Embed Size (px)
Citation preview

energies
Article
Analysis of Torque Ripples of an Induction MotorTaking into Account a Inter-Turn Short-Circuit in aStator Winding
Wojciech Pietrowski * and Konrad Górny
Institute of Electrical Engineering and Electronics, Division of Mechatronics and Electrical Machines,Poznan University of Technology, ul. Piotrowo 3a, 60-965 Poznan, Poland; [email protected]* Correspondence: [email protected]
Received: 9 June 2020; Accepted: 11 July 2020; Published: 14 July 2020�����������������
Abstract: Despite the increasing popularity of permanent magnet synchronous machines,induction motors (IM) are still the most frequently used electrical machines in commercial applications.Ensuring a failure-free operation of IM motivates research aimed at the development of effectivemethods of monitoring and diagnostic of electrical machines. The presented paper deals withdiagnostics of an IM with failure of an inter-turn short-circuit in a stator winding. As this type offailure commonly does not lead immediately to exclusion of a drive system, an early stage diagnosis ofinter-turn short-circuit enables preventive maintenance and reduce the costs of a whole drive systemfailure. In the proposed approach, the early diagnostics of IM with the inter-turn short-circuit isbased on the analysis of an electromagnetic torque waveform. The research is based on an elaboratednumerical field–circuit model of IM. In the presented model, the inter-turn short-circuit in the selectedwinding has been accounted for. As the short-circuit between the turns can occur in different locationsin coils of winding, computations were carried out for various quantity of shorted turns in thewinding. The performed analysis of impact of inter-turn short-circuit on torque waveforms allowedto find the correlation between the quantity of shorted turns and torque ripple level. This correlationcan be used as input into the first layer of an artificial neural network in early and noninvasivediagnostics of drive systems.
Keywords: finite element method; Fourier transform; induction machine; inter-turn short-circuits;torque waveforms
1. Introduction
Due to their simple mechanical design, low cost, and robustness, induction machines are mostoften used in commercial applications [1–4]. Despite design efforts aimed to increase the reliability ofIM, failures still occur. As the initial stages of failures may not have a direct effect on operation of themachine their detection is difficult [5–7]. However, they may spread in the interior of the machineand in consequence may lead to a stoppage of a technological process in a factory [2,8–10]. Therefore,the diagnostics of electric motors and the detection of failures at their early stage plays an importantrole in industrial applications [11,12].
The review of the literature shows that the most often appearing failures of induction motors isdue to damages in a stator circuit [9,11,13,14]. The most common failures in the stator’s circuit concernsinter-turn short-circuits that account for over 30% of all failures. Inter-turn short-circuits occur as aconsequence of damage to the insulation of a sole coil turn [15]. Damage to the insulation can becaused by a flow of current with an intensity exceeding rated values, which leads to release of energyin a form of heat as well as by a mechanical stress. In addition, ubiquitously used frequency converters
Energies 2020, 13, 3626; doi:10.3390/en13143626 www.mdpi.com/journal/energies
Energies 2020, 13, 3626 2 of 17
such as inverters that use fast switching PWM also affect faster degradation of the insulation [16,17].The assessment of the state of the insulation takes place by means of various dielectric measurementssuch as that of the dissipation factor, capacitance, or insulation resistance [18]. The most populardiagnostics methods for testing the insulation condition are as follows; a partial discharge test,a polarization index calculation, a dissipation factor, and a power factor tip-up [19]. The methodslisted above are based on offline diagnostics and require the experience of a diagnostician as well as acomprehensive measurement system [16].
There are lot of publications in the literature related to faults occurred in the stator winding ofinduction motor. Most of them only apply to an analysis an impact of the inter-turn short-circuiton current of stator windings. This approach requires analysis of three signals at the same time.In addition, the impact of a small amount of shorted turns on phase currents for a loaded motorcan be difficult to observe. However, the progressive damage process may affect torque waveforms.Despite the fact that measuring of the torque waveforms is a very difficult task, the progress in field ofsensors will soon allow such measurements to be made in easy way. Therefore, this article focuses onpresenting the results of simulation tests, which take into account short-circuits that result in torquewaveforms. The analysis was carried out for a motor loaded at an external torque of 0 Nm as well as15 Nm. These two values correspond to no-load and rated load, respectively. Based on the results ofthe analysis, the torque ripple factor was determined.
Based on a review of the latest developments in the field of electric motor diagnostics, two mainapproaches can be favored. The first approach is based on analytical calculations, while the secondapproach uses numerical methods, e.g., the finite element method or the finite difference method [20].The most frequently used diagnostic signals include motor phase current waveforms, vibroacousticsignals, axial flux or supply voltage waveforms [21,22]. The above-mentioned diagnostic signals arewidely used in diagnostics of many motors failures, especially mechanical damages such as a shaftmisalignment or bearing failures. Nevertheless, as mentioned in the previous paragraph, failures in theelectrical circuit, such as inter-turn short-circuits in their early stage, do not have a significant impact onthe waveforms of the above-mentioned diagnostic quantities. Therefore, the torque waveforms of themachine can be used for early diagnostics of stator winding of electric motors, despite the difficultiesassociated with obtaining as the diagnostic signal [23].
Many papers describe approaches that do not consider the impact of short-circuits in the statorcircuit on the torque waveforms, or they are based on the short-circuit modeling using either analyticalcalculations. In the presented paper, the authors propose the analysis of the inter-fault short-circuitsusing the field–circuit model of the machine. The use of such model allows for comprehensiveanalysis of the inter-turn short-circuits, taking into account nonlinear phenomena occurring duringmotor operation in an emergency fault condition. On the basis of the developed field–circuit model,authors managed to determine a torque ripple coefficient for different numbers of shorted turns.
In the following paper, the authors present parameters of the considered motor and the method ofmodeling inter-turn short-circuits using a field–circuit model of electromagnetic phenomena. Then,an analysis of the obtained torque waveforms of a squirrel cage motor for various degrees of statorwinding failures is presented. The paper also presents the influence of the inter-turn short-circuits onthe distribution of the magnetic field in the machine. Finally, the method for determining the torqueripple coefficient and conclusions are presented.
2. Stator Winding Failure—Inter-Turn Short-Circuit Modeling
Modeling of winding short-circuits on real object requires building a dedicated stator windingfor each case of damage. As the short-circuits can occur in different locations in the coil and canhave different impact on the current or torque waveforms, the number of cases to be studied is high.To mitigate the discussed disadvantage of experimental-based methods in the proposed approach,the advanced computer simulation technique based on Finite Element Method (FEM) has been applied.Development of the precise numerical model of the electromagnetic field inside the IM allows for
Energies 2020, 13, 3626 3 of 17
calculation of waveforms of the rotational speed, torque, and for any type of fault. It is also possible tostudy different operating states of the machine.
2.1. Method of Modeling Inter-Turn Short-Circuit
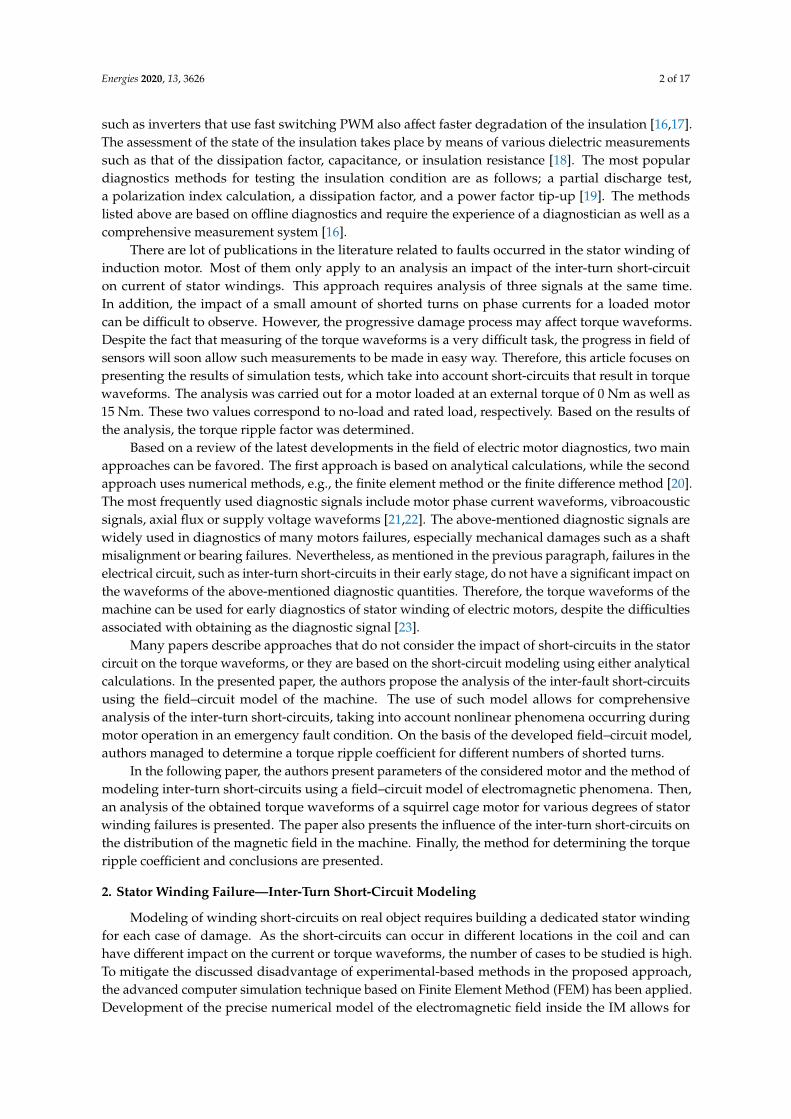
When an inter-turn short-circuit occurs in the stator winding, the winding can be divided intotwo different sections (Figure 1). The first section regards the shorted part of the winding, while thesecond regards the unshorted turns.
Energies 2020, 13, x FOR PEER REVIEW 3 of 19
calculation of waveforms of the rotational speed, torque, and for any type of fault. It is also possible
to study different operating states of the machine.
2.1. Method of Modeling Inter-Turn Short-Circuit
When an inter-turn short-circuit occurs in the stator winding, the winding can be divided into
two different sections (Figure 1). The first section regards the shorted part of the winding, while the
second regards the unshorted turns.
Figure 1. Illustration of the inter-turn short-circuit in the phase A of stator winding.
For better understanding of the presented issue, the individual motor phases are highlighted by
three different colors. For phase A it is red, for phase B green, and for phase C blue. In phase A, the
shorted part of the winding is marked in orange.
The phase windings of the stator can be described by the three lumped parameters: the number
of turns N, the resistance R, and the inductance L. The shorted part of the winding in phase A is
described with 𝑁𝐴𝐹𝑆 , 𝑅𝐴𝐹
𝑆 , and 𝐿𝐴𝐹𝑆 , where upper index “S” relates to the stator, lower index “A”
relates to the phase A, and lower index “F” state for faulty, i.e., the unshorted part of winding.
While, in the case of the shorted part, it is 𝑁𝐴𝑆𝑆 , 𝑅𝐴𝑆
𝑆 , and 𝐿𝐴𝑆𝑆 , where upper index “S” relates to stator,
lower index “A” relates to phase A, and lower index “S” is the part of the winding with shorted
turns.
The damage ratio (𝑘𝑓) of stator winding can be defined as the ratio of the number of shorted
turns to the nominal number of turns [24], and can be calculated as follows,
𝑘𝑓 =𝑁𝑆
𝑁𝑝ℎ (1)
where 𝑁𝑆 is the number of shorted turns and 𝑁𝑝ℎ is the nominal number of turns.
In case of damage in stator, the phase A damage ratio can be written as follows,
𝑘𝐴𝑆 =
𝑁𝐴𝑆𝑆
𝑁𝑁𝑆 (2)
where 𝑁𝐴𝑆𝑆 is the number of shorted turns and 𝑁𝑁
𝑆 is the nominal number of turns.
The value of resistance 𝑅𝐴𝐹𝑆 as well as inductance 𝐿𝐴𝐹
𝑆 of unshorted part of winding (faulty) can
be expressed based on its nominal values (𝑅𝐴𝑆, 𝐿𝐴
𝑆 ) then calculated by following formula.
𝑅𝐴𝐹𝑆 = (1 − 𝑘𝐴
𝑆)𝑅𝐴𝑆
𝐿𝐴𝐹𝑆 = (1 − 𝑘𝐴
𝑆)2𝐿𝐴𝑆 (3)
In the same way, the lumped parameters of the shorted part can be described as
𝑅𝐴𝑆𝑆 = (𝑘𝐴
𝑆)𝑅𝐴𝑆
𝐿𝐴𝑆𝑆 = (𝑘𝐴
𝑆)2𝐿𝐴𝑆 (4)
After rotor parameters were referred to the stator side, a system of voltage equations with
representation of the squirrel cage is the three phase system. For the circuit of stator and rotor, the
system of equations can be written in the following matrix form,
Stator windingFaulty Phase A
Shorted turns
Phase B
Phase C
Shorted turnsof phase A
𝑁𝐴𝑆𝑆 𝑅𝐴𝑆
𝑆 𝐿𝐴𝑆𝑆
𝑁𝐴𝐹𝑆 𝑅𝐴𝐹
𝑆 𝐿𝐴𝐹𝑆
𝑖𝐶𝑆
𝑖𝐵𝑆
𝑖𝐴𝑆
𝑖𝐴𝑆𝑆
Figure 1. Illustration of the inter-turn short-circuit in the phase A of stator winding.
For better understanding of the presented issue, the individual motor phases are highlightedby three different colors. For phase A it is red, for phase B green, and for phase C blue. In phase A,the shorted part of the winding is marked in orange.
The phase windings of the stator can be described by the three lumped parameters: the number ofturns N, the resistance R, and the inductance L. The shorted part of the winding in phase A is describedwith NS
AF, RSAF, and LS
AF, where upper index “S” relates to the stator, lower index “A” relates to thephase A, and lower index “F” state for faulty, i.e., the unshorted part of winding. While, in the caseof the shorted part, it is NS
AS, RSAS, and LS
AS, where upper index “S” relates to stator, lower index “A”relates to phase A, and lower index “S” is the part of the winding with shorted turns.
The damage ratio (k f ) of stator winding can be defined as the ratio of the number of shorted turnsto the nominal number of turns [24], and can be calculated as follows,
k f =NSNph
(1)
where NS is the number of shorted turns and Nph is the nominal number of turns.In case of damage in stator, the phase A damage ratio can be written as follows,
kSA =
NSAS
NSN
(2)
where NSAS is the number of shorted turns and NS
N is the nominal number of turns.The value of resistance RS
AF as well as inductance LSAF of unshorted part of winding (faulty) can be
expressed based on its nominal values (RSA, LS
A) then calculated by following formula.
RSAF =
(1− kS
A
)RS
A
LSAF =
(1− kS
A
)2LS
A
(3)
In the same way, the lumped parameters of the shorted part can be described as
RSAS =
(kS
A
)RS
A
LSAS =
(kS
A
)2LS
A
(4)

Energies 2020, 13, 3626 4 of 17
After rotor parameters were referred to the stator side, a system of voltage equations withrepresentation of the squirrel cage is the three phase system. For the circuit of stator and rotor,the system of equations can be written in the following matrix form,
US = iSRS + LSS ddt
(iS
)+ d
dt
(L′SRi′S
)U′R = i′RR′R + L′RR d
dt
(i′R
)+ d
dt
(L′SRi′R
) (5)
where vectors of phase voltages and currents are as follows,
US =
US
AF
USAS
USB
USC
, U′R =
NRB
NSN
UR
A
URB
URC
, iS =
iSAF
iSAS
iSBiSC
, i′R =
NRB
NSN
iRAiRBiRC
(6)
where NRB is the nominal number of bars in rotor.
The parameters of machine like stator winding inductance and resistance can be written in thefollowing matrix form:
RS =
RS
AF −RSAS 0 0
−RSAS RS
AS 0 0
0 0 RSB 0
0 0 0 RSC
, R′R =
NSN
NRB
RR
A 0 0
0 RRB 0
0 0 RRC
(7)
where RSAF, RS
AS, RSB , and RS
C are the resistances of the stator winding, and RRA, RR
B , and RRC are the
resistances of the rotor winding.
LSS =
LSAF −
(LS
AS + MAFAS)
MAFB + MASB MAFC + MASC
−
(LS
AS + MAFAS)
LSAS −MASB −MASC
MAFB −MASB LSB MBC
MAFC −MASC MBC LSC
. (8)
L′SR =NS
N
NRB
MSR
AF cos(θ) MSRAF cos(θ+ 2π/3) MSR
AF cos(θ− 2π/3)
−MSRAS cos(θ+ γAS) −MSR
AS cos(θ+ γAS + 2π/3) −MSRAS cos(θ+ γAS − 2π/3)
MSRB cos(θ− 2π/3) MSR
B cos(θ) MSRB cos(θ+ 2π/3)
MSRC cos(θ+ 2π/3) MSR
C cos(θ− 2π/3) MSRC cos(θ)
(9)
where LSAF, LS
AS, LSB, and LS
C are the self-inductances of winding, MSR is the mutual inductance betweenstator and rotor, θ is the angle of rotor position, and γ is the angle between shorted coil and statorwinding coil.
The rotor resistance RR can be expressed as a sum of the rotor bar resistance RRbar and the end ring
resistance RRring,
RRA = RR
B = RRC = RR =
1p
(RR
bar + RRring
)(10)
Equations of stator and rotor must be supplemented by mechanical equilibrium equation. Theequation of mechanical equilibrium is expressed in the following form,
Jdωdt
= Te − TL. (11)

Energies 2020, 13, 3626 5 of 17
where Te =[iS
]T ∂L′SR
∂Θ iR is the electromagnetic torque, TL is the load torque, ω is the angular speed,and J is the inertia moment of moving mass.
To calculate the values of winding inductance in Equations (3)–(11), i.e., the healthy part and thefaulty one, it is preferable to use a field model of machine. In this approach, the inductance values arecalculated based on the magnetic field distribution. The calculations are realized in two steps. In thefirst step, the linkage fluxes with phase windings were calculated. In the second step, the inductanceswere calculated on the basis of linkage fluxes and the phase currents.
2.2. Field–Circuit Model of the Induction Motor
The field–circuit model of machine includes the field equations, which describe the electromagneticfield distribution, as well as the circuit equations, which describe the windings connections and thesupply system. The magnetic field distribution using magnetic vector potential A may be described byfollowing equation,
∇× (ν∇×A) = JJ = −σ
(ddt A +∇V
) (12)
where ν is the magnetic reluctivity, J is the current density vector, σ is the conductivity, and V is theelectric scalar potential.
Basically, in the case of voltage-excited fields in devices with nonlinear elements (stator and rotorcores), currents in windings are not known in advance. Therefore, the value of current density vectorJ is not known. Therefore, the electric equations of the device windings should also be considered.A set of equations can be written as Equation (5). Moreover, these equations are coupled through theelectromagnetic torque to the equation of motion (11).
3. Selected Results of the Torque Calculation
The field–circuit model of IM presented above was used to calculate torque waveforms.The field–circuit motor model has been developed in the Ansys Maxwell environment. The structureof the magnetic circuit and applied FE mesh is shown in Figure 2a, while the applied electric circuit,considering the inter-turn short-circuit, is presented in Figure 2b. Using the developed model, the torquewaveforms of the IM were calculated for different values of kS
A. Calculations were carried out for ageneral purpose squirrel IM. Its rated parameters are shown in Table 1.
Energies 2020, 13, x FOR PEER REVIEW 5 of 19
The field–circuit model of machine includes the field equations, which describe the electromagnetic field distribution, as well as the circuit equations, which describe the windings connections and the supply system. The magnetic field distribution using magnetic vector potential A may be described by following equation, ( ) == − + (12)
where is the magnetic reluctivity, is the current density vector, is the conductivity, and is the electric scalar potential.
Basically, in the case of voltage-excited fields in devices with nonlinear elements (stator and rotor cores), currents in windings are not known in advance. Therefore, the value of current density vector is not known. Therefore, the electric equations of the device windings should also be considered. A set of equations can be written as Equation (5). Moreover, these equations are coupled through the electromagnetic torque to the equation of motion (11).
3. Selected Results of the Torque Calculation
The field–circuit model of IM presented above was used to calculate torque waveforms. The field–circuit motor model has been developed in the Ansys Maxwell environment. The structure of the magnetic circuit and applied FE mesh is shown in Figure 2a, while the applied electric circuit, considering the inter-turn short-circuit, is presented in Figure 2b. Using the developed model, the torque waveforms of the IM were calculated for different values of . Calculations were carried out for a general purpose squirrel IM. Its rated parameters are shown in Table 1.
(a)
Figure 2. Cont.

Energies 2020, 13, 3626 6 of 17
Energies 2020, 13, x FOR PEER REVIEW 6 of 19
(b)
Figure 2. Field–circuit model of induction machine: (a) magnetic circuit and (b) electric circuit.
Table 1. Rated parameters of the motor.
Parameter Value Mechanical power 2.2 kW
Supply voltage 380 V Efficiency 82%
Speed 1410 rpm Torque 15 Nm
Frequency 50 Hz Core loss 37 W
Stator slots 36 Rotor slots 24
The calculations take into account that the magnetic circuit is nonlinear, i.e., in the model, there is assigned a nonlinear magnetization characteristic to domains representing the stator and rotor cores. The rotor cage is made of aluminum. The supply phase voltages are sinusoidal and displaced by the angle of . In every phase winding there are four coils, and the number of turns in every phase is 220 and the number of turns per phase is 220. Taking in to account the documentation of the presented motor, the field model of the machine was developed. Calculations were performed for the number of shorted turns from 0 to 55. The machine failure level was adjusted by changing the parameter . In the rest of article, we will use the designation Nf instead of .
3.1. Magnetic Field Distribution
Due to long computation time of calculation of 3D magnetic field distribution, further research was performed using simplified 2D model of the machine. Mesh parameters of the FEM model are shown in Table 2.
Table 2. Mesh parameters of the FEM model.
Num
Elements Min Edge
Length Max Edge
Length RMS Edge
Length Min Elem.
Area Max Elem.
Area Mean Elem.
Area Band 627 0.000125 0.0019747 0.000854215 1.48933 × 10⁻⁸ 1.59494 × 10⁻⁷ 6.82612 × 10⁻⁸ Shaft 96 0.00312145 0.00613875 0.00458931 5.9426 × 10⁻⁶ 1.46274 × 10⁻⁵ 8.32385 × 10⁻⁶
Outer Region 1737 0.000125 0.00589417 0.00216509 2.24777 × 10⁻⁸ 4.85527 × 10⁻⁶ 1.0943 × 10⁻⁶ Stator 2161 0.000408465 0.00614834 0.00327034 2.03949 × 10⁻⁷ 1.50488 × 10⁻⁵ 3.89616 × 10⁻⁶ Coil 33 0.000897214 0.00340384 0.00239494 9.34699 × 10⁻⁷ 3.15461 × 10⁻⁶ 2.03934 × 10⁻⁶
0
LFaza_A1
LFaza_B1
LFaza_C1
(1.52306*5/6) ohmRA
1.52306ohmRB
1.52306ohmRC
0.00253139H*Kle*5/6LA
0.00253139H*KleLB
0.00253139H*KleLC
LabelID=VIA
LabelID=VIB
LabelID=VIC
+
sqrt(2)*U_A
LabelID=VALabelID=IVa
+
sqrt(2)*U_BLabelID=VB
LabelID=IVb
+
sqrt(2)*U_CLabelID=VC
LabelID=IVc
LFaza_A3 LFaza_A4 LFaza_A5 LFaza_A6
LFaza_B2 LFaza_B3 LFaza_B4 LFaza_B5 LFaza_B6
LFaza_C2 LFaza_C3 LFaza_C4 LFaza_C5 LFaza_C6
LLA2_fault1.52306*$k_f/6RRA2_fault
0.00253139H*Kle*$k_f*$k_f /6
LA2_fault
0.00253139H*Kle*(1-$k_f)*(1-$k_f)/6
LA2_shorted1.52306*(1-$k_f)/6
RRA2_shortedLLA2_shorted
$R_shortingRRA2_shorting
LabelID=VIA_2_shorted
LabelID=IVA2_shortedLabelID=IVA2_fault
Figure 2. Field–circuit model of induction machine: (a) magnetic circuit and (b) electric circuit.
Table 1. Rated parameters of the motor.
Parameter Value
Mechanical power 2.2 kWSupply voltage 380 V
Efficiency 82%Speed 1410 rpmTorque 15 Nm
Frequency 50 HzCore loss 37 W
Stator slots 36Rotor slots 24
The calculations take into account that the magnetic circuit is nonlinear, i.e., in the model, there isassigned a nonlinear magnetization characteristic to domains representing the stator and rotor cores.The rotor cage is made of aluminum. The supply phase voltages are sinusoidal and displaced by theangle of 2
3π. In every phase winding there are four coils, and the number of turns in every phase is 220and the number of turns per phase is 220. Taking in to account the documentation of the presentedmotor, the field model of the machine was developed. Calculations were performed for the number ofshorted turns from 0 to 55. The machine failure level was adjusted by changing the parameter NS
AS.In the rest of article, we will use the designation Nf instead of NS
AS.
3.1. Magnetic Field Distribution
Due to long computation time of calculation of 3D magnetic field distribution, further researchwas performed using simplified 2D model of the machine. Mesh parameters of the FEM model areshown in Table 2.
Table 2. Mesh parameters of the FEM model.
NumElements
Min EdgeLength
Max EdgeLength
RMS EdgeLength
Min Elem.Area
Max Elem.Area
Mean Elem.Area
Band 627 0.000125 0.0019747 0.000854215 1.48933 × 10⁻⁸ 1.59494 × 10⁻⁷ 6.82612 × 10⁻⁸
Shaft 96 0.00312145 0.00613875 0.00458931 5.9426 × 10⁻⁶ 1.46274 × 10⁻⁵ 8.32385 × 10⁻⁶
Outer Region 1737 0.000125 0.00589417 0.00216509 2.24777 × 10⁻⁸ 4.85527 × 10⁻⁶ 1.0943 × 10⁻⁶
Stator 2161 0.000408465 0.00614834 0.00327034 2.03949 × 10⁻⁷ 1.50488 × 10⁻⁵ 3.89616 × 10⁻⁶
Coil 33 0.000897214 0.00340384 0.00239494 9.34699 × 10⁻⁷ 3.15461 × 10⁻⁶ 2.03934 × 10⁻⁶
Rotor 6300 0.000273126 0.00582202 0.00140777 4.81107 × 10⁻⁸ 1.03163 × 10⁻⁵ 7.93901 × 10⁻⁷
Bar 453 0.000273126 0.000699128 0.000498602 4.60133 × 10⁻⁸ 1.81518 × 10⁻⁷ 1.06182 × 10⁻⁷
Bar_Separate 499 0.000273126 0.000699128 0.000473352 4.60133 × 10⁻⁸ 1.81518 × 10⁻⁷ 9.6394 × 10⁻⁸
Coil Shorted 7 0.0008 0.002 0.00118964 4 × 10⁻⁷ 1 × 10⁻⁶ 5.71429 × 10⁻⁷

Energies 2020, 13, 3626 7 of 17
The distributions of magnetic flux lines and density in the cross section of the magnetic circuit ofthe machine in the case of (a) Nf = 1 turn and (b) Nf = 40 turns are shown in Figure 3a,b, respectively.It can be observed that at time 0.01 s after switching on the power supply, the angle of rotor position isequal to 1.347 deg in case of Nf = 1 turn, and the angle of rotor position is equal to 0.677 deg in case ofNf = 40 turns.
Energies 2020, 13, x FOR PEER REVIEW 7 of 19
Rotor 6300 0.000273126 0.00582202 0.00140777 4.81107 × 10⁻⁸ 1.03163 × 10⁻⁵ 7.93901 × 10⁻⁷ Bar 453 0.000273126 0.000699128 0.000498602 4.60133 × 10⁻⁸ 1.81518e × 10−7 1.06182 × 10⁻⁷
Bar_Separate 499 0.000273126 0.000699128 0.000473352 4.60133 × 10⁻⁸ 1.81518 × 10⁻⁷ 9.6394 × 10⁻⁸ Coil Shorted 7 0.0008 0.002 0.00118964 4 × 10⁻⁷ 1 × 10⁻⁶ 5.71429 × 10⁻⁷
The distributions of magnetic flux lines and density in the cross section of the magnetic circuit of the machine in the case of (a) Nf = 1 turn and (b) Nf = 40 turns are shown in Figure 3a,b, respectively. It can be observed that at time 0.01 s after switching on the power supply, the angle of rotor position is equal to 1.347 deg in case of Nf = 1 turn, and the angle of rotor position is equal to 0.677 deg in case of Nf = 40 turns.
(a) (b)
Figure 3. Magnetic field distributions at time equal to 10ms, load torque TL=TN, and number of shorted turns: (a) Nf = 1 and (b) Nf = 40.
3.2. The Torque Waveforms at Steady State of the Machine
In the first part of the simulation tests, a set of torque waveforms for healthy and unloaded motor was determined and then simulations for a motor loaded at 15 Nm torque were performed. The time step was equal to 0.2 ms, that is, the calculations were made 100 times during one supply voltage period. The waveforms of the obtained torque are shown in Figure 4.
Figure 3. Magnetic field distributions at time equal to 10ms, load torque TL=TN, and number of shortedturns: (a) Nf = 1 and (b) Nf = 40.
3.2. The Torque Waveforms at Steady State of the Machine
In the first part of the simulation tests, a set of torque waveforms for healthy and unloaded motorwas determined and then simulations for a motor loaded at 15 Nm torque were performed. The timestep was equal to 0.2 ms, that is, the calculations were made 100 times during one supply voltageperiod. The waveforms of the obtained torque are shown in Figure 4.
Energies 2020, 13, x FOR PEER REVIEW 8 of 19
Figure 4. Torque waveforms of a healthy motor at TL = 0 Nm and TL = 15 Nm.
In the second part of the simulation tests, the torque waveforms were calculated for the
following number of shorted turns; Nf = {1, 2, 3, 10, 20, 30, 40, 50, 55} in phase A of stator winding,
again at no external load as well as at load torque equal to 15 Nm. In the simulations, the motor
start-up process was considered. Figures 5 and 6 show the obtained torque waveforms from the time
of switching on the supply voltage to the time of reaching the electromechanically steady state. It has
been assumed that this state is reached after 500 ms from the moment of switching on the voltage.
The waveforms as well as peak values of the electromagnetic torque during the first period of
start-up process, i.e., from 0 to 40 ms, at no-load and rated load conditions are shown in Figures 7
and 8, and Table 3, respectively. Additionally, the torque waveforms in a steady state, i.e., 460–580
ms, are presented in Figures 9 and 10.
Table 3. Peak values of the torque during start-up.
Nf TL = 0 Nm TL = 15 Nm
55 90.589 99.471
50 90.365 99.702
40 89.148 99.567
30 87.410 98.583
20 91.727 96.986
10 92.689 95.689
3 91.938 97.009
2 92.076 97.286
1 92.220 97.599
0 92.305 97.974
One of the most important factors for drive systems in case of a machine failure is the peak
value of the machine torque waveform. The simulations show that the peak value of the torque
waveforms for the motor without external load is 92.689 Nm and occurs in case when the motor has
10 shorted turns in stator winding. This value is 100.41% of the peak torque value for a healthy
motor. It can be concluded that the influence of the shorted turns during the start of machine
without external torque can be neglected.
The highest peak value of torque waveforms for a motor loaded with nominal load torque was
observed at 50 shorted turns and amounts to 99.702, which is 101.76% of the torque value for the
Figure 4. Torque waveforms of a healthy motor at TL = 0 Nm and TL = 15 Nm.
In the second part of the simulation tests, the torque waveforms were calculated for the followingnumber of shorted turns; Nf = {1, 2, 3, 10, 20, 30, 40, 50, 55} in phase A of stator winding, again at noexternal load as well as at load torque equal to 15 Nm. In the simulations, the motor start-up processwas considered. Figures 5 and 6 show the obtained torque waveforms from the time of switching on

Energies 2020, 13, 3626 8 of 17
the supply voltage to the time of reaching the electromechanically steady state. It has been assumedthat this state is reached after 500 ms from the moment of switching on the voltage. The waveforms aswell as peak values of the electromagnetic torque during the first period of start-up process, i.e., from 0to 40 ms, at no-load and rated load conditions are shown in Figures 7 and 8, and Table 3, respectively.Additionally, the torque waveforms in a steady state, i.e., 460–580 ms, are presented in Figures 9 and 10.
Table 3. Peak values of the torque during start-up.
Nf TL = 0 Nm TL = 15 Nm
55 90.589 99.47150 90.365 99.70240 89.148 99.56730 87.410 98.58320 91.727 96.98610 92.689 95.6893 91.938 97.0092 92.076 97.2861 92.220 97.5990 92.305 97.974
One of the most important factors for drive systems in case of a machine failure is the peak valueof the machine torque waveform. The simulations show that the peak value of the torque waveformsfor the motor without external load is 92.689 Nm and occurs in case when the motor has 10 shortedturns in stator winding. This value is 100.41% of the peak torque value for a healthy motor. It can beconcluded that the influence of the shorted turns during the start of machine without external torquecan be neglected.
The highest peak value of torque waveforms for a motor loaded with nominal load torque wasobserved at 50 shorted turns and amounts to 99.702, which is 101.76% of the torque value for the motorwithout failure. In conclusion it can be stated that the influence of the shorted turns during the start ofthe machine at rated torque can be omitted, because the peak value of torque has slightly increased inthe relation to healthy machine.
Energies 2020, 13, x FOR PEER REVIEW 9 of 19
motor without failure. In conclusion it can be stated that the influence of the shorted turns during
the start of the machine at rated torque can be omitted, because the peak value of torque has slightly
increased in the relation to healthy machine.
Figure 5. Torque waveforms of a faulty (Nf = 1–50) as well healthy (Nf = 0) motor without external
torque (TL = 0 Nm).
Figure 6. Torque waveforms of a faulty (Nf = 1 – 50) as well as a healthy (Nf = 0) motor at rated torque
(TL = 15 Nm).
Figure 5. Torque waveforms of a faulty (Nf = 1–50) as well healthy (Nf = 0) motor without externaltorque (TL = 0 Nm).

Energies 2020, 13, 3626 9 of 17
Energies 2020, 13, x FOR PEER REVIEW 9 of 19
motor without failure. In conclusion it can be stated that the influence of the shorted turns during
the start of the machine at rated torque can be omitted, because the peak value of torque has slightly
increased in the relation to healthy machine.
Figure 5. Torque waveforms of a faulty (Nf = 1–50) as well healthy (Nf = 0) motor without external
torque (TL = 0 Nm).
Figure 6. Torque waveforms of a faulty (Nf = 1 – 50) as well as a healthy (Nf = 0) motor at rated torque
(TL = 15 Nm). Figure 6. Torque waveforms of a faulty (Nf = 1 – 50) as well as a healthy (Nf = 0) motor at rated torque(TL = 15 Nm).Energies 2020, 13, x FOR PEER REVIEW 10 of 19
Figure 7. Torque waveforms during first period of start-up process at TL = 0 Nm.
Figure 8. Torque waveforms during first period of start-up process at TL = 15 Nm.
Figure 7. Torque waveforms during first period of start-up process at TL = 0 Nm.
Energies 2020, 13, x FOR PEER REVIEW 10 of 19
Figure 7. Torque waveforms during first period of start-up process at TL = 0 Nm.
Figure 8. Torque waveforms during first period of start-up process at TL = 15 Nm. Figure 8. Torque waveforms during first period of start-up process at TL = 15 Nm.

Energies 2020, 13, 3626 10 of 17
Energies 2020, 13, x FOR PEER REVIEW 11 of 19
Figure 9. Torque waveforms at steady state (time: 460–480 ms) and TL = 0 Nm.
Figure 10. Torque waveforms at steady state (time: 460–480ms) and TL = 15 Nm.
3.3. Torque Analysis—Signal Spectrum
During the analysis of stationary torque waveforms of the machine, spectral analysis using
Fourier transform was used. The results of analysis at no external load as well as at load torque equal
to 15 Nm are shown in Figures 11 and 12, respectively. Two ranges of a spectrum limited by a
dash-dot line marked in Figures 11 and 12 were magnified. The spectral analysis limited in
frequency is shown in Figures 13 and 14.
It can be noticed that the inter-turn short-circuit in the stator winding generates the additional
harmonics of the electromagnetic torque of IM. For the no-load test (TL = 0 Nm), the following
harmonics can be found, f(TL = 0 Nm)={24, 97, 195, 435, 535, 635, 970, 1070, 1170}Hz. In case of rated
load torque, the constant value can be observed as well as the following harmonics, f(TL = 15
Nm)={24, 97, 195, 415, 515, 615, 930, 1030, 1130}Hz. Among the set of harmonics, the second and the
Figure 9. Torque waveforms at steady state (time: 460–480 ms) and TL = 0 Nm.
Energies 2020, 13, x FOR PEER REVIEW 11 of 19
Figure 9. Torque waveforms at steady state (time: 460–480 ms) and TL = 0 Nm.
Figure 10. Torque waveforms at steady state (time: 460–480ms) and TL = 15 Nm.
3.3. Torque Analysis—Signal Spectrum
During the analysis of stationary torque waveforms of the machine, spectral analysis using
Fourier transform was used. The results of analysis at no external load as well as at load torque equal
to 15 Nm are shown in Figures 11 and 12, respectively. Two ranges of a spectrum limited by a
dash-dot line marked in Figures 11 and 12 were magnified. The spectral analysis limited in
frequency is shown in Figures 13 and 14.
It can be noticed that the inter-turn short-circuit in the stator winding generates the additional
harmonics of the electromagnetic torque of IM. For the no-load test (TL = 0 Nm), the following
harmonics can be found, f(TL = 0 Nm)={24, 97, 195, 435, 535, 635, 970, 1070, 1170}Hz. In case of rated
load torque, the constant value can be observed as well as the following harmonics, f(TL = 15
Nm)={24, 97, 195, 415, 515, 615, 930, 1030, 1130}Hz. Among the set of harmonics, the second and the
Figure 10. Torque waveforms at steady state (time: 460–480ms) and TL = 15 Nm.
3.3. Torque Analysis—Signal Spectrum
During the analysis of stationary torque waveforms of the machine, spectral analysis using Fouriertransform was used. The results of analysis at no external load as well as at load torque equal to 15 Nmare shown in Figures 11 and 12, respectively. Two ranges of a spectrum limited by a dash-dot linemarked in Figures 11 and 12 were magnified. The spectral analysis limited in frequency is shown inFigures 13 and 14.
It can be noticed that the inter-turn short-circuit in the stator winding generates the additionalharmonics of the electromagnetic torque of IM. For the no-load test (TL = 0 Nm), the followingharmonics can be found, f (TL = 0 Nm)={24, 97, 195, 435, 535, 635, 970, 1070, 1170}Hz. In case of ratedload torque, the constant value can be observed as well as the following harmonics, f (TL = 15 Nm)={24,97, 195, 415, 515, 615, 930, 1030, 1130}Hz. Among the set of harmonics, the second and the fourthharmonics of supply voltage can be observed. These harmonics are well known in the diagnostics ofelectrical machines [15].

Energies 2020, 13, 3626 11 of 17
Energies 2020, 13, x FOR PEER REVIEW 12 of 19
fourth harmonics of supply voltage can be observed. These harmonics are well known in the
diagnostics of electrical machines [15].
Figure 11. Spectral analysis of the torque waveform of a faulty motor, at TL = 0 Nm.
Figure 12. Spectral analysis of the torque waveform of a faulty motor, at TL = 15 Nm.
Figure 11. Spectral analysis of the torque waveform of a faulty motor, at TL = 0 Nm.
Energies 2020, 13, x FOR PEER REVIEW 12 of 19
fourth harmonics of supply voltage can be observed. These harmonics are well known in the
diagnostics of electrical machines [15].
Figure 11. Spectral analysis of the torque waveform of a faulty motor, at TL = 0 Nm.
Figure 12. Spectral analysis of the torque waveform of a faulty motor, at TL = 15 Nm. Figure 12. Spectral analysis of the torque waveform of a faulty motor, at TL = 15 Nm.Energies 2020, 13, x FOR PEER REVIEW 13 of 19
(a)
(b)
Figure 13. Spectral analysis of the torque waveform of a faulty motor limited in frequency: (a)
400–650 Hz and (b) 950–1200 Hz, at TL = 0 Nm.
Figure 13. Cont.

Energies 2020, 13, 3626 12 of 17
Energies 2020, 13, x FOR PEER REVIEW 13 of 19
(a)
(b)
Figure 13. Spectral analysis of the torque waveform of a faulty motor limited in frequency: (a)
400–650 Hz and (b) 950–1200 Hz, at TL = 0 Nm. Figure 13. Spectral analysis of the torque waveform of a faulty motor limited in frequency: (a) 400–650 Hzand (b) 950–1200 Hz, at TL = 0 Nm.
Energies 2020, 13, x FOR PEER REVIEW 14 of 19
(a)
(b)
Figure 14. Spectral analysis of the torque waveform of a faulty motor limited in frequency: (a)
400–650 Hz and (b) 900–1150 Hz, at TL = 15 Nm.
Based on the obtained results of spectral analysis, it can be concluded that the occurrence of
failure, like inter-turn short-circuit in stator winding, even for a small number of shorted turns has a
significant impact on the torque waveforms. There are additional torque oscillations in the
waveforms. The significant impact of inter-turn short circuits on the torque ripple allowed the
determination of the coefficient describing the relationship between the level of torque ripple and
the level of failure.
3.4. Torque Ripple Factor
Figure 14. Spectral analysis of the torque waveform of a faulty motor limited in frequency: (a) 400–650 Hzand (b) 900–1150 Hz, at TL = 15 Nm.

Energies 2020, 13, 3626 13 of 17
Based on the obtained results of spectral analysis, it can be concluded that the occurrence offailure, like inter-turn short-circuit in stator winding, even for a small number of shorted turns has asignificant impact on the torque waveforms. There are additional torque oscillations in the waveforms.The significant impact of inter-turn short circuits on the torque ripple allowed the determination of thecoefficient describing the relationship between the level of torque ripple and the level of failure.
3.4. Torque Ripple Factor
As can be seen in Figure 5, as well as in Figure 6, there are ripples in the torque waveforms.One can observed that the value of the ripples depends on the number of shorted turns. If the motoroperating without additional load is considered, then the average torque value oscillates around zerofor the steady state. In this case, the torque ripples for a steady state can be calculated as follows.
∆T =Tmax − Tmin
2(13)
Calculations of the ripple factor were performed after passing the waveforms of torque throughthe low-pass filter with the frequency fp = {5000, 2000, 1000, 500, 200} Hz. The characteristicswhich define the relationship between the torque ripple, number of the shorted turns, and filterfrequency for the motor without additional external load are shown in Figures 15 and 16. Based on theobtained characteristics, it can be seen that the torque ripples depend almost linearly on the number ofshorted turns.
Energies 2020, 13, x FOR PEER REVIEW 15 of 19
As can be seen in Figure 5, as well as in Figure 6, there are ripples in the torque waveforms. One
can observed that the value of the ripples depends on the number of shorted turns. If the motor
operating without additional load is considered, then the average torque value oscillates around
zero for the steady state. In this case, the torque ripples for a steady state can be calculated as
follows.
∆𝑇 =𝑇𝑚𝑎𝑥 − 𝑇𝑚𝑖𝑛
2 (13)
Calculations of the ripple factor were performed after passing the waveforms of torque through
the low-pass filter with the frequency fp = {5000, 2000, 1000, 500, 200} Hz. The characteristics which
define the relationship between the torque ripple, number of the shorted turns, and filter frequency
for the motor without additional external load are shown in Figures 15 and 16. Based on the obtained
characteristics, it can be seen that the torque ripples depend almost linearly on the number of
shorted turns.
Figure 15. Torque ripple factor as a function of shorted turns Nf in the case of a faulty motor, at TL = 0
Nm. Figure 15. Torque ripple factor as a function of shorted turns Nf in the case of a faulty motor,at TL = 0 Nm.Energies 2020, 13, x FOR PEER REVIEW 16 of 19
Figure 16. Torque ripple factor as a function of low-pass filter frequency fp in the case of a faulty
motor, at TL = 0 Nm.
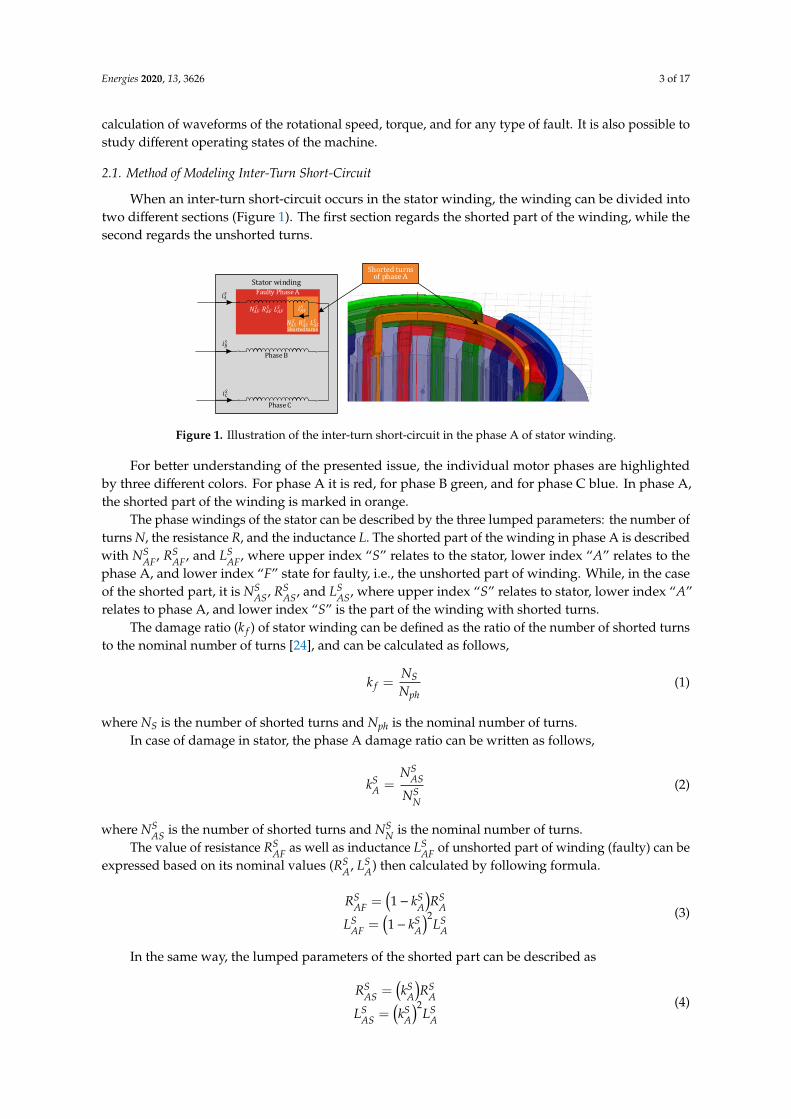
If the motor operates with rated load torque at steady state, the torque ripples can be calculated
as follows.
∆𝑇 =𝑇𝑚𝑎𝑥 − 𝑇𝑚𝑖𝑛
𝑇𝑎𝑣100% (14)
Calculations of the ripple factor were performed after passing the waveforms of torque through
the low-pass filter with the frequency fp = {5000, 2000, 1000, 500, 200} Hz. The characteristics which
define the relationship between the torque ripple, number of the shorted turns, and filter frequency
for the motor with external load are shown in Figures 17 and 18. Based on the obtained
characteristics, it can be seen that the torque ripples also depend almost linearly on the number of
shorted turns.
Figure 17. Torque ripple factor as a function of shorted turns Nf in the case of a faulty motor, at TL =
15 Nm.
Figure 16. Torque ripple factor as a function of low-pass filter frequency fp in the case of a faulty motor,at TL = 0 Nm.
Energies 2020, 13, 3626 14 of 17
If the motor operates with rated load torque at steady state, the torque ripples can be calculatedas follows.
∆T =Tmax − Tmin
Tav100% (14)
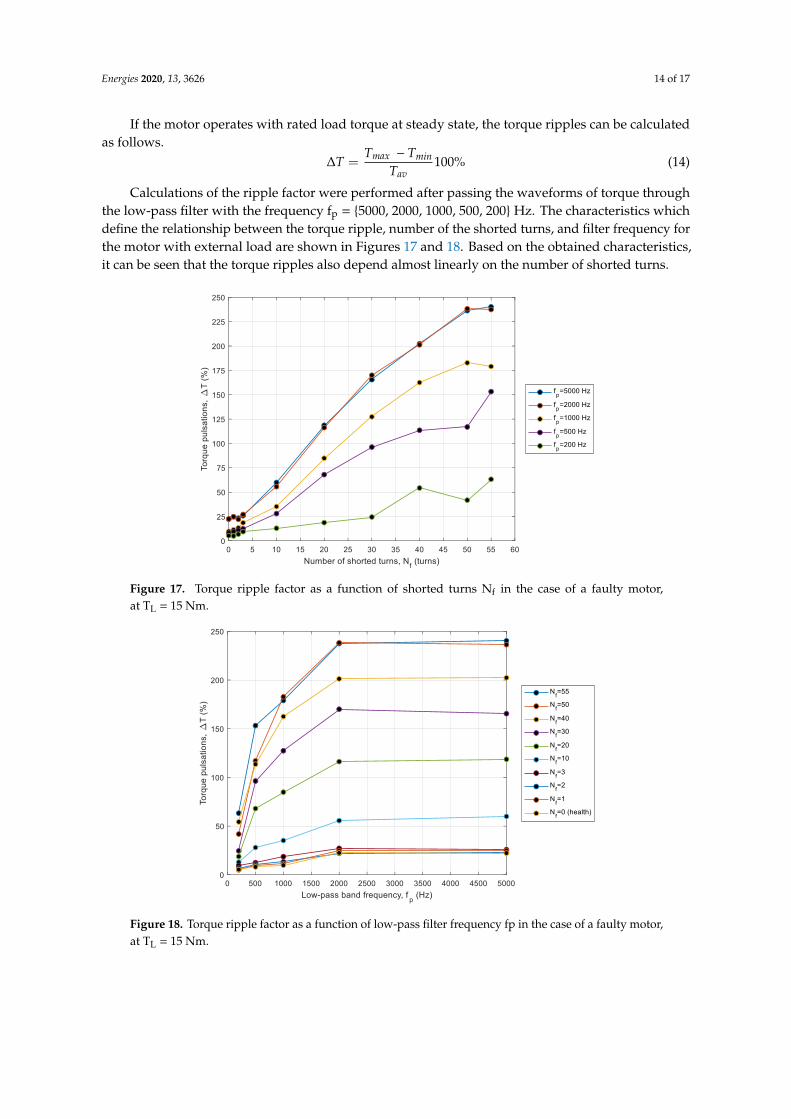
Calculations of the ripple factor were performed after passing the waveforms of torque throughthe low-pass filter with the frequency fp = {5000, 2000, 1000, 500, 200} Hz. The characteristics whichdefine the relationship between the torque ripple, number of the shorted turns, and filter frequency forthe motor with external load are shown in Figures 17 and 18. Based on the obtained characteristics,it can be seen that the torque ripples also depend almost linearly on the number of shorted turns.
Energies 2020, 13, x FOR PEER REVIEW 16 of 19
Figure 16. Torque ripple factor as a function of low-pass filter frequency fp in the case of a faulty
motor, at TL = 0 Nm.
If the motor operates with rated load torque at steady state, the torque ripples can be calculated
as follows.
∆𝑇 =𝑇𝑚𝑎𝑥 − 𝑇𝑚𝑖𝑛
𝑇𝑎𝑣100% (14)
Calculations of the ripple factor were performed after passing the waveforms of torque through
the low-pass filter with the frequency fp = {5000, 2000, 1000, 500, 200} Hz. The characteristics which
define the relationship between the torque ripple, number of the shorted turns, and filter frequency
for the motor with external load are shown in Figures 17 and 18. Based on the obtained
characteristics, it can be seen that the torque ripples also depend almost linearly on the number of
shorted turns.
Figure 17. Torque ripple factor as a function of shorted turns Nf in the case of a faulty motor, at TL =
15 Nm. Figure 17. Torque ripple factor as a function of shorted turns Nf in the case of a faulty motor,at TL = 15 Nm.Energies 2020, 13, x FOR PEER REVIEW 17 of 19
Figure 18. Torque ripple factor as a function of low-pass filter frequency fp in the case of a faulty
motor, at TL = 15 Nm.
Using the obtained results, a determination coefficient describing the correspondence of
calculations to the linear equation was determined. The developed coefficient can be expressed as
follows,
𝑅2 =∑ (𝛥��𝑖−𝛥��)2𝑛
𝑖=1
∑ (𝛥𝑇𝑖−𝛥��)2𝑛𝑖=1
(15)
where iT is the interpolated value of ripples, T is the mean value of ripples, and iT is the
calculated value of ripples.
The R2 coefficient can take values from 0 to 1. The level of fit of the calculations to the linear
equation was determined for the following ranges; 0.0–0.5: low fit; 0.5–0.6: average fit; 0.6–0.8:
satisfactory fit; 0.8–0.9: fine fit; and 0.9–1.0: excellent fit.
The coefficient of determination for a load torque equal to 0 Nm was 0.9895, where the linear
equation of torque ripple can be described as ΔT = 0.3273 Nf + 1.5847, while the value of the
coefficient for a load torque equal to 15 Nm was 0.9885, where the linear equation is: ΔT = 4.304 Nf +
21.079. It can be seen that the value of the R2 coefficient take the value in the range of 0.9 to 1.0, which
allows to determine the relationship between the torque ripple and the number of shorted turns as
linear.
4. Summary
The appearance of a short circuit between turns results in a division of the winding into two
parts. As a result of the superposition of magnetomotive force of the phase winding and
magnetomotive force of the shorted coil, the magnetic field distribution is the machine becomes
asymmetric. One of the symptoms of the asymmetrical magnetic field is the torque ripples. In order
to calculated torque waveforms, the field–circuit model of induction machine taking into account
inter-turn short-circuit in stator winding was elaborated. In this paper, the results of the spectral
analysis of the obtained torque waveforms were presented and discussed. The torque ripples at
steady-state operation were analyzed. An increasing of torque ripple level was observed according
to increasing the number of shorted turns. Based on the calculations of the pulsation factor for
different low-pass filter frequency values, one can observe that the pulsation factor decreases as the
filter frequency decreases. These calculations can be helpful during designing measurement systems
for recording torque waveforms.
Figure 18. Torque ripple factor as a function of low-pass filter frequency fp in the case of a faulty motor,at TL = 15 Nm.

Energies 2020, 13, 3626 15 of 17
Using the obtained results, a determination coefficient describing the correspondence ofcalculations to the linear equation was determined. The developed coefficient can be expressedas follows,
R2 =
∑ni=1
(∆Ti − ∆T
)2
∑ni=1
(∆Ti − ∆T
)2 (15)
where ∆Ti is the interpolated value of ripples, ∆T is the mean value of ripples, and ∆Ti is the calculatedvalue of ripples.
The R2 coefficient can take values from 0 to 1. The level of fit of the calculations to the linearequation was determined for the following ranges; 0.0–0.5: low fit; 0.5–0.6: average fit; 0.6–0.8:satisfactory fit; 0.8–0.9: fine fit; and 0.9–1.0: excellent fit.
The coefficient of determination for a load torque equal to 0 Nm was 0.9895, where the linearequation of torque ripple can be described as ∆T = 0.3273 Nf + 1.5847, while the value of the coefficientfor a load torque equal to 15 Nm was 0.9885, where the linear equation is: ∆T = 4.304 Nf + 21.079.It can be seen that the value of the R2 coefficient take the value in the range of 0.9 to 1.0, which allowsto determine the relationship between the torque ripple and the number of shorted turns as linear.
4. Summary
The appearance of a short circuit between turns results in a division of the winding into two parts.As a result of the superposition of magnetomotive force of the phase winding and magnetomotiveforce of the shorted coil, the magnetic field distribution is the machine becomes asymmetric. One ofthe symptoms of the asymmetrical magnetic field is the torque ripples. In order to calculated torquewaveforms, the field–circuit model of induction machine taking into account inter-turn short-circuit instator winding was elaborated. In this paper, the results of the spectral analysis of the obtained torquewaveforms were presented and discussed. The torque ripples at steady-state operation were analyzed.An increasing of torque ripple level was observed according to increasing the number of shorted turns.Based on the calculations of the pulsation factor for different low-pass filter frequency values, one canobserve that the pulsation factor decreases as the filter frequency decreases. These calculations can behelpful during designing measurement systems for recording torque waveforms.
Furthermore, based on the obtained results, it can be seen that the relationship between the valueof the torque ripples factor and the number of shorted turns can be treated as linear. This allows the useof an artificial neural network (ANN) to classify machine failures based on torque ripples factor level.The results of the spectral analysis of torque waveforms can be used as an input vector to the trainingprocess of artificial neural network used as classifier in online diagnosis of the IM. The response of theANN may concern the assessment of the technical condition of the motor.
Author Contributions: Investigation, W.P. and K.G.; Methodology, W.P. and K.G.; Supervision, W.P.; Validation,K.G.; Visualization, W.P.; Writing—original draft, W.P. and K.G. All authors have read and agreed to the publishedversion of the manuscript.
Funding: This research was supported by statutory funds of the Faculty of Control, Robotics and ElectricalEngineering of the Poznan University of Technology.
Conflicts of Interest: The authors declare no conflicts of interest.
References
1. Rajput, S.; Bender, E.; Averbukh, M. Simplified algorithm for assessment equivalent circuit parameters ofinduction motors. IET Electr. Power Appl. 2020, 14, 426–432. [CrossRef]
2. Morsalin, S.; Mahmud, K.; Mohiuddin, H.; Halim, M.R.; Saha, P. Induction Motor Inter-turn Fault DetectionUsing Heuristic Noninvasive Approach by Artificial Neural Network with Levenberg Marquardt Algorithm.In Proceedings of the Informatics, Electronics & Vision (ICIEV), International Conference, Dhaka, Bangladesh,23–24 May 2014; pp. 1–6.

Energies 2020, 13, 3626 16 of 17
3. Patel, R.K.; Giri, V.K. Condition monitoring of induction motor bearing based on bearing damage index.Arch. Electr. Eng. 2017, 66, 105–119. [CrossRef]
4. Sobanski, P.; Orłowska-Kowalska, T. Detection of single and multiple IGBTs open-circuit faults in afield-oriented controlled induction motor drive. Arch. Electr. Eng. 2017, 66, 89–104. [CrossRef]
5. Chen, Y.; Zhao, X.; Yang, Y.; Shi, Y. Online Diagnosis of Inter-turn Short Circuit for Dual-RedundancyPermanent Magnet Synchronous Motor Based on Reactive Power Difference. Energies 2019, 12, 510. [CrossRef]
6. He, Y.L.; Ke, M.Q.; Tang, G.J.; Jiang, H.C.; Yuan, X.H. Analysis and simulation on the effect of rotor interturnshort circuit on magnetic flux density of turbo-generator. J. Electr. Eng. Elektrotech. Cas 2016, 67, 323–333.[CrossRef]
7. Wu, Y.C.; Li, Y.G. Diagnosis of Rotor Winding Inter-turn Short-Circuit in Turbine Generators Using VirtualPower. IEEE Trans. Energy Convers. 2015, 30, 183–188.
8. Broniera, P.J.; Gongora, W.S.; Goedtel, A.; Godoy, W.F. Diagnosis of Stator Winding Inter-turn Short Circuit inThree-Phase Induction Motors by Using Artificial Neural Networks, Diagnostics for Electric Machines, PowerElectronics and Drives (SDEMPED). In Proceedings of the 9th IEEE International Symposium, Valencia, Spain,27–30 August 2013; pp. 281–287.
9. Pietrowski, W.; Górny, K. Detection of inter-turn short-circuit at start-up of induction machine based ontorque analysis. Open Phys. 2017, 15, 851–856. [CrossRef]
10. Pietrowski, W.; Górny, K. Wavelet analysis of torque at start-up of an induction machine under inter-turnshort-circuit. In Proceedings of the 2017 International Symposium on Electrical Machines (SME 2017),Nałeczów, Poland, 18–21 June 2017; pp. 1–4.
11. Wolkiewicz, M.; Tarchała, G.J.; Orłowska-Kowalska, T.; Kowalski, C.T. Online stator interturn short ciruitsmonitoring in the DFOC induction-motor drive. IEEE Trans. Ind. Electron. 2016, 63, 2517–2528. [CrossRef]
12. Huang, B.; Feng, G.; Tang, X.; Xi Gu, J.; Xu, G.; Cattley, R.; Gu, F.; Ball, A.D. A Performance Evaluation of TwoBispectrum Analysis Methods Applied to Electrical Current Signals for Monitoring Induction Motor-DrivenSystems. Energies 2019, 12, 1438. [CrossRef]
13. Zoeller, C.; Wolbank, T.M.; Vogelsberger, M.A. Influence of Voltage Excitation and Current Sensors onMonitoring of Stator Winding Insulation based on Transient Current Step Response. In Proceedings of theIEEE Energy Conversion Congress and Exposition (ECCE), Montreal, QC, Canada, 20–24 September 2015;pp. 2854–2861.
14. Bouzid, M.B.; Champenois, G. Neural Network Based Method for the Automatic Detection of the StatorFaults of the Induction Motor. In Proceedings of the Electrical Engineering and Software Applications(ICEESA), International Conference, Hammamet, Tunisia, 21–23 March 2013; pp. 1–7.
15. Sellami, T.; Berriri, H.; Jelassi, S.; Darcherif, A.M.; Mimouni, M.F. Short-Circuit Fault Tolerant Control ofa Wind Turbine Driven Induction Generator Based on Sliding Mode Observers. Energies 2017, 10, 1611.[CrossRef]
16. Zoeller, C.; Wolbank, T.M.; Vogelsberger, M.A. Online Insulation Condition Monitoring of Traction Machinesusing Inverter Induced Voltage Injection. In Proceedings of the IECON 2015—41st Annual Conference of theIEEE Industrial Electronics Society, Yokohama, Japan, 9–12 November 2015; pp. 2456–2462.
17. Williamson, S.J.; Wrobel, R.; Yon, J.; Booker, J.D.; Mellor, P.H. Investigation of Equivalent Stator-WindingThermal Resistance during Insulation System Ageing. In Proceedings of the IEEE 11th InternationalSymposium on Diagnostics for Electrical Machines, Power Electronics and Drives (SDEMPED), Tinos, Greece,29 August–1 September 2017; pp. 550–556.
18. Zoeller, C.; Vogelsberger, M.A.; Fasching, R.; Grubelnik, W.; Wolbank, T.M. Evaluation andCurrent-Response-Based Identification of Insulation Degradation for High Utilized Electrical Machines inRailway Application. IEEE Trans. Ind. Appl. 2017, 53, 2679–2689. [CrossRef]
19. Cabanas, M.F.; Norniella, J.G.; Melero, M.G.; Rojas, C.H.; Cano, J.M.; Pedrayes, F.; Orcajo, G.A. Detection ofstator winding insulation failures: On-line and off-line tests. In Proceedings of the 2013 IEEE Workshop onElectrical Machines Design Control and Diagnosis (WEMDCD), Paris, France, 11–12 March 2013; pp. 210–219.
20. Maraaba, L.; Al-Hamouz, Z.; Abido, M. An Efficient Stator Inter-Turn Fault Diagnosis Tool for InductionMontors. Energies 2018, 11, 653. [CrossRef]
21. Leite, V.C.M.N.; Borges da Silva, J.G.; Veloso, G.F.C.; Borges da Silva, L.E.; Lambert-Torres, G.; Bonaldi, E.L.;de Oliveira, L.E.D.L. Detection of Localized Bearing Faults in Induction Machines by Spectral Kurtosis andEnvelope Analysis of Stator Current. IEEE Trans. Ind. Electron. 2015, 62, 1855–1865. [CrossRef]

Energies 2020, 13, 3626 17 of 17
22. Glowacz, A.; Głowacz, Z.; Glowacz, W.; Carletti, E.; Kozik, J.; Korenciak, D.; Gutten, M.; Khan, F.; Irfant, M.Fault Diagnosis of Three Phase Induction Motor Using Current Signal, MSAF-Ratio15 and Selected Classifiers.Arch. Metall. Mater. 2017, 62, 2413–2419. [CrossRef]
23. da Silva, A.M.; Povinelli, R.J.; Demerdash, N.A.O. Rotor Bar Fault Monitoring Method Based on Analysis ofAir-Gap Torques of Induction Motors. IEEE Trans. Ind. Inform. 2013, 9, 2274–2283. [CrossRef]
24. Arkan, M.; Kostic-Perovic, D.; Unsworth, P.J. Modelling and simulation of induction motors with inter-turnfaults for diagnostics. Electr. Power Syst. Res. 2005, 75, 57–66. [CrossRef]
© 2020 by the authors. Licensee MDPI, Basel, Switzerland. This article is an open accessarticle distributed under the terms and conditions of the Creative Commons Attribution(CC BY) license (http://creativecommons.org/licenses/by/4.0/).


![PROTECTION SCHEME FOR DOUBLE CIRCUIT ...ictactjournals.in/paper/IJME_Vol_4_Iss_3_Paper_8_656_664.pdfin EHV transmission lines [9]. A faulty phase selector, based on adaptive cumulative](https://img.dokumen.tips/doc/110x75/5fd989df51624a504106a508/protection-scheme-for-double-circuit-in-ehv-transmission-lines-9-a-faulty.jpg)