Embed Size (px)
Citation preview

Fault Wear by Damage Evolution During Steady-State Slip
VLADIMIR LYAKHOVSKY,1 AMIR SAGY,1 YUVAL BONEH,2 and ZE’EV RECHES3
Abstract—Slip along faults generates wear products such as
gouge layers and cataclasite zones that range in thickness from sub-
millimeter to tens of meters. The properties of these zones appar-
ently control fault strength and slip stability. Here we present a new
model of wear in a three-body configuration that utilizes the
damage rheology approach and considers the process as a micro-
fracturing or damage front propagating from the gouge zone into
the solid rock. The derivations for steady-state conditions lead to a
scaling relation for the damage front velocity considered as the
wear-rate. The model predicts that the wear-rate is a function of the
shear-stress and may vanish when the shear-stress drops below the
microfracturing strength of the fault host rock. The simulated
results successfully fit the measured friction and wear during shear
experiments along faults made of carbonate and tonalite. The
model is also valid for relatively large confining pressures, small
damage-induced change of the bulk modulus and significant deg-
radation of the shear modulus, which are assumed for seismogenic
zones of earthquake faults. The presented formulation indicates that
wear dynamics in brittle materials in general and in natural faults in
particular can be understood by the concept of a ‘‘propagating
damage front’’ and the evolution of a third-body layer.
Key words: Fault wear, Wear-rate, Friction, Damage
rheology.
1. Introduction
Wear is a fundamental process in shearing sur-
faces that was studied experimentally and
theoretically, especially for engineering materials
(ARCHARD 1953; ARCHARD and HIRCH 1956; QUEENER
et al. 1965; LEVY and JEE 1988; KATO and ADACHI
2000). However, the mechanics of the process in a
three-body configuration is still poorly understood.
The Archard model for wear between sliding solid
blocks states that the wear volume linearly increases
with applied normal stress (ARCHARD 1953). This
prediction is not consistent with recent experimental
results of shearing rock faults demonstrating that
wear-rates at steady-state conditions strongly depend
on slip velocity.
Slip along faults in the upper crust is always
associated with wear of the shearing rock blocks
(POWER et al. 1988; SCHOLZ 2002), as evident by
slickenside striations (PETIT 1987) and gouge zones
(ENGELDER 1974; SIBSON 1977; CHESTER and LOGAN
1987). The wear processes strongly affect the fault
structure. First, the plucking and crushing of fault
surface asperities during shear (Fig. 1a) (WANG and
SCHOLZ 1994) modifies the geometry of the fault slip
surfaces (SAGY and BRODSKY 2009). Second, the wear
leads to the establishment of gouge and cataclasite
zones (Fig. 1b) that range in thickness from sub-
millimeter to tens of meters (KATZ et al. 2003; WIL-
SON et al. 2005; SHIPTON et al. 2006; WIBBERLEY et al.
2008). Experimental works showed that a gouge zone
may be established after short slip distances of just a
few centimeters (BONEH 2012). Thus, the existence of
a gouge-zone transforms the fault slip from a ‘‘two-
body’’ mode, in which the shearing occurs at direct
contacts between asperities (Fig. 1a), into a ‘‘three-
body’’ mode in which shearing occurs with a granular
material, powder or fluid layer that separates the
blocks (Fig. 1b) (RABINOWICZ et al. 1961; GODET
1984; FILLOT et al. 2007).
The wear of fault blocks into gouge powder is an
energy dissipative process, and thus its intensity
contributes to the frictional resistance of the fault
(BYERELEE 1967; POWER et al. 1988; WILSON et al.
2005). Moreover, the gouge properties and its evo-
lution apparently control the strength and stability of
the fault (HAN et al. 2010; RECHES and LOCKNER
1 Geological Survey of Israel, 30 Malkhei Israel St., Jerusa-
lem, Israel. E-mail: [email protected] Earth and Planetary Sciences, Washington University, One
Brooking Drive, St. Louis, MO 63130, USA.3 School of Geology and Geophysics, University of Okla-
homa, Norman, OK 73019, USA.
Pure Appl. Geophys.
� 2014 Springer Basel
DOI 10.1007/s00024-014-0787-x Pure and Applied Geophysics

2010). Whereas wear of bare rock blocks was studied
experimentally and theoretically (WANG and SCHOLZ
1994; POWER et al. 1988; BRODSKY et al. 2011), fault
wear in a third-body setting is yet poorly understood;
we propose here a wear model for this configuration.
The present model utilizes the damage rheology
approach (LYAKHOVSKY et al. 1997) for the analysis of
rock wear. First, we outline the model’s approach and
describe the friction and wear-rate observations dur-
ing slip along experimental faults (BONEH et al. 2013;
RECHES and LOCKNER 2010). Then, we use the key
results of the damage rheology model, which are
presented in the ‘‘Appendix’’, to evaluate the wear-
rate of the present experiments. Finally, we discuss
the implications of the present model for natural
faults.
2. Wear Rate Model
2.1. Concepts and Assumptions
The common model for wear between sliding
solid blocks (ARCHARD 1953; ARCHARD and HIRCH
1956) states that the wear volume, WV, follows the
relation
WV ¼ K � D� P
Hð1Þ
where K is a dimensionless probability constant, D—
slip distance, P—applied normal load, and H—
hardness of the softer component of the slipping
system or flow pressure. The Archard model is based
on the assumption that wear occurs at the real contact
area between the sliding surfaces, e.g., the touching
asperities (Fig. 1a), which is significantly smaller
than the nominal area. QUEENER et al. (1965) exper-
imentally recognized an initial transient stage with
high wear production, which is termed ‘‘running-in’’.
The combined wear model, high running-in wear-rate
(QUEENER et al. 1965) followed by lower steady-state
wear-rate (Eq. 1) was applied to many experimental
analyses of slip between two solid blocks (e.g.,
QUEENER et al. 1965; LEVY and JEE 1988; KATO and
ADACHI 2000, WANG and SCHOLZ 1994; BONEH et al.
2014). However, recent experimental analyses of
shearing rock faults demonstrated that Archard’s
model cannot explain some central observations of
fault wear. HIROSE et al. (2012) found that wear-rates
at steady-state conditions strongly depend on slip
velocity, which is not considered in Archard’s model.
They found that granite samples displayed power
relations of wear-rate, whereas a negligible wear-rate
value was measured for sandstone samples during
high velocity runs. BONEH et al. (2013) further found
that the values of wear-rate and frictional strength in
carbonate rocks are interconnected and depend on
both slip-velocity and normal stress.
Following these experiments, we present here a
new, general model for wear at steady-state slip. The
model incorporates the effects of both normal stress
and slip velocity, and it shows that Archard’s model
is a special case of a more general behavior. Our
model is based on the following plausible
assumptions:
Two-body Three-body
A B
Figure 1Schematic illustration of a fault zone in two-body (a) and three-body modes (b). In two-body mode, the sliding blocks interact at touching
asperities that reflect the surface roughness. In three-body mode, the sliding blocks are separated by a gouge layer, and wear accumulation
occurs at the rock-gouge contact
V. Lyakhovsky et al. Pure Appl. Geophys.

1. Steady-state fault slip occurs in three-body con-
figuration in which a gouge layer separates the
rock blocks (Fig. 1b) (BONEH et al. 2014).
2. The wear of the rock blocks occurs at the rock-
gouge contact (SAGY and BRODSKY 2009; HEESAK-
KERS et al. 2011a, b).
3. The solid rock wears by microfracturing-induced
damage, which is controlled by the shear stresses
at the rock-gouge contact.
4. Once the microfractures reach a critical density,
the solid rock disintegrates and its fragments
merge with the gouge zone.
We envision the above process as a microfractur-
ing/damage front that propagates into the solid rock
and consider the front velocity as the steady-state
wear-rate. Modeling fault wear according to the
above assumptions is accomplished here by applica-
tion of damage mechanics that was developed to
quantify brittle rock evolution during continuous
deformation (e.g., KRAJNOVIC 1996; ALLIX and HILD
2002). We show below that (a) wear evolution can be
modeled in the framework of phase transition, while
the shear kinematics is controlled by the resistance to
shear (LU et al. 2007; LYAKHOVSKY and BEN-ZION
2014a, b); and (b) wear-rate is a function of the
system shear and the normal stresses. Finally, we test
the validity of the present model by comparing the
theoretical predictions with wear-rate observations of
experimental faults made of carbonate rock (BONEH
et al. 2013) and tonalite (RECHES and LOCKNER 2010).
2.2. Damage Rheology
Models of damage rheology account for evolving
elastic/plastic properties of a deforming body in
terms of a ‘‘damage-state’’ variable that most likely
represents the local density of micro-cracks. This
concept is supported by the observations of gradual
accumulation of distributed micro-cracks, their coa-
lescence and localization in a narrow, highly
damaged zone with strong micro-crack interaction
prior to failure (e.g., LOCKNER et al. 1992; ZANG et al.
2000; RECHES and LOCKNER 1994). The continuum
damage mechanics, which provides a general frame-
work for the rheological behavior during failure
processes, has been based on pioneering works by
ROBINSON (1952), HOFF (1953), KACHANOV (1958,
1986) and RABOTNOV (1959, 1988) and been further
developed in engineering (e.g., HANSEN and SCHREYER
1994; KACHANOV 1994; KRAJCINOVIC 1996; LEMAITRE
1996; ALLIX and HILD 2002) and the earth sciences
(e.g., NEWMAN and PHOENIX 2001; BERCOVICI et al.
2001; BERCOVICI and RICARD 2003; SHCHERBAKOV and
TURCOTTE 2003; TURCOTTE et al. 2003; RICARD and
BERCOVICI 2009; KARRECH et al. 2011). The most
important advantage of these and other continuum
damage mechanics model formulations is that they
account for the time-dependent gradual micro-crack
accumulation. This is the main difference between
damage mechanics and classical fracture mechanics
or elasto-plastic models which postulate that failure
occurs at given yielding stress conditions ignoring
time-dependency of the fracture process. The damage
rheology model is capable in reproducing the main
stages of the faulting process starting from subcritical
crack growth at very early stages of loading, material
degradation due to increasing crack concentration,
macroscopic brittle failure, post failure deformation,
and healing. This physical framework allows model-
ing the evolution of various fields and properties in
laboratory experiments of brittle deformation as well
as simultaneous evolution of damage and its local-
ization into narrow highly damaged zones (faults) at
crustal scale, earthquakes and associated deformation
fields.
Strong micro-crack interaction in a small, inten-
sely damaged volume prior to failure (e.g., RECHES
and LOCKNER 1994) raised the need for a non-local
model, in which the constitutive relation at a given
position is substituted by a law accounting for the
spatial distribution of the state variable over a
selected neighborhood. The concept of non-local
continuum was first introduced to model small-scale
effects and heterogeneities in elastic solids (e.g.,
ERINGEN 1966; KRONER 1968; BAZANT 1991). Non-
local models, either integral or gradient type (e.g.,
BAZANT and JIRASEK 2002), account for strong micro-
crack interaction in a highly damaged area prior to
total failure and are capable of reproducing size effect
(e.g., BAZANT 2005). In this study we use the
simplified 1-D version of the model formulated by
LYAKHOVSKY et al. (2011) and further developed in
LYAKHOVSKY and BEN-ZION (2014a, b), where
Fault Wear by Damage Evolution
complete thermodynamic derivations are presented.
LYAKHOVSKY and BEN-ZION (2014b) utilized a three-
body configuration and simulated frictional response
including transitions from high quasi-static friction
values at low slip velocity to dynamic friction at high
slip rates, but ignored the wear process addressed in
the present study.
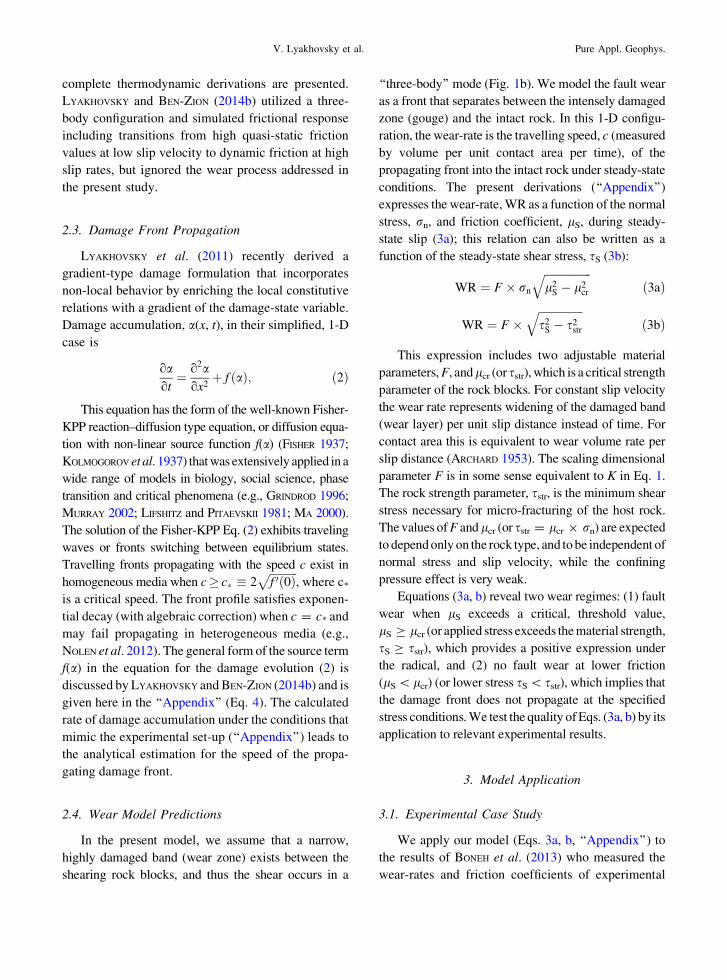
2.3. Damage Front Propagation
LYAKHOVSKY et al. (2011) recently derived a
gradient-type damage formulation that incorporates
non-local behavior by enriching the local constitutive
relations with a gradient of the damage-state variable.
Damage accumulation, a(x, t), in their simplified, 1-D
case is
oaot¼ o2a
ox2þ f ðaÞ; ð2Þ
This equation has the form of the well-known Fisher-
KPP reaction–diffusion type equation, or diffusion equa-
tion with non-linear source function f(a) (FISHER 1937;
KOLMOGOROV et al. 1937) that was extensively applied in a
wide range of models in biology, social science, phase
transition and critical phenomena (e.g., GRINDROD 1996;
MURRAY 2002; LIFSHITZ and PITAEVSKII 1981; MA 2000).
The solution of the Fisher-KPP Eq. (2) exhibits traveling
waves or fronts switching between equilibrium states.
Travelling fronts propagating with the speed c exist in
homogeneous media when c� c� � 2ffiffiffiffiffiffiffiffiffiffi
f 0ð0Þp
, where c*
is a critical speed. The front profile satisfies exponen-
tial decay (with algebraic correction) when c = c* and
may fail propagating in heterogeneous media (e.g.,
NOLEN et al. 2012). The general form of the source term
f(a) in the equation for the damage evolution (2) is
discussed by LYAKHOVSKY and BEN-ZION (2014b) and is
given here in the ‘‘Appendix’’ (Eq. 4). The calculated
rate of damage accumulation under the conditions that
mimic the experimental set-up (‘‘Appendix’’) leads to
the analytical estimation for the speed of the propa-
gating damage front.
2.4. Wear Model Predictions
In the present model, we assume that a narrow,
highly damaged band (wear zone) exists between the
shearing rock blocks, and thus the shear occurs in a
‘‘three-body’’ mode (Fig. 1b). We model the fault wear
as a front that separates between the intensely damaged
zone (gouge) and the intact rock. In this 1-D configu-
ration, the wear-rate is the travelling speed, c (measured
by volume per unit contact area per time), of the
propagating front into the intact rock under steady-state
conditions. The present derivations (‘‘Appendix’’)
expresses the wear-rate, WR as a function of the normal
stress, rn, and friction coefficient, lS, during steady-
state slip (3a); this relation can also be written as a
function of the steady-state shear stress, sS (3b):
WR ¼ F � rn
ffiffiffiffiffiffiffiffiffiffiffiffiffiffiffiffiffi
l2S � l2
cr
q
ð3aÞ
WR ¼ F �ffiffiffiffiffiffiffiffiffiffiffiffiffiffiffiffi
s2S � s2
str
q
ð3bÞ
This expression includes two adjustable material
parameters, F, andlcr (or sstr), which is a critical strength
parameter of the rock blocks. For constant slip velocity
the wear rate represents widening of the damaged band
(wear layer) per unit slip distance instead of time. For
contact area this is equivalent to wear volume rate per
slip distance (ARCHARD 1953). The scaling dimensional
parameter F is in some sense equivalent to K in Eq. 1.
The rock strength parameter, sstr, is the minimum shear
stress necessary for micro-fracturing of the host rock.
The values of F and lcr (or sstr = lcr 9 rn) are expected
to depend only on the rock type, and to be independent of
normal stress and slip velocity, while the confining
pressure effect is very weak.
Equations (3a, b) reveal two wear regimes: (1) fault
wear when lS exceeds a critical, threshold value,
lS C lcr (or applied stress exceeds the material strength,
sS C sstr), which provides a positive expression under
the radical, and (2) no fault wear at lower friction
(lS \lcr) (or lower stress sS \ sstr), which implies that
the damage front does not propagate at the specified
stress conditions. We test the quality of Eqs. (3a, b) by its
application to relevant experimental results.
3. Model Application
3.1. Experimental Case Study
We apply our model (Eqs. 3a, b, ‘‘Appendix’’) to
the results of BONEH et al. (2013) who measured the
wear-rates and friction coefficients of experimental
V. Lyakhovsky et al. Pure Appl. Geophys.

fault made of carbonate rocks. They used a high-
velocity, rotary shear apparatus (RECHES and LOCKNER
2010) to shear solid rock samples with ring-shaped
contact (5.4 and 7.6 cm inner and outer diameters).
Three rock types were used: Kasota dolomite, Dover
limestone and a sample containing an upper Kasota
dolomite and a lower Blue quartzite. BONEH et al.
(2013) performed 87 experiments with total slip of
2–28 m at normal stresses between 0.25 and
6.9 MPa. The experiments included 72 constant-
velocity experiments and 15 stepping-velocity exper-
iments at a slip velocity range of 0.002–0.96 m/s.
BONEH et al. (2013) found that the steady-state
friction coefficient lS of the tested carbonate faults
correlates best with the experimental power-density
(shear stress times slip velocity). Figure 2a presents
the steady-state friction coefficients, lS, measured as
a function of normal stress and slip velocity in all
tests of the Kasota dolomite and Dover limestone,
whereby both upper and bottom sheared surfaces are
from the same lithology. Under slow slip velocity
(below *0.01 m/s) the lS is high in the range of
0.6–0.8 with a minor decrease under elevated normal
stress. The most significant feature of Fig. 2a is the
steep decrease of lS as the slip velocity increases
from *0.01 to *0.3 m/s.
BONEH et al. (2013) followed RECHES and LOCKNER
(2010) and calculated the continuous wear-rate along the
experimental faults in terms of wear-rate = [fault-nor-
mal shortening]/[slip distance], with units of [micron/m].
BONEH et al. (2013) found that the wear-rates during
steady-state slip also depend on both slip velocity and
normal stress. At low velocity, V \ 0.1 m/s, the wear-
rate linearly depends on the normal stress, whereas at
high velocities, V [0.3 m/s, the wear-rate decreases
with increasing normal stresses. In these experiments, the
wear-rates approach zero at the highest velocities,
V * 1 m/s, and normal stresses, rn * 7 MPa.
3.2. Model Adjustments
To apply the present model to the above exper-
imental results, we first generalized the trend of the
experimental frictional results (Fig. 2a) to a simpler
trend (Fig. 2b), in which high, constant friction
values are set at low velocity and a steep friction
drop is set for 0.01–0.1 m/s velocity increase. The
friction values are about constant at high slip
velocities. A similar steep drop of friction values
was observed in laboratory experiments with differ-
ent rock types (e.g., DI TORO et al. 2011). A cross-
section of this function (Fig. 3a, black line) displays
the relations between slip velocity and steady-state
Fric
tion
coef
fici
ent
1
0.8
0.6
0.4
0.2
0
A
Fric
tion
coef
fici
ent
1
0.8
0.6
0.4
0.2
0
B
Figure 2Steady-state friction coefficient as a function of slip velocity and
normal stress. a Interpolation of 87 results of two sets of dynamic
shear experiments (dolomite on dolomite and limestone on
limestone), modified after BONEH et al. (2013). b Generalized
function pointing to significant friction decrease in the transition
zone and about constant value at higher slip-rate values
Fault Wear by Damage Evolution

friction at constant normal stress. Three model
regimes of steady-state frictional strength are built
into Figs. 2b and 3a:
Regime I—high, quasi-constant lS of 0.7–0.8 at low
slip velocity;
Regime II—steep drop rate of lS with increasing
slip-rate;
Regime III—low, quasi-constant lS at high slip-
rates.
Our model predicts that the wear-rate is propor-
tional to the shear stress (Eq. 3b); this dependence is
a natural outcome of model assumption #3 above.
Thus, under constant normal stress, the wear-rate (red
curve in Fig. 3a) dependence on slip velocity is
predicted to mimic the dependence of friction coef-
ficient lS (black curve in Fig. 3a). In this respect,
similarly to the FILLOT et al. (2007) model, our model
links the fault wear to the shear resistance of the fault
during steady state. The model predicts significantly
different wear-rates associated with three frictional
regimes: high wear-rates in regime I, transitional
wear-rates in regime II and vanishing wear-rates in
regime III. Furthermore, the wear-rate drops when
lS ? lcr (Eqs. 3a, b) and may even vanish when the
frictional strength decreases below the defined crit-
ical value (lS \ lcr) (Fig. 3a). These wear-rate
variations may be expressed in terms of the applied
stress (Fig. 3b). The red line in Fig. 3b shows the
material strength versus normal stress for the selected
lcr = 0.3. Under loading conditions corresponding to
lS = 0.75 or 0.5 the shear stress is above the material
strength (lines I and II in Fig. 3b). These stress
conditions favor micro-fracturing in the form of a
propagating damage front into the solid rock. In the
case of low shear stresses in regime III with
lS = 0.25, the shear stress is below the material
strength, which is the threshold for micro-crack
nucleation and growth; with no rock damage, fault
slip might continue without wear.
Figure 3c displays the expected relations between
normal stress and wear-rate for the three regimes of
Fig. 3a. The wear-rate is expected to linearly increase
with respect to the normal stress, as in Archard’s
Fri
ctio
n co
effi
cien
t
I II III0
0.1
0.2
0.3
0.4
0.5
0.6
0.7
0.8
0.9
Wea
r ra
te
Slip velocity (m/s)
Aµs=0.75
0.5
0.25µcr=0.3
10-110-2 101
Normal stress (MPa)
Shea
r st
ress
(M
Pa)
III
III
B
µs=0.75
0.5
0.250.3
100
5
2.5
05
Wea
r ra
te
III
III
C
Normal stress (MPa)1050
Figure 3Present model predictions. a Schematic relationship between
steady-state friction and slip velocity at constant normal stress
(black line). Red line shows calculated wear-rate. Three regimes of
steady-state frictional strength are marked: (I)—high friction at low
slip velocity; (II)—steep drop with increasing slip rate; (III)—low
friction at high slip-rates. Wear-rate drops to zero at critical friction
coefficient lcr. b Shear versus normal stress for frictional values
representing three different regimes. Red line shows shear stress
corresponding to material strength for lcr = 0.3. c Wear-rate
versus normal stress for the same regimes
V. Lyakhovsky et al. Pure Appl. Geophys.

model, but at a different slope that depends on the
steady-state friction. The slopes marked I–III in
Fig. 3c correspond to the representative friction
values of lS = 0.75 and 0.5 for the regimes I and
II and is zero (no wear) for lS = 0.25 in regime III.
3.3. Comparison of Experimental Results and Model
Predictions
3.3.1 Carbonate Faults
The experimentally measured wear-rates are now
compared with the predicted trends of the model.
Figure 4 shows measured wear-rates reported by
BONEH et al. (2013) for Dover limestone samples
(Fig. 4a) and for samples containing an upper Kasota
dolomite and a lower Blue quartzite (Fig. 4b).
Experimentally measured wear-rates were fitted
with the model Eq. (3a) using least-squares by
changing two parameters, material constant F and
critical friction coefficient lcr. The best fitting
model parameters are: F = 98.4 lm m-1 MPa-1,
lcr = 0.68 for Dover limestone, F =
49.8 lm m-1 MPa-1, lcr = 0.35 for Kasota dolo-
mite on Blue quartzite. Experimental results for each
rock type are plotted in three groups according to the
observed steady-state friction value. The modeled
trend lines (dashed lines with the same color as
markers representing specific group) are the calcu-
lated linear relations between the experimental wear-
rate and normal stress for the given friction
group. The systematic slope decrease with decreasing
friction coefficients fits the model predictions.
Comparison of the experimentally observed wear-
rates with the model’s calculated wear-rates (Eq. 3a)
in Fig. 5 indicates that the simplified 1-D model
reproduces the general trends of the wear-rate
changes with both normal stress and frictional
strength.
0
20
40
60
80
100
120
140
160
0 0.5 1 1.5 2 2.5 3
Normal stress (MPa)
Wea
r ra
te (
µm/m
)
< 0.70.7 – 0.8> 0.8
A
B
0
50
100
150
200
0 1 2 3 4 5 6 7
Normal stress (MPa)
< 0.50.5 – 0.65> 0.65
Wea
r ra
te (
µm/m
)
Figure 4Experimentally measured wear-rates under steady-state conditions
(after BONEH et al. 2013) for Dover limestone faults (a), and for
samples composed of an upper Kasota dolomite and a lower Blue
quartzite (b). Colored points are grouped according to the range of
the measured friction coefficient (inset). Dashed lines with the
same color are the model-predicted wear-rates according to the
frictional value for each group
- Limestone
- KD on BQ
0 50 100 150 200
Observed wear rate (µm/m)
0
50
100
150
200
Sim
ulat
ed w
ear
rate
(µm
/m)
Figure 5Model simulated versus experimentally observed wear-rates for
the two sets of experiments shown in Fig. 4
Fault Wear by Damage Evolution

3.3.2 Tonalite Fault
An extensive series of friction experiments on
samples of tonalite, which is better known by its
commercial name Sierra White granite (SWG), were
reported by RECHES and LOCKNER (2010). We apply
the present model to their experiment #616 that was
conducted at a constant normal load of 3.08 Mpa and
stepping velocity. This experiment was conducted on
the same rotary apparatus and similar sample geom-
etry as BONEH et al. (2013), but differs in two central
parameters: rock composition and loading configura-
tion. The #616 experimental fault was made of
tonalite, an igneous rock dominated by quartz and
feldspar (RECHES and LOCKNER 2010), whereas BONEH
et al.’s (2013) experiments were conducted on
limestone and dolomite samples. Also, experiment
#616 was subjected to a continuous sequence of 30
slip velocity steps from V = 0.0015 to 0.32 m/s, and
the slip distance during each velocity step was 2.1 m;
on the other hand, the reported experiments in Fig. 4
are single velocity runs. The experimental results of
#616 (Fig. 6) are shown by friction coefficient (blue
line) and wear-rate (green line) as a function of the
changing slip velocity. We used Eq. (3a) to calculate
the expected wear-rates for the measured friction
coefficient, and the red line in Fig. 6 is the calculated
curve for F = 6.5 lm m-1 MPa-1, lcr = 0.25.
Instead of the best-fit procedure, these values were
chosen to reproduce high wear-rate values during the
initial experimental stages with low slip velocities
(up to 0.01 m/s), and the low wear-rate values for the
velocity range between 0.01 and 0.1 m/s. The present
model based on steady-state conditions is not
expected to fit experimental results of transient
conditions which are intrinsic for stepping velocity
experiments. Therefore, the least-squares procedure
was not applied to the measured data.
In spite of the transient nature of #616 experi-
ment, the present model, provides a reasonable fit to
the experimental data, and predicts the main features
of the observations: (1) abrupt wear-rate decreases as
the friction coefficient drops from *0.7 to *0.4 (slip
velocity *0.01 m/s). Yet, the measured wear-rate
decreases gradually, whereas the model’s calculated
wear-rate drops abruptly. This difference is probably
associated with transient change of the wear-rate that
under changing velocities does not reach the steady-
state of the presented model. (2) At higher velocities
(above 0.1 m/s), the experimental friction coefficient
abruptly increases (due to temperature rise, RECHES
and LOCKNER 2010; SAMMIS et al. 2011), as well as the
experimental and model-derived wear-rates. Note
again a delay of the rise of the experimental wear-
rate. We also note that the model fails to predict the
abrupt drop of wear-rate at the high-velocity of V
0.22–0.29 m/s). Nevertheless, the successful model
simulation of the wear-rates in experiment #616
further indicate the strong correlation between fric-
tional strength and wear-rate even under transient slip
conditions.
4. Discussion
4.1. Relations to Archard’s Wear Model
We derived the model for wear-rate of rock faults
under steady-state conditions with constant slip
velocity and loading stresses motivated mainly by
the limited ability of the well-known ARCHARD (1953)
model to explain recent experimental observations of
rock wear (HIROSE et al. 2012; BONEH et al. 2013).
ARCHARD’s (1953) model was based on wear at
0
2
4
6
8
10
12
14
16
18
20
0.0001 0.001 0.01 0.1 1
Velocity (m/s)
Wea
r ra
te (
µm/m
)
0.2
0.3
0.4
0.5
0.6
0.7
0.8
0.9
1
Fri
ctio
n co
effi
cien
t
Friction (experiment #616)
Wear rate (experiment #616)
Wear rate (present model)
Figure 6Wear-rate and friction coefficient during rotary shear experiment
(#616 in RECHES and LOCKNER 2010) plotted with wear-rate
predictions of the present model. The experiment was conducted
on a tonalite (Sierra White granite) sample at normal stress of
3.05 MPa with total slip of 65 m at 30 slip velocity steps (see text)
V. Lyakhovsky et al. Pure Appl. Geophys.

contacting asperities (Fig. 1a), implying that the
wear-rate is proportional to a strength ratio of
[normal stress]/[hardness of the softer surface]
(Eq. 1). The mechanical conditions at the contacting
asperities (e.g., gouge presence, roughness, and
lubrication) were integrated into one free parameter,
K. In contrast, our model is derived for slip in a three-
body mode (Fig. 1b) with a gouge layer separating
the blocks; experimental (RECHES and LOCKNER 2010;
BONEH et al. 2014) and field observations (e.g.,
CHESTER and CHESTER 1998; KATZ et al. 2003) indicate
that this is the realistic mode for steady-state slip. In
the model, the wear process is associated with
microfracturing and gradual damage increase in the
solid rock.
We analyze the wear process by using a non-
local continuum damage mechanics connecting
wear-rate with the rate of a propagating damage
front. The evolving material damage in space and
time is defined by the reaction–diffusion equation
with non-linear source term (Eqs. 7, 8) known as
Fisher-KPP equations. Using the general properties
of the mathematical solution of Fisher-KPP equa-
tions, we can quantify the process dynamics without
calculating local state and motion of every single
crack in the system. The derivations lead to a simple
expression, Eqs. (3a, b), connecting the wear-rate
with the frictional strength of a fault. Comparison
with experimental data demonstrates that our wear
model is capable of predicting the wear-rates under
a wide range of slip velocities and normal stresses
(Figs. 4, 6) (Eqs. 3a, b). The model depends on the
critical strength of the host rock, ssrt, or its
equivalent, the critical friction coefficient, lcrt.
Archard’s model appears as a specific case in which
the friction coefficient is constant and larger than
the critical friction coefficient, lcrt, (as the wear-rate
vanishes when l B lcrt). Moreover, we showed in
the ‘‘Appendix’’ that the model is valid and even
simpler for wear in relatively large confining
pressures and significant degradation of the shear
modulus (Fig. 7), which are the conditions assumed
for natural faulting, but until now, have never been
taken into account in wear models. Considering
these intrinsic limitations of Archard’s model, its
application to field cases of natural faulting is
limited, as shown below.
4.2. Wear, Gouge Thickness and Fault Slip Distance
The present analysis provides an important insight
on gouge accumulation along faults. It is assumed
here that at steady-state, the front of fault wear
propagates into the host rock by micro-cracking
damage. Based on this assumption, the wear-rate has
simple relations to the friction coefficient (‘‘Appen-
dix’’, Fig. 3, Eq. 3a) or shear-stress (Eq. 3b). Now,
when the shear-stress drops, e.g., due to a friction
coefficient drop at high slip velocity, the wear-rate
also drops (Fig. 6), or even vanishes when lS \ lcr
(Figs. 3, 4, Eqs. 3a, b). An obvious deduction from
these results is that a fault may slip over long
distances without ongoing wear and thickening of the
gouge zone if the shear stress (or the equivalent
friction coefficient) is low enough. This conclusion
leads to a new view on gouge-zone thickness
(discussed below).
As fault gouge is the main wear product of fault
slip, it is commonly envisioned that gouge continu-
ously forms and accumulates during fault slip (e.g.,
SCHOLZ 1987). It was thus suggested that the total
gouge thickness, GT, along a given fault is propor-
tional to the total slip distance, D, of the fault. SCHOLZ
(1987) showed that this relation is a natural result of
Archard’s model, and used compiled field data to
demonstrate that GT is linearly proportional to the
total fault slip with GT/D = 0.1–0.001 over about
seven orders of magnitude of fault slip. Interestingly,
based on fractal fault geometry and transient wear
mechanism, POWER et al. (1988) also suggested that
0
0.1
0.2
0.3
0.4
0.5
0.6
0.7
0.8
0.9
1
0.2 0.3 0.4 0.5 0.6 0.7 0.8
Friction coefficient
Nor
mal
ized
wea
r -ra
te
Figure 7Normalized wear-rate versus friction coefficient calculated using
(14) with Poisson ratio, m = 0.2, 0.25 and 0.3 (black lines). Red
line shows suggested approximation (15) used in this study
Fault Wear by Damage Evolution

wear zone thickness of natural faults depends linearly
on displacement, because the size of the asperities
increases in an approximately linear relationship to
displacement. On the other hand, based on fault
surface roughness measurements and contact
mechanics, BRODSKY et al. (2011) predicted that
average wear-rate is a weak function of D (propor-
tional to D-1); therefore, even under infinite fractal
roughness the wear-rate is not constant. According to
BRODSKY et al. (2011), the predicted wear-rate
vanishes, or GT * constant, for faults that already
accumulated large slip distances. These works were
based on an asperity failure concept (Fig. 1a), and
considered the effects of roughness, lithology and
normal stresses on wear-rate (SCHOLZ 1987; WANG
and SCHOLZ 1994; POWER et al. 1988; BRODSKY et al.
2011), but implicitly ignored the intensity of the
fault-parallel shear-stress. On the other hand, our
model considered the three-body configuration
(Fig. 1b) in which the wear-rate depends on the
shear-stress intensity at the gouge-rock contact
(Eqs. 3a, b).
Our model results can now be applied to evaluate
fault wear at seismic conditions. Experimental works
have shown that the dynamic friction during high slip
velocity may be as low as 0.1–0.3, as shown in many
high-velocity friction experiments (RECHES and LOCK-
NER 2010; DI TORO et al. 2011; CHANG et al. 2012) or
even vanish at seismic velocities (HAN et al. 2010).
Application of these experimental observations to the
field indicates that earthquake slip could generate
very low wear, and thus the long-term gouge
accumulation along a seismically active fault is not
necessarily related to its total slip (SHIPTON et al.
2006). For example, CHESTER et al. (1993) analyzed
two major branches of the San Andreas system, the
north branch San Gabriel and Punchbowl faults, with
a total slip of 22 and 44 km, respectively. They
showed that almost the entire slip along these faults
was localized within a 1 m thick zone of cataclasite
(=cohesive gouge). According to SCHOLZ’s (1987)
compilation of GT/D = 0.1–0.001, the minimum
expected gouge thickness of these faults is on the
order of tens of meters. Thus, our model, which
predicts negligible wear for faults with low to
vanishing dynamic friction, provides a suitable inter-
pretation for the observed gouge thickness along
active faults such as the north branch San Gabriel and
Punchbowl, California.
Our model predictions may also hold for faults that
are intrinsically weak due to their composition. For
example, LOCKNER et al. (2011) analyzed the strength
of core materials collected from the San Andreas fault-
zone, California. The core was retrieved from a depth
of 2.7 km in the creeping segment of the host fault.
The strength measurements conducted at in situ con-
ditions revealed a very weak gouge, with a friction
coefficient of *0.15, due to the presence of saponite,
which is an extremely weak phyllosilicate mineral.
According to our model, faults with such low static
frictional strength will undergo negligible wear and
consequently will have anomalously thin gouge zones.
The present model is a simplified one that fits well
the simple configuration of the experimental faults.
However, the wear of natural faults can also be
affected by additional parameters such as pre-faulting
damage, variable slip velocity, complex geometrical,
lithological and rheological relations (e.g., KATZ et al.
2003; BRODSKY et al. 2011; NIELSEN et al. 2010).
5. Summary and Conclusions
The present wear model is based on a continuum
damage-breakage rheological model that provides a
general quantitative description of fault mechanics
(LYAKHOVSKY and BEN-ZION 2014b). This model con-
siders a transition from a solid phase with distributed
fracturing and evolving elastic moduli to a granular
phase referred to as pseudo-liquid. The model of
LYAKHOVSKY and BEN-ZION (2014b) reproduces central
features of a fault-zone structure, including slip
localization within a narrow zone, gouge formation
(three-body mode), and transition between slow
motion associated with high steady-state friction to a
dynamic regime with low friction. The present wear
model is a 1-D simplification of the general formu-
lation (‘‘Appendix’’) that leads to a general expression
for wear-rate under steady-state slip (Eqs. 3a, b).
The present analysis leads to the following
conclusions:
1. The theoretical wear-rate of a fault during steady-
state slip (Eqs. 3a, b) is linked to the shear stress
along the slipping fault: It is relatively high when
V. Lyakhovsky et al. Pure Appl. Geophys.

the shear stress, ss, is much higher than the rock
strength, sstr, it drops as the shear stress drops, and
the wear-rate vanishes when the shear stress is
lower than the rock strength.
2. The model successfully predicted the wear-rate
intensities in two sets of friction experiments
(BONEH et al. 2013; RECHES and LOCKNER 2010).
These experiments were conducted on different
rocks (limestone, dolomite and tonalite), a wide
range of slip velocities (0.001–0.97 m/s), and two
types of loading histories (constant slip velocity or
stepping velocity).
3. This successful application to experimental obser-
vations indicates that the central model concept of
damage-driven wear in a ‘‘three-body’’ configura-
tion (Fig. 1b) is a reasonable approach for wear
under steady-state slip. We conclude that this
concept is more realistic than the asperities contact
model of bare rock surfaces (Fig. 2a).
4. The present wear model suggests that the thick-
ness of gouge (cataclasite) layers along a natural
fault strongly depends on their frictional strength,
and thus faults with low frictional resistance
(static and/or dynamic) may slip with low to
negligible wear.
Acknowledgments
The manuscript benefitted from useful comments by
Y. Ben-Zion (editor), W. Ashley Griffith (reviewer),
and an anonymous reviewer. The study was sup-
ported by the NSF, Geosciences, Equipment and
Facilities, Grant No. 0732715, with partial support of
NSF, Geosciences, Geophysics, Grant No. 1045414,
and ConocoPhillips Foundation grant. VL acknowl-
edges support by the US–Israel Binational Science
Foundation (Grant 2008248); AS acknowledges sup-
port by the Israel Science Foundation (Grant 929/10).
Appendix
Damage Rheology Model
Key derivations of the damage rheology model
leading to the estimate of the speed of the propagating
damage front are presented in this ‘‘Appendix’’.
Following thermodynamic balance relations and the
ONSAGER (1931) principle, LYAKHOVSKY et al. (1997)
developed a kinetic equation for the damage state
variable, a (weakening and healing) which is a
function of the progressive deformation. Non-linear
elasticity that connects the effective elastic moduli to
a damage variable and loading conditions allows
accounting for the transition from damage accumula-
tion to healing. This transition is controlled by the
strain invariants ratio n ¼ I1
�
ffiffiffiffi
I2
p, where I1 = ekk and
I2 = eijeij are the invariants of the elastic strain tensor
eij. The n value is a conjugate quantity to the ratio
between shear and normal stress expressed in terms of
strains, instead of stresses. The rate of damage/healing
accumulation is given by LYAKHOVSKY et al. (1997):
dadt¼
CdI2 n� n0ð Þ for n [ n0
C1 exp aC2
� �
I2 n� n0ð Þ for n\n0
(
: ð4Þ
where the coefficient Cd is the rate of positive dam-
age evolution (material degradation) that is
constrained by laboratory experiments (LYAKHOVSKY
et al. 1997; HAMIEL et al. 2004, 2006). The value
n = n0 controls the onset of damage accumulation or
transition from material healing to weakening asso-
ciated with microcrack nucleation and growth. The
value of the critical strain invariants ratio also called
‘‘modified internal friction’’ (see Fig. 3 in LYAKHOV-
SKY et al. 1997) is explicitly related to the internal
friction angle of Byerlee’s law (BYERLEE 1978) and
Poisson ratio of the intact rock.
The rate of damage recovery (healing) is assumed
to depend exponentially on a and produces logarith-
mic healing with time in agreement with the behavior
observed in laboratory experiments with rocks and
other materials (e.g., DIETERICH and KILGORE 1996;
SCHOLZ 2002; MUHURI et al. 2003; JOHNSON and JIA
2005). LYAKHOVSKY et al. (2005) showed that the
local damage model reproduces the main phenome-
nological features of the rate- and state-dependent
friction, and constrained the healing parameters C1,
C2 by comparing the model calculations with empiric
parameters of the slow-rate frictional sliding (e.g.,
DIETERICH 1972, 1979; MARONE 1998).
The damage accumulation under constant stress in
a simplified 1-D model with effective elastic moduli
Fault Wear by Damage Evolution
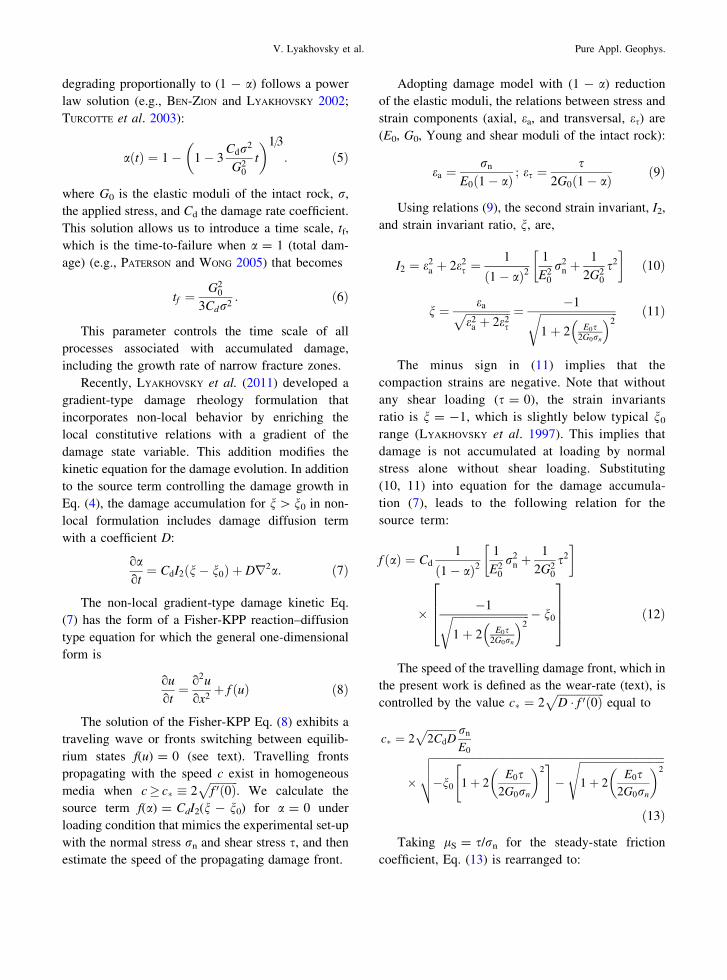
degrading proportionally to (1 - a) follows a power
law solution (e.g., BEN-ZION and LYAKHOVSKY 2002;
TURCOTTE et al. 2003):
aðtÞ ¼ 1� 1� 3Cdr2
G20
t
� �1=3
: ð5Þ
where G0 is the elastic moduli of the intact rock, r,
the applied stress, and Cd the damage rate coefficient.
This solution allows us to introduce a time scale, tf,
which is the time-to-failure when a = 1 (total dam-
age) (e.g., PATERSON and WONG 2005) that becomes
tf ¼G2
0
3Cdr2: ð6Þ
This parameter controls the time scale of all
processes associated with accumulated damage,
including the growth rate of narrow fracture zones.
Recently, LYAKHOVSKY et al. (2011) developed a
gradient-type damage rheology formulation that
incorporates non-local behavior by enriching the
local constitutive relations with a gradient of the
damage state variable. This addition modifies the
kinetic equation for the damage evolution. In addition
to the source term controlling the damage growth in
Eq. (4), the damage accumulation for n[ n0 in non-
local formulation includes damage diffusion term
with a coefficient D:
oaot¼ CdI2 n� n0ð Þ þ Dr2a: ð7Þ
The non-local gradient-type damage kinetic Eq.
(7) has the form of a Fisher-KPP reaction–diffusion
type equation for which the general one-dimensional
form is
ou
ot¼ o2u
ox2þ f ðuÞ ð8Þ
The solution of the Fisher-KPP Eq. (8) exhibits a
traveling wave or fronts switching between equilib-
rium states f(u) = 0 (see text). Travelling fronts
propagating with the speed c exist in homogeneous
media when c� c� � 2ffiffiffiffiffiffiffiffiffiffi
f 0ð0Þp
. We calculate the
source term f(a) = CdI2(n - n0) for a = 0 under
loading condition that mimics the experimental set-up
with the normal stress rn and shear stress s, and then
estimate the speed of the propagating damage front.
Adopting damage model with (1 - a) reduction
of the elastic moduli, the relations between stress and
strain components (axial, ea, and transversal, es) are
(E0, G0, Young and shear moduli of the intact rock):
ea ¼rn
E0 1� að Þ ; es ¼s
2G0 1� að Þ ð9Þ
Using relations (9), the second strain invariant, I2,
and strain invariant ratio, n, are,
I2 ¼ e2a þ 2e2
s ¼1
1� að Þ21
E20
r2n þ
1
2G20
s2
�
ð10Þ
n ¼ eaffiffiffiffiffiffiffiffiffiffiffiffiffiffiffiffi
e2a þ 2e2
s
p ¼ �1ffiffiffiffiffiffiffiffiffiffiffiffiffiffiffiffiffiffiffiffiffiffiffiffiffiffiffiffi
1þ 2 E0s2G0rn
� �2r ð11Þ
The minus sign in (11) implies that the
compaction strains are negative. Note that without
any shear loading (s = 0), the strain invariants
ratio is n = -1, which is slightly below typical n0
range (LYAKHOVSKY et al. 1997). This implies that
damage is not accumulated at loading by normal
stress alone without shear loading. Substituting
(10, 11) into equation for the damage accumula-
tion (7), leads to the following relation for the
source term:
f ðaÞ ¼ Cd
1
1� að Þ21
E20
r2n þ
1
2G20
s2
�
� �1ffiffiffiffiffiffiffiffiffiffiffiffiffiffiffiffiffiffiffiffiffiffiffiffiffiffiffiffi
1þ 2 E0s2G0rn
� �2r � n0
2
6
6
4
3
7
7
5
ð12Þ
The speed of the travelling damage front, which in
the present work is defined as the wear-rate (text), is
controlled by the value c� ¼ 2ffiffiffiffiffiffiffiffiffiffiffiffiffiffiffiffiffi
D � f 0ð0Þp
equal to
c� ¼ 2ffiffiffiffiffiffiffiffiffiffiffi
2CdDp rn
E0
�
ffiffiffiffiffiffiffiffiffiffiffiffiffiffiffiffiffiffiffiffiffiffiffiffiffiffiffiffiffiffiffiffiffiffiffiffiffiffiffiffiffiffiffiffiffiffiffiffiffiffiffiffiffiffiffiffiffiffiffiffiffiffiffiffiffiffiffiffiffiffiffiffiffiffiffiffiffiffiffiffiffiffiffiffiffiffiffiffi
�n0 1þ 2E0s
2G0rn
� �2" #
�
ffiffiffiffiffiffiffiffiffiffiffiffiffiffiffiffiffiffiffiffiffiffiffiffiffiffiffiffiffiffiffiffi
1þ 2E0s
2G0rn
� �2s
v
u
u
t
ð13Þ
Taking lS = s/rn for the steady-state friction
coefficient, Eq. (13) is rearranged to:
V. Lyakhovsky et al. Pure Appl. Geophys.

c� ¼ 2ffiffiffiffiffiffiffiffiffiffiffi
2CdDp rn
E0
ffiffiffiffiffiffiffiffiffiffiffiffiffiffiffiffiffiffiffiffiffiffiffiffiffiffiffiffiffiffiffiffiffiffiffiffiffiffiffiffiffiffiffiffiffiffiffiffiffiffiffiffiffiffiffi
�n0 1þ Al2S
�
�ffiffiffiffiffiffiffiffiffiffiffiffiffiffiffiffi
1þ Al2S
q
r
ð14Þ
where A = 2(E0/2G0)2 = 2(1 ? m)2, and m is the
Poisson ratio. Note that typical values of the strain
invariant ratio, n0, controlling the onset of damage
accumulation in (4) vary between n0 = -1.2 and
n0 = -0.6. These values are taken from Fig. 3 of
LYAKHOVSKY et al. (1997) for friction angle 30�,
m = 0.2 and for friction angle 40�, m = 0.3. The
steady-state friction coefficient should be above cer-
tain critical or threshold values (lS C lcr) related to
the material strength to give positive expression
under the radical in (14). A negative value for
lS \lcr implies that the applied shear stress is below
the level needed for the onset of damage accumula-
tion and the source term in damage growth Eq. (7) is
negative; no any damage is accumulated, and no wear
is anticipated.
The Poisson ratio for most rocks varies within the
small range m = 0.2–0.3. Variation of the steady-state
friction, lS, is also limited. It decreases from static
friction values about 0.6–0.8 to dynamic values about
0.2–0.4. Accounting for this limited range of the
material properties, the speed of the travelling
damage front or wear-rate calculated using (14) only
slightly depends on the Poisson ratio (black lines in
Fig. 7). Hence, the wear-rate may be approximated
by much simpler equation (red line in Fig. 7):
wear rate / rn
ffiffiffiffiffiffiffiffiffiffiffiffiffiffiffiffiffi
l2S � l2
cr
q
ð15Þ
The units of the speed of the travelling damage
front (13, 14) are length per time, while in the
laboratory experiments wear-rate measured the thin-
ning of the sample per unit slip. As the area of the
surface is constant (BONEH et al. 2013), this thinning
is proportional to the wear volume generation. Such
unit conversion could be done under steady-state
conditions with constant slip rate.
We note here that Eq. (14) was derived for the
loading conditions of experimental set-up. More
appropriate conditions for deep seismogenic zones
should account for relatively large confining pressure,
small damage-induced change of the bulk modulus
and significant degradation of the shear modulus.
Similar derivations lead directly to the more simple
form (15) instead of (14) for the natural conditions.
REFERENCES
ALLIX, O. and HILD, F. (2002) Continuum damage mechanics of
materials and structures, Elsevier, 396 pp.
ARCHARD, J.F. (1953) Contact and rubbing of flat surfaces, J. Appl.
Phys., 24, 981–988.
ARCHARD, J.F., HIRCH, W. (1956) Wear of metals under unlubri-
cated conditions. Proc. R. Soc. Lond. A Math. Phys. Sci. 236,
397–410.
BAZANT, Z.P. (1991) Why continuum damage is nonlocal: Mi-
cromechanics arguments, J. Eng. Mech., 1070–1087.
BAZANT, Z.P. (2005) Scaling of structural strength. Elsevier,
327 pp.
BAZANT, Z.P. and JIRASEK, M. (2002) Nonlocal integral formula-
tions of plasticity and damage: Survey of progress, J. Eng.
Mech., 128, 1119–1149.
BEN-ZION, Y., LYAKHOVSKY, V., (2002), Accelerating seismic
release and related aspects of seismicity patterns on earthquake
faults. Pure Appl. Geophys. 159, 2385–2412.
BERCOVICI, D. and RICARD, Y. (2003) Energetics of a two-phase
model of lithospheric damage, shear localization and plate
boundary formation, Geophys. J. Int., 152, 581–596.
BERCOVICI, D., RICARD, Y., and SCHUBERT, G. (2001) A two-phase
model for compaction and damage, part 1: general theory, J.
Geophys. Res., 106, 8887–8906.
BONEH, Y, CHANG, J.J., LOCKNER, D.A., and RECHES, Z. (2014) Fault
evolution by transient processes of wear and friction, Pure. Appl.
Geoph. (this volume).
BONEH, Y. (2012) Wear and gouge along faults: Experimental and
mechanical analysis, Thesis, Univ. Oklahoma.
BONEH, Y., SAGY, A., and RECHES, Z. (2013) Frictional strength and
wear-rate of carbonate faults during high-velocity, steady-state
sliding, Earth Planet. Sci. Lett., 381, 127–137.
BRODSKY E.E., GILCHRIST, J.J SAGY, A., and COLLETTINI, C. (2011)
Faults smooth gradually as a function of slip, Earth Planet. Sci.
Lett., 302, 185–193.
BYERELEE, J.D. (1967) Frictional characteristics of granite under
high confining pressure, J. Geophys. Res., 72, 3639-3648.
BYERLEE, J.D., (1978), Friction of rocks. Pure Appl. Geophys., 116,
615–626.
CHANG, J.C., LOCKNER, D.A., RECHES, Z. (2012) Rapid acceleration
leads to rapid weakening in earthquake-like laboratory experi-
ments, Science, 338, 101, doi:10.1126/science.1221195.
CHESTER, F.M., and CHESTER, J.S. (1998) Ultracataclasite structure
and friction processes of the San Andreas fault, Tectonophysics,
295, 199–221.
CHESTER, F.M., EVANS, J.P., BIEGEL, R.L. (1993) Internal structure
and weakening mechanisms of the San Andreas fault, J. Geophys.
Res., 98, 771–786.
CHESTER, F.M., LOGAN, J.M. (1987) Composite planar fabric of
gouge from the Punchbowl fault, California, J. Struct. Geol., 9,
621–634.
DI TORO, G., HAN, R., HIROSE, T., DE PAOLA, N., NIELSEN, S.,
MIZOGUCHI, K., FERRI, F., COCCO, M., SHIMAMOTO, T. (2011) Fault
lubrication during earthquakes. Nature, 471, 494–498.
Fault Wear by Damage Evolution

DIETERICH, J.H. and KILGORE, B.D., (1996), Imaging surface con-
tacts; power law contact distributions and contact stresses in
quarts, calcite, glass, and acrylic plastic, Tectonophysics, 256,
219–239.
DIETERICH, J.H., (1972) Time-dependent friction in rocks. J. Geo-
phys. Res., 77, 3690–3697.
DIETERICH, J.H., (1979) Modeling of rock friction 1. Experimental
results and constitutive equations, J. Geophys. Res., 84,
2161–2168.
ENGELDER, J. T. (1974), Cataclasis and the generation of fault
gouge. Geol. Soc. Am. Bull., 85, 1515–1522.
ERINGEN, A.C. (1966) A unified theory of thermomechanical
materials, Int. J. Energ. Sci., 4, 179–202.
FILLOT, N., IORDANOFF, I., and BERTHIER, Y. (2007) Wear modeling
and the third body concept, Wear, 262, 949–957.
FISHER, R. (1937), The wave of advance of advantageous genes,
Ann. Eugenics, 7, 355–369.
GODET, M. (1984) The third-body approach: A mechanical view of
wear. Wear, 100, 437–452.
GRINDROD, P. (1996) The theory and applications of reaction-dif-
fusion equations: Patterns and waves, Oxford Applied
Mathematics and Computing Science Series, The Clarendon
Press, Oxford Univ. Press, New York, 2nd ed., 275 p.
HAMIEL, Y., LIU, Y., LYAKHOVSKY, V., BEN-ZION. Y. and LOCKNER,
D., (2004), A visco-elastic damage model with applications to
stable and unstable fracturing. J. Geophys. Int. 159, 1155–1165.
HAMIEL, Y., KATZ, O., LYAKHOVSKY, V. RECHES, R. and FIALKO, Y.
(2006) Stable and unstable damage evolution in rocks with
implications to fracturing of granite. Geophys. J. Int. 167,
1005–1016, doi:10.1111/j.1365-246X.2006.03126.x.
HAN, R., HIROSE, T., SHIMAMOTO, T. (2010) Strong velocity weak-
ening and powder lubrication of simulated carbonate faults at
seismic slip rates. J. Geophys. Res., 115, B03412, doi:10.1029/
2008JB006136.
HANSEN, N.R. and SCHREYER, H.L. (1994) A thermodynamically
consistent framework for theories of elasticity coupled with
damage, Int. J. Solids Struct., 31, 359–389.
HEESAKKERS, V., MURPHY, S., and RECHES, Z. (2011a) Earthquake
rupture at focal depth, Part I: Structure and rupture of the
Pretorius fault, TauTona mine, South Africa, Pure Appl. Geo-
phys., doi:10.1007/s00024-011-0354-7.
HEESAKKERS V., MURPHY. S., LOCKER, D.A., and RECHES, Z. (2011b)
Earthquake rupture at focal depth, Part II: Mechanics of the
2004 M2.2 earthquake along the Pretorius fault, TauTona mine,
South Africa, Pure Appl. Geophys., doi:10.1007/s00024-011-
0355-6.
HIROSE, T., MIZOGUCHI, K., SHIMAMOTO, T. (2012) Wear processes in
rocks at slow to high slip rates. J. Struc. Geol., doi:10.1016/j.jsg.
2011.12.007.
HOFF, N.J. (1953) The necking and rupture of rods subjected to
constant tensile loads, J. Apl. Mech., 20, 105–108.
JOHNSON, P.A. and JIA, X., (2005), Non-linear dynamics, granular
media and dynamic earthquake triggering, Nature, 437,
871–874.
KACHANOV, L.M. (1958) On the time to rupture under creep con-
ditions, Izv. Acad. Nauk SSSR, OTN 8, 26-31 (in Russian).
KACHANOV, L.M. (1986), Introduction to Continuum Damage
Mechanics, Martinus Nijhoff Publishers, 135 p.
KACHANOV, M. (1994) On the concept of damage in creep and in
the brittle-elastic range, Int. J. Damage Mech., 3, 329–337.
KARRECH, A. REGENAUER-LIEB, K., and POULET, T. (2011) Contin-
uum damage mechanics for the lithosphere. J. Geophys. Res.,
116, B04205.
KATO, K., ADACHI, K. (2000) Wear mechanisms, In: Bhushan, B.
(ed.), Modern Tribology Handbook. CRC Press, Boca Raton,
Florida, 273–300.
KATZ, O., RECHES, Z. E. and BAER, G. (2003) Faults and their
associated host rock deformation: Part I. Structure of small
faults in a quartz–syenite body, southern Israel, J. Struct. Geol.,
25, 1675–1689.
KOLMOGOROV, A.N., PETROVSKII, I.G., and PISCOUNOV, N.S. (1937) A
study of the diffusion equation with increase in the amount of
substance, and its application to a biological problem, Bull.
Moscow Univ., Math. Mech. 1, 1–25. Translated by V.M.
Volosov in V.M. Tikhomirov, editor, Selected Works of A. N.
KRAJCINOVIC, D. (1996) Damage Mechanics, Amsterdam, Elsevier.
774 p.
KRONER, E., (1968) Elasticity theory of materials with long-range
cohesive force. Int. J. Solids Struct., 3, 731–742.
LEMAITRE, J. (1996) A Course on Damage Mechanics, Springer-
Verlag, Berlin.
LEVY, A. V., and JEE, N. (1988) Unlubricated sliding wear of
ceramic materials, Wear, 121, 363–380.
LIFSHITZ, E.M. and PITAEVSKII, L.P. (1981) Physical Kinetics,
Course of Theoretical Physics, L.D. Landau and E.M. Lifshitz,
Vol. 10, Elsevier, 452 p.
LOCKNER, D.A., MORROW, C., MOORE, D. and HICKMAN, S. (2011)
Low strength of deep San Andreas fault gouge from SAFOD core,
Nature, 472, p. doi:10.1038/nature09927.
LOCKNER, D.A., RECHER, Z., MOORE, D.E. (1992) Microcrack
interaction leading to shear fracture. In Proc. 33rd U.S. Sympo-
sium on Rock Mechanics (ed. W. Wawersik), A.A. Balkema
Rotterdam.
LU, K., BRODSKY, E.E., and KAVEHPOUR, H.P. (2007) Shear-weak-
ening of the transitional regime for granular flow, J. Fluid Mech.,
587, 347–372.
LYAKHOVSKY, V., BEN-ZION, Y. and AGNON, A., (2005) A visco-
elastic damage rheology and rate- and state-dependent friction.
Geophys. J. Int. 161, 179–190.
LYAKHOVSKY, V., and BEN-ZION Y., (2014a), Damage-Breakage
rheology model and solid-granular transition near brittle insta-
bility, J. Mech. Phys. Solids, 64, 184–197.
LYAKHOVSKY V. and BEN-ZION Y. (2014b) Continuum damage-
breakage model for faulting accounting for solid-granular
transition, Pure Appl. Geophys. (this volume).
LYAKHOVSKY V., HAMIEL, Y. and BEN-ZION, Y. (2011) A non-local
visco-elastic damage model and dynamic fracturing. J. Mech.
Phys. Solids, 59, 1752–1776. doi:10.1016/j.jmps.2011.05.016.
LYAKHOVSKY, V., BEN-ZION, Y., and AGNON, A. (1997) Distributed
damage, faulting, and friction, J. Geophys. Res., 102, 27635–27649.
MA, S. K. (2000), Modern theory of critical phenomena, Westview
press, 561 p.
MARONE, C., (1998), Laboratory-derived friction laws and their
application to seismic faulting, Annu. Rev. Earth Planet. Sci., 26,
643–649.
MUHURI, S.K., DEWERS, T.A., SCOTT, T.E., and RECHES, Z. (2003)
Interseismic fault strengthening and earthquake-slip stability:
Friction or cohesion? Geology, 31(10), 881–884.
MURRAY, J. D. (2002) Mathematical Biology: I. An Introduction,
3rd ed., Springer, 551 p.
V. Lyakhovsky et al. Pure Appl. Geophys.

NEWMAN W.I. and PHOENIX, S.L. (2001) Time-dependent fiber
bundles with local load sharing, Phys. Rev. E., 63(2), 021507,
doi:10.1103/PhysRevE.63.021507.
NIELSEN, S., DI TORO, G. and GRIFFITH, W.A. (2010), Friction and
roughness of a melting rock surface. Geophys. J. Int. 182,
299–310.
NOLEN, J., ROQUEJOFFRE, J.M., RYZHIK, L. and ZLATOS, A. (2012)
Existence and non-existence of Fisher-KPP transition fronts,
Arch. Rational Mech. Anal., 203, 217–246, doi:10.1007/s00205-
011-0449-4.
ONSAGER, L., (1931), Reciprocal relations in irreversible processes.
Phys. Rev., 37, 405–416.
PATERSON, M.S. and WONG, T.-F. (2005) Experimental Rock
Deformation—The Brittle Field. Berlin, Heidelberg, New York:
Springer-Verlag, 348 pp.
PETIT, J.P. (1987) Criteria for the sense of movement on fault
surfaces in brittle rocks, J. Struct. Geol., 9, 597–608.
POWER, W.L., TULLIS, T.E. and WEEKS, J.D. (1988) Roughness and
wear during brittle faulting, J. Geophys. Res. 93, 15268–15278.
QUEENER, C.A., SMITH, T.C., and MITCHELL, W.L. (1965) Transient
wear of machine parts, Wear, 8, 391–400.
RABINOWICZ, E., DUNN, L.A., and RUSSELL, P.G. (1961) A study of
abrasive wear under three-body conditions, Wear, 4, 345–355.
RABOTNOV, Y.N. (1959) A mechanism of a long time failure, in:
Creep problems in structural members, 5–7, USSR Academy of
Sci. Publ., Moscow.
RABOTNOV, Y.N. (1988) Mechanics of Deformable Solids, Moscow,
Science, 712 p.
RECHES, Z. and LOCKNER, D.A., (1994) Nucleation and growth of
faults in brittle rocks. J. Geophys. Res., 99, 18159–18173,
doi:10.1029/94JB00115.
RECHES, Z., and LOCKNER, D.A. (2010) Fault weakening and
earthquake instability by powder lubrication, Nature, 467,
452–456, doi:10.1038/nature09348.
RICARD, Y. and BERCOVICI, D. (2009) A continuum theory of grain-
size evolution and damage, J. Geophys. Res., 114. doi:10.1029/
2007JB005491.
ROBINSON, E.L. (1952) Effect of temperature variation on the long-
term rupture strength of steels, Trans. Am. Soc. Mech. Eng., 174,
777–781.
SAGY, A. and BRODSKY, E.E. (2009) Geometric and rheological
asperities in an exposed fault zone, J. Geophys. Res. 114,
B02301. doi:10.1029/2008JB005701.
SAMMIS, C., LOCKNER, D., RECHES, Z., 2011. The role of adsorbed
water on the friction of a layer of submicron particles. Pure Appl.
Geophys. 168, 2325–2334.
SCHOLZ, C.H. (1987) Wear and gouge formation in brittle faulting,
Geology, 15, 493–495.
SCHOLZ, C.H., (2002) The Mechanics of Earthquakes and Faulting,
2nd ed. Cambridge University Press, 471 p.
SHCHERBAKOV, R. and TURCOTTE, D.L. (2003) Damage and self-
similarity in fracture, Theor. Appl. Fracture Mech., 39, 245–258.
SHIPTON, Z.K., EVANS, J.P., ABERCROMBIE, R.E., and BRODSKY, E.E.
(2006) The missing sinks: slip localization in faults, damage
zones, and the seismic energy budget, In: Abercrombie, R. (eds.)
Earthquakes: Radiated Energy and the Physics of Faulting,
217–222. Washington, DC.
SIBSON, R.H. (1977) Fault rocks and fault mechanisms. J. Geol.
Soc. 133, 191–213.
TURCOTTE, D.L., NEWMAN, W.I., and SHCHERBAKOV, R. (2003) Micro
and macroscopic models of rock fracture, Geophys. J. Int., 152,
718–728.
WANG, W. and SCHOLZ, C.H. (1994) Wear processes during fric-
tional sliding of rock: a theoretical and experimental study.
J. Geophys. Res., 99, 6789–6799.
WIBBERLEY, C.A., YIELDING, G., and DI TORO, G. (2008) Recent
advances in the understanding of fault zone internal structure: A
review. Geol. Soc., London, Special Publ., 299, 5–33.
WILSON, B.T., DEWERS, T., RECHES, T. and BRUNE, J.N. (2005)
Particle size and energetics of gouge from earthquake rupture
zones. Nature, 434, 749–752.
ZANG, A., WAGNER, F., STANCHITS, S., JANSSEN, C. and DRESEN, G.,
2000. Fracture process zone in granite, J. Geophys. Res., 105,
23651–23661.
(Received August 28, 2013, revised January 29, 2014, accepted January 30, 2014)
Fault Wear by Damage Evolution