Embed Size (px)
Citation preview
Fault activation and microseismicity in laboratory
experimentsThomas Göbel
Danijel Schorlemmer, Sergei Stanchits, Erik Rybacki
Georg Dresen, Thorsten Becker, Charles Sammis

1. Changes in spatial and size distributions of seismic events during fault reactivation
2. What type of seismic sources do we expect?
3. Future experiments

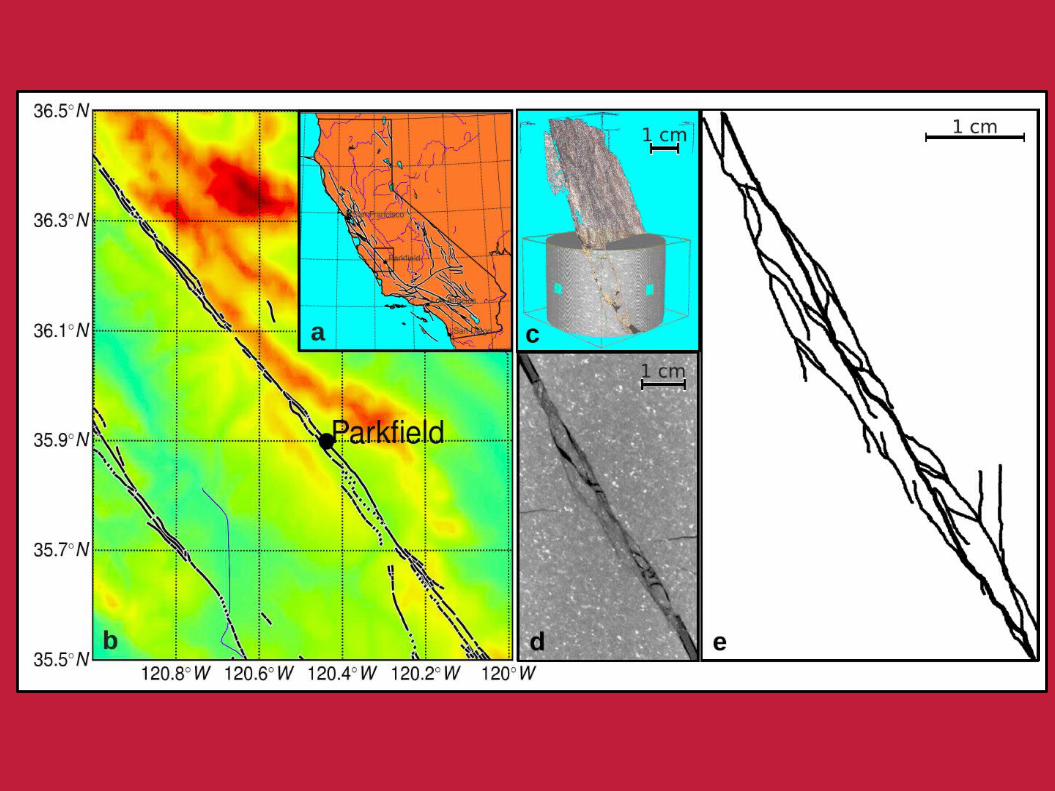
Sample and sensors
Rock specimen with notches
Pressure vessel and loading frame

Acoustic emission system:
o 16 channelso 10 MHz sampling frequencyo 16 bit resolutiono Piezo-electric sensors with
resonance frequency at 2MHzo Active and passive recordingo Full waveform recording
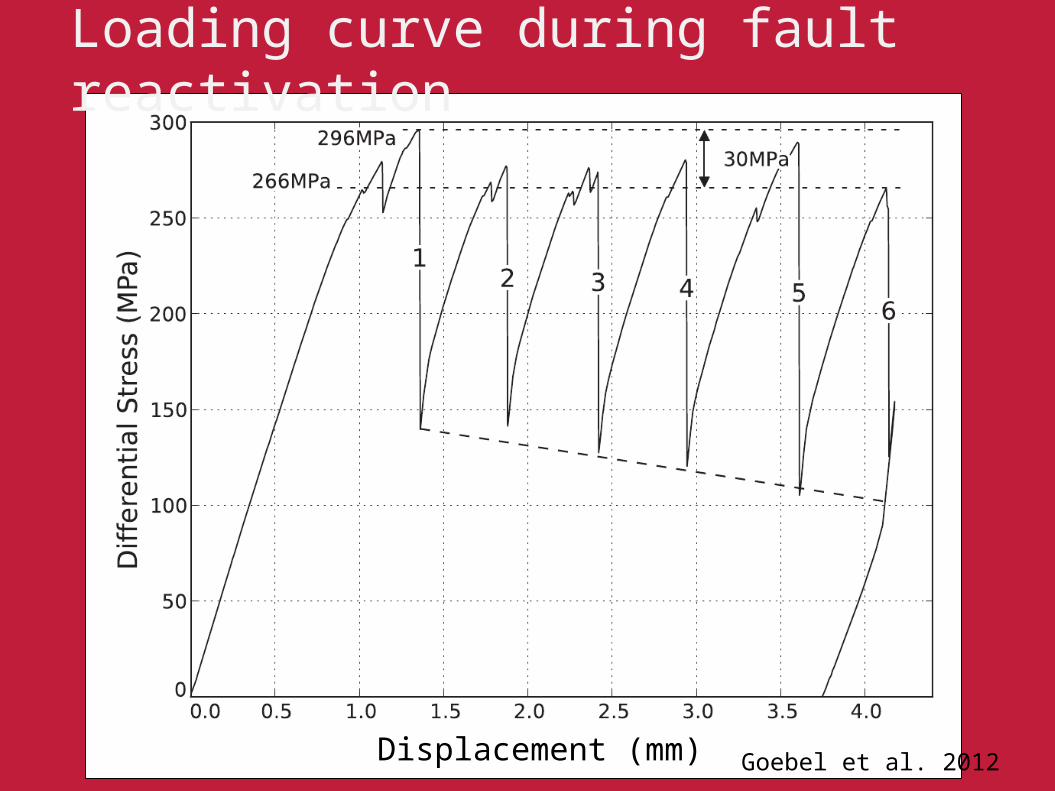
Loading curve during fault reactivation
Displacement (mm) Goebel et al. 2012

Waveforms of small and large events
Goebel et al. 2012

Typical AE event Large stress drop event
Goebel et al. 2012
Waveforms of small and large events
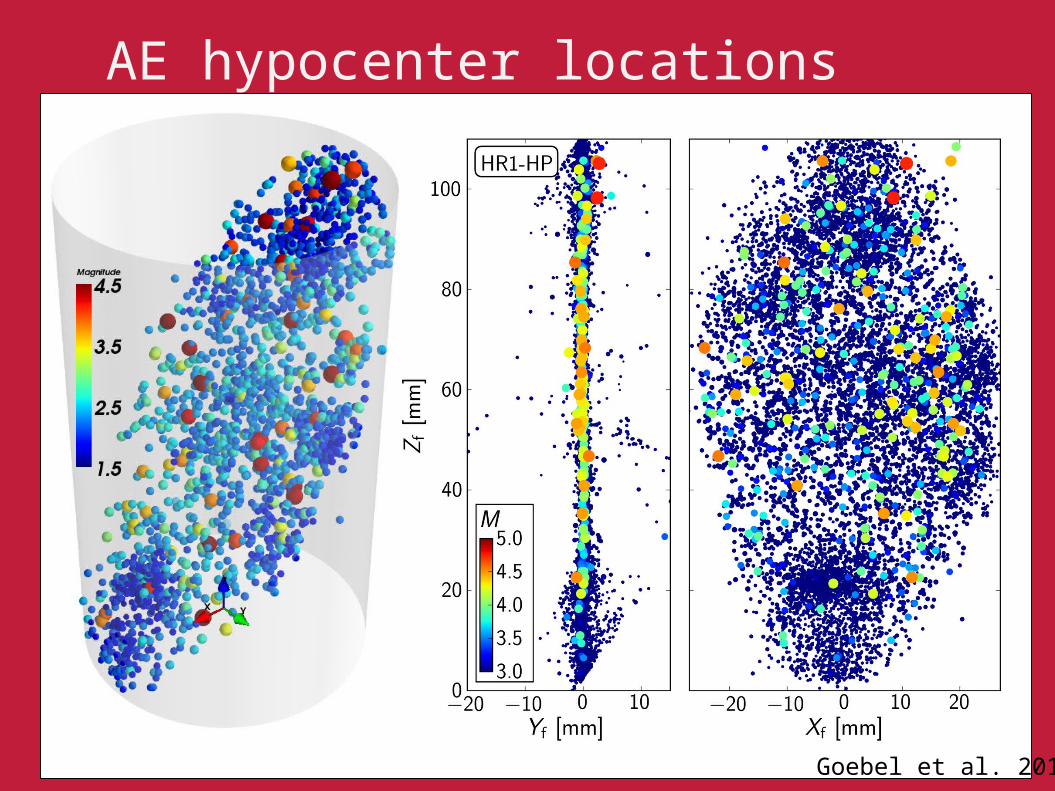
AE hypocenter locations
Goebel et al. 2013c

1. Spatial distribution and b-value

Lockner et al. 1991
Progressive failure

AE clustering at different stress levels

AE clustering at different stress levels
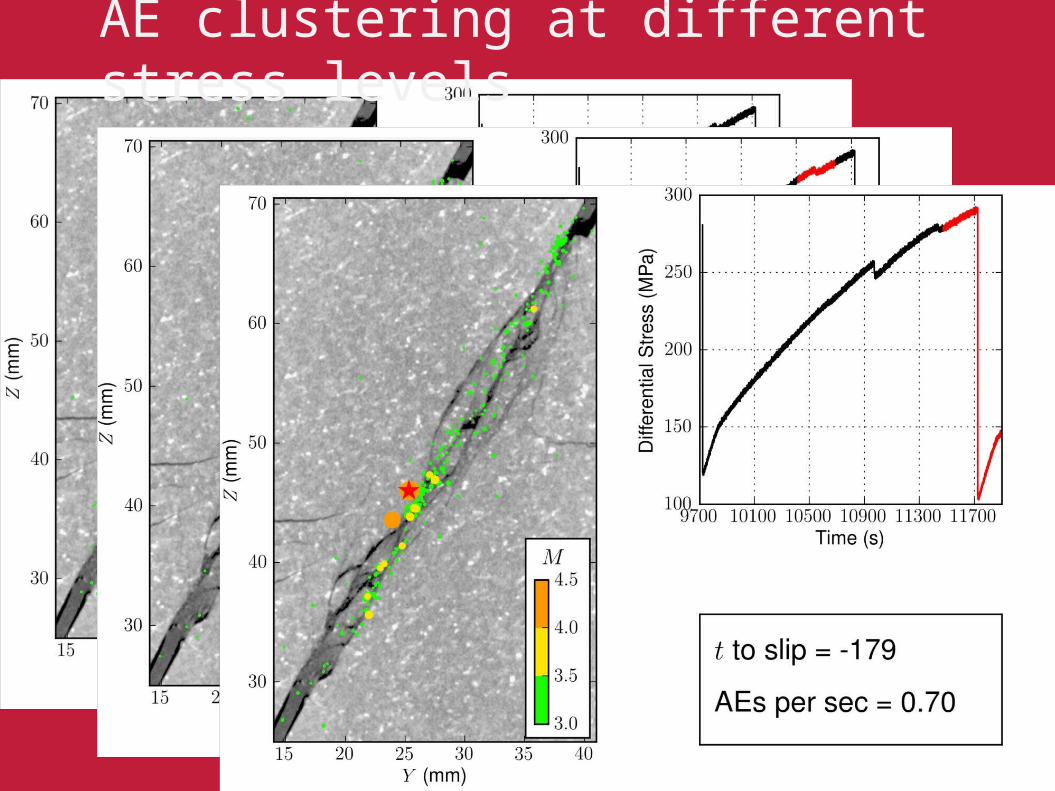
AE clustering at different stress levels

Cyclical changes of b-values and stress
Goebel et al. 2013a

Stress and b-values prior to slip events
Goebel et al. 2013a

2. Source mechanism
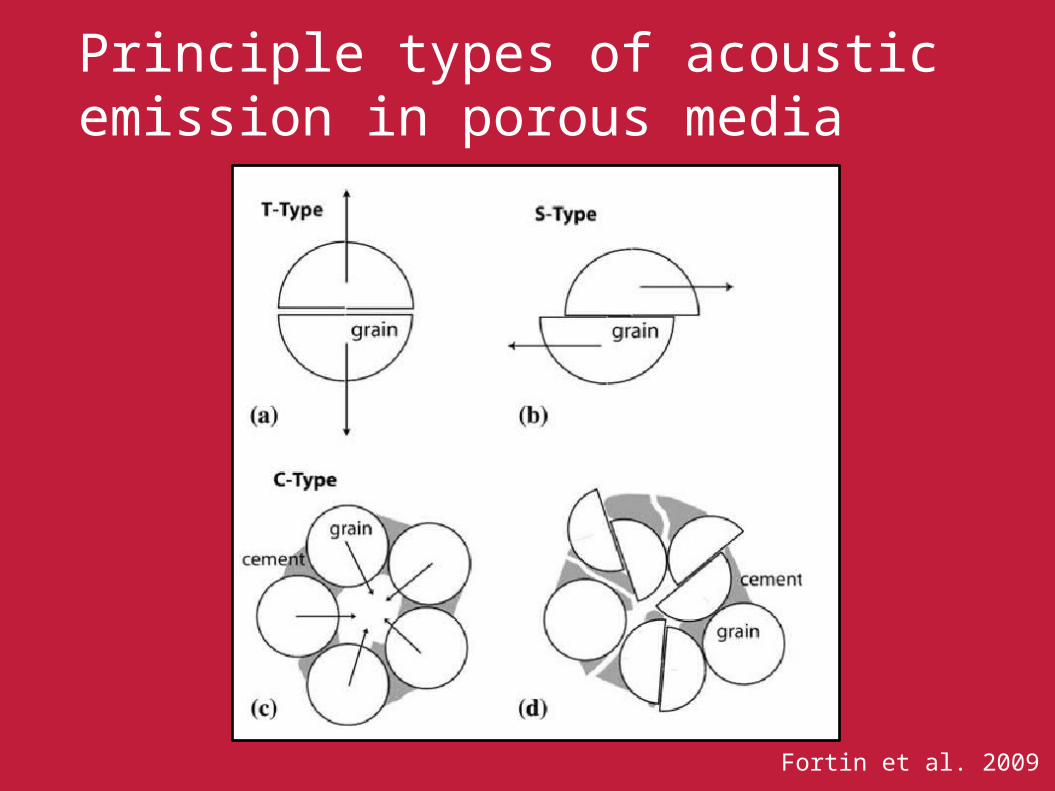
Fortin et al. 2009
Principle types of acoustic emission in porous media

Kwiatek & Goebel in prep.
Main source mechanism during stick-slip
Onset of slip event

Kwiatek & Goebel in prep.
Main source mechanism during stick-slip
Aftershock sequence

Moment tensors during slip event and aftershock sequence
Shear dominated
Kwiatek & Goebel in prep.
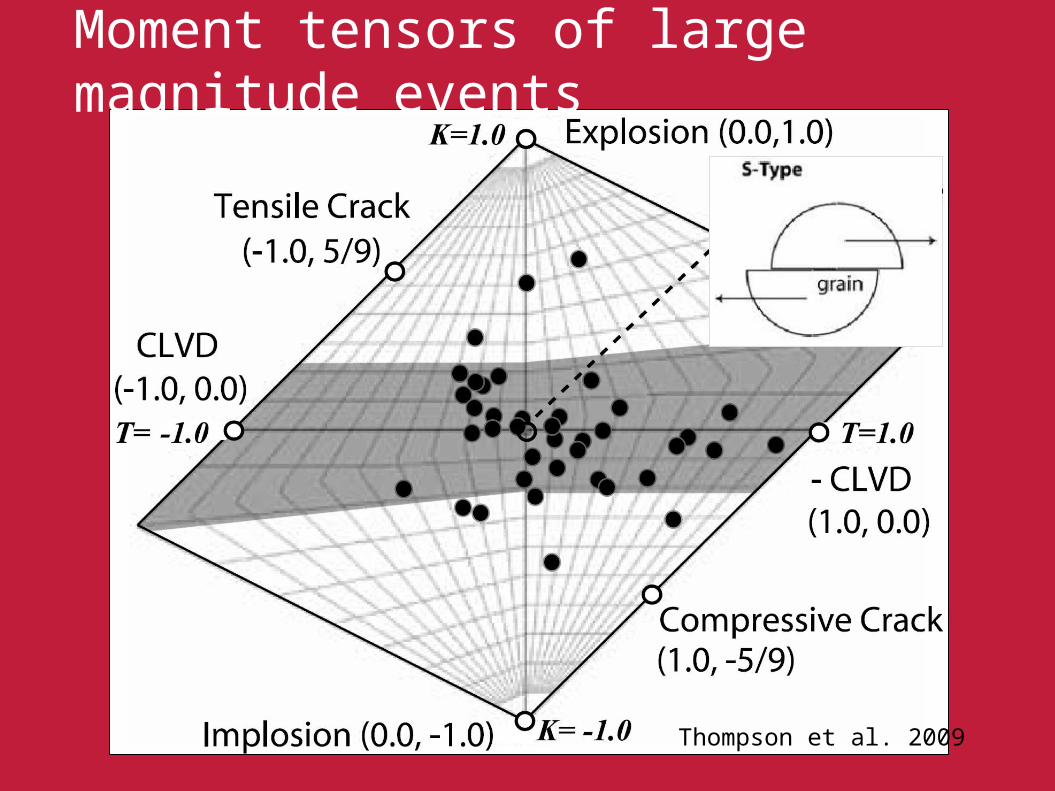
Thompson et al. 2009
Moment tensors of large magnitude events
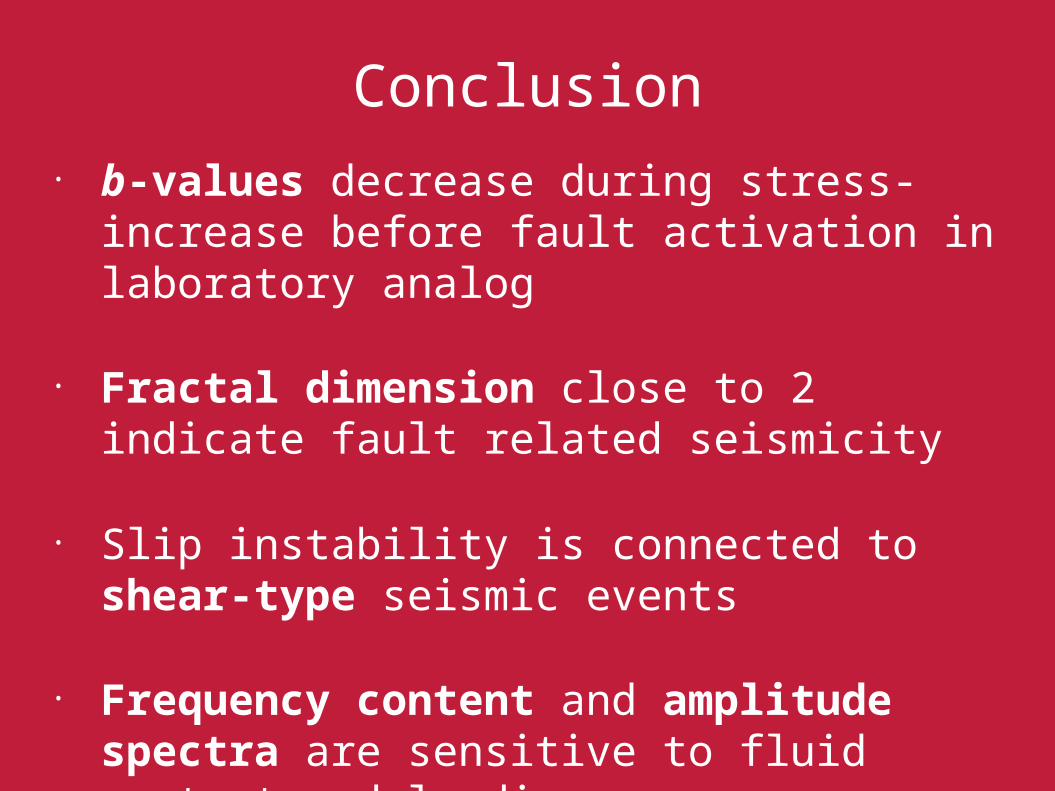
Conclusion• b-values decrease during stress-increase
before fault activation in laboratory analog
• Fractal dimension close to 2 indicate fault related seismicity
• Slip instability is connected to shear-type seismic events
• Frequency content and amplitude spectra are sensitive to fluid content and loading

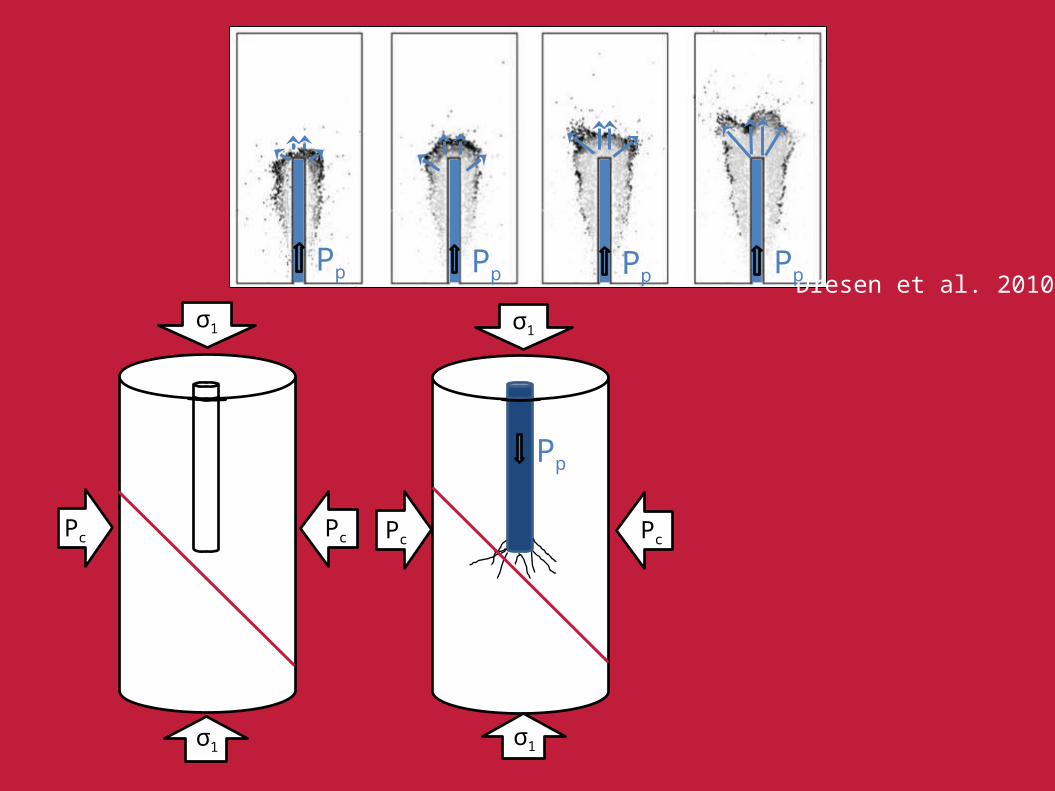
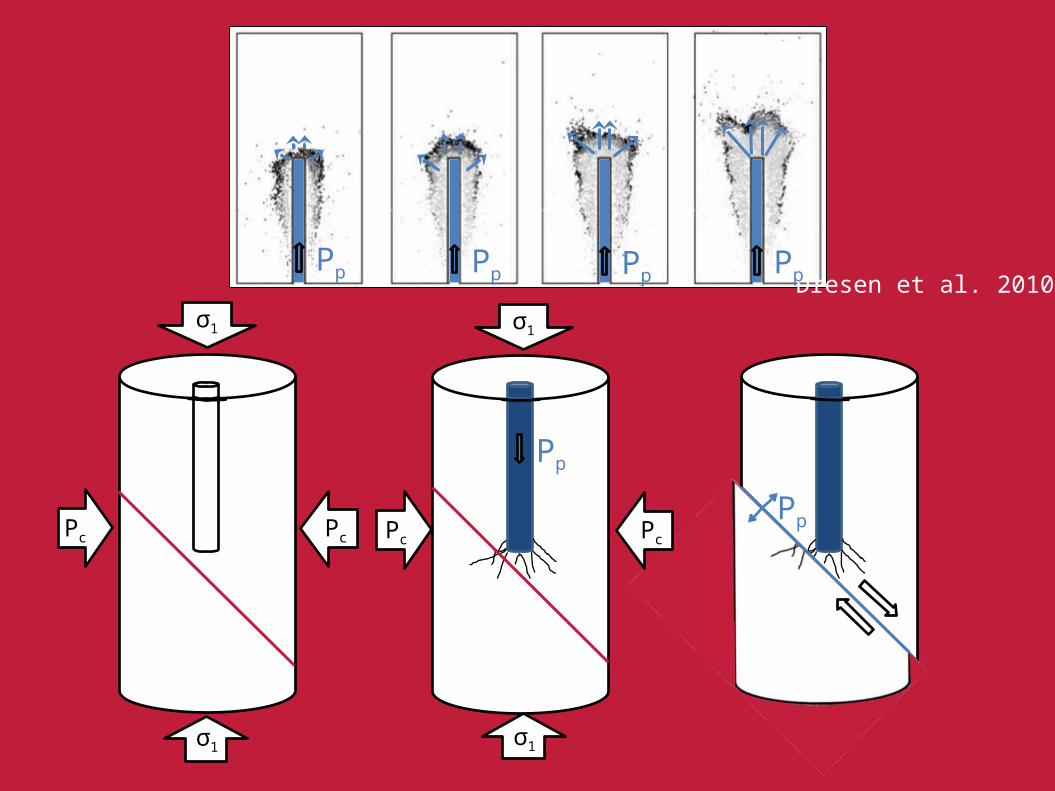
3. Future Experiments

Dresen et al. 2010Pp Pp Pp Pp
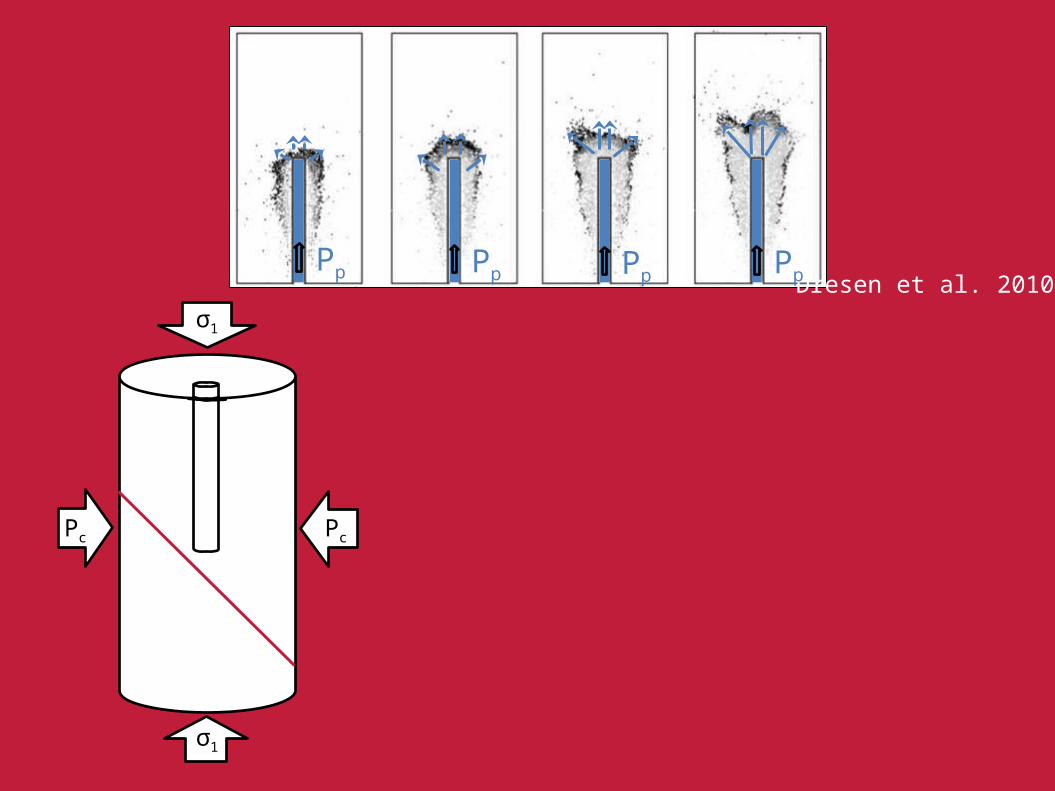
Dresen et al. 2010σ1
PcPc
σ1
Pp Pp Pp Pp
Dresen et al. 2010σ1
PcPc
σ1
σ1
Pc
σ1
Pp
Pc
Pp Pp Pp Pp
Dresen et al. 2010σ1
PcPc
σ1
σ1
Pc
σ1
Pp
PpPc
Pp Pp Pp Pp
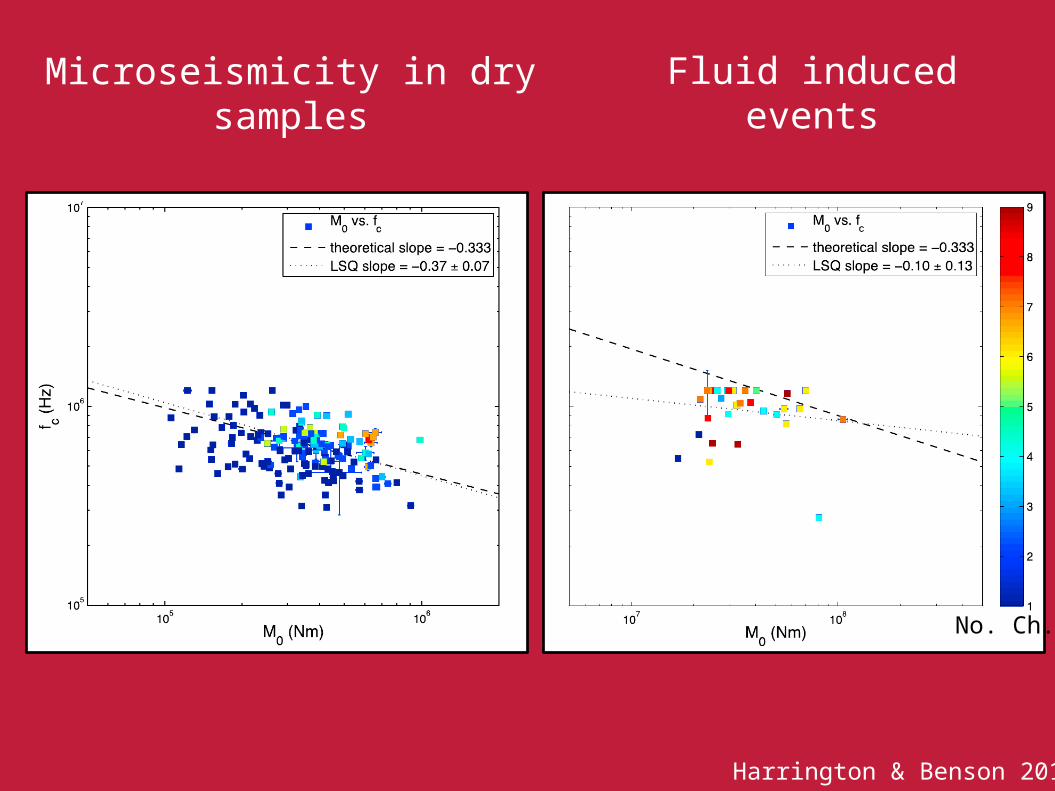
Harrington & Benson 2011
Fluid induced eventsMicroseismicity in dry samples
No. Ch.
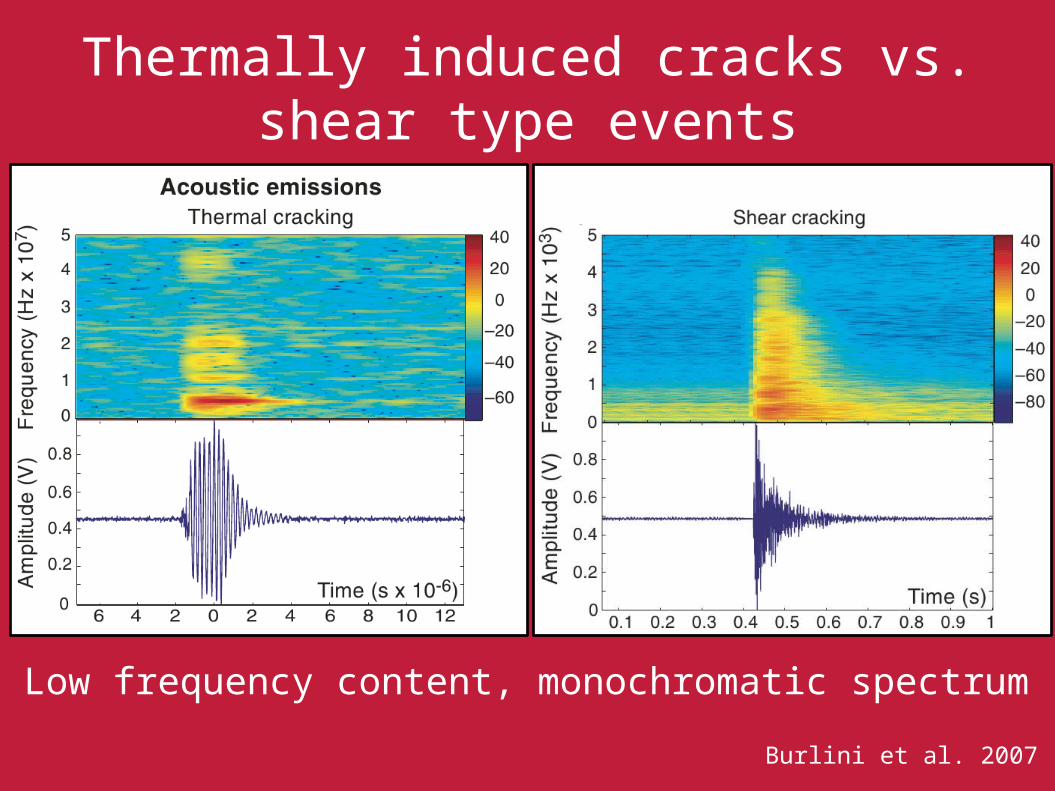
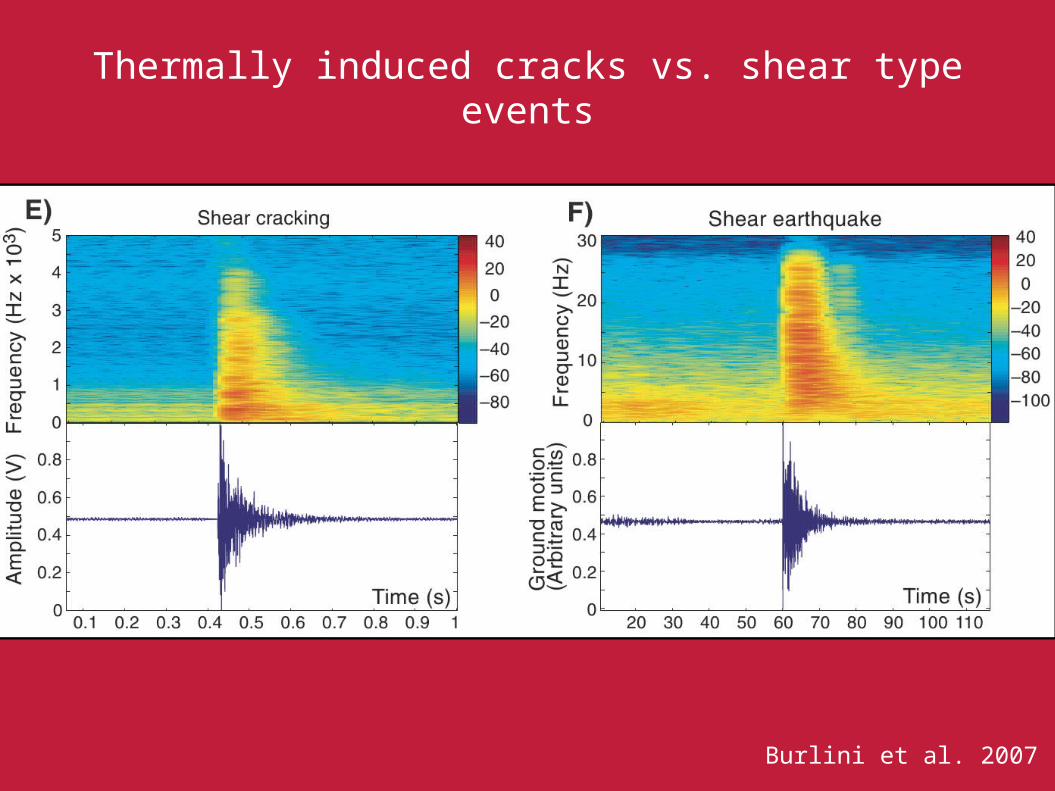
Thermally induced cracks vs. shear type events
Low frequency content, monochromatic spectrum
Burlini et al. 2007

- Thank You -

Additional Slides

Thermally induced cracks vs. shear type events
Low frequency content, monochromatic spectrum
Burlini et al. 2007
Thermally induced cracks vs. shear type events
Burlini et al. 2007

Self-similar scaling
Fluid induced eventsMicroseismicity in dry samples
Am
plitu
de
Am
plitu
deNo clear scaling
Harrington & Benson 2011

D = 2.75D = 2.66D = 2.25
Hirata et al. 1987
Creep tests at constant stress (547 MPa)~ 7 h to failure
Progressivefailure
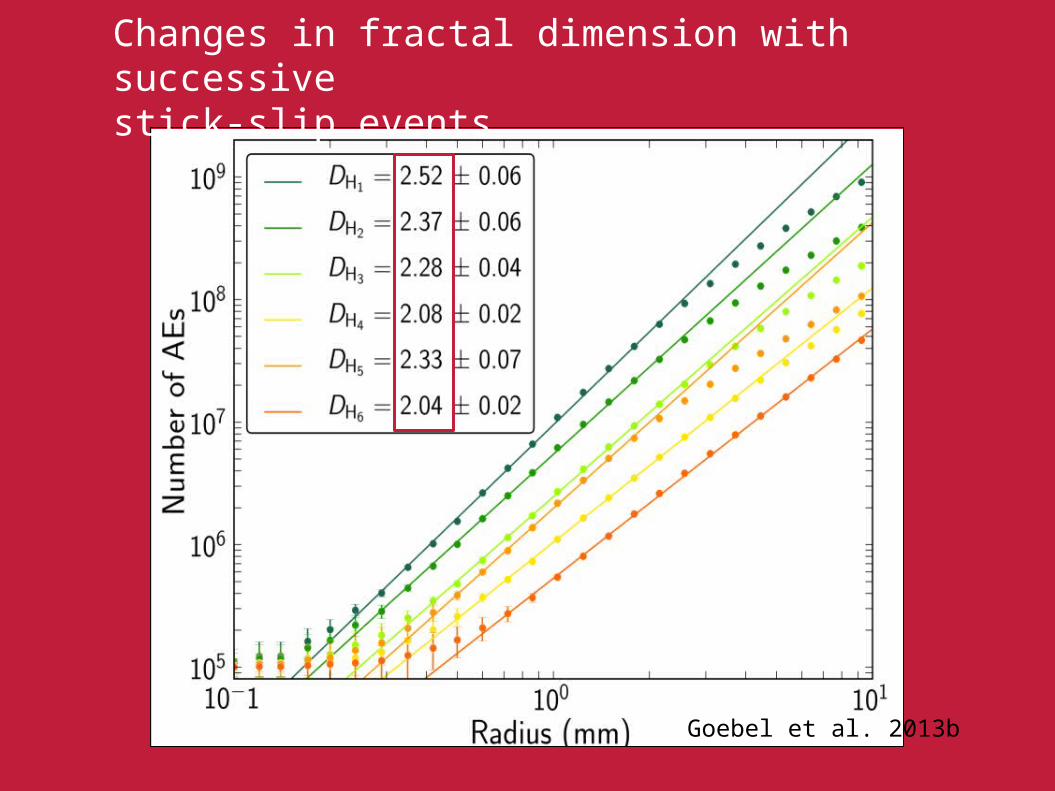
Changes in fractal dimension with successive stick-slip events
Goebel et al. 2013b
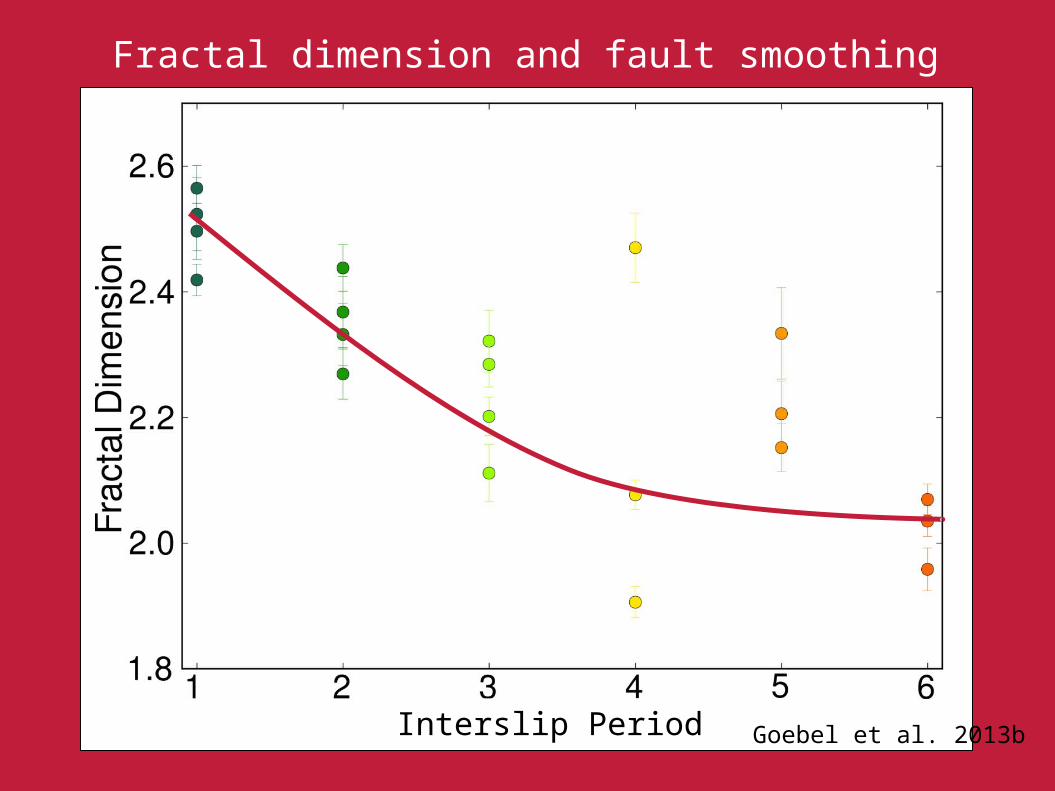
Interslip Period Goebel et al. 2013b
Fractal dimension and fault smoothing

Frac
tal D
imen
sion

Shear dominated

Slip onset
Changes in source mechanism and orientation of principal stressdue to slip

Attenuation and changes in seismic velocityduring damage accumulation
Stanchits et al. 2003

Stanchits et al. 2003