Embed Size (px)
Citation preview
Fatigue properties of dissimilar metal laser welded lap joints.
DINSLEY, Christopher Paul.
Available from Sheffield Hallam University Research Archive (SHURA) at:
http://shura.shu.ac.uk/19561/
This document is the author deposited version. You are advised to consult the publisher's version if you wish to cite from it.
Published version
DINSLEY, Christopher Paul. (2004). Fatigue properties of dissimilar metal laser welded lap joints. Doctoral, Sheffield Hallam University (United Kingdom)..
Copyright and re-use policy
See http://shura.shu.ac.uk/information.html
Sheffield Hallam University Research Archivehttp://shura.shu.ac.uk

r
with retarded mining trainees who fell within prescribed chronological ages and iO range.
Here again in the 5 Rate of LearningT study with the mini entrants, the results significantly disproved the 'null hypothesis5, but in the remainder of the research studie significant results were established* Possibilities of work in these areas were.; opened up, however.Concurrent with this part of the enquiry, using the libr the University of Sheffield, research was made into rele studies’ made elsewhere and these are critically discusse the text of the thesis.In conclusion, the enquiry did establish that regular employment of programmed material accelerated the rate o learning to read of ESN pupils beyond that which can be expected from their mental ages. Nevertheless, and in s; the large amount of literature surveyed in this study, mi more research is indicated to establish which variables, combination o^ variables, are the most potent factors in material and method employed.

ProQuest Number: 10694442
All rights reserved
INFORMATION TO ALL USERS The quality of this reproduction is dependent upon the quality of the copy submitted.
In the unlikely event that the author did not send a com ple te manuscript and there are missing pages, these will be noted. Also, if material had to be removed,
a note will indicate the deletion.
uestProQuest 10694442
Published by ProQuest LLC(2017). Copyright of the Dissertation is held by the Author.
All rights reserved.This work is protected against unauthorized copying under Title 17, United States C ode
Microform Edition © ProQuest LLC.
ProQuest LLC.789 East Eisenhower Parkway
P.O. Box 1346 Ann Arbor, Ml 48106- 1346

Fatigue Properties of Dissimilar
Metal Laser Welded Lap Joints
Christopher Paul Dinsley
A thesis submitted in partial fulfilment of the requirements of
Sheffield Hallam University
for the degree of Doctor of Philosophy
Novembfi£2004
Collaborating'Ofganisation
Outokumpu Stainless Research Foundation
Preface
Abstract
This thesis describes work conducted at the Materials Research Institute at Sheffield Hallam University from August 2000 to August 2003.The work involves laser welding austenitic and duplex stainless steel to zinc-coated mild steel, more specifically 1.2mm V1437, which is a Volvo Truck Coiporation rephosphorised mild steel. The work investigates both tensile and lap shear properties of similar and dissimilar metal laser welded butt and lap joints, with the majority of the investigation concentrating on the fatigue properties of dissimilar metal laser welded lap joints. The problems encountered when laser welding zinc-coated steel are addressed and overcome with regard to dissimilar metal lap joints with stainless steel. The result being the production of a set of guidelines for laser welding stainless steel to zinc- coated mild steel. The stages of laser welded lap joint fatigue life are defined and the factors affecting dissimilar metal laser welded lap joint fatigue properties are analysed and determined; the findings suggesting that dissimilar metal lap joint fatigue properties are primarily controlled by the local stress at the internal lap face and the early crack growth rate of the material at the internal lap face. The lap joint rotation, in turn, is controlled by sheet thickness, weld width and interfacial gap. Laser welded lap joint fatigue properties are found to be independent of base material properties, allowing dissimilar metal lap joints to be produced without fatigue failure occurring preferentially in the weaker parent material, irrespective of large base material property differences. The effects of Marangoni flow on the compositions of the laser weld beads are experimentally characterised. The results providing definite proof of the stirring mechanism within the weld pool through the use of speeds maps for chromium and nickel.
Keywords: Laser welding, dissimilar metal, Zinc-coated mild steel, Austenitic stainless steel, Duplex stainless steel, Fatigue, Lap joint rotation, Automotive.
2

----------------- ,--------- Acknowledgements
Acknowledgements
The author would like to thank the Welsh Technology Centre (Port Talbot) for the use
of the Trumpf 5kW CO2 industrial laser welder and Coventry University for the use of
the Rofin 2kW CO2 industrial laser welder, which allowed the course of research to
proceed on schedule.
The author would like thank the technical staff at Sheffield Hallam University,
Materials Research Institute for fabrication and analytical support throughout the course
of research; also the research staff at the Avesta Research Centre for the use of
numerous fatigue testing machines.
The author would like to thank Rebecca Milsom for both support and guidance during
the start of the authors’ academic career and the authors’ family and friends for their
continual support during the course of research.
Special thanks to my partner Jackie Green, and both Professor Hans Nordberg and Dr
Alan Smith for their personal support, guidance and patience during the course of
research.
3

Advanced Studies
The following section contains the list of advanced studies undertaken in connection
with the course of research.
Publications/Posters
• Laser Welding Of Austenitic and Duplex Stainless Steel to Zinc Coated Mils Steel,
Poster Presentation, IOMMM Materials Congress 2002, London
Presentations
• AvestaPolarit Research Foundation Annual Presentation, Avesta, Sweden (2001/02)
• AvestaPolarit Research Foundation Annual Presentation, Sheffield, UK (2001/02)
Conferences
• Attendance at BSSA Stainless Steel Conference, NMC Birmingham
• Attendance at SMEA Lectures, Sheffield
Training
• Institute of Materials Project Management and Presentation Skills Workshop,
IOMMM London
• Internal Scanning Electron Microscopy training, MRI
• Internal Finite Element Modelling Short Course, SHU
Secondments
• Seven week research secondment to AvestaPolarit R&D, Sweden 2001
• Seven week research secondment to AvestaPolarit R&D, Sweden 2002
4

Table o f Contents
1 Introduction................................................................................................................ 232 Literature Review.......................................................................................................29
2.1 Solid State and Gas Lasers..................................................................................29
2.2 Basic Mechanisms of Laser Welding.................................................................32
2.3 Laser Welding M ode........................................................................................... 36
2.3.1 Conduction Mode Laser Welding............................................................... 36
2.3.2 Keyhole Laser Welding Mode.................................................................... 41
2.4 Laser Welding Parameters...................................................................................43
2.4.1 Power Density............................................................................................. 44
2.4.2 Laser Beam Power....................................................................................... 49
2.4.3 Laser-Beam Diameter..................................................................................50
2.4.4 Traverse Speed............................................................................................ 51
2.4.5 Shielding Gas................................................................................................53
2.4.6 Focussing System........................................................................................ 54
2.5 Current Automotive Steel Grades....................................................................... 55
2.5.1 High Strength Low Alloy (Micro-Alloyed Steels)....................................56
2.5.2 Rephosphorised Steels................................................................................. 56
2.5.3 Bake Hardening Steels................................................................................. 57
2.5.4 High Strength Interstitial-Free (IF) Steels..................................................57
2.6 Current Automotive Painting Systems...............................................................58
2.6.1 Pre-cleaning..................................................................................................58
2.6.2 Pre-treatment................................................................................................59
2.6.3 Dry-Off......................................................................................................... 59
2.6.4 Coating Application Methods..................................................................... 59
2.6.5 Curing Process..............................................................................................59
5

2.7 Stainless Steel Paint Adhesion...........................................................................61
2.8 Stainless Steel...................................................................................................... 63
2.8.1 Austenitic Stainless Steel.............................................................................63
2.8.2 Duplex Stainless Steel................................................................................. 64
2.9 Laser Welding Zinc Coated Steel.......................................................................66
2.9.1 Butt joints.....................................................................................................66
2.9.2 Lap joints......................................................................................................67
2.9.3 Damage to the Focusing Optics by Spatter................................................ 70
2.10 Laser Welding Stainless Steel............................................................................74
2.10.1 Austenitic Stainless Steels...........................................................................74
2.10.2 Duplex Stainless Steels................................................................................74
2.11 Laser Welding Aluminium................................................................................. 75
2.12 Laser Weld Solidification................................................................................... 76
2.12.1 Austenitic Stainless Steel Solidification.....................................................76
2.12.2 Duplex Stainless Steel Solidification.......................................................... 80
2.12.3 Low Alloyed Steel Solidification............................................................... 83
2.13 Factors Affecting Weldability............................................................................ 85
2.13.1 Thermal Conductivity.................................................................................. 85
2.13.2 Thermal Expansion Coefficient.................................................................. 86
2.13.3 Metallurgical Characteristics.......................................................................87
2.14 Weld Geometry................................................................................................... 91
2.15 Joint Geometry................................................................................................... 93
2.15.1 Butt Joint...................................................................................................... 93
2.15.2 Lap Joint....................................................................................................... 95
2.16 Fatigue Properties................................................................................................ 99
2.16.1 Similar Metal Laser Welded Stainless Steel Fatigue Properties.............101

2.16.2 Similar Metal Laser Welded Mild Steel Fatigue Properties....................108
2.16.3 Similar Metal Laser Weld Fatigue Failure............................................... 110
2.16.4 Finite Element Analysis - Similar Metal Lap Joints............................... I l l
2.16.5 Analytical Modelling of Joint Rotation.....................................................116
2.16.6 Fracture Mechanics..................................................................................... 119
2.16.7 Similar & Dissimilar Metal Spot Welded Fatigue Failures.....................121
2.16.8 Adhesive Bonded Lap Joint Fatigue Properties........................................ 124
3 Experimental Technique........................................................................................ 1263.1 Introduction........................................................................................................126
3.1.1 Trumpf 5kW CO2 Laser Welder................................................................127
3.2 Material Tested.................................................................................................. 136
3.2.1 Material Mechanical Properties................................................................. 137
3.2.2 Material Chemical Composition................................................................ 139
3.2.3 Zinc Coating................................................................................................141
3.3 Joint Configuration............................................................................................ 142
3.3.1 Butt Joint..................................................................................................... 142
3.3.2 Lap joint....................................................................................................... 145
3.4 Mechanical Testing............................................................................................147
3.4.1 Tensile Testing........................................................................................... 147
3.4.2 Lap Shear Testing....................................................................................... 149
3.4.3 Fatigue Testing............................................................................................150
3.4.4 Lap Joint Rotation Tests.............................................................................157
3.5 Metallography.................................................................................................... 159
3.5.1 Etchants....................................................................................................... 159
3.5.2 Microhardness Testing...............................................................................161
3.5.3 Optical Analysis......................................................................................... 162
7

3.5.4 Scanning Electron Microscopy................................................................. 164
4 Results........................................................................................................................ 1674.1 Introduction........................................................................................................ 167
4.2 Laser-Welded Butt Joint Tensile Properties - Trumpf 5kW CO2 Laser Welder
(Process Optimisation/Joint Configuration Trials).........................................169
4.2.1 Similar Metal Laser Welded Butt Joint Results....................................... 169
4.2.2 Dissimilar Metal Laser Welded Butt Joint Results..................................172
4.3 Laser-Welded Lap Shear Properties - Trumpf 5kW CO2 Laser Welder
(Process Optimisation/Joint Configuration Trials).........................................175
4.3.1 Similar Metal Laser Welded Lap Shear Results......................................175
4.3.2 Dissimilar Metal Laser Welded Lap Shear Results.................................179
4.4 Laser-Welded Lap Shear Properties - Trumpf 5kW CO2 Laser Welder
(Material Optimisation Trials)......................................................................... 182
4.5 Laser-Welded Tensile/Lap Shear Properties - Rofin 2kW CO2 Laser Welder
(Fatigue Specimen Production)....................................................................... 185
4.6 Lap Joint Fatigue Properties - Trumpf 5kW CO2 Laser Welder....................188
1mm 304 (top) - 1.2mm V 1437 Fatigue Results....................................................191
1.2mm V 1437 (top) - 1mm 304 Fatigue Results....................................................192
0.78mm 2205 (top) - 1.2mm V1437 Fatigue Results..............................................193
1.2mm V I437 (top) - 0.78mm 2205 Fatigue Results..............................................194
4.7 Lap and Butt Joint Fatigue Properties - Rofin 2kW CO2 Laser W elder 195
1.2mm V 1437 (top) - 1mm 2205 Fatigue Results..................................................197
1.2mm V1437 (top) - 1mm 2101 Fatigue Results..................................................198
1mm 2101 - 1mm 2101 Similar Lap Joint Fatigue Results................................... 199
1.2mm V1437 (top) - 1mm 2101 Dissimilar Butt Joint Fatigue Results..............200
4.8 Lap Joint Rotation Results................................................................................ 201

4.9 Metallographic Results.................................................................................... 202
4.9.1 Base Material Metallography.................................................................. 202
4.9.2 Weld Bead Metallography....................................................................... 204
4.10 Weld Bead Microhardness Results................................................................... 205
4.10.1 Butt Joint Microhardness Results.............................................................205
4.10.2 Lap Joint Microhardness Results..............................................................208
4.11 Weld Bead Composition Results...................................................................... 211
4.11.1 Butt Joint Weld Bead Compositions........................................................ 213
4.11.2 Lap Joint Weld Bead Compositions........................................................ 216
4.12 Fatigue Failure Analysis.................................................................................... 219
4.12.1 Optical Fatigue Failure Analysis - Dissimilar Metal Lap Joints...........219
4.12.2 Optical Fatigue Initiation Analysis - 2101 Similar Metal Lap Joint....223
SEM Fatigue Initiation Analysis - 1mm 2101 Similar Metal Lap Joint...............229
4.12.3 Optical Fatigue Initiation Analysis - Dissimilar Metal Lap Joints........230
4.12.4 SEM Fatigue Initiation Analysis - Dissimilar Metal Lap Joints........... 235
4.12.5 Optical Fatigue Failure Analysis - Butt Joints........................................239
5 Discussion..................................................................................................................2415.1 Introduction........................................................................................................ 241
5.2 Laser Weld Quality.................. 243
5.2.1 Trumpf 5kW C 02 Laser Weld Quality.....................................................244
5.2.2 Rofin 2kW C 0 2 Laser Weld Quality........................................................ 251
5.2.3 Liquid Metal Embrittlement......................................................................254
5.3 Laser Welded Butt Joint Properties - Trumpf 5kW ........................................255
5.3.1 Similar Metal Laser Welded Butt Joint Properties................................. 255
5.3.2 Dissimilar Metal Laser Welded Butt Joint Properties.............................256
5.4 Laser Welded Lap Shear Properties - Trumpf 5kW Process Optimisation. 258
9

5.4.1 Similar Metal Laser Welded Lap Shear Properties................................ 258
5.4.2 Dissimilar Metal Laser Welded Lap Shear Properties............................ 260
5.5 Laser Welded Lap Shear Properties - Trumpf 5kW Material Optimisation 262
5.5.1 Dissimilar Metal Laser Welded Lap Shear Properties............................ 262
5.6 Laser Welded Tensile/Lap Shear Properties - Rofin 2kW C 0 2 Laser Welder
(Fatigue Specimen Production).......................................................................264
5.7 Laser Welded Lap Shear Property Comparison..............................................265
5.7.1 Similar Metal Laser Welded Lap Shear Property Comparisons............ 266
5.8 Laser Welded Fatigue Properties......................................................................269
5.8.1 Laser Welded Lap Joint Fatigue Properties - Trumpf 5kW ...................269
5.9 Factors Affecting Laser Welded Lap Joint Fatigue Strength..........................275
5.9.1 Weld Bead Microhardness........................................................................ 275
5.9.2 Weld Bead Compositions..........................................................................281
5.9.3 Stages of Laser Welded Lap Joint Fatigue Life.......................................292
5.9.4 Effect of Lap Joint Geometry................................................................... 294
5.10 Laser Welded Lap and Butt Joint Fatigue Properties - Rofin 2kW ..............297
5.11 Fatigue Failure Analysis................................................................................... 299
5.12 Lap Joint Rotation............................................................................................ 307
5.12.1 Experimental Rotation Comparison.........................................................309
5.13 Factors Controlling Lap Joint Rotation........................................................... 313
5.13.1 Similar Geometry & Rotation Angle........................................................314
5.13.2 Effect of Sheet Thickness..........................................................................316
5.13.3 Effect of Interfacial Gap............................................................................318
5.13.4 Effect of Weld W idth................................................................................320
5.13.5 Young’s Modulus...................................................................................... 323
5.13.6 Partial Penetration and Double Laser Welds...........................................325
10

5.13.7 Removal of Joint Rotation
5.14 Spot Weld Fatigue Comparison
6 Conclusions......................................
.326
327
3296.1.1 Integrating Stainless Steel into Existing Automotive Design................335
7 Further Work............................................................................................................3378 Appendix................................................................................................................... 338
8.1 Trumpf 5kW - Fatigue Results (Staircase & S-N Curve)............................. 339
8.2 Rofin-Sinar 2kW - Fatigue Results (Staircase & S-N Curve)....................... 340
8.3 Lap Joint Rotation Results.................................................................................341
8.4 Butt Joint Composition...................................................................................... 343
8.5 Lap Joint Composition.......................................................................................358
11

Table o f Figures
Figure 1 Welsh Technology Centre Trumpf 5kW CO2 Laser Welder........................ 26Figure 2 Picture showing an inner door panel that is made up of three different
steels that have been laser welded together................................................. 27Figure 3 Schematic diagram showing a typical diode (end) pumped Nd:YAG laser
set up.................................................................................................................30Figure 4 Schematic diagram showing a typical Wave-guide CO2 laser set u p 31Figure 5 Heat dissipation in a conduction mode laser weld......................................... 36Figure 6 Laser weld surface flow for materials with low (left) and high (right)
Prandlt numbers...............................................................................................39Figure 7 Velocity distribution at the X-Y central plane of the laser beam, (a) vector
plot, (b) streamline p lo t..................................................................................40Figure 8 Schematic showing the components of a laser ‘keyhole’ ..............................41Figure 9 Independent process variables that can be controlled to aid in the
production of high quality laser welds...........................................................44Figure 10 The relationship between the focal position and the depth of penetration for
304 & 316 stainless steel................................................................................47Figure 11 Transverse profiles as a function of focus position for a laser-beam welded
type 310 stainless steel. Negative and positive numbers indicate position of focal point below and above, respectively, the surface of the plate. Beampower, 5kW, Traverse welding speed, 16mm/s............................................ 47
Figure 12 The relationship between laser power and the penetration depth achieved 49Figure 13 Variation of relative intensity and percentage of total power with radius for
a gaussian beam...............................................................................................50Figure 14 The welding envelope for a variety of materials thickness.......................... 51Figure 15 Welding speed versus laser power for a 5 kW CO2 laser. These welding
envelopes were produced for a Ti-6A1-4V....................................................51Figure 16 The relationship between the traverse speed and the weld bead depth to
width ratio........................................................................................................ 52Figure 17 The penetration depth achieved from various shielding gases in comparison
to air..................................................................................................................53Figure 18 Additional venting permitted by elongating the weld pool with the use of a
‘Twin spot’ laser beam................................................................................... 69Figure 19 Schematic showing two laser welding ‘set-ups’, a) shows a laser set-up
with a high focal length and b) with a reduced focal length, both systemshave a mirror optic beam delivery and show the effects of spatter..............71
Figure 20 Schematic diagram showing a typical air knife assembly used to protect thefocusing mirror when welding zinc-coated steel with a small focal length 73
Figure 21 Schematics of Solidification Modes of Austenitic Stainless Steel Welds ..77Figure 22 Relevant part of the Fe-Creq-Nieq ternary liquidus diagram for austenitic
stainless steels with eutectic and solidus lines...............................................78Figure 23 Diagram for predicting solidification mode from alloy composition for laser
welded austenitic stainless steels. Values of solidification velocity for the transition from ferritic to austenitic primary solidification, Vtr, are shownfor the alloys studies - 304 & 316..................................................................79
Figure 24 Hardness of the weld metal of low alloyed carbon steels as a function of thecarbon content................................................................................................. 84
Figure 25 The Schaeffler Delong diagram...................................................................... 88Figure 26 Cycles to failure of different weld patterns in 0.61mm carbon steel 91
12
Figure 27 Figure 28
Figure 29
Figure 30 Figure 31
Figure 32 Figure 33
Figure 34
Figure 35
Figure 36
Figure 37
Figure 38 Figure 39 Figure 40
Figure 41 Figure 42 Figure 43 Figure 44 Figure 45 Figure 46 Figure 47 Figure 48 Figure 49 Figure 50
Figure 51 Figure 52 Figure 53
Figure 54
Figure 55
Figure 56
Figure 57
Figure 58
Figure 59
Visual key for the fatigue properties in Figure 26........................................92Weld cross sections in butt joints with smaller (a) and larger (b) gap widths..........................................................................................................................94Lap joint schematic showing the increase of misalignment of the appliedload with increasing sheet thickness..............................................................95The rotation resulting from a lap joint loaded in tension............................. 96schematic diagram of reaction forces and moments that occur in a laser-welded lap jo in t...............................................................................................97Modes of loading which involve crack surface displacement.....................98Graph showing the reduction of lap joint specimen stiffness prior to fatiguefailure..............................................................................................................107FEA stress concentration distribution in a statically loaded 3mm laserwelded lap jo in t............................................................................................. I l lEffective plastic strain von Mises effective stress for a 1mm similar
metal laser welder lap joint at 2mm displacement when subjected to alOm/s impact load..........................................................................................112Solid element analysis of stress intensity versus weld width for a 0.9mmlaser welded lap joint.................................................................................... 113Schematic representation of the stress distribution for a shear loaded lapjoint................................................................................................................114Solid element analysis showing stress intensity versus crack angle 115Schematic load distribution in a lap jo in t....................................................116Schematic diagram showing the different focal positions used during the‘Process Optimisation’ laser welding trials.................................................130Schematic diagram showing the butt weld configuration...........................142Butt joint critical fit up axis with respect to laser beam direction.............143Schematic diagrams showing the lap joint configuration...........................145Schematic showing a reverse of the lap joint configuration in Figure 43.146Diagram to show the markings required to ensure lap joint fit up.............146Butt joint tensile test schematic with sample dimension............................148Schematic showing lap joint shear test and sample dimensions............... 149Schematic diagram showing the la p joint fatigue test dimensions...........151Schematic diagram showing the butt joint fatigue test dimensions...........152Schematic showing the poor load resolution produced by conducted fatiguetests at too high a frequency......................................................................... 156Schematic diagram showing the lap rotation test....................................... 158Microhardness grid (0.25mm) across a laser welded lap jo in t.................. 161Shows the predicted weld bead composition for the 4m/min 1.2mm V I437- 1mm 304 butt weld.................................................................................... 215Shows the predicted weld bead composition for the 1 mm 304 (top) - 1.2mmV I437 lap joint..............................................................................................218Schematic diagram showing the positions of the “close-up” dissimilar metalfatigue initiation sites.................................................................................... 230Schematic diagram showing the positions of the “close-up” dissimilar metalfatigue initiation sites.................................................................................... 235Effect of gas-assist pressure on plasma suppression in CO2 laser welding........................................................................................................................ 248Schematic showing deflection and introduction of a gap in the 0.78mm2205 (top) - 1.2mm V 1437 lap jo in t.......................................................... 271Schematic diagram showing weld bead formed due to base material thermal property differences - stainless steel on the top of the lap joint................279
13

Figure 60 Schematic diagram showing weld bead formed due to base material thermalproperty differences - mild steel on the top of the lap joint...................... 280
Figure 61 Temperature distribution on the surface of 304 stainless steel produced by alaser beam with a gausssian distribution.................................................... 283
Figure 62 Heat distribution across the transverse section of a laser welded butt joint........................................................................................................................284
Figure 63 Effect of welding speed on the dilution and predicted weld beadcompositions-1mm 304 - 1.2mm V1437 butt joint....................................285
Figure 64 Effect of welding speed on the dilution and predicted weld beadcompositions-0.78mm 2205 - 1.2mm V1437 butt joint............................ 287
Figure 65 Heat distribution across the transverse section of a laser welded butt joint 288
Figure 66 Effect of joint configuration on the dilution and predicted weld beadcompositions-1mm 304 - 1.2mm V 1437 lap joint.....................................289
Figure 67 Effect of joint configuration on the dilution and predicted weld bead compositions-0.78mm 2205 - 1.2mm V 1437 lap jo in t............................. 290
Figure 68 SEM image showing the oscillating weld width - the dotted line indicates the boundary between the initial gap and where fatigue cracking takes place........................................................................................................................300
Figure 69 A schematic drawing of a laser-weld from above, showing oscillating weldwidth, and the location fatigue crack will probably initiate....................... 300
Figure 70 Shows the predicted weld bead composition for the 3.5m/min 1.2mmV 1437 - 1mm 304 butt weld........................................................................345
Figure 71 Shows the predicted weld bead composition for the 3m/min 1.2mm V I437- 1mm 304 butt weld.................................................................................... 348
Figure 72 Shows the predicted weld bead composition for the 4m/min 1.2mm V1437- 0.78mm 2205 butt weld.............................................................................351
Figure 73 Shows the predicted weld bead composition for the 3.5m/min 1.2mmV1437 -0.78mm 2205 butt weld................................................................ 354
Figure 74 Shows the predicted weld bead composition for the 3m/min 1.2mm V1437- 0.78mm 2205 butt weld.............................................................................357
Figure 75 Shows the predicted weld bead composition for the 1.2mm V1437 - 1mm304 (top) lap joint......................................................................................... 359
Figure 76 Shows the predicted weld bead composition for the 1.2mm V1437 (top) -0.78mm 2205 lap joint.................................................................................. 361
Figure 77 Shows the predicted weld bead composition for the 0.78mm 2205 (top) -1.2mm V1437 lap joint................................................................................. 363
14

Table o f Graphs
Graph 1
Graph 2
Graph 3
Graph 4
Graph 5
Graph 6
Graph 7
Graph 8
Graph 9 Graph 10
Graph 11
Graph 12
Graph 13
Graph 14
Graph 15
Graph 16
Graph 17
Graph 18 Graph 19
Graph 20
Graph 21
Graph 22
Graph 23
Graph 24
Graph 25
Effect of weld width on laser welded stainless steel lap joint fatigueproperties....................................................................................................... 101Effect of interfacial gap on laser welded stainless steel lap joint fatigueproperties....................................................................................................... 102Effect of sheet thickness on laser welded stainless steel lap joint fatigueproperties....................................................................................................... 1033mm 304 lap joint fatigue property comparison with a wide and narrowweld width..................................................................................................... 1043mm 304 laser welded lap joint fatigue comparison for double and singlenarrow weld seam patterns........................................................................... 1053mm 304 lap joint fatigue comparison between a double narrow and singlewide seam pattern..........................................................................................106Nominal sheet stress stainless steel/carbon steel laser welded lap jointfatigue comparison........................................................................................108Applied bending moment stainless steel/carbon steel laser welded lap jointfatigue comparison........................................................................................109Similar and dissimilar metal resistance spot welded fatigue comparison. 121 Similar metal resistance spot welded duplex stainless steel fatiguecomparison.................................................................................................... 122Effect of sheet thickness on the resistance spot welded duplex stainlesssteel fatigue.................................................................................................... 1231.5mm 304 similar metal adhesive bonded lap joint fatigue properties withdifferent bondline thickness.......................................................................... 124Graph to show the effects of laser welding speed on the Rm properties ofthree similar metal butt joints.......................................................................170Graph to show the effects of laser welding speed on the % elongationproperties of three similar metal butt joints.................................................171Graph to show the effects of laser welding speed on the Rm properties oftwo dissimilar metal butt jo in ts....................................................................173Graph to show the effects of laser welding speed on the % elongationproperties of two dissimilar metal butt joints..............................................174shows the similar metal lap shear properties produced with the optimumwelding parameters........................................................................................177Comparison of similar metal lap joint % elongations................................. 178shows the dissimilar metal lap shear properties produced with the optimumwelding parameters........................................................................................180compares the lap shear percentage elongations to failure for dissimilarmetal lap jo ints.............................................................................................. 181shows the lap shear properties of dissimilar metal laser welds with thinnergauge stainless steel.......................................................................................183shows the lap shear elongation properties of dissimilar metal laser weldswith thinner gauge stainless steel.................................................................184Graph to show the tensile and lap shear properties of similar and dissimilarmetal laser welded lap and butt joints.......................................................... 186Graph to show the percentage elongation properties of similar anddissimilar metal laser weld butt and lap joints.............................................187Graph to show the displacement of fatigue results when stress is calculated using different thickness................................................................................189
15

Graph 26 Fatigue scatter comparison between the applied bending moment and line load units....................................................................................................................190
Graph 27
Graph 28
Graph 29
Graph 30
Graph 31
Graph 32
Graph 33
Graph 34
Graph 35
Graph 36
Graph 37
Graph 38
Graph 39
Graph 40
Graph 41
Graph 42
Graph 43
Graph 44
Graph 45
Graph 46
Graph 47
Graph 48
Graph 49 Graph 50
Graph 51
Graph to show the line load range fatigue properties for the 1mm 304 (top)- 1.2mm V1437 lap joint.............................................................................. 191Graph to show the line load range fatigue properties for the 1.2mm V I437(top) - 1mm 304 lap joint.............................................................................192Graph to show the line load range fatigue properties for the 0.78mm 2205(top) - 1.2mm V I437 lap joint.....................................................................193Graph to show the line load range fatigue properties for the 1.2mm V 1437(top) - 0.78mm 2205 lap joint......................................................................194Graph to show the line load range fatigue properties for the 1.2mm V 1437(top) - 1mm 2205 lap joint...........................................................................197Graph to show the line load range fatigue properties for the 1.2mm V1437(top) - 1mm 2101 lap joint...........................................................................198Graph to show the line load range fatigue properties for the 1mm 2101 —1mm 2101 lap joint........................................................................................199Graph to show the line load range fatigue properties for the 1.2mm V 1437- 1mm 2205 butt jo in t.................................................................................. 2001mm 2101 lap joint maximum rotation angle as a function of line loadrange.............................................................................................................. 201Microhardness grid for P I : 1mm 304 - 1.2mm V1437 dissimilar metal buttjoint................................................................................................................ 206Microhardness grid for P2: 1mm 304 - 1.2mm V 1437 dissimilar metal buttjoint................................................................................................................ 206Microhardness grid for P3: 1mm 304 - 1.2mm V I437 dissimilar metal buttjoint................................................................................................................ 206Microhardness grid for P I: 1mm 2205 - 1.2mm V1437 dissimilar metalbutt joint......................................................................................................... 207Microhardness grid for P2: 1mm 2205 - 1.2mm V1437 dissimilar metalbutt joint......................................................................................................... 207Microhardness grid for P3: 1mm 2205 - 1.2mm V 1437 dissimilar metalbutt joint......................................................................................................... 207Microhardness grid: 1mm 304 (top) - 1.2mm V1437 dissimilar metal lapjoint.................................................................................................................209Microhardness grid: 1.2mm V1437 (top) - 1mm 304 dissimilar metal lapjoint.................................................................................................................209Microhardness grid: 0.78mm 2205 (top) - 1.2mm V1437 dissimilar metallap joint.......................................................................................................... 210Microhardness grid: 1.2mm V1437 (top) - 0.78mm 2205 dissimilar metallap joint.......................................................................................................... 210Weld bead % Chromium content from parameter set 2: 1mm 304 - 1.2mmV 1437 butt joint.............................................................................................214Weld bead % Nickel content from parameter set 2: 1mm 304 - 1.2mmVI437 butt joint.............................................................................................214Weld bead % Chromium content: 1mm 304 (top) - 1.2mm V1437 lap joint........................................................................................................................ 217Weld bead % Nickel content: 1mm 304 (top) - 1.2mm V I437 lap joint. 217 Comparison of 4mm 304 similar metal laser welded lap joint fatigueproperties with full and partial penetration..................................................2501mm 2205 - 1.2mm VI437 load extension graph showing a definite yield point................................................................................................................260
16
Graph 52 Lap shear line load (at fracture) comparison between 1.2mm VI437 spotand laser welded lap joint.............................................................................266
Graph 53 Lap shear line load (at fracture) comparison between 1mm 2205 spot andlaser welded lap joint....................................................................................267
Graph 54 Lap shear line load comparison between 1mm 2101 spot and laser weldedlap joint.......................................................................................................... 268
Graph 55 Joint configuration fatigue comparison for 1.2mm V 1437 - 1mm 304dissimilar metal lap joints.............................................................................272
Graph 56 Joint configuration fatigue comparison for 1.2mm V 1437 - 0.78mm 2205dissimilar metal lap joints.............................................................................273
Graph 57 1mm 2101 similar metal lap joint experimental and predicted rotationcomparison....................................................................................................309
Graph 58 Comparison of experimental rotation angles per line load for similar anddissimilar metal laser welded lap joints.......................................................310
Graph 59 Relationship between rotation angle and cycles to failure............................. 311Graph 60 Dissimilar metal lap joint fatigue property comparison 1.2mm V 1437 (top)
- 1mm 2205 & 1mm 2101............................................................................314Graph 61 Dissimilar metal lap joint fatigue comparison with equal applied bending
moment.......................................................................................................... 315Graph 62 Comparison of fatigue results between joints with large differences in
stiffness.......................................................................................................... 316Graph 63 Effect of sheet thickness on the predicted rotation angles of similar and
dissimilar thickness laser welded lap joints............................................................. 317Graph 64 Linder: Line load range similar metal stainless steel fatigue properties -
effect of sheet thickness and interfacial gap............................................... 318Graph 65 Effect of interfacial gap on the predicted rotation angles of similar
thickness laser welded lap joints.................................................................. 319Graph 66 Linder: Line load range similar metal stainless steel lap joint fatigue
properties - effect of interfacial gap and weld width.................................320Graph 67 Linder: Similar metal carbon steel laser welded lap joint fatigue properties
(0.9mm results from Linder et al)................................................................ 321Graph 68 Effect of sheet thickness on lap joint fatigue properties (similar joint
stiffness.......................................................................................................... 322Graph 69 Comparison of predicted rotation angles for aluminium and steel laser
welded lap joints............................................................................................323Graph 70 Lap joint fatigue comparison between 3mm aluminium lap joint and 1mm
and 3mm stainless steel lap joints................................................................ 324Graph 71 Laser welded lap and butt joint fatigue property comparison..................... 326Graph 72 Fatigue property comparison for 1mm 304 RSW and 1mm 2101 LBW
similar metal lap jo in ts................................................................................. 327Graph 73 Fatigue property comparison for 1mm 304 - 1.2mm V 1437 RSW and 1 mm
304 - 1.2mm V 1437 LBW dissimilar metal lap joints...............................328Graph 74 1mm 304 - 1.2mm V I437 (top) lap joint rotation angle per line load 341Graph 75 0.78mm 2205 - 1.2mm V1437 (top) lap joint rotation angle per line load
........................................................................................................................ 342Graph 76 Weld bead % Chromium content from parameter set 2: 1mm 304 - 1.2mm
V I437 butt joint.............................................................................................344Graph 77 Weld bead % Nickel content from parameter set 2: 1mm 304 - 1.2mm
V1437 butt joint.............................................................................................344Graph 78 Weld bead % Chromium content from parameter set 3: 1mm 304 - 1.2mm
V1437 butt joint.............................................................................................347
17

Graph 79 Weld bead % Nickel content from parameter set 3: 1mm 304 - 1.2mmV 1437 butt joint.............................................................................................347
Graph 80 Weld bead % Chromium content from parameter set 1: 0.78mm 2205 -1.2mm V1437 butt joint................................................................................350
Graph 81 Weld bead % Nickel content from parameter set 1: 0.78mm 2205 - 1.2mmV 1437 butt joint.............................................................................................350
Graph 82 Weld bead % Chromium content from parameter set 2: 0.78mm 2205 -1.2mm V1437 butt joint................................................................................353
Graph 83 Weld bead % Nickel content from parameter set 2: 0.78mm 2205 - 1.2mmV 1437 butt joint.............................................................................................353
Graph 84 Weld bead % Chromium content from parameter set 3: 0.78mm 2205 -1.2mm V 1437 butt joint................................................................................356
Graph 85 Weld bead % Nickel content from parameter set 3: 0.78mm 2205 - 1,2mm V1437 butt joint.............................................................................................356
Graph 86 Weld bead % Chromium content: 1.2mm V 1437 (top) - 1mm 304 lap joint........................................................................................................................358
Graph 87 Weld bead % Nickel content: 1.2mm V 1437 (top) - 1mm 304 lap jo in t. 358Graph 88 Weld bead % Chromium content: 0.78mm 2205 (top) - 1.2mm V 1437 lap
joint.................................................................................................................360Graph 89 Weld bead % Nickel content: 0.78mm 2205 (top) - 1.2mm V1437 lap joint
........................................................................................................................360Graph 90 Weld bead % Chromium content: 1.2mm V 1437 (top) - 0.78mm 2205 lap
joint.................................................................................................................362Graph 91 Weld bead % Nickel content: 1.2mm V 1437 (top) - 1.2mm V 1437 lap joint
........................................................................................................................ 362
18

Table o f Images
Image 1 1mm 304 - 1.2mm V I437 at the top and the 1.2mm V I437 similar metaljoint at the bottom - both VICT exposed..................................................... 62
Image 2 1mm 304 - 1.2mm V 1437 at the top and the 1.2mm V 1437 similar metaljoint at the bottom - both scab exposed.........................................................62
Image 3 Pitting in the HAZ of a laser weld tested in 150ppm NaCl solution at 90°C(top image x 35 & bottom x 130).................................................................. 81
Image 4 Fatigue crack initiation angle of a similar metal laser welded stainless steellap joint.......................................................................................................... 110
Image 5 Shows the ‘as received’ 1.2mm V I437 microstructure at x200magnification.................................................................................................202
Image 6 Shows the ‘as received’ 1mm 304 microstructure at x200 magnification 202Image 7 Shows the ‘as received’ 1mm 2205 microstructure at x200 magnification
........................................................................................................................203Image 8 Shows the ‘as received’ 1mm 2101 microstructure - scale bar.................. 203Image 9 Secondary electron image from parameter set 1: 1mm 304 - 1.2mm V 1437
butt joint.........................................................................................................213Image 10 Speed map for Cr from parameter set 1: 1mm 304 - 1,2mm V1437 butt
joint................................................................................................................ 213Image 11 Speed map for Ni from parameter set 1: 1mm 304 - 1.2mm V 1437 butt
joint................................................................................................................ 213Image 12 Shows a fatigue specimen in which fatigue failure occurred in the 304... 219Image 13 Shows a fatigue specimen in which fatigue failure occurred in the V 1439
........................................................................................................................219Image 14 Shows a fatigue specimen in which fatigue failure occurred in the 304... 220Image 15 Shows a fatigue specimen in which fatigue failure occurred in the V 1439
220Image 16 Shows a fatigue specimen in which fatigue failure occurred in the 2205.221Image 17 Shows a fatigue specimen in which fatigue failure occurred in the V 1439
221Image 18 Shows a fatigue specimen in which fatigue failure occurred in the 2205.222Image 19 Shows a fatigue specimen in which fatigue failure occurred in the V 1439
222Image 20 Fatigue sample cross-section showing fatigue failure in the bottom sheet for
1mm 2101 similar metal lap joint................................................................ 223Image 21 Fatigue crack propagation from the HAZ at the internal lap face into the
weld bead....................................................................................................... 224Image 22 Change in Fatigue crack propagation direction from the HAZ into the laser
weld bead.......................................................................................................225Image 23 1mm 2101 lap joint fatigue failure with a fatigue crack present at the
opposite side of the lap joint.........................................................................226Image 24 1mm 2101 lap joint fatigue failure with a fatigue crack present at the
opposite side of the lap joint.........................................................................226Image 25 Close up image of the propagated fatigue crack from Image 23 2101 similar
metal lap joint................................................................................................227Image 26 Close up image of the propagated fatigue crack from Image 24 2101 similar
metal lap joint................................................................................................228Image 27 SEM 2101 similar metal lap joint fatigue crack tip image.........................229
19
Image
Image
Image
Image
Image
Image
Image
Image
Image
Image
Image
Image
Image
Image
Image
Image
Image
Image
Image
Image
Image
Image
Image
Image
Image
28 SEM 2101 similar metal lap joint fatigue crack - same image as Image 26 ........................................................................................................................229
29 1.2mm V1437(top) - 1mm 2101 dissimilar metal lap joint showing fatiguecracks in both materials............................................................................... 231
30 1.2mm V 1437(top) - 1mm 2101 dissimilar metal lap joint showing fatiguecracks in both materials................................................................................232
31 1.2mm V 1437(top) - 1mm 2205 lap joint fatigue crack in the 1.2mmV1437............................................................................................................ 233
32 1.2mm V 1437(top) - 1mm 2205 lap joint fatigue crack in the 1mm 2205 ........................................................................................................................234
33 Secondary electron image showing fatigue crack initiation in the 1mm 2101 from 1.2mm V 1437 (top) - 1mm 2101 dissimilar metal lap joint 236
34 Back scattered electron image showing fatigue crack initiation in the 1mm 2101 from 1.2mm V1437 (top) - 1mm 2101 dissimilar metal lap joint... 236
35 Secondary electron image showing fatigue crack initiation in the 1.2mm V1437 from 1.2mm V1437 (top) - 1mm 2101 dissimilar metal lap joint 237
36 Back scattered electron image showing fatigue crack initiation in the1.2mm V1437 from 1.2mm V1437 (top) - 1mm 2101 dissimilar metal lap joint.................................................................................................................237
37 Secondary electron image showing fatigue crack initiation in the 1mm 2205 from 1.2mm V 1437 (top) - 1mm 2205 dissimilar metal lap joint 238
38 Secondary electron image showing fatigue crack initiation in the 1.2mm V1437 from 1.2mm V1437 (top) - 1mm 2205 dissimilar metal lap joint 238
39 1.2mm VI437 - 1mm 2101 dissimilar metal butt joint fatigue failure -centre weld failure........................................................................................ 239
40 1.2mm V 1437 - 1 mm 2101 dissimilar metal butt joint fatigue failure -2101 HAZ failure..........................................................................................240
41 1.2mm V 1437 - 1 mm 2101 dissimilar metal butt joint fatigue failure -V I437 HAZ failure....................................................................................... 240
42 Weld bead surface porosity in a 1mm 304 (top) - 1.2mm V 1437 laserwelded lap jo in t.............................................................................................245
43 Weld bead surface porosity in a 1mm 2205 (top) - 1.2mm V 1437 laserwelded lap jo in t.............................................................................................245
44 Weld bead surface porosity in a 1.2mm V 1437 (top) - 1mm 2205 laserwelded lap jo in t.............................................................................................246
45 Weld bead penetration breakdown in a 1.2mm V 1437 (top) - 1mm 304laser welded lap joint.................................................................................... 246
46 Weld bead penetration breakdown in a 1.2mm V 1437 (top) - 1mm 304laser welded lap joint.................................................................................... 247
47 Weld bead shape obtained when the 1mm 304 stainless steel is at the top ofthe lap joint.................................................................................................... 280
48 Weld bead shape obtained when the 1.2mm V 1437 is at the top of the lapjoint.................................................................................................................281
49 Close up image of the propagated fatigue crack from Image 23 2101 similarmetal lap joint................................................................................................303
50 1.2mm V1437(top) - 1mm 2101 dissimilar metal lap joint showing fatiguecracks in both materials................................................................................ 304
51 Secondary electron image showing fatigue crack initiation in the 1mm 2205 from 1.2mm V I437 (top) - 1mm 2205 dissimilar metal lap joint 305
52 Secondary electron image showing fatigue crack initiation in the 1.2mm V I437 from 1.2mm VI437 (top) - 1mm 2205 dissimilar metal lap joint 305
20

Image 53
Image 54
Image 55
Image 56
Image 57
Image 58
Image 59
Image 60
Image 61
Image 62
Image 63
Image 64
Image 65
Image 66
Image 67
Secondary electron image from parameter set 2: 1mm 304 - 1,2mm V I437butt joint......................................................................................................... 343Speed map for Cr from parameter set 2: 1mm 304 - 1.2mm V1437 buttjoint................................................................................................................ 343Speed map for Ni from parameter set 2: 1mm 304 - 1.2mm V 1437 buttjoint................................................................................................................ 343Secondary electron image from parameter set 3: 1mm 304 - 1.2mm V 1437butt joint......................................................................................................... 346Speed map for Cr from parameter set 3: 1mm 304 - 1.2mm V 1437 buttjoint................................................................................................................ 346Speed map for Ni from parameter set 3: 1mm 304 - 1.2mm V 1437 buttjoint................................................................................................................ 346Secondary electron image from parameter set 1: 0.78mm 2205 - 1.2mmV1437 butt joint.............................................................................................349Speed map for Cr from parameter set 1: 0.78mm 2205 - 1.2mm V I437 buttjoint................................................................................................................ 349Speed map for Ni from parameter set 1: 0.78mm 2205 - 1.2mm V 1437 buttjoint................................................................................................................ 349Secondary electron image from parameter set 2: 0.78mm 2205 - 1.2mmV 1437 butt joint.............................................................................................352Speed map for Cr from parameter set 2: 0.78mm 2205 - 1.2mm V1437 buttjoint.................................................................................................................352Speed map for Ni from parameter set 2: 0.78mm 2205 - 1.2mm V1437 buttjoint................................................................................................................ 352Secondary electron image from parameter set 3: 0.78mm 2205 - 1.2mmV1437 butt joint.............................................................................................355Speed map for Cr from parameter set 3: 0.78mm 2205 - 1.2mm V I437 buttjoint.................................................................................................................355Speed map for Ni from parameter set 3: 0.78mm 2205 - 1.2mm V1437 butt joint.................................................................................................................355
21

Tables
Table 1 Energy consumption and efficiency of LBW relative to other selectedwelding processes............................................................................................33
Table 2 Thermal and electrical properties of 304, 2205 and mild steel..................... 86Table 3 1.2mm V 1437 mechanical properties (nominal and actual)........................137Table 4 1mm 304 mechanical properties (nominal and actual)................................ 137Table 5 0.7mm 301 mechanical properties (nominal and actual).............................137Table 6 0.6mm 301 mechanical properties (nominal and actual).............................138Table 7 1mm 2205 mechanical properties (nominal and actual).............................. 138Table 8 0.78mm 2205 mechanical properties (nominal and actual)........................ 138Table 9 1mm 2101 mechanical properties (nominal and actual).............................. 138Table 10 1.2mm V I437 chemical composition........................................................... 139Table 11 1mm 304 chemical composition....................................................................139Table 12 0.7mm 301 chemical composition................................................................ 139Table 13 0.6mm 301 chemical composition................................................................ 139Table 14 1mm 2205 chemical composition..................................................................140Table 15 0.78mm 2205 chemical composition............................................................ 140Table 16 1 mm 2101 chemical composition..................................................................140Table 17 1.2mm V I437 zinc mass and coating thickness...........................................141Table 18 comparison between the parent material tensile properties and the similar
metal laser welded butt joint tensile properties...........................................171Table 19 Comparison between the parent material tensile properties and the similar
metal laser welded lap shear properties....................................................... 178Table 20 Lap joint weld widths between the sheets................................................... 204
22

1 Introduction
The automotive industry is one of the most competitive industries in the world.
Continuous research is being carried out by automotive material suppliers and
manufacturers to develop existing materials and integrate new materials into automotive
design. This research has included extensive evaluation of the use of lightweight
structures, aluminium alloys, and the integration of plastics and composite materials
into vehicle body assembly1.
The driving force for the development and integration of new materials, apart from the
competitive nature of the automotive industry, is the implementation of new legislation.
More specifically, in July 1998 the European Association of Car Makers agreed to
gradually reduce the emissions rate from new vehicles sold in Europe by its members,
the aim being to reduce CO2 emissions to 140g/km by 2008 and to develop and market
vehicles emitting only 120 g of CO2 per km by the same date2.
Areas identified to allow the reduction of CO2 emissions were:
1. New engine technologies to reduce fuel consumption
2. Friction and aerodynamic resistance are to be reduced
3. Vehicle weight to be reduced
Calculations made by PSA Peugeot Citroen revealed that the CO2 emission reduction
brought about by new engine technologies, friction and aerodynamic reduction would
not be enough; therefore, car weight reduction, including “body in white” lightening
must be intensified2.
1 Powell, H.J. Wiemer, K. Joining Technology for High Volume Manufacturing of Lightweight Vehicle Structures, Part 1: Joining Technology Implications for Lightweight Vehicles, TWI, Cambridge, UK, June 962 Lozach, G. The Future of Galvanised Steel Sheets as a Material for the Automotive Body in White, Galvanised Steel Sheet Forum-Automotive, 15-16 May 2000, The Institute of Materials, London, UK
23

Current trends in automotive manufacture are to utilise high strength steels, which allow
weight reductions whilst maintaining component strength and rigidity. Hence, the steels
that are currently used in automotive manufacture are:
1. HSLA or micro-alloyed steels
2. Rephosphorised steels
3. Bake hardening steels
4. Dual phase steels
5. Trip steels
6. High strength Interstitial Free (IF) steels
The major disadvantage of these steels is their corrosion resistance, however, steel can
be protected in a number of ways to improve the corrosion properties, e.g. painting,
galvanising, coating with PVC or concrete, or, for wet applications, cathodic protection.
However, these all add an additional cost to that of the basic steel production figure. In
the case of automotive steel grades, coating the steel with zinc is the preferred and most
widely used method. Mild steel can be hot dip galvanised or electro-galvanised to
achieve the requisite corrosion resistance. The main difference between these two
methods is the thickness of the deposited coating. Hot dip galvanising provides a
thicker coating and consequently better corrosion resistance; thus, it is the most widely
used.
One material that has seemingly been overlooked for potential integration into
lightweight automobile construction is stainless steel. This is, more than likely, due to
the higher cost of stainless steel compared to high strength steel on a weight basis.
24
It has been estimated that the integration of austenitic and duplex stainless steel into
‘lightweight’ automobile construction could achieve a weight saving of up to 40% when
compared to carbon steel3. This is primarily through the elimination of corrosion
allowances; but also by utilising the superior mechanical properties of stainless steel
(especially duplex stainless steel), thinner gauges may be used.
The ability to join dissimilar metals allows further development of many existing
products and components and allows specific material properties to be exploited.
It is often too expensive to design and build prototypes solely for the purpose of testing
a new materials’ suitability for a particular application. Therefore, the most common
route is to introduce a material into specific areas of the existing design.
The welding process most commonly used in large-scale automotive production is
resistance spot welding (RSW). This welding process has been used successfully to
join many different materials including some dissimilar metal joints4. The disadvantage
of the RSW process is its inherent inflexibility in adapting to new vehicle program
changes without significant modifications to the equipment, for example a program
change may result in the RSW equipment having to be moved to a new jig position to
allow successful completion of the welding sequence. Recent trends toward
economically fabricating vehicle structures whilst ensuring quality have led to the
implementation of lasers in the automobile industry5,6,7, which can be incorporated in
the production line as a substitute for the conventional resistance spot welding process.
3 Northart, J. F. Utility Chromium Stainless Steels in the Transportation Industry, Corrosion, 984 Marples, M. Investigation into the Resistance Spot Welding of Stainless Steel to Coated Ferritic Steel, Mphil/PhD Transfer Report, Materials Research Institute, Sheffield Hallam University, 20015 Heston, T. Remote Laser Beam Welding shows Potential in the Body Shop, Welding Journal, June 20006 Irving, B. Lasers continue to Penetrate Automotive Production Lines, Welding Journal, June 20007 Yang, Y.S. Lee, S.H. A Study on the Joining Strength of Laser Spot Welding for Automotive Applications, Journal of Materials Processing Technology 94 (1999), pp 151-156
25

The use of lasers in the automotive industry has seen a dramatic increase in recent years
to a position where approximately 15% of all industrial processing lasers are installed in
automotive production8. Although most of these lasers are devoted to cutting
applications, a significant and increasing proportion of lasers are being applied to
welding. Surveys conducted in 1992 by Rossler, D. et al reported about 20% of the
lasers installed in the automotive industry were used in welding applications9.
Since the survey was conducted, the automotive industry has seen a significant growth
in laser welding applications, particularly involving steel manufacturers, for tailored
blank manufacture and in body-in-white welding applications. Today, this technology is
widespread through the automotive industries of America and Europe9. Figure 1 shows
a 5kW CO2 industrial laser welder from the Welsh Technology Centre, Port Talbot.
Figure 1 Welsh Technology Centre Trumpf 5kW C 0 2 Laser Welder
8 Riches, S. T. Lasers in the Automotive Industry, Make It With Lasers Workshop, Nissan Motor Manufacturing (UK), 22 October 19989 Roessler D. Laser Materials Processing in General Motors Corporation, Proc ISATA 92, June 1992, pp37-51
26

Laser welders are currently used in the production lines of General Motors, BMW and
Volvo to name but a few. The current BMW 5-series contains approximately eleven
metres of laser weld on each car body10.
Laser welding tailored blanks allow manufacturers to provide the material properties in
the areas where they will be used to their best effect, where material utilisation is
maximised or where the total number of build operations are minimised - whichever is
chosen.
Owing to the high formability levels of laser welds, the desired combinations of steel
strength, thickness and/or coating type can be laser welded together as flat sheets and
then pressed into the required panel shape. The rear inner door panel shown in Figure 2
contains three different steels. The lower part of the door contains an area of hot-dip
galvanised steel, which protects against corrosion in the most vulnerable spot. The right
hand side contains an area of high strength, un-coated steel, which replaces many of the
reinforcement parts that are currently welded-on after pressing. This steel also provides
the necessary strength for the door hinges and door mirrors. The rest of the door is
made from iron-zinc coated steel.
Figure 2 Picture showing an inner door panel that is made up of three different steels that have been laser welded
together11
10 Larsson, J.K. Automotive Laser World - The Use of Lasers in Car Body Manufacturing. Proceedings of the 6th Nordic Laser Materials Processing Conference, NOLAMP 6. Aug. 27-29, 1997, Lulea, Sweden, pp 76-94
27

Another current laser welded application is the use of composite blanks for chassis
members, for example structural areas within the body shell that are conventionally
made from single thickness steel and strengthened in critical areas by welding on
stiffening assemblies after the forming operations. By laser welding together areas of
thicker or higher strength steels with thinner gauge steels, a lighter structure (with the
higher strength areas only where required) can be produced in one pressing operation.
This negates additional stamping and forming to make the reinforcement parts and the
resistance welding together of the various parts.
The formability of laser welds is the key to the success or failure of a part. Due to the
small HAZ, the welds are extremely formable, as long as joint quality is good and in
cupping tests generally give between 80 and 100% of the fracture height of the base
material.11
There still remain, however, a number of areas that have yet to be examined in-order to
improve the confidence of automotive manufacturers in the exploitation of these joining
technologies and for the integration of new materials in lightweight automotive design,
these include:
• Weldability of dissimilar material combinations
(zinc-coated mild steel/stainless steel)
• Performance knowledge for structural and non structural components (including
long term prediction)
• Modelling of fatigue performance and fatigue life prediction for dissimilar
metal, dissimilar thickness joints
11 Lalley, M. Laser welding provides tailored properties, Welsh Technology Centre, Materials world, Nov 1994, no. 11, vol. 2, Page 576.
28

2 Literature Review
2.1 Solid State and Gas Lasers
There are four types of laser that prevail in metalworking. These are:
1. Gas laser, the so-called CO2 (mixture of CO2 , N2 and He is used)
2. Ruby laser
3. Solid state laser, the neodymium-doped yttrium-aluminium-garnet (Nd:YAG)
or simply YAG laser
4. Neodymium-doped glass (Nd Glass) or simply glass laser
1 oIt should be noted that approximately 90% of metalworking is done using (1) and (3) ,
these being the two main types of laser, the gas laser and the solid-state laser.
The solid state laser, in this case, Neodymium-doped Yttrium-aluminium-gamet
(Nd:YAG), does not encompass semiconductor devices. The neodymium atoms, which
when held in a suitable host, can be excited by light from an external source, to produce
laser action. Continuous arc lamps, pulsed flashlamps and more recently diode lasers
are used commercially (a typical schematic diagram can be seen in Figure 3). Thus,
solid-state lasers can generate continuous beams of a few milli-watts to several kW,
short pulses with peak powers in the giga-watt range, or pulsed beams with average
powers in the kW range. The wavelength of the Nd:YAG laser is 1.06pm.
12 Ghosh, S. K. & Ericsson, T. Laser welding, IFTT International, ISBN 2-907-669-04-4
29

Output window(partly reflective at 1.06pm)
Pump light beam shaping optics
Laser diode'X ^
Nd:YAG rod
Rod end with coating which transmits 0.81pm diode light and reflects 1.06pm Nd:YAG light
1.06pm laser output
Figure 3 Schematic diagram showing a typical diode (end) pumped NdrYAG laser set up
30

The carbon dioxide (CO2) gas laser is one of the most versatile for materials processing
applications. Of the several types of CO2 laser that are available, the waveguide, the
low power sealed tube and the transversely excited atmospheric (TEA) lasers are used
for small-scale materials processing applications. The fast axial flow CO2 laser and the
less widely used slow flow laser are used for thick section cutting 1-15mm and deep
penetration welding.
The active medium in a CO2 laser is a mixture of carbon dioxide, nitrogen and
(generally) helium. The carbon dioxide produces the laser light, while the nitrogen
molecules help excite the CO2 molecules and increase the efficiency of the light
generation processes. The helium plays a dual role in assisting heat transfer from the
gas caused by the electric discharge used to excite the gas, and also helps the CO2
molecules to return to the ground state. The CO2 laser has a wavelength of 10.6pm.
A schematic diagram of the ‘waveguide’ CO2 laser can be seen in Figure 4 below.
Laser output
Metalelectrode
Output Window
Wave-guide bore region \
RF Power Supply
Insulators (waveguide reflectors)
Rear mirrorFigure 4 Schematic diagram showing a typical Wave-guide C 0 2 laser set up
31
2.2 Basic Mechanisms of Laser Welding
Both solid state and gas lasers operate on the principle that photons of light emitted
from excited atoms can be amplified to produce an intense beam of coherent, uniquely
directional, mono-chromatic light.
Stimulated emission requires more atoms at high energy levels and this is achieved by
external excitation of the laser medium by optical or electrical means. External
excitation is applied either at a constant energy level to produce continuous wave (CW)
laser beams or in a series of bursts to produce pulsed laser beams. Gas lasers are
typically CW whilst solid-state lasers are typically pulsed.
Laser beam welding (LBW) uses a moving high-density (lCf to 107 W/cm2) coherent
optical energy source called a laser as the source of heat. The coherent nature of the
laser beam allows it to be focused to a small spot, leading to high energy densities. The
typical focal spot diameter for a laser beam ranges from 100 to 1000pm. The capability
of the laser to generate a power density greater than 106 W/cm2 is the primary factor in
establishing its potential for welding. Numerous experiments have shown that the laser
permits precision and high quality weld joints rivalled only by those made with an
electron beam13.
The localised heating obtained with laser sources was soon realised to be an important
advantage. Anderson and Jackson14 reported an interesting comparison between heating
effects produced with a conventional arc source and those occurring with a pulsed laser
for an iron substrate. They show that not only is the laser-produced HAZ small, but
also that the laser source is more efficient because it requires only 37.8J/cm2 (0.229
Btu/in.2) to produce melting to the required depth, while the arc source must deliver 246
13 Mazumber, J. Laser Beam Welding, ASM handbook 1, page 262 - 26914 Anderson, J. E. & Jackson, J. E. Welding Journal, vol. 44, 1965, page 1018
32

J/cm2 (1.49Btu/in.2) to the work-piece. This shows the high energy densities achieved
with the laser beam welding process.
Table 1 shows the energy consumption and efficiency of laser-beam welding in
comparison to other common welding processes15.
Weldingprocess
Intensity of energy source Joining efficiency mm2/kJ
Fusion Profile
W/cm2 W/in3Oxyacetylene
(OAW)102- 103 6xl02 -
6xl030 .2 -0 .5 Shallow for single
passArc welding 5xl02 - 104 3xl03-
6xl040 .8 -2 (a) 2 - 3 (b)
4 -1 0 (c )
Shallow for single pass
Plasma arc (PAW)
103- 106 6xl03 - 6xl06
5 - 1 0 Shallow at low- energy end
Deep penetration at high-energy end
Laser beam 105 - 107 6xl05 - 6xl07
15 -25 Shallow at low- energy density
range Deep penetration at
high-energy density range
Electron beam 107- 10s 6xl05 - 6x10s
2 0 -3 0 Deep penetration
(a) Gas - tungsten arc welding (GTAW), (b) Gas - metal arc welding (GMAW), (c)_______________________Submerged arc welding (SAW)_______________________Table 1 Energy consumption and efficiency of LBW relative to other selected welding processes
It can be seen that the joining efficiency of laser-beam welding is far greater than most
other joining processes with the exception of electron beam welding. As well as being
much more efficient, the laser welding process has a large number of advantages that
allow it to compete with many well-established techniques such as soldering, arc
welding, electron beam welding and, the most commonly used automotive welding
process, resistance spot welding12, 16, 17.
15 Mazumber, J. Procedure Development and Practice Considerations for Laser Beam Welding, ASM handbook 3, page 874 - 88016 Wilson, J. & Hawkes, J. F. B. Laser Principles and Applications, Prentice hall, international series in optoelectronics, ISBN 0-13-523705-X17 Lampa, C. Laser Welding, Energy Redistribution and Weld Geometry, Doctoral Thesis, 1997:33, Lulea university of technology, ISSN: 1402 - 1544
33

Advantages include:
1. There is no physical contact with external components; this can be compared to
resistance spot welding where contact occurs between the work-piece and the
electrode tip.
2. Single sided access only is required; again this can be compared with resistance
spot welding which requires double sided access
3. The heating is very localised
4. Dissimilar metals can be welded
5. Welding can be carried out in a controlled atmosphere with the work-piece
sealed if necessary within optically transparent materials
6. Use of inert gas (argon or helium) for shielding to eliminate oxidation
7. Use of both continuous wave and pulsed lasers
8. Use of numerical control (NC) / digital numerical control (DNC) / Robotics
devices for accuracy and complex jobs
9. The ability to carry out laser weld simulations using a low density laser spot
prior to completing the weld
These advantages alone make the laser a very attractive alternative to many existing
welding processes.
As with all welding processes there are some disadvantages to the laser welding
process. These include18:
1. Work-piece ‘fit up’; close fitting joints are required to ensure high quality
welding when making autogenous welds. Alternatively special tooling can be
used to force parts together.
18 Dawes, C. J. C 0 2 Laser Welding Low Carbon Steel Sheet, The Welding Institute Research Bulletin, August 1983, pp260-265
34

2. Work-handling; precision work or beam handling equipment is necessary to
ensure good alignment of the laser beam with the work-piece and to control
weld energy input.
3. Consumables; CO2 lasers consume He, N2 and CO2 gases in their operation and
He shielding gas is usually necessary.
4. Beam focusing; High power lasers use beam focusing lenses or mirrors, these
optics are expensive and may have limited service life.
5. The initial cost of a laser system is expensive in comparison to resistance spot
welding, for example.
35

2.3 Laser Welding Mode
Laser welding can be carried out in two modes. These are conduction mode laser
welding, and for relatively thick sheets, keyhole laser welding. Keyhole laser welding
requires higher power densities to produce the keyhole and results in a weld with a
higher depth to width ratio.
2.3.1 Conduction Mode Laser Welding
The laser welding of thin steel sheets generally involves conduction mode laser
welding. The laser beam irradiates the material surface and heat is conducted radially
away from the laser-material interaction zone19. The molten weld pool produced
generally has a semi-circular type cross section as shown in Figure 5 below.
Laser beam
Heat is conducted radially away from the laser-material interaction zone
Figure 5 Heat dissipation in a conduction mode laser weld19
19 Lampa, C. Laser Welding - Energy Redistribution and Weld Geometry, Doctoral Thesis, Lulea University of Technology, 1997, ISSN: 1402 - 1544
36

The depth to width ratio of conduction mode laser welds provides a greater tolerance to
poor fit than keyhole type laser welds. However, conduction mode laser welding is far
less efficient than keyhole laser welding in terms of energy consumed per unit area of
join17.
The surface condition of the sheets to be welded greatly affects the absorption of the
laser beam. The surface reflectivity of cold rolled thin sheet can be as high as 65-80%
in CO2 laser welding20, with the reflectivity of highly polished surfaces such as bright
annealed stainless steel being as high as 98% at room temperature. However, the
surface reflectivity reduces as the temperature of the surface rises.
Nath et al investigated the laser power coupling efficiency in conduction and keyhole
mode welding of austenitic stainless steel. The estimated coupling efficiencies in
91conduction and keyhole mode welding were found to be 16% and 65% respectively .
20 Xie, J. Kar, A. Laser Welding of Thin Steel Sheet with Surface Oxidation, Welding Journal, 78: (10) 343S-348S OCT 199921 Nath, A. K. Sridarhar, R. Ganesh, P. & Kaul, R. Laser Power Coupling Efficiency in Conduction and Keyhole Welding of Austenitic Stainless Steel, Sadhana, Vol.27, Part 3, June 2002, pp. 383-392
37

2.3.1.1 Dilution/Stirring Mechanism
c nThe high-power density (10 to 10 W/cm2) in laser welding produces a temperature
gradient in the order of 106 K/cm which, in turn, leads to thermo-capillary flow
(Marangoni convection) with surface velocities in the order of lm/s.
The driving forces for thermo-capillary flow in weld pools can be described by three
phenomena22.
1. Surface tension flow
2. Buoyancy force
3. Electromagnetic force
Laser welding uses no electrical current; consequently the electromagnetic force can be
neglected17.
Generally, surface tension of a melt decreases with temperature17. For laser welding;
surface tension is at a maximum at the edges of weld pool and at a minimum in the
centre (see Figure 6). This surface tension gradient produces a stirring action which
acts outwards from the centre of the weld pool. It should be noted, that this flow pattern
can be reversed in some cases by the presence of surface active agents such as sulphur
or oxygen in steel23.
The buoyancy force reinforces the surface tension stirring effect and is produced by the
density of liquid metals decreasing with increasing temperature. Thus, the hotter (less
dense) material towards the centre of the melt pool will tend to rise whilst the cooler
(more dense) material at the edges will tend to sink.
22 Wang, Y.H. Kou, S Driving Forces for Convection in Weld Pools. Proceedings of the international Conference on Trends in Welding Research. May 18-22, 1986, Galinburg, TE, USA, pp. 65-69..23 Kou, S. Welding Metallurgy. New York: Wiley. 1987
38
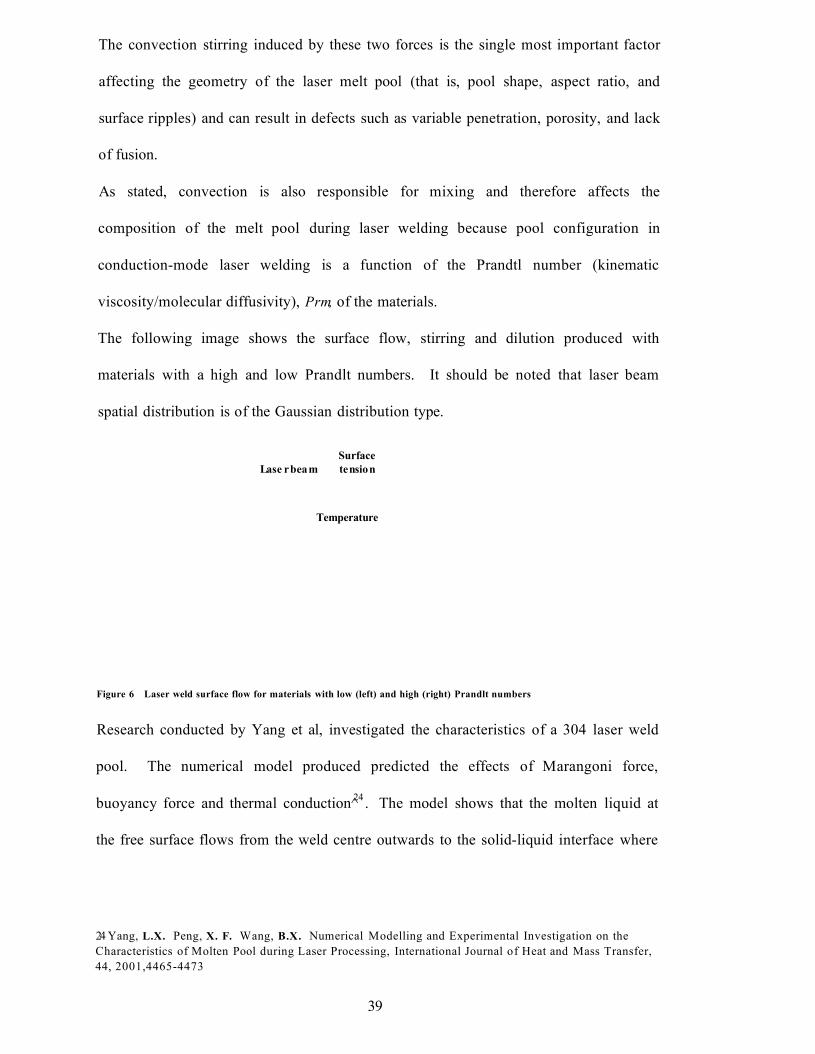
The convection stirring induced by these two forces is the single most important factor
affecting the geometry of the laser melt pool (that is, pool shape, aspect ratio, and
surface ripples) and can result in defects such as variable penetration, porosity, and lack
of fusion.
As stated, convection is also responsible for mixing and therefore affects the
composition of the melt pool during laser welding because pool configuration in
conduction-mode laser welding is a function of the Prandtl number (kinematic
viscosity/molecular diffusivity), Prm, of the materials.
The following image shows the surface flow, stirring and dilution produced with
materials with a high and low Prandlt numbers. It should be noted that laser beam
spatial distribution is of the Gaussian distribution type.
SurfaceLa se r bea m te n sio n
Temperature
Figure 6 Laser weld surface flow for materials with low (left) and high (right) Prandlt numbers
Research conducted by Yang et al, investigated the characteristics of a 304 laser weld
pool. The numerical model produced predicted the effects of Marangoni force,
24buoyancy force and thermal conduction^ . The model shows that the molten liquid at
the free surface flows from the weld centre outwards to the solid-liquid interface where
24 Yang, L.X. Peng, X. F. Wang, B.X. Numerical Modelling and Experimental Investigation on the Characteristics of Molten Pool during Laser Processing, International Journal of Heat and Mass Transfer, 44, 2001,4465-4473
39
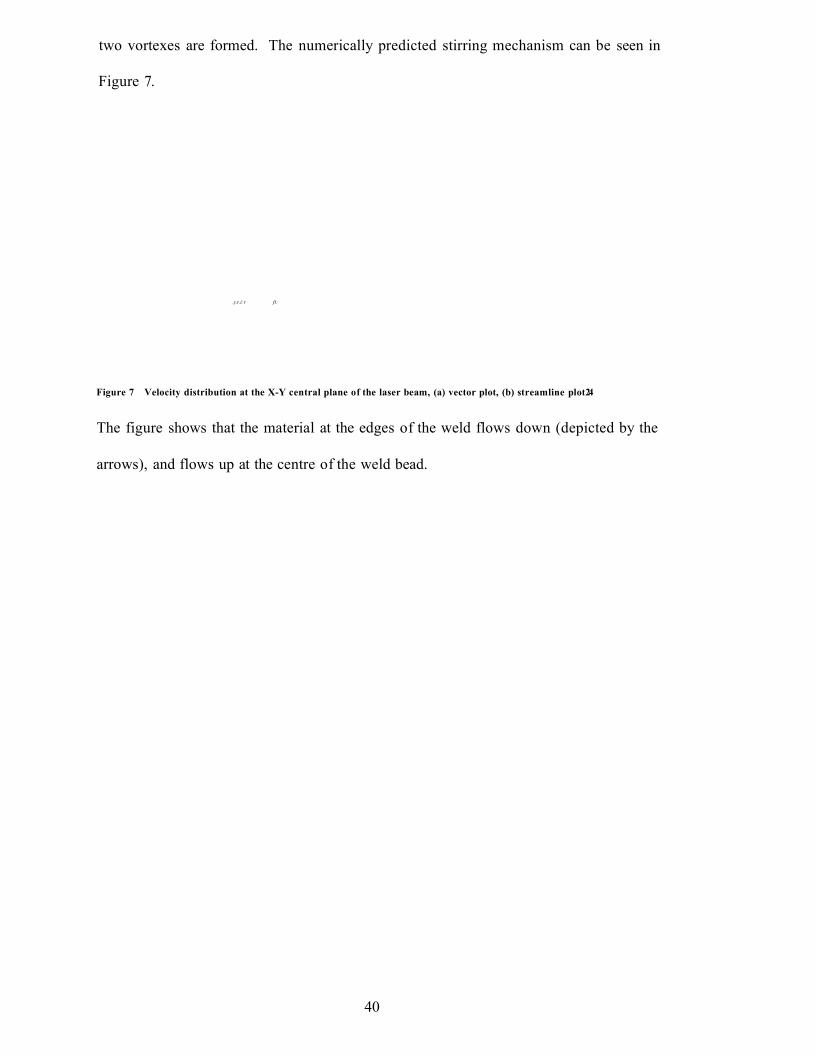
two vortexes are formed. The numerically predicted stirring mechanism can be seen in
Figure 7.
.y.r.i: r ft:
Figure 7 Velocity distribution at the X-Y central plane of the laser beam, (a) vector plot, (b) streamline plot24
The figure shows that the material at the edges of the weld flows down (depicted by the
arrows), and flows up at the centre of the weld bead.
40

Weldingdirection
2.3.2 Keyhole Laser Welding Mode
Increasing the intensity of the laser beam to values in the order of lxlO6 W/cm2 (for
metals) leads to boiling and the formation of a vapour hole approximately the size of the
focussed laser beam known as a ‘keyhole’, surrounded by a hollow column of molten
material. The metal vapour in the keyhole now efficiently absorbs the laser light as it is
subjected to many reflections from the keyhole walls; hence, the increased coupling
efficiency of keyhole welding (65%) compared to conduction mode (16%).
Consequently, the absorptivity and hence the laser wavelength becomes less important
the deeper the hole. Conduction and convection in the liquid transfer heat to the
material increasing the molten volume. A schematic of the laser ‘keyhole’ and its
components can be seen below in Figure 8.
Incident laser beam
PlasmaMetal vapour
Figure 8 Schematic showing the components of a laser ‘keyhole’
41

In keyhole welding, relative motion of the beam sends the keyhole through the work
piece leaving a fused zone behind. The vapour column is of great importance because
this is the medium that transfers energy from the laser beam to the work-piece. Its
vapour pressure keeps the keyhole open allowing the beam to penetrate deeply into the
material being welded.
42

2.4 Laser Welding Parameters
The key factor for weldability is the selection of optimum independent and dependent
process variables. The independent process variables for laser welding include:
1. Incident laser-beam power
2. Incident laser-beam diameter
3. Traverse speed
4. Absorptivity
5. Shielding gas
6. Depth of focus and focal position
7. Design and aperture size
These in turn will affect the dependent process variables having an important affect on
heat flow and fluid flow in the weld pool. This in turn will affect penetration depth,
shape and final solidification structure of the fusion zone. Both the shape and
microstructure of the fusion zone will considerably influence the properties of the laser
weld25.
The independent laser welding variables, as defined by Yih-Fong Tzeng26 can be seen
in Figure 9.
25 Naeem, M. Nd:YAG Laser Welding of Thin Sheet, Welding and Fabrication, June 2000, page 6 - 1 026 Yih - Fong Tzeng, Parametric Analysis of the Pulsed Nd: YAG Laser Seam - Welding Process, Journal of Materials Processing Technology, 102, 2000, page 40 - 47
43

Material Laser Beam-pulsed or continuous
Therm al/Physical Properties Surface R eflectivity Thickness Edge Preparation
M ean Pow er Beam D ivergence
Intensity D istribution Spot Size
Pulse Shape Pulse Energy Pulse Repetition Rate Pulse D uration
▲ i i A
Travel Speed R ig D esignN ozzle D esignBlow n angle
V ertical / H orizontal Types o f G asFlow rate o f gas
-► Quality of Welds
Focal Length
Focal PositionTransport Shielding Focusing
Gas LensFigure 9 Independent process variables that can be controlled to aid in the production of high quality laser welds
2.4.1 Power Density
Power density is defined as the incident power per unit area15. In any welding process it
is the power density that determines the depth of penetration and joining rate for the
process, not the total power of the source. Therefore, beam diameter and spatial
distribution of the laser-beam energy play an extremely important role as they determine
the area of incidence.
Two other variables affecting the ultimate power density driving the welding process
are absorptivity and plasma-beam interaction, such as refraction. Position of focus with
respect to the substrate and depth of focus of the beam also affects the power density
and penetration depth.
44

2.4.1.1 Absorptivity
As mentioned in section 2.3.1, the efficiency of laser beam welding depends on the
absoiption of light energy by the work-piece. The infrared absorption of metals largely
depends on the conductive absorption by free electrons. Therefore, absorbtivity is a
function of the electrical resistivity of the substrate material. Arata and Miyamoto27
measured the absorptivity of polished surfaces of various materials and concluded that
absorptivity is proportional to the square root of the electrical resistivity. This agreed
closely with the following equation:
A := 112.2- yjpr
Equation 1 Absorptivity of laser beam
For reflective materials such as aluminium, Nd: YAG has better coupling, especially for
conduction mode welding, due to their shorter wavelength (1.06pm, as opposed to the
CO2 wavelength 10.6pm).
However, it has been shown that this coupling advantage quickly diminishes as the
material temperature increases and once the material has reached a molten state there is
no great advantage from the shorter wavelength Nd: YAG laser16.
27 Arata, Y. & Miyamoto, Laser Focus, vol 3, 1977
45

2.4.1.1.1 Plasma Beam Interaction
At power densities ~107 W/cm2 (in metals) and higher, some of the electrons in the
vapour become ionised. These free electrons can also absorb energy directly from the
incoming laser beam, resulting in higher temperatures, more increased ionisation and
absorption. Plasma of ionised metal vapour, which can absorb laser light and emit
‘black body’ radiation, is formed. Providing the power density is sufficient to sustain it,
the plasma will be a net contributor to the process. At even higher power densities, the
vapour column leaves the keyhole, forming a ‘cloud’ over its opening. This plasma
cloud (or plume) absorbs light, decreasing the energy entering the keyhole.
The plasma that is formed directly over the molten weld pool can seriously affect
penetration depth. Rockstroh, et al.28 found that during high-power laser welding, free
electrons in the plasma column cause absorption and refraction. When welding
aluminium with a CO2 laser, as much as 30 % of the energy is lost in the plasma and the
refracted beam diameter is 8% larger.
Generally, when welding zinc coated steel there is a very strong plasma formation (even
in conduction mode laser welding) owing to the low boiling point of zinc (906°C) and
its high vapour pressure, which is about eight orders of magnitude greater than that of
Fe. The high vaporisation rate of zinc increases the pressure of the vapour, which is
transformed to plasma in the laser beam, and expands further into the free space above
the metal surface. This affects the absorption and fluctuation of the plasma and in
practice this is shown as increased spattering and porosity in the weld29. See section 2.5
for a comprehensive analysis of the problems associated with laser welding zinc coated
steel, including potential solution to these problems.
28 Rockstroh, T. & Mazunder, J. Applied Physics, vol 61 (no.3), 1987, page 917 - 92329 Matsunawa, A. Monem, A. El-Batahgy and Zaghoul, B. Laser Beam Welding of Lap Joints of Dissimilar Metals, Incomplete source information
46

2.4.1.2 Focal Position
The focal position is the point where the beam is focused in respect to the surface. The
focal position can be controlled to 0.1mm and range from several millimetres above the
surface, the material surface itself (0mm), or several millimetres below. As well as
controlling the depth of penetration by altering power density, it can also (to a lesser
extent) be selected to control the weld bead shape. These effects can be seen in Figure
10 and Figure 11 respectively.3
304L S16L
PmS kW, 3-3 m/mtn£E
a•aco33fflw*»0c 1£
0-6 -5 4 -3 2 1 0 2 3 4 51
Defoouslng distance, mm
Figure 10 The relationship between the focal position and the depth of penetration for 304 & 316 stainless steel30
+4.5 --------- •
+2.5
0-0.5 mm
- 2 .5 imru
-5 mm - 6 mm
P osition of focal point
Figure 11 Transverse profiles as a function of focus position for a laser-beam welded type 310 stainless steel. Negative and
positive numbers indicate position of focal point below and above, respectively, the surface of the plate. Beam power, 5kW,
Traverse welding speed, 16mm/s1"'
30 Monem, A & El-Batahgy, Effect of Laser Welding Parameters on Fusion Zone Shape and Solidification Structure of Austenitic Stainless Steel, Materials Letters 32 (1997), page 155 - 163
47

2.4.1.3 Depth of Focus
Depth of focus is extremely important for welding thin-section materials as for a
shallow depth of focus the substrate comes in and out of the focal position due to
thermal distortion. Depth of focus is defined as the distance over which the focus beam
has approximately the same intensity. It is usually defined as the range over which the
focused spot radius is increased by no more than 5%.
As the f-number of the focusing optics increases, depth of focus increases (the f-number
is defined as the effective focal length divided by the incoming raw beam diameter).
However this is also accompanied with an increase in beam diameter and decreased
power density. As a result, focal point and depth of focus must be optimised for each
particular application.
2.4.1.4 Interaction Time
Interaction time is defined as the time a particular point on the substrate spends under
the laser beam15. In simple terms, it is the ratio of the beam diameter to the traverse
speed. On the basis of heat transfer, the total time of heating and cooling at the point
above the ambient temperature should be accounted for. This is, however, a much more
difficult quantity to keep track of compared to the ratio of the traverse speed and beam
diameter. It is the interaction time that controls the weld pool profile, not the traverse
speed alone.
48

2.4.2 Laser Beam Power
Laser-beam power is one of the primary variables in determining the penetration depth
in laser welding. The relationship between welding power and penetration depth was
investigated by Yih-Fong Tzeng, who found that penetration depth was proportional to
welding power. This can be seen Figure 12. It should be noted that the sample
thickness was 3mm.
4
££
s 3D.O•aco4*«
11 2 3 4 5 6
L aser pow er, kW
Figure 12 The relationship between laser power and the penetration depth achieved30
In addition to the absolute power measurement, the beam mode (that is, the spatial
distribution of energy) and beam diameter should be monitored since they also strongly
affect the power density.
S ’ 3 m/mln, D d‘ 0 .0 mm
49

2.4.3 Laser-Beam Diameter
Laser beam diameter is one of the most important variables since it determines the
power density for a given total power. The spatial distribution of energy in the beam
affects the focusing characteristics of the beam. For a Gaussian beam, the diameter is
defined as the 1/e2 of the central value; see Figure 13, and it contains almost 86% of the
total power15.
0.8
0.6S£w| 0.45 I cc
0.2
-2
1 1 5
1000 59 "1 «
Relative radius r / rb
Figure 13 Variation of relative intensity and percentage of total power with radius for a gaussian beam1"
50

2.4.4 Traverse Speed
Generally welding speed increases with increasing laser power. It can be seen from
Figure 14 and Figure 15 that a range of speeds can be used for a given thickness and
power to produce successful welds. It can also be seen that the envelope becomes larger
when welding thinner material. It should be noted, however, that the fusion zone size
increases with decreased speed within the welding range. This can be seen in Figure 16.
Figure 14 The welding envelope for a variety of materials thickness40
1 2 3 4 5Power Kw
Figure 15 Welding speed versus laser power for a 5 kW C 0 2 laser. These welding envelopes were produced for a Ti-6A1-
4V1S
51

5
P*4 kW , Dd‘ 0.0 mm4
o. 3
2
10 1 2 43
Welding speed, tn/mln
Figure 16 The relationship between the traverse speed and the weld bead depth to width ratio30
52

2.4.5 Shielding Gas
Shielding gas is used to suppress plasma formation as well as provide a controlled
atmosphere around the weld to prevent oxidation etc31 32. Successful plasma
suppression results in high quality welds with consistent shape and penetration depth.
The type and flow rate of the shielding gas are the most commonly controlled aspects of
this variable. However, the direction of the shielding gas can also be controlled; for
example, the gas can be directed from behind the laser (trailing gas) or can be
incorporated around the laser beam (coaxial). A combination of the two can also be
used. The most common types of shielding gas are Argon and Helium. Studies have
shown, however, that Helium is more successful at suppressing plasma and seems to
improve beam transmission whereas Argon can cause severe blockage of the laser
power by not suppressing plasma formation, see Figure 17. It is thought that this is due
to the fact that argon has a lower ionisation potential (15 eV) compared to that of
helium (25 eV)32. Matsunawa et al.29 found that during laser welding of stainless steel
to zinc coated steel the numbers of pores obtained when using helium as a shielding gas
was much less than when Argon was used as the shielding gas.
50 2.0Helium
COgAir
Air25 1.0
ion0
Figure 17 The penetration depth achieved from various shielding gases in comparison to air1'
31 Metzbower, E.A. Moon, D.W. & Denney, P.E. Laser Beam Welding of HSLA Steels, ASM conference proceedings, 8 - 1 2 October 199032 Seaman, F. Role of Shielding Gas in Laser Welding, Technical paper no. MR77-982, 1977
53

2.4.6 Focussing System
The laser welding process involves focusing a laser beam, using either a lens or a
mirror, to a small spot, which has sufficient power density to melt the surface of the
substrate or to produce a keyhole type laser weld. The focusing system is generally
defined by its focal length. However, the critical factors that determine the selection of
the lens are the focused spot diameter and the depth of focus. The depth of focus is the
effective distance over which satisfactory welding can be achieved. It can be defined as
the distance over which the focused spot size does not increases beyond 5%. For a
given beam diameter, as the focal length becomes shorter the focused spot diameter and
the depth of focus also become smaller. The size of the actual spot size is also
dependent on the raw beam diameter. As the raw beam diameter increases, for a given
focussing system, the focused spot size will decrease. To allow comparison between
lasers with different beam diameters the f-number is used. As it is not feasible to
control the raw beam diameter, it is usual to select the correct focussing system to give a
focused beam of the required type. The only other consideration is that the shorter the
focal length, the closer the focusing optics are to the work piece, and therefore more
likely to be damaged by spatter from the welding process.
Thus when welding thicker section materials the requirements would be a high power
density and therefore a small focused spot size but with a long depth of focus, hence an
ability to process thicker materials with a reasonable tolerance to focus position
variation, see section 2.4.1.2.
54
2.5 Current Automotive Steel Grades
Automotive manufacturers use a range of ‘high strength’ steels in the production of
lightweight automotive structures. As stated in section 1, the steels currently used in
automotive manufacture are:
7. HSLA or micro-alloyed steels
8. Rephosphorised steels
9. Bake hardening steels
10. Dual phase steels
11. Trip steels
12. High strength IF steels
The materials that have received the most attention as potential new materials for
lightweight automotive construction are aluminium alloys. As well as the initiatives
stated in section 1 from the European Association of Car Makers to reduce CO2
emissions; the US automotive industry also face demands to simultaneously increase its
average fuel economy and reduce green house gas emissions, with the use of
lightweight aluminium alloys being identified as an effective way to meet these new
standards33.
33 Brown, K. R. Venie, M. S. & Woods, R. A. Journal of Metals, July 1995, pp20-23
55

2.5.1 High Strength Low Alloy (Micro-Alloyed Steels)
These steels have yield strengths in the range of 300-350 MPa for cold rolled
production and typically 550 MPa for hot rolled produce. As the name suggest, micro
alloying additions of titanium, niobium or vanadium are added to low carbon,
aluminium killed steel. This produces high yield strength by precipitation hardening
through the combination of alloying effects and thermo-mechanical treatment received
during the hot strip mill.
2.5.2 Rephosphorised Steels
Rephosphorised steels (currently used by Volvo Truck Corporation) have yield
strengths in the range of 190-269 MPa. These steels achieve their strength with the
additions of phosphorous (typically 0.1%) to an aluminium killed base steel. These
phosphorous additions provide increased strength by the means of solid solution
strengthening and have yield strengths up to 30% higher than plain carbon steels, with
an increase in cost of less than 10%34. A welding problem associated with these steels,
which are due to the increased phosphorous content, is the potential increase in
susceptibility to solidification cracking during laser welding. Microhardness
measurements in the heat affected zones (HAZs) have also indicated that
rephosphorised steel is harder, even with reduced carbon content, compared to plainor
carbon steel . These problems would be exacerbated at higher welding speeds; thus,
laser-welding speeds are usually reduced slightly in practice to eliminate this effect.
34 Hoult, S.H. Kerr, H.W. Spot Weldability of Rephosphorised Steels, Metal Construction, August 1982, pp426-43235 Sawhill, J.M. Jr Baker, J.C.: Welding Journal, 1980, 59, 19s
56

2.5.3 Bake Hardening Steels
This group of steels have a yield strength ranging from 160-260 MPa. These are
produced by vacuum degassing low carbon aluminium killed steels, and achieve higher
strength by ageing during the paint stoving operation. An increase in yield strength of
up to 40% can be achieved from the bake hardening process. This increase is known as
the ‘bake-hardening factor’ and is dependent on the specific steel grade and ageing
conditions.
2.5.4 High Strength Interstitial-Free (IF) Steels
High strength interstitial free steels have yield strengths in the order of 190-300 MPa.
Similar to Bake Hardening steels, these steels are vacuum degassed. This reduces the
carbon and nitrogen levels within the steels. The end result is a carbon content of
<0.0003%, which with strengthening from niobium, vanadium and titanium additions
results in a pearlite-free base metal structure.
57

2.6 Current Automotive Painting Systems
Continual research is being carried out to improve existing paint systems and to develop
more resilient paint systems. Although current automotive grades are galvanised to
achieve the requisite corrosion resistance, increasing demands for quality from the
customers, changes in the environment and more stringent legal requirements for less
harmful products and processes has led to the development of paint systems which can
meet very complex requirements. These systems must also provide a coating that is
acceptable for gloss, colour durability, cracking resistance, adhesion throughout all
layers, acid, chemical and scratch resistance36.
Even more important perhaps, is the surface condition and keying afforded by the base
material prior to the application of the paint system. This has led to a number of pre
treatments for zinc-coated automotive grades. A ‘general’ zinc-coated automotive steel
pre-treatment can be split into the following processes37.
2.6.1 Pre-cleaning
The purpose of pre-cleaning is the removal of contamination from the surface to be
painted. These contaminants include, oil, grease, scale, weld spatter and lubricants that
can be present due to previous manufacturing processes. In extreme cases the pre
cleaning may include blasting, polishing, pickling and solvent degassing. It should be
noted that the pre-cleaning stage does not provide any protection to the surface.
36 Jurgetz, A. Automotive Paint Performance, Bayerische Motoren Werke AG, Germany, Metal Finishing, October 1995, pp 53-5537 Murphy, M. Joseph, R. Introduction to Paint Application Systems, Application Methods, pp 161-166
58

2.6.2 Pre-treatm ent
Surface pre-treatments can include a combination of chemical cleaning and a
conversion coating. The puipose of a conversion coating is to improve the corrosion
resistance and to provide a surface with enhanced adhesion and acceptance of the
organic coating.
2.6.3 Dry-O ff
After pre-treatment the ‘wet’ parts are immediately transferred to a high-temperature
dry-off oven. For small, lightweight, metal parts the oven temperature can be as low as
121 °C. For larger, heavy parts or bulky constructions, the oven temperature may be as
high 204°C. The sole purpose of this ‘dry-off’ period is to evaporate the water as
quickly as possible to prevent flash rusting. It should be noted that in coating
operations where the parts are immersed into a dip tank containing a waterborne
coating, this ‘dry-off’ period might be eliminated.
2.6.4 Coating Application Methods
There is a wide choice of application methods available for both primers and topcoats.
The most extensively used coating deposition methods in automotive applications are
spray, dip, electro-deposition or electro-coating.
2.6.5 Curing Process
Drying is the process by which the solvents and/or water in the coating evaporates to
allow the film to achieve a ‘dry-to-touch’ or ‘dry-to-recoat state. Curing on the other
hand implies that the coating resin undergoes a chemical reaction, rendering the cured
film hard, abrasion resistant, and relatively inert to the environment (chemicals,
solvents, sunlight etc).
59

Hence, the integration of a new material into current automotive design will require
analysis of the materials’ paint ability and determination of the systems required to
produce a coating which meets the current standards for paint appearance and durability
testing.
In the case of dissimilar metal joints between stainless steel and zinc coated mild steel,
the presence of the passive film on the stainless steel surface may produce problems
with paint adhesion. Stainless steel may also require the use of different chemical
cleaning processes during the pre-treatment stage, which is required to produce suitable
adhesion of the organic coats.
Thus, to allow integration of stainless steel into automotive construction, the suitability
of current painting systems for coating stainless steel would need to be investigated;
more specifically, the performance of the pre-treatments and chemical cleaning prior to
the standard automotive scratch and durability tests.
60

2.7 Stainless Steel Paint Adhesion
Research conducted by Marples investigated the resistance spot welding of austenitic
stainless steel (1mm 304) to zinc-coated mild steel (1.2mm V1437)38. A number of
dissimilar metal spot welded samples were subjected to Volvo Truck Corporations’
current painting system and durability testing.
Dissimilar metal spot welded joints with vertical and horizontal joint orientation were
compared with 1.2mm V 1437 similar metal spot welded joints as the reference.
The dry and wet adhesion was tested using the cross-cut test method and the corrosion
resistance of the joints was tested using VICT (accelerated indoor corrosion test) and
scab (accelerated outdoor corrosion test)39.
The investigation resulted in the 1mm 304 stainless steel being approved for both wet
and dry adhesion. However, the accelerated corrosion tests revealed that increased
corrosion was evident on the dissimilar metal scab tested samples when compared with
the V1437 similar metal reference samples. This was attributed to increased galvanic
corrosion of the dissimilar metal joints, the zinc being consumed more quickly whenIQ
joined to stainless steel . The following images show the VICT exposed 1mm 304 -
1.2mm V1437 dissimilar metal joints and scab exposed tests compared to the similar
metal 1.2mm V1437 joints respectively.
38 Marples, M. Resistance Spot Welding of Autstenitic Stainless Steel to Galvanised Mild Steel, Unpublished Work, Sheffield Hallam Univeristy, 200339 Hedlund, J. Corrosion Test of Spot Welded Joints of Stainless Steel and Hot Dip Galvanised Steel, VTC. Engineering Report ER-511811, 16lh Oct, 2001, pp 1 -6
61

It can be seen in the VICT exposed dissimilar and similar metal corrosion comparison
that more corrosion is present on the surface of the dissimilar metal joint.
1mm 304-1.2m m V1437
1.2mm V1437 - 1.2mm V1437
Image 1 1mm 304 - 1.2mm V1437 at the top and the 1.2mm V1437 similar metal joint at the bottom - both VICT exposed
It can also be seen in the scab exposed dissimilar and similar metal corrosion
comparison that more corrosion is present on the surface of the dissimilar metal joint.
%
rff *.Mills >
i
Image 2 1mm 304 - 1.2mm V1437 at the top and the 1.2mm V1437 similar metal joint at the bottom - both scab exposed
Hence, it was concluded that a dissimilar metal lap joint between stainless steel and
zinc-coated mild steel would corrode at a higher rate than a zinc-coated mild steel
similar metal joint.
1mm 304 - 1.2mm V1437
1.2mm V1437 - 1.2mm V1437
62

2.8 Stainless Steel
Stainless steels were initially developed to improve the wear resistance of gun barrels
and were later developed to obtain resistance to corrosion40. However, stainless steels
also exhibit excellent mechanical properties, and in some applications, these mechanical
properties are as important as corrosion resistance in determining the life or utility of a
given structural component. Within the stainless steel family there are many different
types of stainless steels including martensitic, ferritic, austenitic, duplex and
precipitation-hardenable steels. Thus, with so many types of stainless steel, a wide
variety of mechanical properties can be achieved.
2.8.1 Austenitic Stainless Steel
Austenitic stainless steel has sufficient y-stabiliser, in the form of Ni, added to a Fe-Cr
alloy to produce a microstructure that consists entirely of f.c.c. austenite at room
temperature. The f.c.c. structure provides a tough, very ductile steel which work-
hardens rapidly when machined or cold formed. The f.c.c. structure provides the steel
with no impact transition temperature and thus can be used for cryogenic applications.
The austenitic stainless steels do exhibit a wide range of mechanical properties. These
steels, as stated, have an austenitic microstructure at room temperature and cannot be
hardened to any great extent by heat treatment, although they can be appreciably
strengthened by cold working. These steels exhibit good ductility and toughness even
at high strength levels. Austenitic stainless steels have lower melting points, higher
electrical resistance, lower coefficients of thermal conductivity, and higher coefficients
of thermal expansion than mild steels4142.
40 Brickner, K. G. Stainless Steels for Room and Cryogenic Temperatures, Selection of Stainless Steel, American Society for Metals, 196841 Leffler, B. Stainless Steels their Properties, 2nd revised edition42 Holmberg, B. Stainless Steels: Their Properties and their Suitability for Welding
63

2.8.2 Duplex Stainless Steel
Duplex stainless steel consists of two phases, austenite and ferrite, both about 50%. The
primary structure is ferrite and the secondary structure is austenite. The combination of
these two phases results in a very high yield and tensile strength as well as an excellent
resistance to chloride-induced stress corrosion and pitting41.
The structure of duplex stainless steel strongly depends on its chemical composition and
thermal history such as heat-treatment or heat input from welding.
The production of the duplex stainless steel microstructure (austenite/ferrite structure) is
formed as follows.
When the composition cools down from the liquid phase it starts to solidify as ferrite at
1450°C. Below 1300°C the austenite phase starts to form by nucleating at the grain
boundaries of the ferritic phase. An amount of austenite will be formed which is
dependent on the cooling rate. When the cooling rate is low there is a lot of time hence
a large amount of austenite will be formed. Alternatively when the cooling is high there
is very little time, hence only a small amount of austenite will be formed.
To obtain the best possible structure the material is eventually homogenised at about
1050°C and water quenched to maintain the optimum structure (about 50% ferrite and
50% austenite) and to suppress uncontrolled precipitation.
Duplex stainless steels have high resistance to hot cracking during welding, compared
with fully stable austenitic stainless steels.
64
2.8.2.1 Lean Duplex Stainless Steel
Lean duplex or more specifically, 2101 is a relatively new grade of stainless steel. It
possesses the same two phases, austenite and ferrite, again both about 50%. The main
difference of this steel when compared to standard duplex grades is, as the name
suggests, in the composition. The lean duplex grade has a lower nickel content which
reduces cost. The manganese content of this steel is increased, which in turn increases
the amount of soluble nitrogen. Hence, a balance is again struck between the austenite
and ferrite formers/stabilisers and the 50% ferrite and austenite structure can be
achieved.
65
2.9 Laser Welding Zinc Coated Steel
Many problems can occur when laser-welding zinc coated steels, especially in the lap
joint configuration. This is due to the low vaporisation temperature of zinc (906°C).
2.9.1 Butt joints
As explained in section 1, laser welding has been successfully used in the production of
tailor welded blank manufacture and in body-in-white welding applications, an example
of the former can be seen in Figure 2. The joint configuration used for laser welded
tailored blanks is the butt joint. Thus, the effect of the zinc coating is minimal. The
only impact on laser weldability is a slight reduction in welding speed compared to
uncoated steel of the same thickness. This is to allow for adequate suppression of the
plasma formed. Some consideration should be made towards preventing damage to the
focusing optics caused by the slight increase in spatter and potential of fume
condensation on the focusing optics. No other problems are associated with laser
welding zinc-coated steels in the butt joint configuration apart from the removal of the
zinc coating adjacent to the weld. The uncoated area of zinc-coated laser welded butt
joint is ~3-5mm; hence, the weld is cathodically protected by the sacrificial zinc
adjacent to the weld. As the tailored blank is painted, the reduction in corrosion is
minimal.
66
2.9.2 Lap joints
Research has shown that the presence of zinc at the interface of lap and hem joints
causes disruption to the laser welding process2543. If the sheets are intimately clamped,
the zinc vapour at the internal lap face has no means of escape other than through the
molten weld pool. As stated in section 2.4.1.1.1, the vapour pressure of zinc is very
high, thus, ejection of the molten weld metal occurs.
In practice this disruption is manifested as increased spatter during the welding process,
which causes blow holes and porosity in the laser weld bead. It can also reduce the
power absorbed by the work piece due to the formation of a dense plasma cloud, also
explained in section 2.4.1.1.1, which results in variable or reduced penetration.
Current automotive grades are zinc-coated to achieve the requisite corrosion resistance.
The two most commonly used zinc-coating types are:
• Electro-galvanised
• Hot-dipped galvanised
The main difference between these two zinc-coating types, besides deposition method,
is the thickness of the deposited zinc coating. Generally, hot-dipped galvanised
coatings are thicker (>5pm) than electro-galvanised (<5pm) and galvannealed coatings.
These thicker coatings exacerbate the problems mentioned above and consequently,
have provided the driving force to find potential solutions. These proposed solutions
can be split into the following categories:
• Introduction of novel clamping techniques
• Modification of sheets to be clamped
• Control of the welding process/parameters
43 Park, H. Rhee, S. Analysis of Mechanism of Plasma and Spatter in C 0 2 Laser Welding of Galvanised Steel. Optics and Laser Technolgy, 31, 1999, pp 119-126
67

One proposed solution is with the use of modified clamping systems. The purpose is to
introduce a gap between the sheets to allow the zinc vapour to escape from the internal
lap face. This could be achieved by reducing the clamping force or the use of
intermittent point clamps along the length of the weld. The use of shims has also been
tried, although, this solution may produce problems with reproduction and does not lend
itself to automation.
A more novel approach to sheet clamping has been with the use of a spring-loaded
roller positioned adjacent to the weld. Volvo currently uses this system in the
production of a roof joint to create a gap on one side of the lap joint, thus allowing the
zinc vapour to escape the internal lap face in front of the laser beam.
Modification to the pre-welded sheets may also provide a solution with the introduction
of ‘dimples’ by mechanical stamping. This system, aims to provide a gap between the
sheets whilst allowing clamping along the entire length of the lap joint. Again, the gap
introduced allows the zinc vapour to escape from the internal lap face.
One disadvantage of these potential solutions is the cost of the additional equipment
(spring-loaded roller) or the cost of introducing a further manufacturing step (sheet
dimple stamping) to introduce the gap.
Perhaps, the simplest and most cost effective method to overcome the problems
associated by welding zinc-coated lap joints lies with the inherent flexibility and control
of the laser welding system. It should be noted that the control of the laser welding
parameters, or manipulation of the optic beam delivery aim to overcome the problems
of porosity, blow holes and spatter by increasing the solidification time of the weld
bead, thus, providing sufficient time for the zinc vapour to escape through the weld
bead in its molten state.
The huge range of laser welding process variables, explained in section 2.3, may hold
the key to solving the problems of zinc-vapour evacuation. This may lie with
68

development of special welding parameters, perhaps involving pulsing of the laser
energy or the use of propriety gas mixtures. There have been investigations into the
development and use of energy dispersive laser optics capable of producing a twin-spot
laser output to permit additional venting (by slightly elongating the weld pool) of zinc
vapour from the weld pool, see Figure 18. This system may also have the potential to
be used to deliver a post-weld heat treatment in one welding operation.
WeldingDirection
Figure 18 Additional venting permitted by elongating the weld pool with the use of a ‘Twin spot’ laser beam
The problems of laser welding zinc-coated steels in the lap joint configuration are well
known. Hence, a set of guidelines has been generally accepted to aid the production of
high quality laser welds with zinc-coated steels. If the zinc-coating of the sheet is
<5pm, the sheets can be clamped with no gap at the interface; however, should the zinc
coating thickness be >5pm (hot-dipped galvanised automotive grades), it is advisable to
introduce a gap to allow for the evacuation of zinc vapour from the internal lap face.
Zinc Vapour
Elongated Weld Pool
69

2.9.3 Damage to the Focusing Optics by Spatter
Owing to the low vaporisation temperature of zinc (906°C), laser welding zinc-coated
steel produces more spatter than uncoated steel. One way to overcome potential
damage to the focusing mirror or lens is to increase the focal length of the laser welding
system when welding zinc-coated steel4445. This system for reducing damage to the
focusing optics has been employed by the Welsh Technology Centre, which currently
uses a focal length of 250mm for laser welding zinc coated steel. This reduces the
chance of damage to the focusing mirror or lens. The laser can also be reflected from
the mirror/lens through a nozzle to the work piece. The nozzle reduces the area below
the focusing optics and thus reduces the chance of spatter hitting and damaging the
mirror or lens. This is illustrated in Figure 19.
44 Naeem, M. YAG Laser Welding of Thin Sheet,Welding Metal and Fabrication, June 2000, pp 6-10 4:1 Bratt, C. Discussions, Laser Welder Project Leader, Welsh Technology Centre, 2000 - 2002
70

LaserBeam
65mm
250mm
ZincSpatter
Figure 19 Schematic showing two laser welding ‘set-ups’, a) shows a laser set-up with a high focal length and b) with a
reduced focal length, both systems have a mirror optic beam delivery and show the effects of spatter
It should be noted that the focal lengths shown in the above figure, are currently used by
the Welsh Technology Centre Trumpf 5kW CO2 Laser and Coventry Universities’
Rofin-Sinar 2kW CO2 laser.
Another way to use mirror optics without a nozzle and a short focal length is to use an
optically transparent system that protects the focusing mirror from the spatter. One
such system is the ‘Air Knife’.
71

2.9.3.1 Air Knife
It is possible to use a reduced focal length with a mirror beam delivery whilst removing
any possibility of damage to the focusing mirror. The air knife attachment is placed at
the bottom of the aperture below the focusing mirror and blows compressed gas, usually
air, across the face of the aperture. This jet or ‘knife’ of compressed air allows the laser
beam to pass through uninhibited (optically transparent) whilst blasting any spatter that
may come into contact with the gas, thus, protecting the focusing mirror. This system is
currently used with Coventry University’s Rofin-Sinar 2kW CO2 laser welder which
uses a focal length of 65mm.
72

Incoming Laser beam
]□[ ido <^ ^ " ~ T dP~'
^■i / ‘DI! <C==< 3 = = p d f l < !~.........Ian < =
< 2 ■ inn < C 7 - ian << $ -— — hqp < inn < C== s3Dn <^==2D[1 < =
]Q0 < 2 s =ZZ3DD . J DD
ran < = = ^ n B ^ ^ ' X =□□0 < = 3 I \ \ ^ IDI < C - W=]Qi < = i n K / ^
65mm Focal length
Figure 20 Schematic diagram showing a typical air knife assembly used to protect the focusing mirror when welding zinc-
coated steel with a small focal length
Figure 20 shows that the open aperture below the focusing mirror is much closer to the
sample than the stated focal length of the system. Without protection from the ‘air
knife’ the spatter would be channelled up through the open aperture and onto the
focusing mirror.
73

2.10 Laser Welding Stainless Steel
As explained in section 2.6, there are a number of different types of stainless steel.
Laser welding has been successfully used to produce joints incorporating most of these
steel types. Each type of stainless steel however, presents different welding problems,
some of which have been characterised.
2.10.1 Austenitic Stainless Steels
Austenitic stainless steels are generally suitable for laser welding. Lower thermal
conductivity of these steels grades allows slightly higher welding speeds to be achieved
for the same laser welding parameters, e.g. welding power, focusing system etc, in
comparison to mild steels. These higher welding speeds result in higher cooling rates
due to the lower general heat input and are consequently advantageous in reducing the
susceptibility to corrosion caused by the precipitation of chromium carbides at grain
boundaries.
2.10.2 Duplex Stainless Steels
Laser welding of duplex and super-duplex stainless steels is also possible. The steel
composition, laser parameters and shielding gas type can influence phase distribution in
the weld metal. The low general heat input (higher cooling rate) associated with laser
welds can reduce the proportion of austenite present in the weld metal and heat affected
zone, which may impair the corrosion properties of the joint. One potential solution to
increase the austenite content in the weld metal is to use nitrogen as a shielding gas, as
this may increase the stability of the austenite phase during welding.
74

2.11 Laser Welding Aluminium
As stated in sections 1 and 2.5, the aluminium alloys are currently the most researched
alternative material for integration into existing automotive design; and as laser welding
has been identified as a key technology (which offers distinct advantages over
conventional joining technologies) the laser welding of aluminium has been extensively
researched.
In general, aluminium alloys possess poor laser weldability4647, the main problems
associated with laser welding aluminium alloys being high surface reflectivity, high
thermal conductivity and volatilisation of lower boiling point constituents25.
The use of Nd:YAG lasers are generally employed to weld aluminium alloys as the
shorter wavelength of these lasers (1.06pm) compared to that of the CO2 lasers
(10.6pm) provides better coupling efficiency.
Research conducted by Pastor et al, revealed that the main problems with volatilisation
of lower boiling point constituents were associated with Mg loss during laser welding of
automotive aluminium grades. More specifically, Al-5xxx and Al-6xxx aluminium
alloys, which are solid solution strengthened with Mg and precipitation strengthened
with Mg2Si respectively. The volatilisation of Mg during laser welding of both these
alloy series affected the respective strengthening mechanism, which caused degradation
of mechanical properties.
These and other material related problems have led to weld bead and heat affected zone
cracking, degradation in mechanical properties and a general inconsistent welding
performance.
In extreme cases, the laser weld can possess lower hardness and strength than the base
material47.
46 Starzer, T. Ebner, R. Glatz, W. Ellermann, F. Kuhlein, W. Ellermann, W. Symposium onAutomotive Technology and Automation, Proc. 26th, Aachen, 131, 1993
75

2.12 Laser Weld Solidification
The solidification process exerts a great influence on the microstructure and
performance of welds . The type of weld fracture and corrosion behaviour is closely
related with phase chemistry, solute segregation and grain structure which is developed
during weld solidification49.
2.12.1 Austenitic Stainless Steel Solidification
Most austenitic stainless steels solidify as ferrite and transform to austenite on cooling
to room temperature. This mode of solidification with ‘primary ferrite’ has a superior
resistance to solidification cracking than primary austenite. This is attributed to reduced
wetting of boundaries by liquid films and the complicated crack paths these boundaries
form49.
The solidification mode is primarily determined by chemical composition, and is quite
insensitive to welding conditions (solidification conditions) unless the welding speed
becomes extremely high (laser welding).
The primary phase is either ferrite or austenite, and is associated with the equilibrium
primary phase as long as the solidification rate is within a range that conventional
welding practices employ. The compositional boundary between the primary ferrite and
the primary austenite should be at the equilibrium eutectic trough in the multi-
component system of interest. This boundary, however, shifts to higher Cr side as the
solidification rate increases, for example, in laser welding and electron beam welding48.
47 Ebner, R. Karaaslan, A. & Brandstotter, E. Laser Welding of Structual Components Made of Dissimilar Materials, pp 215 - 220.48 Koseki, T. Inoue, H. Ichikawa, K. Nogami, A. Prediction and Control of Weld Solidification in Steels and Ni-base Alloys. Keynote Adress, pp51-6044 Brooks, J.A. Thompson, A.W. Inf 1 Material. Rev, 36, pp 16, 1991
76

Consequently, the selection of the primary phase becomes non-equilibrium, where the
austenite as the primary phase is favoured over the ferrite at high cooling rates of
solidification50.
The solidification modes of austenitic stainless steel can be seen in Figure 21, where the
primary phase and the subsequent formation of secondary phases are major concerns.
SolidificationSequence
Primary
Structure
A mode AF mode FA mode F mode
fee
fully fee
bee
fee ♦ bee
□liquid fe e f f H b c c
Figure 21 Schematics of Solidification Modes of Austenitic Stainless Steel Welds48
The effect of various laser-welding process parameters on the solidifying
microstructures and associated cracking susceptibility were reported to be limited when
compared to the influence of composition51.
Prediction of the primary phase has been carried out using the Cr and Ni equivalents to
take into account the effects of multiple components during solidification52.
50 David, S.A Vitek, J.M. Int’l Material. Rev, 34, pp213, 198951 Pacary, G.M. Moline, M. Lippold, J.C. EWI Research Brief. B008, 199052 Suutala, N. Metall. Trans. A, 13A, pp2121, 1982
77

Further research has since been carried out to produce a diagram (Figure 23) where
values of %Fe and Cr-Ni equivalent ratios are compared with the eutectic compositions
taken from the Fe-Ni-Cr ternary liquidus diagram, see Figure 2253.
10 11 1? 1 3 H 1 5 1 6 17 1 8
N i c k e l e q u i v a l e n t
Figure 22 Relevant part of the Fe-Cre(,-Nieq ternary liquidus diagram for austenitic stainless steels with eutectic and solidus
lines'3
53 Yardy, J.W. Laursen, B.N. Microstructural Predictions for Laser Welded Austenitic Stainless Steels, pp89-92
78

Figure 23 predicts the primary solidifying phase for an alloy together with a rough
estimate of the laser welding speed necessary to avoid primary phase shift from ferrite
to austenite solidification.
69,5Primary Ferrite
Primary Austenite68,5
Vtr > 20mm/s
Vtr <20mfn/s
67,5 ’90
— ♦ — 100u.
66,5
65,5
64,5
1,71,651.61,551.51,451.4
( Creq = Cr+1.35Mo+1.5Si) ( Nieq = Ni+22C+14N+0.3Mn ) Creq/Nieq
Figure 23 Diagram lor predicting solidification mode from alloy composition for laser welded austenitic stainless steels.
Values of solidification velocity for the transition from ferritic to austenitic primary solidification, Vtr, are shown for the
alloys studies - 304 & 31653
Hence, it can be seen that alloys positioned above and to the right of the eutectic line
solidify as primary ferrite, and those below and to the left, as primary austenite. The
approximate welding speeds can also be seen.
Thus, the relationship found between solidification mode, transition velocity, and
composition was that an increase in either the %Fe content or Creq/Nieq ratio strengthens
the tendency towards primary ferrite solidification and also increases the laser welding
speed at which this occurs53.
79

2.12.2 Duplex Stainless Steel Solidification
The low general heat input of the laser welding system produces very high cooling rates
of approximately 1004°C/sec at the weld centre line. These high cooling rates, when
laser welding duplex stainless steels, lead to high ferrite levels in the solidified weld
bead34. Research conducted by Gooch et al, investigated the properties of resistance
and laser welds in 2304 duplex stainless steel. It was found that autogenous 1mm 2304
laser welds contained approximately 90% ferrite, compared to the 30-40% ferrite
contained in the ‘as received’ condition. Similarly, the ferrite contents in the HAZ were
substantially ferritic55. The high ferrite content resulted in an increase in weld and HAZ
hardness from 276Hv to 304 and 286-290 respectively, also a reduction in the corrosion
resistance of the laser welded joints55.
Image 3 shows localised pitting in the HAZ of a 1mm 2304 laser weld tested in 150ppm
NaCl solution at 90°C.
There have been a number of techniques used to increase the austenite content of duplex
stainless steel laser welds. These include:
1. The use of a nitrogen assist shielding gas to increase the austenite content of the
weld metal56.
2. The addition of a high alloy filler (22Cr, 9Ni, 3Mo) to increase the austenite
content55.
Optimisation of process conditions has been seen to increase austenite content,
although, the use of a post weld heat treatment was required to produce a significant
increase54.
54 Bonolio, F. Giordano, L. Tiziani, A. Zambon, A. Microstructural Optimisation of Laser Beam Welded Duplex Stainless Steel, Florence, Associazone Italiana Di Metallurgia, Milan, Italy, ISBN:88- 85298-15-X, 1993, pp 3.251-3.25755 Gooch, T.G. Gin, B.J. Properties of Resistance and Laser Welds in UNS S32304 Duplex Stainless Steel. Duplex Stainless Steels 97, 5th World Conference, D97-024, pp 311-31956 Lawn, P. Deans, W.F. Shannon, G.J. Watson, J. Preliminary Investigation into the Laser Welding of Duplex Stainless Steel, Proc. Duplex Stainless Steels 94, Glasgow, UK, TWI Abington, 1994, paper
80

One recommendation made by Gooch et al, is that the high nitrogen duplex stainless
steels are the preferred choice for laser welding, the welds produced being suitable for
mildly aggressive media55.
Image 3 Pitting in the HAZ of a laser weld tested in 150ppm NaCl solution at 90°C (top image x 35 & bottom x 130)55
81

Research conducted by Wray investigated the austenite contents of a number of
resistance spot welded duplex stainless steels. The results revealed that higher austenite
contents were present for the leanest grade of duplex stainless steel 2101 in comparison
with the higher alloyed duplex stainless steels (2304, 2205, 2507). This was attributed
to the increase in nitrogen content of the 2101 which had a greater mobility during the
solidification process and thus provided the highest spot weld austenite content. As a
consequence of the increased austenite content, the 2101 spot weld possessed the lowest
hardness of the four duplex grades tested57.
^ Wray, T. Resistance Spot Welding of Duplex Stainless Steel, Transfer Report, Sheffield Hallam University, 2002
82

2.12.3 Low Alloyed Steel Solidification
The main feature of laser welds in plain carbon or low alloyed steels is the pronounced
hardness increase in the melt zone and the heat affected zone (HAZ)47.
This increase in hardness is attributed to the phase transformation to martensite during
the rapid melt zone solidification subsequent to laser welding.
The properties of low alloyed carbon steels, for example, depend on the cooling rate in
the critical temperature range from 800 - 500°C. In the case of laser welding this
temperature range is usually passed within 0.5 - 2 seconds, which results in martensitic
transformation4758.
The hardness of martensitic microstructures generally depends on the carbon content59,
which is also true of laser welds47. The relationship between the weld metal hardness of
low alloyed carbon steels as a function of the carbon content can be seen in Figure 24.
This figure shows that for a martensitic structure, increasing the carbon content gave a
pronounced increase in hardness.
88 Ebner, R.E. Brandstatter, H. Klampf. Proceedings 26th Int Synopsium on Automotive Technology and Automation, Aachen, 349, 199359 Pickering, F.B. Pysical Metallurgy and the Design of Steels, Applied Science Publishers Limited London, 1978
83

1000
9 0 0 -U p p e r limit
8 0 0 -
7 0 0 -
to>x 600-cov>®c■s(0-CVik.
500-
® 400- o >
300-
2 0 0 -
1 0 0 -
0.0 0.1 0.2 0.40.3 0.5 0.6
Carbon content [wt.%]
Figure 24 Hardness of the weld metal of low alloyed carbon steels as a function of the carbon content47
The result of the high weld and HAZ hardness is that the tensile strength of laser welded
butt joints in low alloyed carbon steels usually equals that of the parent material or that
of the softer material in a dissimilar metal butt joint47. However, the elongation to
fracture is reduced as the hard weld does not contribute to the plastic deformation47.
Similar trends have also been seen for the fatigue properties of low alloyed carbon steel
laser welds, which usually show no loss in fatigue strength compared to the parent
material4760, if the welds are free of large defects.
It should be noted that exceptions are found in laser welded materials which can exhibit
a pronounced hardness loss in the heat affect zone, for example, quenched and tempered
steels with a high hardness level, also some aluminium alloys47.
60 Schutz, H. Szinjur, K. M. Radlmayr, H. Mildner, W. Schiefermuller: BHM 136, 430, 1999
84

2.13 Factors Affecting Weldability
As well as the laser welding process variables, there are a large number of other factors
that affect weldability. When dissimilar metal welding austenitic or duplex stainless
steel to zinc coated mild steel, these factors, outlined below, become even more critical
and compromises are often necessary.
2.13.1 Thermal Conductivity
When welding dissimilar metals differences in thermal conductivity can have a
profound effect on the shape and structure of the weld bead. Due to the nature of the
laser welding process, the heat is applied to a small area on the surface of the material
and then transferred through the material by conduction17. In a lap joint configuration
the thermal conductivity properties of the material on the top and the bottom of the lap
joint will affect the size, shape and thickness of the weld bead produced and, to a lesser
extent, the penetration achieved for a given power and welding speed. The typical
thermal and electrical properties of AISI 304, 2205, 2101 and mild steel can be seen in
Table 2 41 42 61.
61 Bolton, W. Engineering Materials Pocket Book, Butterworth-Heinemann, 1989
85

2.13.2 Thermal Expansion Coefficient
With any welding process residual stresses can pose great problems. This is especially
true when welding dissimilar metals with different coefficients of thermal expansion.
Austenitic stainless steel has a higher expansion coefficient compared to that of mild
steel. Thus, in any welded joint comprising these two materials, the stainless steel will
be more prone to buckling and warping and will contract more than the mild steel on
cooling. This greater contraction will result in higher residual stresses and increase the
possibility of distortion and solidification cracking. High tensile residual stresses may
severely reduce properties such as fatigue life. The thermal and electrical properties of
austenitic and duplex stainless steel and mild steel can be seen in Table 2 41 42 61. The
thermal and electrical properties of 2101 can also be seen in this table. This grade of
duplex stainless steel is considered in section 2.8.2.1.
Steel Thermalexpansion(xlO'6/°C)
200 -600°C
Thermalconductivity
(W/m°C)20°C
Resistivity(pQ.m)20°C
304 1 7 -1 9 12-15 0.60-0 .752205 13 20 0.70-0 .852101 16 0.75Mild steel 12 64 0.16
Table 2 Thermal and electrical properties of 304, 2205 and mild steel.
86

2.13.3 Metallurgical Characteristics
Laser welding is characterised by its low specific heat input and high welding speeds;
thus, the cooling rate is very high. Recent modelling studies indicate that the cooling
rate from 800°C to 500°C in the HAZ of a HSLA steel is more than 100°C/s31. High
cooling rate may result in deleterious phase transformation in the HAZ. Post weld heat
treatments are seldom used with the laser welding process and add additional cost and
time to fabrication.
When welding stainless steel, it is preferable to cool the material quickly to avoid the
precipitation of Cr23C6 , i.e. chromium carbide, as high cooling rates help to avoid
sensitisation. Precipitation of chromium occurs at grain boundaries during cooling from
800 - 550°C and will produce areas denuded in chromium or “sensitised” adjacent to
the weld41. These denuded areas will be susceptible to intergranular corrosion, as no
passive film will form. On the other hand, high cooling rates may cause problems in
many ferrous alloys by promoting martensite transformations which may produce
higher residual stresses and be susceptible to hydrogen-induced cold cracking; however
this also results in a smaller HAZ size.
Thus, there are a number of considerations to be taken into account when welding
materials with such different properties and characteristics. There is also the potential
of deleterious phases being present in the weld when dilution of austenitic stainless steel
and mild steel occurs. The susceptibility of the duplex stainless steel to heat treatment
may further exacerbate this problem when welded to mild steel. The dilution of the
stainless steel will result in lower chromium and nickel content in the weld bead. As
these elements stabilise ferrite and austenite phases (respectively) in the steel, they have
a direct effect on the structure and phases produced, see Figure 25.
87

A u s t e ni tc
5% FFer r i t i c-Aus t en i t i c
Ferri t ic1 0 % F
M a r t en s i t i c 3 1 6 LN 0 % fe r r i t e in w r o u g h t , : i nn e l< d m a t e r i a l
3 17LM a rte nsi t ic-A u s t e n itic
304L N
2 0 % F
2 5 0 7
2 3 0 4
m mIf 41 0 8 0 % F
1 0 0 % FM + F
N i - e q u i v a l e n t = % N i +3 0{ % C + % N) +0 .5 (% Mn + % Cu + % Co) 26
16 18 20 22 24 26
C r - e q u i v a l e n t = % C r + 1 ,5% Si +% Mo
Figure 25 The Schaeffler Delong diagram41
88

2.13.3.1 Liquid M etal Embrittlement
The intimate surface contact between the stainless steel and zinc coated mild steel may
produce problems associated with environmentally assisted cracking. Liquid metal
embrittlement (LME) cracking of austenitic stainless steels by molten zinc has been
seen in many dissimilar metal joints when austenitic stainless steel is welded to
galvanised steel .
There are at least four distinct forms of liquid metal embrittlement:
Type 1 Instantaneous fracture of a metal under an applied or residual tensile stress
when in contact with certain liquid metals. This is the most common type of LME.
Type 2 Delayed failure of a metal when in contact with a specific liquid metal after a
certain time interval at a static load below the ultimate tensile stress of the metal.
This form involves grain-boundary penetration by the liquid metal and is less
common than type one.
Type 3 Grain-boundary penetration of a solid metal by a specific liquid metal, which
causes the solid metal to eventually disintegrate. Stress does not appear to be a
prerequisite for this type of LME in all observed cases.
Type 4 High-temperature corrosion of a solid metal by a liquid metal, causing
embrittlement, an entirely different problem from types 1 to 3.
62 Bruscato, R. M. Liquid Metal Embrittlement of Austenitic Stainless Steel when Welded to Galvanised Steel, Welding Research Supplement, December 1992, page 455 - 459
89

There are two types of interactions between molten zinc and austenitic stainless steel
that have been reported63.
Molten zinc slowly erodes unstressed 300 series stainless steel at 419°C to 570°C
penetrating (diffusing) primarily along the grain boundaries in a relatively slow manner.
This phenomenon has been designated ‘Type I* embrittlement.
‘Type IF embrittlement occurs in stainless steel above 750°C when it is stressed and
exposed to molten zinc. It is characterised by extremely rapid crack propagation
perpendicular to the applied stress. This phenomenon is described as classic liquid
metal embrittlement (LME).
Important microstructural factors that affect environment sensitive cracking of
austenitic stainless steels are grain size, cold work (dislocation substructure, martensite
formation), sensitisation, segregation, 8-ferrite and radiation damage.
The only way to completely prevent this phenomena when dissimilar metal laser
welding austenitic stainless steel and zinc coated mild steel is to remove the zinc from
the surface of the mild steel prior to welding.
63 Metals Handbook, ninth edition, vol.l 1, Failure Analysis and Prevention, ASM page.236 - 237
90

2.14 Weld Geometry
The inherent flexibility of the laser system coupled with the ability to use
NC/CNC/Robotics devices allows many welding patterns to be used64. As well as
complex weld patterns; complex weld configurations can also be produced. This
provides the ability to weld pre-formed sheets. The lap joint configuration is usually
utilised due to the increased fit-up flexibility afforded from the overlap. Complex weld
configurations utilise robotic laser control with up to six degrees of freedom axis.
These systems, when coupled to a computer program can complete a ‘trial weld’ to
allow a fine adjustment of the focal length and weld position etc. These systems can be
used for mass production runs with very high accuracy and reproduction.
Figure 26 and Figure 27 show that the use of more complex welding geometries can
improve fatigue properties64. However, in existing large-scale operations, where fit-up,
reproduction and time are important factors; the single straight-line laser weld has the
greater potential for integration65.
ST R E SS RANGE (MPa)PATTERN 200 170 150 120 100
S in g le stra igh t-lin e 22,70019,600
48 ,000 169,300 169 ,4002 6 5 ,0 0 0
D ou b le stra igh t-lin e 48,700 68 ,2 0 0 103,700 5 6 9 ,7 0 0Triple stra igh t-lin e 162 ,900S a w to o th 20 ,800 41 ,600 109 ,800 159,300 6 8 6 ,8 0 0D o u b le circular-arc 19,800 109 ,800 91,900 5 3 1 ,0 0 0LLSG (7.6 m m )* 162,000
123,800160,400 184 ,200 2 ,010 ,1 0 0 * *
LLSG (12.5 mm)* 179,100 333 ,200 571 ,800 2,283,200* *Ladder 1,026 ,400
*W eld len g th **D id n ot fail in 2 ,0 0 0 ,0 0 0 c y c le s
Figure 26 Cycles to failure of different weld patterns in 0.61mm carbon steel64
64 Albright, C. E. Hsu, C. Lund, R. O. Fatigue Strength of Laser Welded Lap Joints, Materials Joining Technology, July 1989, MR890565 Smith, A. J. Nordberg, H. Cawely, J. Discussions with Supervisory Team, Sheffield Hallam University, 2000
91

tII11
{a) Straight-line pattern
=HffiFL-
(b) Triple strain ht-line pattern
(c) Longitudinal-line segment group pattern
(d) Ladder p^ttefn
(a) Sawtooth pattern
X T
(b) Double circular arc pattern
Figure 27 Visual key for the fatigue properties in Figure 266
92
^931

2.15 Joint Geometry
The flexibility of the laser welding system allows both butt and lap joints to be
successfully welded.
2.15.1 Butt Joint
Tailored blanks have made a great impact on pressed sheet components in the
automotive industry. Larger pressings can be made than with standard sized sheets, and
dissimilar steel types or thickness can be joined. The resulting benefits are improved
material use, potential weight savings and a reduction in subsequent assembly
operations.
Currently, resistance and CO2 laser welding are major welding processes used for
tailored blanks. Typical welding speeds are 7m/min for 6kW CO2 lasers.
In many applications where resistance spot welding has been traditionally used, laser
welding can offer many advantages, including single side access and reductions in
weight and costs by removing the overlap needed in resistance spot welding. It has
been estimated that up to 60 kg (130 lb) of steel can be saved from an automobile by
replacing resistance spot welding with laser welding and taking advantage of the design
flexibility66.
One problem associated with welding very thin sheets in the butt weld configuration is
edge preparation and fit up. Tests have shown that if the gap between 1.50mm plates
can be maintained at 0.2mm or less (which is possible with, for example, precision
sheared edges) then it is possible to achieve welds at speeds of lOm/min in a typical
tailored blank configuration using a 0.6mm spot size67. However, if the edges are not
66 DiPietro, F. A. Robotic Laser Welding Systems in the Automotive Proceedings of Laser Systems Application in Industry, Italy, 1990, page 103 - 11967 Sundnik, W. Radaj, D. & Erofeew, W. Computerised Simulation of Laser Beam Welding Formation Comprising Joint Gaps, J. Phys. D:Appl. Phys. 31 (1998), 3457-3480
93

precision sheared the gap between the plates can grow to at least 0.5mm or more over a
length of weld. This can result in concavity of the weld bead, see Figure 28, which
increases the stress ultimately reducing the tensile and fatigue properties of the weld.
a). 0.2 mm (b). 0.5 mm
Figure 28 Weld cross sections in butt joints with smaller (a) and larger (b) gap widths67
94

2.15.2 Lap Joint
The lap joint configuration removes the problems associated with edge preparation and
is the preferred configuration for laser welding; however, the configuration has some
inherent problems of its own.
2.15.2.1Joint Rotation
When lap joints loaded in tension, or tested either in lap-shear tests or in fatigue tests,
the eccentricity of the applied load introduced by the lap joint configuration results in
rotation of the lap joint. It can be seen from Figure 29 below that increasing sheet
thickness in the lap joint configuration would increase the eccentricity of the applied
load.
Figure 29 Lap joint schematic showing the increase of misalignment of the applied load with increasing sheet thickness
Grips
I i
95

Lap joint rotation, seen in Figure 29, is larger for thicker materials and has been seen to
reduce fatigue life68. The greater the eccentricity of the applied load, the more rotation
has to occur to align the applied load. This can be seen from Figure 30, which shows
the angle of rotation the lap joint is subjected to in order to align the applied load.
Figure 30 The rotation resulting from a lap joint loaded in tension*
68 Albright,C. E. Hsu, C. & Lund, R. O. Fatigue Strength of Laser-Welded Lap Joints, Materials Joining Technology, July 1989, MR890569 Dieter, G. E. Mechanical Metallurgy SI Metric Edition,McGraw-Hill Book Co (UK) Limited, ISBN 0- 07-100406-8
96

This lap joint rotation results in an applied bending moment to the joint70 71. The
applied bending moment of the lap can be explained by analysing the reaction forces
and moments that occur in the laser welded lap joint specimen70.
z
Figure 31 schematic diagram of reaction forces and moments that occur in a laser-welded lap joint70
It should be noted that Mr and Tr are reaction moment and force which develops for
TOrigid loading of the specimen .
70 Linder, J. Nilsson, K*. Meurling, F. Engstrom, H*. Larsson, M. Fatigue Strength of Laser welded Stainless Steel sheets, Swedish Institute for Metals Research, Sweden, *Lulea University of Technology, report no: IM-2000-529, ISSN: 1403-848/X71 Kaitanov, A. Investigation of Static and Fatigue Strengths of Stainless Steel Laser Welded Over-Lap Joints with Controlled Penetration, Experimental and Theoretical Study, St. Petersburg State Marine Technical University of Ocean Technology, 2001
97
The applied bending moment can be calculated from the following equation.
^ ( t +g) (Nmm)Ma := F •--------
2
Equation 2 Applied bending moment
where:
Ma - applied bending moment
F = applied force
t = sheet thickness
g - interfacial gap
Equation 2 assumes a similar sheet thickness. Where dissimilar sheet thickness is
present t is replaced with the following equation.
_ (tl + t2) (mm)2
Equation 3 Average sheet thickness
Where:
tl = sheet 1 thickness
t2 = sheet 2 thickness
The rotation and resulting bending moment change the mode of loading applied to the
lap joint from a mode-II to a mode-I. As it can be seen from Figure 32, mode-I is an
opening mode and is more detrimental to lap joint fatigue properties than mode-II.
Mode I M ode E M ode IHO p e n in g M ode Sliding M ode T e a r i n g Mode
Figure 32 Modes of loading which involve crack surface displacement6'

2.16 Fatigue Properties
Fatigue testing has been conducted by numerous researchers on similar metal laser
welded lap joints7071. There are two main types of stress life fatigue data that can be
produced to assess a joint’s fatigue properties. These are high stress-low cycle fatigue
and low stress-high cycle fatigue. The selection of the type of testing required depends
on the level of stress the joint will be subjected to in service. However, if time (test
frequency at resolvable load) and money are critical factors, high stress-low cycle
fatigue can be conducted to produce a series of results that can be extrapolated to give
an indication of the joint fatigue properties at lower stress and higher cycles. In some
situations this may be feasible, as the scatter of cycles to failure increases at higher
fatigue lives, but, obviously, there is no substitute for conducting the tests and
generating the results at these lower load levels and higher cycles.
Although research has been conducted to determine the fatigue properties of laser welds
in excess of 2xl06 cycles (spot welds fatigue properties have been produced at lOxlO6
cycles) there is very little data for the statistically valid mean fatigue strength of laser
welds at pre-assigned cycle lives, for example, 2xl06 cycles.
If the joint fatigue property of interest is the mean fatigue strength at a pre-assignedzr
cycle life, for example 2x10 cycles then a test method must be employed to generate
the results and determine the mean fatigue strength whilst accounting for the test scatter.
One method which allows the determination of a joint’s mean fatigue properties is the
staircase method. This method also allows the mean fatigue properties to be validated
statistically.
99

There is no current literature on similar metal laser welded lap joint mean fatigue
properties. Research to determine the statistically valid mean fatigue properties (2xl06
cycles) of spot welded joints has been conducted by Marples and Wray, who
investigated dissimilar metal joints between stainless steel and zinc coated mild and
similar metal duplex stainless steel joints respectively3872.
The majority of similar metal laser welded lap joint fatigue properties are characterised
by three or more load or stress ranges, with three or four tests at each load or stress
range. These results are then used to insert trend lines and thus, indicate the fatigue
properties at higher cycle lives.
The following fatigue results from previous work, here, are presented using the line load
range unit (unless otherwise stated). This is simply the applied load range per unit
length and allows comparison of dissimilar thickness joints on a line load bearing basis.
See section 4.6 for a comprehensive explanation of the line load range unit.
72 Wray, T. Resistance Spot Welding of Duplex Stainless Steel, Doctoral Thesis, Sheffield Hallam University, 2004
100
2.16.1 Similar Metal Laser Welded Stainless Steel Fatigue Properties
Research conducted by Linder et al, investigated factors affecting laser welded stainless
steel (cold rolled SS2333 austenitic stainless steel) lap joint fatigue properties70. The
welds were produced using an Nd:YAG laser producing a maximum power of 3kW at
the work piece. The results were presented using Pmax (kN)/cycles to failure.
The following graph shows the effects of weld width on the fatigue properties of similar
metal stainless steel laser welded lap joints.
10 i
z
CL
X se rie s 3, 1.0mm /1.0m m, no gap, w= 1.3mm
A se rie s 4, 1.0mm /1.0m m, no gap, w =0.6m m
10 000 100 000 1 000 000 10 000 000Cycles to failure
Graph 1 Effect of weld width on laser welded stainless steel lap joint fatigue properties70
It can be seen that for the same sheet thickness and no interfacial gap, increasing the
weld width (between the sheets), increases the fatigue properties of the lap joints.
WeldWidth
101

The following graph shows the effect of interfacial gap on the fatigue properties of
similar metal stainless steel laser welded lap joints.
100■ se rie s 3 , 1 .0m m /1.0m m , no gap, w =1.3m m
♦ se rie s 2, 1.0m m /1.0m m , gap, w= 1.3mm
X se rie s 5, 2 .5m m /2.5m m , no gap, w =1.2m m
A se rie s 6, 2 .5m m /2.5m m , gap , w= 1.7mmF""lZ
X1Q.
R=0.05
10 000 0001 000 000100 00010 000Cycles to failure
Graph 2 Effect of interfacial gap on laser welded stainless steel lap joint fatigue properties70
Graph 2 shows that the presence of an interfacial gap between the sheets reduces the
fatigue properties of the respective lap joint configuration. It can also be seen that the
trend lines for the 1 mm/1 mm, no gap, w= 1.3mm and 2.5mm/2.5mm, gap, w=l ,7mm
appear to diverge at approximately 1.6 x 10⁶ cycles. This illustrates the large influence
of sheet gap on the high cycle fatigue properties. Linder et al concluded that increasing
the gap from ~0mm to 40% of the sheet thickness reduced the allowable fatigue load by
-40% to obtain a similar number of cycles to failure70.
102

The following graph shows the effect of sheet thickness on the fatigue properties of
similar metal stainless steel laser welded lap joints.
100■ Series 1, 1.0mm/1.0mm, no gap, w=0.8mm
X s e r ie s 5, 2 .5m m /2 .5m m , no g ap , w =1.2m m
♦ series 7, 1.0mm/2.5mm, no gap, w= 1.0mm
zXnE£L
R=0.05
10 000 100 000 1 000 000 10 000 000Cycles to failure
Graph 3 Effect of sheet thickness on laser welded stainless steel lap joint fatigue properties70
Graph 3 indicates that increasing the sheet thickness of even one of the sheets improves
the fatigue properties of the similar metal stainless steel lap joint. Linder et al stated
that the amount of rotation depended primarily upon the sheet thickness, since the
resistance to bending of a sheet is proportional to the thickness squared70. It should be
noted that Graph 3 not only shows the fatigue strength influence of sheet thickness, but
also the affect of weld width.
103

Similarly, research conducted by Kaitanov revealed that improved 3mm 304 similar
metal laser welded lap joint fatigue properties were achieved with a wide (as opposed to
a narrow) weld width, see Graph 487.
1000
s 100
■ Single wide seam pattern o Single narrow seam pattern
10000 100000 1000000 10000000Cycles to Failure
Graph 4 3mm 304 lap joint fatigue property comparison with a wide and narrow weld width87
Kaitanov also investigated the effects of a double narrow weld seam pattern on the lap
joint fatigue properties of 3mm 304 austenitic stainless steel87. The results showed
higher fatigue properties were achieved with the double narrow weld seam pattern as
opposed to the single narrow weld seam pattern, see Graph 5. A similar trend can be
seen in section 2.14, through the research conducted by Albright et al, which shows
higher lap joint fatigue lives were achieved at the same stress level for the double weld
seam when compared to the single weld seam configuration.
104

1000
5 ioo
■ Double narrow seam pattern o Single narrow seam pattern
10000 100000 1000000Cycles to Failure
Graph 5 3mm 304 laser welded lap joint fatigue comparison for double and single narrow weld seam patterns87
Thus, it can be seen that higher fatigue properties were achieved with the double weld
configuration.
105
Kaitanov also found that similar fatigue properties were achieved with both the double
narrow seam penetration and the single wide seam pattern. However, the weld widths
were not characterised during this investigation.
1000
100
■ Double narrow seam pattern
a Single wide seam pattern
10000 100000 1000000 10000000Cycles to Failure
Graph 6 3mm 304 lap joint fatigue comparison between a double narrow and single wide seam pattern
106

2.16.1.lL aser W elded Lap Joint Fatigue Failure Criteria
The fatigue failure criterion has to be selected carefully to provide reproduction of tests
to allow comparison of the fatigue data produced. For resistance spot-welds, the fatigue
failure criterion is usually determined by a pre-assigned cyclic elongation, for example,
2mm. This is due to the nature of spot weld fatigue failures, where fatigue crack
initiation at the periphery of the nugget causes plastic deformation, rotation and
appreciable elongation prior to sheet separation.73.
Similarly a fatigue failure criterion has been assigned to laser welded lap joints. Tests
have been carried out to determine the fatigue test specimen stiffness over the duration
of a fatigue test. These tests show that the lap joint stiffness dramatically decreases
prior to failure and sheet separation, see Figure 33. Thus, the fatigue failure criterion
has been defined as total sheet separation70.
80 -I
70 -
| 60 -
0 ' . i ■ *-------- --------- > ---------------- ---—»0 200000 400000 600000 800000 1000000 1200000 1400000 1600000
No cycles
Figure 33 Graph showing the reduction of lap joint specimen stiffness prior to fatigue failure
73 Marples, M. Resistance Spot Welding of Autstenitic Stainless Steel to Galvanised Mild Steel, Unpublished Work, Sheffield Hallam Univeristy, 2003
107

2.16.2 Similar Metal Laser Welded Mild Steel Fatigue Properties
Linder et al compared the fatigue properties of similar metal stainless steel laser welded
lap joints with similar metal carbon steel laser welded lap joints74. In order to normalise
the results to allow fatigue comparison of dissimilar thickness joints with and without
interfacial gaps, the results were presented using nominal sheet stress and the calculated
applied bending moment (Equation 2). The use of the applied bending moment allows
the interfacial gap to be used as a damage parameter; however, the disadvantage is that
sheet thickness has to be considered separately.
180
160
140nT0.2 120<n</>® 100
3 80
re 60 co 40
20
0
X 'MD
o o <$>
oo
ua j.* ♦
□ Series 1, 1.0mm/1.0mm, no gap, w=0.8mm
O Series 2, 1.0mm/1.0mm, gap, w=1.3mm
A Series 3, 1.0mm/1.0mm, no gap, w=1.4mm
X Series 4, 1.0mm/1.0mm, no gap, w=0.6mm
■ Carbon steel, 0.9mm/0.9mm, no gap, w=0.5mm
A Carbon steel, 0.9mm/0.9mm, no gap, w=0.7mm
♦ Carbon steel, 0.9mm/0.9mm, no gap, w=0.9mm
xx xnnM D
ooo
10 000 100 000 1 000 000Cycles to failure
10 000 000
Graph 7 Nominal sheet stress stainless steel/carbon steel laser welded lap joint fatigue comparison70
Thus, it can be seen that higher fatigue properties were achieved by the carbon steel
laser welded lap joints in comparison to the stainless steel lap joints. Even with a wider
weld between the sheets, the lmm/lmm, no gap, w=1.4mm stainless steel fatigue
properties were lower than the carbon steel grades, which all possessed lower weld
widths.
74 Larsson, J.K. Abdulwahab, F. Meurling, F. Fatigue Properties and FE-Simulation of Laser-Welds, Proc. 7th Nordic Conference in Laser Processing of Materials (NOLAMP), eds Kujanpaa, K. and Ion, J. vol 1, pp 55-61, 1999
108
It should be noted however, that the use of the nominal sheet stress increased the carbon
steel similar metal joint fatigue properties, as the sheet thickness was 0.9mm in
comparison to the 1mm stainless steel fatigue properties.
The applied bending moment fatigue comparison can be seen in Graph 8 below.
CCD
EoEO)cc
|aa.<
4500
4000
3500
3000
2500
2000
1500
1000
500
0
O <$>
□ Series 1, 1.0mm/1.0mm, no gap, w=0.8mm O Series 2, 1.0mm/1.0mm, gap, w=1.3mm A Series 3, 1.0mm/1.0mm, no gap, w=1.4mm X Series 4, 1.0mm/1.0mm, no gap, w=0.6mm ■ Carbon steel, 0.9mm/0.9mm, no gap, w=0.5mm A Carbon steel, 0.9mm/0.9mm, no gap, w=0.7mm ♦ Carbon steel, 0.9mm/0.9mm, no gap, w=0.9mm
-X-fiA m s
10 000 100 000 1 000 000 Cycles to failure
10 000 000
Graph 8 Applied bending moment stainless steel/carbon steel laser welded lap joint fatigue comparison70
It can be seen that when the applied bending moment is used as a damage parameter, the
scatter decreases and the similarity between stainless steels and carbon steels increases.
The conclusion drawn was that the applied bending moment could be used as a damage
parameter for the assessment of lap joint fatigue properties70.
109

2.16.3 Similar Metal Laser Weld Fatigue Failure
Similar metal laser welded lap joint fatigue failure was found to occur at the weld edge
fusion line at the internal lap face. This was found for both similar metal stainless steel
and carbon steel lap joints and was insensitive to microstructure, with fatigue failure
being observed in the parent material, heat affected zone and in the laser weld70,71,74.
Research by Linder et al revealed that fatigue failure occurred at the weld edge (fusion
line) between the sheets and propagated through the sheet approximately perpendicular
to the applied load70. The initiation angle was observed to be approximately 75 - 80°
from the centre of the specimen and is illustrated in the following image.
Image 4 Fatigue crack initiation angle of a similar metal laser welded stainless steel lap joint
110

2.16.4 Finite Element Analysis - Similar Metal Lap Joints
In order to understand how sheet thickness, interfacial gap and weld width can affect the
fatigue properties of laser welded lap joints, research using FE analysis has been
conducted to determine the effect joint rotation has on the stress distribution during
similar metal, similar thickness lap shear or lap joint fatigue loading.
Finite element analysis of lap joints under a static load has been conducted by
Kaitanov71. Figure 34 is an FE stress analysis of a laser welded lap joint, which shows
the stress distribution present in the lap joint under an applied static load of 15kN. The
simulated laser weld is in 3mm 304 and has a width of 0.86mm71.
Figure 34 FEA stress concentration distribution in a statically loaded 3mm laser welded lap joint71
It can be seen that the greatest stress, depicted by the area in purple, runs along the
internal lap face of the two sheets and across the weld width between the two sheets.
Finite element simulation of laser welds during crash testing also showed the greatest
stress was present at the internal lap face75. This can be seen from the FEA plots in
Figure 35, which show the effective plastic strain and von Mises effective stress at 2mm
displacement for a 1mm DDQ steel similar metal laser welded lap joint subjected to a
lOm/s impact velocity.
75 Melander, A. Finite element simulation of crash testing of laser welded joints, Swedish institute for metals research, IM-2000-062, ISSN: 1403-848/X
111

MI'lTV? f l l f - V.r« r :-H • i n c ttn »tf t> m m s st««
<t 40Atr-\«xh?-i>* i«ita wstt-W: «*w*‘nj*|2* #ll~7£.f* ItHl: 17,* V?:i&
Figure 35 Effective plastic strain von Mises effective stress
for a 1mm similar metal laser welder lap joint at 2mm displacement when subjected to a lOm/s impact load71
Similarly, it was found that the greatest von Mises stress occurred at the internal lap
face at the edge of the weld.
These FE analyses correlate with the similar metal fatigue failures positions
characterised by Linder et al.
112

Increasing the sheet thickness increases the stress concentration at the internal lap face.
This is the single most important lap joint fatigue property controlling factor as it
directly affects the applied bending moment.
There are two schools of thought for the effect of weld width on the fatigue properties
of laser welded lap joints. The first is that the weld width should equal the sheet
thickness or average sheet thickness for dissimilar thickness lap joints. This was
corroborated by Helin76, who carried out solid element analysis of the stress intensity
versus weld width for a 0.9mm laser welded lap joint. Figure 36 below shows the graph
of stress intensity versus weld width.
Stress Intensity vs Weld Width1,50
z
E"5CL2
(/>c0)c
in1,40
0,650.45 0,85 1,05 1,25
Weld Width [mm]____________________
Figure 36 Solid element analysis of stress intensity versus weld width for a 0.9mm laser welded lap joint
It can be seen that the lowest stress intensity was achieved with a weld width (between
the sheets) of 0.8mm, which was approximately 90% of the sheet thickness.
76 Helin, W. Finite element analysis of fatigue loaded laser welded lap joints, Swedish institute for metals research, Stockholm, Aug 2000, ISSN: 1403-848/X
113

The second school of thought, corroborated by the fatigue results of Linder et al states,
the wider the weld the higher the lap joint fatigue properties70. This is due to the
increase in weld width decreasing the average stress within the weld. This is shown in
Figure 37 below70.
Stress distribution in the laser weld at section A-A.
x
Figure 37 Schematic representation of the stress distribution for a shear loaded lap joint
As can be seen, the stress is highest at the weld edge in comparison to the weld centre,
thus, although increasing the weld width would reduce the average stress within the
weld; the effects are less pronounced when compared with sheet thickness and applied
bending moment.
114
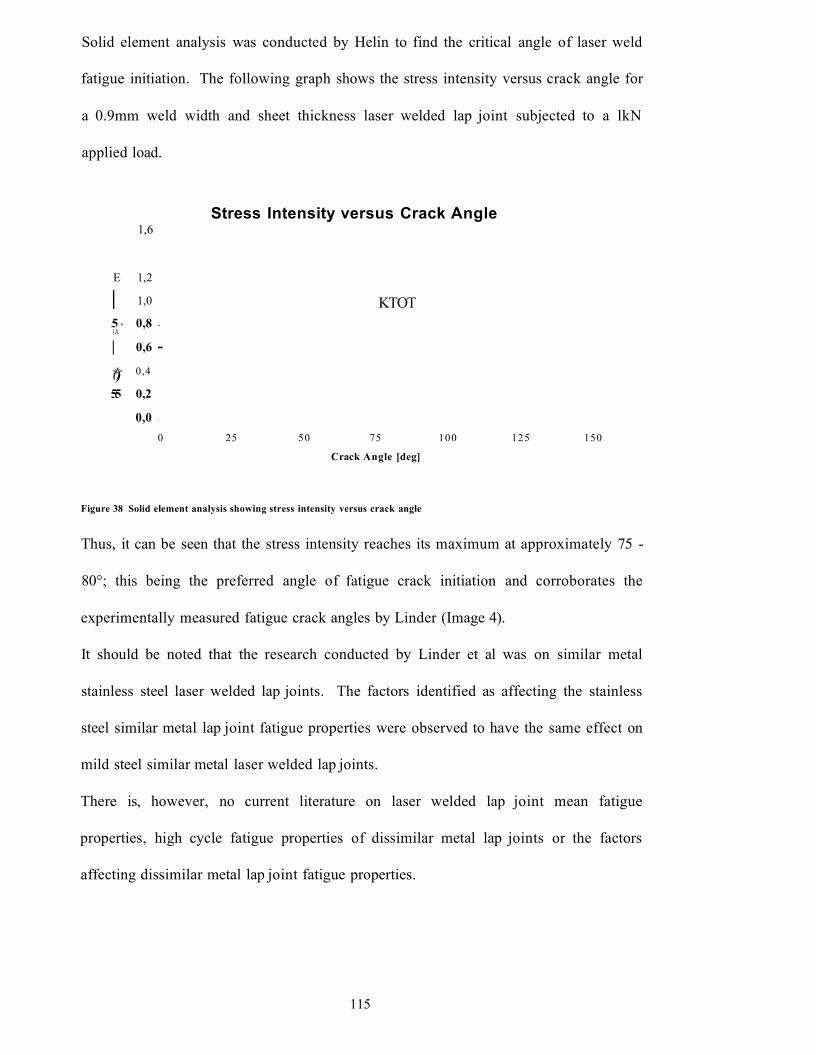
Solid element analysis was conducted by Helin to find the critical angle of laser weld
fatigue initiation. The following graph shows the stress intensity versus crack angle for
a 0.9mm weld width and sheet thickness laser welded lap joint subjected to a lkN
applied load.
Stress Intensity versus Crack Angle1,6
E 1,2
| 1,0
.5 * 0,8 -(A
| 0,6 -</> 0,40)55 0,2
0,0 -
0 25 50 75 100 125 150
Crack Angle [deg]
Figure 38 Solid element analysis showing stress intensity versus crack angle
Thus, it can be seen that the stress intensity reaches its maximum at approximately 75 -
80°; this being the preferred angle of fatigue crack initiation and corroborates the
experimentally measured fatigue crack angles by Linder (Image 4).
It should be noted that the research conducted by Linder et al was on similar metal
stainless steel laser welded lap joints. The factors identified as affecting the stainless
steel similar metal lap joint fatigue properties were observed to have the same effect on
mild steel similar metal laser welded lap joints.
There is, however, no current literature on laser welded lap joint mean fatigue
properties, high cycle fatigue properties of dissimilar metal lap joints or the factors
affecting dissimilar metal lap joint fatigue properties.
KTOT
115

2.16.5 Analytical Modelling of Joint Rotation
Nordberg and McCann developed a simple analytical model using beam-bending
77theory . The model was used to evaluate the effect of different joint parameters on
joint rotation and the resulting development of the opening mode tensile load and or
peel stresses.
The load, P, was divided into a shear force, P*cos0 , and a peel force, T*P where 0 is
the angle of joint rotation. For small 0, P*cos0 = P
P*COS0
T*p
t P*cos0
' Xa
Figure 39 Schematic load distribution in a lap joint
The stress distribution in the sheet due to the shear load moment is found from
^a(x)dx = P and |cr(x) ■ x dx = 0 to be
< 7 =2P
2 -3 - , where x = distance from sheet interface.
77 Nordberg, H. McCann, S. Overlap Joining of Stainless Steel Sheets, AvestaPolarit Research Foundation publication, 2004
116

APresulting in a maximal stress at the inner surface of <j = — ,
t
2 Pa stress at the outer surface o ------
t
and the neutral line at x=2t/3
21The shear load create a moment M = — P3
Due to the symmetry, the calculated deflection by the moment and by the transverse
load must take out each other, Thus
2 q 2 a ?>
- t - P = T • P resulting in a value for the factor T = —3 2 El 3 El a
Using line load (P = P/b, b = width) and beam theory the rotation due to the moment
and the transverse force can be calculated as
M a 2 t - P a TP a2 P t a20M = ------- = --------------------- and 0T =
El 3 El 2 E l a 2 El
Since 0Total = 0M - 0Peell = 0 the total (net) rotation is
2 ' t - P a P t a _ P t a _ 2 -a 3 E I ~ 2 El ~ El ~ E - t 2 '
Thus,
2- z -a
Equation 4 Similar Thickness Rotation Angle Calculation
If there is a gap between the two sheets, the rotation angle 0, can be calculated using
Equation 4 and using Equation 5 to calculate the variable “z” if no interfacial gapis
present “z” is equal to one.
3 c 6 • t + 9 • cz = ------ 1- —-----------
2 t 6-t + 4-c
Equation 5 Interfacial Gap Variable
117
P = line load (N/mm)
a = “free” half-length of the specimen or sheets (mm)
t = sheet thickness (mm)
2c = distance between sheets or bondline thickness (mm)
0 = rotation in Radians
E = Elastic Modulus (190MPa) (MPa)
The model showed that for normal combinations of loads and sheet thickness (t), the
rotation rarely exceeded three degrees.
The limiting nominal stress for which this elastic model holds is local plasticity. In a lap
joint this occurs first at the inner fibre (the surface where the sheets join).
The fibre stress is
max
For a typical stainless steel with Rpo.2 = 300 MPa this means that the inner fibre of a 1.0,
1.5 and 2.0 mm thick sheet yields for a line load of 75, 112 and 150 N/mm. Beyond
these values the elastic theory starts to break down and the calculated values are
increasingly inaccurate77.
118

2.16.6 Fracture Mechanics
The fatigue life of a component is made up of initiation and propagation stages. The
size of the crack at the transition from initiation to propagation is usually unknown and
often depends on the view of the analyst and the size of the component being analysed.
Nevertheless the distinction between the initiation life and propagation life is important.
At low strain amplitudes up to 90% of the life may be taken up with initiation, while at
high amplitudes the majority of the fatigue life may be spent propagating a crack.
Fracture mechanics approaches are used to estimate the propagation life and require that
an initial crack size be known or assumed78.
Linear elastic fracture mechanics (LEFM) principles are used to relate the stress
magnitude and distribution near the crack tip to:
1. Remote stresses applied to the cracked component
2. The crack size and shape
3. The material properties of the cracked component
The general form of the LEFM equations can be seen in Equation 6 below.
Equation 6 General form to determine local stresses near the crack tip
Where:
K = the stress intensity factor
r and 9 are cylindrical coordinates of a point with respect to the crack tip.
The stress intensity factor, K defines the magnitude of the local stresses around the
crack tip.
78 Bannantine, J. A. Comer, J. J. Handrock, J. L. Fundamentals of Metal Fatigue Analysis, 1990, Prentice Hall, Inc, pp88-89
119

This factor depends on loading, crack, crack shape, and geometric boundaries, with the
general form given by:
K = f ( g ) C F y [ m
Equation 7 Stress intensity factor
Where:
a = Remote stress applied (not to be confuse with local stress Gy in Equation 6.
a = crack length
f (g) = correction factor that depends on specimen and crack geometry
Research conducted by Zhang et al, extended a structural-stress concept developed for
spot welds to laser welds following a degree of modification79.
The stresses in the direct vicinity of the weld were characterised by stress intensity
factors, with the objective being to make a connection between the nominal structural
stress and the stress-intensity factors.
In order to develop the approach, the gap between the sheets was regarded as a crack in
the terms of fracture mechanics79.
Zhang concluded that the weld was always subjected to non-homogeneous stresses over
its length and that the length did not make a linearly proportional contribution to the
increase in the load bearing capacity. For this reason Zhang et al concluded that the
dimensioning must be based on local stress ability, (e.g. structural stress, parameter pa
or notch stress) which was around one third lower for laser welds than for spot welds.
The structural stress or parameter pa was calculated from the following equation:
P a ~ K a,mix 1 A ~ G 'a{ns) C1 + ( K / f l + K I tj_ . 2 ) + C x { t J t 2 ~ 1 ) ) y f b ^
Equation 8 Structural stress calculation”
79 Zhang, G. Sinhg, S. Hahn, O. Kurzok, P. Methods of predicting the fatigue lives of laser-beam welded lap welds subjected to shear stresses, Welding and Cutting, February 2002, pp 96 - 103
120

2.16.7 Similar & Dissimilar Metal Spot Welded Fatigue Failures
Marples investigated the resistance spot welding of 1.2mm V I437 - 1mm 304
dissimilar metal joints. The line load range fatigue properties of this joint can be seen in
Graph 9, compared with both 1mm 304 and 1.2mm V1437 similar metal spot welded
fatigue properties.
1000
■ 1 mm 304 Spot WeldA 1.2mm V1437 Spot Weld♦ 1.2mm V1437 -1 mm 304 Spot Weld
2x10cyclescm
3 100
10000 100000 1000000 10000000Cycles to Failure
Graph 9 Similar and dissimilar metal resistance spot welded fatigue comparison
Graph 9 displays very similar fatigue results however, the 1mm 304 possessed the
lowest fatigue properties. The dissimilar metal joint with an increase in sheet thickness
with the 1.2mm VI437 possessed slightly higher fatigue properties and the 1.2mm
V1437 similar metal joint with a further increase in sheet thickness possessed the
highest fatigue properties.
121

Research conducted by Wray investigated the fatigue properties of similar metal
resistance spot welded duplex stainless steel grades. The four grades tested during the
investigation range in alloy content from the relatively lean 2101 duplex stainless steel
to the relatively high alloyed 2507 duplex stainless steel.
1000
• 1 mm 2101 Spot Weld A 1 mm 2304 Spot Weld □ 1 mm 2205 Spot Weld 0 1 mm 2507 Spot Weld
2x10cycles00
3 100
10000 100000 1000000 10000000Cycles to Failure
Graph 10 Similar metal resistance spot welded duplex stainless steel fatigue comparison
It can be seen the four grades possessed similar fatigue properties. It should be noted
that the same electrode diameter was used to produce the spot welds, resulting in similar
nugget diameters.
122

Wray also compared the fatigue properties of dissimilar thickness grades, the results of
which can be seen in the following graph.
1000
£.£z<uwoI 100ceoJ<u.£_
10
L—■ 1 m m n t W ol H
♦ 2mm 2205 Spot Weld
riCvcl<;s
♦II
2:C ]
■ ■ —♦ - r-
10000 100000 1000000Cycles to Failure
10000000
Graph 11 Effect of sheet thickness on the resistance spot welded duplex stainless steel fatigue
Wray found that increasing the sheet thickness improved the fatigue properties of the
lap joint. It should be noted that the electrode diameter was the same for the two joints.
A similar trend was found by Linder et al for similar metal laser welded lap joint fatigue
results.
123

2.16.8 Adhesive Bonded Lap Joint Fatigue Properties
The effects of bondline thickness on the fatigue properties of 1.5mm (sheet thickness)
304 lap joints was analysed by Boyes80. It can be seen from Graph 12, that lower
fatigue properties were achieved with the thicker bondline.
1,000
5 100
■ 1.5m m A d h es iv e B on d (0.165m m B on d lin e)
o 1.5m m A d h esiv e B on d (0.6m m B on d lin e)
10000 100000 1000000Cycles to Failure
Graph 12 1.5mm 304 similar metal adhesive bonded lap joint fatigue properties with different bondline thickness80
The bondline thickness has a similar effect on adhesive bonded lap joint fatigue
properties as the introduction of an interfacial gap in a laser welded lap joint. The
increased bondline thickness increases the eccentricity of the applied fatigue load
producing an increase in the applied bending moment to the joint, reducing fatigue
properties. The bonded area was the same for the two adhesively bonded joints.
However, it should be noted that adhesively bonded lap joint fatigue failure occurs
either in the adhesive itself or at the interface between the adhesive and the adherent.
80 Boyes, B. Adhesive bonding of stainless steel, PhD thesis, Sheffield Hallam University, 1998
124

In summary, the experimental program aimed to provide answers to the following
questions.
1. What are the tensile and fatigue controlling factors of dissimilar metal laser
welded lap joints?; including the effects of:
a. Sheet thickness
b. Weld width
c. Interfacial gap
d. Zinc-coating (liquid metal embrittlement)
e. Material tensile properties
f. Weld bead composition
g. Solidification mode (austenitic stainless steel)
2. How do the tensile and fatigue results of laser welded lap joints compare with
those of current automotive joining methods (resistance spot welding)?
3. What are the “problems” associated with laser welding zinc-coated mild steel to
stainless steel and can these “problems” be overcome?
125
3 Experimental Technique
3.1 Introduction
Two industrial CO2 laser welders were used to produce welded samples The initial
trials, which included welding similar and dissimilar metal laser welded lap and butt
joints, were carried out using a Tmmpf 5kW CO2 laser welder. The specifics of the
Trumpf 5kW CO2 laser welder and the welding trials conducted can be seen in section
3.1.1.
Further trials were carried out using a Rofin 2kW CO2 industrial laser welder.
Inevitably, the welding speed was reduced to produce a similar power density at the
source to allow full penetration welds. However, this welder provided greater laser-
optics flexibility and beam control. This welder was used to produce similar and
dissimilar metal laser welded lap and butt joints. The specifics of the Rofin 2kW CO2
laser welder and welding trials conducted can be seen in section 3.1.1.1.3.
126

3.1.1 Trumpf 5kW CO2 Laser Welder
Similar and dissimilar metal laser welds were produced using a Trumpf 5kW CO2
industrial laser welder. This laser is a ‘class 4’ laser product with mirror optic beam
delivery. As with all laser-welding processes there is some loss of power from the
source to the work piece, thus, a laser power of 5 kW at the source resulted in a
measured 3.8 kW at the work piece.
The laser beam energy distribution was of the gausssian type with a spot size of 0.3mm.
This equated to a power density of 54kW/mm2 at the work piece. The diameter of the
beam containing 86% of the total power was 0.26mm.
Owing to the nature of the beam delivery; when welding zinc coated mild steel, the
focal length (distance from the centre of the focusing mirror to the work piece) is kept
relatively high to reduce the possibility of damage to the focusing mirror from zinc
spatter. Hence, the focal length during the laser welding trials was 250mm.
A number of welding trials were conducted using this laser welder. These can be split
into three separate sets of trials, each with different aims, which can be seen below.
1. Process optimisation and joint configuration
2. Material optimisation
3. Fatigue specimen production
Each of these trials will now be explained in further detail.
127

3.1.1.1 Process Optimisation and Joint Configuration
The initial welding trials were used to hone the laser welding process parameters with
regard to the production of similar and dissimilar metal lap and butt joints. The steels
used in the initial welding trials were:
• 1 mm 304 austenitic stainless steel
• 1mm 2205 duplex stainless
• 1.2mm V1437 zinc-coated mild steel
The laser welding process parameters controlled during these laser welding trials were:
• Welding speed
• Focal position
• Shielding gas flow rate
The length of the overlap in the lap joint configuration was also controlled.
Initially, the welding power was set at the 5kW maximum (continuous beam mode);
however, due to degradation of the optics the measured power at the work piece was
3.8kW. The focal length, which is the distance from the focusing mirror to the work
piece surface, remained a constant length of 250mm. This was to reduce damage to the
focusing mirror from zinc spatter. Helium was used as the shielding gas which was fed
to the weld at a rate of 25L/min trailing the welding beam. The focal point was initially
focussed on the surface of the top-sheet (0mm focal position).
128

3A .1.1.1 Welding Speed
Laser welding trials were conducted to determine the highest attainable lap joint
welding speed whilst achieving full penetration. 1.2mm V1437, 1mm 304 and 1mm
2205 similar metal welds, and 1.2mm V1437-lmm 304 and 1.2mm V1437-lmm 2205
dissimilar metal welds were produced and assessed with the welding speed set at
2.3m/min. Trials were then conducted with increased welding speeds of 3.0m/min,
2.9m/min, 2.8m/min and 2.6m/min respectively. The weld penetration of each laser
welded lap joint was visually assessed after each weld run.
129
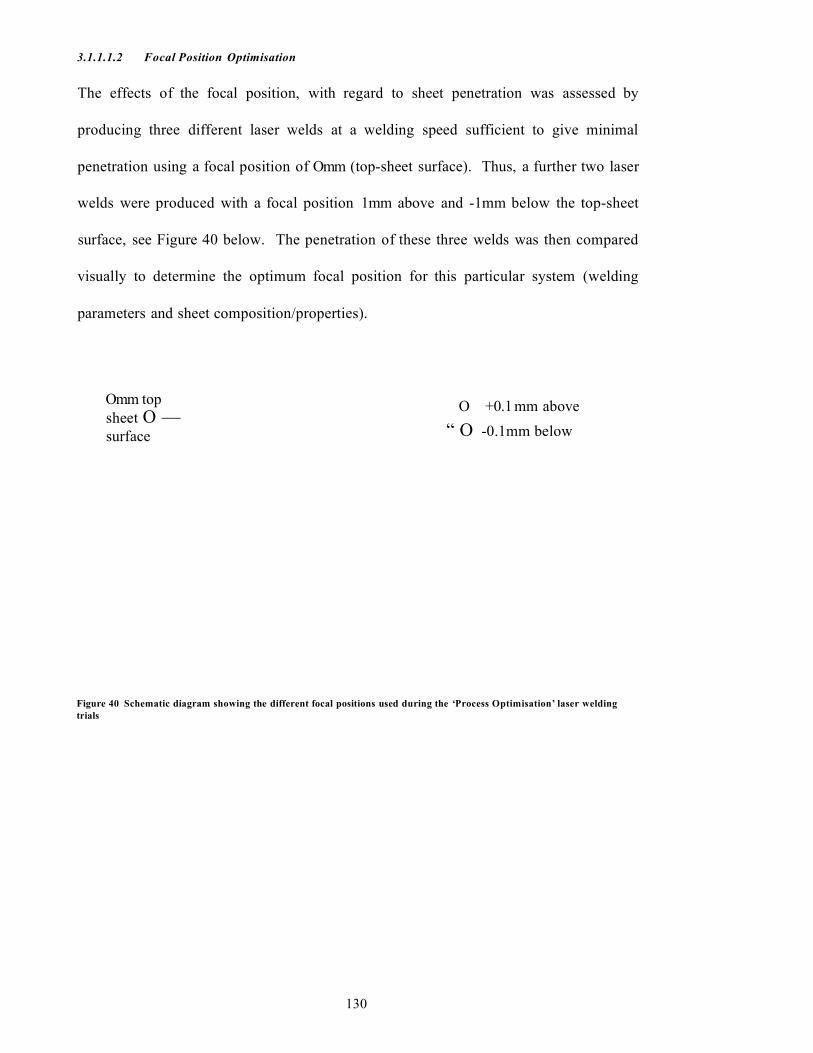
3.1.1.1.2 Focal Position Optimisation
The effects of the focal position, with regard to sheet penetration was assessed by
producing three different laser welds at a welding speed sufficient to give minimal
penetration using a focal position of Omm (top-sheet surface). Thus, a further two laser
welds were produced with a focal position 1mm above and -1mm below the top-sheet
surface, see Figure 40 below. The penetration of these three welds was then compared
visually to determine the optimum focal position for this particular system (welding
parameters and sheet composition/properties).
Omm top sheet O — surface
O +0.1 mm above“ O -0.1mm below
Figure 40 Schematic diagram showing the different focal positions used during the ‘Process Optimisation’ laser welding trials
130

3.1.1.1.3 Shielding Gas Flow Rate
The shielding gas flow rate was originally set at 25L/min. However, comparisons of
plasma suppression were made by producing welds with a shielding gas flow rate of
30L/min and 20L/min respectively. A visual examination of the welds was carried out
to assess the penetration and weld bead quality.
3.1.1.1.4 Overlap Length
The overlap length was set at 30mm for the similar and dissimilar metal lap joints.
However, to aid in the evacuation of zinc vapour from the internal lap face, dissimilar
metal laser welded lap joints were produced using an overlap of 10mm. The laser welds
produced were examined visually to assess penetration and weld bead quality.
131

3.1.1.2 M aterial Optimisation
The second set of welding trials using the Trumpf 5kW CO2 laser welder followed the
tensile, and more specifically, the lap shear results produced from the “Process
Optimisation and Joint Configuration” trials.
Thinner gauges of both austenitic and duplex stainless steels were laser welded to
1.2mm V1437 zinc-coated mild steel in the lap joint configuration. These thinner gauge
stainless steels were:
• 0.6mm 301 austenitic stainless steel
• 0.7mm 301 austenitic stainless steel
• 0.78mm 2205 duplex stainless steel
The welding parameters used were, again, determined from the “Process Optimisation
and Joint Configuration” welding trials. With the laser power set at the maximum 5kW
(3.8kW at the work piece) and a focal length of 250mm; a welding speed of 2.6m/min
was used. The focal position was 0.1mm above the surface and the shielding gas flow
rate was 20L/min. The laser welds produced were assessed visually and consequently
lap shear tested.
132

3.1.1.3 Fatigue Specimen Production
The third and final welding trials using the Trumpf 5kW CO2 laser welder were to
produce the laser welds which would be fatigue tested. Four dissimilar laser welds were
produced with the following configurations:
• 1mm 304 (top) - 1.2mm V1437 Lap Joint
• 1.2mm V I437 (top) - 1mm 304 Lap Joint
• 0.78mm 2205 (top) - 1.2mm V1437 Lap Joint
• 1.2mm V1437 (top) - 0.78mm 2205 Lap Joint
It should be noted that “top” in the above laser welded lap joint configurations denotes
the steel at the top of the lap joint, which is impinged by the incoming laser beam. The
selection of these configurations was based on the lap shear results from the previous
two welding trials. These four configurations all achieved greater than 100% weld
efficiency; that is, the lap shear failure occurred in the parent material of the 1.2mm
VI437 zinc-coated mild steel at 45° shear and not in the weld itself.
The welding parameters used to produce these four lap joints were determined from the
previous two welding trials. The maximum laser power (3.8kW at the work piece) was
used with a focal length of 250mm. The focal position was 0.1mm above the surface of
the top sheet and helium shielding gas with a flow rate of 20 L/min was used. An
overlap length of 25mm was selected to allow comparison with fatigue data from
current literature.
133

3.1.1.4 Rofin 2kW C 0 2 Laser W elder
Similar and dissimilar metal laser welds were produced using a Rofin 2kW CO2
industrial laser welder. This laser welder uses a mirror optic beam delivery in a similar
way to the Trumpf 5kW CO2 laser. The main difference however between the two
lasers, aside from the welding power, is the reduced focal length of the Rofin 2kW CO2
mirror optic system which was 65mm. Ordinarily, this reduced focal length would
result in damage to the focusing mirror due to zinc spatter; however, this problem was
overcome with the use of an air knife between the focusing mirror and the work piece.
Only one set of laser welding trials was undertaken using this industrial laser welder.
The aim of this set of trials was to produce four joints that were to be fatigue tested.
The process was optimised using a series of test welds, which were visually examined
before the welds for fatigue testing were produced.
134

3.1.1.4.1 Fatigue Specimen Production
Due to the reduced power of Rofin laser welder in comparison to the Trumpf, a lower
welding speed was required to achieve a similar power density. Hence, a number of
welds were produced and visually examined before the fatigue specimens were
produced. The focal position selected was -1mm below the surface; the helium trailing
gas flow rate was 25L/min. The focal position was adjusted to effectively defocus the
laser beam. This, in conjunction with a reduced welding speed, increases the heat input
and produces a slower cooling and consequently solidification rate. This slower
solidification rate, it was hoped, would allow more time for the zinc vapour from the
internal lap face to escape the molten weld pool and reduce the chance of porosity. The
overlap was 25mm, which was the same as the previous four fatigue tested lap joints to
allow comparison with previous fatigue data.
Four laser welded joints were produced, these were:
1.2mm V I437 (top) - 1mm 2205 Lap Joint
1.2mm V1437 (top) - 1mm 2101 Lap Joint
1mm 2101 similar metal lap joint Lap Joint
1.2mm V 1437- 1mm 2101 Butt Joint
135

3.2 Material Tested
Four different grades of stainless steel were welded to the 1.2mm V1437 zinc-coated
mild steel.
Stainless steel grades:
1. 1mm AvestaPolarit grade 18-8 (BS: 304s31, EN: 1.4301) with a 2B finish
2. 0.7mm AvestaPolarit grade 17-7 (BS: 301 s21) with a bright annealed finish
3. 0.6mm AvestaPolarit grade 17-7 (BS: 301s21) with a bright annealed finish
4. 1mm AvestaPolarit grade 2205 (BS: 318sl3, EN: 1.4301) with a brushed finish
5. 0.78mm AvestaPolarit grade 2205 (BS: 318s 13, EN: 1.4301) with a brushed
finish
6. 1mm AvestaPolarit grade 2101 with a brushed finish
136

3.2.1 Material Mechanical Properties
The actual base material mechanical properties were determined. The tensile test
specimens were precision sheared from each sheet of material used.
The tensile tests were carried out using an Instron 4206 uniaxial tension-testing machine
with a maximum load capacity of 150kN. Information output was via an IEEE port to a
PC that contained Instron series XI software.
The velocity of each test was set at lOmm.min'1. These can be seen compared with the
nominal base material mechanical data in the following tables.
1.2mm Volvo Truck Corporation (VTC) grade V1437
1.2mm V1439 Rpo.2 (MPa) Rm (MPa) As (%) Hv
Nominal 260 380 30 -
Actual 300 420 - 140
Table 3 1.2mm VI437 mechanical properties (nominal and actual)
Stainless steel grades:
1mm AvestaPolarit grade 18-8 (BS: 304s31, EN: 1.4301) with a 2B finish
1mm 304 Rpo.2 (MPa) Rm (MPa) As Hv
Nominal 310 620 57 -
Actual 310 627 - 163
Table 4 1mm 304 mechanical properties (nominal and actual)
0.7mm AvestaPolarit grade 17-7 (BS: 301s21) with a bright annealed finish
0.7mm 302 Rp0.2 (MPa) Rm (MPa) As Hv
Nominal 250 600 45 -
Actual Not Tested 588 - Not Tested
Table 5 0.7mm 301 mechanical properties (nominal and actual)
137
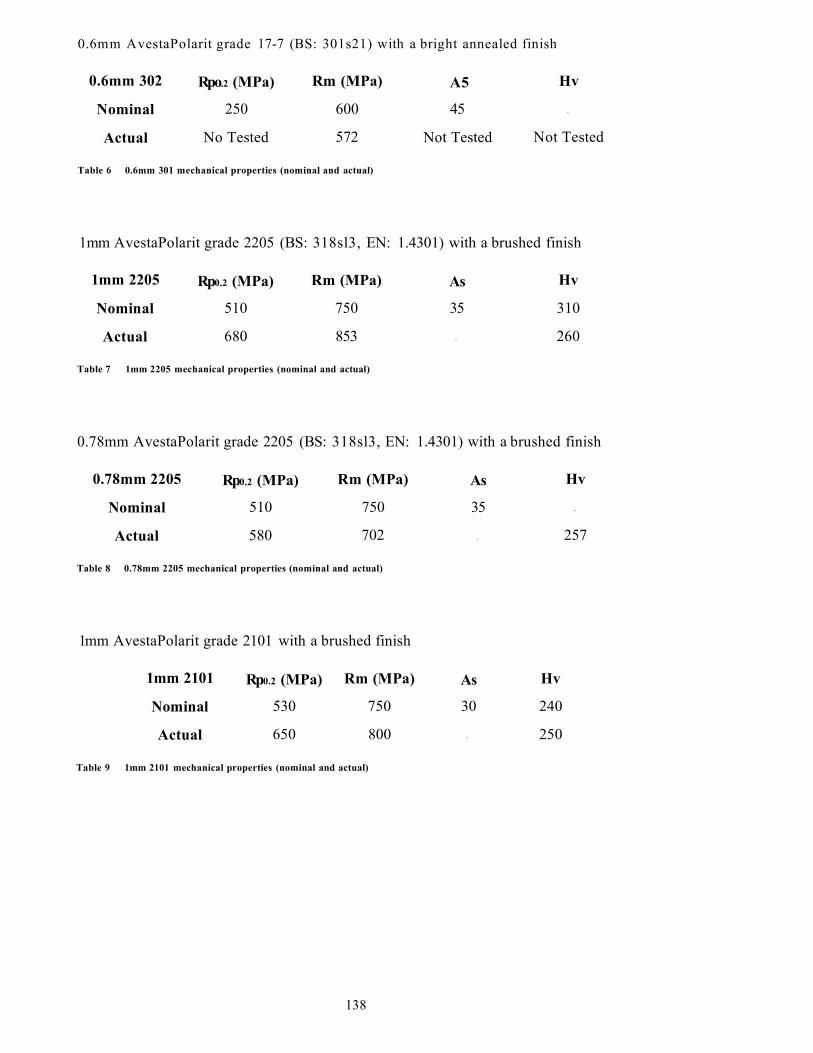
0.6mm AvestaPolarit grade 17-7 (BS: 301s21) with a bright annealed finish
0.6mm 302 Rpo.2 (MPa) Rm (MPa) A5 Hv
Nominal 250 600 45 -
Actual No Tested 572 Not Tested Not Tested
Table 6 0.6mm 301 mechanical properties (nominal and actual)
1mm AvestaPolarit grade 2205 (BS: 318sl3, EN: 1.4301) with a brushed finish
1 mm 2205 Rp0.2 (MPa) Rm (MPa) As Hv
Nominal 510 750 35 310
Actual 680 853 - 260
Table 7 1mm 2205 mechanical properties (nominal and actual)
0.78mm AvestaPolarit grade 2205 (BS: 318sl3, EN: 1.4301) with a brushed finish
0.78mm 2205 Rp0.2 (MPa) Rm (MPa) As Hv
Nominal 510 750 35 -
Actual 580 702 - 257
Table 8 0.78mm 2205 mechanical properties (nominal and actual)
1 mm AvestaPolarit grade 2101 with a brushed finish
1 mm 2101 Rp0.2 (MPa) Rm (MPa) As Hv
Nominal 530 750 30 240
Actual 650 800 - 250
Table 9 1mm 2101 mechanical properties (nominal and actual)
138

3.2.2 Material Chemical Composition
1.2mm Volvo Truck Coiporation (VTC) grade V1437
C Si Mn S P Ni C r Cu V A1 N
Mass (%) 0.08 0.01 0.32 0.009 0.013 0.02 0.03 0.02 0.002 0.041 0.0037
Table 10 1.2mm V1437 chemical composition
Stainless steel grades:
1mm AvestaPolarit grade 18-8 (BS: 304s31, EN: 1.4301) with a 2B finish
C Si Mn P S Cr Ni N
Min (%) - - - - - 18.0 8.0 -
Max (%) 0.03 0.75 2.0 0.045 0.015 19.0 10.0 0.1
Mass (%) 0.021 0.27 1.45 0.024 0.003 18.16 8.20 0.06
Table 11 1mm 304 chemical composition
0.7mm AvestaPolarit grade 17-7 (BS: 301s21) with a bright annealed finish
C Si Mn P S Cr Ni N
Min (%) 0.05 - - - - 16.0 6.0 -
Max (%) 0.15 - - - - 18.0 8.0 0.11
Mass (%) Not Tested
Table 12 0.7mm 301 chemical composition
0.6mm AvestaPolarit grade 17-7 (BS: 301s21) with a bright annealed finish
C Si Mn P S Cr Ni N
Min (%) 0.05 - - - - 16.0 6.0 -
Max (%) 0.15 - - - - 18.0 8.0 0.11
Mass (%) Not Tested
Table 13 0.6mm 301 chemical composition
139

1mm AvestaPolarit grade 2205 (BS: 318sl3) with a brushed finish
C Si Mn P S Cr Ni N
Min (%) - - - - - 21.0 4.5 2.5
Max (%) 0.03 - - - - 23.0 6.5 3.5
Mass (%) 0.019 0.42 1.45 - - 22.41 5.77 0.18
Table 14 1mm 2205 chemical composition
0.78mm AvestaPolarit grade 2205 (BS: 318sl3, EN: 1.4301) with a brushed finish
C Si Mn P S Cr Ni N
Min (%) - - - - - 21.0 4.5 2.5
Max (%) 0.03 - - - - 23.0 6.5 3.5
Mass (%) 0.021 0.4 1.38 - - 22.11 5.6 0.22
Table 15 0.78mm 2205 chemical composition
1mm AvestaPolarit grade 2101 with a brushed finish
C Si Mn P S Cr Ni Mo N
Nominal (%) 0.03 - 5 - - 21.5 1.5 0.3 0.22
Actual (%) 0.029 0.65 5.0 - - 21.59 1.54 0.3 0.23
Table 16 1mm 2101 chemical composition
140

3.2.3 Zinc Coating
The Volvo Truck Corporation (VTC) grade V1437 had been hot dipped galvanised to
the VTC - Z100 specification. The mass per unit area has been based on a density of
7.14g.cm'3. The zinc coating properties can be seen in Table 17 below.
Mass Coating thickness per coated surface
Triple spot test
tern'2)
Single spot test
(g-m'2)
pm (nominal) pm (min)
100-140 85-115 7 5
Table 17 1.2mm V1437 zinc mass and coating thickness
141

3.3 Joint Configuration
The flexibility of the laser system allowed both laser welded lap and butt joints to be
produced. Both these welding configurations present their own problems with regard to
laser weldability and are addressed in more detail in the following two sections.
3.3.1 Butt Joint
Laser welded butt joints were produced by butting two steel sheets together and running
the laser beam along the centre of the two-sheet interface. This can be seen in Figure
41, where zinc coated mild steel has been welded to stainless steel. Both similar and
dissimilar metal butt joints were produced.
Laser beam
tLaser weld bead
I
Zinc coated mild steel
Stainless steel
Figure 41 Schematic diagram showing the hutt weld configuration
142

The critical aspects to be considered when producing laser-welded butt joints are the fit
up between the two sheets to be joined and, provided good fit up is achieved, alignment
of the laser beam along the centre of the two sheets.
Good fit up is critical in laser-welded butt joints in both the ‘y’ and ‘z’ axis. These can
be seen in Figure 42 below with respect to the laser beam and welding direction.
Laser beam
z
Welding Direction
Figure 42 Butt joint critical fit up axis with respect to laser beam direction
Thus, to improve fit up in the ‘z’ axis, the samples were all ‘precision-sheared’ along
the edge to be welded. This reduced any gap between the sheets to <10% of the sheet
thickness, which is sufficient to remove under fill and concavity of the weld bead.
Hydraulic clamps were used to produce the butt joints with the Trumpf 5kW CO2
industrial laser welder. This removed any deflection within the sheets inherent from
manufacture and improved the fit up with respect to the ‘y’ axis.
In comparison, laser welded butt joints produced with the Rofin 2kW CO2 industrial
laser welder used a set of mechanical point clamps to remove any deflection within the
sheets, and again improved the fit up in the ‘y’ axis.
143

When satisfactory fit up between the sheets was achieved, a low power-density laser
spot, similar to a laser pointer, was placed on the joint surface. This laser spot traversed
across the sheets using CNC positioning and allowed a laser-weld alignment test to be
completed. During the laser-weld test, which could be done very slowly, observations
would reveal if the spot moved away from the two-sheet interface into either parent
material. Thus alignment of the laser beam along the length of the weld was achieved
allowing for good reproduction and highly consistent welds.
144

3.3.2 Lap joint
Laser welded lap joints were produced by overlapping two sheets of steel. The laser
beam then traversed down the centre of the overlap, impinging on the surface of the top
material, and produced a weld between the two sheets. This can be seen in Figure 43.
Both similar and dissimilar metal laser welded lap joints were produced.
Laser beam
tLaser weld bead
I
Zinc coated mild steel
Stainless steel
Figure 43 Schematic diagrams showing the lap joint configuration
145

It should be noted that the lap joint configuration allows two joints to be produced for a
particular dissimilar set of steels. For example, Figure 43 illustrates a dissimilar metal
laser welded lap joint between zinc coated mild steel and a stainless steel. It can be seen
that the laser beam impinges on the surface of the zinc coated mild steel, which is at the
top of the lap joint. Thus, the two steels can be reversed and a laser-welded lap joint
can be produced with the laser impinging on the surface of the stainless steel. This can
be seen in Figure 44.
The advantage of the lap joint configuration is that it removes problems associated with
edge preparation, inherent within the butt joint configuration. This makes the lap joint
much more flexible and attractive to industry. However, similar precautions were taken
to achieve alignment as in the production of the laser -welded butt joints.
Marking the bottom sheet at the edge of the overlap allowed the two sheets and the
overlap (L) to be aligned. Marking the top sheet at half the length (L/2) of the overlap
allowed the laser weld to be produced at the centre of the overlap.
Top sheet marked
Laser beam
Figure 44 Schematic showing a reverse of the lap joint configuration in Figure 43
at half the length of the overlap
Bottom sheet marked at total length of overlap
Figure 45 Diagram to show the markings required to ensure lap joint fit up
146
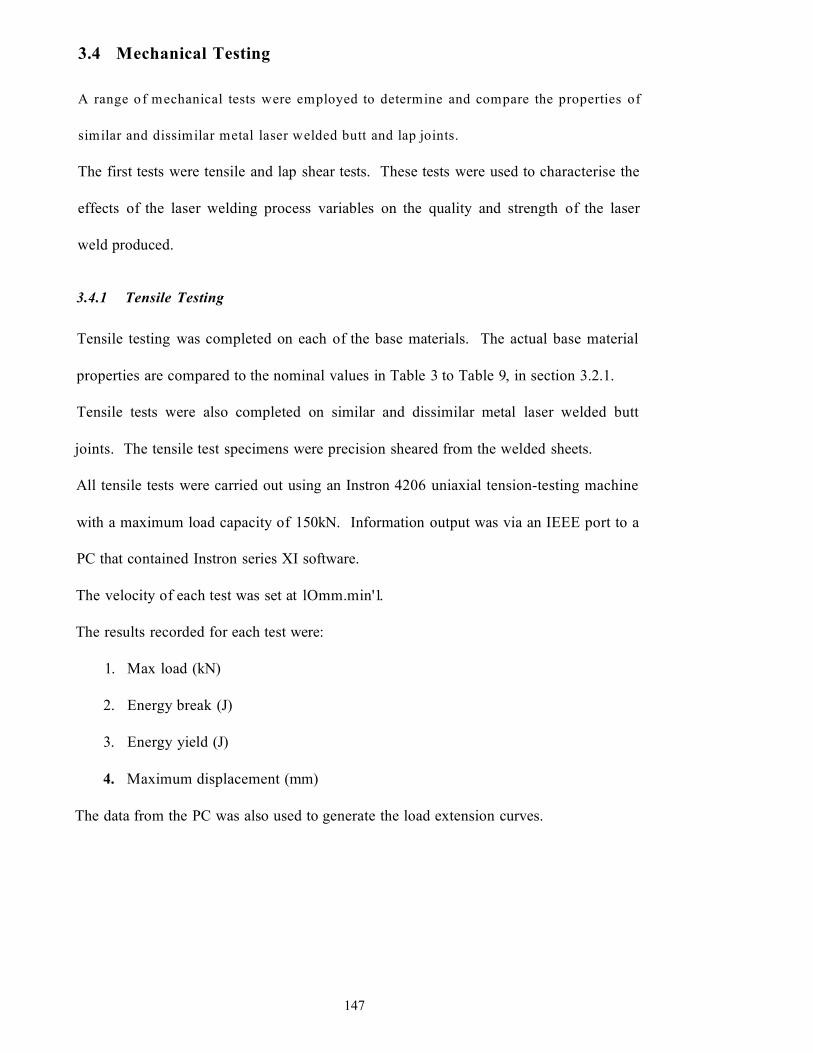
3.4 Mechanical Testing
A range of mechanical tests were employed to determine and compare the properties of
similar and dissimilar metal laser welded butt and lap joints.
The first tests were tensile and lap shear tests. These tests were used to characterise the
effects of the laser welding process variables on the quality and strength of the laser
weld produced.
3.4.1 Tensile Testing
Tensile testing was completed on each of the base materials. The actual base material
properties are compared to the nominal values in Table 3 to Table 9, in section 3.2.1.
Tensile tests were also completed on similar and dissimilar metal laser welded butt
joints. The tensile test specimens were precision sheared from the welded sheets.
All tensile tests were carried out using an Instron 4206 uniaxial tension-testing machine
with a maximum load capacity of 150kN. Information output was via an IEEE port to a
PC that contained Instron series XI software.
The velocity of each test was set at lOmm.min'1.
The results recorded for each test were:
1. Max load (kN)
2. Energy break (J)
3. Energy yield (J)
4. Maximum displacement (mm)
The data from the PC was also used to generate the load extension curves.
147
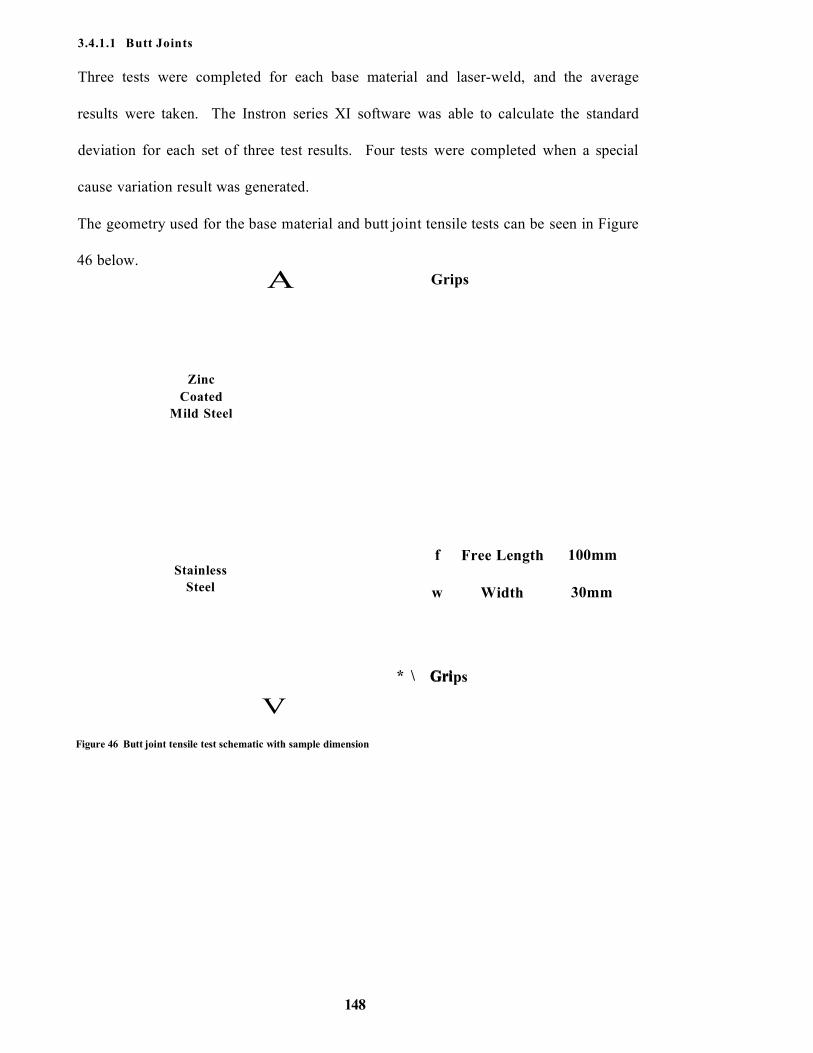
3.4.1.1 Butt Joints
Three tests were completed for each base material and laser-weld, and the average
results were taken. The Instron series XI software was able to calculate the standard
deviation for each set of three test results. Four tests were completed when a special
cause variation result was generated.
The geometry used for the base material and butt joint tensile tests can be seen in Figure
46 below.
Zinc Coated
Mild Steel
StainlessSteel
A
V
Grips
f Free Length 100mm
w Width 30mm
* \ GriGrips
Figure 46 Butt joint tensile test schematic with sample dimension
148

3.4.2 Lap Shear Testing
Similarly, lap shear testing was completed on similar and dissimilar metal laser welded
lap joints. The lap shear test specimens were precision sheared from the welded sheets.
To simulate the loading applied to the joint, spacers were integrated into the lap shear
testing. It should be noted that the thickness of each spacer was the same as the
opposite sheet thickness. This removed any rotation or stress on the lap joint prior to
lap shear test commencement.
Three tests were completed for each set of trials and the average and standard deviation
of each set was calculated. In a similar manner to the butt joint tests, a fourth test would
be conducted if a special cause variation was seen.Spacer
AGrips
100mmFree Length
Width 30mmw
10 - 30mmOverlap
Spacer
\7
Figure 47 Schematic showing lap joint shear test and sample dimensions
149

3.4.3 Fatigue Testing
Fatigue testing was completed in air on eight similar/dissimilar metal laser welded lap
and butt joints. As explained in section 3.1, these joints were produced in two separate
welding trials using the Trumpf 5kW and the Rofin 2kW CO2 laser welders
respectively.
The fatigue tests carried out were of the tension/tension type with a sinusoidal
waveform. The load ratio (minimum load/maximum load) was 0.05 = R. The fatigue
test frequency was selected on the basis of the highest attainable frequency whilst
achieving applied load resolution. Thus, the fatigue test frequencies were 50Hz for the
lap joints and 20Hz for the butt joints. A temperature sensor was placed on the surfaces
of the lap joint to assess the temperature during the test. Even at the higher frequencies
(50Hz), the sample did not show an increase in temperature. Joint survival at 2xl06
cycles was considered "run out" and the test was terminated. Failure was defined as
total sheet separation, see section 2.16.1.1; which allowed the fatigue machine,
waveform generator, and cycle counter to trip when >2mm actuator travel occurred.
Both lap and butt joint fatigue specimens were water jet cut from lm long laser welds.
A 10mm strip was cut from both ends of the laser weld and discarded, thus no start and
stop point was included in a sample.
The water jet diameter was 1mm, with tolerances of ± 0.2mm. The kerf deviation was
0.1mm - 0.2mm.
150

3.4.3.1 Lap Joint Fatigue Specimen Geometry
The fatigue specimen geometry (width, overlap and free length) was selected to allow
comparison between stainless steel similar metal and mild steel similar metal laser
welded fatigue results70.
ASpacer
w
cm
V
Grips
f Free Length 100mm
w Width 45mm
A Overlap 25mm
Spacer
rips
Figure 48 Schematic diagram showing the la p joint fatigue test dimensions
151

3.4.3.2 Butt Joint Fatigue Specimen Geometry
The butt joint fatigue specimen dimensions, primarily the free length and width, were
the same as the lap joint fatigue specimens. This was to allow comparison between the
butt joint fatigue results with the lap joint fatigue results.
A
Zinc Coated
Mild Steel
StainlessSteel
w
Grips
V
f Free Length 100mm
w Width 45mm
Grips
Figure 49 Schematic diagram showing the butt joint fatigue test dimensions
152

3.4.3.3 Fatigue Tests - Staircase Method
The staircase method was employed to determine the statistically valid mean fatigue
strength at 2xl06 cycles, see section 2.16. Preliminary testing was conducted to give an
indication of the first load level used in the staircase method. The load increment used
was O.lkN for the similar and dissimilar metal lap joints and 0.2kN for the dissimilar
metal butt weld. A minimum number of twenty tests were conducted in each staircase
to allow the mean fatigue strength to be statistically validated81.
The staircase (or “up-and-down”) method of testing is a variation of the “Probit”
method. It requires fewer specimens than the latter but is useful only when the primary
interest is in the mean fatigue strength corresponding to a pre-assigned cycle life,
commonly 2xl06 cycles. The advantage gained in reducing the number of specimens
tested can be offset by an increase in the time required to conduct the test.
In the staircase method the specimens are tested sequentially, one at a time. The first
specimen is tested at a stress level equal to the estimated value of mean fatigue strength
for the prescribed number of cycles. If the specimen fails before the pre-assigned cycle
life (2xl06 cycles), the next specimen is tested at a stress level that is one increment
below the first stress level, and so forth82.
Ideally, most of the tests should be made at three stress levels, chosen so that
approximately 50 per cent of the test specimens survive at the middle stress level, about
70 per cent survive at the lower stress level, and about 30 per cent survive at the higher
stress level82.
81 Nordberg, H. Discussion with Supervisor, Sheffield Hallam University, 200182 A Guide for Fatigue Testing and the Statistical Analysis of Fatigue Data, Prepared by Committee E- on Fatigue, American Society for Testing and Materials, 1963, pp 13-15
153

Thus, the selection of the proper increment of stress level is very important. Too large
an increment may produce a simple pass-fail threshold. Too small an increment and
large numbers of tests may have to be carried out to produce three (or more) active
levels. Increasing the number of active levels will also increase the standard deviation
and reduce the accuracy of the mean fatigue strength.
Previous data for the same or similar materials is needed in order to choose the initial
stress level effectively. If none is available, some preliminary testing may be required,
however, if the correct initial stress level and increment are chosen, it is possible to
determine the statistically valid mean fatigue strength at 2xl06 cycles with
approximately twenty tests81.
For each staircase method produced, the following calculations were used to determine
the statistically valid mean fatigue line load range (N/mm) and standard deviation.
Statistical calculations
The mean fatigue line load range at 2xl06 cycles was calculated using the following
equation:
X = p 0 + d ( j ~ ) (N/mm)
Equation 9 Mean fatigue line load range
Statistical Validity
The statistical validity of the mean fatigue line load range was calculated using the
following equation:
(.F * B - A 2)F
>0.3 and <1.2
Equation 10 Staircase statistical validity
If the value was between 0.3 and 1.2, the staircase was statistically valid.
154

Standard Deviation
The standard deviation of the mean fatigue line load range was calculated from the
following equation:
X = Mean fatigue line load (N/mm)
s = Standard deviation
Po = Total stress (N/mm) for step 0
F = Total number of failures
d = Stress interval (N/mm) or load interval (N)
A =Z( i * fi)
B =Z( i2 * fi)
i = Step number
fi = Number of failures in a step
F * B - A 2, F 2
(N/mm)
Equation 11 Standard deviation of the staircase
Where:
155
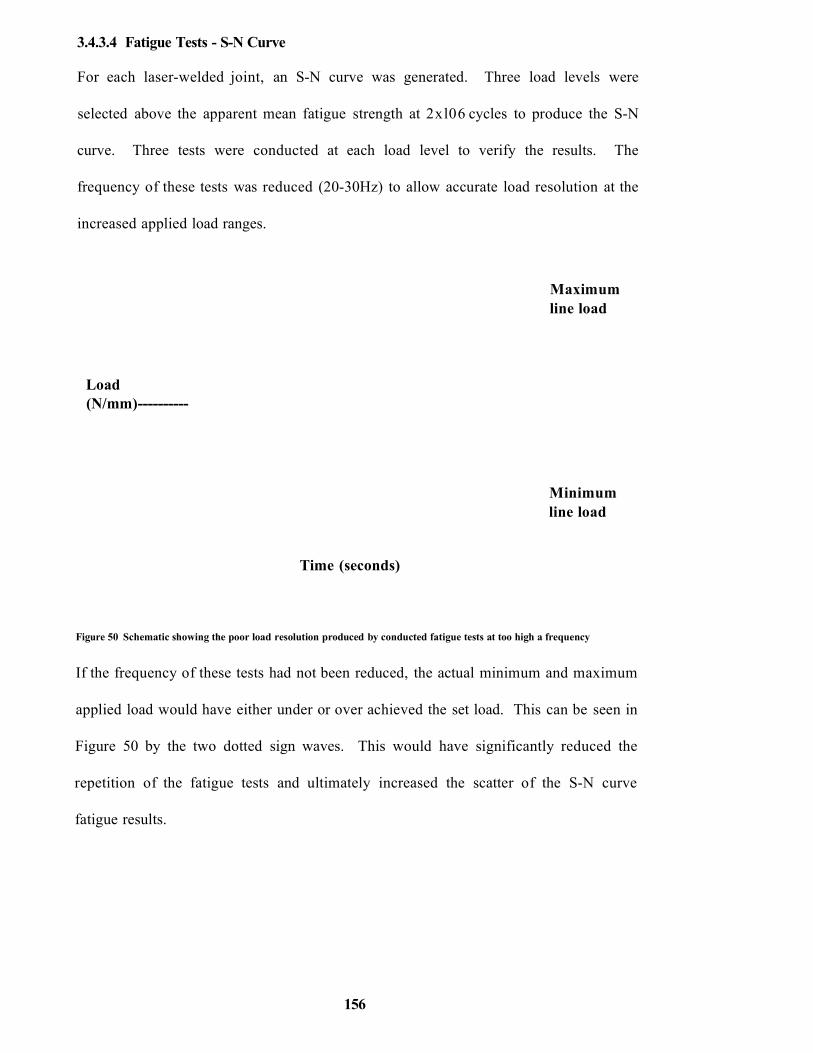
3.4.3.4 Fatigue Tests - S-N Curve
For each laser-welded joint, an S-N curve was generated. Three load levels were
selected above the apparent mean fatigue strength at 2xl06 cycles to produce the S-N
curve. Three tests were conducted at each load level to verify the results. The
frequency of these tests was reduced (20-30Hz) to allow accurate load resolution at the
increased applied load ranges.
Maximum line load
Load(N/mm)----------
Minimum line load
Time (seconds)
Figure 50 Schematic showing the poor load resolution produced by conducted fatigue tests at too high a frequency
If the frequency of these tests had not been reduced, the actual minimum and maximum
applied load would have either under or over achieved the set load. This can be seen in
Figure 50 by the two dotted sign waves. This would have significantly reduced the
repetition of the fatigue tests and ultimately increased the scatter of the S-N curve
fatigue results.
156

3.4.4 Lap Joint Rotation Tests
As explained in section 2.15.2.1, a lap joint subjected to a tensile load, whether from a
lap shear or fatigue test, will rotate. Thus, a test designed by Nordberg and McCann83
was used to analyse and quantify the degree of lap joint rotation for a given applied
load.
A low intensity laser beam was reflected from a mirror (see Figure 51), which was
adhesively bonded to the overlap surface of the lap joint. The reflected beam was
directed to a flat white canvas that was positioned one metre from the lap joint. The
initial (zero) position was marked on the canvas’ surface prior to loading. The lap joint
was then subjected to incremental loading until the sample began to plastically deform.
The test was then terminated. There was some diffraction of the laser light during the
reflection process and the reflected spot size on the canvas was approximately 5mm.
Further rotation tests were carried out with the laser spot being reflected on a sheet of
white paper which reduced the spot diameter to ~ 4mm. The rotation was measured by
placing a line at the centre of the laser spot. The error of the rotation test introduced by
marking and measuring the laser displacement was thus estimated to a rotation angle
error of ±0.1°.
To provide an accurate rotation angle for the lap joints during fatigue loading, the free
length of the rotation tests was carried out at 100mm, this being the free length used
during the fatigue tests.
83 McCann, S. Adhesive Bonding of Stainless Steels, PhD Thesis, Materials Research Institute, Sheffield Hallam University, July, 2003
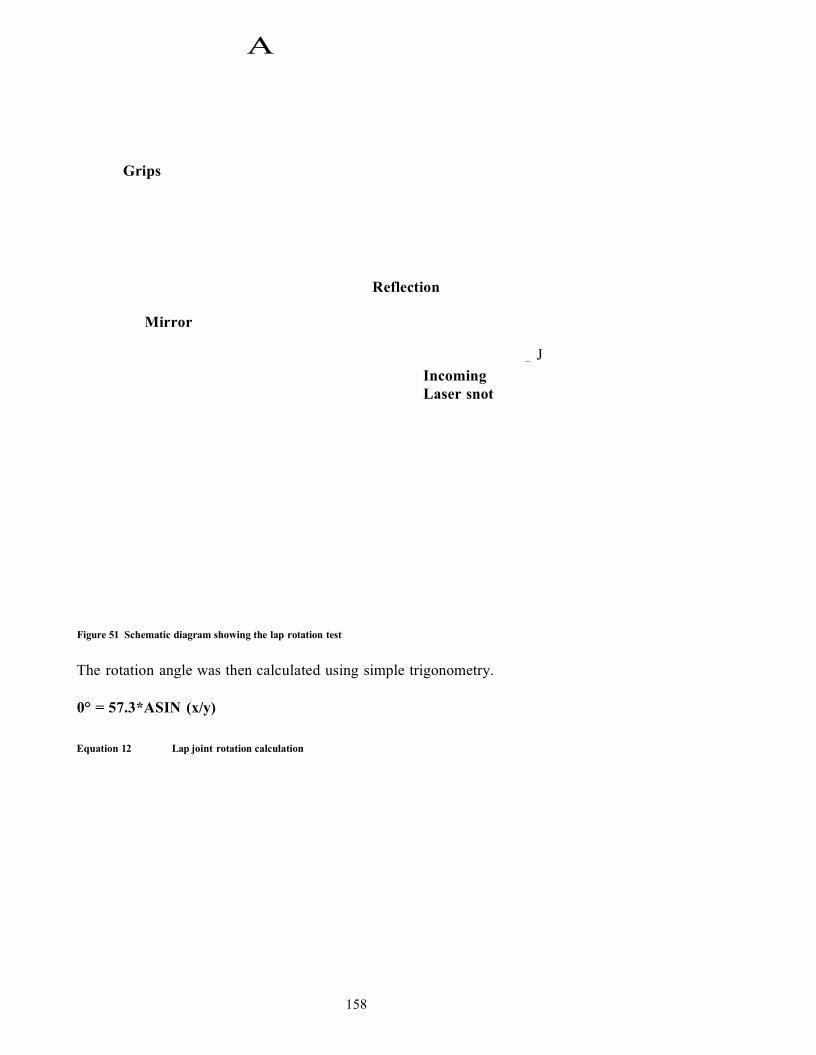
A
Grips
Mirror
Reflection
_ JIncoming Laser snot
Figure 51 Schematic diagram showing the lap rotation test
The rotation angle was then calculated using simple trigonometry.
0° = 57.3*ASIN (x/y)
Equation 12 Lap joint rotation calculation
158

3.5 Metallography
A number of metallographic techniques were used to provide information from similar
and dissimilar metal laser-welded lap and butt joints.
For the majority of the metallographic techniques, the laser welds were hot mounted in
conductive bakelite. The use of conductive bakelite allowed advanced SEM
examination to be carried out; this included secondary and back-scattered electron
imaging analysis. Weld bead measurements and compositional analysis was also
conducted using optical and SEM analysis respectively.
3.5.1 Etchants
A number of etchants were used to provide microstructural data and to allow visual
examination of the laser weld bead. Due to the existence of the passive layer on the
stainless steel; the stainless steel etchants tend to be much more aggressive than those
used for mild steel, for example, boiling nitric acid and electrolytic etching. These
etchants are too severe for zinc coated mild steel grades and over-etch the mild steel
structure very quickly. Thus, in most cases, a compromise had to be found, usually the
laser welds would be etched for the zinc-coated mild steel and secondly for the stainless
steel.
159

3.5.1.1 Stainless Steel
A number of etchants were used to provide different structural information.
Kallings reagent was used to show contrast between austenite, ferrite and martensite.
This etchant was used primarily with the duplex dissimilar metal welds.
Schaftmeisters reagent, which is a grain boundary etchant, was used to provide images
of the austenitic grain structure.
3.5.1.2 Zinc Coated Mild Steel (V1437)
Nitric acid in solution with alchohol produces a solution called Nital. Nital, with a
typical nitric acid concentration of 2 & 6% is the most common etchant for mild steel.
The increased concentration of 6% Nital provides a more powerful etchant that requires
a shorter duration to suitably etch a mild steel sample. Nital is a grain boundary etchant
which is useful for examining the grain structure of mild steel.
160

3.5.2 Microhardness Testing
A microhardness traverse was completed on dissimilar metal lap and butt joints. A
microhardness machine with an integrated ocular micrometer was used to produce the
microhardness grid with a 0.25mm increment. A load of 500g was used. Thus, a
microhardness grid across the weld was produced, which allowed a comparison of laser
weld microhardness for different welding parameters. An example of the grid can be
seen in Figure 52.
Transverse Section
FF~FFFF-FF
0.25mm
0.25mm
Figure 52 Microhardness grid (0.25mm) across a laser welded lap joint
161

3.5.3 Optical Analysis
Optical microscopy of dissimilar metal butt and lap joints was carried out. This was to
allow investigation into the weld bead profiles and, when suitably etched, to visually
characterise the degree of weld bead dilution and provide images which show contrast
between the base materials, heat affected zone (HAZ) and the weld bead.
3.5.3.1 Weld Bead Widths
Similar and dissimilar metal laser welded lap joint profiles were examined using a
Vanox optical microscope. The examination was used to determine the average weld
width between the sheets. Transverse sections of the welds were mounted prior to
grinding and were polished before being suitably etched, see section 3.5.1. Optical
analysis was then carried out.
162

3.5.3.2 Fatigue Failure Analysis
Similar and dissimilar metal laser-welded lap and butt joints were optically analysed to
provide information on the fatigue failure of the joints. Transverse sections were
mounted in conductive bakelite and subsequently ground, polished and etched. The aim
of the fatigue failure analysis was to characterise the fatigue initiation sites and angle of
propagation etc, with respect to the laser welded joint. The equipment used was an
optical microscope with an integral digital camera. A PC with image capture software
was connected to the digital camera, which allowed the images to be manipulated to
enhance analysis.
3.5.3.2.1 Butt Joints
Dissimilar metal laser-welded butt joints were analysed to determine and compare
fatigue failure positions, for example, failure in the weld bead, failure between the weld
and zinc-coated mild steel or failure between the weld bead and the stainless steel.
3.5.3.2.2 Lap Joints
Similar and dissimilar metal laser-welded lap joints were analysed to determine and
compare fatigue failure in the mild steel and the stainless steel, with regard to initiation
site, distance from the laser weld bead centre and propagation angle.
163

3.5.4 Scanning Electron Microscopy
A scanning electron microscope (SEM) was used in both secondary electron and back
scattered electron mode to allow further examination of similar and dissimilar laser
welded butt and lap joints. The SEM used was a Philips XL40, which is computer
controlled with integrated software that allows qualitative and quantitative chemical
analysis. The SEM allowed higher magnification images to be produced with excellent
resolution and improved depth of field/focus in comparison to the optical microscope.
3.5.4.1 Fatigue Failure Analysis
Further fatigue failure analysis of the lap and butt joints was undertaken. This was to
provide higher magnification images of the fatigue cracks and analysis of the initiation
sites. As well as the standard secondary electron mode of SEM analysis, back-scattered
electron mode was used to determine if the fatigue cracks propagated preferentially in
or around a particular phase. Thus, the back scattered electron mode was used to
produce images whose contrast was atomic-number dependent.
164

3.5.4.2 Weld Bead Compositions
The compositions of dissimilar metal laser-welded butt and lap joints were analysed to
determine the weld bead chemical composition and the effects of the welding process
parameters on the weld bead compositions. It was not possible to isolate the laser welds
and have the weld beads chemically analysed as the size of the laser weld was too small.
Consequently, the laser welds were mounted in conductive bakelite and chemically
analysed using the Philips XL40 SEM.
The XL40 is equipped with Energy Dispersive X-ray analysis (EDX). It also has the
ability to semi-quantitatively identify the elements present in a sample. This is done by
returning the relative percentage of counts from each element selected. Hence, the
stainless steel parent material was semi-quantifiably analysed for Fe, Cr and Ni,
determining the relative percentage of each respective elements ka counts. Since the
actual parent material composition was known, it was possible to relate the relative
percentages to the actual percentages. The microhardness grid was then used as a
reference and analysis of the laser weld bead commenced. If, for example, the Cr and
Ni relative percentages of the weld bead dropped by 50%, the corresponding calculated
Cr and Ni chemical content would fall by 50%, thus a 50% dilution of the stainless steel
would have occurred. Since the zinc-coated mild steel is very lean, the error introduced
by ignoring the other elements in the zinc-coated mild steel and the stainless steel was
relatively small (estimated <2%).
165

3.5.4.2.1 Butt Joints
Six dissimilar metal laser welded butt joints were analysed. Three of these dissimilar
metal laser welded butt joints were 1mm 304 laser welded to zinc-coated mild steel; the
other three were 0.78mm 2205 laser welded to zinc-coated mild steel. These were
welded with the same welding parameters apart from the laser welding speed which was
increased from 3.0m/min to 3.5m/min, and finally, to 4.0m/min respectively.
The weld bead compositions were analysed to determine the effects of welding speed on
the dilution and stirring mechanism (Marangoni flow) and ultimately the composition of
the weld bead.
3.5.4.2.2 Lap Joints
Four dissimilar metal laser-welded lap joints were analysed. Two were 1mm 304 laser
welded to zinc-coated mild steel (both configurations, one with the stainless steel on the
top of the lap and the second with the zinc-coated mild steel on the top of the lap) and
two were 1mm 2205 laser welded to zinc-coated mild steel (again, both configurations).
166

4 Results
4.1 Introduction
The results chapter follows a similar direction dictated by the experimental techniques
stated in chapter 3. Thus, the results can be split into the following sections:
o Mechanical Testing
• Laser weld lap shear/tensile properties - Trumpf 5kW CO2 laser welder
o Process optimisation and joint configuration - lap shear (lap-joint) and
tensile (butt-joint) properties
o Material optimisation - Thinner gauge stainless steel lap joints
• Laser weld lap shear/tensile properties - Rofin 2kW CO2 laser welder
o Fatigue specimen production - lap shear (lap-joint) and tensile (butt-
joint) properties
• Laser welded lap joint fatigue properties - Trumpf 5kW CO2 laser welder
o 1mm 304 (top) - 1.2mm V1437 dissimilar metal lap joint
o 1mm 304 - 1.2mm V1437 (top) dissimilar metal lap joint
o 0.78mm 2205 (top) - 1.2mm V1437 dissimilar metal lap joint
o 0.78mm 2205 - 1.2mm V1437 (top) dissimilar metal lap joint
• Laser welded lap/butt joint fatigue properties - Rofin 2kW CO2 laser welder
o 1mm 2205 - 1.2mm V1437 (top) dissimilar metal lap joint
o 1mm 2101 - 1.2mm V1437 (top) dissimilar metal lap joint
o 1mm 2101 - 1mm V1437 dissimilar metal butt joint
o 1mm 2101 - 1mm 2101 similar metal lap joint
167

o Lap Joint Rotation Tests
o Weld Bead Metallography
• Microhardness testing results
• Weld bead composition results
• Fatigue failure analysis
168

4.2 Laser-Welded Butt Joint Tensile Properties - Trumpf 5kW CO2
Laser Welder (Process Optimisation/Joint Configuration Trials)
As stated in section 3.1.1, similar and dissimilar metal laser-welded butt joints were
produced with a range of parameters. Each weld was examined visually for signs of
porosity and blow holes in the laser weld bead; tensile properties were also determined.
4.2.1 Similar Metal Laser Welded Butt Joint Results
The welding parameters used for the similar and dissimilar metal butt joint laser
welding trials were:
• Welding power: 3.8kW (workpiece)
• Welding speed: 4.0m/min
3.5m/min
• Focal point: Sheet surface
• Focal length: 250mm
• Trailing gas flow rate: 20L/min
Thus, all of the welding parameters were fixed, except the welding speed. In the
following graphs the welding speed can be seen on the ‘x’ axis under the respective
data.
169

Graph 13 below shows the similar metal butt joint ultimate tensile strength (Rm) results.
It should be noted that the 4m/min and 3.5m/min on the ‘X’ axis denote the laser
welding speed used to produce the laser weld. This graph allows comparison of the
ultimate tensile strength (Rm) with regard to welding speed.
1000
900
800
700
_ 600 as Q.~ 500E cc
400
300
200
100
0
Graph 13 Graph to show the effects of laser welding speed on the Rm properties of three similar metal butt joints
• 1.2mm V1437 similar metal butt joint tensile failure occurred in the parent material
of the V1437 zinc coated mild steel at 45° shear.
• 1mm 304 and 1mm 2205 similar metal laser welded butt joint tensile failure occurred
at the edge of the weld in the HAZ.
□ 1.2mm V1437□ 1mm 304 ■ 1mm 2205
4m/min 3.5m/min
170
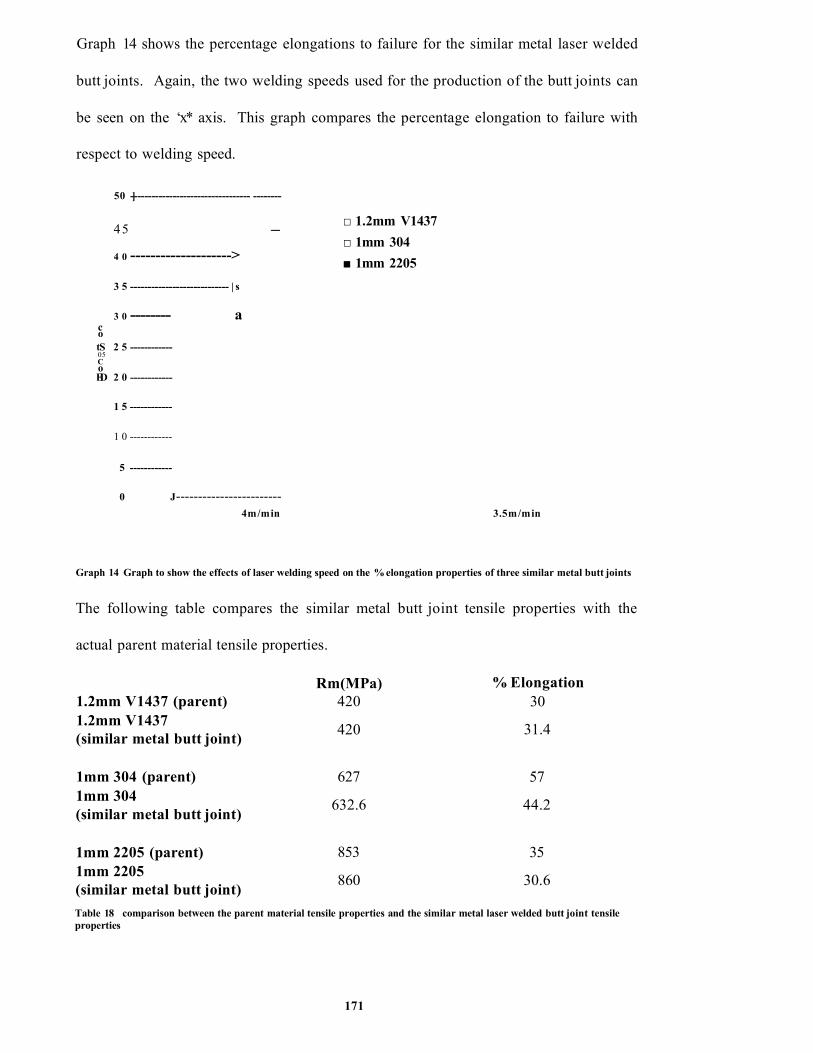
Graph 14 shows the percentage elongations to failure for the similar metal laser welded
butt joints. Again, the two welding speeds used for the production of the butt joints can
be seen on the ‘x* axis. This graph compares the percentage elongation to failure with
respect to welding speed.
50 -]--------------------------------- --------
45 --
4 0 -------------------->
3 5 ---------------------------- | s
3 0 -------- ac otS 2 5 ------------05 CoED 2 0 ------------
1 5 ------------
1 0 ------------
5 ------------
0 J------------------------4m/min
Graph 14 Graph to show the effects of laser welding speed on the % elongation properties of three similar metal butt joints
The following table compares the similar metal butt joint tensile properties with the
actual parent material tensile properties.
Rm (MPa) % Elongation1.2mm V1437 (parent) 420 301.2mm V1437 (similar metal butt joint) 420 31.4
1mm 304 (parent) 627 571mm 304(similar metal butt joint) 632.6 44.2
1mm 2205 (parent) 853 351mm 2205(similar metal butt joint) 860 30.6
Table 18 comparison between the parent material tensile properties and the similar metal laser welded butt joint tensile properties
3.5m/min
□ 1.2mm V1437□ 1mm 304 ■ 1mm 2205
171

4.2.2 Dissimilar Metal Laser Welded Butt Joint Results
The welding parameters used for the similar and dissimilar metal butt joint laser
welding trials were:
• Welding power: 3.8kW (work piece)
• Welding speed: 4.0m/min
3.5m/min
3.0m/min
• Focal point: Sheet surface
• Focal length: 250mm
• Trailing gas flow rate: 20L/min
Thus, the welding parameters were fixed with the exception of the welding speed which
was sequentially increased. In the following graphs, the welding speed can be seen on
the ‘x* axis under the respective data.
172

Graph 15 below shows the dissimilar metal butt joint ultimate tensile strength (Rm)
results. It should be noted that the welding speed can be seen on the ‘x’ axis under the
respective data. This graph allows comparison of the ultimate tensile strength (Rra) with
regard to welding speed.
450
400
350
300
TO' 250 Q.2Ecc 200
150
100
50
0
Graph 15 Graph to show the effects of laser welding speed on the Rm properties of two dissimilar metal butt joints
• The three dissimilar metal laser welded butt joints between 304 and V1437 all failed
in the parent material of the V 1437 zinc-coated mild steel at 45° shear away from the
weld.
• The three dissimilar metal laser welded butt joints between 2205 and VI437 all
failed in the parent material of the V1437 zinc-coated mild steel at 45° shear away
from the weld.
□ 1mm 304 - 1.2mm V1437□ 1mm 2205 - 1.2mm V1437
4m/min 3.5m/min 3m/min
173

Graph 16 shows the percentage elongations to failure for the dissimilar metal laser
welded butt joints. Again, the welding speed can be seen on the ‘x’ axis under the
respective data. This graph allows comparison of the elongations to failure with respect
to welding speed.
30
25
20
Co"o'- Coro 1505c oLU
10
5
0
Graph 16 Graph to show the effects of laser welding speed on the % elongation properties of two dissimilar metal butt joints
□ 1mm 304 - 1.2mm V1437□ 1mm 2205 - 1.2mm V1437
4m/min 3.5m/min 3m/min
174

4.3 Laser-Welded Lap Shear Properties - Trumpf 5kW C 0 2 Laser
Welder (Process Optimisation/Joint Configuration Trials)
As stated in chapter 3, section 3.1.1, similar and dissimilar metal laser-welded lap
joints were produced with a range of parameters. Each weld was visually examined for
signs of porosity and blow holes in the laser weld bead and also to assess the
consistency of penetration. The lap shear properties of each weld were then determined.
Thus, the optimum welding parameters for each configuration was determined, this
being defined as the highest welding speed whilst achieving full consistent penetration.
4.3.1 Similar Metal Laser Welded Lap Shear Results
The laser welding parameters which provided the highest lap shear properties for
1.2mm V I437 zinc-coated mild steel similar metal lap joints were:
• Welding power: 3.8kW (work piece)
• Welding speed: 2.3m/min
• Focal point: 0.1mm above top sheet surface
• Focal length: 250mm
• Trailing gas flow rate: 25F/min
• Overlap: 10mm
• Interfacial gap: None
However, very poor V1437 similar metal lap joints were produced in terms of weld
quality. Each weld bead showed signs of blow holes, and porosity with inconsistent, if
any, penetration being achieved. Hence the laser welding process was not optimised for
this similar metal lap joint configuration.
175

The optimised parameters for both 1mm 304 and 2205 stainless steel similar metal laser
welded lap joints were:
3.8kW (workpiece)
2.6m/min
0.1mm above top sheet surface
250mm
• Welding power:
• Welding speed:
• Focal point:
• Focal length:
Trailing gas flow rate: 25L/min
• Overlap:
• Interfacial gap:
30mm
None
176

Graph 17 below, shows the similar metal laser welded lap shear properties produced
using the optimum welding parameters.
900 ---------------------------------------------------------------------------------------------------------
800
700
600«T| 500
| 400
300
200
100
01.2mm V1437 1mm 304 1mm 2205
Graph 17 shows the similar metal lap shear properties produced with the optimum welding parameters
The 1.2mm VI437 and stainless steel (1mm 304 and 1mm 2205) similar metal lap shear
failures occurred in the HAZ at the edge of the weld bead.
The failures occurred across the region used for the cross sectional area in the
calculation of the Rm stress (MPa).
177

The following table compares the similar metal weld lap shear properties with the actual
parent material tensile properties.
Rm (MPa) % Elongation1.2mm V1437 (parent) 420 301.2mm V1437 (similar metal lap joint) 366 19
% Parent 87% 63%
1mm 304 (parent) 627 571mm 304(similar metal lap joint) 557 23
% Parent 89% 40%
1mm 2205 (parent) 853 351mm 2205(similar metal lap joint) 810 12
% Parent 95% 34%Table 19 Comparison between the parent material tensile properties and the similar metal laser welded lap shear properties
Graph 18 shows the percentage elongations to failure for the similar metal laser welded
lap joints. This graph allows comparison of the elongations to failure for the three
similar metal lap joints.
1.2mm V1437 1mm 304 1mm 2205
Graph 18 Comparison of similar metal lap joint % elongations
178

4.3.2 Dissimilar Metal Laser Welded Lap Shear Results
The optimum laser welding parameters for the four dissimilar metal lap joint
configurations were:
3.8kW (workpiece)
2.3m/min
0.1mm above top sheet surface
250mm
• Welding power:
• Welding speed:
• Focal point:
• Focal length:
Trailing gas flow rate: 20L/min
Overlap:
Interfacial gap:
10mm
None
179

Graph 19 below, shows the dissimilar metal laser welded lap shear properties produced
using the optimum welding parameters. For comparison, the similar metal lap shear
results are also presented.
nQ.
EDC
900
800
700
600
500
400
300
200
100
0
✓.$>
rS'$
j y
A A
Graph 19 shows the dissimilar metal lap shear properties produced with the optimum welding parameters
All four dissimilar metal lap joints failed in the parent material of the mild steel at 45c
shear away from the laser weld.
180

Graph 20 shows the percentage elongations to failure for the dissimilar metal laser
welded lap joints. This graph allows comparison of the elongations to failure for the
three similar metal lap joints.
3 0 -i--------------------------------------------------------------------------------------------------------------------------------------------------1
2 5 ---------------------------------------------------------------------------------------------------------------------------- ■ ■ ---------------------------------------------------------------------------------------------------------------------------------1
to- 20o'-
Graph 20 compares the lap shear percentage elongations to failure for dissimilar metal lap joints
181

4.4 Laser-Welded Lap Shear Properties - Trumpf 5kW C 0 2 Laser
Welder (Material Optimisation Trials)
As stated in 3.1.1.2, thinner gauges of stainless steel were laser welded to 1,2mm V I437
in the lap joint configuration.
The welding parameters used were determined from the original welding trials:
• Welding power: 3.8kW (work piece)
2.6m/min
0.1mm above top sheet surface
250mm
• Welding speed:
• Focal point:
• Focal length:
Trailing gas flow rate: 20L/min
• Overlap:
• Interfacial gap:
10mm
None
182

Graph 21 below shows the lap shear properties of dissimilar metal laser welds produced
with thinner gauge stainless steel.
700
600
500
400CLs
i 300
200
100
0
Graph 21 shows the lap shear properties of dissimilar metal laser welds with thinner gauge stainless steel
• Lap shear failure occurred in the parent material of both the 0.6 and 0.7mm 302
stainless steel when welded to 1.2mm VI437.
• However, the lap shear failure occurred in the parent material of the 1.2mm V1437
for the dissimilar metal lap joint when welded to 0.78mm 2205.
Note: the Rm has been calculated for the thickness of the failed sheet
__ ____0.6mm 302(top)-V1437 0.7mm 302(top)-V1437 0.78mm 2205(top)-V1437
183
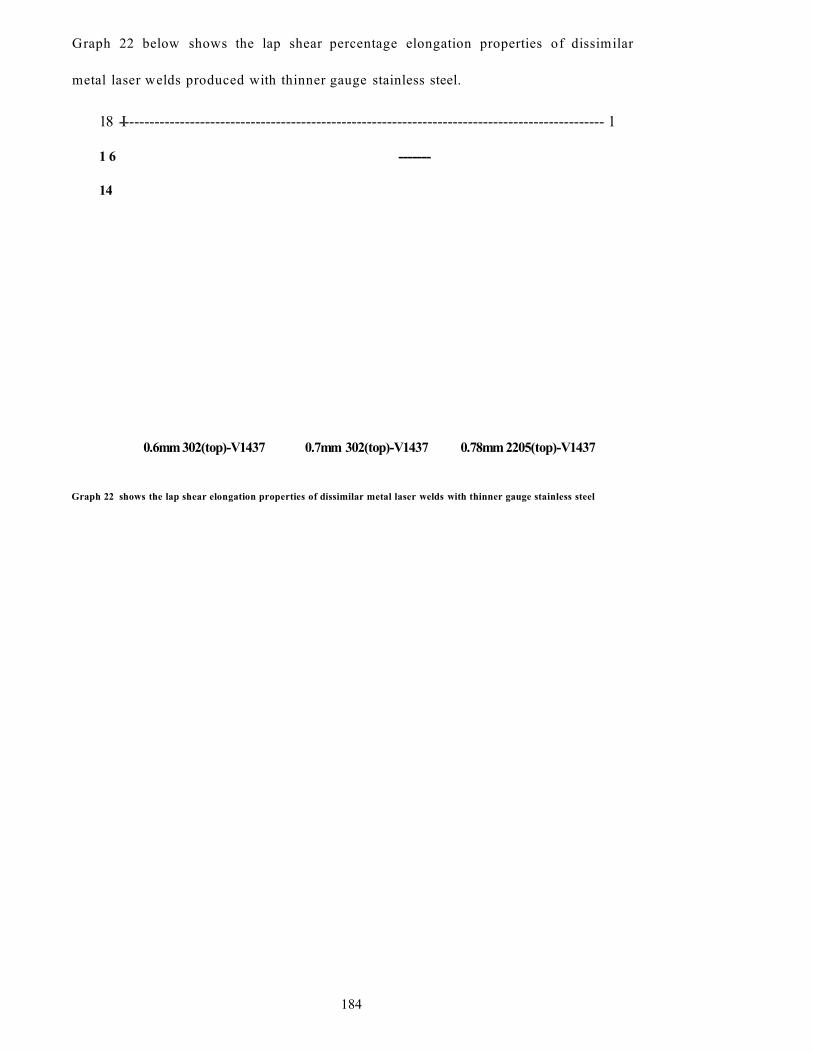
Graph 22 below shows the lap shear percentage elongation properties of dissimilar
metal laser welds produced with thinner gauge stainless steel.
18 -I----------------------------------------------------------------------------------------------- 1
1 6 -------
14
0.6mm 302(top)-V1437 0.7mm 302(top)-V1437 0.78mm 2205(top)-V1437
Graph 22 shows the lap shear elongation properties of dissimilar metal laser welds with thinner gauge stainless steel
184

4.5 Laser-Welded Tensile/Lap Shear Properties - Rofin 2kW C 0 2
Laser Welder (Fatigue Specimen Production)
The Rofin 2kW CO2 laser welding parameters used to produce the similar and
dissimilar metal lap joints were:
2kW (work piece)
lm/min
4mm above top sheet surface
67.5mm
• Welding power:
• Welding speed:
• Focal point:
• Focal length:
Trailing gas flow rate: 20L/min
• Overlap:
• Interfacial gap:
25 mm
None
The welding parameters used to produce the dissimilar metal butt joint were:
• Welding power: 2kW (work piece)
1.5m/min
Omm (sheet surface)
67.5mm
• Welding speed:
• Focal point:
• Focal length:
• Trailing gas flow rate: 20L/min
• Overlap: N/A
• Interfacial gap: N/A
The laser welds produced were:
• 1.2mm V I437 (top) - 1mm 2205 dissimilar metal lap joint
• 1.2mm V I437 (top) - 1mm 2101 dissimilar metal lap joint
• 1mm 2101 - 1mm 2101 similar metal lap joint
• 1.2mm V 1437 - 1 mm 2205 dissimilar metal butt joint
185

Graph 23 below shows the tensile and lap shear properties of the similar and dissimilar
metal laser welded butt and lap joints produced with the Rofin 2kW CO2 laser welder.
800
700
600
_ 500 (0 CL
1, 400 EX 300
200
100
0
Graph 23 Graph to show the tensile and lap shear properties of similar and dissimilar metal laser welded lap and butt joints
• Similar metal 1mm 2101 lap shear failure occurred at the edge of the weld in the
HAZ.
• Dissimilar metal lap shear failure occurred in the parent material of the 1.2mm
V I437 at 45° shear away from the weld for both configurations.
• Dissimilar metal butt joint failure occurred in the parent material of the 1.2mm
V1437 at 45° shear away from the weld.
186

Graph 24 below shows the tensile and lap shear percentage elongation properties of the
similar and dissimilar metal laser welded butt and lap joints produced with Rofin 2kW
CO2 laser welder.
18 T
Graph 24 Graph to show the percentage elongation properties of similar and dissimilar metal laser weld butt and lap joints
187

4.6 Lap Joint Fatigue Properties - Trumpf 5kW C 0 2 Laser Welder
Four dissimilar metal laser welded lap joints were fatigue tested in air to produce an S-
N curve and to determine the statistically valid mean fatigue line load range at 2xl06
cycles. These joints all possessed >100% weld efficiency, that is, lap shear failure
occurred in the parent material of the 1.2mm V1437 zinc-coated mild steel.
The fatigue properties of each joint are presented using the line load range units. This is
simply the applied load range per unit length. This unit allows the comparison of
dissimilar thickness lap joint fatigue properties as no cross section is used to calculate a
relevant stress. It should be noted that the fatigue failures occurred randomly in either
the 1.2mm V1437 or the stainless steel for each configuration. Hence, during the
staircase method, it was common to have failure occurring in both materials for the
same applied load level. This posed problems when calculating the respective stresses
and is illustrated in Graph 25. It is apparent that there are three potential stresses which
can be calculated for a dissimilar metal joint. This can cause discrepancies when
comparing the fatigue properties of dissimilar thickness, dissimilar metal joints. The
line load range unit (N/mm) is the force (N) per unit length (mm) and is not based on an
area; hence, it allows the fatigue properties of dissimilar thickness joints to be compared
more easily also allowing comparison of discontinuous welding processes such as
resistance spot welding. The staircase and S-N curve of the lap joints produced using
the Trumpf laser welder can be found in Appendix 8.1.
188

Graph 25 illustrates the displacement of results that can occur if one of the three
thicknesses is used to calculate a stress. This can lead to misinterpretations when the
fatigue results between dissimilar thickness joints are compared.
1000
■ 1 mm 304 sheet thickness ♦ 1.1 mm Average sheet thickness a 1.2mm V1437 sheet thickness
100
10000 100000 1000000 10000000Cycles to failure
Graph 25 Graph to show the displacement of fatigue results when stress is calculated using different thickness
The applied bending moment unit first used by Linder et al70 was assessed with regard
to lap joint fatigue property comparisons. It can be seen in Graph 26, on the following
page, that the applied bending moment and line load units allow similar comparisons to
be made.
189

Graph 26 compares the lap joint fatigue results from this investigation using both the
applied bending moment and the line load units.
10000
AppliedBendingMoment(Nmm)
1000
xD-
X X□
□ 1.2mm V1437(top)-1mm 304 Lap w eld O l m m 304 (top)-1.2mm V1437 Lap w eld
A 1.2mm V1437 (top)-0.78mm 2205 lap w eld X 0.78mm 2205 (top)-1.2mm V1437 lap w eld■ 1mm LDX2101 lap w eld ▲ 1.2mm V 1437(top) - 1mm LDX2101
♦ 1.2mm V1437 (top) - 1mm 2205
(N/mm)
100000 Cycles to failure100000010000
Graph 26 Fatigue scatter comparison between the applied bending moment and line load units
10000000
Apart from the obvious displacement of results, no significant alternative trends to the
fatigue properties could be made with the applied bending moment comparisons.
For this reason the line load range unit was considered to be the most appropriate and
was used throughout this investigation.
190

1mm 304 (top) - 1.2mm V1437 Fatigue Results
1000
0 1 mm 304(top)-1.2mm V1437
cycles2x10'o<>« 100
10000000100000010000010000Cycles to failure
Graph 27 Graph to show the line load range fatigue properties for the 1mm 304 (top) - 1.2mm V1437 lap joint
Mean Fatigue Line Load Range at 2xl06 cycles
Po + d ( A / F - 0.5 ) = X (N/mm)
54.89 + 2.22 (30 /12 - 0.5 ) = 59.3 (N/mm)
Statistical Validity
( F * B - A 2) / F 2 = >0.3 and <1.2
( 12 * 86 - 302) / 122 = 0.9
Standard Deviation
1.620 * d { ( F * B - A 2) / F 2 + 0.029} = S (N/mm)
1.620 * 2.22 {( 12 * 86 - 302) / 122 + 0.029} = 3.4 (N/mm)
Thus, the mean fatigue line load range at 2xl06 cycles for the lap joint configuration
1mm 304 (top) - 1.2mm V1437 is 59.3 N/mm with a standard deviation of 3.4 N/mm
or 6% and is statistically valid.
191

1.2mm V1437 (top) - 1mm 304 Fatigue Results
1000
a>U)5 100T3(0O0)c
1010000
d d
□ 1.2mm V1437(top)-1 mm 304
DO
2x10⁶ cycles
100000 1000000 Cycles to failure
10000000
Graph 28 Graph to show the line load range fatigue properties for the 1.2mm V1437 (top) - 1mm 304 lap joint
Mean Fatigue Line Load Range at 2xl06 cycles
Po + d ( A / F - 0.5 ) = X (N/mm)
65.44 + 2.22 (26 /1 0 - 0.5 ) = 70.1 (N/mm)
Statistical Validity
( F * B - A 2) / F 2 = >0.3 and <1.2
( 10 * 80 - 262) / 102 = 1.2
Standard Deviation
1.620 * d { ( F * B - A 2) / F 2 + 0.029} = S (N/mm)
1.620 * 2.22 {( 10 * 80 - 262) / 102 + 0.029} = 4.6 (N/mm)
Thus, the mean fatigue line load range at 2xl06 cycles for the lap joint configuration
1.2mm V I437 (top) - 1mm 304 is 70.1 N/mm with a standard deviation of 4.6 N/mm
or 6% and is statistically valid.
192

0.78mm 2205 (top) - 1.2mm V1437Fatigue Results
1000
0)O)£ 100TJ(0o<DC
10 10000
N/ n 7Qrnrr OOnCflnn\ -t 9mm i 7■
X X <X _>
-A>< 4 1o 6 cyt
| -T--1r v ------- —A--- X X A
100000 1000000 Cycles to failure
10000000
Graph 29 Graph to show the line load range fatigue properties for the 0.78mm 2205 (top) - 1.2mm V1437 lap joint
*6M ean Fatigue Line Load Range at 2x10 cycles
P0 + d ( A / F - 0.5 ) = X
50.67 + 2.22 (27 / 8 - 0.5 ) = 57.1
Statistical Validity
( F * B - A 2) / F 2 = >0.3 and <1.2
(8 * 105 - 272) / 82 = 1.7
Standard D eviation
1.620 * d { ( F * B ~ A 2) / F 2 + 0.029} = S
(N/m m )
(N/m m )
(N/m m )
(N/m m )1.620 * 2.22 {( 8 * 105 - 272) / 82 + 0.029} = 6.3
Thus, the mean fatigue line load range at 2xl06 cycles for the lap joint configuration
0.78mm 2205 (top) - 1.2mm V1437 is 57.1 N /m m with a standard deviation of 6.3
N/m m or 11% , this is not statistically valid.
193

1.2mm V1437 (top) - 0.78mm 2205 Fatigue Results
1000
a)o>§ 100■o(0oa)c
1010000
AA-
A 1.2mm V1437(top)-0.78mm 2205
f t 3
100000 1000000 Cycles to failure
2x10⁶ cycles
IS
10000000
Graph 30 Graph to show the line load range fatigue properties for the 1.2mm V1437 (top) - 0.78mm 2205 lap joint
16Mean Fatigue Line Load Range at 2x10 cycles
Po + d ( A / F - 0 . 5 ) = X
61.22 + 2.22 (26 / 10 - 0.5 ) = 65.9
Statistical Validity
( F * B - A2) / F2 = >0.3 and <1.2
( 10 * 76 - 262) / 102 = 0.8
Standard Deviation
1.620 * d { ( F * B - A 2) / F 2 + 0.029) = S
1.620 * 2.22 {( 10 * 76 - 262) / 102 + 0.029) = 3.1
(N/mm)
(N/mm)
(N/mm)
(N/mm)
Thus, the mean fatigue line load range at 2 x l0 6 cycles for the lap joint configuration
1.2mm V1437 (top) - 0.78mm 2205 is 6 5 .9 N /m m with a standard deviation of 3.1
N /m m or 5% and is statistically valid.
194

4.7 Lap and Butt Joint Fatigue Properties - Rofin 2kW CO2 Laser
Welder
Four similar and dissimilar metal laser welded butt and lap joints were fatigue tested in
air to produce an S-N curve and to determine the statistically valid mean fatigue line
load range at 2xl06 cycles. These joints possessed >100% weld efficiency (apart from
the 1mm 2101 similar metal lap joint), that is, tensile and lap shear failure occurred in
the parent material of the 1.2mm V1437 zinc-coated mild steel.
The welds were produced with the following welding parameters:
1.2mm Y1437 (top) - 1mm 2205 & 1mm 2101 - 1mm 2101
1.2mm V1437 (top) - 1mm 2101
• Welding power:
• Speed:
• Focal point:
• Focal length:
2kW (work piece)
lm/min
4mm above top sheet surface
67.5mm
Trailing gas flow rate: 20L/min
• Overlap:
• Interfacial gap:
25 mm
None
The staircase and S-N curve of the butt and lap joints produced using the Rofin laser
welder can be found in Appendix 8.2.
195

1.2mm V1437 - 1mm 2101 butt joint
Welding power: 2kW (work piece)
Speed: 1.5m/min
Focal point: 0mm sheet surface
Focal length: 67.5mm
Trailing gas flow rate: 20L/min
Overlap: N/A
Interfacial gap: N/A
The fatigue properties of each joint are again presented using the line load range units.
196

1.2mm V1437 (top) - 1mm 2205 Fatigue Results
1000
<DU)1 100■CCBO0)c
1010000
♦ 1.2mm V1437(top)-1 mm 2205
2x10⁶ cycles
100000 1000000 Cycles to failure
10000000
Graph 31 Graph to show the line load range fatigue properties for the 1.2mm V1437 (top) - 1mm 2205 lap joint
Mean Fatigue Line Load Range at 2xl06 cycles
Po + d ( A / F - 0.5 ) = X (N/mm)
59.11 + 2.22 (32 / 10 - 0.5 ) = 65.1 (N/mm)
Statistical Validity
( F * B - A2) / F2 = >0.3 and <1.2
( 10 * 114 - 322) / 102 = 1.16
Standard Deviation
1.620 * d { ( F * B - A 2) / F 2 + 0.029} = S (N/mm)
1.620 * 2.22 {( 10 * 114 - 322) / 102 + 0.029} = 4.3 (N/mm)
Thus, the mean fatigue line load range at 2xl06 cycles for the lap joint configuration
1.2mm V1437 (top) - 1mm 2205 is 65.1 N/mm with a standard deviation of 4.3 N/mm
or 1% and is statistically valid.
197

1.2mm V1437 (top) - 1mm 2101 Fatigue Results
1000
E£zCl)O)£ 100■o(0o0)c
1010000
▲ 1.2mm V1437(top)-1 mm LDX2101
▲ ▲............ f
2x10 cycles
100000 1000000 Cycles to failure
10000000
Graph 32 Graph to show the line load range fatigue properties for the 1.2mm V1437 (top) - 1mm 2101 lap joint
Mean Fatigue Line Load Range at 2xl06 cycles
P o + d ( A / F - 0 . 5 ) = X (N/mm)
61.22 + 2.22 (26 / 9 - 0.5 ) = 66.5 (N/mm)
Statistical Validity
( F * B - A2) IF 2 = >0.3 and <1.2
( 9 * 84 - 262) / 92 = 0.99
Standard Deviation
1.620 * d {( F * B - A2) / F2 + 0.029} = S (N/mm)
1.620 * 2.22 {( 9 * 84 - 262) / 92 + 0.029} = 3.7 (N/mm)
Thus, the mean fatigue line load range at 2xl06 cycles for the lap joint configuration
1.2mm V I437 (top) - 1mm 2101 is 66.5 N/mm with a standard deviation of 3.7 N/mm
or 5% and is statistically valid.
198

1mm 2101 - 1mm 2101 Similar Lap Joint Fatigue Results
1000
0)U)1 100■o(0o0)c
10 10000
■ 1mm LDX2101-1mm LDX2101
■I ■ 4 ■ ■i
2x1*f Cyc
1 I] /■ ■ 1 1-----
100000 1000000 Cycles to failure
10000000
Graph 33 Graph to show the line load range fatigue properties for the 1mm 2101 - 1mm 2101 lap joint
Mean Fatigue Line Load Range at 2x10 cycles
P0 + d ( A / F - 0 . 5 ) = X
78.11 + 2.22 (31 / 11 - 0.5 ) = 83.3
Statistical Validity
( F * B - A2) / F2 = >0.3 and <1.2
( 11 * 99 - 3 12) / l l 2 = 1.06
Standard Deviation
1.620 * d ( ( F * B - A 2) / F 2 + 0.029} = S
1.620 * 2.22 {( 11 * 99 - 312) / 112 + 0.029} = 3.9
(N/mm)
(N/mm)
(N/mm)
(N/mm)
Thus, the mean fatigue line load range at 2 x l0 6 cycles for the lap joint configuration
1mm 2101 - 1mm 2101 is 83.3 N /m m with a standard deviation of 3 .9 N /m m or 5%
and is statistically valid.
199

1.2mm V1437 (top) - 1mm 2101 Dissimilar Butt Joint Fatigue Results
1000
a>CT)
2 100TJ(0o0)c
■J— 4>x10° eye
o q oo <ucc) c) 0 0 o ) — J
-----
O 1.2mm V1437-1 mm LDX2101
10 10000 100000 1000000
Cycles to failure10000000
Graph 34 Graph to show the line load range fatigue properties for the 1.2mm V1437 - 1mm 2205 butt joint
\6M ean Fatigue Line Load Range at 2x10 cycles
P0 + d ( A / F - 0 . 5 ) = X
270.22 + 4.44 (22 / 10 - 0.5 ) = 277.8
Statistical Validity
( F * B - A2) / F2 = >0.3 and <1.2
( 10 * 58 - 222) / 102 = 0.96
Standard D eviation
1.620 * d { ( F * B - A 2) / F 2 + 0.029} = S
1.620 * 4.44 {( 10 * 58 - 222) / 102 + 0.029} = 7.1
(N/m m )
(N/m m )
(N/m m )
(N/m m )
Thus, the mean fatigue line load range at 2x10ft cycles for the lap joint configuration
1.2mm V1437 - 1mm 2101 is 277 .8 N /m m with a standard deviation of 7.1 N /m m or
3% and is statistically valid.
200
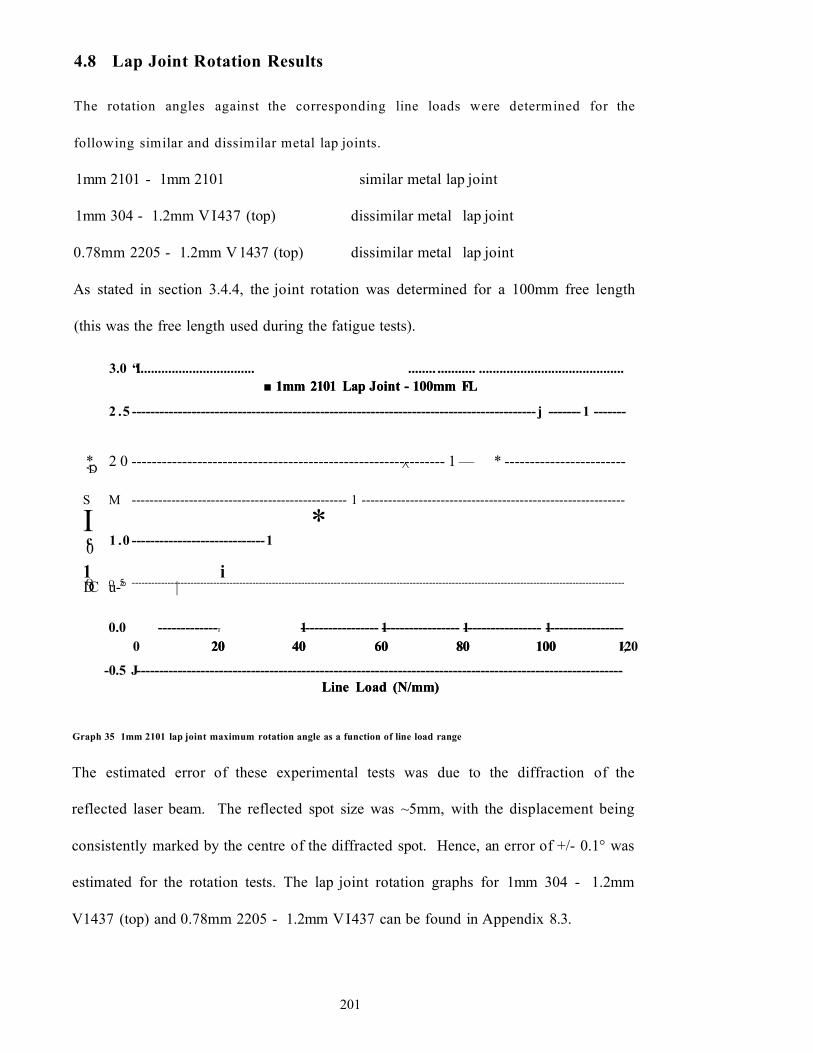
4.8 Lap Joint Rotation Results
The rotation angles against the corresponding line loads were determined for the
following similar and dissimilar metal lap joints.
1mm 2101 - 1mm 2101 similar metal lap joint
1mm 304 - 1.2mm V I437 (top) dissimilar metal lap joint
0.78mm 2205 - 1.2mm V 1437 (top) dissimilar metal lap joint
As stated in section 3.4.4, the joint rotation was determined for a 100mm free length
(this was the free length used during the fatigue tests).
3.0 “I.................................. ........ ........... ..........................................■ 1mm 2101 Lap Joint - 100mm FL
2 .5 ---------------------------------------------------------------------------------------- j ------- 1 -------
* 2 0 -------------------------------------------------------------- 1 — * ------------------------<d ^
S M ------------------------------------------------- 1 ------------------------------------------------------------
I *c 1 .0 -----------------------------101 iO q 5 -------------------------------------------------------------------------------------------------------------------------------------------------------DC u-° |
0.0 -------------T 1----------------- 1----------------- 1----------------- 1-----------------0 20 40 60 80 100 120
-0.5 J----------------------------------------------------------------------------------------------------------Line Load (N/mm)
Graph 35 1mm 2101 lap joint maximum rotation angle as a function of line load range
The estimated error of these experimental tests was due to the diffraction of the
reflected laser beam. The reflected spot size was ~5mm, with the displacement being
consistently marked by the centre of the diffracted spot. Hence, an error of +/- 0.1° was
estimated for the rotation tests. The lap joint rotation graphs for 1mm 304 - 1.2mm
V1437 (top) and 0.78mm 2205 - 1.2mm VI437 can be found in Appendix 8.3.
1mm 2101 Lap Joint - 100mm FL
20 40 60 80 100 V,
Line Load (N/mm)
201

4.9 Metallographic Results
4.9.1 Base Material Metallography
The following images show the base material structures for 304, 2205, 2101 and V1437.
Image 5 below shows the 1.2mm V I437 base material (ferrite and small islands of
pearlite) grain structure. This image was etched with 2% nital.
Image 5 Shows the ‘as received’ 1.2mm V1437 microstructure at x200 magnification
Image 6 below shows the 1mm 304 base material (austenitic) grain structure. This
image was electrolytic etched with 60% nitric acid.
o r / ' - :
•: - . 3
i • ' ' sfe'&A ' - ' i k '
Image 6 Shows the ‘as received’ 1mm 304 microstructure at x200 magnification
202

Image 7 below shows the 1mm 2205 base material grain structure. This image was
potentiostatic etched with 10% w/v Oxalic acid (NaOH). The darker areas are ferrite
and the lighter areas are austenite, approximately 50% of each.
Image 7 Shows the ‘as received’ 1mm 2205 microstructure at x200 magnification
Image 8 below shows the 1mm 2101 base material grain structure. This was
potentiostatic etched using 10% w/v Oxalic acid (NaOH). The darker areas are ferrite
and the lighter areas are austenite, approximately 50% of each.
Image 8 Shows the ‘as received’ 1mm 2101 microstructure - scale bar
203

4.9.2 Weld Bead Metallography
4.9.2.1 Lap Joint Weld Widths
The weld width of each laser welded lap joint was determined to investigate the effects
of the laser welding parameters on the weld width and the effects of weld width on the
fatigue properties of the joints.
Table 20 shows the average weld width (+/-0.05mm estimated error) between the sheets
from each laser welded lap joint.
Laser Welder Lap Joint Configuration Weld Width (mm)
Trumpf 5kW C 021 mm 304 (top) - 1.2mm V 1437 1.31.2mm V 1437 (top) - 1mm 304 1.40.78mm 2205 (top) - 1.2mm V I437 0.91.2mm V1437 (top) - 0.78mm 2205 1.2
Rofin 2kW C 0 21.2mm V 1437 (top) - 1mm 2205 1.41.2mm V1437 (top) - 1mm 2101 1.41mm 2101 - 1mm 2101 1.4
Table 20 Lap joint weld widths between the sheets
204

4.10 Weld Bead Microhardness Results
The following microhardness grids were produced using the procedure stated in section
3.5.2.
4.10.1 Butt Joint Microhardness Results
Butt weld microhardness grids were produced to compare the effects of the welding
parameters on the microhardness and shape of the laser weld beads.
The welding parameters used to produce the dissimilar metal butt joints were:
• Welding power: 3.8kW (work piece)
• Speed: PI = 4.0m/min
P2 = 3.5m/min
P3 = 3.0m/min
• Focal point: Sheet surface
• Focal length: 250mm
• Trailing gas flow rate: 20L/min
Thus, the majority of the welding parameters were fixed, with the welding speed being
altered. In the following graphs, PI, P2 and P3 denote the parameter sets with the
corresponding welding speeds.
205

The following graphs show the distribution of microhardness across the laser butt weld
for the 1mm 304 - 1.2mm V 1437 configuration. LHS = 304, RHS = V1437.
P 1 : 1 mm 3 0 4 - 1 .2m m V143 7 Butt J o in t m icro h a rd n ess Grid
S1
400-450
350-400
300-350
250-300
200-250
150-200
100-150
7 6 5 4
0.25mm Increm ents
0.25mmIncrem ents
Graph 36 Microhardness grid for PI: 1mm 304 - 1.2mm V1437 dissimilar metal butt joint
P2: 1 m m 3 0 4 - 1 .2m m V 14 3 7 B u tt J o in t M ic r o h a r d n e ss Grid
Graph 37 Microhardness grid for P2: 1mm 304 - 1.2mm V1437 dissimilar metal butt joint
400-450 P3: 1 mm 304 - 1 .2mm V 1437 Butt Jo in t M icrohardness Grid
350-400
300-350
250-300
1200-25012 11 10
150-200
9 8 7 6 5 4
0.25mm Increm ents
0.25m mIn crem en ts
100-150
Graph 38 Microhardness grid for P3: 1mm 304 - 1.2mm V1437 dissimilar metal butt joint
*Please note: Originally printed in colour.
206

The following graphs show the distribution of microhardness across the laser butt weld
for the 1mm 2205 - 1.2mm V 1437 configuration. LHS = 2205, RHS = V1437.
400-450 P1: 1m m 2 2 0 5 - 1 .2m m V14 3 7 B utt J o in t M icro h a rd n ess Grid
350-400
300-350
250-300
I 200-250
1 50-200
O 1
S2
S3
-S410 7 6 5 4
0.25mm Increment
0.25mmIncrement
100-150
Graph 39 Microhardness grid for PI: 1mm 2205 - 1.2mm V1437 dissimilar metal butt joint
m 400-450 P 2: 1 m m 2 2 0 5 - 1 .2m m V 1 4 3 7 B u tt J o in t M ic r o h a r d n e s s Grid
0 .2 5 m mIn c r e m e n ts
■ 150-200 0 .2 5 m m I n c r e m e n ts
■ 100-150
Graph 40 Microhardness grid for P2: 1mm 2205 - 1.2mm V1437 dissimilar metal butt joint
400-450 P3: 1 m m 2 2 0 5 - 1 .2m m V 14 3 7 B u tt J o in t M ic r o h a r d n e ss Grid
S1350-400
300-350
250-300
1200-250
1 2 1 1
1150-200
9 8 7 6 5 4
0 .25m m In c r e m e n ts
0 .2 5 m mIn c r e m e n ts
100-150
Graph 41 Microhardness grid for P3: 1mm 2205 - 1.2mm V1437 dissimilar metal butt joint
*Please note: Originally printed in colour.
207

4.10.2 Lap Joint Microhardness Results
Lap joint weld microhardness grids were produced to compare the effects of the
welding configuration on the microhardness and shape of the laser weld beads.
The welding parameters used to produce the dissimilar metal lap joints were:
• Welding power: 3.8kW (work piece)
• Speed: 2.3m/min - 304 dissimilar metal welds
2.6m/min - 2205 dissimilar metal welds
• Focal point: 0.1mm above top sheet surface
• Focal length: 250mm
• Trailing gas flow rate: 20L/min
Thus, the welding parameters were fixed, with the welding configuration being
controlled.
208

The following two graphs show the distribution of microhardness across two dissimilar
metal lap joints. The configurations were:
• 1mm 304 (top) - 1.2mm V I437
4 0 0 -4 5 0
3 5 0 -4 0 0
3 0 0 -3 5 0
2 5 0 -3 0 0
1200-250
15 0 -2 0 0
1 0 0 -150
1 mm 304 (top) -1 .2mm V1437 Lap Joint Microhardness GridS1
fl5 14 13 12 11 10 9 8 7 6 5 4 3
0.25mm Increments
0.25mm Increments
Graph 42 Microhardness grid: 1mm 304 (top) - 1.2mm V1437 dissimilar metal lap joint
• 1.2mm V 1437 (top) - 1mm 304
* 4 0 0 - 4 5 0
3 5 0 -4 0 0
3 0 0 -3 5 0
2 5 0 -3 0 0
■ 20 0 -2 5 0
■ 150-200
■ 100-150
1.2mm V1437 (top) -1 mm 304 Lap Joint Microhardness Grid
0.25mmIncrementsS5
14 13 12 11 10 9 8 7 6 5
0.25mm Increments
Graph 43 Microhardness grid: 1.2mm V1437 (top) - 1mm 304 dissimilar metal lap joint
209
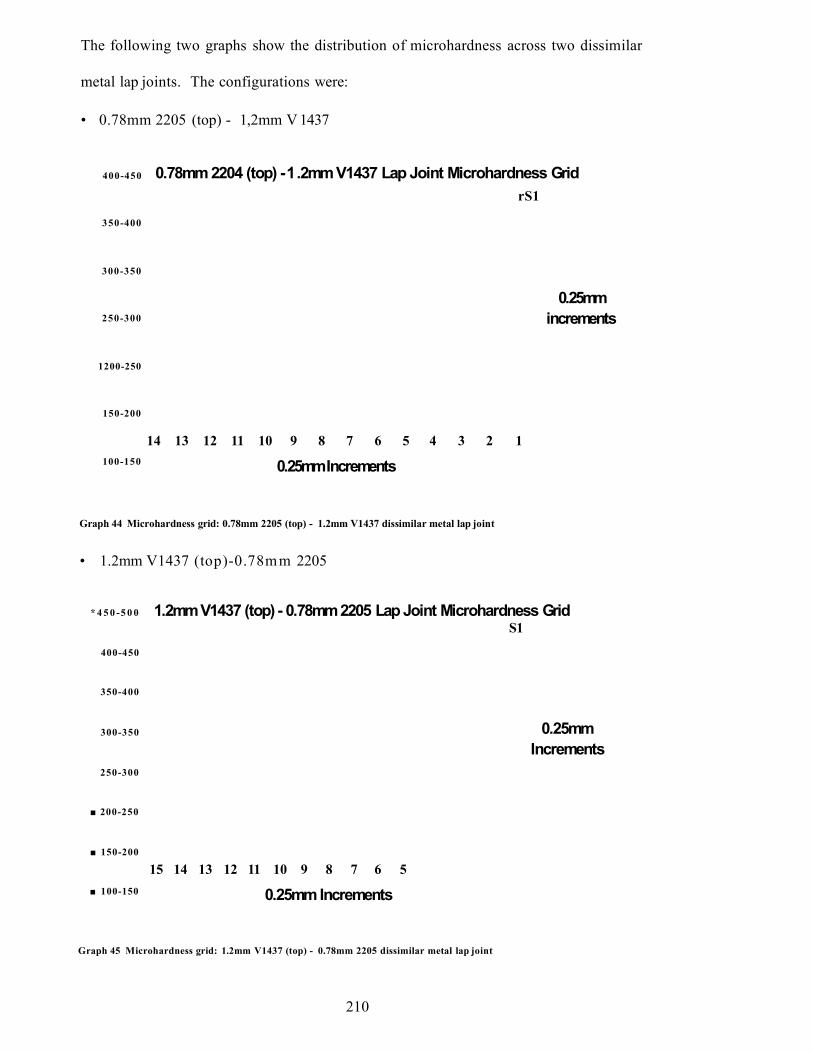
The following two graphs show the distribution of microhardness across two dissimilar
metal lap joints. The configurations were:
• 0.78mm 2205 (top) - 1,2mm V 1437
400-450
350-400
300-350
250-300
1200-250
150-200
100-150
0.78mm 2204 (top) -1.2mm V1437 Lap Joint Microhardness GridrS1
0.25mm increments
14 13 12 11 10 9 8 7 6 5 4 3 2 1
0.25mm Increments
Graph 44 Microhardness grid: 0.78mm 2205 (top) - 1.2mm V1437 dissimilar metal lap joint
• 1.2mm V1437 (top)-0.78mm 2205
* 4 5 0 -5 0 0
400-450
350-400
300-350
250-300
■ 200-250
■ 150-200
■ 100-150
1.2mm V1437 (top) - 0.78mm 2205 Lap Joint Microhardness GridS1
15 14 13 12 11 10 9 8 7 6 5
0.25mm Increments
0.25mmIncrements
Graph 45 Microhardness grid: 1.2mm V1437 (top) - 0.78mm 2205 dissimilar metal lap joint
210

4.11 Weld Bead Composition Results
The composition of the butt and lap joint weld beads was determined using the method
described in section 3.5.4.2. The following images, graphs and corresponding
Schaeffler diagrams show the butt joint dilutions calculated for different welding speeds
and the lap joint dilutions which occurred with the same laser welding parameters for
the different configurations (both the V1437 and the 304 or 2205 at the top of the lap
joint.
The welding parameters used to produce the dissimilar metal butt joints were:
• Welding power: 3.8kW (work piece)
• Speed: PI = 4.0m/min
P2 = 3.5m/min
P3 = 3.0m/min
• Focal point: Sheet surface
• Focal length: 250mm
• Trailing gas flow rate: 20L/min
Thus, the majority of the welding parameters were fixed, with the welding speed being
altered. In the following graphs, PI, P2 and P3 denote the parameter sets with the
corresponding welding speeds.
2 1 1

The welding parameters used to produce the dissimilar metal lap joints were:
• Welding power: 3.8kW (work piece)
• Speed: 2.3m/min - 304 dissimilar metal welds
2.6m/min - 2205 dissimilar metal welds
• Focal point: 0.1mm above top sheet surface
• Focal length: 250mm
• Trailing gas flow rate: 20L/min
Thus, the welding parameters were fixed, with the welding configuration being altered.
212

4.11.1 Butt Joint Weld Bead Compositions
Parameter set 1 (PI): 1 mm 304 - 1.2mm V1437
The following speed maps were produced using a Philips XL40 SEM.
1mm 304 1.2mm V1437
Image 9 Secondary electron image from parameter set 1: 1mm 304 - 1.2mm V1437 butt joint
1mm 304 1.2mm V1437
Image 10 Speed map for Cr from parameter set 1: 1mm 304 - 1.2mm V1437 butt joint
1.2mm V1437
Image 11 Speed map for Ni from parameter set 1 :1mm 304 - 1.2mm V1437 butt joint
213

The two graphs below show the actual percentages of Chromium and Nickel within the
weld bead. PI = 4.0m/min
1 6 -2 0
1 2 -16
8-12
P I: 1mm 304- 1.2mm V1437 Butt Weld % Cr Content
52
0.25mmIncrments
5 3
1 2 3 4 5
0.25mm Increments
Graph 46 Weld bead % Chromium content from parameter set 2 :1mm 304 - 1.2mm V1437 butt joint
P I: 1mm 304- 1.2mm V1437 Butt Weld % Ni Content8-10
6-8
4 -6
2 -4
10-2
0.25mmIncrements
2 3 4 5
0.25mm Increments
Graph 47 Weld bead % Nickel content from parameter set 2: 1mm 304 - 1.2mm V1437 butt joint
214

The data used to produce the weld bead composition graphs was then used to predict the
dilution and phases present in the laser weld bead. The range of composition found in
the weld bead can be seen on the modified Schaeffler diagram below.
3 0
2 5 -
AU5TENITE
U> o Z *
-.oAUSTENITE + X ,
\ M ARTEN SITE XA U ST E N IT E + FE R R IT E
^ M A R T E N S IT %
M ARTENSITE + FE R R IT E
f e r r i t e
IO 15 2 0f e r r i t e zz \z : - .z : : :z
(°/oC r + % M o + t -5 x % S i + 2x<fcN b + 3x<VoTi)
2 5FERRITE ST A B IL ISIN G EQ UIVALENT
3 53 0LISINGSTA B!
Figure 53 Shows the predicted weld bead composition for the 4m/min 1.2mm V1437 - 1mm 304 butt weld
Hence, the predicted weld bead micro structure would be martensite.
The composition analysis of the laser welded butt joints for P2 and P3 can be seen
in Appendix 8.4.
215

4.11.2 Lap Joint Weld Bead Compositions
The composition of the laser welded lap joints were determined to compare the effects
of welding configuration on the dilution and weld bead compositions produced.
1m m 304 (top) - 1.2m m V 1437 & 1m m 304 - 1.2mm V 1437 (top)
3.8kW (workpiece)
2.3m /m in
0.1mm above top sheet surface
250mm
Welding power:
Speed:
Focal point:
Focal length:
Trailing gas flow rate: 20L/min
• Overlap:
• Interfacial gap:
10mm
None
0.78m m 2205 (top) - 1.2mm V 1437 & 0.78m m 2205 - 1.2m m V 1437 (top)
• Welding power: 3.8kW (work piece)
2.6m /m in
0.1mm above top sheet surface
250mm
• Speed:
• Focal point:
• Focal length:
Trailing gas flow rate: 20L/min
• Overlap:
• Interfacial gap:
10mm
None
216

1mm 304 (top) - 1.2mm V1437
The two graphs below show the actual percentages of Chromium and Nickel within the
weld bead.
1 mm 304 (top) -1 .2mm V1437 Lap Joint Weld % Cr Content
0.25mmIncrements
0.25mm Increments
Graph 48 Weld bead % Chromium content: 1mm 304 (top) - 1.2mm V1437 lap joint
1mm 304 (top) - 1.2mm V1437 Lap Joint Weld % Ni Content■ 6 -7 .5
S1
m S2■ 4 .5 -6 | S 3
P ® S4
|-S 5 0.25mm3 -4 .5
S6Increments
I S7
1 .5 -3 S8
W , 1 S91 2 3 4 5 6
■ 0 -1 .5 0.25mmIncrements
Graph 49 Weld bead % Nickel content: 1mm 304 (top) - 1.2mm V1437 lap joint
217

The data used to produce the weld bead composition graphs was then used to predict the
dilution and phases present in the laser weld bead. The range of compositions found in
the weld bead can be seen on the modified schaeffler diagram below.
AUSTENITE
AUSTENITE +
M ARTEN SITEA U ST E N IT E + FERRITE
MARTENS
/M A R T E N SITE \J + FERRITE \
FERRITE
5 iO 15 2 0 2 5 3 0FERRITE ST A B IL ISIN G EQ UIVALENT
(°/oC r +• o/oM o + 1-5 x°/oSi + 2 x % N b + 3x°/oT iJ
ru<£ —
inif)
V143 l * r
Figure 54 Shows the predicted weld bead composition for the 1mm 304 (top) - 1.2mm V1437 lap joint
Hence, the predicted weld bead micro structure would be martensite.
The composition analysis of the laser welded lap joints can be seen in Appendix
8.5.
218

4.12 Fatigue Failure Analysis
As explained in section 3.5.3.2, a range of procedures were used to characterise the
fatigue failure of laser welded lap joints. Optical microscopy was used to characterise
the fatigue failures of dissimilar metal lap joints. All the images were from fatigue
failures produced during the staircase method.
4.12.1 Optical Fatigue Failure Analysis - Dissimilar Metal Lap Joints
The following optical images show lap joint fatigue failure from four dissimilar metal
lap joints. These images show that lap joint fatigue failure occurred in both materials
for each joint configuration within the staircase method.
1mm 304 (top) - 1.20mm V1439 fatigue failures
304
V1439
Image 12 Shows a fatigue specimen in which fatigue failure occurred in the 304
V1439
V1439
304
>
304
>
Image 13 Shows a fatigue specimen in which fatigue failure occurred in the V1439
219

1.20mm V1439 (top) - 1mm 304 fatigue failures
304
V1439
304
Image 14 Shows a fatigue specimen in which fatigue failure occurred in the 304
V1439
V1439
304
Image 15 Shows a fatigue specimen in which fatigue failure occurred in the V1439
220

1.20mm V1439 (top) - 0.78mm 2205 fatigue failures
V1439
2205
2205
Image 16 Shows a fatigue specimen in which fatigue failure occurred in the 2205
V1439
V1439
2205
Image 17 Shows a fatigue specimen in which fatigue failure occurred in the V1439
221

0.78mm 2205 (top) - 1.20mm V1439 fatigue failures
V1439
3J8
2205
2205
Image 18 Shows a fatigue specimen in which fatigue failure occurred in the 2205
V1439
V1439
2205
Image 19 Shows a fatigue specimen in which fatigue failure occurred in the Y1439
222

4.12.2 Optical Fatigue Initiation Analysis - 2101 Similar Metal Lap Joint
The following optical images were taken from staircase fatigue failures (> lx l06 cycles).
A 1mm 2101 similar metal lap joint fatigue failure can be seen in Image 20 below,
where fatigue failure has occurred in the sheet at the bottom of the lap joint. Fatigue
crack initiation occurs at the internal lap face, the crack then propagates across the
sheet. This sample was electrolytic etched in 60% Nital
V " /■' ^ ’■ '
■ ' , * ;; - x ”- ; . . . . - tehs/fr&m-, 'a V
■ ; ; . V ■ ■ ; >' V.:
, { I ■ % ' ^ , 1 % / * c '
. * ' ’s .. : • . 'n r — •'• ~vt' sit
25 micron
Image 20 Fatigue sample cross-section showing fatigue failure in the bottom sheet for 1mm 2101 similar metal lap joint
223

As the following two images show, initiated fatigue cracks do not propagate with
preference to the weld bead or heat affected zone etc.
Image 21 below shows fatigue crack initiation occurring from the internal lap face and
propagation into the weld bead with no apparent plastic deformation or sheet tearing
Image 21 Fatigue crack propagation from the HAZ at the internal lap face into the weld bead
224
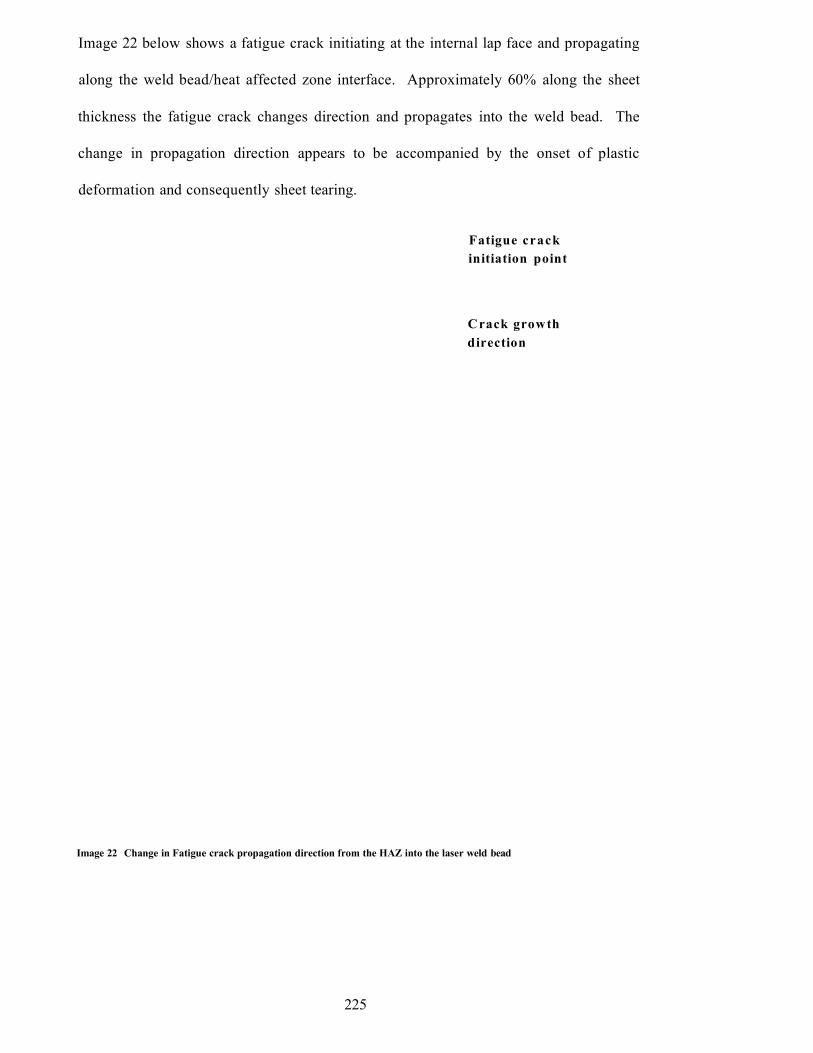
Image 22 below shows a fatigue crack initiating at the internal lap face and propagating
along the weld bead/heat affected zone interface. Approximately 60% along the sheet
thickness the fatigue crack changes direction and propagates into the weld bead. The
change in propagation direction appears to be accompanied by the onset of plastic
deformation and consequently sheet tearing.
Fatigue crack initiation point
Crack growth direction
Image 22 Change in Fatigue crack propagation direction from the HAZ into the laser weld bead
225
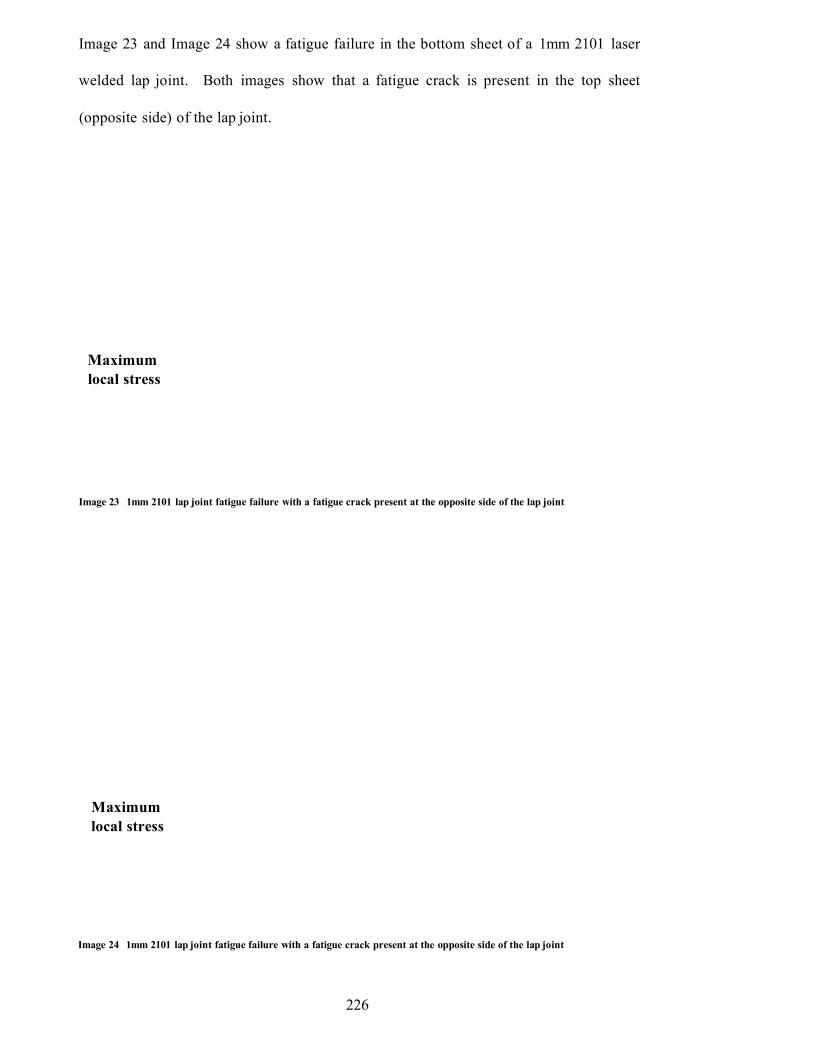
Image 23 and Image 24 show a fatigue failure in the bottom sheet of a 1mm 2101 laser
welded lap joint. Both images show that a fatigue crack is present in the top sheet
(opposite side) of the lap joint.
Maximum local stress
Image 23 1mm 2101 lap joint fatigue failure with a fatigue crack present at the opposite side of the lap joint
Maximum local stress
Image 24 1mm 2101 lap joint fatigue failure with a fatigue crack present at the opposite side of the lap joint
226

Image 25 and Image 26 show the respective close up images of the propagated fatigue
cracks from Image 23 and Image 24. As both the images show, there is no evidence of
plastic deformation in and around the crack area.
50 micron,
Image 25 Close up image of the propagated fatigue crack from Image 23 2101 similar metal lap joint
227

50 m icron
Image 26 Close up image of the propagated fatigue crack from Image 24 2101 similar metal lap joint
228

SEM Fatigue Initiation Analysis - 1mm 2101 Similar Metal Lap Joint
The following SEM images show a close up of 2101 similar metal lap joint fatigue
crack initiation including a further higher magnification image of the crack tip.
Image 27 SEM 2101 similar metal lap joint fatigue crack tip image
Image 28 SEM 2101 similar metal lap joint fatigue crack - same image as Image 26
229

4.12.3 Optical Fatigue Initiation Analysis - Dissimilar Metal Lap Joints
The following optical images were taken from dissimilar metal lap joints. The samples
were fatigue tested; however, the tests were terminated prior to failure and total sheet
separation. The samples were then mounted and analysed for the presence of fatigue
cracks.
The following close up images are taken from the internal lap faces of the sheets. The
illustration below shows the position of images presented.
Figure 55 Schematic diagram showing the positions of the “close-up” dissimilar metal fatigue initiation sites
230

1.2mm V1437 (top) - 1mm 2101 dissimilar metal lap joint
Composite lap joint image showing the presence of fatigue cracks in both materials
Image 29 1.2mm V1437(top) - 1mm 2101 dissimilar metal lap joint showing fatigue cracks in both materials
231
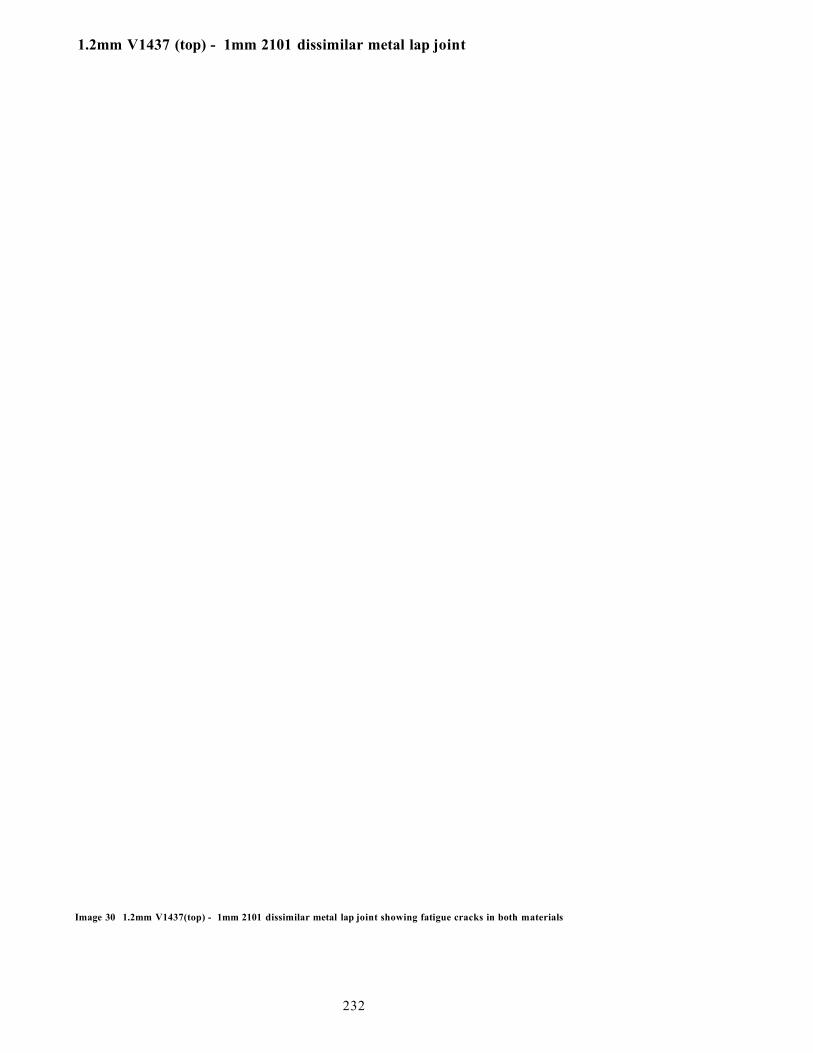
1.2mm V1437 (top) - 1mm 2101 dissimilar metal lap joint
Image 30 1.2mm V1437(top) - 1mm 2101 dissimilar metal lap joint showing fatigue cracks in both materials
232

1.2mm V1437 (top) - 1mm 2205 dissimilar metal lap joint
The following optical images show a 1.2mm V1437 fatigue crack at high magnification.
Image 31 1.2mm V1437(top) - 1mm 2205 lap joint fatigue crack in the 1.2mm V1437
233

The follow ing optical images show a 1mm 2205 fatigue crack at high magnifications.
Image 32 1.2mm V1437(top) - 1mm 2205 lap joint fatigue crack in the 1mm 2205
234

4.12.4 SEM Fatigue Initiation Analysis - Dissimilar Metal Lap Joints
The following SEM images were taken from dissimilar metal lap joints. The samples
were fatigue tested; however, the fatigue tests were terminated prior to failure and total
sheet separation. The samples were then mounted and analysed for the presence of
fatigue cracks.
The following close up images are taken from the internal lap faces of the sheets. The
illustration below shows the position of images presented.
Figure 56 Schematic diagram showing the positions of the “close-up” dissimilar metal fatigue initiation sites
235
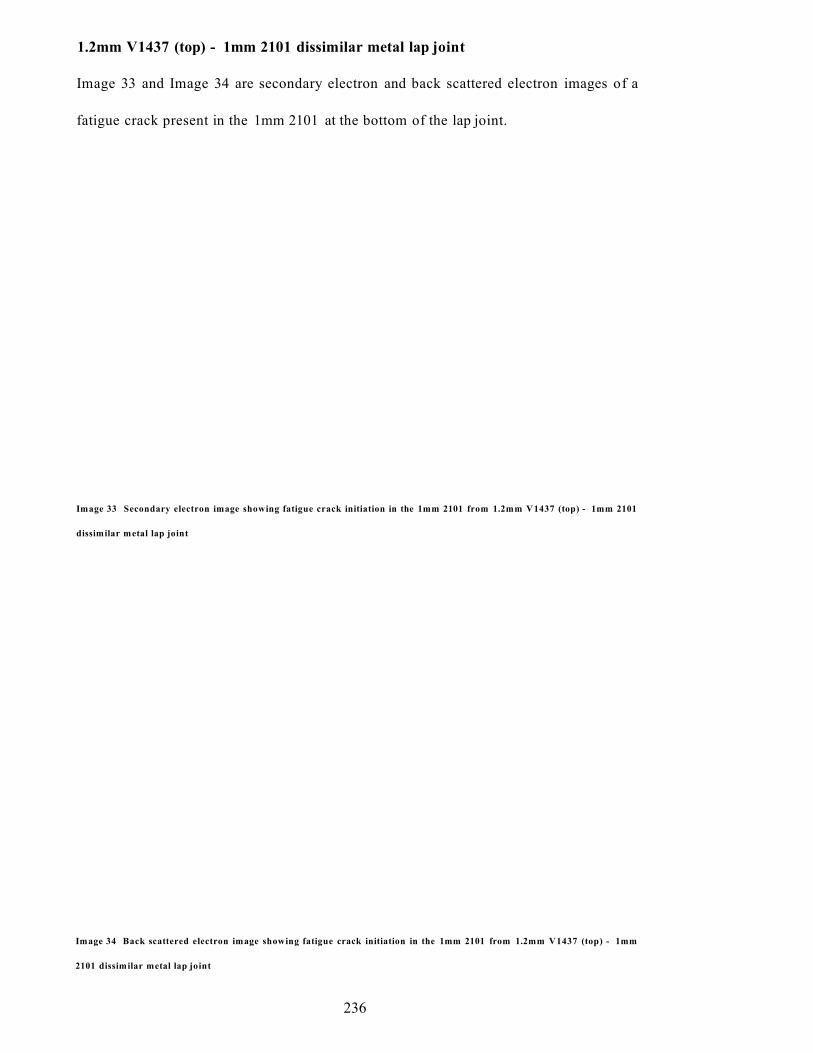
1.2mm V1437 (top) - 1mm 2101 dissimilar metal lap joint
Image 33 and Image 34 are secondary electron and back scattered electron images of a
fatigue crack present in the 1mm 2101 at the bottom of the lap joint.
Image 33 Secondary electron image showing fatigue crack initiation in the 1mm 2101 from 1.2mm V1437 (top) - 1mm 2101
dissimilar metal lap joint
Image 34 Back scattered electron image showing fatigue crack initiation in the 1mm 2101 from 1.2mm V1437 (top) - 1mm
2101 dissimilar metal lap joint
236

Image 35 and Image 36 are secondary electron and back scattered electron images of a
fatigue crack present in the 1.2mm V I437 zinc coated mild steel at the top of the lap
joint.
l l i l l l
Image 35 Secondary electron image showing fatigue crack initiation in the 1.2mm V1437 from 1.2mm V1437 (top) - 1mm
2101 dissimilar metal lap joint
% *
Image 36 Back scattered electron image showing fatigue crack initiation in the 1.2mm V1437 from 1.2mm V1437 (top) -
1mm 2101 dissimilar metal lap joint
237

1.2mm V1437 (top) - 1mm 2205 dissimilar metal lap joint
Image 37 is a secondary electron image of a fatigue crack present in the 1mm 2205
stainless steel at the bottom of the lap joint.
Image 37 Secondary electron image showing fatigue crack initiation in the 1mm 2205 from 1.2mm V1437 (top) - 1mm 2205
dissimilar metal lap joint
Image 38 is a secondary electron image of a fatigue crack present in the 1.2mm V1437
zinc coated mild steel at the top of the lap joint.
Image 38 Secondary electron image showing fatigue crack initiation in the 1.2mm V1437 from 1.2mm V1437 (top) - 1mm
2205 dissimilar metal lap joint
238

4.12.5 Optical Fatigue Failure Analysis - Butt Joints
The following images show the three types of dissimilar metal butt joint fatigue failures.
Image 39 shows a 1.2mm V1437 - 1mm 2101 dissimilar metal butt joint fatigue failure
in the centre of the weld metal.
\
Image 39 1.2mm V1437 - 1mm 2101 dissimilar metal butt joint fatigue failure - centre weld failure
239

Image 40 shows a 1.2mm V1437 - 1mm 2101 dissimilar metal butt joint fatigue failure
in the HAZ of the 1mm 2101 base material.
. 1 i
Image 40 1.2mm V1437 - 1mm 2101 dissimilar metal butt joint fatigue failure - 2101 HAZ failure
Image 41 shows a 1.2mm V I437 - 1mm 2101 dissimilar metal butt joint fatigue failure
in the HAZ of the 1.2mm V 1437 base material.
’%8&m
Image 41 1.2mm V1437 - 1mm 2101 dissimilar metal butt joint fatigue failure - V1437 HAZ failure
240

5 Discussion
5.1 Introduction
The discussions section has been split into the following sections:
o Laser Weld Quality
• Laser weld lap shear/tensile properties - T rum pf 5kW CO 2 laser welder
o Process optim isation and jo in t configuration - lap shear (lap-joint) and
tensile (butt-joint) properties
o M aterial optim isation - lap shear (lap-joint) properties
• Laser weld lap shear/tensile properties - Rofin 2kW CO 2 laser w elder
o Fatigue specim en production - lap shear (lap-joint) and tensile (butt-
joint) properties
• Laser welded lap joint fatigue properties - T rum pf 5kW CO 2 laser w elder
o 1mm 304 (top) - 1.2m m V 1437 dissimilar metal lap joint
o 1mm 304 - 1.2m m V 1437 (top) dissimilar metal lap joint
o 0.78m m 2205 (top) - 1.2mm V 1437 dissimilar metal lap joint
o 0.78m m 2205 - 1.2m m V 1437 (top) dissimilar metal lap joint
• Factors affecting dissimilar metal lap joint fatigue results
o Weld bead microhardness
o Weld bead composition
o Stages of laser welded lap joint fatigue life
o Geometric affects/Joint rotation
• Laser welded lap/butt joint fatigue properties - R ofin 2kW CO 2 laser w elder
o 1mm 2205 - 1.2m m V 1437 (top) dissimilar metal lap joint
o 1m m 2101 - 1.2m m V 1437 (top) dissimilar metal lap joint
241

o 1mm 2101 - 1mm V1437 dissimilar metal butt joint
o 1mm 2101 - 1mm 2101 similar metal lap joint
• Fatigue failure analysis
• Lap joint rotation
o Experim ental R otation
• Factors controlling lap jo in t rotation
o Sim ilar geom etry & rotation angle
o E ffect o f sheet thickness
o E ffect o f interfacial gap
o E ffect o f w eld width
o E ffect o f young’s m odulus
o Partial penetration and double laser welds
o R em oval o f jo in t rotation
• Spot w eld fatigue com parison
242

5.2 Laser Weld Quality
The initial laser welds were produced using the Trumpf 5kW CO2 laser welder. The
aim of the initial welding trials was to determine the highest welding speed whilst
achieving full penetration for the similar and dissimilar metal lap joints. The presence
of zinc at the internal lap face caused some problems with porosity and penetration.
Thus, investigations were carried out and measures were taken to prevent these
problems during the fatigue specimen production using the lower power Rofin 2kW
CO2 laser welder.
The problems and preventative measures will now be discussed.
243
5.2.1 Trumpf 5kW CO2 Laser Weld Quality
As stated in section 2.9.2, slower welding speeds are usually used when laser welding
zinc-coated steel to allow adequate plasma suppression, however, this assumes a similar
metal laser welded zinc-coated steel joint, which has twice the thickness of zinc as the
dissimilar metal joints produced in this investigation. Similarly the use of shims to
allow adequate zinc degasification from the internal lap face is suggested when the zinc
coating thickness is >5pm (hot dipped galvanised coating). Again, this is assuming a
similar metal lap joint configuration, with the dissimilar metal joint possessing half the
zinc-coating thickness.
Thus, during the initial laser welding trials, no shims were used between the lap joints to
allow for zinc degasification and the aim of the welding trials was to determine the
highest welding speed whilst achieving full penetration for the lap joints.
Visual examination of the laser welded lap joint weld beads, however, revealed
occasional signs of surface porosity in the laser weld bead and an occasional breakdown
of penetration, see the following images.
It was noted that more frequent surface porosity occurred when the respective stainless
steel was at the top of the lap joint.
244

Image 42 Weld bead surface porosity in a 1mm 304 (top) - 1.2mm V1437 laser welded lap joint
Image 43 Weld bead surface porosity in a 1mm 2205 (top) - 1.2mm V1437 laser welded lap joint
245

However, surface porosity was also observed when the 1.2mm V I437 was at the top of
the lap joint.
Image 44 Weld bead surface porosity in a 1.2mm V1437 (top) - 1mm 2205 laser welded lap joint
In contrast, the penetration was observed to break down more frequently when the
1.2mm V 1437 was at the top of the lap joint.
Image 45 Weld bead penetration breakdown in a 1.2mm V1437 (top) - 1mm 304 laser welded lap joint
246
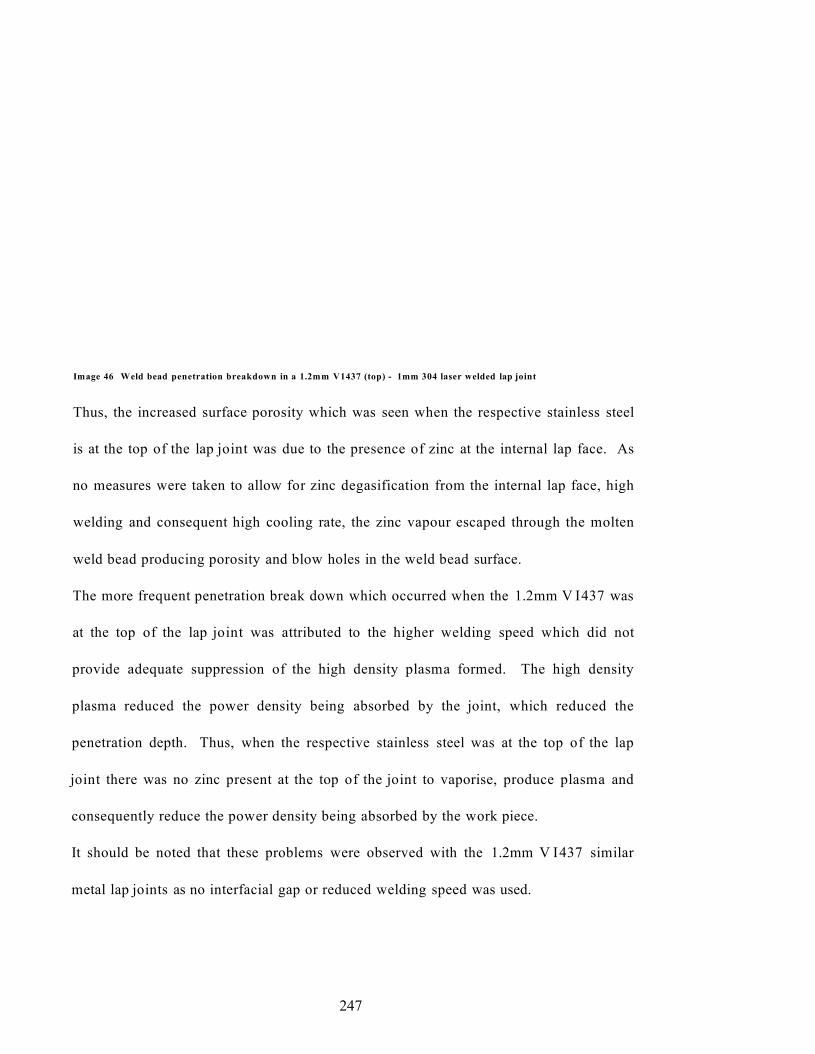
Image 46 Weld bead penetration breakdown in a 1.2mm V1437 (top) - 1mm 304 laser welded lap joint
Thus, the increased surface porosity which was seen when the respective stainless steel
is at the top of the lap joint was due to the presence of zinc at the internal lap face. As
no measures were taken to allow for zinc degasification from the internal lap face, high
welding and consequent high cooling rate, the zinc vapour escaped through the molten
weld bead producing porosity and blow holes in the weld bead surface.
The more frequent penetration break down which occurred when the 1.2mm V I437 was
at the top of the lap joint was attributed to the higher welding speed which did not
provide adequate suppression of the high density plasma formed. The high density
plasma reduced the power density being absorbed by the joint, which reduced the
penetration depth. Thus, when the respective stainless steel was at the top of the lap
joint there was no zinc present at the top of the joint to vaporise, produce plasma and
consequently reduce the power density being absorbed by the work piece.
It should be noted that these problems were observed with the 1.2mm V I437 similar
metal lap joints as no interfacial gap or reduced welding speed was used.
247

Research has been conducted into the mechanism of plasma control during gas-assisted
CO2 laser welding. This research has shown that there is an optimum gas assist
It can be seen from Figure 57, that the optimum gas assist pressure provides a plasma
stream along the rear wall of the cavity. Too high gas assist pressure produces a central
bead with surface porosity as there is no route for the plasma to escape due to the high
gas assist pressure; hence, the vapour is incorporated into the weld bead causing surface
porosity. Too little gas assist pressure does not adequately suppress the plasma
formation, which reduces the energy being absorbed by the work piece.
84 Arata, Y. Electron and Laser Beam Welding in Japan, Japan Institute of Welding, Commission IV, c/o Japan Welding Society, Kandasakumacho 1-11, Chiyodaku, Tokyo, Japan, pp293-30485 Miyamoto, I. Marou, H. Arata, Y. The Role of C 0 2 Laser Welding, Proceedings of ICALEO’84, 44, 1984, pp 1-7
pressure, which is slightly higher than the metal vapour pressure produced8485.
Too weak pressure
U L<>-
Too high pressure Optumum pressureU A « rbeam Nozzte
Figure 57 Effect of gas-assist pressure on plasma suppression in CO 2 laser welding8'
248

Thus, the gas-assist flow rate (helium) which was found to produce the highest quality
welds, in terms o f surface porosity, using the Trumpft 5kW CO2 laser welder was
25L/min. Lower quality laser welds were observed using both 20 and 30L/min gas-
assist flow rate (helium).
It should be noted, however, that porosity was still observed even with the optimum gas
assist pressure.
249
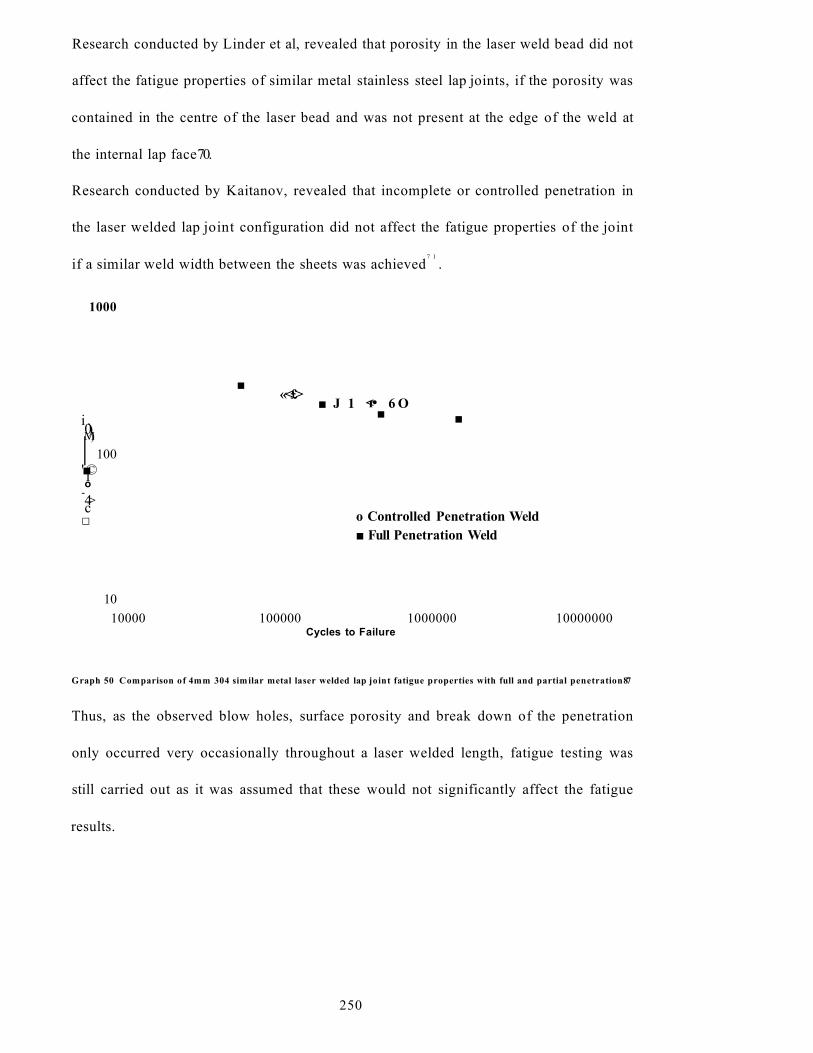
Research conducted by Linder et al, revealed that porosity in the laser weld bead did not
affect the fatigue properties of similar metal stainless steel lap joints, if the porosity was
contained in the centre of the laser bead and was not present at the edge of the weld at
the internal lap face70.
Research conducted by Kaitanov, revealed that incomplete or controlled penetration in
the laser welded lap joint configuration did not affect the fatigue properties of the joint
7 1
if a similar weld width between the sheets was achieved .
1000
i .0)M)| 100'■©1o-4>c□
1010000 100000 1000000 10000000
Cycles to Failure
Graph 50 Comparison of 4mm 304 similar metal laser welded lap joint fatigue properties with full and partial penetration87
Thus, as the observed blow holes, surface porosity and break down of the penetration
only occurred very occasionally throughout a laser welded length, fatigue testing was
still carried out as it was assumed that these would not significantly affect the fatigue
results.
■«<£> ■ J 1 <r• 6 O
■ ■
o Controlled Penetration Weld ■ Full Penetration Weld
250

5.2.2 Rofin 2kW CO2 Laser Weld Quality
As stated in section 3.1.1.4, the Rofin 2kW CO2 laser welder was used to produce four
similar and dissimilar metal laser-welded butt and lap joints for fatigue testing. Two of
which were dissimilar metal laser welded lap joints between stainless steel and 1.2mm
V1437 zinc-coated mild steel.
The weld quality, that is, the consistency of penetration and reduction in the frequency
of blows holes and porosity in the weld was improved by optimising:
• Welding power (kW)
• Welding Speed (m/min)
• Focal position (mm)
The power of the Rofin laser welder (2kW) was lower than that of the Trumpf (5kW) so
a slower welding speed was used. As it can be seen from Figure 14 and Figure 15, the
welding envelope for thinner materials covers a large range of welding power and
speeds, thus allowing the production of welds in the lap joint configuration with full
penetration over a range of welding speeds.
The focal length (distance from the focusing mirror to the work piece), see section 2.9.3,
was shorter for the Rofin laser welding system (65mm - smaller f number) in
comparison to the focal length of the Trumpf laser welding system (250mm). This
produced a greater beam convergence, (seen in Figure 19), however measures had to be
introduced to prevent damage to the focusing mirror owing to zinc spatter. This was
overcome with the use of an air knife, see section 2.9.3.1, which allowed the laser welds
to be produced with a 65mm focal length without damage to the focusing mirror.
251
Defocusing the laser beam reduces the laser power density, and consequently the weld
penetration depth, unless extra power is available to compensate. Also, when using
focusing systems with small f numbers (which produce large beam convergence
angles), setting the focus height to achieve the required spot diameter is difficult
because of the large beam convergence angle producing significant increases in spot
diameter for small vertical movements of the optical system86.
The greater beam divergence of the Rofin laser welding system allowed the effect of the
focal position to be utilised to a greater extent. Hence, a focal position of 4mm above
the surface of the top sheet was selected, which had the effect of defocusing the beam.
The aim was to increase the specific heat input of the process, as the welding speed
would have to be reduced to achieve adequate penetration; ultimately reducing the
solidification rate, thus, allowing more time for the zinc vapour from the internal lap
face to escape through the molten weld bead.
A similar technique has been investigated using twin spot lasers; see section 2.9.2,
which produced an elongated weld bead to allow the zinc vapour to escape through the
molten weld bead.
A lower welding speed was also used to increase the heat input of the Rofin laser
welding system. The welding speed and power of the Rofin produced a heat input of
120 J/mm compared to the heat input of the Trumpf which was 88 J/mm for the
dissimilar metal laser welded lap joints.
The increased specific heat input and defocused beam of the Rofin 2kW CO2 laser
welder produced a slower solidification rate to provide more time for the zinc vapour to
escape through the molten weld bead. The slower welding speed used also provided
adequate suppression of plasma to aid penetration.
S6 Dawes, C. J. Johnson, K. I. Watson, M. N. Developments in Laser Welding of Sheet and Plate, The Welding Institute, Abington Hall, Abington, Cambridge CB1 6AI, UK, pp213-223
252

The result was a series of laser welded lap joints with no porosity or blow holes
observed in the weld beads and consistent penetration along the entire length of the
weld. It should be noted that the use of the twin spot laser was to produce porosity free
welds in similar metal zinc-coated steel laser welds, thus possessing twice the zinc
coating thickness at the internal lap face. Hence, with only half the quantity of zinc
present in the dissimilar metal lap joints, control of the specific heat input and focusing
system was sufficient to remove the problems associated with the zinc coating.
The use of shims to produce a gap at the internal lap face was not introduced, as it was
considered that this may reduce fatigue properties. This effect will be discussed in
detail in section, 5.9.3.
253

5.2.3 Liquid Metal Embrittlement
No signs of LME were evident in any of the dissimilar metal lap joints produced with
1mm 304 austenitic stainless steel. No premature failures or especially low properties
were observed during tensile, lap shear and lap joint fatigue testing throughout the trials,
which could have been attributed to the effects of LME.
Energy dispersive x-ray analysis of the internal lap face of a dissimilar metal laser
welded lap joint revealed the diffusion of zinc into the surface of the 1mm 304
austenitic stainless steel adjacent to the laser weld bead, however, no signs of cracking
were evident. A similar investigation was carried out by Marples, who also observed
diffusion of zinc into the surface of 1mm 304 at the internal lap face of a dissimilar
metal spot welded joint between 1.2mm V1437 - 1mm 304. No reduction in spot
welded lap shear or lap joint fatigue properties were noted4.
254

5.3 Laser Welded Butt Joint Properties - Trumpf 5kW
5.3.1 Similar Metal Laser Welded Butt Joint Properties
As shown in Graph 13 and Graph 14, laser welding speed had no effect on the tensile
strength and elongation properties of the three similar metal butt joints produced. The
mode and positions of failure showed no change with welding speed, with failure
occurring in the parent material of the 1.2mm V I437 and at the edge of the weld for the
respective stainless steel joints. This was expected as the welding envelopes produced
for thin sheets accommodate a wide range of welding speeds and power to produce high
quality welds, see Figure 14.
When compared to the base material tensile properties the elongation to failure for the
1.2mm V1437 weld was similar to the base material, with failure occurring
approximately half way between the grip and the weld at 45° shear after appreciable
plastic deformation.
The elongation to failure for the 1mm 304 and 1mm 2205 similar metal butt joints was
lower than the base material properties for the two respective stainless steel grades. The
stainless steel grades showed no appreciable signs of necking and although the butt
joints achieved the same tensile strength as the parent material stainless steel, failure
occurred prior to achieving the elongation of the parent material, see Table 18 .
255

5.3.2 Dissimilar Metal Laser Welded Butt Joint Properties
Graph 15 shows that the laser welding speed had no effect on the tensile properties of
dissimilar metal butt joints between 1.2mm V1437 - 1mm 304 and 1.2mm V1437 -
1mm 2205. This is due to the lower tensile properties, more specifically the lower
Rp0.2, of the V1437 in comparison to the 1mm 304 and 1mm 2205 stainless steel. Thus
tensile failure occurred in the parent material of the 1.2mm V 1437 at 45° shear.
Laser welding speed had no effect on the dissimilar metal butt joint elongation to
failure, see Graph 16. The elongation to failure, however, does reveal some interesting
points. It can be seen from Graph 16 that the elongations to failure for the 1.2mm
V1437 - 1mm 2205 dissimilar metal butt joints are approximately 60% of the V1437
base material elongation, see Table 18. This is because the yield strength of the 1mm
2205 is higher than the ultimate tensile strength of the 1.2mm V1437 (see Table 7 and
Table 3 respectively) and thus, dop<i nnt nlnstirallv deform durim? the tensile test.
The elongations to failure for the 1.2mm V I437 - 1mm 304 dissimilar metal butt joints
show that both materials had plastically deformed during the tensile tests. The actual
yield strengths for 1.2mm V1437 and 1mm 304 can be seen in Table 3 and Table 4
respectively and shows only a lOMPa difference between the two steels. However, at
the load which equates to the 1.2mm V1437 yield stress, the equivalent stress in the
1mm 304 would be 50MPa above the 304 yield strength; hence, the 1mm 304 would
begin to plastically deform first. Due to the higher work hardening rate of the 1mm 304
in comparison to the 1.2mm V1437, necking would occur preferentially in the 1.2mm
V 1437. The reduction in cross sectional area and increase in stress resulted in failure in
the 1.2mm V I437. This explanation was further substantiated through the observation
of the load - extension graph which showed no definitive yield point as seen in the
256

1.2mm V 1437 base material tensile graph and the 1.2mm V1437 - 1mm 2205 dissimilar
metal butt joint graph.
257

5.4 Laser Welded Lap Shear Properties - Trumpf 5kW Process
Optimisation
5.4.1 Similar Metal Laser Welded Lap Shear Properties
As mentioned in section 4.3.1, poor quality 1.2mm V1437 similar metal lap joints were
produced. The clamping arrangement of the Trumpf 5kW C 02 laser welder was a
hydraulic press, which served to clamp the sheets with an even force over the entire
length of the laser weld. No methods for allowing zinc-degasification of the internal lap
face were introduced, for example shims or slower welding speeds. Thus, the
combination of the high pressure, intimate sheet contact with no interfacial gap and the
presence of two 5 - 7pm zinc coatings led to a breakdown of the laser welding process.
This produced intermittent penetration, frequent blow holes and surface porosity in the
weld bead. When these welds were tested however, most achieved >100% weld
efficiency. Research has shown that the presence of porosity in the laser weld bead may
not always reduce the tensile properties of the joints; if the porosity is contained within
the weld bead and does no break the edge of the weld between the lap face then high
tensile properties may still be achieved. Similarly, research has also shown that partial
penetration laser welds can possess similar tensile and fatigue properties to full
penetration laser welds87.
The effect of the porosity and partial penetration on the tensile properties of the similar
metal 1.2mm V1437 is reduced by its low tensile properties. The high laser weld
hardness (-400 Hv) results in the weld not being suitably stressed for the porosity or
partial penetration to have an effect as the weakest part of the joint is the parent 1.2mm
V 1437, which strains and necks increasing the local stress prior to failure at 45° shear.
258

Table 18 shows the 1.2mm V1437 similar metal lap joint failure occurred in the HAZ.
Both the 1mm 304 and 1mm 2205 similar metal lap shear failures also occurred in the
HAZ at 89% and 95% of the parent material tensile properties respectively. This is due
to the joint configuration. The lap joint configuration, unlike the butt joint
configuration, introduces an applied bending moment to the joint due to eccentricity of
the applied load. This “misalignment” increases the local stress at the internal lap face
adjacent to the weld that results in failure. See section 2.15.2.1 for an explanation of lap
joint rotation. It should be noted that the eccentricity of the applied load and its effects
will be covered in detail in the fatigue discussion section.
Graph 18 shows the elongations to failure for the similar metal lap joints. All three
similar metal lap joint elongations to failure are lower than those achieved by the
respective parent material (see Table 19) and similar metal butt joint elongations (see
Table 18). Again, this was attributed to the rotation, and increase in local stress at the
internal lap face.
259

5.4.2 Dissimilar Metal Laser Welded Lap Shear Properties
Although the similar metal stainless steel lap shear results are affected by rotation and
the local stress at the internal lap face, the dissimilar metal lap joint failures for 1.2mm
V1437 - 1mm 304 and 1mm 2205 occurred in the parent material of the 1.2mm
V1437at 45° shear, (seen in Graph 19). The joint configuration, that is which material
was at the top of the lap joint, had no effect on the lap shear failure.
The % elongation to failure for the 1.2mm V1437 - 1mm 2205 lap joint (both
configurations) was lower than the 1.2mm V1437 - 1mm 304 lap joint (both
configurations), see Graph 20. This was due to the 1mm 2205 not plastically
deforming, so only half the 1.2mm V1438 was accommodating the strain.
This was substantiated by the load - extension graph which showed a definite yield
point for the two configurations.
16
14
12
£&-ceto
1060 2 4 8
Extension (mm)
Graph 51 1mm 2205 - 1.2mm V1437 load extension graph showing a definite yield point
In comparison, the 1.2mm VI437 - 1mm 304 (both configurations) load - extension
graph showed no definite yield point.
260

Graph 20 also allows comparison of the dissimilar metal lap joint % elongations with
the similar metal lap joint elongations to failure. This shows that the 1.2mm V I437 -
lmm 2205 dissimilar metal lap joint elongation is lower than the 1.2mm V1437 similar
metal lap joint elongation; again, because only half the 1.2mm V1437 is
accommodating the strain during the lap shear tests. More interestingly, however, is
comparison of the 1.2mm V 1437 - lmm 304 (both configurations) to the 1.2mm V1437
and lmm 304 similar metal lap joint elongations to failure. The dissimilar joint values
are higher than the 1.2mm V1437 similar metal values, which shows that the strain is
accommodated equally in both materials for the 1.2mm V1437 - lmm 304 and it is the
increased work hardening rate of the lmm 304 that produces failure in the 1.2mm
V1437.
261

5.5 Laser Welded Lap Shear Properties - Trumpf 5kW Material
Optimisation
5.5.1 Dissimilar Metal Laser Welded Lap Shear Properties
Thinner gauges of stainless steel were laser welded to 1.2mm V1437 in order to balance
the tensile properties of the lap joints. It was thought that the very high tensile property
difference between the 1.2mm V1437 and the lmm stainless steel grades, specifically
the lmm 2205 (see Table 3 and Table 7 respectively) would cause fatigue failure to
occur preferentially in the parent material of the 1.2mm V 1437 and not the laser welded
joint. Thus, thinner gauges of 302 austenitic stainless steel and 2205 duplex stainless
steel were welded to 1.2mm V 1437.
It can be seen from Graph 21 that lap shear failure occurred in the parent material of the
0.6 and 0.7mm 302 stainless steel (top) when welded to 1.2mm V1437 in the lap joint
configuration. In comparison, the lap shear failure for the 0.78mm 2205 (top) - 1.2mm
V 1437 occurred in the parent material of the 1.2mm VI437 at 45° shear.
It should be noted that although the tensile properties of the 0.6mm and 0.7mm 302 are
higher than the parent material 1.2mm V1437 failure, the reduced cross - sectional area
of the 302 stainless steel correlated to a lower load to failure than the 1.2mm V 1437 and
hence, 302 parent material failures occurred. The tensile properties of the 0.6, 0.7mm
302 and 0.78mm 2205 can be seen in Table 6, Table 5 and Table 8 respectively.
In comparison, the 0.78mm 2205 yield strength was higher than the ultimate tensile
strength of the 1.2mm V1437 and again did not plastically deform during the lap shear
test.
262

Graph 22 shows the 0.78mm 2205 (top) - 1.2mm V1437 elongation to failure was
lower than the 1.2mm V 1437 similar metal elongation to failure due to only half the
1.2mm V I437 accommodating any strain throughout the lap shear tests.
Similarly, less than half the parent material elongation was achieved with the 0.6 and
0.7mm 302 - 1.2mm V1437 dissimilar metal lap joints. This was due to the 1.2mm
V1437 not accommodating any strain and plastically deforming during the lap shear
test. Consequently, the following joint configurations with “balanced” tensile
properties were selected for fatigue testing.
• 1.2mm V1437 (top) - lmm 304 dissimilar metal lap joint
• lmm 304 (top) - 1.2mm V1437 dissimilar metal lap joint
• 1.2mm V1437 (top) - 0.78mm 2205 dissimilar metal lap joint
• 0.78mm 2205 (top) - 1.2mm V1437 dissimilar metal lap joint
These joints all possessed >100% weld efficiency, that is, lap shear failure occurred in
the parent material of the 1.2mm V1437 away from the weld. The reduced thickness of
the 2205 duplex stainless steel from lmm to 0.78mm was to “balance” the tensile
properties within the dissimilar metal lap joint, due to concerns that the softer parent
material (1.2mm V1437) may fatigue with preference to the laser weld.
263

5.6 Laser Welded Tensile/Lap Shear Properties - Rofin 2kW CO2
Laser Welder (Fatigue Specimen Production)
Graph 23 shows the tensile and lap shear properties of the similar and dissimilar metal
laser welded butt and lap joints produced using the lower powered Rofin 2kW laser
welder. Tensile and lap shear failure occurred in the parent material of the 1.2mm
V I437 for the two dissimilar metal lap joints and dissimilar metal butt joint produced.
This was expected since the yield strength of the lmm 2205 and 2101 was higher than
the ultimate tensile strength of the 1.2mm V1437.
The graph also shows the lap shear properties of the lmm 2101 similar metal lap joint.
It can be seen that the lmm 2101 similar metal lap shear value was 91% of the lmm
2101 parent tensile value, see Table 9 for lmm 2101 parent properties. This is
attributed to the rotation of the lap joint during the lap shear test, with lap shear failure
occurring at the edge of the weld (highest local stress), the same position as the lmm
2205 similar metal lap shear failures.
As shown in Graph 24, the two dissimilar metal lap joints and dissimilar metal butt joint
possessed comparable elongations to failure. This was due to the respective stainless
steels, lmm 2205 and lmm 2101 not plastically deforming.
The relationship between the elongation to failure for the lmm 2101 similar metal lap
joint and the parent material was comparable to the lmm 2205 similar metal lap joints,
achieving 38% of the parent material elongation to failure.
Thus, the four joints lap shear tested were selected for fatigue testing.
264

5.7 Laser Welded Lap Shear Property Comparison
The similar and dissimilar metal laser welded lap shear properties were compared with
resistance spot welded lap shear properties of Marples and Wray for the same
materials4,72. Resistance spot welding is currently the highest volume and most widely
used automotive welding process and thus serves as the benchmark for comparison.
The following graphs are presented in lap shear line load, which is the applied load
divided by the sample width. This unit allows comparison of laser welded lap shear
properties with the discontinuous resistance spot welding lap shear properties. Unless
otherwise stated the scatter of lap shear results was less than +1-1%.
The equations used to calculate the resistance spot weld line load and spot weld
electrode diameter can be seen below.
Equation 13 shows the calculation used to determine the pitch spacing and consequently
the width over which the applied load is divided to produce the line load lap shear value
for the spot welded joints.
(14 x t) + 3 = spot weld pitch, centre to centre (mm)
where: t = sheet thickness
Equation 13 Resistance spot welded pitch spacing equation based on sheet thickness4
Equation 14 is used to calculate the electrode diameter used to produce the comparative
spot welded lap shear properties
5 x (V t) = electrode diameter
where: t = sheet thickness
Equation 14 Resistance spot welded electrode diameter equation based on sheet thickness4
265

5.7.1 Similar Metal Laser Welded Lap Shear Property Comparisons
The following graph shows the similar metal lap shear property comparisons between
laser-welded lap joints and Marples’ resistance spot welded lap joints4.
700
600
| 500MwA5 400cs?| 300T3OJ 200 e3
100
0
Graph 52 Lap shear line load (at fracture) comparison between 1.2mm V1437 spot and laser welded lap joint
The calculated pitch distance between the spot welds was 19.8mm with a nugget
diameter of 6mm.
Thus, the graph shows that the 1.2mm V1437 spot welded joint is capable of
withstanding a higher applied load per unit length than the 1.2mm V1437 laser welded
lap joint. The mode of failure for the spot welded joint was by nugget pull out, which is
the preferred mode of failure and denotes a high quality spot weld.
1.2mm V1437 Spot Weld 1.2mm V1437 Laser Weld
266

The following graph shows the similar metal lap shear property comparisons between
laser-welded lap joints and Wray’s resistance spot welded lap joints72.
900
800
700
S 600s§ 500CS2 400.5^ 300
200
100
0
Graph 53 Lap shear line load (at fracture) comparison between lmm 2205 spot and laser welded lap joint
The calculated pitch distance between the spot welds was 17mm with a nugget diameter
of 5mm. Thus, the graph shows that the lmm 2205 laser weld is capable of
withstanding a higher applied load per unit length than the lmm 2205 spot weld.
Again, the mode of failure for the spot welded joint was by nugget pull out, which is the
preferred mode of failure and denotes a high quality spot weld.
1mm 2205 Spot Weld 1mm 2205 Laser Weld
267

Graph 54, below, shows the lmm 2101 laser welded lap shear properties compared with
Wray’s lm m 2101 spot welded joint72.
800
700
600
| 500§.| 400
3 300
200
100
0
Graph 54 Lap shear line load comparison between lmm 2101 spot and laser welded lap joint
The calculated pitch distance between the spot welds was 17mm with a nugget diameter
of 5mm. Thus, the graph shows that the lmm 2101 laser weld is capable of
withstanding a similar load per unit length than the lmm 2101 spot weld when the
scatter is taken into account (+/-1%).
The mode of failure for the spot welded joint was by nugget pull out, which is the
preferred mode of failure and denotes a high quality spot weld.
1mm 2101 Spot Weld 1mm 2101 Laser Weld
268
This further encouraged the use of the line load range to present the fatigue curves due
to the problems of selecting a relevant cross-sectional area over which to calculate the
stress.
As can be seen from Graph 27, the statistically valid mean fatigue line load range
(2xl06 cycles) for the lmm 304 (top) - 1.2mm V1437 laser welded lap joint was 60.3
N/mm with a standard deviation of 3.4 N/mm.
The 1.2mm V1437 (top) - lmm 304 laser welded lap joint and 1.2mm V1437 (top) -
0.78mm 2205 laser welded lap joint mean fatigue line load ranges (2xl06 cycles) were
71.1 N/mm with a standard deviation of 4.6 N/mm and 66.9 N/mm with a standard
deviation of 3.1 N/mm (shown in Graph 28 and Graph 30 respectively). Both these
staircases were statistically valid.
One staircase, however, was not statistically valid, see Graph 29. The 0.78mm 2205
(top) - 1.2mm V I437 laser welded lap joint mean fatigue line load range (2xl06 cycles)
was 58.1 N/mm with a standard deviation of 6.3 N/mm. This was attributed to the
introduction of an inconsistent gap between the sheets along the length of the weld. The
Trumpf 5kW CO2 laser welder used a hydraulic press to intimately clamp the sheets
during the laser welding process. Observations of the joint configuration, for alignment,
prior to laser welding showed the 0.78mm sheet on top of the lap joint deflecting
slightly with the applied force of the press. This produced a slight inconsistent gap
between the sheets which, in turn, reduced the weld width between the sheets which
produced an increase in the scatter of the fatigue results and ultimately prevented the
statistical validity of the staircase. A schematic diagram illustrating this effect can be
seen in Figure 58.
270

Fixed Clamp
Pressure
l.:
0.78mm 2205
Pressure
Laser Beam
Figure 58 Schematic showing deflection and introduction of a gap in the 0.78mm 2205 (top) - 1.2mm V1437 lap joint
It can be seen that slight deflection of the 0.78mm 2205 occurred during the production
of the laser welds. As well as affecting the statistical validity of the staircase, the
reduced weld width and introduction of a gap between the sheets reduced the fatigue
properties of the joint. Thus, it can be seen that this joint configuration achieved the
lowest fatigue properties of the four dissimilar metal lap joints produced using the
Trumpf 5kW CO2 laser welder.
The following graphs compare the effects of joint configuration and weld width on the
fatigue properties of the four dissimilar metal laser welded lap joints produced using the
Trumpf 5kW CO2 laser welder. It should be noted that only the failures were used in
the generation of the following comparative graphs as this allowed a more accurate
trend line to be inserted for ease of comparison.
271

The following graph shows the effect of joint configuration and weld width on the
fatigue properties of the 1.2mm V I437 - lmm 304 dissimilar metal lap joints.
1000
□ 1.2mm V1437(top)-1mm 304: Weld width=1.4mm
0 1 mm 304 (top)-1.2mm V1437: Weld width=1.3mm
0X)
10070.159.3
10000 100000 1000000 10000000Cycles to failure
Graph 55 Joint configuration fatigue comparison for 1.2mm V1437 - lmm 304 dissimilar metal lap joints
The mean fatigue line load ranges were 70.1 N/mm for the 1.2mm V1437 (top) - lmm
304 and 59.3 N/mm for the lmm 304 (top) - 1.2mm V1437. Thus, it can be seen that
slightly higher fatigue properties were achieved when the 1.2mm V I437 was at the top
of the lap joint. It is interesting to note the laser weld widths between the sheets for the
corresponding lap joints, see Table 20. A weld width of 1.4mm was determined for the
1.2mm V1437 (top) - lmm 304 and 1.3mm for the lmm 304 (top) - 1.2mm V1437 lap
joint. It would appear that increasing the weld width between the sheets increases the
fatigue properties of the joint.
272

A similar trend can be seen in the following graph for the 1.2mm V1437 - 0.78mm
2205 lap joint fatigue comparison.
1000
A 1.2mm V1437 (top)-0.78mm 2205: Weld width=1.2mm
X0.78mm 2205 (top)-1.2mm V1437: Weld width=0.9mm
100x :
10000000100000 100000010000Cycles to failure
Graph 56 Joint configuration fatigue comparison for 1.2mm V 1437 - 0.78mm 2205 dissimilar metal lap joints
The mean fatigue line load ranges were 65.9 N/mm for the 1.2mm V1437 (top) -
0.78mm 2205 and 57.1 N/mm for the 0.78mm 2205 (top) - 1.2mm V 1437. Thus, it can
be seen that higher fatigue properties were achieved when the 1.2mm V1437 was at the
top of the lap joint. The laser weld widths between the sheets for the corresponding lap
joints can be seen in Table 20. A weld width of 1.2mm was determined for the 1.2mm
V1437 (top) - 0.78mm 2205 and 0.9mm for the 0.78mm 2205 (top) - 1.2mm V 1437 lap
joint.
273

This corroborates research carried out by Linder et al and results presented by Kaitanov
for similar metal laser welded lap joints, who discovered that increasing the weld width
increased the fatigue properties70,87.
It should be noted that a higher weld width was achieved when the 1.2mm V I437 was
at the top of the lap joint. This was observed for both sets of dissimilar metal lap joints
produced, however, the welding parameters (welding power and speed) were the same
for each joint configuration.
Hence, analysis of the four dissimilar metal lap joints produced using the Trumpf 5kW
CO2 laser welder presented the following questions:
• Why were wider laser weld widths achieved when the 1.2mm V1437 was at the top
of lap joint for both sets of dissimilar metal lap joints for the same welding
parameters?
• Why did the lap joints with the wider weld width possess higher fatigue properties?
For these reasons, an investigation was conducted using the following tests and
techniques to determine the factors affecting dissimilar metal lap joint fatigue strength.
• Laser weld microhardness
• Weld bead composition
• Lap joint rotation
The effects of each will now be discussed.
87 Kaitanov, A. Comparable investigation o f fatigue strength o f laser welded overlap joints with full or controlled penetration, ASAB research foundation report, 97.1-5
274

5.9 Factors Affecting Laser Welded Lap Joint Fatigue Strength
As previously stated, the following areas were investigated to determine the effects of
the laser welding parameters and joint configuration on the properties of laser welded
butt and lap joints, the aim being to determine the factors affecting laser welded lap
joint fatigue properties.
5.9.1 Weld Bead Microhardness
As explained in section 3.5.2, microhardness grids in 0.25mm increments were
produced across a transverse section of the laser weld bead. The microhardness grids
not only show the distribution of hardness across the weld bead, but indicate the weld
bead shape and thus, can also be used to analyse the effects of the laser welding
parameters, specifically welding speed, on the size and shape of the laser weld
produced.
5.9.1.1 Dissimilar Metal Butt Joint Laser Weld Microhardness
Graph 36 to Graph 38 show the effects of three laser welding speeds, (4m/min,
3.5m/min and 3m/min) on the shape and microhardness of 1.2mm V1437 - 1mm 304
dissimilar metal laser welded butt joints.
Analysis of the three graphs showed that decreasing the welding speed from 4 m/min to
3m/min reduced the microhardness of the weld bead to <400Hv. This may improve the
formability of the laser weld in, for example, the production of a composite blank where
forming is carried out after welding, see Figure 2.
There is also a distinct change in the weld bead shape as the welding speed is reduced.
This is attributed to the thermal properties of the dissimilar metals. As can be seen from
Table 2, the thermal conductivity of mild steel is much greater than that of the three
stainless steels. This allows the heat input from the laser welder to be more readily
275

dissipated in the mild steel than in the respective stainless steel grades, which tend to
contain the heat input. This results in a laser weld bead whose geometry changes abrupt
on the stainless steel side of the butt joint. As the welding speed is reduced, this effect
is reduced and the weld bead shape becomes much more uniform. As well as
comparing the microhardness plots this effect can also be seen in the three secondary
electron images of the laser welds produced with the respective welding speeds. This
serves to validate the method of weld bead shape analysis through the use of a
microhardness grid.
Parameter set 1 (4m/min): 1mm 304 - 1.2mm V1437
lmm 304
ansm im
1.2mm V1437
Image 5 Secondary electron image from parameter set 1: lmm 304 - 1.2mm V1437 butt joint
Parameter set 2 (3.5m/min): lmm 304 - 1.2mm V I437
lmm 304 1.2mm V1437
Image 8 Secondary electron image from parameter set 2: lmm 304 - 1.2mm V1437 butt joint
276

Parameter set 3 (3m/min): lmm 304 - 1.2mm V I437
lmm 304 1.2m m V 1437
Image 11 Secondary electron image from parameter set 3: lmm 304 - 1.2mm V1437 butt joint
A similar trend can be seen for the lmm 2205 - 1.2mm V1437 dissimilar metal butt
joints in Graph 39 to Graph 41. The same three welding speeds were used (4m/min,
3.5m/min and 3m/min) and similar effects on the microhardness of the weld bead can be
seen. With a welding speed of 3m/min, the laser weld bead possessed more areas with
lower hardness than the welds produced at the increased laser welding speeds.
The shapes of the laser welds also follow the findings from the 1.2mm V I437 - lmm
304 dissimilar metal butt joints, a welding speed of 4m/min producing a non-uniform
weld bead due to the differences in the thermal conductivity of the mild steel and duplex
stainless steel.
Thus, welding parameters can be used to control the hardness of laser weld beads and
overcome the effects caused by the differing thermal properties of dissimilar metal laser
welded butt joints to produce welds with a uniform appearance.
It should be noted that no change in tensile properties was seen for the laser welds
produced at the three welding speeds with failure occurring in the parent material of the
mild steel.
277

5.9.1.2 Dissimilar Metal Lap Joint Laser W eld M icrohardness
Graph 42 and Graph 43 show the distribution of microhardness in the lmm 304 -
1.2mm V1437 (both configurations) lap joints. It can be seen that both laser weld beads
contain areas with microhardness >400 Hv and softer areas in the range of 350 -
400Hv.
A similar effect can be seen in the distribution of microhardness in the 0.78mm 2205 -
1.2mm V1437 lap joints (both configurations) shown in Graph 44 and Graph 45. There
is, however, an area in the 1.2mm V1437 (top) - 0.78mm 2205 weld which achieved in
excess of 450Hv. It would seem likely that this is due to the higher cooling rates
associated at the bottom of the lap joint during the laser welding process.
The most important comparison that can be made between the graphs is of the
microhardness of the material at the internal lap face. Because these values are similar,
one could propose that tensile properties would also be comparable and thus have
similar fatigue crack initiation susceptibility. This will be discussed in more detail in
section 5.9.4.
Another comparison that can be made between the two sets of graphs is in the shape of
the laser weld bead. It can be seen that the laser weld bead produced with the lmm 304
on the top of the lap joint is non-uniform with a narrow penetration into the 1.2mm
V1437 being achieved. The laser weld bead produced with the 1.2mm V1437 on the
top, in comparison, is more uniform with a greater penetration width into the lmm 304
being achieved.
The weld bead shapes produced using the 0.78mm 2205 show the same trend. A more
uniform weld bead is achieved when the 1.2mm V1437 is at the top of the lap joint,
with a greater penetration width into the lower sheet being achieved. In comparison, a
non-uniform weld bead is produced when the 0.78mm 2205 is at the top of the lap joint,
resulting in narrow penetration into the 1.2mm 1437.
278

This, as explained in section 5.9.1.1, is due to the thermal properties of the mild steel
and respective stainless steel.
When the stainless steel grade is at the top of the lap joint, the lower thermal
conductivity, which is approximately half that of the mild steel, results in heat being
contained in the stainless steel. As heat is conducted through the stainless steel to the
V1437 at the lap joint interface this heat is transferred more readily into the V1437
away from the lap joint interface producing a thin penetration into the V I437. This heat
transfer situation can be seen in the following schematic diagram.
Laser Beam
/"'I , • a . aStainless Steel« _
' n n n n n n—. — — —. k.
Figure 59 Schematic diagram showing weld bead formed due to base material thermal property differences - stainless steel
on the top of the lap joint
Image 47 below shows the weld bead shape for lmm 304 (top) - 1.2mm V 1437.
279

Image 47 Weld bead shape obtained when the lmm 304 stainless steel is at the top of the lap joint
In comparison, when the 1.2mm V1437 is at the top of the lap joint, the heat is
transferred readily through the material to the internal lap face. The heat is then
transferred through the stainless steel at a lower rate, thus producing a wider weld
penetration into the stainless steel. This is illustrated in the simple heat transfer
schematic diagram seen below.
Laser Beam
IMild Steel
WWW/
lOLOXLQTlj \ M L /y a m *
Stainless Steel
Figure 60 Schematic diagram showing weld bead formed due to base material thermal property differences - mild steel on
the top of the lap joint
Image 48 shows the weld bead shape for 1.2mm V 1437 (top) - 0.78mm 2205
280

Image 48 Weld bead shape obtained when the 1.2mni V1437 is at the top of the lap joint
This explains why wider weld widths were seen when the 1.2mm VI437 was at the top
of the lap joint for the same welding parameters compared to when the respective
stainless steel was at the top of the lap joint.
5.9.2 Weld Bead Compositions
5.9.2.1 Butt Joint Weld Bead Compositions
Due to the low general heat input (high specific heat input) of the laser welding process,
very high cooling rates are achieved. These high cooling rates do not provide sufficient
time for the weld bead to become homogenous. Research conducted by Lampa et al19,
showed that ‘stirring’ of the laser weld occurs due to the effects of thermo-capillary
flow (Marangoni convection) with surface velocities in the order of lm/s. The driving
forces for thermo-capillary flow in laser weld pools being described by two
phenomena88.
1. Surface tension flow
2. Buoyancy force
M Wang, Y.H. Kou, S Driving Forces for Convection in Weld Pools. Proceedings o f the international Conference on Trends in Welding Research. May 18-22, 1986, Galinburg, TE, USA, pp. 65-69..
281
This stirring mechanism is produced by the temporal heat distribution within the laser
weld bead, which produces surface tension driven flow and buoyancy flow. The
material at the edges of the weld bead posses the lowest temperature as they are cooled
by the surrounding parent material, while the highest temperature is at the centre of the
weld bead.
This can be seen in Figure 61, which shows the temperature distribution on a 304
stainless steel surface heated with a laser beam with a Gaussian beam distribution24.
282
I
2.W5£’I3:2j<r2*e*»3
M i » £ * # 3
i . m f - I S
1 Wtt+99 l.7W £*PS
| i 31?€*«3
I JL1**C«C9$I
# .S 9 ? £ * I2
17 U27t*t7
8 . 2* 2£**2
5 .1 * 2 £ * «
* ,W 2 C * M
Figure 61 Temperature distribution on the surface of 304 stainless steel produced by a laser beam with a gausssian distribution2''
In the same way, the heat distribution across the transverse section of a similar metal
laser welded butt joint can be seen in Figure 62. Due to the lack of surface active agents
such as sulphur and oxygen, which can reverse flow direction, the surface tension
driven flow is from the centre to the edges of the laser weld bead.
283

Temperature
Figure 62 Heat distribution across the transverse section of a laser welded butt joint
The combined effect of the surface tension and buoyancy forces cause the cooler, more
dense, molten weld metal at the edges of the weld bead to flow downward, whilst the
hotter, less dense, molten weld metal in the centre of the weld bead flows upwards
producing a stirring mechanism. This, in conjunction with the high cooling rate, owing
to the high specific heat input of the laser welding process, results in a weld bead with a
very inhomogeneous composition.
This effect can be seen clearly in the composition maps for chromium and nickel for the
dissimilar metal butt joints and appears to become more pronounced at the lower
welding speeds. This is due to the greater quantity of stainless steel being melted, as
seen from the more uniform weld bead shape produced at the lower welding speeds,
although the cooling rate is still sufficiently high to prevent homogeneity.
Comparison of the range of predicted weld microstructure reveals the extent that
welding speed has on the relative amounts of both parent materials melted which forms
284

the weld bead. The following figures show the effects of welding speed on the
predicted compositions of the dissimilar metal laser welded butt joint weld beads
3 0
25
AU 5TENITE
o\°AUSTEN1TE +
v MAR.TEN5ITE' afU ^> —"7 \ .r"* U5TENSTE + F E ft R > T E
/ ' • • : < x ' ' '
/M A R T E N S iT E / +■ FE R R IT E
FERRITE
lO 20 2 5FERRITE ST A B IL ISIN G EQUIVALENT
3 53 0FERR TE STA LISINGBS
(R'oCr +- °/oMo + ISxo/oSi + 2 x % N b + 3**/oTi]
Figure 63 Effect of welding speed on the dilution and predicted weld bead compositions-lmni 304 - 1.2mm V1437 butt joint
The three arrows on Figure 63 denote the range of composition found in each lmm 304
- 1.2mm V 1437 butt joint weld bead. The smallest arrow denotes the 4m/min butt weld
speed, with 3.5m/min and 3m/min represented by the middle and largest arrows
respectively.
This shows that decreasing the laser welding speed increases the range of compositions
present in the laser weld bead, demonstrated by the increase in arrow size on the graph.
The weld beads remain inhomogeneous at the lower welding speeds due to the high
solidification rate of the laser welding process (low general heat input). It can be seen
that at the lowest welding speed of 3m/min, the largest amount of stainless steel is
285

melted, producing areas within the weld bead which contain up to 13 % chromium and
6% nickel.
Similarly, reducing the welding speed produced areas within the weld bead with a
composition near the base material of the 1.2mm V1437. This corroborates the
observation made in section 5.9.1.1, which shows that the shape of the weld bead
becomes more uniform at lower welding speeds, with an increased weld bead
penetration into the stainless steel. Thus, decreasing the welding speed increases the
chromium and nickel contents found in the laser weld beads. This is also illustrated in
the chromium and nickel butt weld content graphs which show net percentage increases
in both chromium and nickel as the welding speed decreases.
Graph 78 and Graph 79 show the percentage of chromium and nickel in the weld bead
for the lmm 304 - 1.2mm V1437 butt joint produced at 3m/min. These graphs when
compared to their respective speed maps for chromium and nickel (Image 57 and Image
58 respectively) show the effects of the stirring mechanism. A high chromium and
nickel content flow can be seen moving down at the weld bead-304 stainless steel
interface (more dense) and flowing upwards at the centre of the weld bead (less dense).
The interesting point noted from this investigation is that reducing the welding speed
does not increase the homogeneity of the laser weld bead. In contrast, reducing the
welding speed produces a more pronounced range of compositions in the dissimilar
metal butt weld bead, with small predicted areas of martensite + austenite in the weld
bead for the 3m/min butt joint; however none was observed. The higher welding speeds
(3.5m/min and 4m/min) producing a fully martensitic weld.
286

AUSTENITE
"X AUSTENITE + X\
MARTENSITE' / 0 2205
^ /
AUS*g?NJT£ + FERRITE
/ m a r t e n s i t e+■ F E R R IT E
F E R R I T E
~ 0 5 ............. iO 15 2 0 2 5 3 0 ' 35~F E R R I T E S T A B I L I S I N G E Q U I V A L E N T
( % C r + % M o + l - 5 x % S i + 2 x % N b + Sx^ oT i]
Figure 64 Effect of welding speed on the dilution and predicted weld bead coinpositions-0.78mm 2205 - 1.2mm V1437 butt
joint
A similar trend can be seen with the 0.78mm 2205 - 1.2mm V1437 butt welds produced
at the three laser-welding speeds. Again, the larger arrows correspond to the slower
welding speeds which result in an increase in the range of compositions found in the
weld bead. There is however, little effect on the predicted phase of the laser weld bead
which is martensite, corroborated by the high weld bead microhardness >400Hv.
It should be noted that the increase in the range of butt weld bead composition had no
affect on the tensile properties of the dissimilar metal butt joints, as failure occurred in
the parent material of the 1.2mm V1437.
287

5.9.2.2 Lap Joint W eld Bead Compositions
The stirring mechanism that occurs in the laser welded lap joint weld bead is the same
as the butt weld bead stirring mechanism. This stirring mechanism is produced by the
thermo-capillary flow (Marangoni convection) within the laser weld bead. The material
at the edges of the weld bead posses the lowest temperature as they are cooled by the
surrounding parent material, whilst the highest temperature is at the centre of the weld
bead. The heat distribution across the transverse section of a similar metal laser welded
lap joint can be seen in Figure 65 below.
Temperature
Figure 65 Heat distribution across the transverse section of a laser welded butt joint
The joint configuration does not affect the stirring mechanism, although it does control
the quantity of the stainless steel and mild steel melted.
This is due to the thermal properties of the mild steel and respective stainless steel and
the position within the lap joint configuration (top of the lap joint). As mentioned in
section 5.9.1.2, a more uniform weld bead is achieved when the 1.2mm V 1437 is at the
top of the lap joint. Hence, a greater proportion of the material at the top of the lap joint
is melted in comparison to the material at the bottom of the lap joint.
288

30
25
A U S T E N I T E20
a u s t e n i t e + X / x
"'"•-X. M ARTEN SITE a n d X XAUSTENITE + FERRITE
304 top x
/M A R T E N S IT E : F E R R IT E
V1437 topF E R R I T E
i O 15 2 0F E R R I T E S T A B I L I S I N G E Q U I V A L E N T
(0/o C r + °/o M o +■ l -5x°/oS i + 2 x % N b - f 3 * % T i ]
2 5 3S3 0E Q U I V A L E N T
3
Figure 66 Effect of joint configuration on the dilution and predicted weld bead compositions-lmm 304 - 1.2nini V1437 lap
joint
It can be seen from Figure 66 that the range of composition within the weld bead
increases when the lmm 304 is at the top of the lap joint. The range is also displaced
towards the 304 base material composition. It can be seen that when 1.2mm V1437 is
at the top of the lap joint, the range of composition within the weld bead is displaced
towards the 1.2mm V 1437 base material composition. This effect can also be seen from
Graph 48, Graph 49 and Graph 86, Graph 87; which show that lower chromium and
nickel contents were found in the weld bead when the 1.2mm V1437 was at the top of
the lap joint. Although a range of chromium and nickel has been found in the weld
bead (see Graph 48, Graph 49 and Graph 86, Graph 87); the predicted weld bead phase
is martensite. This would explain the high microhardness of the laser weld beads, all of
which were in excess of 400Hv, see section 4.10.
289

AUSTENITE
AUSTENITE * / # 2205/ + + S'
A U £ * £ n !TE + FERRITEMARTENSITE
MARTS
ARTENSITEFERRITE
V1437 topFERRITE
"o 5 iO IS 2 0 25 30 ' 35FERRITE STABILISING EQUIVALENT
(°/oCr + o/oMo + |.Sx%>Si + Sx'VbNb f 3x°/oTi]
Figure 67 Effect of joint configuration on the dilution and predicted weld bead compositions-0.78nim 2205 - 1.2mm V1437
lap joint
Figure 67 shows that the range of weld composition is displaced towards the 2205 base
material point when the 2205 is at the top of the lap joint. It can be seen that when
1.2mm V I437 is at the top of the lap joint, the range of composition within the weld
bead is displaced towards the 1.2mm V 1437 base material. This effect can also be seen
from Graph 88 to Graph 91, which show that lower chromium and nickel contents were
found in the weld bead when the 1.2mm V 1437 was at the top of the lap joint.
Although a range of chromium and nickel is found in the weld bead (see Graph 88 to
Graph 91), the predicted weld bead phase is martensite. This would explain the high
microhardness of the laser weld beads, all of which were in excess of 400Hv; see
section 4.10.
290

From the extensive investigation into the composition, dilution and consequently the
predicted phases present in the laser welded butt and lap joint weld beads, no evidence
was found that these factors had a controlling effect on the tensile, lap shear and
ultimately the fatigue properties o f the respective joints.
The only fatigue-controlling factor was the microhardness o f the material at the internal
lap faces o f the joints. A ll were similar within a particular joint, suggesting that the
tensile properties and also the fatigue crack initiation and early crack growth rates
would be comparable. The bulk microhardness was not found to be a lap shear or
fatigue controlling factor.
Tests were conducted to determine the primary solidification mode o f the dissimilar
metal joints containing lm m 304 austenitic stainless steel. Although, the Creq/N ieq
ratios were in the range o f 1.4 - 1.6, a pronounced increase in the Fe content due to the
dilution of the two compositions strengthened the ferrite primary solidification phase.
This was the preferred primary phase as this mode of solidification has a superior
resistance to solidification cracking than primary austenite, which is attributed to
reduced wetting o f boundaries by liquid films and the complicated crack paths these
boundaries form49, see section 2.12.1.
The investigation, hence, proceeded into the geometric factors introduced by the lap
joint welding configuration to determine if this had an effect on dissimilar metal lap
joint fatigue properties.
291

5.9.3 Stages of Laser Welded Lap Joint Fatigue Life
Discussion o f the “effect o f geometry” on the fatigue life o f a laser welded lap joint is
complicated by the lack of uniform definitions o f fatigue crack initiation, the stages o f
fatigue crack propagation, and fatigue failure. Research carried out by Wang et al
OQdivided the fatigue life o f a tensile-shear spot welded lap joint into three stages .
Stage I - Crack initiation and early crack growth
At the end o f Stage 7, a detectable crack or a crack o f some agreed (small) size is
present at the periphery o f the weld nugget89.
Stage I I - Crack propagation from the periphery o f the nugget through the thickness o f
the sheet to its external surface
Early growth proceeds initially at an angle o f 66D eg, but ultimately the growth during
this period is nearly perpendicular to the sheet so that the sheet thickness is roughly
equal to the crack length at the end of Stage 7/89.
Stage III - Crack propagation laterally across the specimen width until failure occurs
O Q
through plastic instability (tearing or rupture) .
With this in mind, the proposed stages o f fatigue life for a laser welded lap joint are:
Stage I - Initiation and early crack growth (multiple crack)
Stage I I - Crack propagation (multiple crack)
Stage III - Failure due to plastic instability and separation through tearing and
rupture o f the remaining material.
The proposed stages o f laser welded lap joint fatigue life can be linked with the test
conducted by Linder et al from section 2.16.1.1, which assessed the stiffness o f a
similar metal laser welded lap joint during its fatigue life. Figure 33 shows that the lap
89 Wang, P.C., Corten, H.T., and Lawerence, F.V. A Fatigue Life Prediction Method for Tensile-Shear Spot Welds, “SAE Technical Paper 850370, Society of Automotive Engineers, Warrendale, PA 1985
292

joint stiffness remained constant throughout the majority o f its fatigue life (Stages I),
falling dramatically prior to failure (Stage II).
Stage I is concerned with fatigue crack initiation and early crack. Multiple fatigue
cracks initiate and early stage crack growth occurs. Multiple initiation sites were first
proposed by Linder et al for similar metal laser welded lap joints, see section 5.11. This
was observed during the analysis o f dissimilar metal lap joint fatigue failures from this
investigation (also section 5.11). At the end o f Stage I fatigue crack growth w ill have
occurred at multiple initiation sites along the length o f the weld, however no reduction
to the stiffness o f the joint w ill have occurred.
Stage I I is concerned with crack propagation. At the transition to Stage I I the multiple
fatigue cracks have propagated to the extent where the stiffness o f the joint is reduced.
The reduction in joint stiffness causes the joint to rotate increasingly under the applied
load. This increases the local stresses and consequently the crack growth rate.
Stage III is concerned with sheet separation and failure. The transition to Stage III
occurs when the net cross section can no longer withstand the applied load, plastic
instability occurs and the remaining material tears and ruptures until the sheets separate.
This would suggest that the majority o f laser welded lap joint fatigue life is concerned
with early crack growth (multiple), where no reduction in lap joint stiffness occurs
(Stage I). Once the multiple fatigue cracks have propagated to the extent where the
stiffness is reduced (transition to Stage II), failure occurs rapidly through plastic tearing
of the remaining material (Stage III).
The effect o f geometry on the fatigue properties or, more specifically, the early stage
crack growth rate (Stage I) can now be discussed.
293

5.9.4 Effect of Lap Joint Geometry
A s stated in section 2.15.2, when lap joints are subjected to a tensile load in either lap
shear or fatigue, the misalignment (eccentricity) o f the applied load introduced by the
lap joint configuration results in rotation o f the lap joint, see section 3.4.4.
Linder et al proposed that load misalignment produced an applied bending moment to
the joint, which could be explained by analysing the reaction forces and moments that
occur in the laser welded lap joint specimen, see section 2.15.270,71. It can be seen from
Equation 2 that increasing the sheet thickness, (or average sheet thickness for dissimilar
thickness lap joints), w ill increase the applied bending moment to the joint. The
introduction o f an interfacial gap between the sheets w ill also increase the applied
bending moment to the joint.
Thus, the result o f the misalignment, applied bending moment and consequent joint
rotation, is an increase in the local stress at the internal lap surface, which can be seen in
Figure 34, and corresponds to the position o f similar metal stainless steel laser welded
fatigue initiation sites70.
It is reasonable to state that increasing the rotation angle w ill increase the local stress at
the internal lap face, which will increase the early stage crack growth rate. More
specifically, one could postulate that the fatigue life o f a similar metal laser welded lap
joint would be controlled by:
1. The applied load and, consequently, the severity o f the local stress at the internal
lap surface (directly related to the extent o f rotation)
2. The early stage crack growth rate o f the material at the internal lap face
This theory may also be applied to, and thus explain, the fatigue properties o f dissimilar
thickness and dissimilar metal lap joints.
294

The local stress generated at the internal lap surface o f a dissimilar thickness joint
would be the same since the rotation angle at both internal lap surfaces is equal
(geometry dependent).
In relation to the four original dissimilar metal laser welded lap joints produced using
the Trumpf 5kW laser welder, random fatigue failures were noted; however, this was
originally thought to be due to the ‘balanced tensile properties’ o f the lap joints by using
thinner gauge stainless steel (lm m 304 and 0.78mm 2205). Analysis o f the material at
the internal lap faces revealed that the microhardness values were comparable,
supporting the fact that the tensile properties and also the fatigue crack initiation and
crack growth rates would be similar.
It is known that there is a major influence o f metallurgical variables on the fatigue crack
propagation at both high and low AK levels. In the case o f dissimilar metal lap joints, if
the material at the internal lap faces was microstructurally similar, that is free from
pores, inclusions, precipitates and the presence o f large secondary phase areas; one
could postulate that the early stage fatigue crack growth rate would be comparable in
both materials for both high and low AK levels.
In the case o f intermediate AK levels fatigue crack propagation is relatively structure
insensitive hence the propagation rate would also be similar promoting random fatigue
failure in either o f the dissimilar metals90.
It can be seen in section 4.10.2 that the microhardness o f the material at the internal lap
faces was similar, suggesting that the material properties were also similar.
90 Hertzberg, R. W. Deformation and fracture mechanics of engineering materials, 4 th edition, John Wiley & Sons, Inc, ISBN 0-471-01214-9, pp 648-649
295
In light o f these findings, research was directed towards the investigation of dissimilar
metal laser welded lap joint fatigue properties between materials with large tensile
property differences. If the theory that lap joint fatigue properties were controlled by
applied load and the local stress at the internal lap face (joint rotation) and the early
crack growth rate o f the material at the internal lap face, then fatigue failure should still
occur randomly in either the high strength stainless steel (lm m 2101 and 2205) or the
relatively low strength 1.2mm V 1437 if the material properties at the internal lap faces
were similar.
296

5.10 Laser Welded Lap and Butt Joint Fatigue Properties - Rofin 2kW
A s previously stated, the joint configurations chosen for further fatigue testing
incorporated thicker gauges o f stainless steel. Section 5.5 states it was originally
thought that the tensile properties o f the dissimilar metal lap joints need to be balanced
to prevent preferential fatigue failure o f the relatively low strength 1.2mm V 1437 over
the laser welded lap joint, hence the reduced thickness 2205 (0.78mm) duplex stainless
steel grade. This was further substantiated by the random nature o f the fatigue failures
throughout the four dissimilar metal lap joints produced using the Trumpf 5kW laser
welder due to tensile property balance being achieved. However, after analysing the
factors that effect lap joint fatigue properties, the aim was to determine whether
dissimilar metal lap joint fatigue properties were geometry dependent and consequently
that fatigue failure occurred randomly in either the zinc-coated mild steel or the
respective higher strength stainless steel. Hence, the following joints were chosen for
fatigue testing, these joints also allow a range o f comparisons to be made with the
previous four dissimilar metal laser welded lap joints.
1.2mm V 1437 (top) - lm m 2205 dissimilar metal lap joint
1.2mm V 1437 (top) - lm m 2101 dissimilar metal lap joint
lm m 2101 - lm m 2101 similar metal lap joint
1.2mm V 1437 - lm m 2101 dissimilar metal butt joint
It can be seen from Table 3, Table 7 and Table 9 respectively that the tensile strength o f
the 1.2mm V 1437 is below the yield strength o f both the lm m 2205 and lm m 2101.
297

Both the 1.2mm V I 437 (top) - lm m 2205 and 1.2mm V I437 (top) - lm m 2101
staircase methods were statistically valid, which can be seen in Graph 31 and Graph 32
respectively. In comparison with the previous four laser-welded lap joints (Graph 27 -
Graph 30), fatigue failure also occurred randomly in either the 1.2mm V I 437 or the
respective lm m stainless steel throughout the fatigue testing program. In som e cases
failure occurred in both materials for the same applied load level during the staircase
method.
This would suggest that the local stress at the internal lap faces are comparable and,
more importantly, that the early fatigue crack growth rate o f both the materials at the
internal lap face is the same.
This further substantiated the hypothesis that dissimilar metal laser welded lap joint
fatigue properties were independent o f base material properties, even when the two base
material tensile properties were significantly different, and were controlled by the
applied load and the local stress at the internal lap face produced by joint rotation,
which is, in turn, controlled by sheet thickness, interfacial gap and weld width.
Thus, with random fatigue failure being noted for these dissimilar metal lap joints the
investigation proceeded into characterisation o f the initiation site and propagation
angles o f the fatigue cracks; the emphasis being on the comparability o f these fatigue
failures from both materials o f a respective lap joint.
298

5.11 Fatigue Failure Analysis
It can be seen from Image 12 to Image 19 that fatigue failure occurred in both the
1.2mm V 1437 and the respective lm m 304 and 0.78mm 2205 for each laser welded lap
joint produced using the Trumpf 5kW CO 2 laser welder. The fatigue failure occurred at
the edge o f the weld at the internal lap face for all the failures.
More importantly, however, was the characterisation o f the fatigue initiation point and
propagation angles for the dissimilar metal laser welded lap joints produced with large
tensile properties differences. The fatigue failures o f these joints, produced using the
Rofin 2kW laser welder, are investigated within this section.
As previously stated; dissimilar metal lap joint fatigue failures occurred randomly in
both materials; this would suggest that the local stress and early fatigue crack growth
rate o f the material at the internal lap surface o f both sheets must be similar. If this was
the case, one would expect to find evidence o f propagating fatigue cracks at the internal
lap surface o f the opposite material to which fatigue failure and separation occur. There
were, however, a number o f problems to be overcome before this could be determined.
299

Research conducted by Linder et al, revealed that the laser weld bead oscillated in width
over its length70. This effect can be seen in Figure 68, and was observed during the
determination o f the weld widths in this investigation, the weld width being determined
by measuring, regrinding and measuring to provide 5 weld width measurements for
each sample before taking the average.
Fatigue crack
Figure 68 SEM image showing the oscillating weld width - the dotted line indicates the boundary between the initial gap
and where fatigue cracking takes place70
This led Linder et al to predict that fatigue crack initiation would occur at certain points
along the length o f the laser weld, see Figure 69 below.
Critical fatigue points
Figure 69 A schematic drawing of a laser-weld from above, showing oscillating weld width, and the location fatigue crack
will probably initiate70
300

Thus, fatigue cracks would not be present along the entire length o f the sample and
would occur intermittently at the points where the weld bead was the widest due to
oscillation o f the weld bead width (similar to a spot weld periphery).
Image 20 shows fatigue failure in a 1mm 2101 similar metal lap joint, which displays
no evidence o f fatigue crack propagation from the internal lap face in the opposite sheet.
Further grinding o f three 2101 similar metal lap joint fatigue failures revealed evidence
of a crack in the opposite sheet to fatigue failure, see Image 23 and Image 24. Further
examination o f the cracks was conducted to determine whether the cracks were
produced by tearing during fatigue failure o f the opposite sheet or whether they were in
fact propagating fatigue cracks. It can be seen from higher magnification optical
analysis (Image 25 and Image 26) that there is no evidence o f plastic deformation
around the cracks suggesting that they are in fact propagated fatigue cracks. This was
substantiated by SEM analysis o f the crack from Image 25 that showed the crack tip
(see Image 27). The crack tip can be seen to be relatively ‘sharp’ in comparison to the
majority o f the crack, which has opened due to the cyclic loading from the
tension/tension fatigue tests.
Although these images show signs o f fatigue cracks present on the opposite side to
fatigue failure, the lap joints are still o f the similar metal type. The aim o f this
investigation was to determine if fatigue cracks were present in both materials for a
dissimilar metal lap joint prior to fatigue failure.
Thus, observations o f the fatigue tests were undertaken to determine if it was possible to
predict the fatigue failure o f a lap joint sample. It was noted that the sound o f the
machine increased prior to failure, probably due to contact between the propagating
crack surfaces from Stage II. A test was consequently stopped and restarted to test the
theory and failure occurred after 20 - 30 seconds (-1000 - 1500 cycles).
301

This would suggest that the crack growth rate during Stage I I is much higher than the
early crack growth rate during Stage /. This can be explained by considering that once
the lap joint stiffness decreases due to the multiple propagating cracks (Stage II), the
joint w ill rotate more under the applied load. The increased joint rotation w ill increase
the local stress at the crack tips (more mode I loading), hence the crack growth rate w ill
increase until the net section is no longer able to withstand the applied load and failure
occurs through tearing and plastic instability.
Hence, a number o f tests were terminated when the noise o f the test increased. This was
done for 1.2mm V 1437 (top) - 1mm 2205 and 1.2mm V 1437 (top) - 1mm 2101 lap
joint samples (the lap joints with large base material property differences).
After examination, regrinding and examination etc o f the lap joints, evidence o f fatigue
cracks in both materials (in the same transverse section) prior to failure was discovered.
For the 1.2mm V 1437 (top) - 1mm 2101 lap joint configuration, evidence o f a fatigue
crack in the 1mm 2101 (bottom o f the lap joint) can be seen in Image 33 and Image 34;
it can be seen the back scattered electron mode provided better contrast o f the crack
than the secondary electron mode. From the same transverse section, evidence o f a
fatigue crack can be seen in the 1.2mm V 1437 (top o f the lap joint) in Image 35 and
Image 36, again the back scattered electron images providing better contrast.
The same effect can be seen in Image 37 and Image 38, which show fatigue cracks
propagating from the internal lap face in the 1mm 2205 (bottom o f the lap joint) and
1.2mm V 1437 (top o f the lap joint) from the same transverse section o f a 1.2mm V 1437
(top) - 1mm 2205 dissimilar metal lap joint.
302

Similar and dissimilar metal laser welded fatigue crack angles were determined and
compared to the angles found by Linder et al and predicted by Helin.
The 1mm 2101 similar metal lap joint fatigue crack angle was determined and can be
seen in Image 25.
50 micron
Image 49 Close up image of the propagated fatigue crack from Image 23 2101 similar metal lap joint
Hence, it can be seen that the 1mm 2101 similar metal lap joint fatigue crack angle is
approximately 75°, a similar angle to those reported by Linder et al for similar metal
stainless steel lap joints.
303

1.2mm V1437 (top) - 1mm 2101 dissimilar metal lap joint
Composite lap joint image showing the presence of fatigue cracks in both materials
p w w pImage 50 1.2mm V 1437(top)- 1mm 2101 dissimilar metal lap joint showing fatigue cracks in both materials
304

1.2mm V1437 (top) - 1mm 2205 dissimilar metal lap joint
Image 51 Secondary electron image showing fatigue crack initiation in the 1mm 2205 from 1.2mm V1437 (top) - 1mm 2205
dissimilar metal lap joint
M B S m
Image 52 Secondary electron image showing fatigue crack initiation in the 1.2mm V1437 from 1.2mni V1437 (top) - 1mm
2205 dissimilar metal lap joint
305

It can be seen that the angle o f fatigue crack propagation is approximately 65° for the
dissimilar metal lap joints. This is lower than the fatigue crack angles found by Linder
et al. More importantly, however, is that the fatigue crack propagation angle is the same
in both materials in a dissimilar metal lap joint (1mm 2205 and 2101 to 1.2mm V1437).
In summary, the increased noise from the fatigue samples prior to failure (~<2000
cycles) corresponded to the change from Stage I (early crack grow th) to Stage II,
suggesting that the majority o f lap joint fatigue life is concerned with the early crack
growth; once the transition to Stage I I has occurred, the crack growth rate increases due
to the reduction o f stiffness, the increase in rotation and the local stress until the net
section can no longer withstand the applied load and failure occurs through plastic
tearing and rupture.
In light o f this investigation, the following statements may be made:
• Fatigue cracks occur intermittently along the length o f the weld bead
• The early stage crack growth rate (Stage I) o f both materials is comparable
• The transition to Stage I I occurs at a similar cycle life
• The Stage I I crack growth rate is much higher than the early crack growth rate
• Reducing the lap joint stiffness increases joint rotation, which increases the local
stress at the crack tips and consequently the crack growth rate
These can be used to explain the observed random nature o f the fatigue failures.
The investigation was directed towards determining the factors that effect joint rotation,
the severity o f the local stress, early crack growth rate and consequently the fatigue life.
306

5.12 Lap Joint Rotation
The model proposed by Nordberg and McCann in section 2.16.5 was used to predict the
rotation o f laser-welded lap joints77. The equation used to predict the rotation angle o f
laser-welded lap joints can be seen in Equation 4. If there is a gap between the two
sheets, Equation 5 is used to calculate the variable “z” (note: “z” is also included for
joints with no interfacial gap and is equal to 1).
It should be noted that the model assumes symmetry, thus, it can only be used for
similar thickness lap joints. A lso, it does not take into account the effects o f weld
width.
In light o f this; for a similar thickness, similar metal lap joint, the model predicts:
• Increasing the sheet thickness reduces the rotation angle per line load.
• The introduction o f an interfacial gap between the sheets increases the rotation angle
per line load.
N ote: The higher the rotation angle p e r line load, the greater the local stress a t the
internal lap fa c e s . Increasing the local stress a t the in ternal lap fa ce s w ill increase the
early stage crack propagation rate and consequently reduce lap jo in t fa tig u e life.
307
Increasing the sheet thickness in the lap joint configuration, increases the eccentricity o f
the applied load, however, this increase in sheet thickness is accompanied by an
increase in sheet stiffness. This increase in lap joint stiffness reduces the susceptibility
o f the joint to rotate per line load, improving fatigue properties.
Conversely, the introduction o f an interfacial gap between the sheets increases the
eccentricity o f the applied load, whilst the sheet stiffness remains the same; hence the
lap joint is more susceptible to rotation per line load, lowering fatigue properties.
Weld width, although not covered by the model, has already been seen to have an effect
on lap joint fatigue properties, see section 5.8.1, and will be covered in section 5.13.
The modulus o f elasticity also plays a fundamental roll in the prediction o f lap joint
rotation. Since the modulus o f elasticity is the same for stainless steel and mild steel
(190GPa), the model predicts that the respective similar metal lap joints would rotate to
the same extent per line load.
308
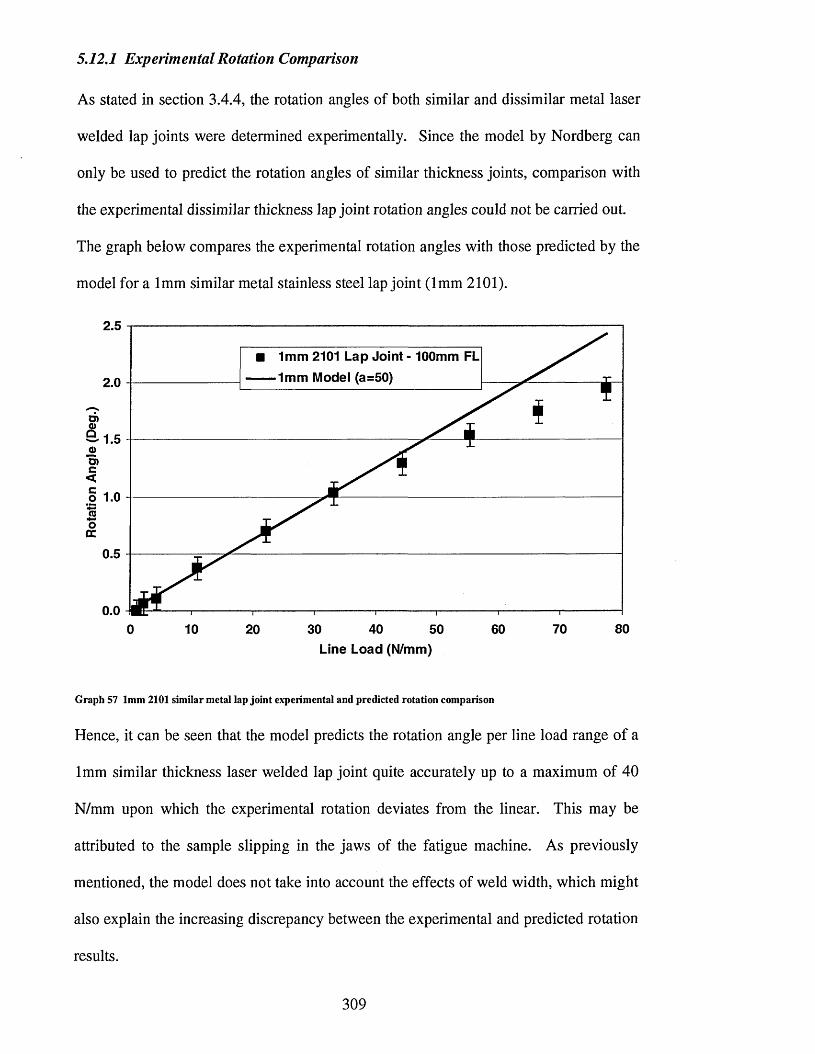
5.12.1 Experimental Rotation Comparison
A s stated in section 3.4.4, the rotation angles o f both similar and dissimilar metal laser
welded lap joints were determined experimentally. Since the model by Nordberg can
only be used to predict the rotation angles o f similar thickness joints, comparison with
the experimental dissimilar thickness lap joint rotation angles could not be carried out.
The graph below compares the experimental rotation angles with those predicted by the
model for a 1mm similar metal stainless steel lap joint (1mm 2101).
2.5
■ 1mm 2101 Lap Joint - 100mm FL
1mm Model (a=50)2.0
~ 1.5
0.5
0.08040 700 10 20 30 50 60
Line Load (N/mm)
Graph 57 1mm 2101 similar metal lap joint experimental and predicted rotation comparison
Hence, it can be seen that the model predicts the rotation angle per line load range o f a
1mm similar thickness laser welded lap joint quite accurately up to a maximum o f 40
N/mm upon which the experimental rotation deviates from the linear. This may be
attributed to the sample slipping in the jaws o f the fatigue machine. A s previously
mentioned, the model does not take into account the effects o f weld width, which might
also explain the increasing discrepancy between the experimental and predicted rotation
results.
309

Unfortunately, this was the only joint for which the comparison between experimental
and predicted rotation angles could be made, as this was the only similar thickness lap
joint produced during this investigation and the model cannot predict the rotation angles
o f dissimilar thickness joints.
However, a comparison between the experimental rotation angles o f the similar and
dissimilar thickness joints can be made and can be seen below in Graph 58.
2.5■ 1mm 2101 Lap Joint - 100mm FL A0.78mm 2205 - 1.2mm V1437 Lap Joint - 100mm FL 0 1mm 304 - 1.2mm V1437 Lap Joint - 100mm FL2.0
o
1.5o>
.2 1.0
0.5
0.0807010 30 40 50 600 20
Line Load (N/mm)
Graph 58 Comparison of experimental rotation angles per line load for sim ilar and dissimilar metal laser welded lap joints
It can be seen that the experimental rotation angles for the three joints are effectively the
same when the estimated errors are taken into account. This was the reason for not
comparing the rotation angles for both configurations o f the respective dissimilar
thickness joints and attempting to characterise the effects o f weld width on the rotation
angles. Again when the estimated error o f the rotation and weld width was taken into
account, no trends could be identified. It can also be seen that the rotation angles above
40N/m m also appear to deviate from the linear, which may have been due to the sample
slipping in the jaws during the test.
310

These experimental rotation angles were linked to the line load by inserting a linear
trend line, which intercepted zero. This relationship was used to plot rotation angle
against cycles to failure for the joints in question and can be seen in Graph 59 below.
4.5
4
3.5
3
U)& 2 -5 oO)< 2co"5o 1 5cc
1
0.5 H
B i E ■ 1m m LDX2101
□ 1.2m m V 1437 (top) -1 m m 304
A 1.2 m m V 1437 (top) - 0 .78m m 2205
1
/
1
pi; ii ci1
I $
' T Ti ' ■% iiii4 (i i l i i j
iWffi
0 4 10000 100000 ^ 1000000 10000000
Cycles to failure
Graph 59 Relationship between rotation angle and cycles to failure
It can be seen that increasing the rotation angle reduces the cycles to failure.
It is worth mentioning that the configurations o f the laser welds produced during this
investigation all possessed similar:
• Sheet thickness or average sheet thickness for the dissimilar thickness joints
• Weld widths
• Interfacial gap
• Elastic Modulus
Since the joints all possessed a similar average sheet thickness, one would expect the
stiffness o f the joints to be comparable. Furthermore, due to the nature o f the oscillating
311

weld widths, when the tolerance or scatter is taken into account, the differences in weld
width between joints are relatively small.
This is reflected in the fatigue properties o f the joints, which only show trends in the
mean fatigue line load ranges at 2 x l0 6 cycles when one standard deviation is used.
Should two standard deviations be used, differences or trends between the joints are
removed or, at most, are very weak.
Thus, the factors affecting joint rotation have been identified and will now be discussed
with comparisons o f the fatigue properties from this investigation with those from
previous research.
The predicted rotation angles from the model produced by Nordberg and McCann have
been used in the following discussions to predict the rotation angles o f the joints, with
the aim being to link them to the fatigue properties.
312

5.13 Factors Controlling Lap Joint Rotation
The factors identified as controlling the extent to which a joint will rotate per line load
are:
• Sheet thickness
• Interfacial gap
• W eld width
• Elastic Modulus
Before these are discussed in more detail, it is worth mentioning that i f the fatigue
properties o f similar and dissimilar metal laser welded lap joints are controlled by these
geometric factors, then lap joints that possess the same sheet thickness, interfacial gap
and weld width should rotate to the same extent per line load, providing the elastic
modulus o f the materials is the same. This should result in similar or comparable
fatigue properties. This w ill be discussed in the following section.
313

5.13.1 Similar Geometry & Rotation Angle
It can be seen from Graph 60, that the two dissimilar metal laser welded lap joint fatigue
properties are very similar. Both joints were produced consecutively with the Rofin
2kW CO2 laser welder. The same welding parameters were used and both lap joints
possessed a similar weld width between the sheets (~ 1.4mm ±0.05mm ). It can be seen
that the statistically valid mean fatigue line load ranges for the joints are within 2 N/mm
of each other. When the standard deviations are taken into account, 4.3 N/mm for the
2205 and 3.7 N/mm for the 2101 dissimilar metal lap joints, both joints exhibited the
same fatigue properties. It should be noted that both dissimilar metal laser welded lap
joints did not possess an interfacial gap.
1000
££ta>CD| 100-c«oc3
1010000 100000 1000000 10000000
Cycles to failure
Graph 60 Dissimilar metal lap joint fatigue property comparison 1.2mm V1437 (top) - 1mm 2205 & 1mm 2101
Thus, with the same average sheet thickness, weld width and no interfacial gap, the
joints would rotate to the same degree per line load, producing similar fatigue
properties.
314
1 Om m /t'i7 ttnr■»\ _ 1m m oon
A 1.2mm V1437 (top) - 1mm LDX2101
V
*—H— 4—
~^i (VI►fj V- 6 i.5___z r M y r T W —*65.1
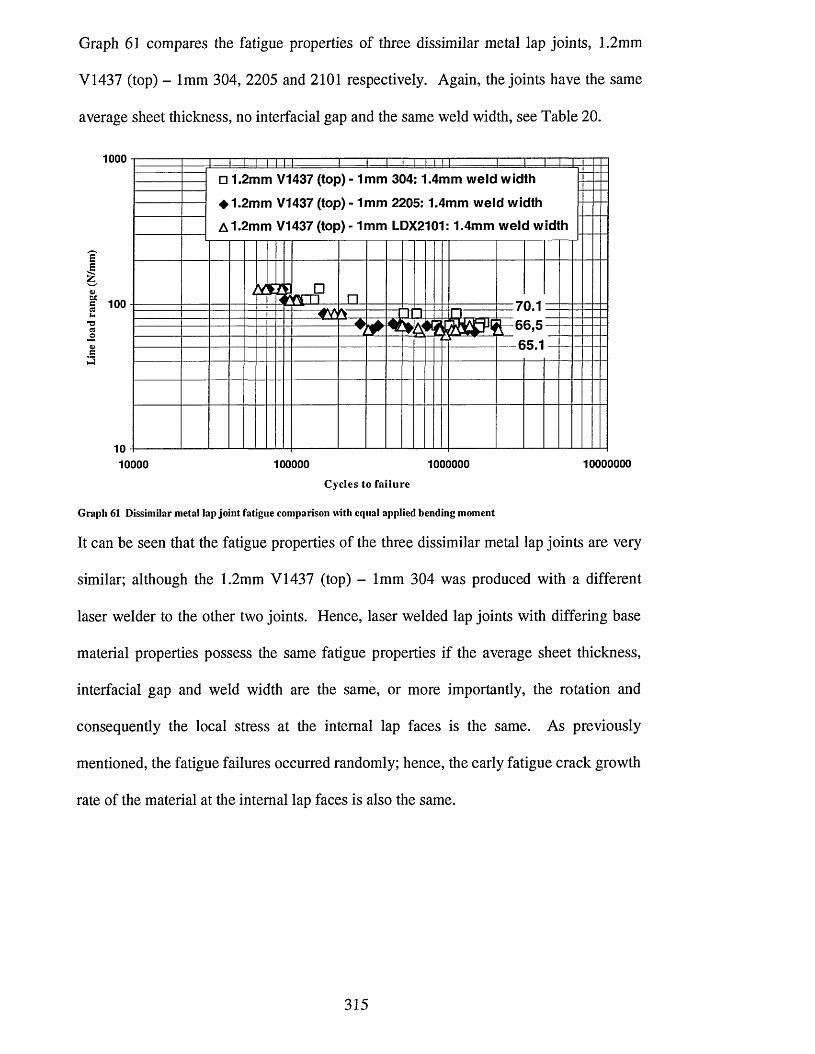
Graph 61 compares the fatigue properties o f three dissimilar metal lap joints, 1.2mm
V 1437 (top) - 1mm 304, 2205 and 2101 respectively. Again, the joints have the same
average sheet thickness, no interfacial gap and the same weld width, see Table 20.
1000
w)s 100
I — \ — l I I I IT | = T O T "i..... r ~ i□ 1.2mm V1437 (top) - 1mm 304 :1.4mm weld width
♦ 1.2mm V1437 (top) - 1mm 2205:1.4mm weld width
A 1.2mm V1437 (top) - 1mm LDX2101:1.4mm weld width
_ □ K E L jil
-i r m T H ~ 6 5 . 1
1010000 100000 1000000
C y c le s to fa i lu r e
10000000
Graph 61 Dissimilar metal lap joint fatigue comparison with equal applied bending moment
It can be seen that the fatigue properties o f the three dissimilar metal lap joints are very
similar; although the 1.2mm V 1437 (top) - 1mm 304 was produced with a different
laser welder to the other two joints. Hence, laser welded lap joints with differing base
material properties possess the same fatigue properties if the average sheet thickness,
interfacial gap and weld width are the same, or more importantly, the rotation and
consequently the local stress at the internal lap faces is the same. A s previously
mentioned, the fatigue failures occurred randomly; hence, the early fatigue crack growth
rate o f the material at the internal lap faces is also the same.
315

5.13.2 Effect of Sheet Thickness
The follow ing graph compares results from this investigation with those produced by
Linder et al, showing the effects o f increasing the sheet thickness o f one or both sheets
in the lap joint configuration. The joints do not possess an interfacial gap.
1000O 2.5mm:No Gap, Weld Width=1.2mm
A 1 mm - 2.5mm: No Gap, Weld Width=1 mm
♦ 1 mm 2101: No Gap, Weld Width=1.4mm
5 100
10 -I10000 100000 1000000 10000000
Cycles to Failure
Graph 62 Comparison of fatigue results between joints with large differences in stiffness70
It can be seen that increasing the sheet thickness o f one o f the sheets results in an
improvement o f the fatigue properties. Increasing the sheet thickness o f both sheets
further improves the fatigue properties o f the joints.
The rotation angles per line load have been predicted using the model o f Nordberg and
McCann. For the dissimilar thickness joint, the average sheet thickness has been used
to predict the rotation angles.
316

The model predicts that as the sheet thickness increases, the stiffness o f the lap joint
increases and is consequently less susceptible to rotate per line load.
2.5
2.5mm: No Gap - 100mm FL
1mm - 2.5mm: No Gap - 100mm FL
1mm: No Gap - 100mm FL
0.5
807040 50 600 10 20 30
Line Load (N/mm)
Graph 63 Effect o f sheet thickness on the predicted rotation angles o f similar and dissimilar thickness laser welded lap joints
This shows that increasing the sheet thickness o f even one sheet in the lap joint
configuration will increase the stiffness o f the joint. This will reduce the rotation angle
per line load, reducing the local stress at the internal lap face and consequently the early
crack growth rate, improving the fatigue properties.
317

5.13.3 Effect of Interfacial Gap
nc\The fatigue tests in Graph 64 below were conducted by Linder et al and have been
recalculated into the line load unit see below.
1000o2.5mm:No Gap, Weld Width=1.2mm
■ 2.5mm: Gap, Weld Width=1.7mm
A 1mm - 2.5mm: No Gap, Weld Width=1mm
/—\ S £ Z,
10000 100000 1000000 10000000Cycles to Failure
Graph 64 Linder: Line load range similar metal stainless steel fatigue properties - effect o f sheet thickness and interfacial
gap™
It can be seen that the fatigue properties o f the 2.5mm lap joint with no gap are the
highest. This was noted from the previous graph and was due to the increase in joint
stiffness. However, the introduction o f an interfacial gap to the 2.5mm lap joint
produces a drastic reduction in the fatigue properties. The linear trendline shows the
fatigue properties become lower than the dissimilar thickness joint at higher cycle
failures. Hence, the introduction o f an interfacial gap has overcome the effects o f
increased sheet stiffness and weld width.
The predicted rotation angles per line load for these joints can be seen in graph 63 on
the following page.
318

A s the actual interfacial gap for 2.5mm lap joint was not known, it has been estimated at
10% o f the sheet thickness (0.25mm).
0.5—O—2.5mm: No Gap - 100mm FL
—■ —2.5mm: 10% Gap - 100mm FL0.45
0.4
o> 0*35 a>° 0.30)O) _ _ _c 0.25 <
I 024-»(0+-IoDC
0.15
0.1
0.05
807040 50 603010 200Line Load (N/mm)
Graph 65 Effect of interfacial gap on the predicted rotation angles of similar thickness laser welded lap joints
Hence, it can be seen that the model predicts the presence o f an interfacial gap will
increase the rotation angle per line load. As previously stated, this is due to the increase
in the eccentricity o f the applied load.
This increase in rotation per line load can be seen to reduce the fatigue properties o f the
lap joint.
The effect o f interfacial gap is also mentioned in the following section.
319

5.13.4 Effect of Weld Width
Section 5.8.1 states the initial dissimilar metal lap joints produced and tested showed
that higher fatigue properties were achieved when the 1.2mm V I437 was at the top of
the lap joint. This corresponded to an increase in weld width between the sheets and
can be seen in Graph 55 and Graph 56 respectively.
A similar weld width trend has been found with the fatigue properties o f similar metal
laser welded stainless steel and carbon steel lap joints and can be seen respectively in
Graph 66 and Graph 67 below. The results from the following two graphs are from
Linder et al70 (cold rolled SS2333 austenitic stainless steel) and have been recalculated
and presented using the line load range unit.
1000■ 1mm: No Gap, Weld Width=1.3mm 01mm: No Gap, Weld Width=0.8mm 01mm: No Gap, Weld Width=0.6mm A 1mm: Gap, Weld Width=1.7mm
w>5 100ns
1010000 100000 1000000 10000000
Cycles to Failure
Graph 66 Linder: Line load range similar metal stainless steel lap joint fatigue properties - effect of interfacial gap and
weld width
It can be seen that the laser welded lap joint with the low est fatigue properties, although
possessing the highest weld width, was the only joint to have an interfacial gap. Hence
for the same sheet thickness (joint stiffness), the presence o f an interfacial gap overcame
320

the effect of weld width, increasing the rotation of the joint per line load and reducing
the fatigue properties.
It can also be seen that for the three remaining joints with no interfacial gap, increasing
the weld width increased the fatigue properties o f the joints by, it is proposed, reducing
the rotation angle per line load range.
The following graph shows the similar metal carbon steel fatigue properties used for
comparison by Linder et al. The fatigue properties have been recalculated into the line
load range unit.
1000
Vto1 100H303oa>c3
1010000 100000 1000000 10000000
Cycles to Failure
Graph 67 Linder: Similar metal carbon steel laser welded lap joint fatigue properties (0.9mm results from Linder et al)
Increasing the weld width between the sheets provides a slight increase in the cycles to
failure for a given line load range by reducing the rotation angle per line load range.
This reduces the local stress and early crack growth rate improving fatigue properties.
.... :"-T l I... i 1 1 II .....1 1 I l a 1-1-O 0.9mm:No Gap, Weld Width=0.5mm
■ 0.9mm:No Gap, Weld Width=0.7mm
A0.9mm:No Gap, Weld Width=0.9mm
c Dl I ■ 1 IAocM ■
' M A r A■ A■ /\ L\
321

The lap joints in Graph 68 all possess the same average sheet thickness, this allowed the
fatigue properties o f the 1mm 2101 similar metal lap joint fatigue properties to be
compared with the 1.2mm V 1437 - 0.78mm 2205 (both configurations), with an
average sheet thickness o f 0.99mm.
1000
■ 1mm 2101:1.4mm weld width
A 1.2mm V1437 (top)-0.78mm 2205:1.2mm weld width
X 0.78mm 2205 (top)-1.2mm V1437: 0.9mm weld width
U)2 100
T3 x :
_ j
10 —
10000 100000001000000100000Cycles to failure
Graph 68 Effect o f sheet thickness on lap joint fatigue properties (similar joint stiffness
It can be seen that the 1mm 2101 similar metal laser welded lap joint possessed higher
fatigue properties than both the 1.2mm V 1437 - 0.78mm 2205 dissimilar metal lap
joints. The respective mean fatigue line load ranges (2 x l0 6 cycles) can be seen on
Graph 68, as can the weld widths. This shows that for the same average sheet thickness
and consequently a similar joint stiffness, increasing the laser weld width produced an
improvement in the fatigue properties o f the joints. Unfortunately, the effect o f weld
width could not be characterised using the model by Nordberg and McCann.
322

5.13.5 Young’s Modulus
In order to illustrate the affect o f elastic modulus on the predicted rotation angles, it was
necessary to find a material that had a significantly different modulus to that o f steel or
stainless steel. A s previously stated, the aluminium alloys are currently the largest
alternative to zinc-coated mild steel in the automotive sector. The Y oung’s modulus o f
aluminium is also much lower than that o f steel or stainless steel and in the follow ing
rotation predictions a value o f 69.5GPa has been used.
This material was selected to allow comparison and correlation o f predicted rotation
angles with lap joint fatigue properties.
The graph below compares the predicted rotation angles o f a 3mm aluminium lap joint
with that o f a 3mm steel/stainless steel lap joint.
3mm Stainless: No Gap - 100mm FL
3mm Aluminium: No Gap - 190mm FL
1.2o>Q 1oc 0.8 <
■2 0.6
o* 0.4
0.2
807010 30 500 20 40 60Line Load (N/mm)
Graph 69 Comparison of predicted rotation angles for aluminium and steel laser welded lap joints
It can be seen that the predicted rotation angles for aluminium laser welded lap joints
are far higher than those o f the comparative steel lap joints.
323

This would suggest that a similar thickness laser welded lap joint fabricated using
aluminium would rotate more than a comparable thickness steel, stainless steel or
indeed a dissimilar metal (steel / stainless steel) lap joint. The fatigue properties o f
these joints can be seen in the following graph, which compares the line load lap joint
fatigue properties o f 3mm aluminium laser welded lap joint with a 3mm stainless steel
laser welded lap joint and a 1mm 2101 stainless steel lap joint.
1000
A3mm Stainless Steel: No Gap - 100mm FL ■ 3mm Aluminium: No Gap - 190mm FL
o><5 100
_ i
10 -I— 10000 100000 1000000 10000000
Cycles to Failure
Graph 70 Lap joint fatigue comparison between 3mm aluminium lap joint and 1mm and 3mm stainless steel lap joints
Hence, it can be seen that the 3mm aluminium lap joint possessed the low est fatigue
properties.
This supports the evidence that lap joint fatigue properties are controlled by geometry,
which in turn, determines the extent to which the lap joint will rotate per line load. This
affects the local stress and consequently the early crack growth rate. It should be noted
that the aluminium weld microstructure would also have an affect.
32 4

5.13.6 Partial Penetration and Double Laser Welds
This also explains why no reduction in fatigue properties was seen with partial
penetration laser welding and also the presence o f porosity in the weld bead. A s stated,
if partial penetration laser welds possess the same weld width between the sheets, then
the joint stiffness would not be affected, thus the rotation angle per line load would not
change and the fatigue properties would not be affected. It is also unlikely that the
presence o f porosity within the weld bead would affect the stiffness o f the lap joint and
consequently the fatigue properties.
On the other hand, if the porosity is present at the edge o f the weld, this would
effectively reduce the weld width perhaps increasing rotation, but more importantly
increasing the local stress and affect the early stage fatigue crack growth, drastically
reducing the fatigue properties.
The introduction o f double laser welds may behave in a similar manner to a very wide
weld and reduce rotation per line load range, which would increase in fatigue properties
over single laser welds.
The rotation angle may also be used to explain why Wray57 found no change in fatigue
properties for the four different grades o f resistance spot welded duplex stainless steel.
The joints possessed the same sheet thickness and were welded with the same nugget
diameter, hence it is proposed that the rotation per line load range and consequently the
local stress would be the comparable for the four joints, see Graph 10.
325

5.13.7 Removal of Joint Rotation
For comparative purposes, the final laser weld configuration selected during this
investigation was a dissimilar metal butt joint. Clearly, the butt joint configuration
results in alignment o f the applied load, thus, the joint does not rotate during fatigue
loading. Removal o f the lap joint and the stress concentration significantly improves
the fatigue properties o f dissimilar metal joints.
1000
E.Ezo' 100O)c(0V.T5COO0)C
1010000 100000 1000000 10000000
Cycles to failure
Graph 71 Laser welded lap and butt joint fatigue property comparison
It can be seen from Graph 71, that the dissimilar metal butt joint fatigue properties are
far higher than the similar and dissimilar metal laser welded lap joints. The staircase
produced was statistically valid, however the increment was increased from O.lkN to
0.2kN, to produce three active levels. The S-N curve was only conducted at two load
levels (317 and 338 N/mm) as when testing commenced on the third (358 N/mm)
plastic deformation o f the 1.2mm V1437 occurred. Fatigue failure was observed in
weld bead and in the HAZ, between the weld and both parent materials (see Image 39 to
Image 41).
(1 Gk n 0 7.8O wUy t “n p"3- -----Lf> 2 /
IOX
i iX o ■
XIBK
>1□
□X X m IX- ■ ii i
Av / 'Xj•X
■ All Lap JointsO 1mm LDX2101-1.2mm V1437 butt weld
326
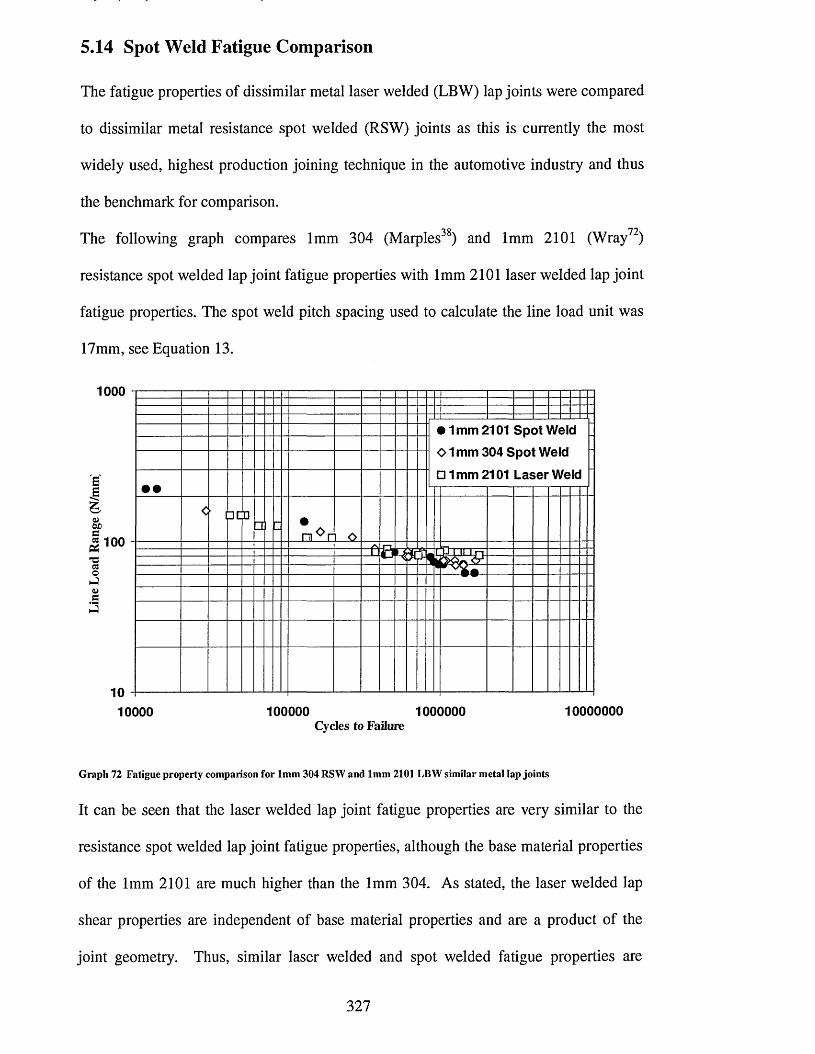
5.14 Spot Weld Fatigue Comparison
The fatigue properties o f dissimilar metal laser welded (LBW) lap joints were compared
to dissimilar metal resistance spot welded (RSW) joints as this is currently the most
w idely used, highest production joining technique in the automotive industry and thus
the benchmark for comparison.
The following graph compares 1mm 304 (Marples38) and 1mm 2101 (Wray72)
resistance spot welded lap joint fatigue properties with 1mm 2101 laser welded lap joint
fatigue properties. The spot weld pitch spacing used to calculate the line load unit was
17mm, see Equation 13.
1000
• 1 mm 2101 Spot Weld 0 1 mm 304 Spot Weld □ 1 mm 2101 Laser Weld
ppaOX)| 100 'O
10000 100000 1000000 10000000Cycles to Failure
Graph 72 Fatigue property comparison for 1mm 304 RSW and 1mm 2101 LBW sim ilar metal lap joints
It can be seen that the laser welded lap joint fatigue properties are very similar to the
resistance spot welded lap joint fatigue properties, although the base material properties
of the 1mm 2101 are much higher than the 1mm 304. A s stated, the laser welded lap
shear properties are independent o f base material properties and are a product o f the
joint geometry. Thus, similar laser welded and spot welded fatigue properties are
327
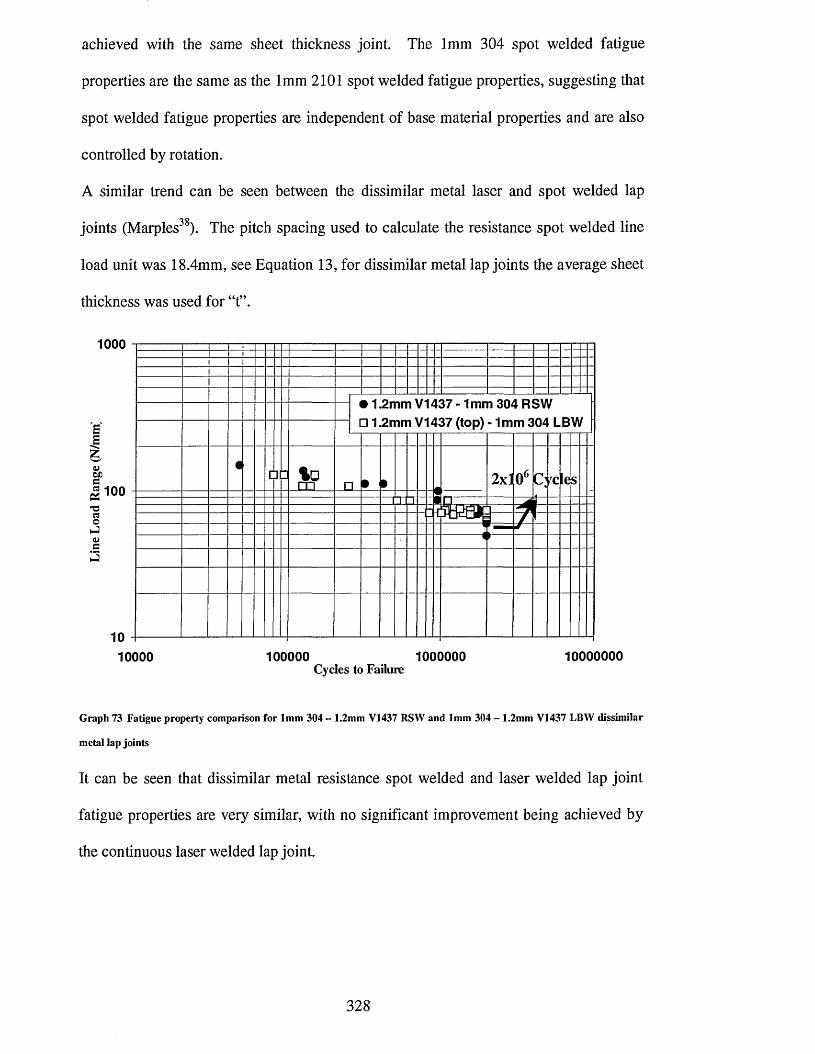
achieved with the same sheet thickness joint. The 1mm 304 spot welded fatigue
properties are the same as the 1mm 2101 spot welded fatigue properties, suggesting that
spot welded fatigue properties are independent o f base material properties and are also
controlled by rotation.
A similar trend can be seen between the dissimilar metal laser and spot welded lap
joints (Marples38). The pitch spacing used to calculate the resistance spot welded line
load unit was 18.4mm, see Equation 13, for dissimilar metal lap joints the average sheet
thickness was used for “t”.
1000
£VDC1 100T3«ohJ<Dc3
1010000 100000 1000000 10000000
Cycles to Failure
Graph 73 Fatigue property comparison for 1mm 304 - 1.2mm V1437 RSW and 1mm 304 - 1.2mm V1437 LBW dissimilar
metal lap joints
It can be seen that dissimilar metal resistance spot welded and laser welded lap joint
fatigue properties are very similar, with no significant improvement being achieved by
the continuous laser welded lap joint.
• 1.2mm V1437 - 1mm 304 RSW□ 1.2mm V1437 (top) - 1mm 304 LBW
i '□ p %0L_m □ • i i --------
2xl 06 C;rclesI I I
^ t =----------
( i
328
6 Conclusions
• The original guidelines for laser welding zinc-coated mild steel, which state that the
introduction of methods to allow zinc degasification o f the internal lap face are not
required for zinc-coatings o f <5pm appear to be incorrect. A single zinc-coating
thickness o f 6.14pm at the internal lap face o f the dissimilar metal joints was
sufficient to produce porosity and blowholes in the respective weld beads when no
zinc evacuation methods were employed.
• The problems caused by zinc vapour at the internal lap face o f dissimilar metal lap
joints may be overcome without the use o f additional equipment or processes such as
shims between the sheets.
Increasing the heat input o f the process by reducing the welding speed and
defocusing the laser beam, provided sufficient time for the zinc vapour at the internal
lap face to escape through the molten weld pool. This not only removed the
problems with internal and surface porosity (blow holes), but also allowed adequate
suppression o f the plasma formed.
• No detrimental effect o f liquid metal embrittlement o f austenitic stainless steel by
molten zinc was evident. The diffusion o f the zinc into the 1mm 304 was not
observed to affect either the lap shear or lap joint fatigue properties o f the dissimilar
metal lap joints.
329

• Reducing the welding speed did not improve the homogeneity o f dissimilar metal
butt joints. On the contrary, the range o f compositions found in the weld bead
increased as welding speed was reduced (more inhomogeneous).
Reducing laser welding speed produces a more uniform weld bead shape (butt joint),
with an average reduction in weld bead microhardness.
• The effects o f Marangoni flow did control dilution and stirring in the laser welded
butt joint. The effects are clearly characterised by the chromium and nickel speed
maps further substantiating the mathematical and FE models from current literature.
The material at the top and bottom o f the lap joint configuration greatly affect the
composition o f the lap joint weld bead; the dilution and composition range being
shifted towards the base material from the top o f the lap joint (mild steel/stainless
steel grade).
• The thermal properties o f the respective materials control the shape o f the lap joint
weld bead. A more uniform weld bead is achieved when the V 1437 is at the top o f
the lap joint compared to a ‘top-heavy’ weld bead shape when the respective
stainless steel is at the top o f the lap joint.
The result being that a wider weld width between the sheets is achieved when the
V 1437 is at the top o f the lap joint for a fixed set o f laser welding parameters.
330

• The predicted structure (Schaeffler diagram) o f the dissimilar metal laser welded butt
and lap joints is martensite, which is corroborated by the high weld bead
microhardness.
• Similar metal stainless steel lap shear properties were between 89 - 98% o f the parent
material tensile strength. The elongation to failure was lower due to the weld bead
not contributing to plastic deformation. Both lap shear and fatigue failure occurred
at the edge o f the weld in the HAZ.
The “non optimised” 1.2mm V 1437 similar metal lap shear properties were 87% of
the parent material tensile strength with failure occurring in the HAZ.
Dissimilar metal laser welded lap shear properties with greater than 100% weld
efficiency were achieved with the 1mm 304, 2205, 2101 and 0.78mm 2205 to 1.2mm
V 1437 (failure occurred in the parent material o f the V 1437).
• Joint configuration (material at the top and bottom of the lap) and weld width did not
affect the lap shear properties
331

Fatigue Conclusions
• It is possible to produce dissimilar metal laser welded butt and lap joints between
two materials with large parent material tensile property differences without fatigue
failure occurring preferentially in the material with lower properties. Lap joint
fatigue failure occurred randomly in both respective materials; in som e cases failure
occurred in both materials for the same applied line load range.
• Both similar and dissimilar metal lap joint fatigue properties are controlled by:
1. The severity o f the local stress at the internal lap face.
2. The early crack growth rate o f the material at the internal lap face.
• The extent o f the local stress is directly linked to the applied load and rotation angle.
• Since the rotation is symmetrical, both materials rotate to the same extent; hence the
local stress is the same at the internal lap face o f both similar and dissimilar metal
and thickness lap joints.
• The model produced by Nordberg and McCann for predicting rotation angles per line
load appears to be accurate up to 40N/mm with regard to the 1mm 2101 similar
metal lap joint.
• The model correctly predicts the effects o f sheet thickness, interfacial gap and elastic
modulus, when compared with similar and dissimilar metal fatigue properties.
332

• The laser weld microhardness, composition and martensitic structure had no effect
on the fatigue properties o f dissimilar metal lap joints. That is, the early stage crack
growth rate o f the materials at the internal lap faces were similar for the range o f
joints produced, promoting random fatigue failure.
• The extent to which a joint would rotate per line load was controlled by:
1. Sheet thickness
2. Interfacial gap
3. W eld width
4. Elastic modulus
• Increasing the sheet thickness o f one sheet, although increasing the eccentricity o f
the applied load, would increase lap joint stiffness, reducing the joints susceptibility
to rotation and improving the fatigue properties.
• The introduction o f an interfacial gap increases the eccentricity o f the applied load
and increases the joints susceptibility to rotation due to no increase in stiffness. Thus,
the fatigue properties are reduced.
• Increasing the weld width between the sheets improves lap joint stiffness, thus the
susceptibility o f the joint to rotate is reduced, improving fatigue properties.
• Lap joints produced with a lower modulus o f elasticity appear to rotate more per line
load and consequently have lower fatigue properties (Aluminium Alloys).
333

• Dissimilar metal lap joint fatigue failure occurred in the HAZ, weld bead, and
HAZ/weld bead interface; thus, the propagating fatigue crack has no preference for
microstructure.
• Fatigue cracks were present in both materials for both 1mm 2101 and 2205 to 1.2mm
V 1437 lap joint configurations. The observed fatigue crack angles were the same.
• 1mm 2101 similar metal lap joint fatigue crack propagation occurred at an angle o f
75° to the sheet surface. In comparison, 1mm 2101 - 1.2mm V I 437 and 1mm 2101
- 1.2mm V 1437 fatigue crack angles were 65°.
• The fatigue cracks were found to exist intermittently along a transverse section o f a
lap joint, thus supporting the hypothesis proposed by Linder et al o f multiple fatigue
cracks.
• Dissimilar metal laser welded butt joint fatigue properties were far superior to the lap
joint fatigue properties as no rotation o f the joint occurred.
Dissimilar metal butt joint fatigue failure occurred randomly in either the stainless
steel or zinc-coated mild steel HAZ interface.
• The use o f the line load range (N/mm) unit for assessing and comparing lap joint
fatigue properties allows a far wider comparison o f fatigue properties than other units
used to compare fatigue properties.
334

6.1.1 Integrating Stainless Steel into Existing Automotive Design
The future seems bright for the integration o f austenitic and duplex stainless steel into
existing automotive design.
The use o f stainless steel offers distinct advantages over the largest currently used
alternative to zinc-coated steels, the aluminium alloys. The use o f special welding
techniques to improve the weldability and increase the performance o f aluminium laser
welds is not required for the production o f high quality stainless steel laser welds. The
fatigue properties o f similar metal aluminium lap joints are also considerably lower than
a like thickness similar metal stainless steel joint.
The major disadvantages o f dissimilar metal lap joints between stainless steel and zinc-
coated mild steel, for example, the high hardness o f the weld bead and dilution o f Cr
and Ni in the weld bead does not affect the fatigue properties o f the respective lap
joints.
The problems with increasing the galvanic effect and consequent higher rate o f zinc
removal in the dissimilar metal joints would be negligible as the joints would be
subjected to the standard automotive painting systems. This being possible as the
stainless steel does not require the use o f additional pre-treatments and reached the
required standard in scab tests, etc.
The problems o f liquid metal embrittlement o f austenitic stainless steel by molten zinc
have not been seen during this investigation.
With new, more cost effective grades being produced, such as the 2101 duplex stainless
steels, which contain significantly lower Ni contents compared to standard duplex
grades, the integration o f stainless steel into existing automotive design becom es more
attractive and cost effective.
335

With grades o f stainless steel being produced with Rm values in the order o f lOOOMPa
the scope for weight reduction is larger than ever and obviously reduces the cost o f
integration further. For example, a dissimilar metal lap joint between 0.5mm, lOOOMPa
stainless steel and 1.2mm V 1437 would fail in the parent material o f the 1.2mm V1437
(lap shear). Thus, the estimated weight savings o f up to 40% could be realised. This
would allow the automotive manufacturers to meet the current legislations for reducing
vehicle emissions, which stated that the development o f engine technology and
reductions in friction etc would not be enough.
Although, the production o f stainless steel dissimilar metal lap joints with zinc-coated
mild steel produced no improvement in fatigue properties compared to the standard
zinc-coated mild steel lap joints (as lap joint fatigue properties are independent o f base
material properties), this may allow the existing design criteria to be used.
336

7 Further Work
Further clarification linking the effects o f joint rotation to the fatigue properties o f
similar and dissimilar metal laser welded lap joints is required. A range o f joint
configurations comparing sheet thickness, weld width and interfacial gap need to be
completed to characterise the angles o f rotation and the respective fatigue properties.
Question: Does an increase in weld width increase joint stiffness and reduce the
rotation angle therefore improving fatigue properties?
Since lap joint fatigue properties are geometry dependent, if the rotation angle could be
accurately predicted using a model similar to that produced by Nordberg and McCann it
may be possible to link the rotation angle to the fatigue properties. In the case o f
dissimilar thickness lap joints, the use o f FE analysis may be used to predict the rotation
angle, with the aim being to link them to the experimental fatigue properties.
Question: What is the effect of the free length on the rotation angle?
This may allow the fatigue properties to be predicted and hence reduce the time
consuming fatigue testing programs, especially the determination o f mean fatigue
properties at pre-assigned cycle lives (staircase method). The use o f FE analysis may
also allow the clarification o f the weld width variable with regard to rotation and
consequently fatigue properties.
The effect o f the elastic modulus on the rotation angles and consequent lap joint fatigue
properties needs to be investigated; more specifically, the characterisation o f the
rotation angle o f a dissimilar metal aluminium/steel lap joint.
Question: Would the rotation angle be equal in both sheets?
Would fatigue failure occur randomly in either material?
337

8.1 Trumpf 5kW - Fatigue Results (Staircase & S-N Curve)
339

zO £II II 50? H.3 7?
? 2 Xu ~
in -I , o5* =■S 11o X
II —
Number of
cycles
♦10J >►OsJ<
S^]x> 3
TotalStressN/mm:
m-3nn5*n I
A/o0£
J f 2 £ i sr 5 C*ii
A(T»It/>
y|E
gJO
£PC>
5 - - ^ c/J -F
. Step No ,i
O
113 3^3 > -
left 5 ^ 2 k#r» ■
. NJm s s z % • /
IS > I fftft -U2 ^ ? 6 3 & s2
4A
N
& 1 C 1
£0pr
c33
0 *y i
z, ^
zif«a3a
V
0
^ ■
SIA
1®
S '
0z
? ■O ''LiflS'0
1!G6
P 'n>-D
0
O
F*
1
JftHV
z
o5*5 1 ?
1
t o?3
H3s*Mzo
aa*<
3 o o i r « -\J
PN2 o ? ? 2 ? - ?1 2 5 ’2 S ’^ g ’
V✓/ 30
22<=||CI 2 ) \ oSTSU-S.& ; !l o w 1 ^ 0 f —
3 o 3 5 S i 3 \ N»
20 6 1 # .\>
L»J
2 ? « r s .-^ s - <)r V
-U
l o s s u - / ^\
fI<3 2 ? 5 '© e) V
/ C\5 6 3 0 2 5 s.
/0
■»-J
%1SI2^S r/
\»
30
l f 6 3 l 3 6V.
*k* o
1 5 1 5 2 6 2As SJ
o
2 2 6 ^ « r?
\>. N>
) N>NJNJUJ
«
N>
NJCNNi
i* ) IS O X S 'NJ00
2 0 I6<=i X*
NJO
3 3 , 5 6 2 X SOJoUA
IIS 3 6 0 - X tn UJNJ
I f ? R-35? X *u>Ul
116 X u>.uUJ
2s o e ^ X -F u>CN
25=1 1 2 6 K . *■ Ul I
c
O
OJT>0
5 ? 2 4 -4 -5 X &OJ30OJo.uo
<runouts
Num
ber 1
MIIT1
)ffailuresfi
MII> »
mMIIG3
*
FATIG
UE
TE
STIN
G, STA
IRC
ASE
ME
TH
OD

u
O Xii k ^ 2 SSM s ~-j 3 STI S’ «““00 —5 3 n-t r» 6j8 s o“ 3 5.
■3 »o X
Nu
mb
er o
f
cycles
*10
3
5
-
LaJ
S3
V 3
f
\Al
v \
To
tal
Stress
N/m
m2
CO"3on3'n r t ;
i !
%
r *0
I
I i
3
r I
!
%
i
7|3
r -
3 >\ AOS
A>
OST -
O
d ' - 1S3 J4 f
Z 40 ° FT-.03
3O
I f 6 i ( 4 $ c 6 -
\ 2 2 2 o 6 g\ . r
NJ
2 q 2 t < i 0 5X
C*J
2 o i 2 S 5 ' 6\>7
■U
c s < « < w t\ . )
* C/1< /V $
1 1
G 3
r ^ ■
a
j >
r
5
0 I« q
a.
* i
L i
Ziy
•oa.
i
V
I O
0
1t/1
©
t o .
o '
(Vt
0
I
\
h
0
I
A >II
0
p '
T >
" 0
o l
0
■F
1< :
z1 oi*
3 I
3
l
S
a5*Z
-Iaa
2 0 4 4 8 4 84lv
c\
2 2 3 1 4 - 6 7)
r \ 4
l o u s e sV
V oo
1 I O O 6 8 1\ /
*1' vO
2 o o 4 © i £l ( \ ©
1 3 4 - 1 0 ? ?\ J
X 'H
I O ? l 8 8 5 ” Xy
fNJ
S i t O ' I S a / UJ
2 © 2 i < 8 0 6 r \s
!u
2 W 7 - 2 4 < TL )
rC/i
2 6 S S " o o SC
\cs
6 7 2 * S 6 4L ;
X -xj
I 5 - ? S " 6 H *I
oo
1 ® O A 6 ? -= ? \/
f vO
1 5 6 2 * 5 ? v
)*
Ii NJO
/ X NJ
NJNJ
NJt*J
NJ-U
NJCS
to'O
1 5 0 % O G X1 ^
NJOO
~ = p \ X< *
NJSO
<=14- c n - z X ) &UiO
CJ
1 4 0 6 /1 X (A u>NJ
1 2 4 - T 9 - 1 X *
UJ1>J
2 4 3 5 = 1 ? XCO•U
OJC/1
5 7 6 2 * 4 X1
... *
COOs
6 2 = 1 X*
CO«o 3<*
&
i c !
c
<■ *.
(
o
O
£
X
3
1 1 1 6 0 2 6 X i IC*J00
COso
.uo
° 2 £ § C/J < z
C -
§ . .n-1MII“T1
"*)r i 5 ? n z;V) 1
MII>
' *rr>
MIIra
*m
FATIG
UE
TE
STIN
G, ST
AIR
CA
SE M
ET
HO
D

oxII II 70 21 W
X M M O*.03 £ c
-8 iio X
X^ IIU "0" I$ ?n ti,r i
Number of cycles *!03 hOJD(P <jr*Mto>CrO TotalStressN/mmJ C/5TJOn3*f?
(0- C/sJ■r Step No ,i 3O221 064 V f -45=1,436 */A NJ1 £fS? 2,3 =? La3/322 55 r\A ■U2012 650 LA2 18 620 J\ Cv2C4-S” +•25' )/ 'J<T2<=1 S>60 00S'S"/ 26 if vO612 243 »A o4341 22 \ *» —2 <=>©8213 _ / NJ23I242S- ()/\ LaSS"44o4 CJf1000444 Vt LA£64 /' < Os2116 04C| r✓SL
385" LNf OO2 253542 r/sr2 0284-42 c) jrV NJO\Oooocoo V,fr\ N>) NJNJNJLa
«NJ.UNJcsNJ-J5" 20 X O' NJOO14-3 A-35" X NJO**-C> \6 X ) t LaoLa
S3- IIO X \ La « NJ114" 30 2 X Kw *La ^130> 6-) <T X ) l lu "LaLA4-2 2‘n X * LaCN4-32 2t*-2 X f * (44*1 3o*t- X / t La005S <6 (g aS. 3
° 35-
&c/i0t
f Ir-2>K
t(drC7
7*
G
6
•r(W
&
Ofi / 1QQ
fO
1>- o
8*IH .
JOT)o0
I
cP
0
FATIG
UE
TE
STIN
G, STA
IRC
ASE
ME
TH
OD

Mean
fatigue strength
= X, standard
deviation =
s X
= P0 +d
(A/F
-l/2) = _(
I /
2) =
[N/m
m2]
P0 =
Total stress for step
0 (i=0)
If (F
*B
-A2)/F2 =
>0.3 and
<1.2'.'I =
FailureO
= R
unout S
= 1.620
*d {(F*B
- A
2)/F2 +0.029} =
■
[N/m
m2]
L
Number of cycles *1
0’
)o > F <
9 )
Ao ) N .
OiJ (
^ > ^ -
A .TotalStressN/mm2
Specimen no.
3O f3>I
0
i35Ii
-1ONzcrt0**
0
S 'ItA4**
0I
7Z>II06
r - 1D>*0
0*■"
|
r-
f 3
£(Tvra
(> - - rO j4 -F <AcZ oo ° ff o-.-o
2 . •-
1 %4
y fNi
2 0 0 1 9 2 1J) s
2 2 S 2 A S 3J
p\ -U
6 o * + 5 2 2J
kifLn
5 N c . iC 1C/v
0
£/■s
a
o !3
5 T £
Zi5o
f3*3
VJ O
0
r</*
e)
0 % '
N
0x>K>0V)F
<c
S■v
z1Of4ji
fifO33 /
|.Z
Ha.
&2^/
\ f .. ©\2 2 3 % /f V
622 S t e/ OO
\5< \c& -2£ f
t» o) £ 0 0 0 0 3
“ / \ olO,oe>o,Gcc /
*V/ NJ
29 \ ; c\ »-J\ } -U
2SfS"*i3V)
/ >t-rt
l * S o S 6 ^ 5 ">
/o
3 o W S S l .-J
I5"36 0 ^ 0 Jf
oo
IS><=I b ± ° \ V f
so
+IO 3S"+ */
fNJo
J o ? %4
*NJ
[ O o o o o o oJ
\
<• NiNJ
\ J NJUi
NJLn
NJCN
6*0 6SS“ X I ^NJ-J
© o o X NJ00
X 3 s NJsO
u>o
5S" 6 2 6 X Ui
g'T IIS X c *■UiNi
*<-6o X ) &UiUi
U-u
X 'I *LJUl
qS SH-I X tl*io
2#S 32.6 X j &U)-J
a
NO0
o ’oo\0
U»00
UiVC
-Uo
! !(/> i zc
- 1 *o-nMII•n
* r , 5 S’ro z;V) I
MII>
♦
M. II
S3*
zr>
FATIG
UE
TE
STIN
G, STA
IRC
ASE
ME
TH
OD

8.2 Rofin-Sinar 2kW - Fatigue Results (Staircase & S-N Curve)
340

w -T _ o O’ =
e X
■2 3
1
Number
cycles
♦10’ JO oov>
Tt30
TotalStressN/mm2
00■aoo3o t f -
2
$i°
? 1 3
J 5
7|ar*
—>o - - W-F
Step No ,i
3O f|
8?10
2 2 ^ 0 ^ 6 \ r - 0 Z2 °\<3H 2 .
4v * to I (T>
r2 & b o ^ ‘1 IfJ 0A - o / 9 2 9
V-U ]
16 l f J ^/
/' V
t-rt tf\ s.,Z l(Ac
Cl2 0 3 0 5 7 5 ^ r
J CN 7, !P I
2 6 £ £ 2*5”V..*
r■\U 2C I
0
2 c> 2 2 ^ -S ~J
V 00 C/1 0
e1
2 2 5 - / 4 9 3 c o 0X”
2 . k ^ - S ° \ 0?
Kf o 0T>r
\N«?iW2^& 4-3C > •s
/f
\ —
(ht(/>
2 . ^ - 2 0 3 9 N/
<• NJ VS 7 6 4 9 - 0 s
/' L*J
2 ^ 9 5 S 2 2 r V>* —
, 6 4 - 3 / 5 9 / v.'a a
3O
2 & M 6 U -Z r7
t S Of 7, ? lS b o o o o i K.
r \ to i r2 o © 4 - 3 3 9
V)r \ 00 X f i
I 2 2 l ° f i 6V.*
N/ o 7 “201 5 * 6 5 " e
7 V NJO o1°
\ ) NiNJNJ ii 3N)U»Ni-U
NJC\
Num
ber of specim
en
b
Testing K
o.
Ni-JVn 2 $ ? 9 A - X ) ^
NJ00 H2lS& > «t-©- X r N)VO N*
8.*<S 3 > o o S “ X OJo 0 ■
Ui
2 M S IS XOJNi crrrr3VH?S<&2 X rt>JUJ i
2 6 2 , 5 0 2 . X ) zUJU>Oil w
do.
OJC\OJ
(®✓T oL*J00 0
U»vO 1-Up No •
(runouts Xc T
M_l_ 3*1
)ffailures
da*o-i (M
M'1> *rr>M_il_ *rr>
FATIG
UE
TE
STIN
G, STA
IRC
ASE
ME
TH
OD

z.O CII II<7 CJ
5s <:ii n Ii
X cj CJ ZT.z* ^21 C “I On ._to £*,
n —CO X. o-8 » so X
~ £
z33
1
Nu
mb
er
cy
cle
s
♦1
05
S >
5 0 - 0
0 * 1 > 5
O
J O
i o
> >
f *
To
tal
Stre
ss
N/m
m2
00- 3oo5*o
?. f3 2! 3
t q
Product |L
os
ev
—I
- r ' O rj 4T <
Ste
p
No
,i
3O |
f
*i '- ( | \
0t
I S ^ f e V c o l
t NNJ
p
i'
4
»>J J 0
^ 0 ^ 1 5 ?
I Js ' X
c ?
>
/
i f
) \ —V i
M \ rm e
K O °3 0 S « i 6 l 2 C■ \
<
Zc?*
VJ
r■v c 10
I
§
M ^ I S ?
V. )
/0 0
1
>
J W
o
V 7
6
T >
<
p *3 0 2 -3 ^ 4 - V
J
'
<
o i X
2 o U ? t & 8
/
\—
r * 4s
l o S ^ - W S .
k. /
> *b J < \ \
I '
( / » :
a
&
t6 5 0 4 - 2 2 \ '
wV i
< q s " 2 I O < * -
> \X
2 6 ^ 2 ^ 4 rj
*V l 3 3
O
2 o f c " S o o o/
r \C n o f 3 » -
2 \ \ C o ? ‘ a l
0 . )
/■ \—J
r
2 Z ? # U - U
c
r VOO
* ?i
6 > 3 S " O R l
\ . J
fo
1 -
ii
r o
>9 7 J t - ^ 5 s .
J \b Jo
' l o U - C X i ^ ,
?
VNJ j
I c ^ & r ^ a u -
I ;
\ *NJNJ
0/ NJ
V»
0
—b J-X
NJCV
1
■i1?
Testing N
o.
NJ'- J V
B 1
< z & y \ < z X O nNJ0 0
< £ ^ © 8 5 ? XX NJ
Oa*<
6 1 X cVJo
VJ
1 / ^
u c ^ q q - X V IVJN) T >
I C 3 ? A ^ t 6 X • mV IV I
c 4
G
q ^ - o o z . X C
V I.u- t
VIVi
l ? > « - 8 7 X KVI<3\
d >1
1 6 ^ 6 - 7 - X [ KV I
0X
VJ0 0 ChVJVO 8x.o
(r
un
ou
ts 2 :c
-4—\ )
MII
• n
3f
fa
il
ure
s
a -0
MII> *
rr^
MII
C3
FATIG
UE
TE
STIN
G, STA
IRC
ASE
ME
TH
OD

Mean
fatigue strength
= X, standard
deviation =
s X
= P0 +
d (A
/F-l/2) =
(
1
/2)=
;
[N
/mm
1]Po =
Total stress for
step 0
(i=0)If
(F*B -
A2)/F
2 =
>0-3
and <1.2
H =
FailureO
= R
unout S
= 1.620
* d
{(F*B -
AJ)/F
2 +0.029} =
[N/m
m2]
I
Num
ber o
f
cycles
*10’
>
0r i [
r i
-
A o
o u
tl
1* -f
NJ
Total
Stress
N/m
m2
Specimen
no.
elD 1
7 * *
r \
1
3a
1
s’
i
X\A<•0
I
ON
J0
I '
7 0
II
0
6
ps>* o
* -
I
y1
3 >0 0
£
2(TNr0
( ) - - 0 A l r c» \
Z oo ° ff ■*_. -a
W f V -
I l ' t t c S k -y
to
T ^ - r . n - ° i X\ . J
%' to
%/
3 2 2 2 W 7 -
~ ;'v.t/l (A .
n
c 1I/) "
0
03>
r
23
o f* p*
K II "
2a1
13
v /
N O
0
i
<A
(?)
8XN
aY o l
0
1
c
1
t2
0— §*
/
p
31
0a5*2
0aa«rV<
a
• ^ 2 0 6 2 ^\ .7
'i ’CN
1 2 1 ^ ^ , 0 3/
'w
■o
*y
00
O H - S 'I g C A - f■ 7 \
o
2 . ’£ c r ? ‘4 S ?\
Vo
\ 7v f =
l Z 2 o > S & %/
fs.
to
2 . \ fto
2 0 0 1 ^ 4 -/
\t
3
( )\
t/l
( )\
CN
S -* 6 }-}S ' ( )s 'O
2\O t+ S6G 00
I c zO ^ Z G K)r V 3\ )
'too
/1
\ to
2inQ4-Jl\
\7 toto
\ J tototo
toONto«o
X (Is to00
'ZOZLbS X toNO
ZgbrOg, X ) 2tooto
3 1 6 ^ -3 X ' «t toto
I c R - l t t X toto
l\C ) o z ° \ X ) &to-U
tot/l
ISS23 2 X > ftoON
2 o ^ S ’4 0 X [ j r . to~o
\G\ 7&*i X ) Sto00
toNO
.uo
° 2 £ ic/) i
2 :
40-0MIIT]
r> =; o n:
MII>
*«rr>
MIIC3
FATIG
UE
TE
STIN
G, ST
AIR
CA
SE
ME
TH
OD
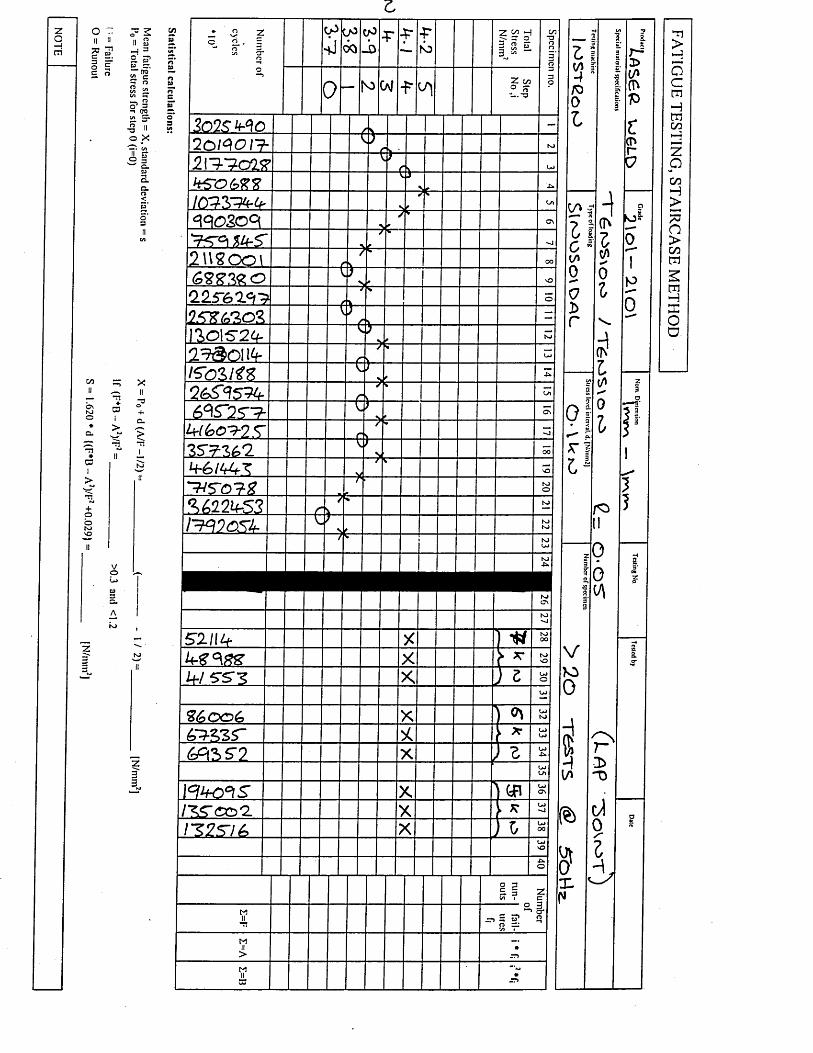
6
Statistical calculations:
Mean
fatigue strength
= X, standard
deviation =
s X
= P0 +
d (A/F
-1/21 = (
Po = Total stress
for step 0
(i=0) ------------------------—
' ’
'
11 = Failure
If <r-B
- A
’)/r’= >0.3
„„d <1.2
0”
Runoul •
S«
l.62
0-d
|(F
*B
-A!)/P’+0.029|=
[N/m
.
....... 1
—
Num
ber of
cycles
♦I05
i i d o - b• F f
r o
w . ,v
TotalStressN
/mm
2
/)3 - r
I- zI VJ
/ o0
1 1 5 ir s
i
i
3>|.
a>v>(&P
CcnrC?
3 '- W * •< A
Step No
,i
l o l S M o r \- L
2 0 1 4 0 r * J ho
2 l ^ ? 0 2 . 5 5 ?(r \ LJ
hS-O&XXl )
Sr 4S'
/ sr~ L- CA w “ 1
:(T*
Vi0*0
&
5$
t(/i
0
I
ii
6
P
" 0
o i '
j
5
ck J^
0
Tp
0
zIo
3 1!
5 *1
H85*0*Zo
8£
p
4 4 0 2 Q < 4 A4
S*/*
C y
- ?J C si r I
2 W ? O o \/
"V &= v>J
X < 0
0 . 2 . ^ 6 2 4 4 /j V.
G C7
I S Z t f b O l (j/ \
: b- r
]7 > 0 \S 2 4 - ( )* K)
/■?
\w
U
I 5 0 Z I * Z V.N
Q 6S4S1U - /■ \ Lr 1
6 4 5 2 ^ I )s. * C> 0 }
r/ <•
tn
i *
zi?
ai'3
V
> o
0
i
0
(M
)s 00
i+ 6 IU4-X s/r
oNJo
R 6 2 2 « f 6 3 r> hj
r W 2 c & h I ;Nf
SJNJ/ \ NJ
hJ-U
NJOsNJ-J
52114- X ' TW S
4 - Z 4 8 Z X > ** s
I + I S S 3 X ; Z su>
X6 > z , s r X fc w
& P & 5 2 Xz3
OJLh3m
\<=I4C>4S X Gfl -
! Z 5 c o 2 X ► * 3
I S 2 5 I 4 , X Xj Buj
o
a pZ 5 Z09 l C
MIIti
nber3ffail
uresn
MII>
*
MIIa
*
FATIG
UE
TE
STIN
G, ST
AIR
CA
SE M
ET
HO
D

8.3 Lap Joint Rotation Results
The following appendix contains the experimentally determined lap joint maximum
rotation angles as a function of line load range for the following joints.
1mm 304 - 1.2mm V1437 (top) dissimilar metal lap joint
0.78mm 2205 - 1.2mm V 1437 (top) dissimilar metal lap joint
1mm 304 - 1.2mm Y1437 (top) dissimilar metal lap joint
2.5
2.0
U)a)Q0)U)c < c .2 1COoDC
1.5
0.5
0.0
0 1 mm 304 -1 .2mm V1437 Lap Joint - 100mm FL
20
I
40 60
Line Load (N/mm)
80
I
100
Graph 74 1mm 304 - 1.2mm V1437 (top) lap joint rotation angle per line load
341

0.78mm 2205 - 1.2mm V1437 (top) dissimilar metal lap joint
2.5
2.0
6) a)QJ 1 .5O)c <.2 1-0w *-> o a.
0.5
0.00 20 40 60 80 100
Line Load (N/mm)
Graph 75 0.78mm 2205 - 1.2mm V1437 (top) lap joint rotation angle per line load
A 0.78mm 2205 - 1.2mm V1437 Lap Joint - 100mm FL
i
$t
342

8.4 Butt Joint Composition
Parameter set 2 (P2):lmm 304 - 1.2mm V1437
The following speed maps were produced using a Philips XL40 SEM.
1mm 304 1.2mm V1437
Image 53 Secondary electron image from parameter set 2: 1mm 304 - 1.2mm V1437 butt joint
1mm 304 1.2mm V1437
Image 54 Speed map for Cr from parameter set 2: 1mm 304 - 1.2mm V1437 butt joint
1.2mm V1437
Image 55 Speed map for Ni from parameter set 2: 1mm 304 - 1.2mm V1437 butt joint
343

The two graphs below show the approximate percentages of Chromium and Nickel
within the weld bead. P2 = 3.5m/min
n m
■ 16-20
12-16
P2: 1 m m 3 0 4 - 1 .2m m B utt W eld % Cr C o n te n t
S1
0 .25m mIn c r em e n ts
S51 2 3 4 5 6 7 8
0.25m m In crem en ts
Graph 76 Weld bead % Chromium content from parameter set 2: lnnn 304 - 1.2mm V1437 butt joint
18-10P2: 1 m m 3 0 4 - 1 .2m m V 14 3 7 Butt W eld % Ni C o n ten t
S1
S 3 0 .25m m In c r em e n ts
S53 4 5 6 7 8
0 .25m m In crem en ts
Graph 77 Weld bead % Nickel content from parameter set 2: 1mm 304 - 1.2mm V1437 butt joint
344

The data used to produce the weld bead composition graphs was then used to predict the
dilution and phases present in the laser weld bead. The range of compositions found in
the weld bead can be seen on the modified Schaeffler diagram below.
AUSTEN ITE
xAUSTEN1TE +
MARTENSITE' USTENITE + FERRITE
M A R T E N S I T E
MARTENSITE ■f FERRITE
FERRITE
5 i O 15 2 0 2 S 3 0FERRITE STA BI LI SI NG EQUIVALENT
< % C r +- ° /o Mo + I ■ 5 x %.Si + 2 x % N b + 3*%.Ti]
Figure 70 Shows the predicted weld bead composition for the 3.5m/min 1.2mm V1437 - lrnni 304 butt weld
Hence, the predicted weld bead microstructure would be martensite.
345

Parameter set 3 (P3):lmm 304 - 1.2mm V1437
The following speed maps were produced using a Philips XL40 scanning electron
microscope.
1mm 304 1.2mm V1437
Image 56 Secondary electron image from parameter set 3 : 1mm 304 - 1.2mm V1437 butt joint
1mm 304 1.2mm V1437
Image 57 Speed map for Cr from parameter set 3: 1mm 304 - 1.2mm V1437 butt joint
1.2mm V1437
Image 58 Speed map for Ni from parameter set 3: lnnn 304 - 1.2mm V1437 butt joint
346

The two graphs below show the approximate percentages of Chromium and Nickel
within the weld bead. P3 = 3.0m/min
■ 16-20
12-16
8-12
P 3 : 1 mm 3 0 4 - 1 .2m m V 1437 Butt W eld % Cr C o n ten t
520.25m m
In crem en ts53
S43 4 5 6 7 8 9
0.25m m In crem en ts
Graph 78 Weld bead % Chromium content from parameter set 3: lrnrn 304 -1.2m m VI437 butt joint
P3: 1 m m 3 0 4 - 1 .2m m V 1437 Butt W eld % Ni C o n ten t
S1
0 .25m m In crem en ts
S2
S3
0 .25m mIn crem en ts
Graph 79 Weld bead % Nickel content from parameter set 3: 1mm 3 0 4 - l.2mni V1437 butt joint
347

The data used to produce the weld bead composition graphs was then used to predict the
dilution and phases present in the laser weld bead. The range of compositions found in
the weld bead can be seen on the modified Schaeffler diagram below.
AU5TENITE
AUSTENITE +
M ARTENSITEUSTENITE + F ERRI TE
MARTEN
/ M A R T E N S I T E
4- F E R R I T EV143mferrite
IO 15 2 0 2 5FERRITE S TA BI LI SI NG EQUIVALENT
(° /oCr + o /oMo + | . 5x° /oSi 4- a x ^ o N b -F 3 x % T i ]
Figure 71 Shows the predicted weld bead composition for the 3m/min 1.2mm V1437 - lnim 304 butt weld
Hence, the predicted weld bead microstructure would be predominantly martensitic with
small quantities of austenite and ferrite present.
348

Parameter set 1 (Pl):0.78mm 2205 - 1.2mm V1437
The following speed maps were produced using a Philips XL40 SEM.
0.78mm 2205 1.2mm V1437
Image 59 Secondary electron image from parameter set 1: 0.78mm 2205 - 1.2mm V1437 butt joint
1.2mm V14370.78mm 2205
Image 60 Speed map for Cr from parameter set 1: 0.78mm 2205 - 1.2mm V1437 butt joint
1.2mm V14370.78mm 2205
Image 61 Speed map for Ni from parameter set 1: 0.78mm 2205 - 1.2mm V1437 butt joint
349

The two graphs below show the approximate percentages of Chromium and Nickel
within the weld bead. PI = 4.0m/min
20-24
16-20
12-16
8-12
4-8
i 0-4
PI: 0.78mm 2205 - 1.2mm V1437 Butt Weld % Cr C ontentS1
5 4 30.25mm Increments
0.25mmIncrem ents
Graph 80 Weld bead % Chromium content from parameter set 1: 0.78mm 2205 - 1.2mm V1437 butt joint
P1: 0.78mm 2205 - 1 .2mm V1437 Butt Weld % Ni Content
S1
-S20.25mm
Increm ents
S3
4 30.25mm Increments
Graph 81 Weld bead % Nickel content from parameter set 1: 0.78mm 2205 - 1.2mm V1437 butt joint
350

The data used to produce the weld bead composition graphs was then used to predict the
dilution and phases present in the laser weld bead. The range of compositions found in
the weld bead can be seen on the modified Schaeffler diagram below.
AU ST EN I TE
AUSTEN1 TE + # 2 2 0 5
AUS?fNlTE + FERRITEM ARTENSITE
M A R T E N S I T E
M A R T E N S I T E +• F E R R I T E
-.6 *
f e r r i t eVI437lO 15 2 0 2 5
F E R R I T E S T A B I L I S I N G E Q U I V A L E N T ( ° /o C r + ° / o M o + l -5x°/oS i + 2 x ^ o N b F Sx^/oTj]
Figure 72 Shows the predicted weld bead composition for the 4m/niin 1.2mm VI437 - 0.78mm 2205 butt weld
Hence, the predicted weld bead microstructure would be martensite.
351

Parameter set 2 (P2):0.78mm 2205 - 1.2mm V1437
The following speed maps were produced using a Philips XL40 SEM.
0.78mm 2205 tfjj 1.2mm V1437
Image 62 Secondary electron image from parameter set 2: 0.78mm 2205 - 1.2mm V1437 butt joint
§ £ S S »
; u,'hf'£irxH'. ; V i *
0.78mm 2205 1.2mm V1437
Image 63 Speed map for Cr from parameter set 2: 0.78mm 2205 - 1.2mm V1437 butt joint
0.78mm 2205 1.2mm V1437
‘i
Image 64 Speed map for Ni from parameter set 2 :0.78mm 2205 - 1.2mm V1437 butt joint
352
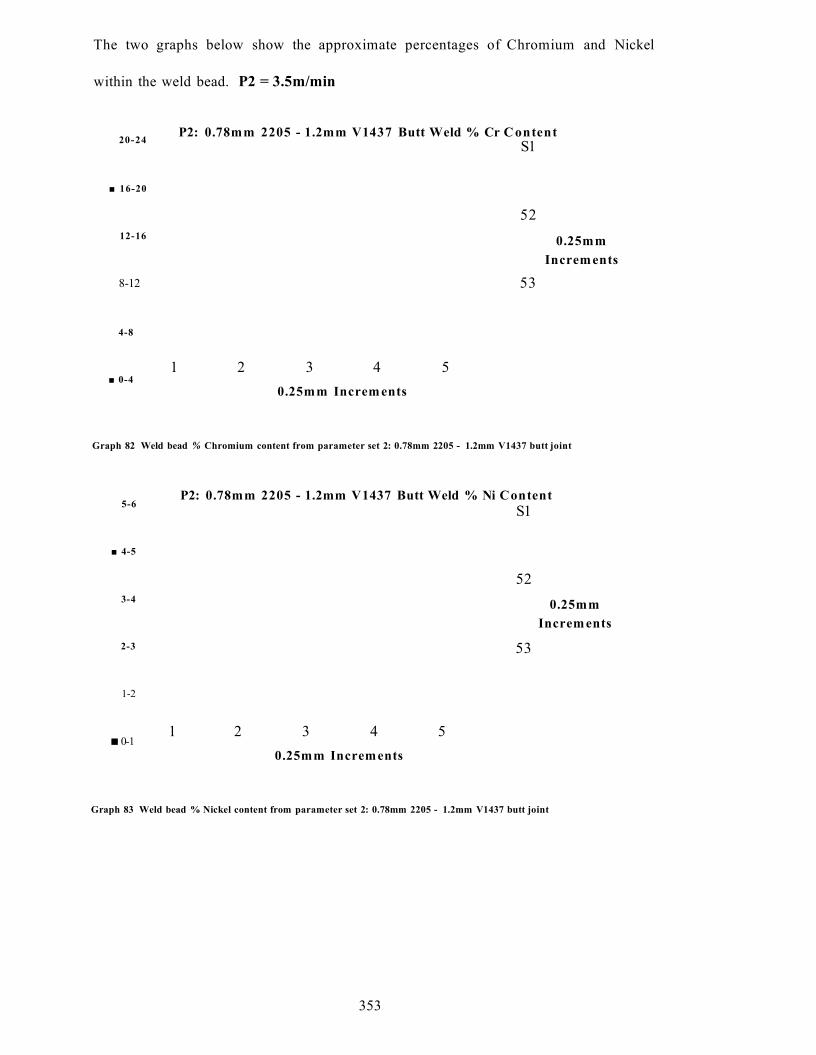
The two graphs below show the approximate percentages of Chromium and Nickel
within the weld bead. P2 = 3.5m/min
20-24
■ 16-20
12-16
8-12
4-8
■ 0-4
P2: 0.78mm 2205 - 1.2mm V1437 Butt Weld % Cr C ontentS1
52
0.25mmIncrem ents
53
1 2 3 4 50.25mm Increm ents
Graph 82 Weld bead % Chromium content from parameter set 2: 0.78mm 2205 - 1.2mm V1437 butt joint
5-6
■ 4-5
3-4
2-3
1-2
■ 0-1
P2: 0.78mm 2205 - 1.2mm V1437 Butt Weld % Ni ContentS1
520.25mm
Increm ents
53
1 2 3 4 50.25mm Increments
Graph 83 Weld bead % Nickel content from parameter set 2: 0.78mm 2205 - 1.2mm V1437 butt joint
353

The data used to produce the weld bead composition graphs was then used to predict the
dilution and phases present in the laser weld bead. The range of compositions found in
the weld bead can be seen on the modified Schaeffler diagram below.
3 0
2 5 '
u i x -j AUSTEN ITE
O o
o # 2205AUSTEN1TE +
X X MARTENSITE< A U S T E N ! T E + F E R R I T E
MARTE N
V I4 3 7 # 'f e r r i t e
iOi | 5 2 0 25F E R R I T E S T A B I L I S I N G E Q U I V A L E N T
3 53 0e q u i v a l e n t
( % C r -i- % M o + l -5x° /oSi + 2xty>Nb + 3*<>/oTiJM o +
Figure 73 Shows the predicted weld bead composition for the 3.5m/min 1.2mm VI437 - 0.78nim 2205 butt weld
Hence, the predicted weld bead microstructure would be martensite.
354

Parameter set 3 (P3):0.78mm 2205 - 1.2mm V1437
The following speed maps were produced using a Philips XL40 SEM.
0.78mm 2205 1.2mm V1437
Image 65 Secondary electron image from parameter set 3 : 0.78mm 2205 - 1.2mm V1437 butt joint
0.78mm 2205 1.2mm V1437
Image 66 Speed map for Cr from parameter set 3 : 0.78mm 2205 - 1.2mm V1437 butt joint
0.78mm 2205 1.2mm V1437
Image 67 Speed map for Ni from parameter set 3: 0.78mm 2205 - 1.2mm V1437 butt joint
355

The two graphs below show the approximate percentages of Chromium and Nickel
within the weld bead. P3 = 3.0m/min
20- 24
■ 16-20
12-16
8-12
4-8
■ 0-4
P3: 0.78m m 2205 -1 .2m m V1437 Butt Weld % Cr C ontentS1
S 3 0.25m m Increm ents
S51 2 3 4 5 6 7 8
0.25m m Increm ents
Graph 84 Weld bead % Chromium content from parameter set 3: 0.78mm 2205 - 1.2mm V1437 butt joint
P3: 0.78m m 2205 - 1.2mm V1437 Butt Weld % Ni C ontentS1
S 3 0.25m m Increm ents
S51 2 3 4 5 6 7 8
0.25mm Increm ents
Graph 85 Weld bead % Nickel content from parameter set 3: 0.78mm 2205 - 1.2mm V1437 butt joint
356

The data used to produce the weld bead composition graphs was then used to predict the
dilution and phases present in the laser weld bead. The range of compositions found in
the weld bead can be seen on the modified Schaeffler diagram below.
3 0
2 5 '
-J fM <£ — AUSTEN ITE20
O o Z x
# 2 2 0 5
X USTEN1 TE + F E R R I T E
M A RT E N St
/MARTENSITE ■j- FERRITE
f e r r i t e
i O 15 2 0 2 5FERRITE STA BI LI SI NG EQUIVALENT
(° /oCr + o/oMo + | . 5 x % S i + 2 * % ^ + 3x°/oTi]
3 53 0
Figure 74 Shows the predicted weld bead composition for the 3m/min 1.2mm VI437 - 0.78mm 2205 butt weld
Hence, the predicted weld bead microstructure would be predominantly martensitic with
a small quantity of austenite and ferrite.
357
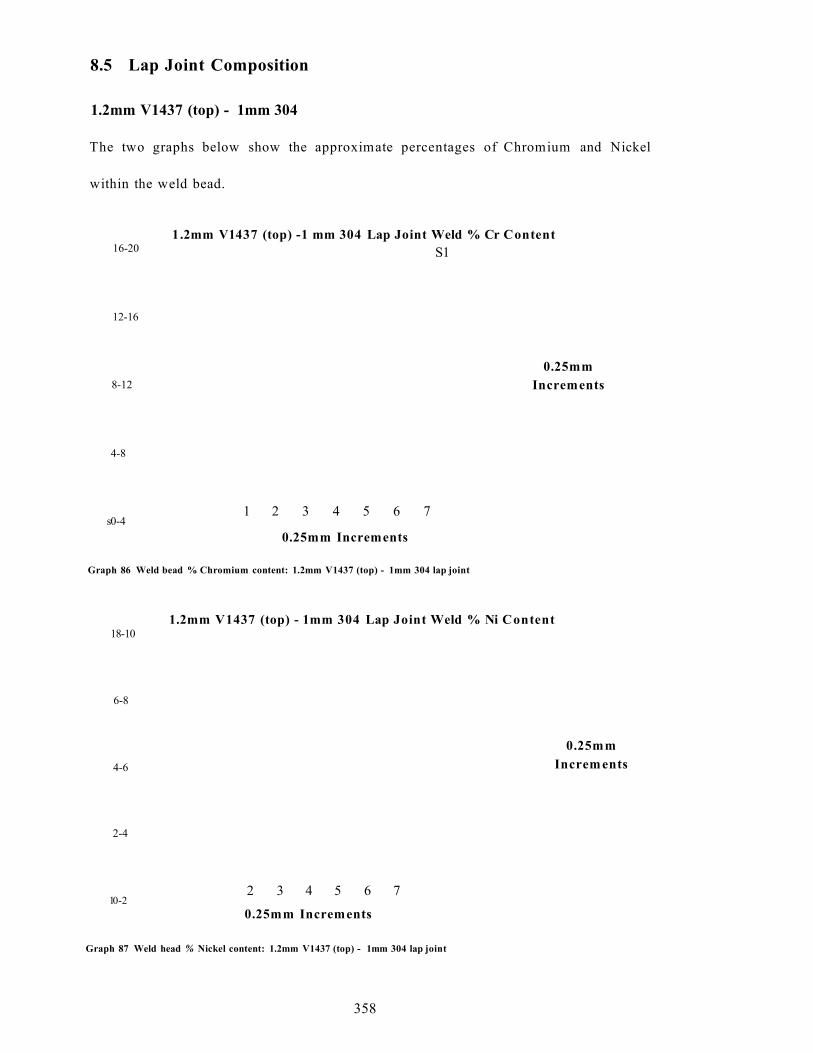
8.5 Lap Joint Composition
1.2mm V1437 (top) - 1mm 304
The two graphs below show the approximate percentages of Chrom ium and Nickel
within the weld bead.
16-20
12-16
8-12
4-8
s 0-4
1.2mm V1437 (top) -1 mm 304 Lap Joint Weld % Cr ContentS1
1 2 3 4 5 6 7
0.25mm Increments
0.25mmIncrements
Graph 86 Weld bead % Chromium content: 1.2mm V1437 (top) - 1mm 304 lap joint
18-10
6-8
4-6
2-4
10-2
1.2mm V1437 (top) - 1mm 304 Lap Joint Weld % Ni Content
2 3 4 5 6 7
0.25mm Increments
0.25mmIncrem ents
Graph 87 Weld head % Nickel content: 1.2mm V1437 (top) - 1mm 304 lap joint
358

The data used to produce the weld bead composition graphs was then used to predict the
dilution and phases present in the laser weld bead. The range of compositions found in
the weld bead can be seen on the modified Schaeffler diagram below.
3 0
25
- i r a < — A U ST EN ITE
20
O o2 5 rz in
o\o
AUSTENITE + X . / X
X . MARTENS I T E X ^a USTENI TE + FERRI TE
MAR TE N Sljr*
M A R TE N S I T E + F E R R I T E
V143f e r r i t e
1 15 2 0 2 5FERRITE S T ABI LI S IN G EQUIVALENT
IO 3 0
<°/oCr + % M o + I • 5 x % S i + 2 x % N b f 3*<>/oTi]
Figure 75 Shows the predicted weld bead composition for the 1.2mm VI437 - 1mm 304 (top) lap joint
Hence, the predicted weld bead m icrostructure would be martensite.
359

0.78mm 2205 (top) - 1.2mm V1437
The two graphs below show the approximate percentages of Chromium and Nickel
within the weld bead.
0.78mm 2205 (top) - 1.2mm V1437 Lap Joint Weld % Cr C ontent
0.25mmIncrem ents
0.25mm Increm ents
Graph 88 Weld bead % Chromium content: 0.78mm 2205 (top) - 1.2mm V1437 lap joint
0.78mm 2205 (top) - 1 .2mm V1437 Lap Joint Weld % Ni C ontent
0.25mmIncrem ents
0.25mm Increments
Graph 89 Weld bead % Nickel content: 0.78mm 2205 (to p )- 1.2mm VI437 lap joint
360

The data used to produce the weld bead composition graphs was then used to predict the
dilution and phases present in the laser weld bead. The range of compositions found in
the weld bead can be seen on the modified Schaeffler diagram below.
3 0
2 5 ”
A U ST EN I TE20
O Q £ *
# 2205AUSTENITE + X
V M ARTENSITEA U S T E N I T E + F ERRI TE
M A R T E N S
M A R T E N S I T E + F E R R I T E
f e r r i t e
i oF E R R i "
i % C r -i- ° / o M o + l -5x%»S i + 2 x % N b + 3*<&Ti]
15 20 2SFERRITE STABILISING EQUIVALENT
353 0T Eo}
Figure 76 Shows the predicted weld bead composition for the 1.2mm V1437 (top) - 0.78mm 2205 lap joint
Hence, the predicted weld bead m icrostructure would be martensitic with a small
quantity of austenite present.
361

1.2mm V1437 (top) - 0.78mm 2205
The two graphs below show the approximate percentages of Chromium and Nickel
within the weld bead.
m 20-24
16-20
12-16
8-12
4-8
I 0-4
1.2mm V1437 (top) - 0.78mm 2205 Lap Joint Weld % Cr Content-S1
1 2 3 4 5 6 7
0.25mm Increments
0.25mmIncrements
Graph 90 Weld bead % Chromium content: 1.2mm V1437 (top) - 0.78mm 2205 lap joint
1.2mm V1437 (top) - 0.78mm 2205 Lap Joint Weld % Ni Content51
52
53
3 4 0.25mmIncrements
55
56
57
581 2 3 4 5 6 7
0.25mm Increments
4-5
3-4
2-3
1-2
Graph 91 Weld bead % Nickel content: 1.2mm V1437 (top) - 1.2mm V1437 lap joint

; L u jc f rr ciucu i
The data used to produce the weld bead composition graphs was then used to predict the
dilution and phases present in the laser weld bead. The range of compositions found in
the weld bead can be seen on the modified Schaeffler diagram below.
AU 5TENITE
AUSTENITE +
MARTENSITEA u s t e n i t e + f e r r i t e
M A R T E N S I T E + F E R R I T E
~ d <5
MAR TE N
V1437 « rf e r r i t e
IO 15 2 0 25F E R R I T E S T A B I L I S I N G E Q U I V A L E N T
(°/oCr + o /oMo + 1-5 x%>Si + 2 x % N b + 3*°/oTi]
Figure 77 Shows the predicted weld bead composition for the 0.78mm 2205 (top) - 1.2mm V1437 lap joint
Hence, the predicted weld bead m icrostructure would be predom inantly martensitic with
a large portion of austenite present.
363