Embed Size (px)
Citation preview

C.P. No. 521 C.P. No. 521 (20,84 I )
A.R.C. Technical Report Rf-JV& I ., L c :‘, i-u _ t t ._ %.
f$-$DFC~~; z. .I -,:‘f (20,841)
A.R.C. Technical Report
MINISTRY OF AVlATlOti
AERONAUTICAL RESEARCH COUNCIL
CURRENT PAPERS
Fatigue Loadings in Flight-Loads in the Nose Undercarriage and
Wing of a Valiant-
6Y
E. W, Wells
LONDON: HER MAJESTY’S STATIONERY OFFICE
1960
PRICE 4s. 6d. NET


C.P. TTo. 521 U.D.C. No. 539.431 : 533.6.048.5 :
629.13.ClI+~J : 629.13.015.14.6 (Valiant)
Technical Note Do. Str-dctures 242
June, 1958
Data obtair:d mt the number of loa. c;rcles of various magnitudes occurriq in the Wing ;-ml the nose undercmiage of a Valisxt in normal ground and fLi.ght conditionc we pTesdnted. The conditions include taxjjing, take-off, 1andi.q md flight in -52rbulcnce. An estdate is made of the loads ix a typical operational fliC;ht to illustrate the relative importance of the vwious conditions.
k velationship is 2iLso established between the wing load and the acceli:r~tirli; a-: *he aircraft c.g. when flying in tulvbulence. This enables thE msultt fo~q the i'Si&t tests to be linked to operational data obtained 0" cgust s .


4.1 wing lo ad. s k.2 Uose undercarriage loasls
5 CoXIusIoNS
LIST 03' X?Z,X3mCES 6
I - Details sf instruzntation, calibration, flight tests and miscellarleous results
2 - Estimakion of load occurrences in a typical flight
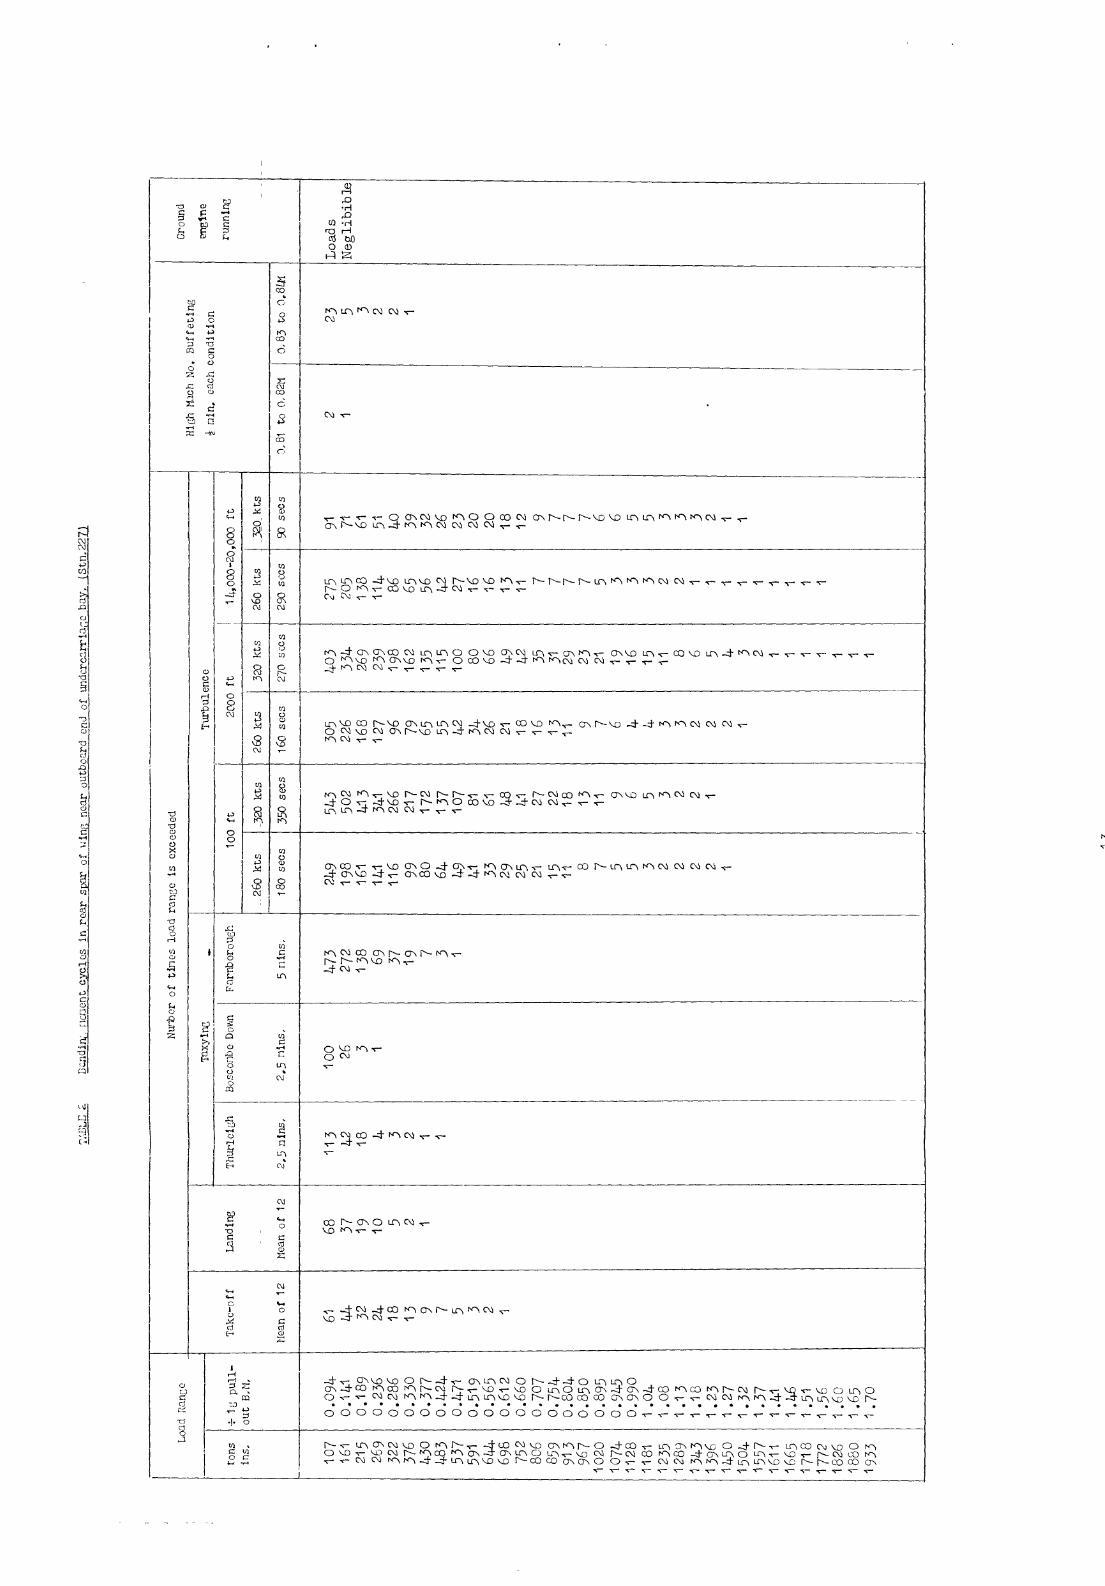
I - Bending mment cycles in rear spar of sting in centre section iStn.-36)
3
General or'rmgcncnt 0f Valiant Sketches siiodrg strain gauge positions on rzar s>ar of wing
IjlSng loads iu; component corditions of a typical P'ti&t
Nose l.indwXzrriage lc,~ds ir- compolzent coiditions of 8 typical flight
~elztionshiyj between l.od rmdes in thti rdar spar of' the wing at stn .-;G and c.g. acceleration rmgcs exceeded the same number of times irL turbulence
Relationship between load rrangcs in the rear spar of the wing at Stn. 227 pad the c.g. acceleration ranges exceeded the same nudger of times in twdndence
Page
4
4
4
5
5 5
6
7
9
12
13
14
15
Fi.&$
1
2
3
4
-2-
Fig
Relationship between wing load ranges cand c.g. acceleration ranges exceeded the same number of times in various conditions
Frequency of occurrence of gusts exceeding IO fi/sec ?XAS at different heights
Nmber of gusts exceeding different magnitudes per thousand exceeding IO ft/sec Z&3
Typical, record of loads in turbuleme
7
8
9
IO
-3-

1 IM~RODUCTION
Plight tests l:mre made in a Valiant FW to obtain information on the fatigue loads in various parts of the structure. The loads in the tail unit have already been given'; this note deals vfith the vertioal loads in the nose undercarriage and the bending moments at two stations in the rear spar of the wing. Fluctuating loads were measured during normal ground and flight conditions, including tax&.ng, take-off, landing and flight in turbulence, but no steady loads were measured.
~5.11 acco?lnt of the instrumentation, flight and strain gauge calibration tests is given in Appendix I. 'Toe measurements were obtained by means of electrical resistance strain gauge3 and continuous recording equipment.
Strain gauge3 were applied to the rear spar of the starboard wing at -tWO st,ati~ons. The first was at Station-36 which was in the wing centre section approximately nidw~~ betwecsn the aircraft centre line and the h3clage s-id e. The second Ta3 at Station 227 which was near the outer end 07" the main unde~arriage b3y. The loads in the nose undercarriage were measureLl by strain gauges applied to the trunnion. Details of the wing strain gsuge positions are shown in Pig.2
Bccsleration was measured by me,ans of a Type Structures 4 accelerometer mounted rigidly in the bomb bay at the ailurati centre line and near the c.g. Throughout this note the reading of this accelerometer is for convenience referred to as "c.g. acoeleration7' and it is pointed out tnat it includes some dynamic effects due to flexibilitieo of the structure.
Records showing; the variation in load were taken during all normal grouti anl i'light conditions. The aircraft was flown by a nuxriber of pilots and lending, c were made at three different aerodromes. Records of flight in turbulence were taken at airspeeds of 260 kts and 320 kts EAS and at heights varying from 100 M above ground to 20,000 ft above mean sea level.
InfoM,iation on the 103.d3 measured is tabulated in terms of load ranges exceeding vacious sizes and is given in Tables 1 - 3. The method of analysing the measured loads in terms of nuIab or3 of load ;enges exceeding vsxious sizes i.3 sunilar to that described in an earlier noteL but it has been modified to enable i-lie bul Jc of the somputation to be carried out by Deuce e
The information is sumnarized by showing the number of load ranges exceedby varicJus sizes for the (Piqs.3 and 4).
component conditions of a typical flight This flight, Tinich i 3 intended to represent an operational
cmss country Iflight carried out at an R.A.F. station, consists of 12 minutes engine ru:qC.ng on the gro&, 21 minutes i-axying, a t&e-off, a 4 hours cross Country flight and a landing. Details of tho method of obtaining the loads for the various conditions of this typical flight are given in Appendix 2. It should be noted that the load ranges shown for take-off and landing in the above figures and in Tables I - 3 do not include the load cycle associ- ated with the tralsiticn from ground to air that occurs once per flight.
Pigs.5 and 6 show the relationship between the wing load and c.g. acceleration ranges exceeded the saae number of times in turbulence at Stations-J% arid 227 respectively. The curves are based on six records of fli$t in turbulence in which the aircraft was flown at various speeds, heights and weights. In each case the results have been reduced so that they correspond with those obtained at an all-up weight of 100,000 lb end
-4-

a speed of 260 knots EAS. Fig.7 shows the relationship between wing load and c.g. acceleration ranges exceeded the same number of times for the com- ponent conditions of a typical flight. The curve showing the relationship for flight in turbulence is again for a weight of 100,000 lb, and speed of 260 knots. All wing bending moments are plotted in terms of the bending moment measured in a lg pull-out carried out at the same conditions, i.e., 100,000 lb XJW. 260 knots EAS.
4 DISCUSSION OF RESULTS --s -.--.eT*---.l---.
4.1 Wiftg_hdS Wm.-
Mean values of bending moment were not measured. It should be remembered, however, that fluctuations of bending moment are associated with a mean value of bending moment. It should be pointed out, for instance, that there is a marked difference between the mean bending moment in level flight and in taxying; the former puts the bottom surface of the wing in tension and the latter puts it in compression. During take-off and landing the mean load in the bottom surface varies from tension, when the aerodynamic wing lift is developed, to compression, when there is no aerodynamic lift.
Fig.3(a) shows that for Stn-36, which is near the root of the rear spar, flight in turbulence produces the largest number of load fluctuations in a typical flight. The loads from all the other conditions are much less severe 2nd they only affect the total at the lower load levels. For Stn.227, which is near the outboard end of the undercarriage bay, Fig.j(b) shows that the highest changes of bending moment are produced mainly by turbulence and that the smaller and more frequent changes are caused predominantly by taxying,
Comparison of Figs.j(a) and 3(b) show that the ground conditions of taxying, take-off and landing are responsible for a much higher proportion of the load fluctuations at Stn.227 than they are at Stn-36. The loads occurring in these ground conditions are associated with three modes of displacement, two of which produce loads that appear only at the outer wing stations and a third which produces loads at both wing stations. The first mode has a frequency of approximately 1.25 c.p.s. and is produced by the aircraft moving as a rigid body on its undercarriage; variations of bending moment occur with this frequency only at Stn.227 and are due to the weight of the wing outboard of that station; at Stn-36 the bending moment from the weight of the wing is balanced by that from the reaction of the weight of the aircraft on its undercarriage and so does not appear. These effects occur at Stn.227 mainly during landing and taxying. A second mode having a frequency of approximately 5 c.p.s. appears to be the wing anti-symmetric mode. This produces loads at the outer station but, as might be expected, has a much smaller effect on the wing centre section. This frequency is present in all ground conditions and is especially noticeable during taxying and accounts for the taxying loads being such a high proportion of the total. A third mode with a frequency of approximately 2,25 c.p.s. is the wing fundamental flexural mode; its effects appear at both stations during all the ground conditions,
4.2 Nose undercarri-loads m-m*.
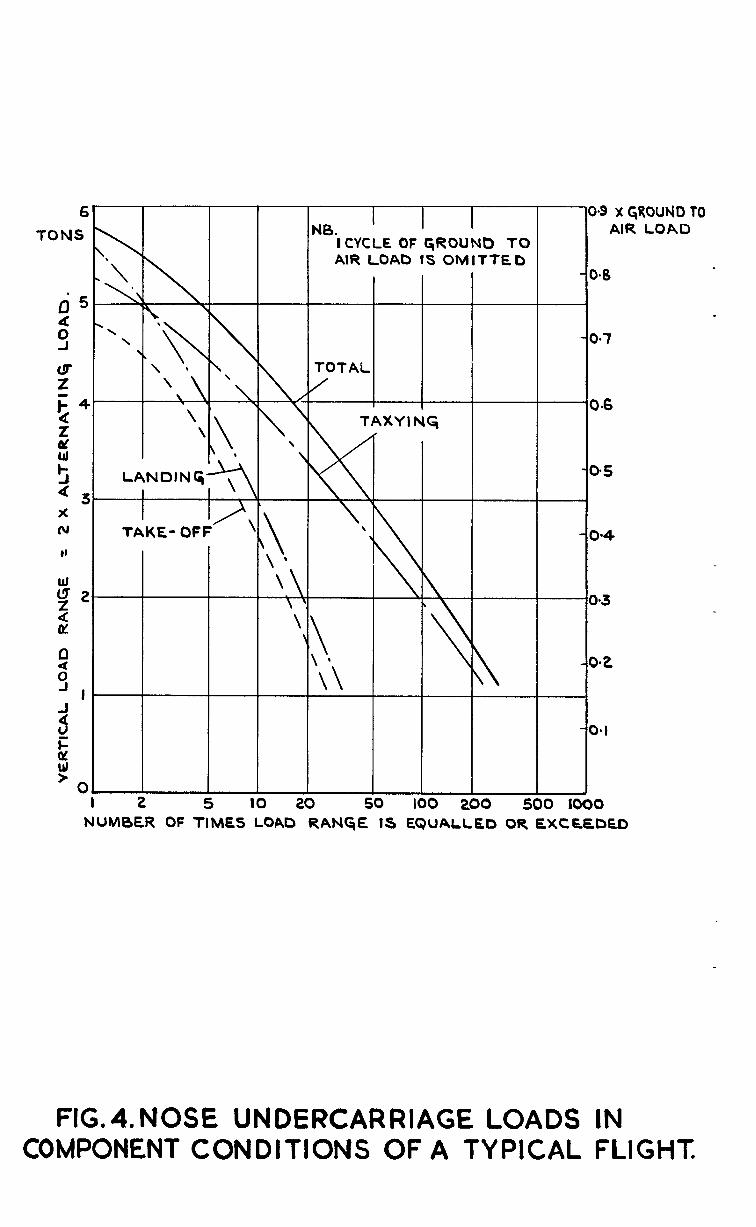
Fig.4 shows that for the nose undercarriage the largest number of load fluctuations during the typical flight occur during taxying. At the lower load levels this condition accounts for approximately 75% of the total. The loads occurring during landing are next in order of severity and exceed the loads occurring during taxying at the higher load levels. The loads occurr- ing during take-off are comparable but slightly less than those occurring during landing,
-5-

IIlf~Xl~tZ~C?il i,aS been obtained on the nur&ur of load fluctuations of various 0gnitlGes ow:~~.r~‘ing in the nose undercarriage and wing of a Valiant engaged in 02e.r ati onal fJ-ying &ties.
nose- Measurements were confined to vertical
loads in the ~xderl:~arria,~e and bending, moments at two stations in the wing ; L i-1 2.y TJf2 re made in special tests covering all normal ground and flight conditions.
The rcsul-ts ::I-tow that ibr the nose undercarriage the largest number of load ~L41~~ckm,tio~-a occur during taqing md they are exceeded only at the higher load lev-21s by those that occus during landing, In the case of the xing , measurements made on Cllc re,is spar only, show that at Stn.-36, which is in the wing centre sec$lsn, the largest number of load fluctuations in a typical fli&t occ'~r duxi.ng rlight in turbulence. The load Piuctuations due to take-off, Lmdir,g and tq-in? are ;Ialch less severe and those that occur during engine running on the ground are negligible. At Stn.227, which is near t!:z outboard end 0 bendinil; mment
P t;he main undercarriage bay, the highest changes cf ‘are produced mainly by flight in turbulence and the smaller
and more: frequent cliaqe3 ,are caused predominantly by taxying. The load flue tuat ions those t-hat
-t'x.t cccur iluring t&e-off and landing are less severe than ocm.w dl;ying i'li$lt in turbulence and those that occur during
engine 3mning on the ground are negligible.
No -- .Author(s)
I Bur:1s 9 A.
Title, etc
Fatigue loadings in flight - loads in the t?ailplane and fir, of a Valiant. Al-33 1:,l+s7. Februw, 1957. *
ElatQuc loadings in flight - loads in the tiailplane and fin of a Varsity. ARC Current Paper No. 256. January, 1956.


Ar::ldite SiJecCa.1 Strain ~o.uge Cement at two stations on the rear spar of the starboard Ytin~~ 9s shotrin in Yig, 1 a.nd on the trunnion of the nose under- carriage. 'he gasp33 at the two wing stations xere arranged to measure bending monient, their positions are shown in more detail in Fig.2. The gauges on th c ruse undercnrrjage were attached to e,ach side of the trunnion at the stLart of the cone. A pair of gauges were attached top and bottom on each side ;cd the four gauges arranged as a bridge to measure the average bending moment of the tv~o sides. The signals from the strain gauges were f&l ill?;0 a CWichael. carrier wave aniplifier and were recorded on a Films and ~quipmerdi I 2 cimiine7 recorder. A Type Structures 4 accelerometer adapted to give a stepped c~cel.eration trace was mounted on the roof of the bomb bay r,e:lr *he sircraft c ,g- and its signal was also fed into the Films Land Zquipmerit rcuo rder.
'rho sfir:lj.il ~:mg?s on the King were calibrated on the ground in terms of’ bonding moment by loading th3 ping with shot bags. The gauges were also calibrated in the air by subjecting the aircraft to pull-outs. These pull- outs were c,arried out with the airspeed remaining sensibly constant, the value of the acceleration in the pull-out being given by the accelerometer at the aircraft c.g. The all-up meight at whch the pull-outs were carried out varied between 99,000 and 103,COO lb, the average being approxjmately 100,000 lb.
'The gauges on the nose underc;xrria.ge trunnion xere calibrated directly in terms of vertical load by ,j:xkijr,g the nose wheel clear of the ground and then loweririg it on to a weighing platfoxxl, the resulting change in load and trace deflection being measured. k calibration in terms of the ground to air load -V,YG also obteincd by me+ qpuring the trace deflection produced by the change of' vc;rticas. l 10,ad In the undercarriage from the aircraft standing on the i'llriGa;ir Mth the engines idling $xt before take-off to the point where the nose unclerc~arriage was ,;ust clear of the ground, The average value for 10 take-off:; i-:as obtained.
J’LISjIT ‘LTSTS _--
The aircraft xas flown throughcut the tests at an all-up weight varying l bztwecn e7,5CN and 1"3,500 lb, The weights at vvihich the measurements of
flight in turbulence were made varied between 96,000 and 108,500 lb, All the landings vcere made at less than 100,000 lb, the maximum permissible landing weight. The c.g. was kept within 47.33 + 0.25 ft aft of the nose datum point (limits 46.93 to 47.75 ft axft of datum). The aircraft was flown at al?, times by the pilot and not by the auto-pilot.
Norm& take-offs and landings were recorded during the course of the tesJ< .zJ and they wzre carried o;lt by a number of pilots and at three different aerodrome s. Take-offs were carried out using two different techniwes: the f2.r 31; -iTas to hold the aircraft against the brakes until the engine speed had built up to 6OCO r,p.m. the brakes were then released and the aircraft allowed to roll forward; the seco& was to allox the airzraftto run freely forward as the ergines were opened up. In each case, for the purpose of

analysis, the take-off was considered to start Tvhen the engine run up commenced and to end *{{hen the aircraft was clear of the ru&vay and had reached a speed of 150 knots EkS. <This -firas the speed at which the under- carriage was normall~y retracted, an event which could be detected easily on the records, This eras also the speed at v;hich the stepped accelerometer began to operate so that any loads <occurring after this point could be conveniently classed as flight loads. R landing was defined as starting 5 seconds befor% the initial impact and lasting for a total of 40 seconds.
The taxying loads wore measured at three aerodromes: Boscombe Down, Thurleigh .zuld Farnborough. The loads were most severe at Farnborough where a considerable amount of turning and frequent application of the brakes were involved. The Soscombe Dorm and Thurleigh records -,vere taken while the aircraft Tiras taying doT:m long straight perinetor tracks and although this taxying was carriefi out at higher forward speeds it produced only very light loads.
iiecords of flight in turbulence were obtained when flying straight and level at airspeeds of 260 knots and 320 knots Z&S. 16easurements were taken at the two airspeeds in three flight bands: 59-100 ft above ground, 2OOO-TOGO 3 md l&.,000-20,000 oft above me,an sea level. The third and highest height bated was intended to cover ttirbulance above 25,000 f-l; but unfortunately, during the period of the flight tests, no turbulence was found above 20,000 ft. Xost of the turbulence in the two upper height bands 7;yas found by flying in or just below small to medtilm cumulus clouds. Turbulence encountered in the lov:est height band was the results of several effects which included convective air currents and light to medium winds.
As mentioned in the previous section two different techniques were used for take-offs. The first was to allow the aircraft to run freely forward as the engine r.p.m. increased and the second was to hold the air- craft stationary, by means of the brakes until the engine speed built up to 6000 r.p.m. If the change of vertical load on the nose undercarriage from the aircraft stationary on the ground vtith its engines idling to the point in the take-off where the wheels are just clt?ar of the ground is taken C.LS the no.rmal change of load in a take-off, then use of the former technique produces thjs normr;il chti?ge of load. Running up the engines against the brakes, as in the latter case, resulted in a considerable increase in dovm- load on the nose undercarriage, the load returning to its normal value When the brakes were released. Analysis of eight take-offs in which the second technique y<as used sh,;wcd that this increase in download resulted in a total change of vertical load approximate ly 7C@ greater than the normal change of load, the maxrimun value being approximately K$ greater.
-8-

TAm - K w AT 0-J LmD I D G m-e-----
The numbers of occurrences of wing and nose undercarriage loads in landing and take-off are the average valzes obtained from the analysis of twelve landing and take-off rec,o~+?s.
The 95% confidence inte,rvalszF for the number of occurrences of load cycles a-t Stn.227 correspondk1.g approximatel;y to a 5 ft/sec gust range at 250 k.rlots, i%; 120 000 lb 1~ U.W 9 . *, are as follows:-
:!he Ioad s oocurring at S-i,n. -36 iiuriri~ take-off and landing are consiasrably smaller and confidence limits are not given.
The amount of taxying and the average engine running times mere obtai.nca from thy: renYLts of intensive flight trials carried out on Valiants at an E.A.F. station, The dititacc taxied during each flight was about 3$ miles at speeds of IO to 15 m,p*h, giving a total taxying time of 21 minutes wr flight. Taxying loads f'or the typical flight were therefore based on a total time of 23 minlltes made up as follows: 16 minutes at the rate of lo:lciing aqpropriate to Farnborough, rate and 25 minutes at the: '?hurleigh rate.
2$ minutes at the Boscombc Dam
Using the average cngini: running times in the il..h.8. L;rialn :in conjunction with the engiw running conrticted with aircraft servicing based on R.A.E. practice, a progrwlms oi7 engine ground running tests was built up. This progwmme entailed running the engines in a number of conditions including running all engines at 6000 r.p.m. and running each engine separately up to 7350 r.p.m. but in all cases the loads imposed on the tings and nose underc‘arriage were very small and were less than the smallest load range used in the analysis.
r‘or the estimation of wing load s in turbulence the typical flight was t<aken as a cross country flight of & hours duration. Details of this Sli:J--rt vzre '~:lsed on ini'ormation receiwd i^rOZl t?Yl3?~ R, A Y. dAtims. "he take-off woi:$t; yas 126,Or?C~ 13.. Ce$ails bf the flight plan are given in the following table together with the number of gu"ts of IO ft/sec or greater encountered during each stage of the flight.
* Inte:Tals v&thin &ich there is a 9575 probability that the true mean lies.
- g “ .

These numbers were calculated using the curve shown in Fig.8 which shows the miles to meet a gust of IO ft/sec or greater end is based on operational data obtained on a number of aircraft. The ocLr;lrrences of gusts of other magnitudes were obtained from Fig.9, which shows the relative occurrence of gusts of different magnitudes.
I Mean No. of up or Condition Sleight (ft) ' Time airspeed
(kts.IAs) / ",OE $:c I
Take-off 0 to 1,000 1.75 mins 160 ' 1.9 ' Climb 1,000 to 2,000 I 250 0.32
2,000 to 5,000 303 0.8 5,000 to 20,000 ( 16.5 mins 290 0.95 20,000 to &o,ooo i 250 1 0.13
Climb cruise W,OCO to 45,000& 3 hrs 203 2.1 20.35 mins
Descent 45,000 to 2,000 14.4 tins 24L) 1.95
Approach 2,000 to 200 ! 7mirls 160 6.6
200 to 3 f 125 0.3 Total 4hs
I I 15 gusts
From the number of gusts of IO ft/sec or greater, shown in the table above, and. from Fig.9 the number of gust ranges of ?O, 20 and 30 ft/sec were calculated for each section of the flight. A factor of 0.75 was used to allow for the difference in number of ranges obtained from a direct count and from the geometric means of counts of equal up and dov;n accelerations.
As shown in Table 'I) six records of flight in turbulence were analysed; they were for two speeds in three height bands with all-uy weights varying between 96,500 lb end 108,500 lb. A graph was drawn for each vling station showing for each of the six records the variation in wing bending moment ranges with e.g. acceleration ranges occurring an equal number of times. There was a certain amount of variation between results from the six records and an attempt was made to eliminate the effect of the different all up weights and speeds at which the records were taken. Differences in all up weight were due to the consumption of fuel in wing al-63 fuselage tanks and hence affected the wing bending moments per g, and the differences in speed affected the proportion of lift taken by the tail and hence again the wing bending moments per g. The differences in height appeared to have little effect on the results. Using data obtained from the firm on the tail loads, lift, Viking weight and fuel distributions, the wing bending moment at stations -36 and 227 were calculated for en increment&L acceleration of lg at the conditions appropriate to each of the six records and also at a standard condition of 100,000 lb and 260 knots, the average condition at whkh pull-outs were carried out in flight. The original curves for the six
records were then multiplied by the factor 1 D EM at standard condition snd IglMat record condition
the curves were replotted and were found to be in good agreement. A line was dra~vn through all the points and represents the relationship between -ting bending moment ranges and c.g. acceleration ranges for an all up weight of 100,000 lb and an airspeed of 260 knots BAS. The basic curve for each wing station is shown in Figs .5 and 6.
- IO -

IJsiq data on airspeed, height, all up weight and fuel state obtained for compiling ,the typical flight conditions, the basic curves shown in Pigs.5 and 6 were modified and new curves obtained representing conditions corresponding to three stages of the typical flight:- take-off and climb, climb-cruise, descent and approach. These curves gave an approximate relationship between xi.,ng bending moment and vertical acceleration for the three stage s of the typical flight. The value of vertical acceleration for gust ranges 0 f IO, 20 and 39 I%/ set for each individual section of the typical flight -xas then calculated and the corresponding wing bending moment read off from the curve appropriate to the flight stage. Once this relation- ship between gust velocity and wing bending moment was established a plot could be mx.Ie, for oath section of the flight, of the number of occurrences of wing bending moment rsnges. From these plots it was possible to tot&I. the number of occurrences at discrete values of the range and to draw the turbulenoe curve for the typical flight shown in Fig.3.
-11 -


-
T
I

----- --- - ---.
------ --. -I :I i 4 1. I
r-F-r--+;focs . . . . . . . 223ch- NrCICDlr\-t~MrT-T-

APPROXIMATE POSITION STRAIN GAUGE STATIONS REAR SPAR.
/ ! i+ STN. 227.
i a-.-.
\\ i
OF ON
FIG.1. GENERAL ARRANGEMENT OF VALIANT.

FWO.
STATION-36
FIND. e
STATION 227.
FIC.2.SKETCHES SHOWING STRAIN GAUGE POSITIONS ON REAR SPAR OF WING.
( NOTE :- THESE DIAGRAMS ARE NOT TO SCALE)

Y I3 PULL-OUT BM.
TAKE-OFF
10 1 2
LOAD NUMBER OF
0 a STATION-36. REAR SPAR OF WING IN CENTRE SECTION
.
-.. \ \
‘.
LANDI&- ‘.
b I I I IO IO2 IO’
RANGE IS EQUALLED OR EXCEEDED.
(b) STATION 227. REAR SPAR OF WlNG NEAR OUTBOARD END OF U/C BAY.
FIG.3@eb).WlNG LOADS IN COMPONENT CONDITIONS OF A TYPICAL FLIGHT.
: qtoulm TO IR LOAD
-0.9 x qtoulm TO -0.9 x AIR LOAD
ICYCLE OF G,ROUNb TQ ICYCLE OF G,ROUNb TQ AIR LOAD tS OMITTED AIR LOAD tS OMITTED
- 0*4 - 0*4
NUMBER OF TIMES LOAD RANGE. tS EQUALLED OR EXCEEDED
FIG.4.NOSE UNDERCARRIAGE LOADS IN COMPONENT CONDITIONS OF A TYPICAL FLIGHT.

X BM.IN ly PULL OUT
NOTE :- ’ -----I
RESULTS FROM SIX RECORDS OF FLIGHT IU
1 TURBULENCE REDUCED TO A COMMON CONDITION OF IOQOOO CBS. A.U.W. AND 260 KTS. EeS. I o/
i-
’ 0 lAS(KTS) HEICHTFT) x 260 100 o 320 3 V 260 2000 + 320 ) 0 260 Q 320
14000 -2QOOO
FIGS. RELATIONSHIP BETWEEN LOAD RANGES IN THE REAR SPAR OF THE WING AT STN-36 AND CG. ACCELERATION RANGES EXCEEDED THE SAME NUMBER Of TIMES IN TURBULENCE

XWvl.IN I9 PULL-OUT I I I
I NOTE - RESULTS FROM SIX RECORDS OF FLIGHT IN TURBULENCE
REDUCE0 TO A COMMON CONDITION OF 100,000 LB9 .AUW. AN0 260 KTS. EAS. I I
0 0.4 096 O-8 CG. ACCELERATION RANG&
.
FIG6eRELATIONSHIP BETWEEN LOAD RANGES IN THE REAR SPAR OF THE WING AT STN.227 AND CG. ACCELERATION RANGES EXCEEDED THE SAME NUMBER OF TIMES IN TURBULENCE.

0.8rBMIN If3 YLLOUT --T--
C.c;. ACCELERATION QANGE
STATION- 36.
-OFF
0 0*2 o-4 O&j Cc,. ACCELERATION RANGE
STATION 227.
FIG.7 RELATIONSHIP BETWEEN WING LOAD RANGES AND CG. ACCELERATION RANGES EXCEEDED THE SAME NUMBER OF TIMES
IN VARIOUS CONDITIONS.

IOOC
MILES PER GUST
GREATER THAN 50( IO FT’SEC. E.A.S
zoc
IOC
50
20
10
5
2
I
/ /
/
4QOO0 ALTITUDE iT.
FtG.8. FREQUENCY OF OCCURRENCE OF GUSTS EXCEEDING lOFT/SEC. E.A.S.AT DIFFERENT HEIGHTS.
‘ .

500 No. OF qusts
200
100
50
20
IO
5
FT/SEC. EAS.
FIG .9. NUMBER OF GUSTS EXCEEDING 01 FFERENT MAGNITUDES. PER THOUSAND
EXCEEDING IO FT/SEC. E.AS.


C.P. NO. 521 539.431 : 533.6.048.5: 629.13.014.3:
FATIGUE IQADINGS IIJ FLIGHT - MADS IN THE NOSE UNDERCARRIAGE AND WIIJG OF A VALIRh’T Wells, E. W. June, 1958.
62~.Ij.O15.14.6 (Valiant)
Data obtained on the number of load cycles of various magnitudes Data obtained on the number of load cycles of various magnitudes occurring in the wing and the nose undercarriage of a Valiant in normal occurring in the wing arxl thi: nose urldcrcarriagc of a valiant in ncrmal ground and flight conditions arc presented. The conditions include ground and flight conditions 3re proscnted. The conditions include taxying, take-off, landing and flight in turbulence. An estimate is taxying, take-off, landing and flight in turbulence. iin estimate IS made of the loads in a typical operational flight to illustrate the made of the loads in a typical operational flight to IlMstrate the relative importance of the various conditions. relative importance of the various conditions.
(Over)
539.431 : 533.6.0-18.5: S~g.13.014.3: 629.13.015.14.6 (Valiant)
FATIGUE LO-ADINGS IZi FLIGHT - LOADS IaJ THE NOSE UNDERCARRIAGE AND WI>lG OF 4%. VALIANT Wells, E.W. June, 1958.
(Over)
C.P. No. 521 539.431: 533As.ci48.5: 629.13.014.3:
FATIGUE LOADINGS IN FLIGHT - LOADS IN THE NOSE UNDERCARRIAGE AND WING OF A VALIANT Wells, E.W. June, 1958.
62q.lj.ol5.14.6 (Valiant)
Data obtained on the number of load cycles of various magnitudes occurring in the wing and the nose undorcarriege of a Valiant in normal ground ar.2 flight conditions are prescntcd. The conditions include taxg’:ng, take-off, landing and flight in turbulence. An estimate is made of the loads in a typical operational flight to illustrate the rciative importance of the various conditions.
(over)
C.P. No. 521 539.431: 533.6.Od8.5: 629.13.olQ.j: 629.13.015.14.6 (Valiant)
FATIGUE L,OADINGS IN FLIGHT - LOADS Ill THE NOSE UNDERCARRIAGE i.bn WIi!G OF .1 V,ILIC,VT Wells, E. W. June, 19%.
Data obtained on the number of load cycles of various magnitudes occurring in the wing and the nose und ,?rcarrlage of a Valiant in normal ground and flight conditions are presented. The conditions include taxying, take-off 9 ian.nJlng and flight in turbulence. An estlmatc IS made of the loads in a typical. operational flight to illustrate the relative importance of the various conditions.

A relationship is also established between the wing load and the acceleration at the aircraft c.g. when flying in turbulence. This enables the results for the flight tests to be linked to operational data obtained on gusts.
11 relationship IS also cstabllshcd between the wing load and the accclcration at the aircraft e.g. when flying in turbulence. This enables the results for the flight tests to bo U&cd to operational data obtained on gusts.
A relationship is also established between the wing load and the acceleration at the aircraft c.g. when flying in turbulence. This enables the results for the flight tests to be linked to operational data obtained on gusts.
A relationship is also established bctwcen the wing load and the acceleration at the aircraft c.g. when flying in turbulence. This enables the results for the flight tests to be linked to operational data obtained on gusts.

C.P. No. 521 (20,84 I )
A.R.C. Technical Report
@ Crown Copyright 1960
Published by HER M AJESTY’S- STATIONERY OFFICE
. To be purchased from York House, Kingsway, London w.c.2
4i3 Oxford Street, London w.l 13~ Castle Street, Edinburgh 2
109 St. Mary Street, Cardiff 39 King Street, Manchester 2 50 Fairfax Street, Bristol 1
2 Edmund street, Bir@ngham 3 80 Chichester Street, Belfast 1 _ or through any bookseller
Printed in Englad 4
S.O. Code No. 23-9012-2 I
C.P. No. 521


![[0521 석재호]백트래킹알고리즘](https://img.dokumen.tips/doc/110x75/5588f95ed8b42a04688b4658/0521-.jpg)
![[0521 박민근] [udk] material example](https://img.dokumen.tips/doc/110x75/55641367d8b42aa9518b5dcd/0521-udk-material-example.jpg)