Embed Size (px)
Citation preview

fatiguefatigue
L. VerganiL. Vergani

L. Vergani L. Vergani -- approccio Sapproccio S--NN
2
•From latin fatigare.
• Components of machines, vehicles and structures are frequently subjected to repeated loads (cyclic loads) and the resulting cyclic stresses can lead to microscopic damage. This damage can accumulate until it develops into a crack that leads the failure of the component, even at stresses well below the ultimate strength of materials. This process of accumulating damage is the FATIGUE.
•Mechanical failure due to:
55% high cycle fatigue (HCF)
10% low cycle fatigue (LCF)
15% fatigue (RCF, CF, creep-fatigue,…)
20% static loading
10% other kind of failure
Fatigue of Materials

L. Vergani L. Vergani -- approccio Sapproccio S--NN
3
Mechanical failures due to fatigue have been studied for more than 150 years. One early study was in 1828 by Albert in Germany. Fatigue was studied in the mid-1800s by several researchers in response to failures of components as railway axles, shaft, gears….. The fatigue failures are frequent also at present…
Fatigue of materials

L. Vergani L. Vergani -- approccio Sapproccio S--NN
4
The damage is characterized by three steps:
•Nucleation of the crack (from the surfaces or internal from existing defects)
•Propagation (short crack, long crack)
•Final failure
Fatigue damage MECHANISMS

L. Vergani L. Vergani -- approccio Sapproccio S--NN
5
•The nucleation of a micro-crack is due to the plastic strain and the persistent slip band (PSB).
Nucleation of a micro-crack
L. Vergani L. Vergani -- approccio Sapproccio S--NN
6
•In the most strained zones the material fails and micro-cracks nucleate. In the first stage these micro-cracks propagate in the direction of the maximum tangential stress (Stage I). They can be inter-granular or trans-granular.
Nucleation of a micro-crack
Da Suresh - “Fatigue of Materials”

L. Vergani L. Vergani -- approccio Sapproccio S--NN
7
•During the Stage I the propagation of the micro-cracks is influenced by the microstructure of the material.
•When the dimensions of the micro-crack are increasing the friction between the crack faces is increasing too. The propagation of the cracks continues in a plane perpendicular to the applied load (Stage II), until the sudden failure.
Propagation of a micro-crack
Da Suresh - “Fatigue of Materials”
L. Vergani L. Vergani -- approccio Sapproccio S--NN
8
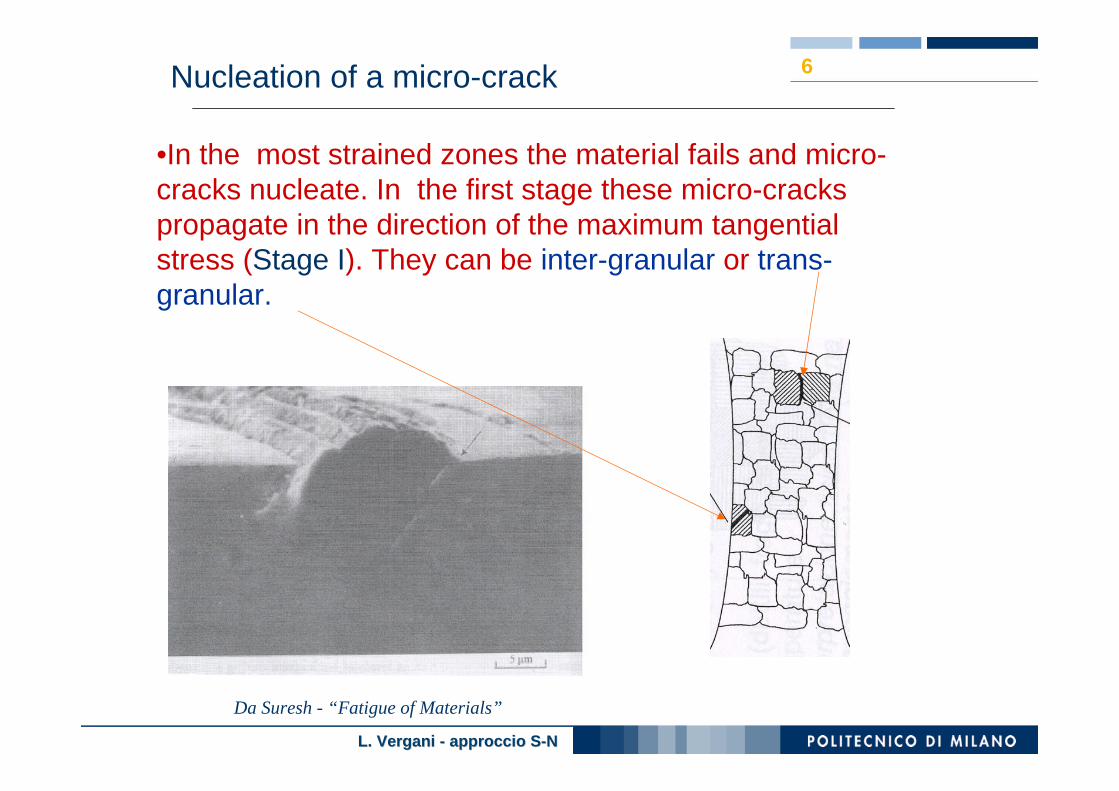
•The fatigue propagation zone is fairly flat and marked by the beach marks.
•When the crack has reached a sufficient size a final failure occurs.
Propagation of a micro-crack
The final failure can be ductile (involving large deformation) or brittle (involving little deformation) depending on the material.
L. Vergani L. Vergani -- approccio Sapproccio S--NN
9Description of a cyclic loading
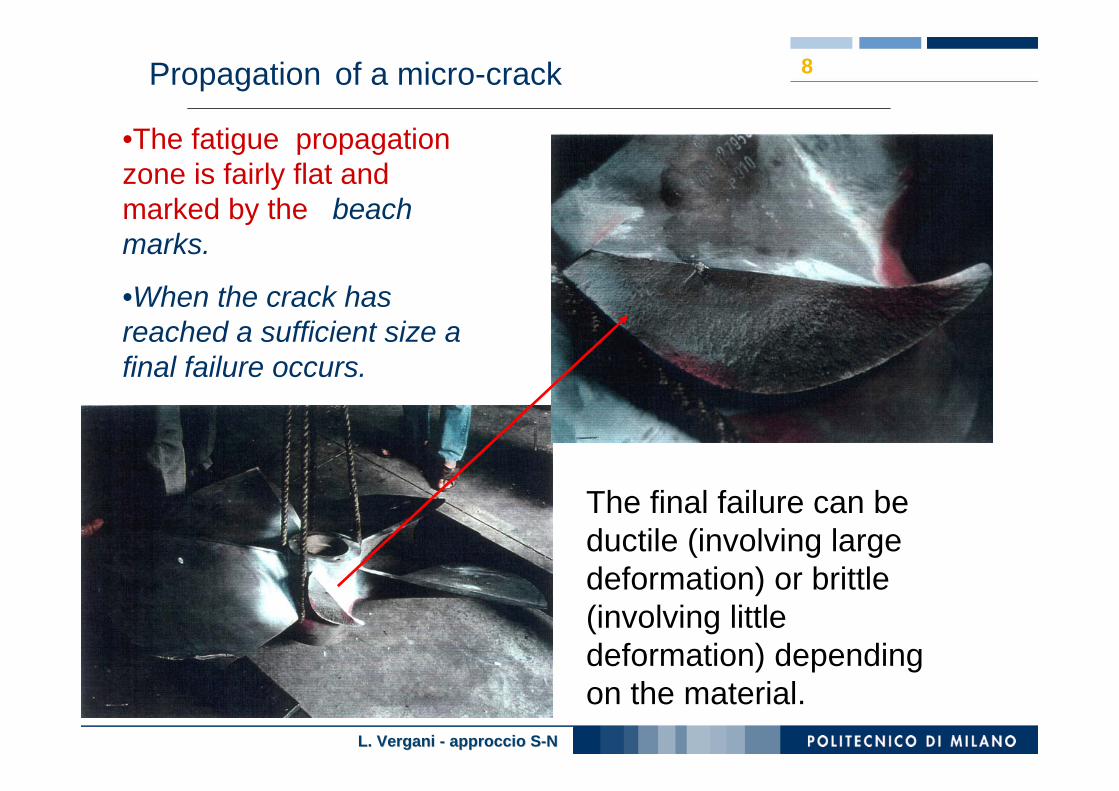
Variable loading
off-shore structure
airplane
Da Broek - “The Practical Use of Fracture Mechanics”

L. Vergani L. Vergani -- approccio Sapproccio S--NN
10
With the aim to evaluate the effect of the fatigue the cyclic loading could be schematized as:
Alternating stress
Mean stress
Amplitude ratio
2minmax σσσ −
=a
2minmax σσσ +
=med
max
min
σσ
=R
Description of a cyclic loading

L. Vergani L. Vergani -- approccio Sapproccio S--NN
11Fatigue design
A D
B C
No cracks Large cracks
Low stress amplutude
High stress amplutude
uni-axial loading
A. HCF (fatigue strength, Haigh diagram, Wöhler curves).
B. LCF (Coffin-Manson curves)
C. Elasto-plastic fracture mechanics (EPFM)
D. Linear-elastic farcture mechanics (LEFM).

L. Vergani L. Vergani -- approccio Sapproccio S--NN
12Fatigue design
AD
B C
F
E
G
H
No cracks Large cracks
Low stress amplitude
High stress amplitude
Uniaxial Stress
Multiaxial Stress
Amplitude of the loading cycles
Complexity applied loadings
Geometry and dimensions
Acceptability of the
damage
Environment
Experience

L. Vergani L. Vergani -- approccio Sapproccio S--NN
13Fatigue characterization of materials
Wöhler curves (S-N curves)
R=costant (very often =-1)
The diagram of curves S-N is a log-log diagram
UTS

L. Vergani L. Vergani -- approccio Sapproccio S--NN
14S-N curves
We can enter in these curves by considering the life or by considering the stress amplitude
σFA
UTS

L. Vergani L. Vergani -- approccio Sapproccio S--NN
15Fatigue test machines
Rotating bending test machine scheme
da Davoli, Vergani, Beretta, Guagliano, Baragetti “Costruzione di macchine 1” McGraw-Hill

L. Vergani L. Vergani -- approccio Sapproccio S--NN
16Macchine di prova
Rotating bending test machines
L. Vergani L. Vergani -- approccio Sapproccio S--NN
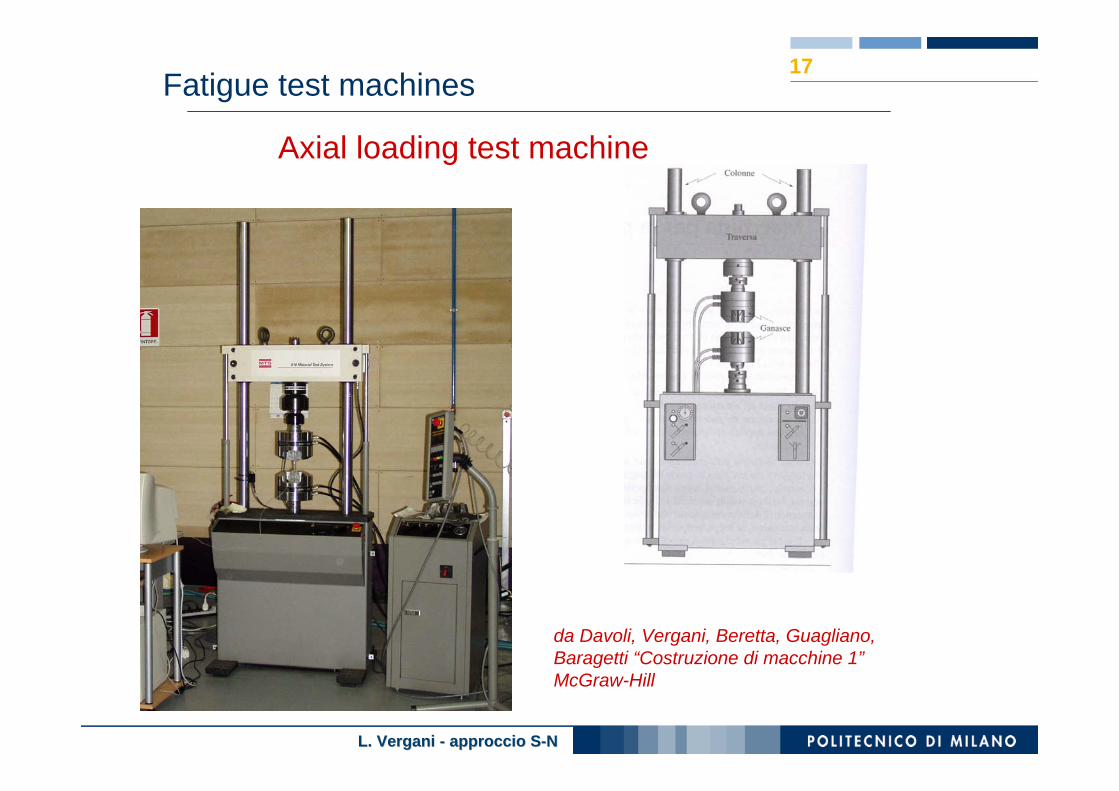
17Fatigue test machines
Axial loading test machine
da Davoli, Vergani, Beretta, Guagliano, Baragetti “Costruzione di macchine 1”McGraw-Hill

L. Vergani L. Vergani –– approccio Sapproccio S--NN
18
POLITECNICO DI MILANO
Fatigue characterization of materials
The tests to evaluate the fatigue strength of materials are carried out by using standard specimens
(norma ISO 1143)
d = 10 mm
Ra= 0.3μm
Kt = 1
σFAf/Rm= 0.4 - 0.6
σFAa/Rm= 0.3 - 0.45
τFAt/Rm= 0.23 - 0.33
L. Vergani L. Vergani –– approccio Sapproccio S--NN
19Fatigue characterization of materials
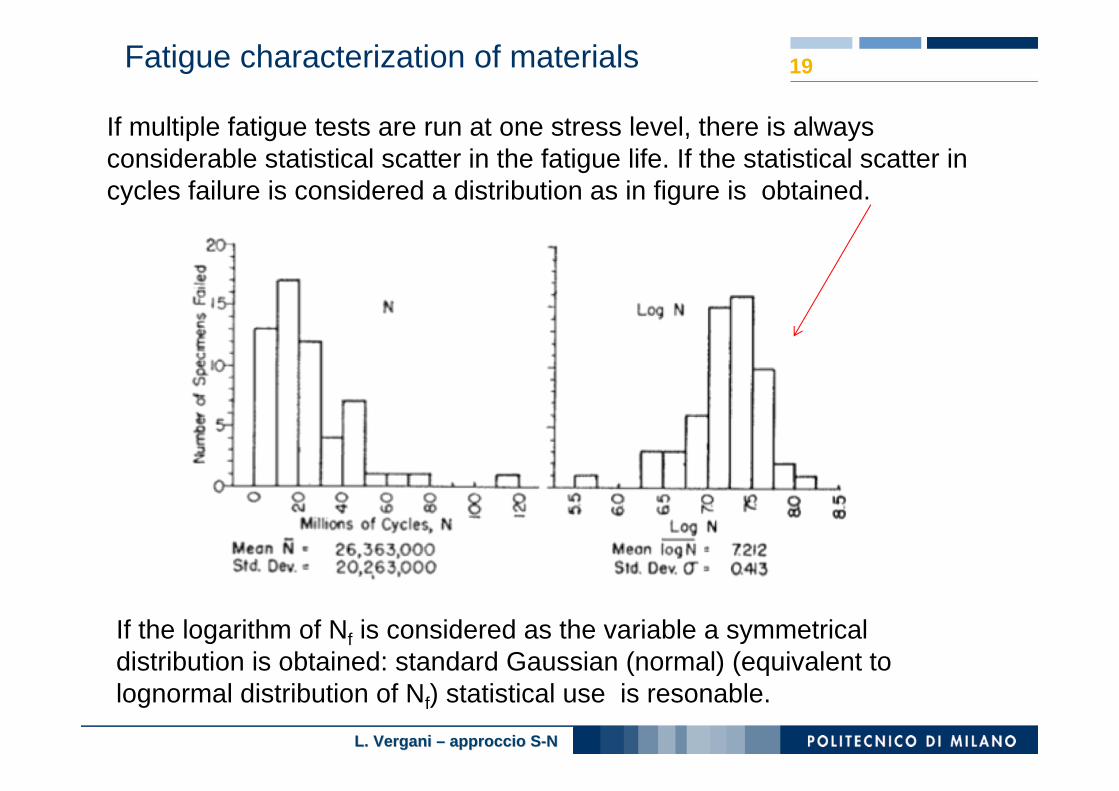
If multiple fatigue tests are run at one stress level, there is always considerable statistical scatter in the fatigue life. If the statistical scatter in cycles failure is considered a distribution as in figure is obtained.
If the logarithm of Nf is considered as the variable a symmetrical distribution is obtained: standard Gaussian (normal) (equivalent to lognormal distribution of Nf) statistical use is resonable.

L. Vergani L. Vergani –– approccio Sapproccio S--NN
20
Statistical analysis of fatigue data permits the average fatigue curves t.o be established along with additional S-N curves for various probabilities of failure

L. Vergani L. Vergani –– approccio Sapproccio S--NN
Fatigue characterization of materials
The experimental data are treated by the statistical approach: STAIR CASE.This approach allows to determine the fatigue strength characterized by the 50% of probability of failure.A large number of specimens to be experimentally tested is required.The number of specimens has to be odd in order to have a different number of failure and survivors.Before starting the tests the maximum number of loading cycles and the value of Δσ are chosen.
21

L. Vergani L. Vergani –– approccio Sapproccio S--NN
22Fatigue characterization of materials
5 broken specimens (3 σ2 and 2 σ3) 6 run out specimens (2 σ2, 3 σ1 and 1 σο)
2523 32 σσσσ Δ
−+
=FA
Less frequent event
failure
L. Vergani L. Vergani -- approccio Sapproccio S--NN
23S-N Curves
POLITECNICO DI MILANO
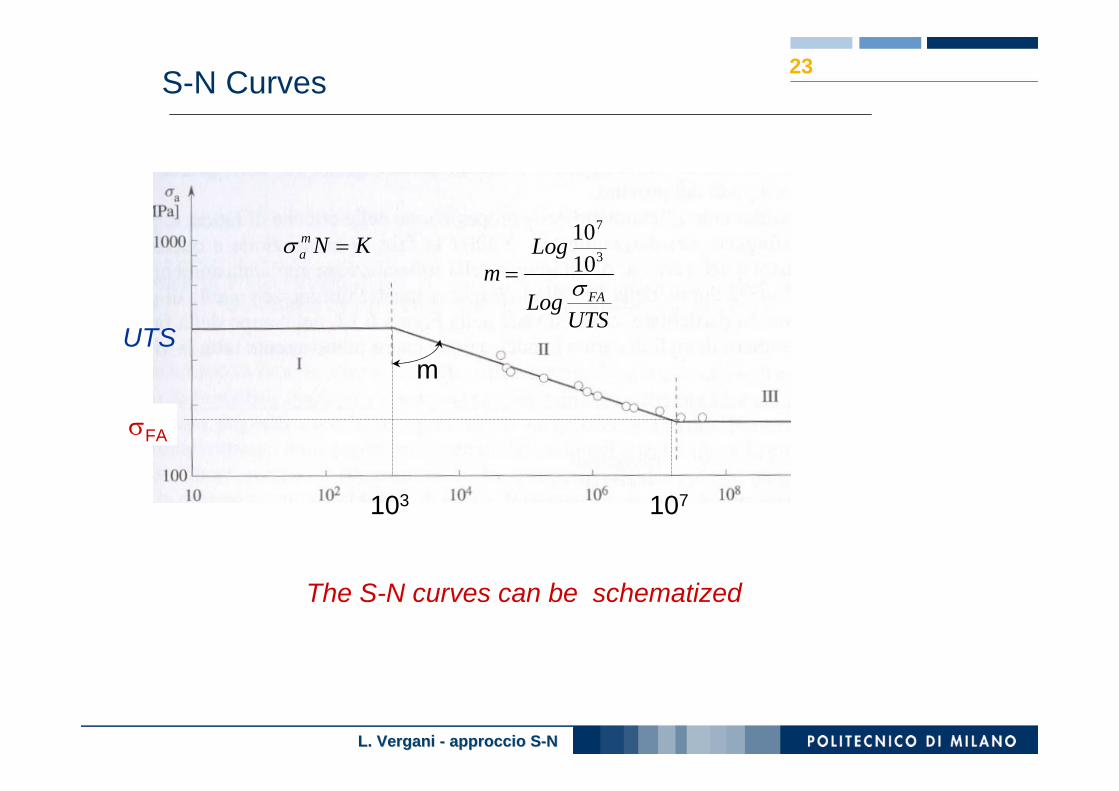
The S-N curves can be schematized
σFA
UTSUTS
Log
Logm
FAσ3
7
1010
=
m
KNma =σ
103 107

L. Vergani L. Vergani –– approccio Sapproccio S--NN
24
POLITECNICO DI MILANO
From the specimen to the component
•Surface finish effect
•Dimension effect
•Notch effect
With the aim to consider these effects the follwing parameters are defined:

L. Vergani L. Vergani –– approccio Sapproccio S--NN
25
POLITECNICO DI MILANO
From the specimen to the component
•Surface finish effect: the coefficient b3 is defined equal to the ratio between the fatigue strength obtained by specimens with different surface finish and the fatigue strength obtained by standard specimens (roughness Ra=0.3 μm)
b3 pattern versus ultimate strength of materials(1- lucidato; 2-rettificato fine; 3-rettificato; 4,5-tornito)

L. Vergani L. Vergani –– approccio Sapproccio S--NN
26

L. Vergani L. Vergani –– approccio Sapproccio S--NN
27
POLITECNICO DI MILANO
From the specimen to the component
•Dimensional effect: the coefficient b2 is defined equal to the ratio between the fatigue strength obtained by specimens with generic dimensions and the fatiguestrength obtained by standard specimens (d=10mm).
b2 pattern versus the dimensions

L. Vergani L. Vergani –– approccio Sapproccio S--NN
28
POLITECNICO DI MILANO
From the specimen to the component
•Notch effect: the fatigue notch coefficient Kf is defined equal to the ratio between the fatigue strength obtained by standard specimens and the fatigue strength obtained by notched specimens
•Kf depend on Kt by the notch sensivity q.
11
−
−=
t
f
KK
q Bending and axial fatigue
Torsion fatigue
L. Vergani L. Vergani –– approccio Sapproccio S--NN
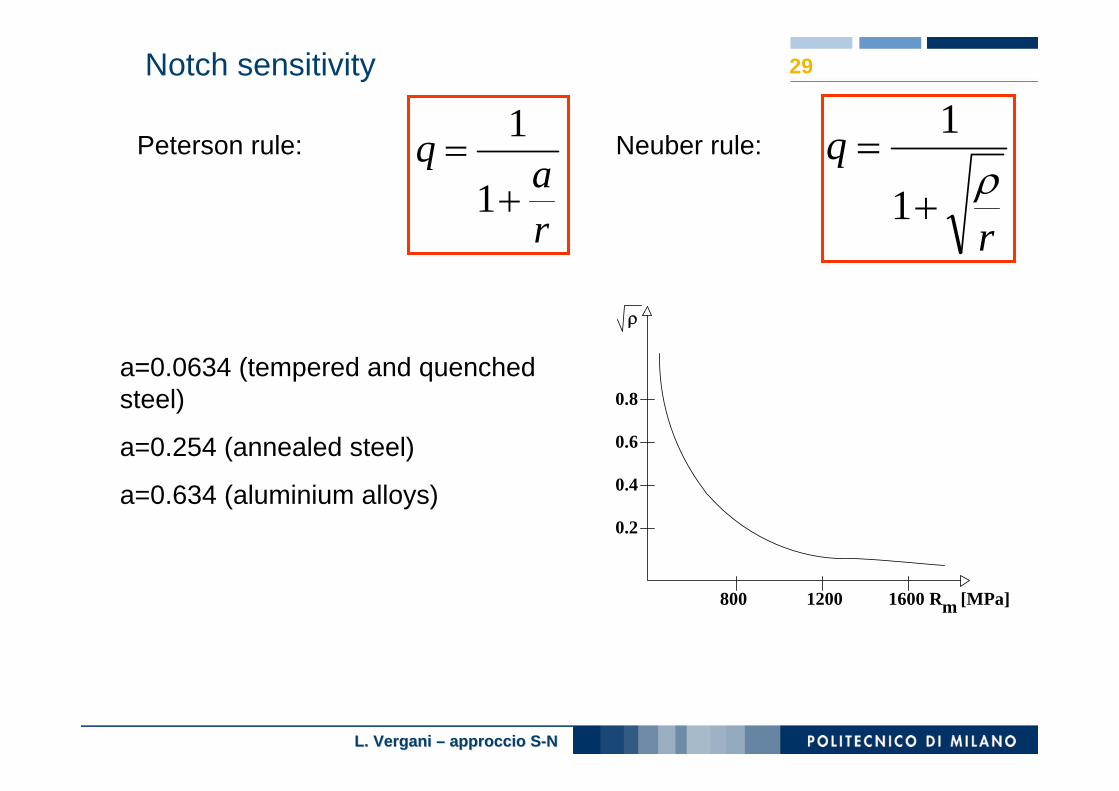
29Notch sensitivity
Peterson rule: Neuber rule: q
r
=+
1
1 ρ
R [MPa]m
ρ
0.2
0.4
0.6
0.8
800 1200 1600
raq
+=
1
1
a=0.0634 (tempered and quenched steel)
a=0.254 (annealed steel)
a=0.634 (aluminium alloys)

L. Vergani L. Vergani –– approccio Sapproccio S--NN
30
POLITECNICO DI MILANO
From specimen to the component
•Kf=1+q(Kt-1)
r M Mf1 f2
A B
rA> rB
At the same σmax :
From experimental tests: KfA=2,1 e KfB=3,6 If the notch radius is larger (KtA=2,5) the value of Kf decreases of 16%, on the contrary if the notch radius is lower (KtB=5), the value decreases of 28%.
KtA=2,5 KtB=5
2 tBfA fB fB
tA
KM M M
K= =
KfB> KfA The gradient effect is secondary

L. Vergani L. Vergani –– approccio Sapproccio S--NN
31
POLITECNICO DI MILANO
From the specimen to the component
•The fatigue limit of the component becames:
f
faFAfaFA K
bb 32),(),('
σσ =
The S-N curve of the component
σa
σFA
σ’FA

L. Vergani L. Vergani –– approccio Sapproccio S--NN
32
POLITECNICO DI MILANO
Mean stress effect
Haigh diagram:
σ’FA
Rm

L. Vergani L. Vergani –– approccio Sapproccio S--NN
33
POLITECNICO DI MILANO
Mean stress effect:
Semplified diagram:
σ’FA
Rm
σsn
σsn σsnRc
The yielding limit is considered

L. Vergani L. Vergani –– approccio Sapproccio S--NN
34Mean stress effect:

L. Vergani L. Vergani –– approccio Sapproccio S--NN
35Compression mean stress effect
The surface tretament are applied to improve the fatigue behavior of mechanical componentThermo-chemical treatment (carburizing and nitriding) Mechanical treatment (shot peening, cold rolling)
+-
L. Vergani L. Vergani –– approccio Sapproccio S--NN
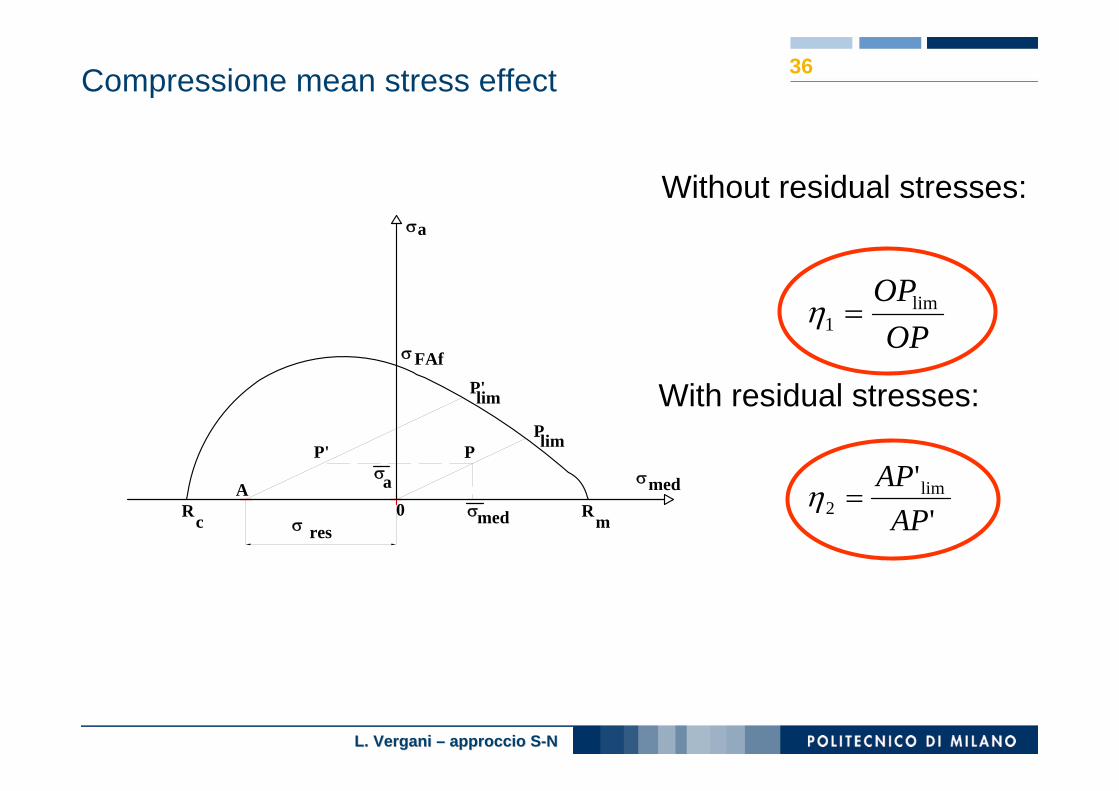
36Compressione mean stress effect
σ
σ
σ
a
FAf
medRc
0
PPlim
σ
σa
medresσ
P'lim
P'
Rm
A
OPOPlim
1 =η
''lim
2 APAP
=η
Without residual stresses:
With residual stresses:

L. Vergani L. Vergani –– approccio Sapproccio S--NN
37Haigh diagram: torsion

L. Vergani L. Vergani –– approccio Sapproccio S--NN
38
POLITECNICO DI MILANO
Finite life estimationIf the service required life is lower than the life corresponding to the fatigue limit (N=106÷107):
A semplified Wöhler diagram is constructed
(σ’F) value is determined
Log N
max
FAf
σ
σ
1 2 3 4 5 6 7
Rm
σF
σFAf
σF
Ν=105
σ’F> σ’FAf

L. Vergani L. Vergani –– approccio Sapproccio S--NN
39
The shaft is loaded by a varaible bending momentN=105
b2 b3 Kf and matreial characteristics are known
r
Mf
M
fM
D d
′ = ⋅⋅
σ σFAf FAfff
b bK2 3
M f = Mo sinωt

L. Vergani L. Vergani –– approccio Sapproccio S--NN
40Finite life
Wöhler diagram
Log N
max
FAf
σ
σ
1 2 3 4 5 6 7
Rm
Fσ

L. Vergani L. Vergani –– approccio Sapproccio S--NN
41example
dL1
L2
F0 F0
Steel: 39NiCrMo3 (Rm=900MPa, Rsn=700MPa). L1=40mm L2=60mm d=15mm B=5mm F0=10.000N
F= F0(1+sinωt)
Νf>107
Failure?

L. Vergani L. Vergani –– approccio Sapproccio S--NN
42Example
σmed=-50MPaσa=60MPa
b2, b3, Kf, σFA
t5060
σ
stress:

L. Vergani L. Vergani –– approccio Sapproccio S--NN
43Example
σa>0 σm<0
σ
σ
σ
a
FAf
medRs
Rs
Rs mR
P
Plim
60
-50
Haigh diagram
σ σFA FAf
b bK
' = 2 3
limOPOP
η =

L. Vergani L. Vergani –– approccio Sapproccio S--NN
44example

L. Vergani L. Vergani –– approccio Sapproccio S--NN
45example
σ
σ
σ
a
FAf
medRc O
Plim
Rm
σrot

L. Vergani L. Vergani –– approccio Sapproccio S--NN
46
POLITECNICO DI MILANO
Example
L’omologazione del manubrio illustrato in figura richiede che esso superi senza rompersi una prova di fatica dalla durata di 5x10⁵ cicli con una carico applicato F1, alternato intorno al valor nullo, di 1 kN.
Si stimi se, assegnati il materiale e le dimensioni geometriche, il manubrio supererà la prova.
DatiMat.: 39NiCrMo3 (Rm=900 MPa, Rp0.2=650 MPa)
L=400 mm
a= 200 mm
Sez. A-A (circolare cava)
De= 25 mm
Di=20 mm
Kt=1.7
Α
Α
−F1
F1F1
−F1 A-AL
a