Embed Size (px)
Citation preview

Under fluctuating / cyclic stresses, failure can occur at loads considerably lower than tensile or yield strengths of material under a static load: Fatigue
Estimated to cause 90% of all failures of metallic structures (bridges, aircraft, machine components, etc.)
Fatigue failure is brittle-like (relatively little plastic deformation) -even in normally ductile materials. Thus sudden and catastrophic!
Fatigue :Failure under fluctuating / cyclic stress
Fatigue failure proceeds in three distinct stages: crack initiation in the areas of stress concentration (near stress raisers), incremental crack propagation, final catastrophic failure.
Cyclic stresses characterized by maximum, minimum and mean stress, the range of stress, the stress amplitude, and the stress ratio
Remember the convention that tensile stresses are positive, compressive stresses are negative
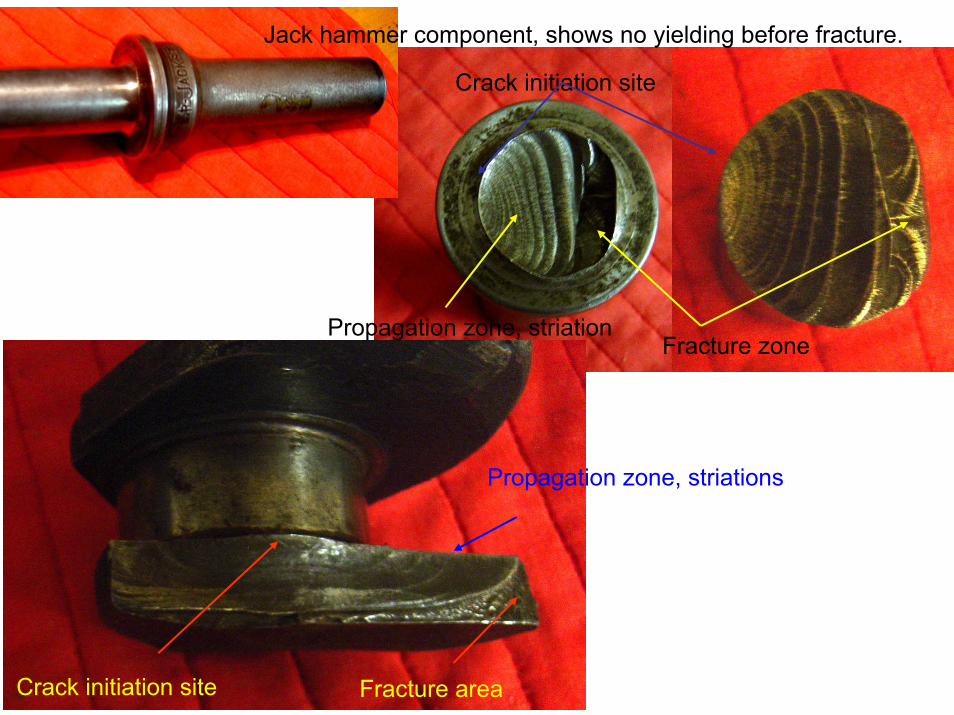
Jack hammer component, shows no yielding before fracture.
Crack initiation site
Fracture zonePropagation zone, striation
Fracture areaCrack initiation site
Propagation zone, striations
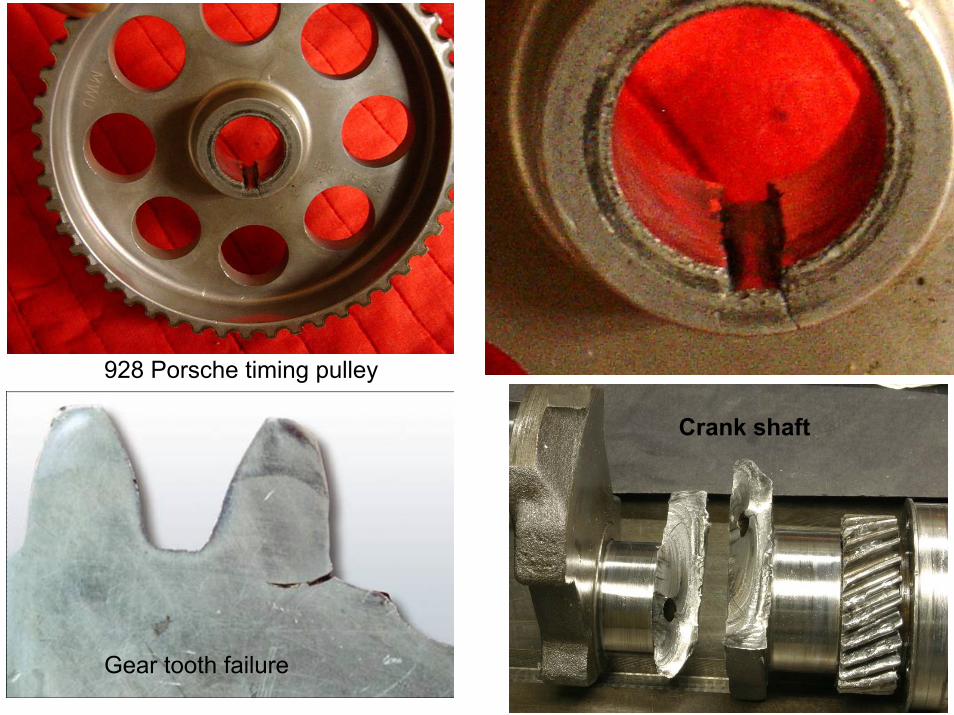
928 Porsche timing pulley
Gear tooth failure
Crank shaft
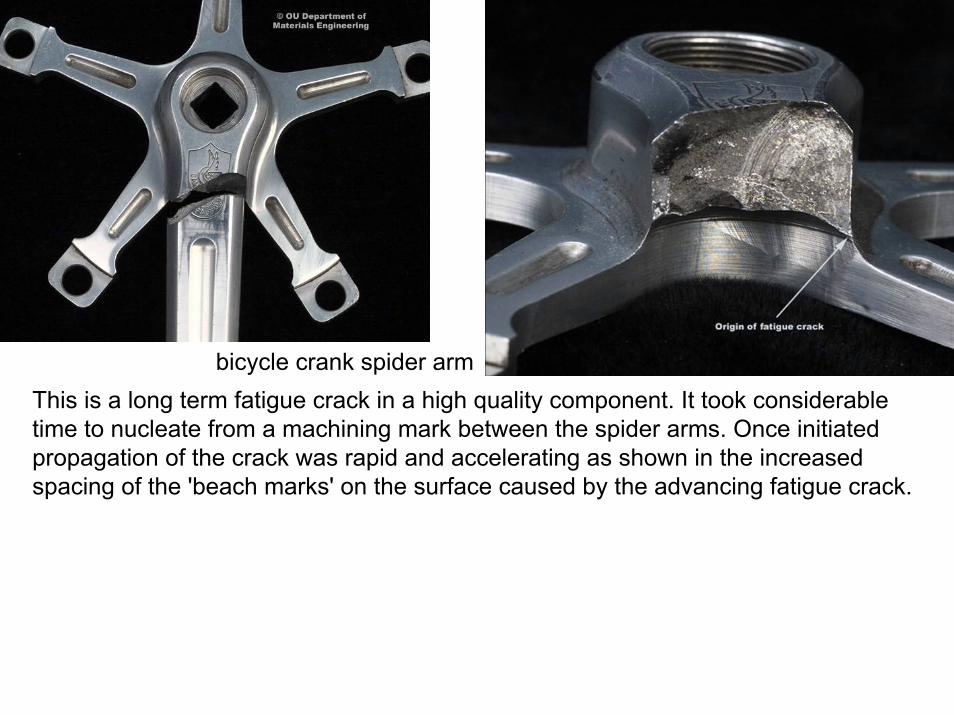
This is a long term fatigue crack in a high quality component. It took considerable time to nucleate from a machining mark between the spider arms. Once initiated propagation of the crack was rapid and accelerating as shown in the increased spacing of the 'beach marks' on the surface caused by the advancing fatigue crack.
bicycle crank spider arm

Hawaii, Aloha Flight 243, a Boeing 737, an upper part of the plane's cabin area rips off in mid-flight. Metal fatigue was the cause of the failure.

Fatigue: Cyclic Stresses
2minmax σσσ +
=mean
2minmax σσσ −
=amplitude
minmax σσσ −=range
max
min_σσ
=ratioStress
Fatigue: S—N curvesFatigue: rotating-bending tests produce S-N curves
S (stress) vs. N (number of cycles to failure)
Low cycle fatigue: high loads, plastic and elastic deformationHigh cycle fatigue: low loads, elastic deformation (N > 105)
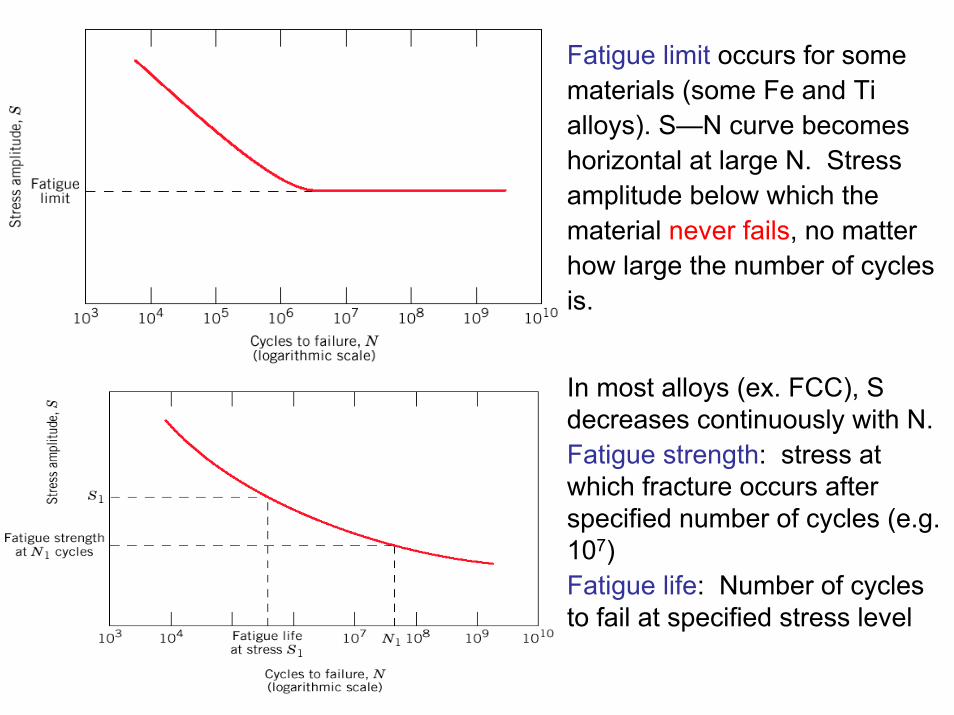
Fatigue limit occurs for some materials (some Fe and Ti alloys). S—N curve becomes horizontal at large N. Stress amplitude below which the material never fails, no matter how large the number of cycles is.
In most alloys (ex. FCC), S decreases continuously with N. Fatigue strength: stress at which fracture occurs after specified number of cycles (e.g. 107)Fatigue life: Number of cycles to fail at specified stress level
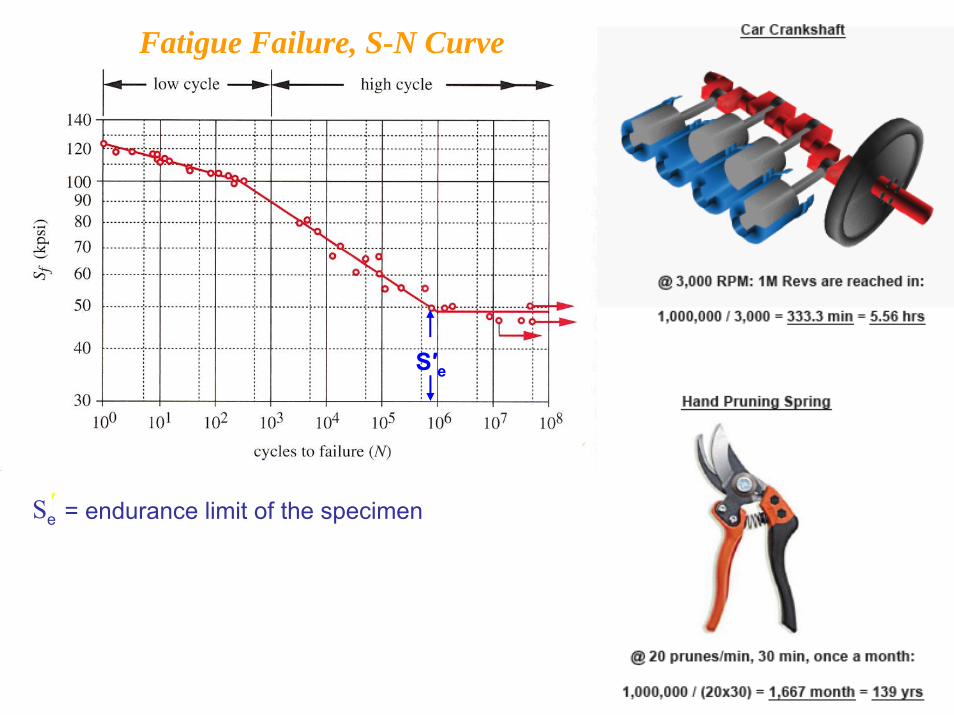
Fatigue Failure, S-N Curve
S′e
= endurance limit of the specimenSe′
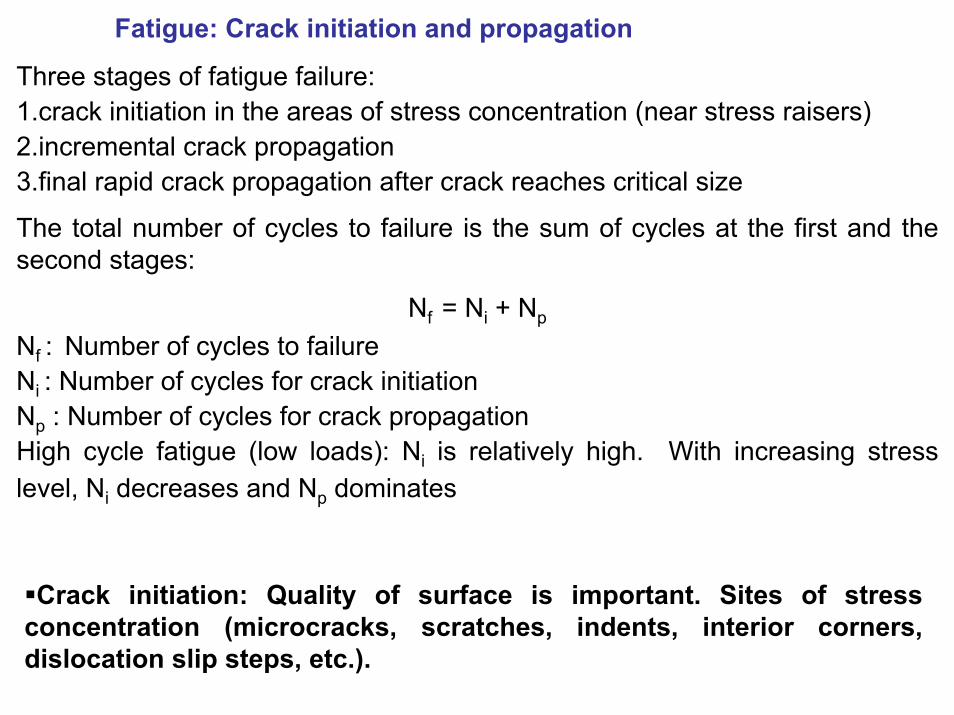
Three stages of fatigue failure: 1.crack initiation in the areas of stress concentration (near stress raisers)2.incremental crack propagation3.final rapid crack propagation after crack reaches critical size
The total number of cycles to failure is the sum of cycles at the first and the second stages:
Nf = Ni + Np
Nf : Number of cycles to failureNi : Number of cycles for crack initiationNp : Number of cycles for crack propagationHigh cycle fatigue (low loads): Ni is relatively high. With increasing stress level, Ni decreases and Np dominates
Fatigue: Crack initiation and propagation
Crack initiation: Quality of surface is important. Sites of stress concentration (microcracks, scratches, indents, interior corners, dislocation slip steps, etc.).
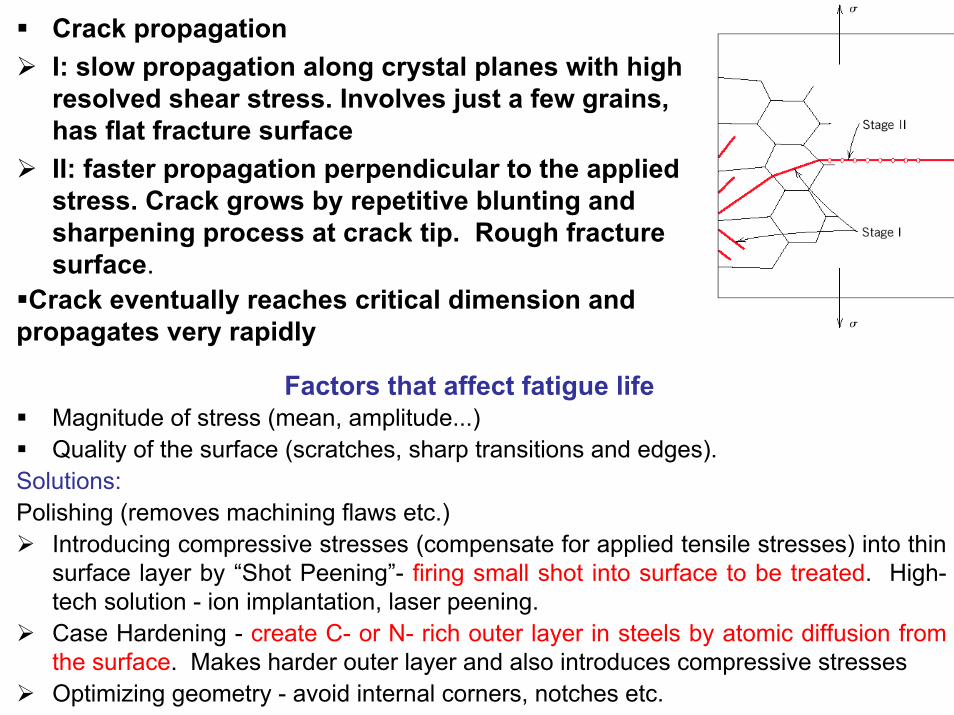
Crack propagation I: slow propagation along crystal planes with high resolved shear stress. Involves just a few grains, has flat fracture surfaceII: faster propagation perpendicular to the applied stress. Crack grows by repetitive blunting and sharpening process at crack tip. Rough fracture surface.
Crack eventually reaches critical dimension and propagates very rapidly
Factors that affect fatigue life Magnitude of stress (mean, amplitude...)Quality of the surface (scratches, sharp transitions and edges).
Solutions:Polishing (removes machining flaws etc.)
Introducing compressive stresses (compensate for applied tensile stresses) into thin surface layer by “Shot Peening”- firing small shot into surface to be treated. High-tech solution - ion implantation, laser peening.Case Hardening - create C- or N- rich outer layer in steels by atomic diffusion from the surface. Makes harder outer layer and also introduces compressive stressesOptimizing geometry - avoid internal corners, notches etc.

11
Fatigue• Fracture surface with crack initiation at top. Surface shows predominantly dull fibrous texture where rapid failure occurred after crack achieved critical size.
• Fatigue failure1.Crack initiation2.Crack propagation3.Final failure

• Fatigue failure is brittle in nature, even in normally ductile materials; there is very little plastic deformation associated with the failure.• The image shows fatigue striations (microscopic).
• Striations are close together indicatinglow stress, many cycles.• Widely spaced striations mean high stress few cycles.

• Federal investigators say metal fatigue caused a hole to rip open in the roof of aSouthwest Airlines jet as it cruised at 35,000 feet last year (2009). The National Transportation Safety Board says the 14-inch crack developed in a spot where two sheets of aluminum skin were bonded together on the Boeing 737 jet.
• The pilot made an emergency landing in Charleston, W.Va. There were no injuries among the 126 passengers and five crew members. Two months after the scare, Boeing told all airlines with 737s to conduct repeated inspections of the top of the fuselage near the vertical tail fin. The Federal Aviation Administration has since made those inspections mandatory.
• Southwest got the plane in 1994 — it's much older than the average Southwest jet —and had flown it for 50,500 hours and made 42,500 takeoffs and landings before it sprang a hole in the roof, according to the safety board report. The safety board said it found signs of metal fatigue by magnifying the area in front of the tail fin. In a 3-inch stretch, the crack penetrated completely through the aluminum skin.
• FAA records showed that eight cracks had been found and repaired in the fuselage during the plane's 14-year checkup.

14
• Crack grows incrementally Typically between. 1 to 6
( ) a~ σΔincrease in crack length per loading cycle
• Failed rotating shaft-- crack grew even though
Kmax < Kc-- crack grows faster as
• Δσ increases• crack gets longer• loading freq. increases.
crack origin
Adapted fromFig. 9.28, Callister & Rethwisch 3e. (Fig. 9.28 is from D.J. Wulpi, Understanding How Components Fail, American Society for Metals, Materials Park, OH, 1985.)
Fatigue Mechanism
( )mKdNda
Δ=

Crack growth rate1. Initially, growth rate is small, but
increases with increasing crack length.
2.Growth rate increases with applied stress level for a given crack length (a1).
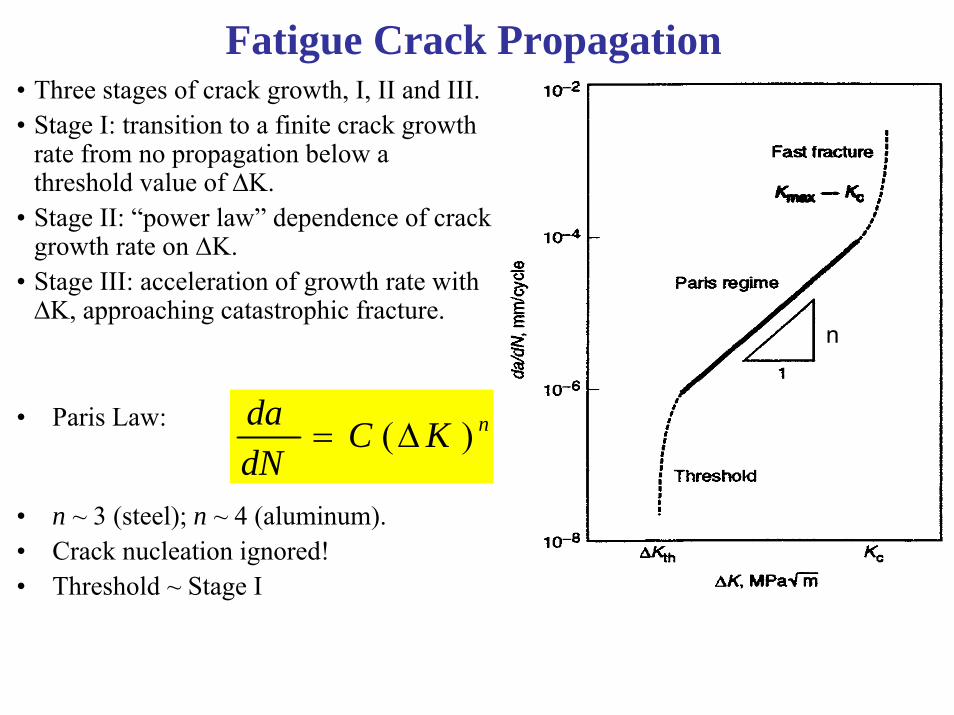
Fatigue Crack Propagation• Three stages of crack growth, I, II and III.• Stage I: transition to a finite crack growth
rate from no propagation below a threshold value of ∆K.
• Stage II: “power law” dependence of crack growth rate on ∆K.
• Stage III: acceleration of growth rate with ∆K, approaching catastrophic fracture.
• Paris Law:
• n ~ 3 (steel); n ~ 4 (aluminum).• Crack nucleation ignored!• Threshold ~ Stage I
nKCdNda )(Δ=
n

[ ]2
2/)2(2/)2(
22
minmax
)2(
2
)(
nnn
ni
nc
nnnn
n
CYn
aaN
aCY
dadN
aYK
aYaYK
KCdNda
πσ
πσ
πσ
πσπσ
Δ−
−=
Δ=
Δ=Δ
−=Δ
Δ=
−−
Notes on crack growth equation
• Material constant n and C • ac; the flaw size required for
fracture• ai; initial flaw size• Crack will not propagate during
compression–If σmin is less than zero put
it as zero

ExampleA high-strength steel plate has Kic of 80MPa.m0.5 is alternately loaded in tension to 500 MPa and a compression to 60 MPa. The plate is to survive 10 years, with the stress being applied at a frequency of once every 5 minutes. Design a manufacturing and testing procedure. Data: Y=1 Solution
[ ]
[ ]2
2/)2(2/)2(
2
2/)2(2/)2(
5001)2(
081.02200,051,1
)2(
2
200,051,11036524min60min5
11.80081.0
500*180
nnn
ni
n
nnn
ni
nc
c
ccIc
Cn
aCfn
aaN
cyclesyy
dd
hh
cycleN
mmmaaMpaaYmMPaK
π
πσ
ππσ
−
−=
Δ−
−=
==
==
=Δ==
−−
−−

• For an specific material, use n=3.2, C=1.62*10-12
• ai=1.82*10—6 m=0.00182 mm for surface flaw• If internal flow 2ai=0.00264 mm• Manufacturing process must produce surface and internal flaws
less than the above numbers• Non-destructive test must be able to detect this flaw size
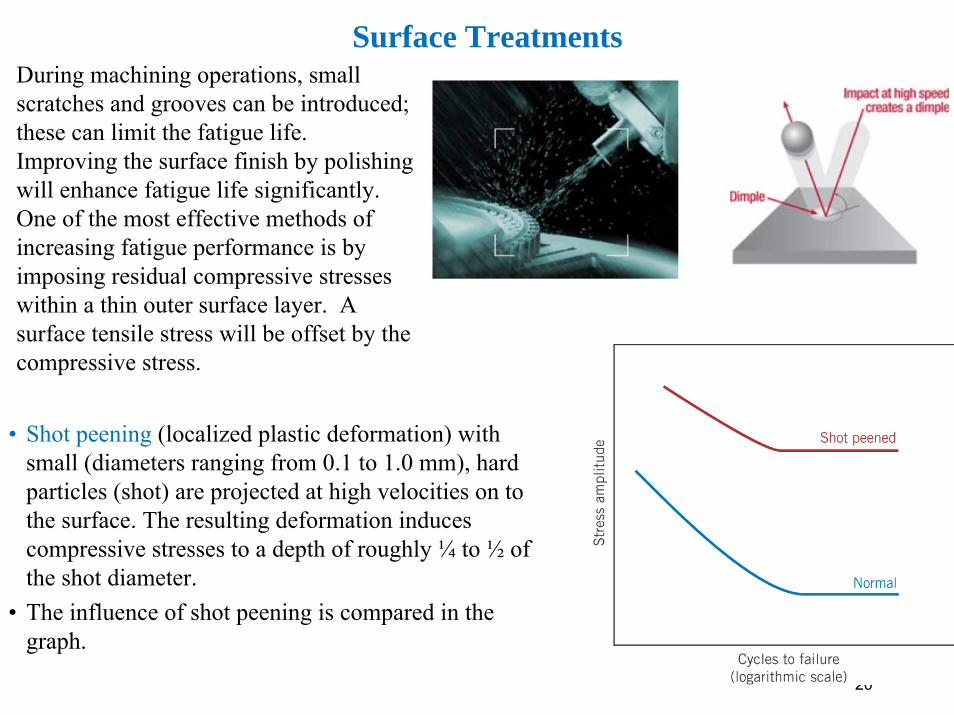
• Shot peening (localized plastic deformation) with small (diameters ranging from 0.1 to 1.0 mm), hard particles (shot) are projected at high velocities on to the surface. The resulting deformation induces compressive stresses to a depth of roughly ¼ to ½ of the shot diameter.
• The influence of shot peening is compared in the graph.
20
Surface TreatmentsDuring machining operations, small scratches and grooves can be introduced; these can limit the fatigue life.Improving the surface finish by polishing will enhance fatigue life significantly.One of the most effective methods of increasing fatigue performance is by imposing residual compressive stresses within a thin outer surface layer. A surface tensile stress will be offset by the compressive stress.
21
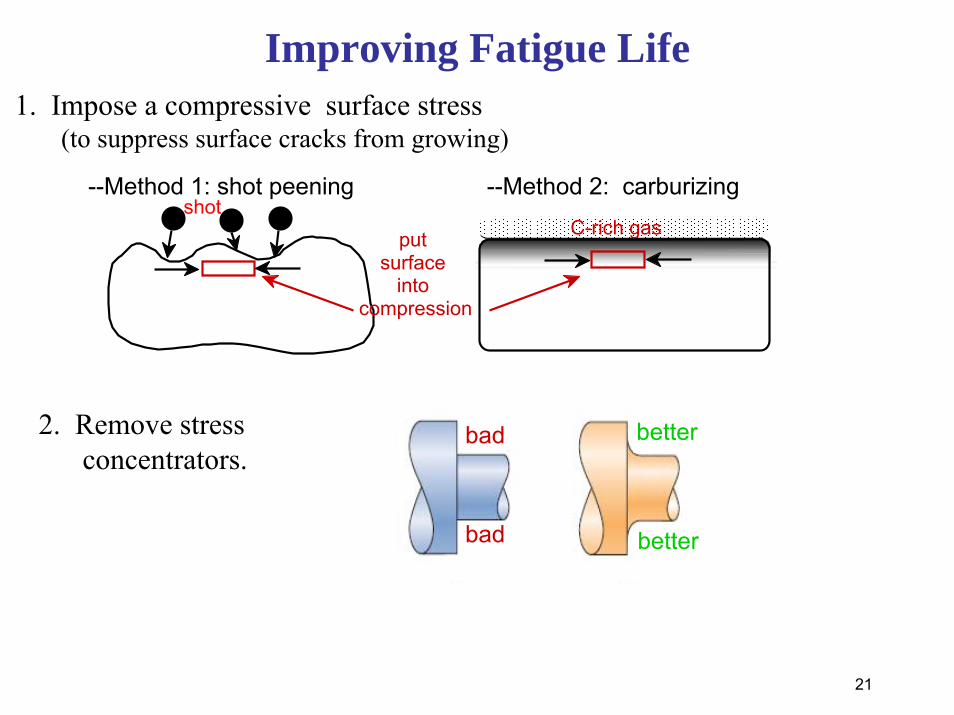
Improving Fatigue Life1. Impose a compressive surface stress
(to suppress surface cracks from growing)
--Method 1: shot peening
put surface
into compression
shot--Method 2: carburizing
C-rich gas
2. Remove stressconcentrators.
bad
bad
better
better

Case Hardening• Case hardening is a technique where both surface hardness and fatigue life are improved for steel alloys.
• Both core region and carburized outer case region are seen in image. Knoop microhardness shows case has higher hardness (smaller indent).
• A carbon or nitrogen rich outer surface layer (case) is introduced by atomic diffusion from the gaseous phase. The case is typically 1mm deep and is harder than the inner core material.
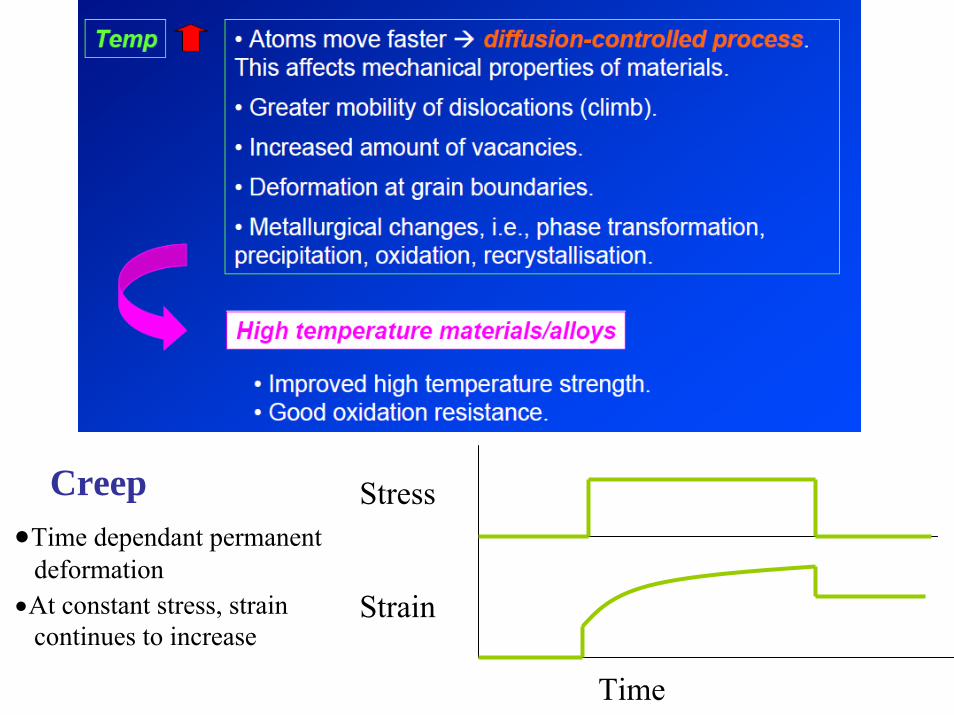
Creep
Time
Stress
Strain
•Time dependant permanent deformation
•At constant stress, strain continues to increase
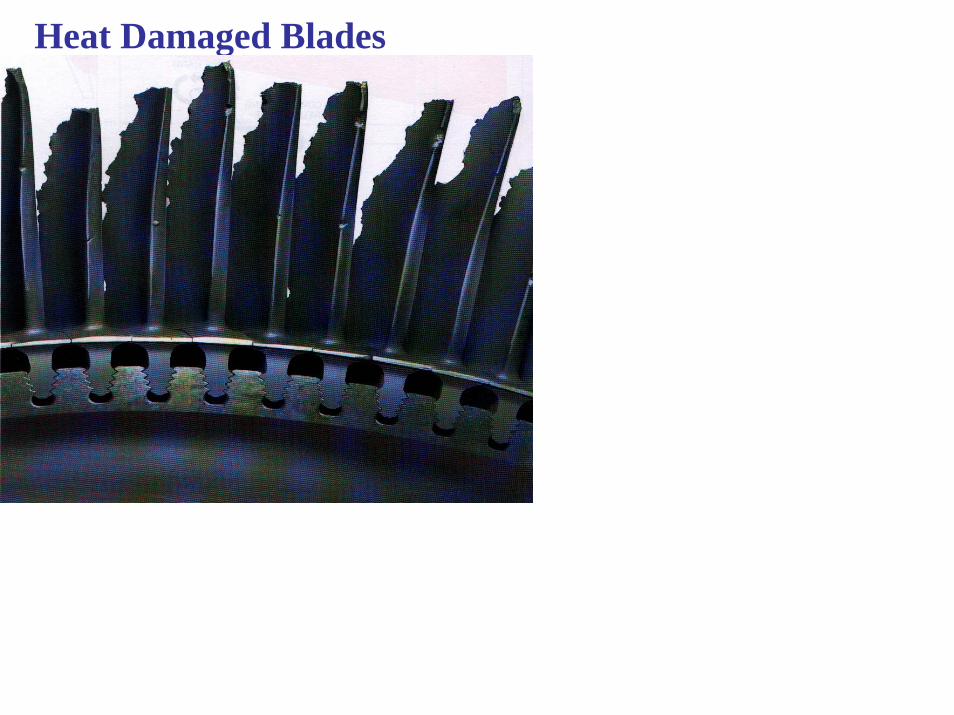
Heat Damaged Blades

SC Grain Structure

Creep Failure

Mechanisms of Creep• High rates of diffusion induces the reshaping of crystals to relieve
stress• Diffusion is significant at both grain boundaries and in the bulk • High energy and weak bonds allow dislocations to “climb” around
structures that pin them at lower temperature

The Creep Test• Usually a tensile bar • Dead load applied• Strain is plotted with time• Test usually ends with rupture (failure)
Classical creep curve

Creep Time-dependent and permanent deformation of materials when subjected to a constant load at a high temperature (> 0.4 Tm). Examples: turbine blades, steam generators.
Stages of creep
Application of Classical Curve•Steady state creep rate determined from straight section (secondary creep)•Arhennius model captures temperature dependence (diffusion!)•Several tests at different temperatures & stress levels can be used to determine material model parameters
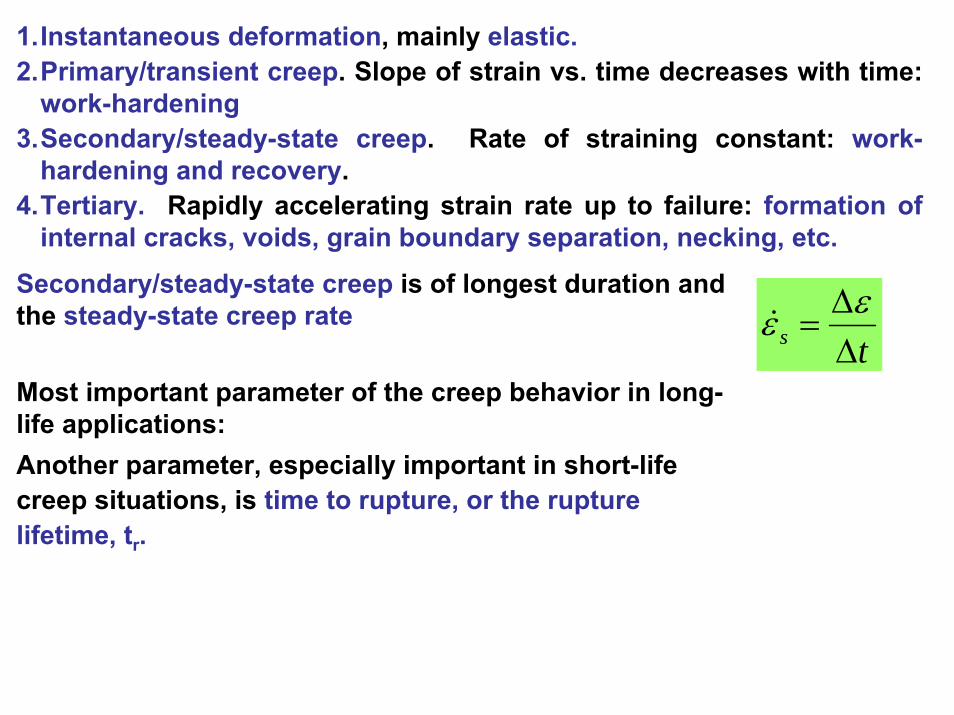
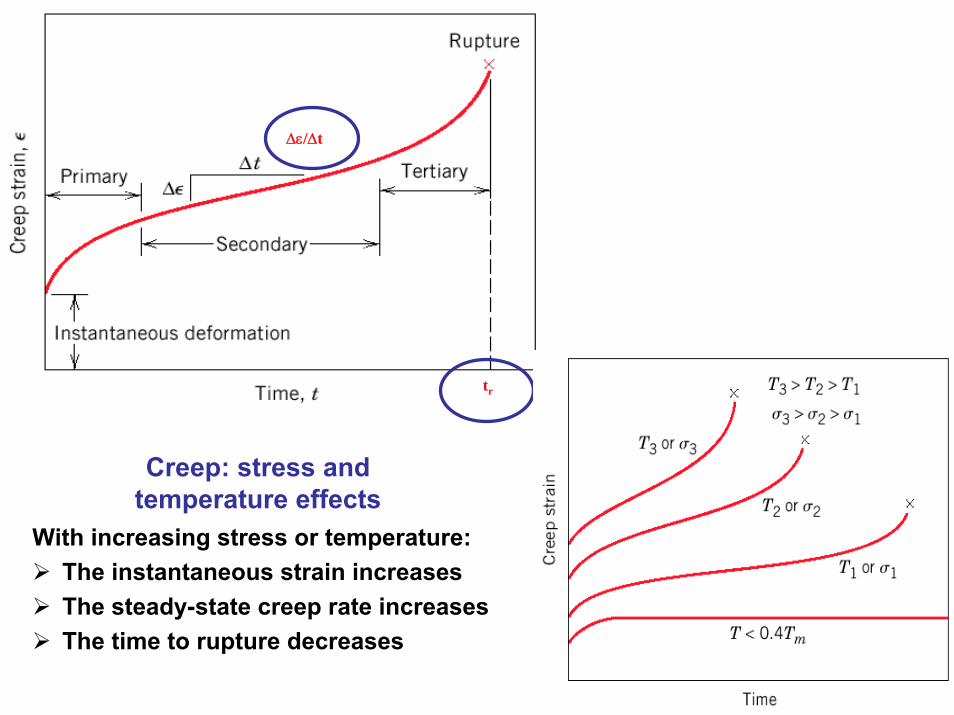
1.Instantaneous deformation, mainly elastic.2.Primary/transient creep. Slope of strain vs. time decreases with time:
work-hardening3.Secondary/steady-state creep. Rate of straining constant: work-
hardening and recovery. 4.Tertiary. Rapidly accelerating strain rate up to failure: formation of
internal cracks, voids, grain boundary separation, necking, etc.
Secondary/steady-state creep is of longest duration and the steady-state creep rate
.Most important parameter of the creep behavior in long-life applications:Another parameter, especially important in short-life creep situations, is time to rupture, or the rupture lifetime, tr.
ts ΔΔ
=εε&
tr
Δε/Δt
Creep: stress and temperature effects
With increasing stress or temperature:The instantaneous strain increasesThe steady-state creep rate increasesThe time to rupture decreases

Example:The steady-state creep strain rate for a Carbon-Nickel alloy is 0.1%/1000h at 650C and 10MPa stress. Estimate the lifetime of a turbine blade that is 75 mm long initially and can creep 0.5mm before contacting the casing.
Lo=75 mm( )
h6.7x10
)(1000/%1.0%67.0
%67.00067.075
5.0
.
3=
×==∴
==
=Δ
=
=
t
th
mmmm
LL
t
creep
creep
o
ccreep
screep
ε
ε
ε
εε &

Creep in the Concorde16 were built. Speed: Mach 2.2; Length 25.5 mDesign Life: 20,000 flying hrs.Primary Structural Alloy : 2618 Aluminum for Creep Resistance.
DesignThe operating temperature of the airframe is about 100°C due to kinetic heating at cruising altitude. The design creep strain limit was 0.1% over the design life of 20,000 hrs. Hence, the age hardened aluminum alloy 2618 was selected.
Stress = 175 MPa
How much would the length change if this creep was distributed evenly over the entire airframe? (25.5 mm!)

Creep Constitutive ModelsIn physics, a constitutive model (equation) mathematically describes the relationship between two physical quantities (often described by tensors) that is specific to a material, and approximates the response of that material to external stimulus.
For T = constant
⎟⎠⎞
⎜⎝⎛−==
RTQK
tcn
s exp2σεδδε
&
nKt
σδδε
1=Creep Rupture Method
• When rupture (catastrophic failure) is the only concern (egboiler tubes) a simpler method will do
• Maps of time to rupture as a function of stress and temperature are used to determine the expected life
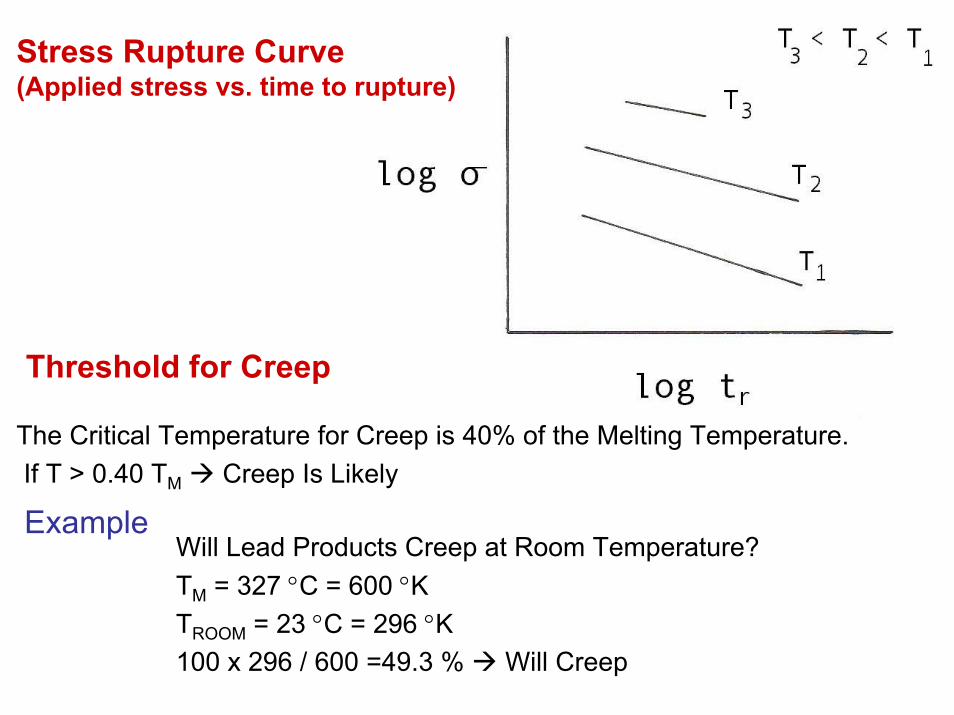
Stress Rupture Curve(Applied stress vs. time to rupture)
Threshold for Creep
The Critical Temperature for Creep is 40% of the Melting Temperature.If T > 0.40 TM Creep Is Likely
ExampleWill Lead Products Creep at Room Temperature?TM = 327 °C = 600 °KTROOM = 23 °C = 296 °K100 x 296 / 600 =49.3 % Will Creep
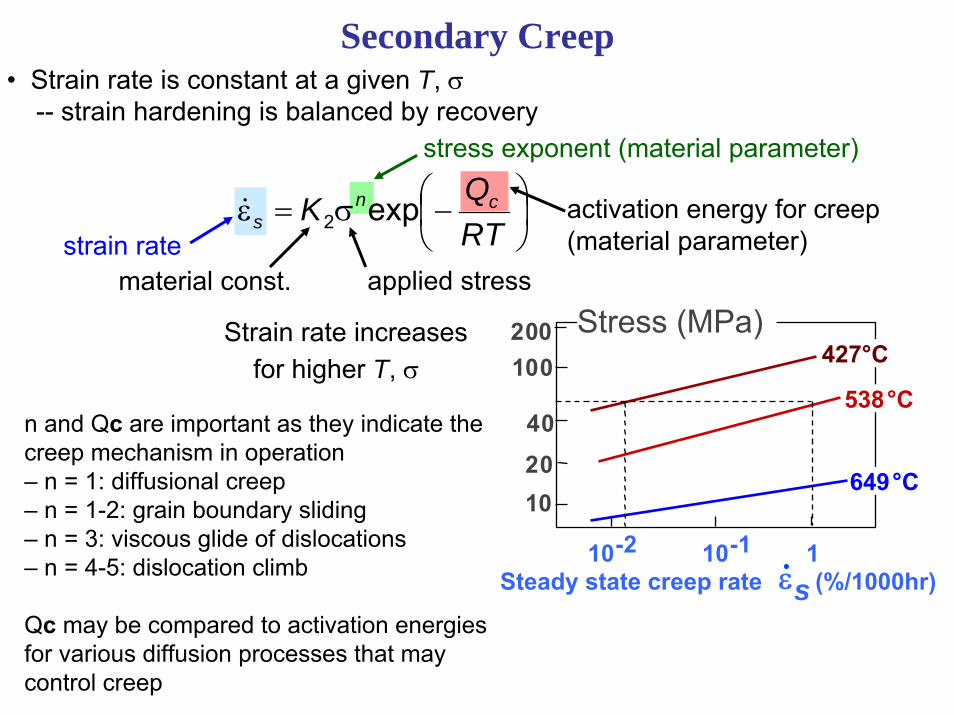
• Strain rate is constant at a given T, σ-- strain hardening is balanced by recovery
Strain rate increasesfor higher T, σ
102040
100200
10-2 10-1 1Steady state creep rate (%/1000hr)ε s
Stress (MPa)427°C
538°C
649°C
Secondary Creep
stress exponent (material parameter)
strain rateactivation energy for creep(material parameter)
applied stressmaterial const.
⎟⎠⎞
⎜⎝⎛−σ=ε
RTQK cn
s exp2&
n and Qc are important as they indicate the creep mechanism in operation– n = 1: diffusional creep– n = 1-2: grain boundary sliding– n = 3: viscous glide of dislocations– n = 4-5: dislocation climb
Qc may be compared to activation energies for various diffusion processes that maycontrol creep
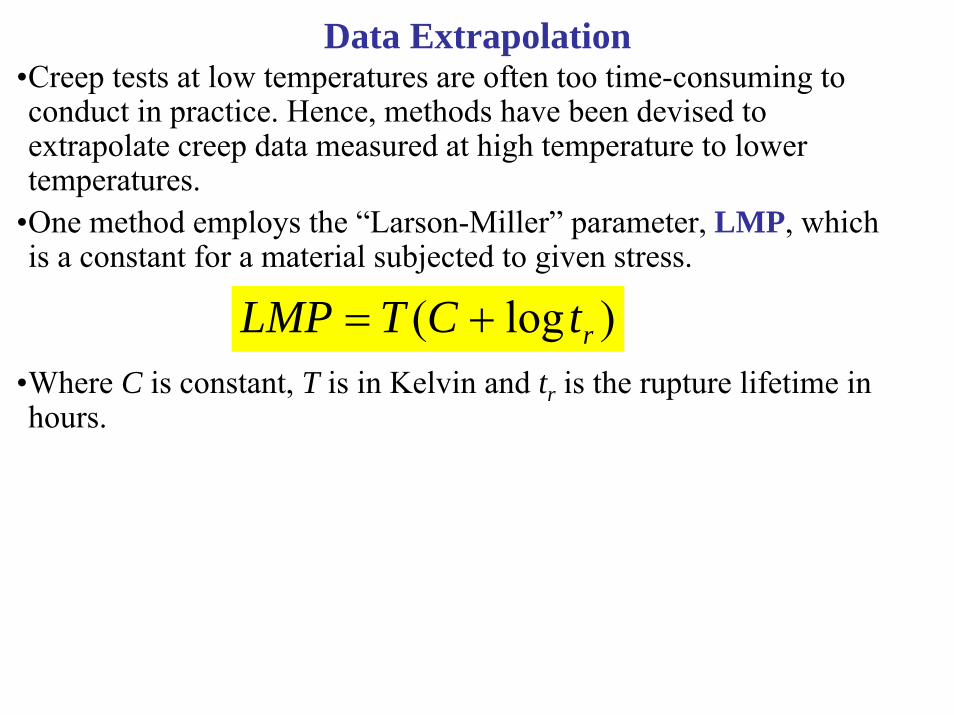
Data Extrapolation•Creep tests at low temperatures are often too time-consuming to conduct in practice. Hence, methods have been devised to extrapolate creep data measured at high temperature to lower temperatures.
•One method employs the “Larson-Miller” parameter, LMP, which is a constant for a material subjected to given stress.
•Where C is constant, T is in Kelvin and tr is the rupture lifetime in hours.
)log( rtCTLMP +=

Larson-Miller Parameter for an Iron Alloy
10
100
1000
12 17 22 27 32
)(10x)log20( 3 hKtT r ⋅+
Stre
ss (M
Pa)
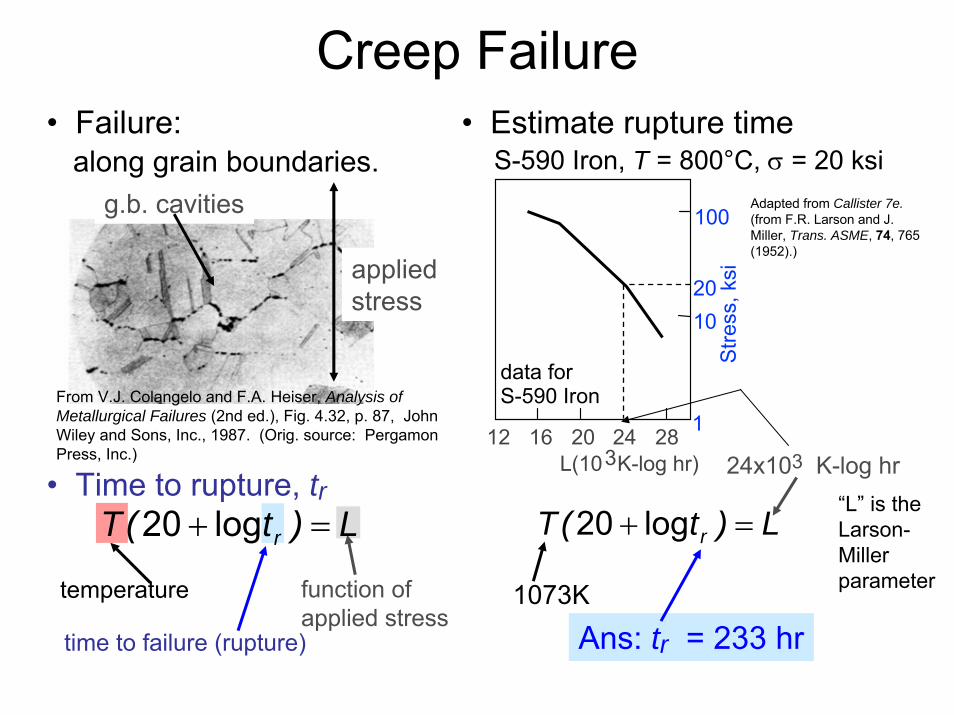
Creep Failure• Estimate rupture time
S-590 Iron, T = 800°C, σ = 20 ksi• Failure:
along grain boundaries.
time to failure (rupture)
function ofapplied stress
temperature
L)t(T r =+ log20
appliedstress
g.b. cavities
• Time to rupture, tr
From V.J. Colangelo and F.A. Heiser, Analysis of Metallurgical Failures (2nd ed.), Fig. 4.32, p. 87, John Wiley and Sons, Inc., 1987. (Orig. source: PergamonPress, Inc.)
L)t(T r =+ log20
1073K
Ans: tr = 233 hr
24x103 K-log hr
Adapted from Callister 7e.(from F.R. Larson and J. Miller, Trans. ASME, 74, 765 (1952).)
L(103K-log hr)
Stre
ss, k
si
100
10
112 20 24 2816
data for S-590 Iron
20
“L” is the Larson-Miller parameter

Considering a Problem:
• S-590 steel subject to stress of 55 MPa• Using Data in L vs stress plot, L ≈ 26.2x10³
• Determine the temperature for creep at which the component fails at 200 hours
( )
( ) ( )3
20 log
26.2 10 117520 log 20 log(200)
902
r
r
T t L
LT Kt
T C
+ =
×= = ≈+ +
=
o
o
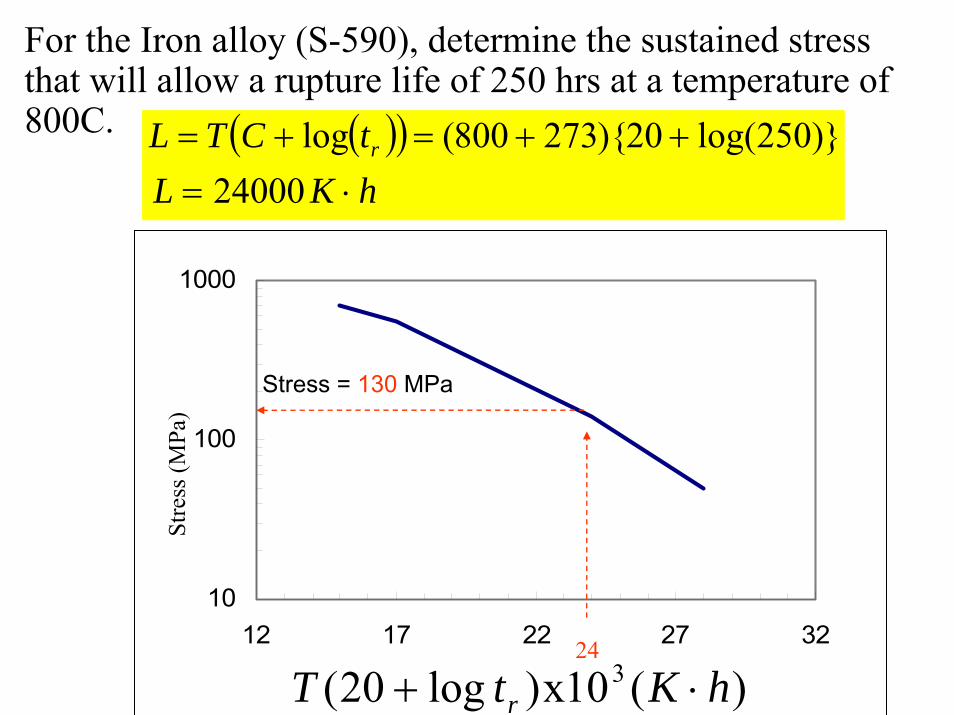
For the Iron alloy (S-590), determine the sustained stress that will allow a rupture life of 250 hrs at a temperature of 800C. ( )( )
hKLtCTL r
⋅=++=+=
24000)}250log(20){273800(log
10
100
1000
12 17 22 27 32
)(10x)log20( 3 hKtT r ⋅+
Stre
ss (M
Pa)
Stress = 130 MPa
24

The stress-temperature dependence of the steady-state creep rate can be described by
⎟⎠⎞
⎜⎝⎛−σ=ε
RTQexpK cn
2s&
where Qc is the activation energy for creep, K2 and n are material constants.
Mechanisms of Creep
Different mechanisms are responsible for creep in different materials and under different loading and temperature conditions. The mechanisms include:
Stress-assisted vacancy diffusion
Grain boundary diffusionGrain boundary slidingDislocation motion
Different mechanisms result in different values of n, Qc.
Grain boundary diffusion
Dislocation glide and climb

Alloys for high-temperature use(turbines in jet engines, hypersonic airplanes, nuclear reactors, etc.)
Creep is generally minimized in materials with:High melting temperatureHigh elastic modulusLarge grain sizes (inhibits grain boundary sliding)
The following materials are especially resilient to creep:Stainless steelsRefractory metals (containing elements of high melting point, like Nb, Mo, W, Ta) “Superalloys” (Co, Ni based: solid solution hardening and secondary phases)
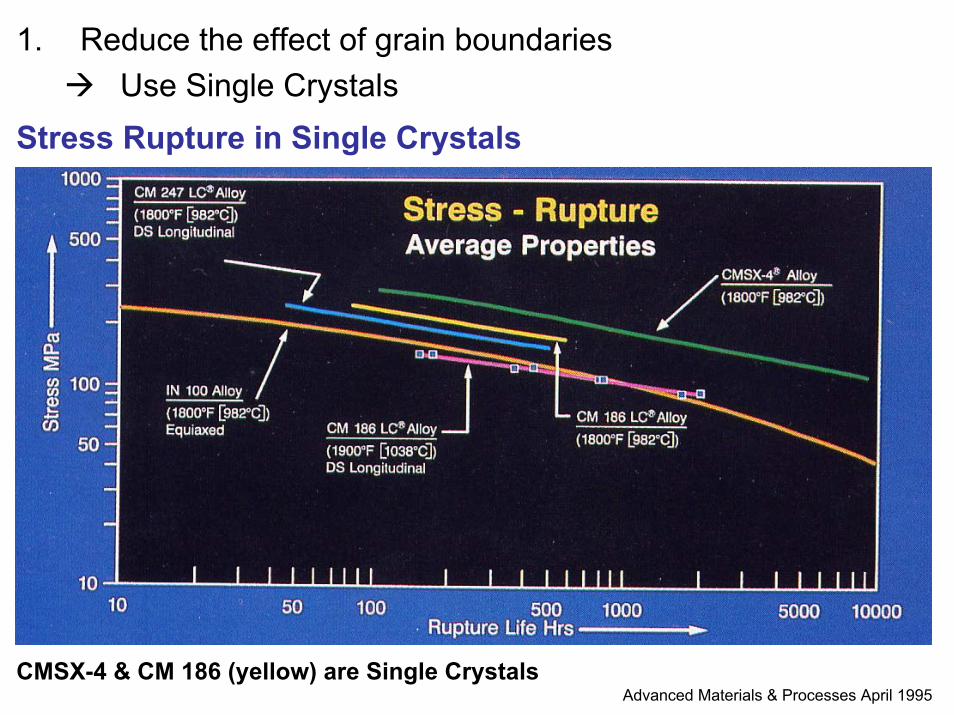
1. Reduce the effect of grain boundariesUse Single Crystals
Stress Rupture in Single Crystals
CMSX-4 & CM 186 (yellow) are Single CrystalsAdvanced Materials & Processes April 1995

Where Does Creep Occur?• Combustion chambers (gas & oil fired furnaces)• Pressurized piping (steam power plants, nuclear plants, heat exchangers)• Blades and components in gas turbines (Jet engines, power plant turbines)• Polymeric systems
http://www.moelleraircraft.com/airfoil2.htm
David Woodford http://www.creeprupture.com/paper1.htm
Semi-Log DataCreep Rupture
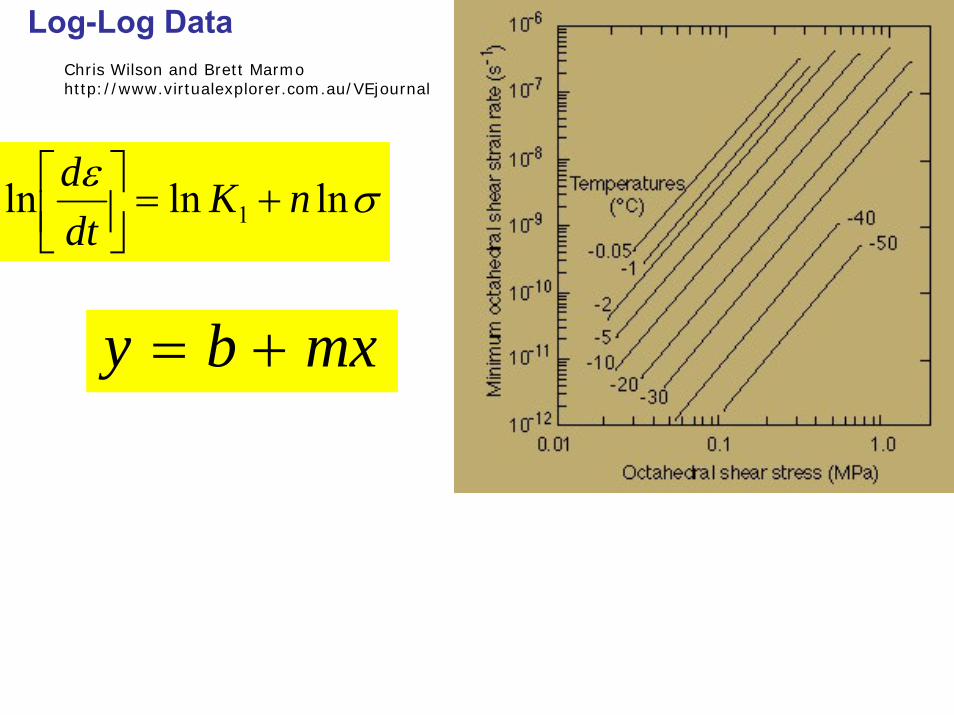
Log-Log DataChris Wilson and Brett Marmohttp://www.virtualexplorer.com.au/VEjournal
σε lnlnln 1 nKdtd
+=⎥⎦⎤
⎢⎣⎡
mxby +=
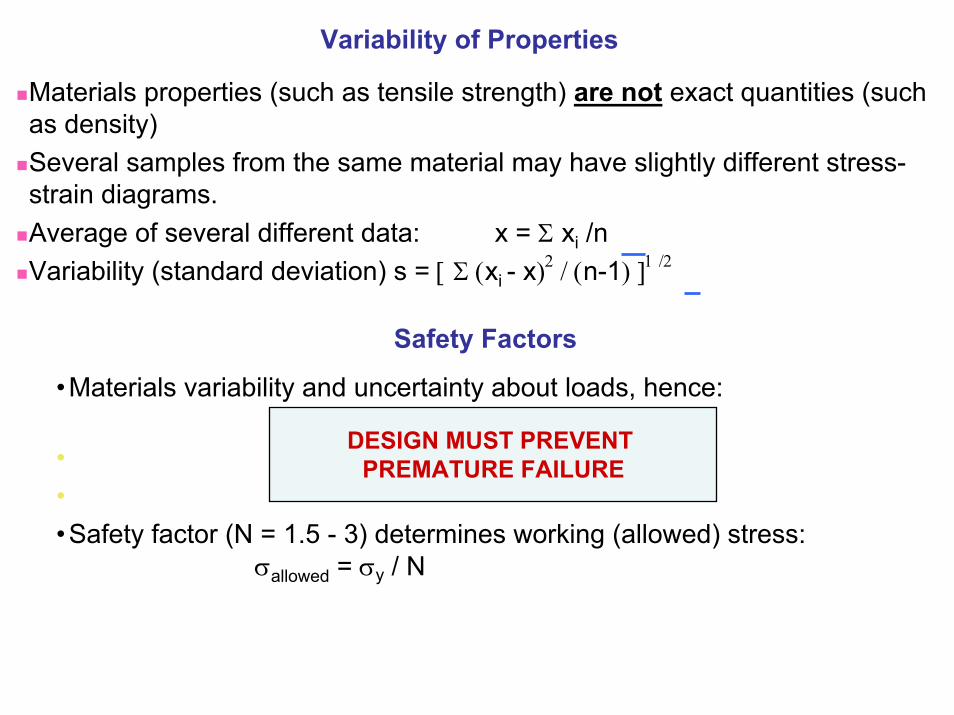
•Materials variability and uncertainty about loads, hence:
•••Safety factor (N = 1.5 - 3) determines working (allowed) stress:
σallowed = σy / N
Safety Factors
Materials properties (such as tensile strength) are not exact quantities (such as density)Several samples from the same material may have slightly different stress-strain diagrams.Average of several different data: x = Σ xi /nVariability (standard deviation) s = [ Σ (xi - x)2 / (n-1) ]1 /2
Variability of Properties
DESIGN MUST PREVENT PREMATURE FAILURE