Embed Size (px)
Citation preview

1
Joint Advanced Materials & Structures Center of Excellence www.jams-coe.org
Fatigue Damage Growth Rate of Sandwich Structures using Single Cantilever Beam (SCB) Test
John Tomblin, Waruna Seneviratne, Shawn Denning Wichita State University
Wichita, Kansas
ABSTRACT
Fluid-ingression phenomenon in composite structures is a concern for sandwich structural details. Inadequate design details and/or poor material selections can result in microcracks during ground-air-ground (GAG) cycling that consequently coalesce to form transverse matrix cracks that lead to moisture ingression into the subsequent composite and adhesive layers and finally into the core. Impact damages on sandwich structures exacerbate the fluid-ingression phenomenon as a result of localized transverse cracks, delaminations, disbonds, and core damages. Thermo-mechanical loads during GAG cycling could cause the local buckling on compression side of a sandwich structure that result in localized mode I stresses that may result in further delamination/disbond growth creating more passageways for fluid migration. Additionally, the trapped water in sandwich cells translate into vapor during high temperatures and increase the internal pressure and cause core disbond and/or fracture. In some cases, the damage growth due to the above-mentioned two mechanisms is stable and occurs over a period of several flights, but may not be readily detected on the ground, when the thermo-mechanical and internal vapor pressure loads are released. Although the damage size continues to grow in such cases, the structure continues to carry loads until it reaches a critical damage threshold (CDT), where the unstable damage growth triggers the catastrophic failure. Unless such damage is detected and repaired prior to reaching CDT, GAG effects will further the damage size and threaten the structural integrity and safety of the aircraft. The influence of sandwich parameters such as core size, density, and facesheet/core stiffness ratio on the onset and damage growth rate of sandwich composites was investigated using single-cantilever beam (SCB) static and fatigue testing for Mode I fracture toughness of core-facesheet disbond. In order to investigate the influence of fluid ingression and entrapped fluids in sandwich structures, test specimens were conditioned in a hydraulic oil (Skydrol) and water mixture. Baseline specimens are tested as fabricated with no drying or additional fluid ingression. Fluid-ingressed specimens were conditioned either in a Skydrol-water solution or in a water bath. Standard Skydrol-water fluid ingression was for 45 days, while it was 165 days for extended fluid-ingressed specimens. Water-ingressed specimens were conditioned in a de-ionized water bath for 45 days. The information gathered through this research will be instrumental in developing analytical methods and validating finite element analysis procedures to further investigate the damage growth mechanics of sandwich composite structures.
KEY WORDS: progressive damage growth, sandwich, GAG cycle, fluid ingression, fatigue

2
Joint Advanced Materials & Structures Center of Excellence www.jams-coe.org
1. INTRODUCTION Over the past 25 years, the use of advanced composite materials in aircraft primary structures has increased significantly. In 1994, with the Advanced General Aviation Transport Experiments (AGATE) program, the National Aeronautics and Space Administration (NASA) and the Federal Aviation Administration (FAA) revitalized the use of composites in general and commercial aviation. Driven by the demand for fuel-efficient, light-weight, and high-stiffness structures that have fatigue durability and corrosion resistance, modern large commercial aircraft are designed with more than 50 percent composite materials. Although there are key differences between metal and composite damage mechanics and durability concerns, the certification philosophy for composites must meet structural integrity, safety, and durability requirements. Despite the many advantages, composite structural certification becomes challenging due to the lack of experience in large-scale structures, complex interactive failure mechanisms, sensitivity to temperature and moisture, and scatter in the data, especially in fatigue.
Current research tasks are designed to investigate the fluid ingression phenomenon in sandwich structures and resulting progressive damage growth due to ground-air-ground cycling. Inadequate design details and/or poor material selections as well as operational damages can cause fluid ingression into core. Impact damages on sandwich structures exacerbate the fluid-ingression phenomenon as a result of localized transverse cracks, delaminations, disbonds, and core damages. Thermo-mechanical loads during GAG cycling could cause the local buckling on compression side of a sandwich structure that result in localized mode I stresses that may result in further delamination/disbond growth creating more passageways for fluid migration. Additionally, the trapped water in sandwich cells changes phase to vapor during high temperatures and increase the internal pressure and cause core disbond and/or fracture. In some cases, the damage growth due to the above-mentioned two mechanisms is stable and occurs over a period of several flights, but may not be readily detected on the ground, when the thermo-mechanical and internal vapor pressure loads are released. Although the damage size continues to grow in such cases, the structure continues to carry loads until it reaches a critical damage threshold (CDT), where the unstable damage growth triggers the catastrophic failure. Unless such damage is detected and repaired prior to the reaching CDT, GAG effects will further the damage size and threaten the structural integrity and safety of the aircraft. The primary objective of the current research program is to provide guidance for demonstrating durability and damage tolerance of sandwich composite structures against fluid ingression and GAG cycle effects as shown in Figure 1. The influence of sandwich parameters such as core size, density, and facesheet/core stiffness ratio on the onset and damage growth rate of sandwich composites will be investigated using single-cantilever beam (SCB) static and fatigue testing for Mode I fracture toughness of core-facesheet disbond.
2. EXPERIMENTAL PROCEDURE
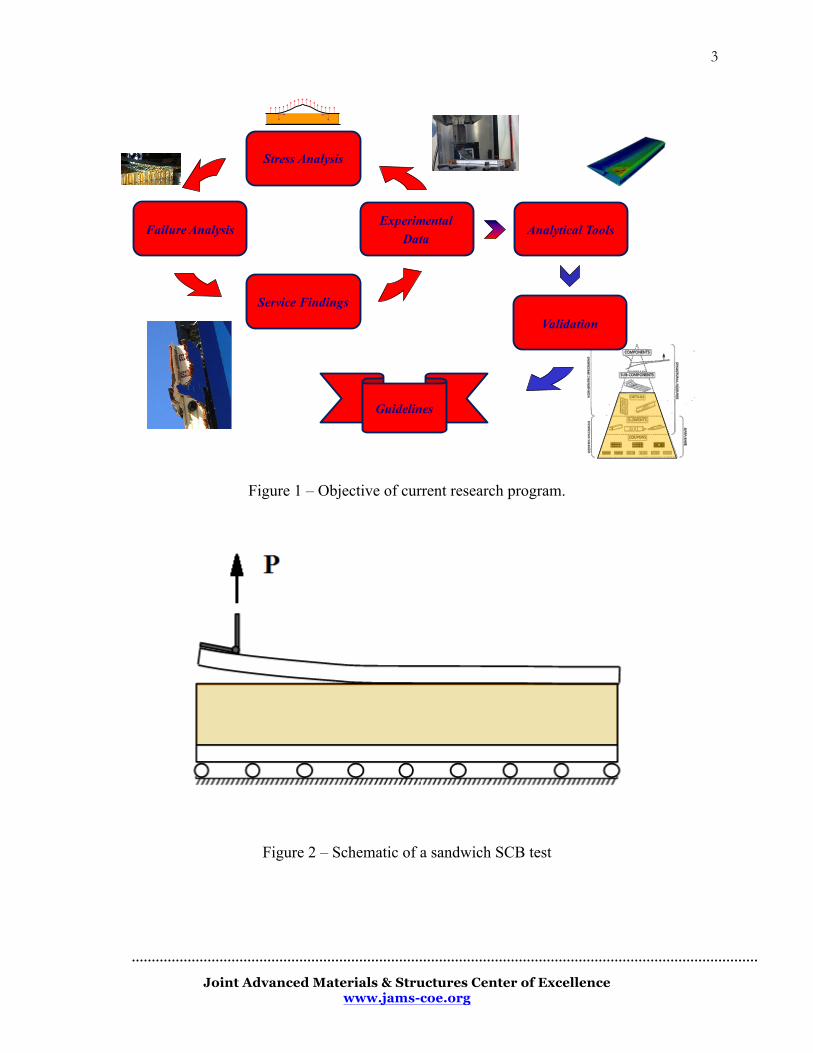
2.1. Sandwich Single-‐Cantilever Beam Test. The primary difference between sandwich SCB and DCB test configurations is the fact that the underside of the SCB specimen is secured to a rigid base, while the top facesheet is loaded out of-plane (Mode I) as shown in Figure 2.
3
Joint Advanced Materials & Structures Center of Excellence www.jams-coe.org
Figure 1 – Objective of current research program.
Figure 2 – Schematic of a sandwich SCB test
Stress Analysis
Failure Analysis
Service Findings
Analytical ToolsExperimental
Data
Validation
Guidelines
4
Joint Advanced Materials & Structures Center of Excellence www.jams-coe.org
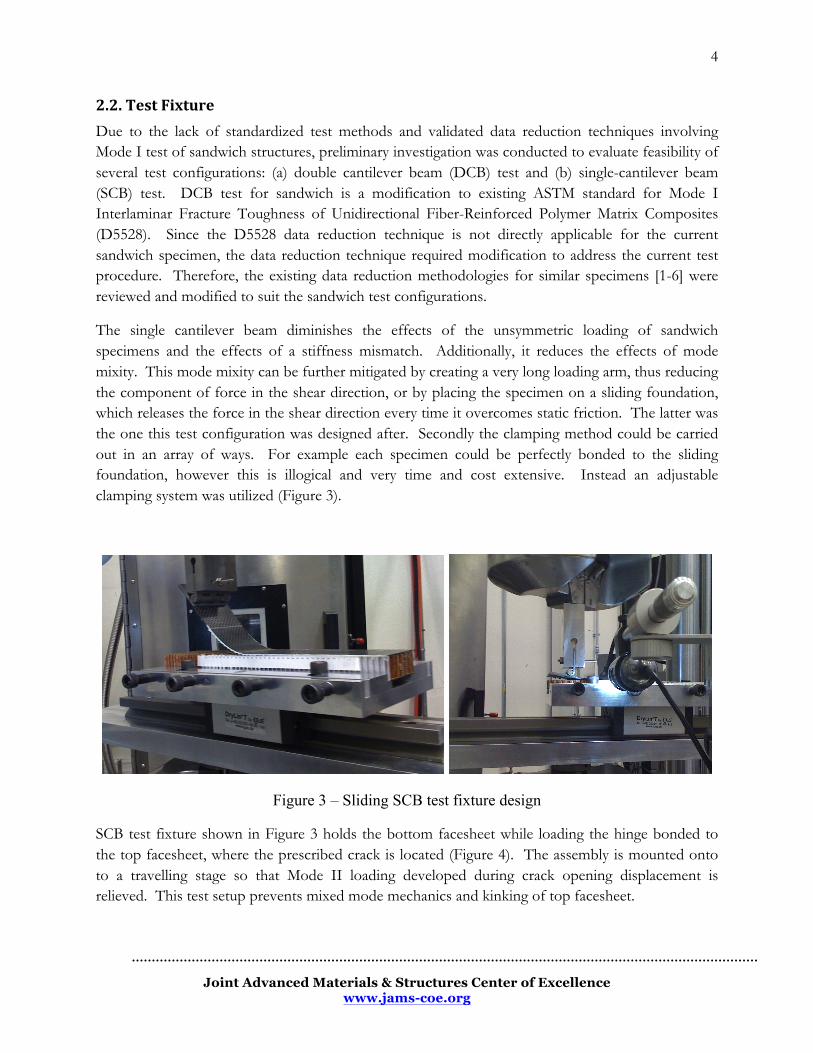
2.2. Test Fixture Due to the lack of standardized test methods and validated data reduction techniques involving Mode I test of sandwich structures, preliminary investigation was conducted to evaluate feasibility of several test configurations: (a) double cantilever beam (DCB) test and (b) single-cantilever beam (SCB) test. DCB test for sandwich is a modification to existing ASTM standard for Mode I Interlaminar Fracture Toughness of Unidirectional Fiber-Reinforced Polymer Matrix Composites (D5528). Since the D5528 data reduction technique is not directly applicable for the current sandwich specimen, the data reduction technique required modification to address the current test procedure. Therefore, the existing data reduction methodologies for similar specimens [1-6] were reviewed and modified to suit the sandwich test configurations.
The single cantilever beam diminishes the effects of the unsymmetric loading of sandwich specimens and the effects of a stiffness mismatch. Additionally, it reduces the effects of mode mixity. This mode mixity can be further mitigated by creating a very long loading arm, thus reducing the component of force in the shear direction, or by placing the specimen on a sliding foundation, which releases the force in the shear direction every time it overcomes static friction. The latter was the one this test configuration was designed after. Secondly the clamping method could be carried out in an array of ways. For example each specimen could be perfectly bonded to the sliding foundation, however this is illogical and very time and cost extensive. Instead an adjustable clamping system was utilized (Figure 3).
Figure 3 – Sliding SCB test fixture design
SCB test fixture shown in Figure 3 holds the bottom facesheet while loading the hinge bonded to the top facesheet, where the prescribed crack is located (Figure 4). The assembly is mounted onto to a travelling stage so that Mode II loading developed during crack opening displacement is relieved. This test setup prevents mixed mode mechanics and kinking of top facesheet.

5
Joint Advanced Materials & Structures Center of Excellence www.jams-coe.org
2.3. Specimen Design. While testing the four ply facesheet specimens exceptionally large displacements were encountered. The correction factor (F) in D5528 could properly adjust the GIC, however it does not adjust the corresponding displacements. Since the nonlinear displacements are required to properly determine the maximum and minimum displacements for cyclic loading, an additional adjustment was needed and discussed in reference [7].
To reduce the large deflection and attain an accurate nonlinear displacement the coupons were resized to reduce the prescribed crack length. This would prolong the onset of large deflection as long as the prescribed crack length was still long enough to ensure bending was the primary form of loading. The methods presented in reference [8] were utilized in determining modified prescribed crack length (ao) of the shortened specimens. A new prescribed crack length of one inch was selected and these specimens are known as “shortened” and are represented in the master summary with an asterisk and the data is italicized.
Figure 4 – Sandwich SCB specimen geometry
Due to the complex damage mechanics, a detail failure analysis was conducted upon failure of test specimens. Preliminary tests conducted on sandwich specimens indicated that the failure initiation can occur either along the bondline (cohesive failure) or core fracture right below the fillet (core failure). Although it possible that the crack could initiate through the composite facesheet (facesheet failure), it is unlikely given that the facesheet fracture toughness is significantly higher than that of the core. Further, the preliminary tests revealed that there were two possible primary progressive fracture paths as shown in Figure 5:

6
Joint Advanced Materials & Structures Center of Excellence www.jams-coe.org
1. Crack propagates along the bondline (debond) or core failure right below the fillets. Thus, the crack propagates along the facesheet, where it was initiated at.
2. Crack propagates along the facesheet for a short distance and migrates into the core and propagates through the core.
In addition to these two primary failure modes, the following secondary failure modes were observed as well.
1. Adhesive pullout: flatwise tensile failure of the adhesive underneath the fillet region 2. Core pullout or adhesive failure of cell wall interface 3. Crack propagates along the facesheet for a short distance and core rupture through the
thickness due to kinking of bottom facesheet and crack propagates along the opposite facesheet on DCB specimens
4. Delamination of facesheet (not common)
Due to the complex nature of progressive damage growth, any combination of the above mentioned primary failure modes are possible. Detailed failure modes for sandwich specimen configurations studies under this investigation are discussed in the results section of this report.
Figure 5 – Primary progressive fracture paths for sandwich structures
2.4. Test Matrix. Experiments proposed in the current task were carried out using Cytec AS4/E7K8 plain weave facesheets bonded to Hexcel HexWeb HRH-10 aramid fiber/phenolic honeycomb using Cytec

7
Joint Advanced Materials & Structures Center of Excellence www.jams-coe.org
FM300 film adhesive. Table 1 shows the test matrix for determining the Mode I fracture toughness of sandwich specimens using SCB test configuration. Test matrix includes both as fabricated (baseline) and fluid-ingressed specimens. Fluid-ingressed specimens were conditioned in a water and Skydrol LD-4 hydraulic-oil mixture. As shown in Table 1, two different core types (hexagonal of HEX and over-expanded or OX), three different cell sizes (1/8, 3/16, and 3/8 inch), and three different core densities (2, 3, and 6 pcf) were selected with two different facesheet thicknesses (4 and 16 plies).
Test matrix was reduced so that a design of experiment (DOE) model can be used for evaluating other (untested) combinations within the design space considered in Table 1.
Sandwich SCB specimens are 2x10-inch with a prescribed length (ao) of 2.5 inches. For several sandwich configurations, specimens with an ao of 1 inch were included after the original prescribed crack length was outside the recommended envelop according to the recommendations in reference [8].
2.5. Environmental Conditioning. Baseline specimens were tested as fabricated with no drying or additional fluid ingression. Fluid-ingressed specimens were conditioned in a Skydrol-water solution for 45 days.
When hydraulic oil was mixed with water and exposed to elevated temperatures, i.e., above 120°F, for an extended period of time, a chemical reaction released phosphoric acid, which deteriorated the adhesive interface in the bonded structures. Aircraft control surfaces that extensively use sandwich structures are frequently exposed to hydraulic oil, and the above-mentioned conditions are highly probable. Therefore, it was vital to determine the effect of this volatile mixture on exposed sandwich structures.
In order to produce a viable solution, water and Skydrol were mixed in a 50:50 ratio by volume, placed in an elevated temperature of 160°F for preconditioning, and agitated for two weeks. Then, the mixture was kept at room temperature and the acidity level monitored daily. During preconditioning, the elevated temperature acted as a catalyst and accelerated the chemical reaction that produced phosphoric acid. Following preconditioning, the solution maintained a steady pH level of around 3 at room temperature, indicating a stable fluid mixture for conditioning the fluid-ingressed specimens (Figure 6).
2.6. Test Procedure. A new procedure was developed modifying the existing procedure for testing laminate DCB specimens. The static test procedure was based very closely on the ASTM standard for Mode I Interlaminar Fracture Toughness of Unidirectional Fiber-Reinforced Polymer Matrix Composites (D5528). Excluding the test specimen configuration (SCB vs. DCB) and data reduction method, the test procedures are nearly identical.

8
Joint Advanced Materials & Structures Center of Excellence www.jams-coe.org
Table 1 – Sandwich SCB test matrix.
Core Material
Core Type
Core Thickness
(in)
Facesheet Layup
Cell Size [in]
Core Density [lb/ft3]
Number of Fatigue Test Specimens
Baseline Fluid-
Ingressed
HRH-10
HX 0.5
4-ply [0/45]S
1/8
2.0*
3.0* 6 6
6.0*
3/16
2.0* 6 6
3.0* 6 6
6.0* 6 6
3/8
2.0*
3.0* 6 6
6.0*
16-ply [0/45]4S
1/8
2
3 6 3
3** 4
6
3/16
2 6 1
2** 6
3 6 3
3** 5
6 6 4
6** 4
3/8
2
3 6 6
6
OX 0.5
4-ply 3/16
2
3 6 6
6
16-ply 3/16
2
3 6 6
6
Total Specimens 150
Note: * ao = 1 inch
** �max from static FI results

9
Joint Advanced Materials & Structures Center of Excellence www.jams-coe.org
Figure 6 – Acidity of the Skydrol-water mixture after 2-week precondition.
3. DATA REDUCTION
3.1 Damage Growth Rate Derivation. The damage growth rate, or da/dn, was determined by dividing the change in crack length by the change in cycle count, where the cycle count is prescribed by the above inspection schedule [9]:
ii
ii
nnaa
dnda
−
−=
+
+
1
1 (1)
3.2 GImax Derivation. Strain energy release rate (SERR) was determined using the modified beam-bending theory and was derived in volume one of this report. The only difference was the use of an average crack length [9]:
( )av
ax abPG
Δ+=23 maxmax
Imδ
(2)
0
2
4
6
8
10
12
14
0 50 100 150 200 250 300
pH L
evel
Days @ Room Teperature Ambient after Precondition

10
Joint Advanced Materials & Structures Center of Excellence www.jams-coe.org
where
( )ii aaa += +121
(3)
The correction factor F was not used.
3.3 Shaping Parameters of Paris Region. The crack growth rate (da/dn) and strain energy release rate (GImax) were then plotted on a logarithmic scale, as shown in Figure 7. The corresponding plot was divided into three regions. The first region represents no growth and consists of any loading that results in an SERR less than the threshold SERR, or GIth. The third region signifies instant failure and constitutes any loading that results in an SERR that exceeds the critical SERR, or GIC. The second or middle region is of most interest, because it characterizes stable crack growth. This region is often referred to as the Paris region and consists of all loadings that result in an SERR between GIth and GIC.
Figure 7 – Log plot of da/dn vs. GImax
The Paris region is characterized with a power curve consisting of two shaping parameters, m and B [9]:
maxGRB
dnda ])1[( Im−= (4)
where:
01.2max
2min
max
min =⎟⎟⎠
⎞⎜⎜⎝
⎛==
δδ
GGR (5)

11
Joint Advanced Materials & Structures Center of Excellence www.jams-coe.org
Therefore (1-R) is neglected and the final equation takes the form:
maxBG
dnda
Im= (6)
This program determined the shaping parameter, m, and presents those findings. The shaping parameter, B, was also determined and can be found in the appendices.
Three distinct solutions for the shaping parameter, m, were determined:
• A curve fit was applied to each specimen’s data, and the corresponding shaping parameters for each set of data (typically six specimens per set) were averaged. This was called the average “individual” shaping parameter, m.
• A curve fit was applied to the entire set of specimen data. This was called the average “all” shaping parameter, m.
• Each specimen’s data was linearly interpolated with respect to predetermined GImax’s (GImax = 10 x i, where i= 1,2,3…and GImax was in [j/m2]), and those results were averaged for each distinct GImax (as long as at least two specimens were accounted for). This was called the average “interpolated” shaping parameter, m.
4. RESULTS AND DISCUSSION
Table 2 shows the shaping parameter, m, obtained for different sandwich parameters and environmental conditions [10]. Figures 7 through 10 show a graphical comparison of these results. Test data includes the shaping parameter, m, for different facesheet thicknesses, core types, cell sizes, core densities, and environments. It is important to note that several other variables can contribute to the shaping parameter, m, such as ribbon direction, fabrication technique, prescribed crack location with respect to cell walls, etc. Therefore, the discussion and conclusions here are solely based on the results included in this report. Detailed results including failure modes are found in reference [10] for 4-ply HX, 16-ply HX, 4-ply OX, and 16-ply OX, respectively.
Although the master summary tables and charts show a comparison of the shaping parameter, m, the effects of the aforementioned variables are coupled across different variables and required detailed data analysis for determining the impact of each variable. This section discusses, in detail, the impact of the following sandwich parameters on the shaping parameter, m:
a. Core type b. Cell size c. Core density d. Environmental conditioning