Embed Size (px)
Citation preview

Jurnal Mekanikal June 2006, No. 21, 1 - 15
1
FATIGUE BEHAVIOUR OF 6000 SERIES ALUMINUM ALLOYS ON CYLINDER BLOCK OF A FREE PISTON LINEAR ENGINE
USING TOTAL LIFE APPROACH
M. M. Rahman A. K. Ariffin
B. N. Jamaludin C. C. H. C. Haron
Computational and Experimental Mechanics Group
Department of Mechanical and Materials Engineering Faculty of Engineering
Universiti Kebangsaan Malaysia 43600 UKM, Bangi, Selangor DE, Malaysia.
Phone: +6-03-89216012, Fax: +6-03-89216040 E-mail: [email protected], [email protected]
ABSTRACT Finite element based fatigue and damage behaviour of 6000 series aluminum alloys (range AA6009-T6 to AA6951-T6) on cylinder block of two-stroke free piston linear engine has been investigated in this paper. The finite element modeling and analysis have been performed using finite element analysis software and the fatigue life prediction was carried out using finite element based fatigue analysis commercial codes. Fatigue total life approach was used when the piston is subjected to constant and variable amplitude loading. Constant-amplitude and variable amplitude loading were performed at different loading conditions. The effects of mean stress and sensitivity analysis on fatigue life of aluminum alloys are discussed. From the results, it is shown that the Goodman mean stress correction method is more conservative life prediction. This paper also describes the effect of material and component S-N approach. The result is a life contour, showing how long each area of a mounting will survive under the defined loading conditions. The results showed contour plots of fatigue life and fatigue damage at most damaging case. Key Words: Total life, material S-N, component S-N, constant amplitude, variable
amplitude loading.
1.0 INTRODUCTION In developing process for a new free piston engine, the appropriate criterion for durability design should be on consideration of actual service environments. In two-stroke free piston engine [1], two horizontally opposed pistons are mounted on a common connecting rod, which is allowed to oscillate between the two end-mounted cylinders. Each piston will move in a head that is closed on the outer end and open on the inner end. In most of the past research [1-2] on the engine, combustion occurs in both cylinder, in order to get the linear movement of the

Jurnal Mekanikal, June 2006
2
piston. For this linear engine, crank and camshaft will be eliminated, where there will be no rotary movement involved. Additionally, the linear system of the engine should prove to be more efficient as the frictional losses associated with the crack and rod bearings are eliminated. However, Aichlmayr [2] has determined that a single piston engine with rebound device has developed an unbalanced situation and this need to be encountered for this new two-stroke free piston engine.
Cylinder block of two-stroke free piston engine structures are very commonly subjected to fatigue loading. Fatigue durability has long been important issues in the design of free piston engine structures [3]. Durability calculations derived from the finite element analysis (FEA) provide the foundation for predicting product performance throughout the entire design to manufacturing process and into the hands of customers. Better, stronger, lighter, safer, and less costly; in less time have been available through simulation. Fatigue analysis for the design of modern structures relies on techniques, which have been developed over the last 100 years or so. Today, 95% of all fatigue design calculations are covered by one of the three approaches, i.e. Total life (stress-life) approach, crack initiation approach, and/or crack propagation [4]. Furthermore, since stress, or strain are the governing variables it has been usual to test prototype components in order to obtain the required data needed for the fatigue analysis. However, with the FEA has come the possibility of doing fatigue calculations long before a prototype exists. In addition, a dramatic improvement in computing power has made finite element (FE) based fatigue life calculations a routine task.
The FE based fatigue analysis is considered to be a complete analysis of an entire component [3]. Fatigue life can be estimated for every element in the finite element model and contour plots of life or damage plotted in a similar way to stresses. Geometry information is provided by FE results for each load case applied independently, i.e. the FE results define how an applied load is transformed into a stress or strain at a particular location in the component. Appropriate material data are also provided for the desired fatigue analysis method. This process is detailed in Figure 1.
Figure 1: Finite Element based Fatigue Analysis
Materials DataFE Model
System System Inputs Model
Fatigue Life Contours
Multibody Dynamics
FE Analysis
Fatigue AnalysisComponent Load Histories
Stress& Strains

Jurnal Mekanikal, June 2006
3
The Al6000 series with suitable temper is considered to be an important cylinder block material, as it possess a good combination of strength, toughness and stress corrosion cracking resistance. Over the years attempts have been made to enhance the performance of conventional 6000 series alloy with the appropriate addition of alloying elements [5].
A computational numerical model for the fatigue life assessment for cylinder block of two-stroke free piston engine is presented in this paper. The objectives of this study is to predict the fatigue life for a cylinder block using total life method, and to investigate the effect of mean stress on fatigue life, the effect of material and component S-N approach on fatigue life and also the fatigue behavior of aluminum alloy material using total-life approach. 2.0 TOTAL-LIFE APPROACH There are several methods being postulated to safely and economically design and maintain the fatigue life of cylinder block of two-stroke free piston engine. These methods are known as stress-life (total–life) approach, crack initiation approach and crack propagation method. Traditionally, the fatigue behavior has been designed and managed using total-life method. Total-life method directly relates service loads to a safe operating life that is based on a linear representation of cumulative damage [6-7]. The stress-life approach was the first well-developed approach to fatigue analysis. It is suitable to predict high cycle fatigue and has been extensively used in the automotive industry. Fatigue life depends primarily on loads, materials, geometry and environmental effects and is usually described by S-N curves [8]. The stress-based approach considers the controlling parameter for fatigue life to be the nominal stress. The relationship between the nominal stress amplitude and the fatigue life is often represented as S-N curve, which can be expressed as [9]:
bffa N2 )(σσ ′= (1)
where aσ is the stress amplitude, fσ ′ is the fatigue strength coefficient, 2 fN is the reversals to failure and b is the fatigue strength exponent.
The stress-based approach to fatigue is typically used for life prediction of components subject to high cycle fatigue, where stresses are mainly elastic. This approach emphasizes nominal stresses rather than local stresses. It uses the material stress-life curve and employs fatigue notch factors to account for stress concentrations, empirical modification factors for surface finish effects, and analytical equations such as modified Goodman and Gerber equation to account for mean stress effects. The modified Goodman and Gerber equations are given by Equation (2) and (3) respectively.
1SS u
m
e
a =+σσ (2)
Jurnal Mekanikal, June 2006
4
12=⎟⎟
⎠
⎞⎜⎜⎝
⎛+
uSm
eSa σσ (3)
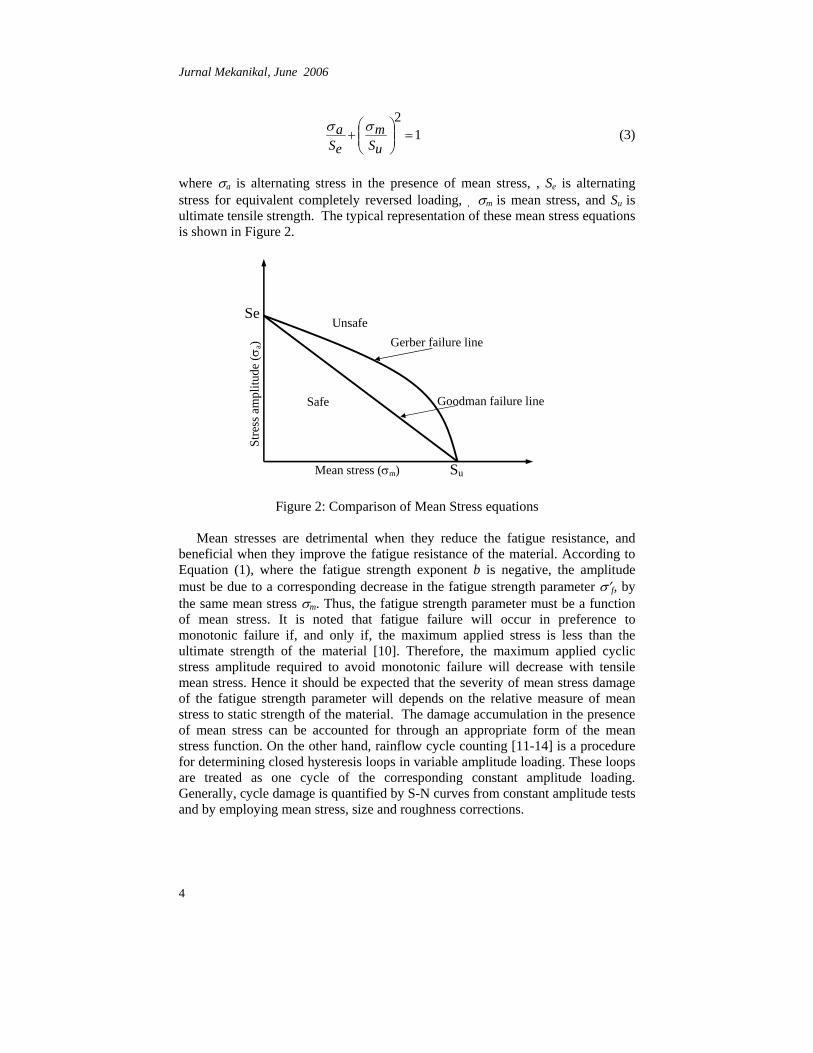
where σa is alternating stress in the presence of mean stress, , Se is alternating stress for equivalent completely reversed loading, , σm is mean stress, and Su is ultimate tensile strength. The typical representation of these mean stress equations is shown in Figure 2.
Figure 2: Comparison of Mean Stress equations Mean stresses are detrimental when they reduce the fatigue resistance, and
beneficial when they improve the fatigue resistance of the material. According to Equation (1), where the fatigue strength exponent b is negative, the amplitude must be due to a corresponding decrease in the fatigue strength parameter σ′f, by the same mean stress σm. Thus, the fatigue strength parameter must be a function of mean stress. It is noted that fatigue failure will occur in preference to monotonic failure if, and only if, the maximum applied stress is less than the ultimate strength of the material [10]. Therefore, the maximum applied cyclic stress amplitude required to avoid monotonic failure will decrease with tensile mean stress. Hence it should be expected that the severity of mean stress damage of the fatigue strength parameter will depends on the relative measure of mean stress to static strength of the material. The damage accumulation in the presence of mean stress can be accounted for through an appropriate form of the mean stress function. On the other hand, rainflow cycle counting [11-14] is a procedure for determining closed hysteresis loops in variable amplitude loading. These loops are treated as one cycle of the corresponding constant amplitude loading. Generally, cycle damage is quantified by S-N curves from constant amplitude tests and by employing mean stress, size and roughness corrections.
Goodman failure line
Se
Su
Stre
ss a
mpl
itude
(σa)
Mean stress (σm)
Safe
UnsafeGerber failure line

Jurnal Mekanikal, June 2006
5
3.0 FINITE ELEMENT MODELING In the finite element model of the cylinder block of linear generator engine, there are several contact areas (for example: cylinder head, gasket, hole for bolt, etc) concerning multi-point constraints (MPC). Therefore constraints are employed for the following purposes: (1) to specify the prescribed enforce displacements, (2) to simulate the continuous behavior of displacement in the interface area, (3) to enforce rest condition in the specified directions at grid points of reaction. Because of the complexity of geometry and loading on the cylinder block, a 3D FE model was adopted which as shown in Figure 3. The loading and constraints on the cylinder block are shown in Figure 4. A linear static analysis was carried out on the cylinder block.
Figure 3: 3D Finite Element Model
Figure 4: Loading and Constraints.
Constraints (Bolt)
Pressure (7 MPa)
Constraints (Bolt)
Preload on bolt (0.3 MPa)
Gasket pressure (0.3 MPa)
Figure 4: Loading and Constraints
Jurnal Mekanikal, June 2006
6
Three-dimensional model geometry was developed in CATIA software. A parabolic tetrahedron element was used for the solid mesh. Sensitivity analysis was performed to obtain the optimum element size. These analyses were performed iteratively at different element lengths until the solution obtained appropriate accuracy. Convergence of stresses was observed, as the mesh size was successively refined. The element size of 0.20 mm was finally considered. A total of 35415 elements and 66209 nodes were generated at 0.20 mm element length. Compressive loads were applied as pressure (7 MPa) on the surface of combustion chamber and preload were applied as pressure (0.3 MPa) on the bolt hole surfaces, and preload were also applied on the gasket surface as pressure (0.3 MPa). The constraints were applied on the bolt-hole for all six degree of freedom. Multi-point constraints [15] were used to connect the parts thru the interface nodes. This MPCs were acting as an artificial bolt and nut that connect each parts of the structure. Each MPCs will be connected using Rigid Body Element (RBE) that allow users to indicate the independent and dependent nodes. From the viewpoint of machine engine, the bolts were constrained to the head, at their top end, and to the block, at their bottom end. In this situation with no loading configuration, at the bottom end of the bolt head hole, RBE element with six-degrees of freedom were assigned with the independent node was created from cylinder block properties.
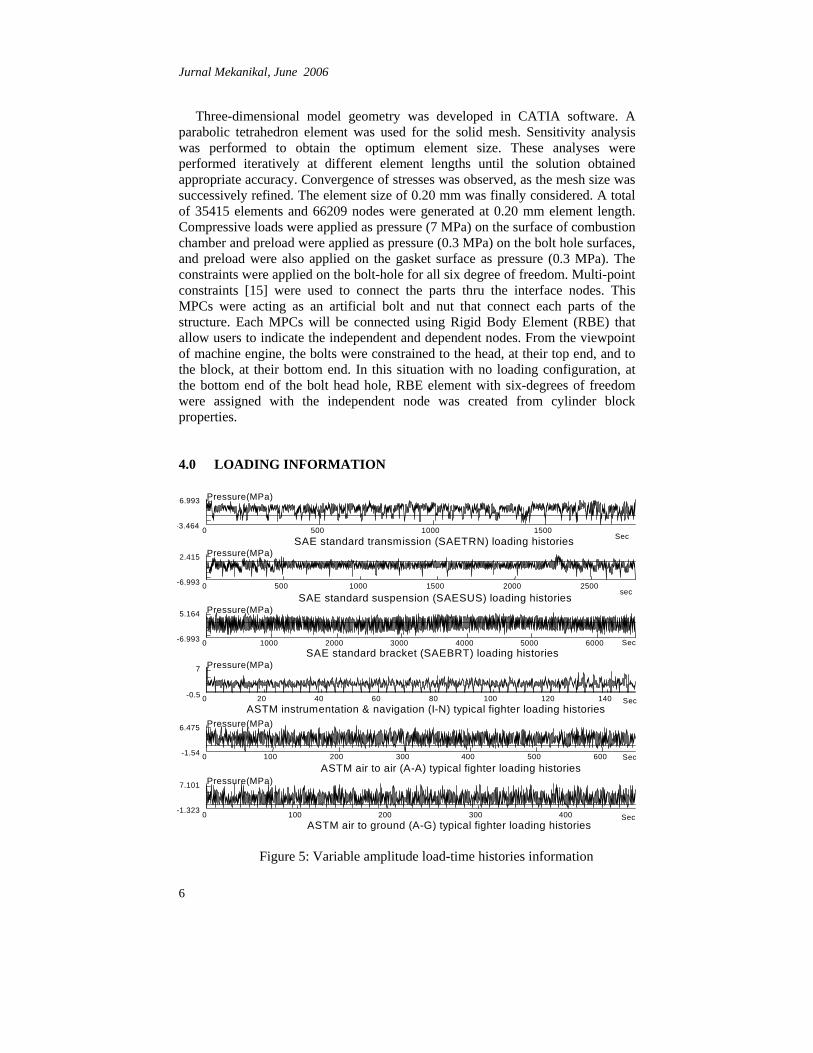
4.0 LOADING INFORMATION
0 500 1000 1500-3.464 6.993 Pressure(MPa)
Sec SAE standard transmission (SAETRN) loading histories
0 500 1000 1500 2000 2500 -6.993 2.415 Pressure(MPa)
sec SAE standard suspension (SAESUS) loading histories
0 1000 2000 3000 4000 5000 6000 -6.993 5.164 Pressure(MPa)
SAE standard bracket (SAEBRT) loading historiesSec
0 20 40 60 80 100 120 140 -0.5 7 Pressure(MPa)
ASTM instrumentation & navigation (I-N) typical fighter loading histories Sec
0 100 200 300 400 500 600 -1.54 6.475 Pressure(MPa)
ASTM air to air (A-A) typical fighter loading histories Sec
0 100 200 300 400 -1.323 7.101 Pressure(MPa)
ASTM air to ground (A-G) typical fighter loading histories Sec
Figure 5: Variable amplitude load-time histories information

Jurnal Mekanikal, June 2006
7
Several types of variable amplitude loading history were selected from the SAE and ASTM profiles for the FE based fatigue analysis. The detailed information about these histories is given in the literature [16]. The variable amplitude load-time histories are shown in Figure 5. The terms of SAETRN, SAESUS, and SAEBRAKT represent the load-time history for the transmission, suspension, and bracket respectively. The considered load-time histories are based on the SAE’s profile. In addition, I-N, A-A, and A-G are represent the ASTM instrumentation & navigation typical fighter, ASTM air to air typical fighter, and ASTM air to ground typical fighter loading history, respectively [3]. The abscissa is the time, in seconds. Constant amplitude fully reversed sinusoidal (CAFRS) loading history as shown in Figure 6 is also considered in this study.
8
-8 10
Pres
sure
(MPa
)
Time (seconds)
Figure 6: Constant amplitude fully reversed sinusoidal load. 5.0 MATERIAL INFORMATION
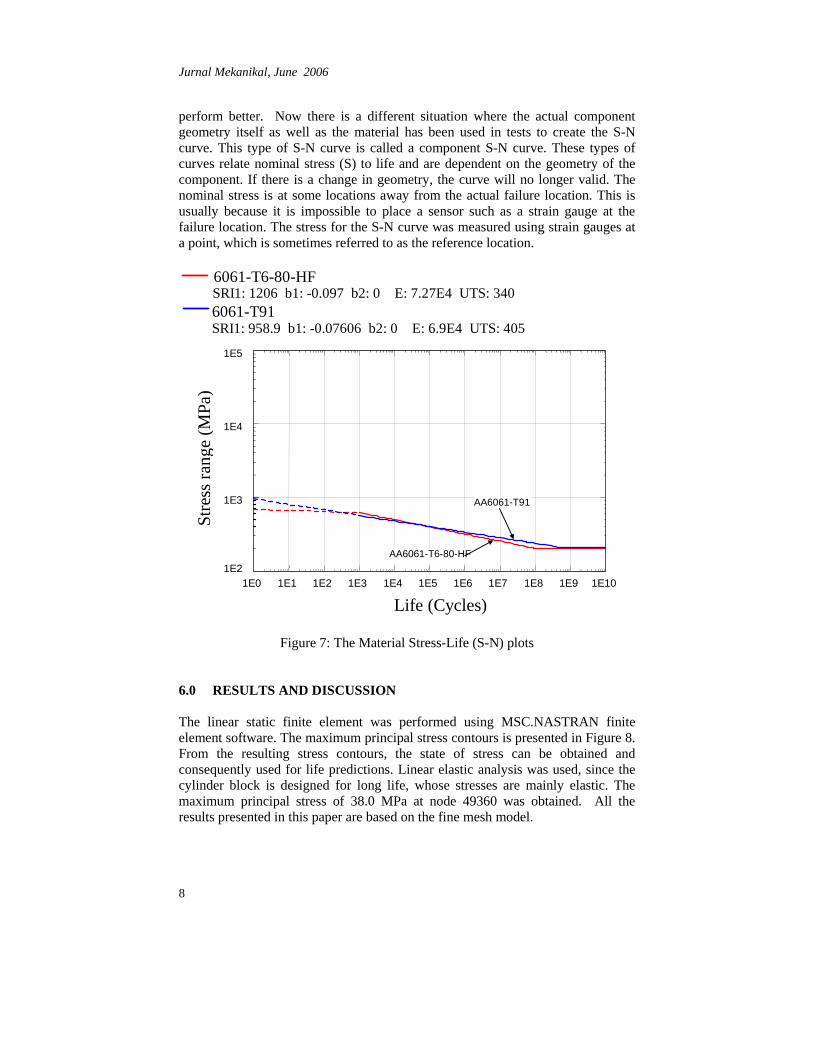
The Material data is one of the major input and is the definition of how a material behaves under the cyclic loading conditions it typically experiences during service operation. The materials parameters required depend on the analysis methodology being used. Figure 7 shows S-N behaviour of AA6061-T6-80-HF and AA6061-T91. This S-N curve is called material S-N curve that represents material and is independent of geometry. The dashed line portion of the S-N curve is invalid because conventional S-N curve are drawn from the life (cycles to failure) 103 but Figure 6 is drawn from the cycle 1. The S-N fatigue analysis method is generally only good for high cycle fatigue problems, meaning that the number of the cycles to failure is generally very high. Another region of the curve is the “cut-off” region where the endurance limit is defined. Anything beyond this limit will be reported back as being over the “cut-off” or infinite life. It can also be seen that these curves cross each other and therefore exhibit different life behaviour depending on the stress range experienced. So it is difficult to say, which would
Jurnal Mekanikal, June 2006
8
perform better. Now there is a different situation where the actual component geometry itself as well as the material has been used in tests to create the S-N curve. This type of S-N curve is called a component S-N curve. These types of curves relate nominal stress (S) to life and are dependent on the geometry of the component. If there is a change in geometry, the curve will no longer valid. The nominal stress is at some locations away from the actual failure location. This is usually because it is impossible to place a sensor such as a strain gauge at the failure location. The stress for the S-N curve was measured using strain gauges at a point, which is sometimes referred to as the reference location.
Figure 7: The Material Stress-Life (S-N) plots 6.0 RESULTS AND DISCUSSION
The linear static finite element was performed using MSC.NASTRAN finite element software. The maximum principal stress contours is presented in Figure 8. From the resulting stress contours, the state of stress can be obtained and consequently used for life predictions. Linear elastic analysis was used, since the cylinder block is designed for long life, whose stresses are mainly elastic. The maximum principal stress of 38.0 MPa at node 49360 was obtained. All the results presented in this paper are based on the fine mesh model.
6061-T6-80-HF SRI1: 1206 b1: -0.097 b2: 0 E: 7.27E4 UTS: 340 6061-T91 SRI1: 958.9 b1: -0.07606 b2: 0 E: 6.9E4 UTS: 405
1E2
1E3
1E4
1E5
Stre
ss ra
nge
(MPa
)
1E0 1E1 1E2 1E3 1E4 1E5 1E6 1E7 1E8 1E9 1E10 Life (Cycles)
AA6061-T6-80-HF
AA6061-T91

Jurnal Mekanikal, June 2006
9
Figure 9 shows the fatigue log life plot for SAEBKT loading condition arising on the cylinder block of linear generator engine using the total life approach. The critical location is also shown in Figure 9 at node 49360, when using SAEBKT loading histories. The predicted minimum and maximum fatigue life are 105.58 and 1023.8 seconds respectively. The fatigue life is expressed in seconds of the variable amplitude and constant amplitude loading conditions. It is observed that the edge of the cylinder block is the most critical positions among the component. The critical fatigue life using different loading histories and materials combination using total-life method is tabulated in Table 1. Two mean stress correction methods, Goodman and Gerber are used in this study. It is observed that the Goodman mean stress correction method gives the most conservative prediction when the time histories predominantly tensile mean. However, Gerber mean stress correction gives conservative prediction when the time histories predominantly zero mean, and no mean stress correction method is found conservative when the time histories predominantly compressive mean. It is also observed that the constant amplitude fully reversed sinusoidal loading condition have been found to produce a minimum fatigue life. Table 2 shows the comparison between the material S-N and component S-N approach for SAEBKT loading conditions when considering the component S-N approach. It is shown that Gerber mean stress
Maximum Stresses 38.0 MPa near edge of bolt- hole
MPa
Figure 8. Maximum Principal Stresses.

Jurnal Mekanikal, June 2006
10
correction method is most conservative prediction for component S-N method and material S-N method while the AA6053-T6 and AA6951-T6 aluminum alloy are the most conservative results when using the zero mean stress correction method. It is also shown that the component S-N method gives the higher life than material S-N method. Table 3 shows the critical fatigue life for different materials and loading conditions for Goodman mean stress correction method. It is found that AA6061-T91 is consistently higher life than other materials for all loading conditions.
Table 1 Predicted fatigue life at critical location with mean stress effect
Table 1: Predicted fatigue life at critical location with mean stress effect
Material AA 6061-T6 Material AA6061-T91 Loading
conditions None Goodman Gerber None Goodman Gerber SAETRN 8.80E6 4.24E5 5.33E6 2.96E8 3.58E7 2.21E8 SAESUS 6.07E8 8.51E9 1.15E9 2.19E10 1.96E11 3.29E10 SAEBKT 6.29E6 1.51E7 5.61E6 2.13E8 4.14E8 1.81E8
I-N 6.7E8 3.45E6 1.27E8 2.63E10 4.76E8 8.89E9 A-A 1.04E8 1.11E6 2.77E7 4.26E9 1.23E8 1.63E9 A-G 1.66E8 3.28E6 6.72E7 8.92E9 3.16E8 4.00E9
CAFRS 2246 1734 1780 3.74E4 2.96E4 2.97E4
Log of Life (Seconds)
Critical location at node 49360
Figure 9: Life contour plot of log Life.

Jurnal Mekanikal, June 2006
11
Table 2: Comparison between material S-N and component S-N method for SAEBKT loading
Material S-N Component S-N
Materials None Goodman Gerber None Goodman Gerber 6009-T6 2.12E7 4.71E7 1.85E7 4.57E7 7.93E7 3.89E7 6053-T6 2.24E5 1.31E6 2.42E5 2.18E6 4.57E6 1.96E6 6061-T6 6.29E6 1.51E7 5.61E6 1.71E7 3.15E7 1.48E7 6061-T91 2.13E8 4.14E8 1.81E8 3.00E8 4.84E8 2.48E8 6066-T4 4.34E7 9.22E7 3.76E7 8.16E7 1.37E8 6.87E7 6066-T6 1.43E8 2.84E8 1.22E8 2.16E8 3.51E8 1.79E8 6070-T6 8.86E7 1.81E8 7.60E7 1.46E8 2.40E8 1.22E8 6151-T6 1.43E7 3.26E7 1.26E7 3.32E7 5.88E7 2.85E7 6262-T8 6.29E6 1.51E7 5.61E6 1.71E7 3.15E7 1.48E7 6262-T9 1.80E8 3.54E8 1.54E8 2.64E8 4.24E8 2.18E8 6951-T6 3.81E5 1.88E6 4.82E5 3.99E6 8.01E6 3.54E6
Table 3: Predicted fatigue life at critical location (node 49360) for different materials, and loading conditions
Predicted fatigue life in seconds for Goodman mean correction method
Materials SAETRN SAESUS SAEBRAKT I-N A-A A-G CAFRS 6009-T6 6.37E6 1.75E10 7.93E7 3.58E7 6.87E6 1.65E7 4626 6053-T6 1.11E4 1.21E9 4.57E6 3.58E5 1.28E5 8.92E4 Broken 6061-T6 1.91E6 7.29E9 3.15E7 8.74E6 2.65E6 3.28E6 1734 6061-T91 5.82E7 9.99E10 4.84E8 4.69E8 1.21E8 3.16E8 2.96E6 6066-T4 1.28E7 3.40E10 1.37E8 8.02E7 2.22E7 4.18E7 8234 6066-T6 4.00E7 7.63E10 3.51E8 2.98E8 7.96E7 1.91E8 2.15E4 6070-T6 1.54E7 5.51E10 2.40E8 1.79E8 4.79E7 1.04E8 1.46E4 6151-T6 4.33E6 1.35E10 5.88E7 2.28E7 6.62E6 9.84E6 3368 6262-T8 1.91E6 7.29E9 3.15E7 8.74E6 2.65E6 3.28E6 1734 6262-T9 4.99E7 8.94E10 4.24E8 3.84E8 1.02E8 2.58E8 2.59E4 6951-T6 1.06E5 1.98E9 8.01E6 9.46E5 2.17E5 6.96E5 Broken
Three-dimensional cycle histogram and corresponding damage histogram for
AA6951-T6 aluminum alloy using SAEBKT loading histories is shown in Figures 10 and 11 respectively. Figures show the results of the rainflow cycle count for the critical location on the component. This cycle/damage histogram gives an idea of where the majority of the damages are coming from. It can be seen that there are a lot of cycles with a low stress range and fewer with a high range. The height of each tower represents the number of cycles at that particular stress range and mean. Each tower is used to look up damage on the S-N curve and the damage is summed over all towers. It also shows that the high stress ranges give the most of the damage and a fairly wide damage distribution at the higher ranges, which means that it cannot point to a single event causing damage. Combined cycle histogram and corresponding damage histogram for AA6951-T6 aluminum alloy using SAEBKT loading histories is also shown in Figure 12.

Jurnal Mekanikal, June 2006
12
Figure 10: Cycle Histogram
Figure 11: Damage Histogram
Figure 12: 2D Cycle and Damage Histograms for AA6951-T6
aluminium alloy
0
800 -400
400 0
0.011141
Range MPa X-Axis
Mean MPa Y-Axis
Damage Z-Axis
Maximum height : 0.011141
0
800 -400
4000
29
RangeMPa X-Axis
MeanMPaY-Axis
Cycles Z-Axis
Maximum height : 29
Jurnal Mekanikal, June 2006
13
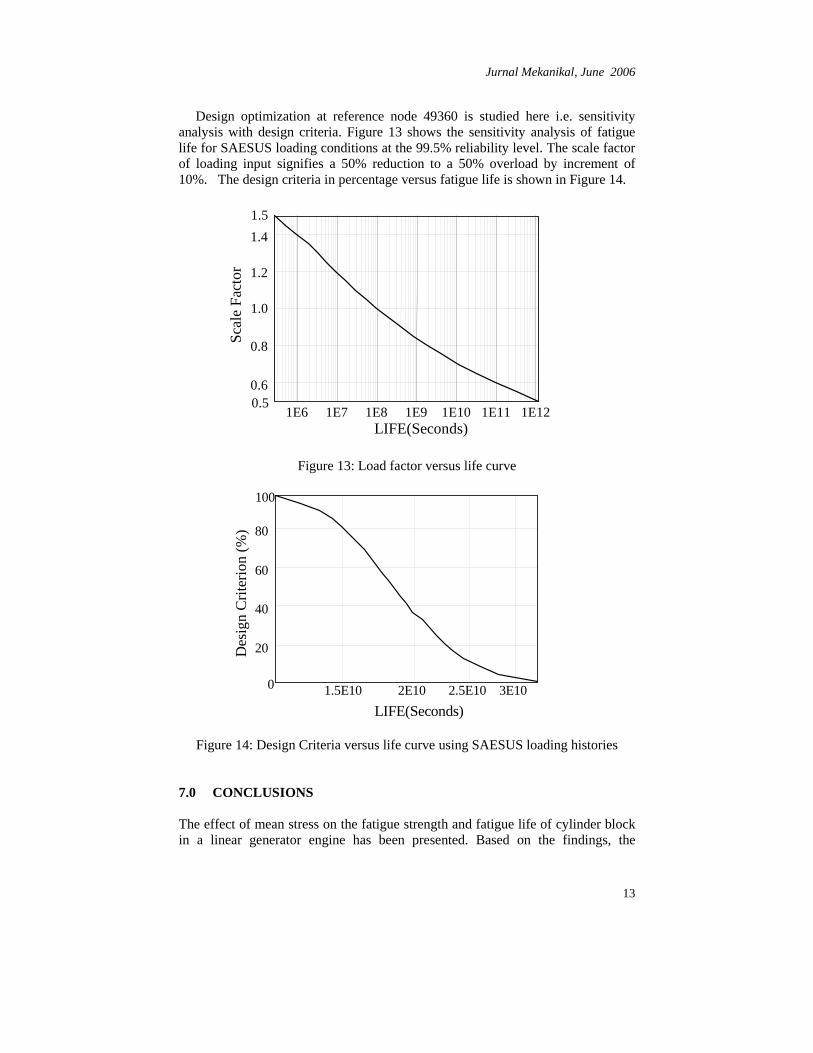
Design optimization at reference node 49360 is studied here i.e. sensitivity analysis with design criteria. Figure 13 shows the sensitivity analysis of fatigue life for SAESUS loading conditions at the 99.5% reliability level. The scale factor of loading input signifies a 50% reduction to a 50% overload by increment of 10%. The design criteria in percentage versus fatigue life is shown in Figure 14.
Figure 13: Load factor versus life curve
Figure 14: Design Criteria versus life curve using SAESUS loading histories 7.0 CONCLUSIONS The effect of mean stress on the fatigue strength and fatigue life of cylinder block in a linear generator engine has been presented. Based on the findings, the
1E6 1E7 1E8 1E9 1E10 1E11 1E12
0.6
0.8
1.0
1.2
1.4
LIFE(Seconds)
Scal
e Fa
ctor
0.5
1.5
1.5E10 2E10 2.5E10 3E10
20
40
60
80
100
0
LIFE(Seconds)
Des
ign
Crit
erio
n (%
)

Jurnal Mekanikal, June 2006
14
following conclusions can be made with regard to the fatigue damage and fatigue life of the cylinder block of free piston engine:
• Goodman mean stress correction method has been found to give the most conservative prediction when the time histories predominantly tensile mean. However, Gerber mean stress correction has been found to give conservative prediction when the time histories had a predominantly zero mean, while no mean stress correction method when predominantly compressive mean.
• The high stress ranges have been found to give the most of the damage.
• AA6061-T91 aluminum alloy is more suitable material using all loading conditions and all mean stress correction methods.
• Gerber mean stress correction method is most conservative for component S-N method for all materials and material S-N method, while the AA6053-T6 and AA6951-T6 aluminum alloys are the most conservative when using the zero mean stress correction.
Therefore, the total life approach can be use as an efficient and reliable means for the sign-off of durability of a prototype engine with actual service environments at the early stage of development.
ACKNOWLEDGMENTS The authors would like to thank the Department of Mechanical and Materials Engineering, Faculty of Engineering, Universiti Kebangsaan Malaysia. The authors are grateful to Malaysia Government especially Ministry of Science, Technology and Environment under IRPA project (IRPA project no: 03-02-02-0056 PR0025/04-03) for providing financial support.
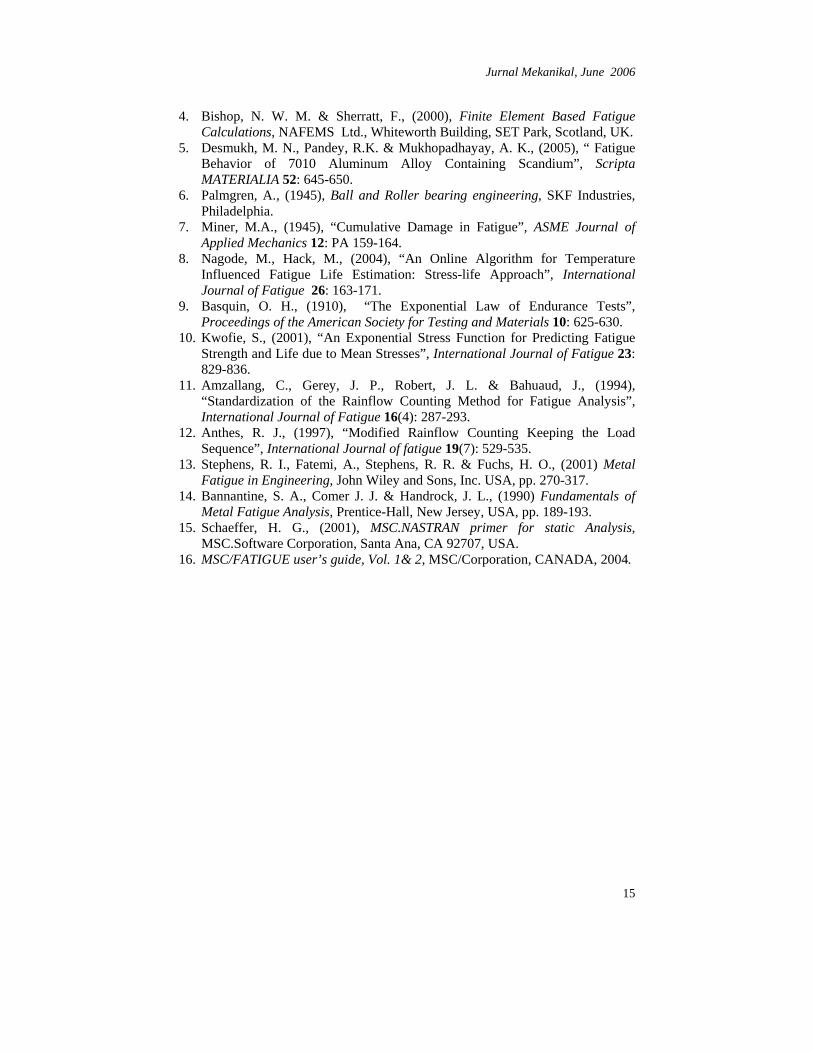
REFERENCES 1. Arshad, W. M., Bäckström, T., Thelin, P. & Sadarangani, C., (2002),
“Integrated Free Piston Generator: an Overview”, CD-ROM Proceedings of NORpie/2002, Stockholm, Sweden, pp. 1-5.
2. Aichlmayr, H. T., (2002), Design consideration Modeling, and Analysis of Micro-Homogeneous Charge Ignition Combustion Free-Piston Engine, PhD Thesis Dissertation, University of Minnesota, USA.
3. Rahman, M. M., Ariffin, A. K., Jamaludin, N. & Haron, C. H. C., (8-9 April 2005), “Modeling and Analysis of Cylinder Block of Linear Generator Engine for Fatigue Durability”, Proceedings of the 4th International Conference on Numerical Analysis of Engineering, Hotel SANTIKA, Yogyakarta, Indonesia, pp. 1-7.
Jurnal Mekanikal, June 2006
15
4. Bishop, N. W. M. & Sherratt, F., (2000), Finite Element Based Fatigue Calculations, NAFEMS Ltd., Whiteworth Building, SET Park, Scotland, UK.
5. Desmukh, M. N., Pandey, R.K. & Mukhopadhayay, A. K., (2005), “ Fatigue Behavior of 7010 Aluminum Alloy Containing Scandium”, Scripta MATERIALIA 52: 645-650.
6. Palmgren, A., (1945), Ball and Roller bearing engineering, SKF Industries, Philadelphia.
7. Miner, M.A., (1945), “Cumulative Damage in Fatigue”, ASME Journal of Applied Mechanics 12: PA 159-164.
8. Nagode, M., Hack, M., (2004), “An Online Algorithm for Temperature Influenced Fatigue Life Estimation: Stress-life Approach”, International Journal of Fatigue 26: 163-171.
9. Basquin, O. H., (1910), “The Exponential Law of Endurance Tests”, Proceedings of the American Society for Testing and Materials 10: 625-630.
10. Kwofie, S., (2001), “An Exponential Stress Function for Predicting Fatigue Strength and Life due to Mean Stresses”, International Journal of Fatigue 23: 829-836.
11. Amzallang, C., Gerey, J. P., Robert, J. L. & Bahuaud, J., (1994), “Standardization of the Rainflow Counting Method for Fatigue Analysis”, International Journal of Fatigue 16(4): 287-293.
12. Anthes, R. J., (1997), “Modified Rainflow Counting Keeping the Load Sequence”, International Journal of fatigue 19(7): 529-535.
13. Stephens, R. I., Fatemi, A., Stephens, R. R. & Fuchs, H. O., (2001) Metal Fatigue in Engineering, John Wiley and Sons, Inc. USA, pp. 270-317.
14. Bannantine, S. A., Comer J. J. & Handrock, J. L., (1990) Fundamentals of Metal Fatigue Analysis, Prentice-Hall, New Jersey, USA, pp. 189-193.
15. Schaeffer, H. G., (2001), MSC.NASTRAN primer for static Analysis, MSC.Software Corporation, Santa Ana, CA 92707, USA.
16. MSC/FATIGUE user’s guide, Vol. 1& 2, MSC/Corporation, CANADA, 2004.