Embed Size (px)
Citation preview

Fate of Six Neonicotinoids During
Full-scale Wastewater Treatment and
Passage Through an Engineered Wetland
by
Akash Mahendra Sadaria
A Thesis Presented in Partial Fulfillment of the Requirements for the Degree
Master of Science
Approved April 2015 by the Graduate Supervisory Committee:
Rolf Halden, Chair
Peter Fox Sudeep Popat
ARIZONA STATE UNIVERSITY
May 2015

i
ABSTRACT
Six high-production-volume neonicotinoids were traced through a municipal
wastewater treatment plant (WWTP) and engineered wetland located downstream, in a
study motivated by reports on these insecticides posing threats to non-target invertebrate
species and potentially playing a role in the global honeybee colony collapse disorder. An
array of automated samplers was deployed in a five-day monitoring campaign and
resultant flow-weighted samples were analyzed by liquid chromatography tandem mass
spectrometry (LC-MS/MS) using the isotope dilution method. Concentrations in WWTP
influent and effluent were 54.7 ± 2.9 and 48.6 ± 2.7 ng/L for imidacloprid, respectively,
and 3.7 ± 0.3 and 1.8 ± 0.1 ng/L for acetamiprid, respectively. A mass balance over the
WWTP showed no (p=0.09, CI = 95%) removal of imidacloprid, and 56 ± 6% aqueous
removal of acetamiprid. In the constructed wetland downstream, a lack of removal was
noted for both imidacloprid (from 54.4 ± 3.4 ng/L to 49.9 ± 14.6 ng/L) and acetamiprid
(from 2.00 ± 0.03 ng/L to 2.30 ± 0.21 ng/L). Clothianidin was detected only
inconsistently in the WWTP and wetland (>2 to 288 ng/L; 60% detection frequency),
whereas thiamethoxam (<10 ng/L), thiacloprid (<2 ng/L), and dinotefuran (<180 ng/L)
were not detected at all. Thus, imidacloprid and acetamiprid were identified as
recalcitrant sewage constituents (estimated U.S. WWTP discharge of 1920- 4780 kg/y)
that persist during conventional wastewater treatment to enter U.S. surface waters at
potentially harmful concentrations.

ii
TABLE OF CONTENT
Page
LIST OF TABLES…………………………………………….…………………..……...iv
LIST OF FIGURES………………………………………...……………………..……....v
CHAPTER
1. INTRODUCTION……………………………………………..……………...1
2. MATERIALS AND METHODS……………………………..……………....4
Chemicals and Reagents…………………………………….………….…4
Sample Collection………………………………………………..………..4
Sample Extraction and Cleanup…………………………………..……….6
Extraction of Water Samples…………………………….….….....6
Extraction of Solid Samples……………………………….………6
Liquid Chromatography Separation…………………………………..…...7
Tandem Mass Spectrometry……………………………………….……...8
Quantification, Isotope Dilution, Method Validation and Quality
Assurance……………………………………………………………..…...8
Mass Balance Calculations………………………..…………………..…..9
Sludge Water Partitioning Coefficient, KD…………………………..…..12
Statistical Data Analysis……………………………………………..…..12
3. RESULTS AND DISCUSSION…………………………………………..…14
Analytical Method Performance…………………………………………14
Fate of Neonicotinoids across Wastewater Treatment Process…….....…18
Fate of Imidacloprid across WWTP……………...……….….….18

iii
CHAPTER Page
Fate of Acetamiprid Across WWTP………………………..…....23
Detection of Clothianidin Across WWTP……………...………..24
Fate of Neonicotinoids Across Wetland Treatment………………...…....26
Fate of Imidacloprid Across Wetland Treatment………….....…..27
Fate of Acetamiprid Across Wetland Treatment…………...…....28
Detection of Clothianidin in Wetland…………………………....28
Environmental Emission of Neonicotinoids through WWTPs….…….....29
Study Limitations………………………………………………………...31
4. CONCLUSION………………………………………………………………32
REFERENCES…………………………………………………………………………..33

iv
LIST OF TABLES
Table Page
1. Mass Spectrometric Parameters for Detection of Six Neonicotinoids and Two
Isotope Labeled Surrogate Standards………………………..………………...…14
2. Method Detection Limits in Different Matrices ………………….....…………..16
3. Average Flow Rate and Average Aqueous Concentration of Imidacloprid and
Acetamiprid in Wastewater Treatment and Wetland Streams………………...…20
4. Partitioning and Persistence Properties of Neonicotinoids……………..…….….22
5. Aqueous Concentration of Clothianidin in Wastewater Treatment and Wetland
Streams with Respective Detection Frequency…………………………………..25
6. Estimated Emissions of Neonicotinoids by WWTP Effluent……………………30

v
LIST OF FIGURES
Figure Page
1. Liquid Chromatograms of All Six Neonicotinoids Representing Distinguishable
Separation……………………………………………………………...………...15
2. Treatment Processes for Wastewater and Sludge in the Investigated Activated
Sludge Treatment.…………………………………………………..……………17
3. Average Mass of Imidacloprid and Acetamiprid in Wastewater Streams Over a 5-
Day Period………………….....…………………………………….………...…21
4. Average Mass of Clothianidin in Wastewater Streams Over a 5-Day
Period…………………………………………………….……………………....26
5. Mass and Concentrations of Imidacloprid and Acetamiprid in Engineered
Wetland Streams…………………………………………..……………………..27

1
Chapter 1
INTRODUCTION
Neonicotinoids are the world’s most widely used insecticides, with global
production valued at 2.5 billion dollars, and registration in more than 120 countries for
commercial use on more than 140 crops. They are neurotoxic insecticides used for
control of aphids, whiteflies, planthoppers, lepidoptera, and some coleopteran pests,
among others. They can be applied as seed treatment, foliar treatment, soil injection,
trunk application, and drench/drip application (Jeschke, Nauen et al. 2011).
Neonicotinoids act on nicotinic acetylcholine receptors, disrupting synaptic transmission
(Matsuda, Buckingham et al. 2001). The vertebrate nAChR is an agonist-gated ion
channel responsible for rapid excitatory neurotransmission. The neonicotinoids have an
electronegative tip consisting of a nitro or cyano pharmacophore, which binds to a unique
cationic subsite of the insect receptor and disrupt excitatory cholinergic
neurotransmission, imparting potency (Tomizawa and Casida 2005).
In December, 2013 the European Commission introduced a 2-year moratorium on
clothianidin, imidacloprid, and thiamethoxam following reports by the European Food
Safety Authority (EFSA) saying the substances pose an "acute risk" to honey bees
essential to farming and natural ecosystem (EU Regulation No 485/2013). Adverse
effects on many non-target organisms like phloem feeding insects (Bonmatin, Giorio et
al. 2015), pollinators and bees (van der Sluijs, Simon-Delso et al. 2013), and aquatic
invertebrate (Morrissey, Mineau et al. 2015) due to widespread use of neonicotinoids
have been recently reported. Neonicotinoids cause excitation of the insect nerves, leading
2
to trembling and shaking, paralysis, and ultimately death. Median lethal dose values
(LD50) of neonicotinoids for bees varies from 5-70 ng/bee (Suchail, Guez et al. 2001).
Sub-lethal doses cause ATP synthesis inhibition, resulting in impairment of foraging
success, memory and learning, damage to the central nervous system, and increased
susceptibility to diseases (van der Sluijs, Simon-Delso et al. 2013). According to a recent
review, based on 214 toxicity tests of 48 species, average individual environmental
concentration greater than 35 ng/L can severely affect sensitive aquatic invertebrate
populations (Morrissey, Mineau et al. 2015). A recent study observed that aquatic
macrofauna populations dropped sharply at concentrations between 13 and 67 ng/L (Van
Dijk, Van Staalduinen et al. 2013). Insectivorous birds are also susceptible to exposure
through the food chain(Goulson 2014). A study in the Netherlands observed a decline in
bird population after the introduction of imidacloprid, the highest production volume
insecticide in the world; imidacloprid concentrations of greater than 20 ng/L correlated
with 3.5% average annual declines in bird populations (Hallmann, Foppen et al. 2014).
Co-occurrence of multiple neonicotinoids is known to impart synergistic toxic effects
(van der Sluijs, Amaral-Rogers et al. 2015).
During the past decades global contamination of neonicotinoids has been
observed in surface water (Bonmatin, Giorio et al. 2015). In a 2013 study in Canada,
neonicotinoids were detected in 91% of samples gathered from wetlands from the central-
eastern region of Saskatchewan with a total average concentration of 52.7 ng/L (n=90)
(Main, Headley et al. 2014). In several rivers around Sydney, Australia total average
neonicotinoid concentrations of 118 ng/L were detected; imidacloprid was the most
common neonicotinoid, detected in 93% of samples (n=15) (Sanchez-Bayo and Hyne

3
2014). In California imidacloprid was detected in 89% of surface water samples (n=75)
in which 19% samples exceeded concentrations of 1.05 µg/L, the United States
Environmental Protection Agency's chronic invertebrate Aquatic Life Benchmark value
(Starner and Goh 2012). In Spain imidacloprid was detected in river water receiving
wastewater treatment plant effluent at a maximum concentration of 19.2 ng/L, identifying
wastewater treatment plants (WWTPs) as a potential but not well established source of
neonicotinoids in the environment (Masiá, Campo et al. 2013).
The goal of the present study was to assess the presence of six neonicotinoids –
imidacloprid, thiamethoxam, clothianidin, acetamiprid, thiacloprid and dinotefuran in a
major metropolis in the southwestern U.S., and to trace their fate and transport through a
conventional wastewater treatment train and engineered wetland located immediately
downstream. We hypothesized that neonicotinoids in addition to being present in
agricultural runoff, also may occur at detectable levels in urban wastewater, due to their
use for control of insects on daily consumable products like rice, fruits, tea, and
vegetables, for horticulture and grass management applications, as well as for domestic
pet flea control (Jeschke, Nauen et al. 2011). Effluent of WWTPs is discharged into
surface waters used by animals, plants, or other organisms, thereby posing a potential
source of exposure to neonicotinoids. To determine the occurrence of neonicotinoids in
various stages of wastewater treatment infrastructure commonly used in the U.S. and
around the world, we developed a method for detection of six neonicotinoids and studied
their behavior during passage through a conventional WWTP and engineered wetland
downstream.

4
Chapter 2
MATERIALS AND METHODS
Chemicals and Reagents.
Organic solvent of high performance liquid chromatography (HPLC) grade and
formic acid of American Chemical Society (ACS) grade (98%) were purchased from
Sigma-Aldrich Corp., St. Louis, MO, USA. Ultrapure LC-MS grade water was purchased
from Thermo Fisher Scientific, Waltham, MA, USA. Analytical standards for six
neonicotinoids and deuterated labeled standards for imidacloprid (imidacloprid-d4,
Chemical Abstracts Service (CAS) number 1015855-75-0) and acetamiprid (acetamiprid-
d3, Molecular Design Limited (MDL) number MFCD17019132) were obtained from
Sigma-Aldrich Corp. (St. Louis, MO, USA). Stock solutions of analytical standards and
their mixtures were prepared in acetonitrile and stored at -20oC.
Sample Collection.
Sampling was conducted in early December 2014 for a period of five consecutive
days (Thursday through Monday) at a large activated sludge sewage treatment plant and
an engineered wetland downstream, located in the southwestern region of USA. The plant
is designed to serve a population of over 2.57 million with design capacity of 870 million
liters per day, received sewage being comprised of 94% domestic wastewater and 6%
industrial wastewater, and producing Class B+ reclaimed water discharged into a river
and Class B sludge used for land application. The treatment plant consists of 5 parallel
but similar treatment trains, merging before discharge into the constructed wetland. Unit
processes performed at the WWTP include: screening, grit removal, primary

5
sedimentation, activated sludge biological treatment, secondary clarification, chlorine
disinfection, centrifuge thickening of primary sludge and waste activated sludge,
anaerobic sludge digestion, and centrifuge dewatering of digested sludge. Primary sludge
and waste activated sludge are digested at 35oC, with an average solid retention time of
21 days. Average values of carbonaceous biochemical oxygen demand (cBOD) for plant
influent and wetland effluent were 292.4 ± 18.4 mg/L and 6.5 ± 1.0 mg/L respectively,
demonstrating cBOD removal of 97.8 ± 0.4%. Average values of total suspended solid
particles for plant influent and wetland effluent were 442.8 ± 122.2 mg/L and 13.4 ± 2.3
mg/L, respectively, demonstrating total suspended solids (TSS) removal of 96.8 ± 1.0 %.
The treatment train on which sampling was conducted received wastewater at a
flow rate averaging 230 ML/D. Seven portable automated samplers (6712 Full-Size
Portable Sampler, Teledyne Isco, Lincoln, NE, USA) were programmed based on three-
week average hourly–daily flow rate data to collect 2.5 liters of flow weighted composite
samples of primary influent, primary effluent, secondary effluent, waste activated sludge,
tertiary effluent, wetland influent and wetland effluent over a period of 24 hours for 5
consecutive days. Samples were collected into pre-cleaned 2.5 liter amber wide- glass
mouth bottles. Grab samples of primary sludge and dewatered sludge were collected into
pre-cleaned 1 liter amber glass bottles and 40 ml amber VOA glass vials, respectively.
After collection, samples were placed into coolers and shipped to the laboratory,
where 600 mg/L Kathon preservative(Groot and Weyland 1988) and 80-100 mg/L
sodium thiosulfate (MacCrehan, Bedner et al. 2005) were added to disinfect and
dechlorinate the samples, respectively, preventing biological and chemical degradation of

6
analytes during storage. Then, 500 mL of sample aliquots were fortified with 200 ng of
the deuterated surrogate standards imidacloprid-d4, acetamiprid-d3 to account for losses
during storage, extraction and analysis. Solid samples were fortified with 400 ng per
gram of the surrogate standards. All samples were stored at 4oC prior to processing.
Sample Extraction and Cleanup.
Extraction of Water Samples. An automatic solid-phase extraction instrument
(Dionex AutoTrace 280, Thermo Scientific, Waltham, MA, USA) was used to
concentrate and elute analytes from water samples from the sorbent bed for analysis.
Following screening of extraction efficiency of a combination of sorbents and sample
volumes, reverse-phase, functionalized polymeric styrene divinylbenzene sorbent (Strata
X & XL, 500 mg/3 mL, Phenomenex, Torrance, CA, USA) was selected and loaded with
500 mL of sample. Before loading, cartridges were conditioned with 3 mL methanol,
followed by 3 mL water. Then, water samples were loaded onto the cartridges at a flow
rate of 2 mL/min, washed with water, and dried with nitrogen gas for 5 minutes. Two
consecutive elutions were performed, each with 4 mL of methanol and formic acid
mixture (95:5, v/v). Equal volumes of serial eluates were combined, evaporated, and
reconstituted to half the volume of water and methanol solution (80:20, v/v) in 0.1%
formic acid for LC-MS analysis. Waste activated sludge and primary sludge samples
featuring approximately 2 and 6% TSS content, respectively, were centrifugated at 7500
g for 10 minutes. Resultant supernatants and solids were extracted separately.
Extraction of Solid Samples. Solid samples were dried under nitrogen using an
evaporator (Reacti-Therm TS-18821, Thermo Scientific, Waltham, MA, USA). Later,

7
1 gram of solids was transferred into 40 mL VOA vials and extracted into 10 mL acetone
for 24 hours followed by 1 hour of sonication. Resultant solutions were centrifugated and
supernatants transferred into another vial. To maximize analyte recovery, 10 mL acetone
was added again to the extracted solids, vortexed for a minute, centrifugated, and the
resultant supernatant combined with the first extract. After exchanging solvents from
acetone to 6 mL of hexane, extract cleanup was performed by solid phase extraction
(EPA Method 1698, USA) with a sorbent bed featuring a blend of magnesium oxide and
silica gel (Sep-Pak Vac Florisil Cartridge 6 cc containing 1 g of sorbent, Waters
Corporation, Milford, MA, USA). Before loading, the sorbent was conditioned
successively with 6 mL methylene chloride (DCM), 6 mL acetone and 6 mL hexane.
Extracts in hexane were loaded, the resin bed washed with 6 mL of hexane and analytes
eluted subsequently with 4 mL DCM and 4 mL acetone. Lastly, from resultant eluates 1
mL extracts were transferred into separate 2 mL vials, dried under a gentle stream of
nitrogen, and reconstituted with 1 mL of a solution of water, methanol and formic acid
(80/20/0.1, v/v/v) for analysis.
Liquid Chromatography Separation.
Separation was carried out using a Shimadzu Ultra Performance Liquid
Chromatography (UPLC) system, equipped with the SIL-20AC autosampler and 20-AD
solvent delivery system (Shimadzu Scientific Instruments, Inc., Columbia, MD, USA).
Simultaneous chromatographic separation for all six neonicotinoids was performed by
reverse phase liquid chromatography using a 4.6 x 150 mm C8 column (XBridge, Waters
Corporation Milford, MA, USA) with 3.5 µm bridged ethylene hybrid (BEH) particles. A

8
binary gradient with acidified water and methanol (100:0.1, v/v) at a total flow rate of 0.5
mL/min was applied. The mobile phase consisted of 20% organic with an initial 1-min
ramp of 10% solvent content increase min-1, followed by a 6-minute ramp of 10.8% min-1
to 95% organic, where it was held for 3.5 min, for a total run time of 14 min.
Tandem Mass Spectrometry.
Identification and quantitation were performed using an API 4000 tandem mass
spectrometer (ABSciex, Framingham, MA, USA) in positive electrospray (ESI+) mode
by monitoring the first and second most abundant ion transitions for quantification and
confirmation, respectively. Mass spectrometry was performed at a source heating
temperature of 700°C, ion spray voltage of 4500 V, curtain gas (nitrogen) pressure of 50
psi, nebulizer gas pressure of 90 psi, heater gas pressure of 75 psi, and dwell time of 70
ms. Analyst software, version 1.5 (ABSciex, Framingham, MA, USA) was used for LC-
MS/MS system control and data analysis.
Quantification, Isotope Dilution, Method Validation and Quality Assurance.
Quantification was performed using 8-point, linear calibration curves for each
analyte in the specific concentration range of interest. Calibration curve with a coefficient
of determination R2 > 0.99 was considered satisfactory. When background signal was
detected in field blank and instrumental blank, detected concentrations in samples were
corrected by background subtractions. For imidacloprid and acetamiprid isotope dilution
technique was utilized to determine losses during extraction and to compensate for ion
suppression during the LC-MS/MS detection. Water samples were spiked with 200 ng of
each deuterated isotopes (imidacloprid-d4, and acetamiprid-d3). Calibration samples were

9
spiked with 50 ng of labeled standards for relative recovery determination of isotopes.
Calibration curves for imidacloprid and acetamiprid were built by plotting the area ratio
of analyte with the internal standard (IS) to the concentration of each analyte. Similarly,
solid samples were spiked with 400 ng of isotope. For the other four analytes not having
labled standards, the method of standard addition was performed to compensate for ion
suppression during analysis.
Concentrations below detection limits were considered to be half of the method
detection limit for calculation purposes.
Relative percentage difference (RPD) was determined with the following
equation to determine precision between samples and duplicates.
RPD, % = !!"#$%&! !!"#$!"#$%!!"#$%& ! !!"#$%&'()
!
x 100 (1)
where Csample and Cduplicate are the detected concentrations in the original sample and its
duplicate, respectively.
Mass Balance Calculations.
Analyte mass balances were performed for the full-scale wastewater treatment
train, combining primary, secondary and tertiary treatment, using the following equation:
ṁtransformed = Q1’inf x C1’inf – Q3’eff x C3’eff – ṁDWS (2)
where,
ṁtransformed = mass input of neonicotinoids lost to transformation (g/day)
Q1’inf = flowrate of influent to primary clarifier (L/day)
C1’inf = concentration of neonicotinoids in influent entering primary clarifier (g/L)
Q3’eff = flowrate of tertiary effluent after chlorine disinfection (L/day)

10
C3’eff = concentration of neonicotinoids in tertiary effluent leaving treatment plant (g/L)
ṁDWS = mass of neonicotinoids accumulated in digested dewatered sludge (g/day)
= MDWS x CDWS
MDWS = mass of dewatered sludge produced (kg/day)
CDWS = concentration of neonicotinoids in dewatered sludge (g/kg)
Mass balance for wetland was calculated by following equation.
ṁlost = QWL,inf x CWL,inf – QWL,eff x CWL,eff (3)
where,
ṁlost = mass input of neonicotinoids lost to transformation and accumulation during
passage through wetland (g/day)
QWL,inf = flowrate of influent entering wetland (L/day)
CWL,inf = concentration of neonicotinoids in influent entering wetland (g/L)
QWL,eff = flowrate of effluent leaving wetland (L/day)
CWL,eff = concentration of neonicotinoids in effluent leaving wetland (g/L)
Mass balances for primary and secondary treatment were calculated using the
equations 3 and 4, respectively:
ṁPT,transformed = Q1’inf x C1’inf – Q1’eff x C1’eff – QPS x CPS (4)
where,
ṁPT,transformed = mass input of neonicotinoids lost to transformation during primary
treatment (g/day)
Q1’eff = flowrate of primary effluent leaving primary clarifier (L/day)
C1’eff = concentration of neonicotinoids in effluent leaving primary clarifier (g/L)

11
QPS = flowrate of sludge leaving primary clarifier (L/day)
CPS = concentration of neonicotinoids in primary sludge (g/L)
= CPS,aq + (C PS,particulates x TSSPS)
CPS,aq = concentration of neonicotinoids in aqueous phase of primary sludge (g/L)
C PS,particulates = concentration of neonicotinoids in sorbed phase of primary sludge
(g/g-solids)
TSSPS = concentration of total suspended particles in primary sludge (g-solids/L)
ṁST,transformed = Q1’eff x C1’eff – Q2’eff x C2’eff – QWAS x CWAS (5)
where,
ṁST,transformed= mass input of neonicotinoids lost to transformation during secondary
treatment (g/day)
Q2’eff = flowrate of secondary effluent leaving secondary clarifier (L/day)
C2’eff = concentration of neonicotinoids in secondary effluent leaving secondary clarifier
(g/L)
QWAS = flowrate of waste activated sludge (L/day)
CWAS = concentration of neonicotinoids in waste activated sludge (g/L)
= CWAS,aq + (C WAS,particulates x TSSWAS)
CWAS,aq = concentration of neonicotinoids in aqueous phase of waste activated sludge
(g/L)
CWAS,particulates = concentration of neonicotinoids in sorbed phase of waste activated
sludge (g/g-solids)

12
TSSWAS = concentration of total suspended particles in waste activated sludge
(g-solids/L)
Sludge Water Partitioning Coefficient (or Distribution Coefficient), KD.
To determine the sorption affinity of analytes onto sludge particulates, a
laboratory study was conducted (EPA 1991). Ten mL aliquots of water having 1 ppm, 10
ppm and 100 ppm of all six neonicotinoids was added to 1 gram of dewatered sludge and
after 10 days of shaking in absence of light at 22oC, water and solids were analyzed to
establish the partitioning behavior. To determine KD values, equation 5 was used, for all
six neonicotinoids,
KD = CS / CD (6)
Where,
KD = distribution coefficient, L/kg
CS = sorbed concentration on the solid particulates, mg/kg dry weight of dewatered solids
CD = bulk concentration remaining after sorption, mg/L
Statistical Data Analysis.
To determine standard error (SE) of the population (daily average parameter
data), following formula (Altman and Bland 2005) was used, where x is sample mean
average and n is sample size.
σ = (!! ! )!
! (!!!) (7)
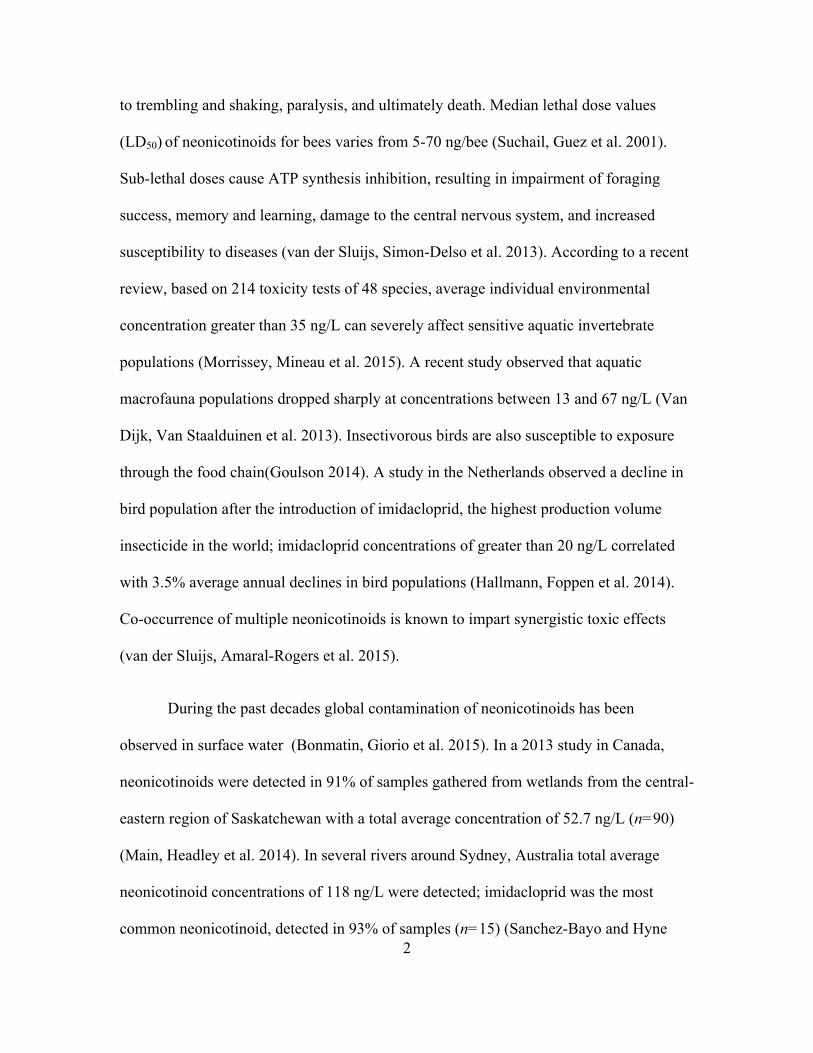
To determine the deviation value (sp) for the percentage removal of masses,
pooled variance was determined by following formula (Bucchianico 2014),
13
sp2 = !!!! !!
!!!!!
!!!!!!!!
(8)
A paired, two-tailed t-test (alpha = 0.05) was performed to test the null hypothesis
that differences in the means between paired observations of the daily mass of analyte in
two different streams were distinct.

14
Chapter 3
RESULTS AND DISCUSSION
Analytical Method Performance.
The tandem mass spectrometry method developed for this study targeted six
neonicotinoids at part-per-trillion levels simultaneously with monitoring of two ion
transitions by multiple reaction monitoring (MRM). Mass spectrometry parameters
optimized for detection are shown in Table 1.
Table 1
Mass Spectrometric Parameters for Detection of Six Neonicotinoids and Two Isotope-
Labeled Surrogate Standards
analyte Q
(m/z)
Q1
(m/z)
Q2
(m/z)
tR
(min)
DP
(V)
CE
(V)
EP
(V)
CXP
(V)
acetamiprid 223.1 126.0 99.0 7.95 56 31 15 6
clothianidin 250.0 169.0 132.0 7.70 50 30 8 8
dinotefuran 203.0 129.3 113.1 6.06 50 30 15 8
imidacloprid 256.0 175.1 209.2 7.50 50 30 10 8
thiacloprid 253.0 126.0 73.1 8.27 50 30 15 12
thiamethoxam 292.0 211.1 181.0 7.01 50 30 8 8
internal standards
imidacloprid-d4 261.0 214.0 180.0 7.50 76 25F, 33S 6 4F, 8S
acetamiprid-d3 226.0 125.9 99.0 7.95 61 31F, 55S 15 10F, 8S

15
Q mass-to-charge ratio (m/z) of precursor ion; Q1 m/z of most abundant fragment ion; Q2
m/z of second most abundant fragment ion; tR retention time; DP declustering potential;
CE collision energy; EP entrance potential; CXP collision cell exit potential; F quantifier
ions; and S qualification ions.
Figure 1. Chromatograms of all six neonicotinoids representing distinguishable
separation; relative response for 5 ppb of each analyte in 1 mL solution of water,
methanol and formic acid (80/20/0.1, v/v/v). The relative intensity has been scaled to the
highest response for thiacloprid for better representation.

16
Table 2
Estimated Method Detection Limits in Different Matrices
analyte wastewater (ng/L) sludge (µg/kg dry weight)
acetamiprid 2 5
clothianidin 2 5
dinotefuran 180 200
imidacloprid 5 15
thiacloprid 2 8
thiamethoxam 10 15
Estimated limit of detection of analytes in different matrices are shown in Table 2.
To assure the quality and validity of results, each analysis batch of environmental
samples contained a field blank, instrument blank, and method blank. No false positives
suggesting contamination were detected during the analysis of all samples. Check
samples were analyzed between runs and calibration set was also repeated after each run
to verify response fluctuations, if any. For imidacloprid and acetamiprid, RPD values
were 25.3% and 38.9%, respectively.

17
Figu
re 2
. Flo
w d
iagr
am sh
owin
g tre
atm
ent p
roce
sses
for w
aste
wat
er a
nd sl
udge
in th
e in
vest
igat
ed a
ctiv
ated
slud
ge tr
eatm
ent
plan
t. N
umbe
rs in
dica
te th
e sa
mpl
ing
loca
tions
use
d. A
t loc
atio
ns 1
, 2, 4
, 5, 6
, 8, a
nd 9
flow
-wei
ghte
d, 2
4-ho
ur c
ompo
site
sam
ples
wer
e co
llect
ed u
sing
aut
omat
ed sa
mpl
ers.
At l
ocat
ions
3 a
nd 7
gra
b sa
mpl
es w
ere
colle
cted
. The
blu
e an
d br
own
boxe
s rep
rese
nt, r
espe
ctiv
ely,
the
cont
rol v
olum
es u
sed
to c
ondu
ct m
ass b
alan
ces o
n th
e w
aste
wat
er tr
eatm
ent t
rain
and
an
engi
neer
ed w
etla
nd lo
cate
d im
med
iate
ly d
owns
tream
.

18
Fate of Neonicotinoids Across Wastewater Treatment Process.
Three out of six targeted neonicotinoids, thiacloprid, thiamethoxam and
dinotefuran, were absent from samples or present at levels below their respective method
detection limits (Table 2) in all WWTP process streams shown in Figure 2. Consistent
loading with imidacloprid and acetamiprid into the treatment facility was observed over
the 5-day sampling period as shown by the data compiled in Table 3.
Fate of Imidacloprid Across WWTP.
During the 5-day period of sampling, concentrations of imidacloprid in plant
influent fluctuated moderately between 43 and 65 ng/L. Based on the daily average flow
received by the treatment train, these concentrations corresponded to 13.3 ± 0.8
grams/day of loading in the aqueous phase over the 5-day period. This mass entered the
primary clarifier in which settling occurred, diverting 1% of total flow away as sludge
showing a 17 times higher level of suspended solids relative to clarifier effluent. Analyte
loading in primary effluent was 14.1 ± 0.8 grams/day, implying insignificant sorption on
sludge and persistence during primary treatment. Secondary treatment was an activated
sludge unit operation, a biological process aimed at breaking down organic compounds
by microbial degradation. However, the mass of imidacloprid in secondary effluent was
11.7 ± 0.6 grams/day, implying insignificant oxidation, hydrolysis and microbial
degradation in the aeration basin. A prior study also showed imidacloprid to undergo
insignificant transformation in both acidic and neutral conditions. According to a
laboratory study conducted at pH 7, after 3 months only 1.5% of mass was lost (Zheng
and Liu 1999). To meet microbial removal criteria, the here examined facility uses a
chlorine dosage of 2.5 mg/L. Although chlorine has the potential to oxidize organic

19
compounds, no change in imidacloprid concentration and mass was observed during the
chlorination process unit, indicating resistance to oxidation under the conditions studied.
Thus, during the 5-day period the average mass entering in raw sewage experienced little
removal from 13.3 ± 0.9 grams to 11.7 ± 0.7 grams detected in the effluent. To determine
statistical significance of the difference between change in mass of imidacloprid during
treatment, paired t-test was performed, and with p=0.09 and CI = 95%, it showed that
difference was not statistically significant, implying no discernible aqueous removal of
imidacloprid.
The average concentration in the aqueous phase of primary sludge was 30.7 ± 1.3
ng/L and the mass of this pesticide sorbed to sludge particles was below the method
detection limit (<15 µg/kg). The aqueous phase of waste activated sludge featured
imidacloprid concentrations of 22.3 ± 1.8 ng/L, with levels on the solids (particulate)
fraction registering below the detection limit (<15 µg/kg), similar to findings for primary
sludge. Based on the computed partitioning coefficient, the estimated concentration of
imidacloprid sorbed onto solid particulates of primary sludge and waste activated sludge
was 0.30 ± 0.01 and 0.22 ± 0.02 µg/kg, respectively. Therefore average daily mass of
imidacloprid leaving in primary sludge and waste activated sludge was 91.1 ± 3.3 and
43.7 ± 4.5 mg/days, respectively. Primary sludge and waste activated sludge were
subjected to anaerobic digestion at 35oC for 21 days followed by dewatering. Similarly
concentrations in dewatered sludge were below the detection limit (<15 µg/kg) and are
estimated to be in the range of 0-0.5 µg/kg. As primary sludge and waste activated sludge
were only 2% of total flow and due to less sorption of imidacloprid onto particles and
high water solubility, the mass accumulated onto particles had no effect on the mass

20
balance of the wastewater treatment train, thus aqueous removal and total removal were
similar.
Table 3
Average Flow Rate and Average Aqueous Concentration of Imidacloprid and
Acetamiprid in Wastewater Treatment and Wetland Streams (n=10). The Error Values
Given Represents Standard Errors (SE).
process stream flow rate
(MLD)**
5-day average aqueous concentration
(ng/L)
imidacloprid acetamiprid
wastewater treatment plant
influent 243.8 ± 1.8 54.7 ± 2.9 3.7 ± 0.3
primary effluent 241.9 ± 1.8 58.4 ± 3.3* 3.7 ± 0.2
secondary effluent 240.2 ± 1.7 48.6 ± 2.5 1.8 ± 0.1
disinfection effluent 240.2 ± 1.7 48.6 ± 2.7 1.7 ± 0.1
engineered wetland
influent 283.6 ± 3.4 48.2 ± 1.5 2.1 ± 0.2
effluent 247.2 ± 6.5 41.5 ± 3.6 2.0 ± 0.1
*n=15, **n=5

21
Figure 3. Average mass of imidacloprid and acetamiprid in wastewater streams over a 5-
day period. Aqueous removal of imidacloprid and acetamiprid was less than 10% (p =
0.09) and 56 ± 6% (p < 0.01), respectively, during tertiary wastewater treatment.

22
Tabl
e 4
Parti
tioni
ng a
nd P
ersis
tenc
e Pr
oper
ties o
f Neo
nico
tinoi
ds
anal
yte
Log
KO
Wa
log
KD
for d
ws
soil
pers
iste
nce
half
life,
day
sa
wat
er p
hoto
lysi
s
half
life,
day
sa
wat
er d
issi
patio
n
half
life,
day
sa
GU
S le
achi
ng
pote
ntia
l ind
exb
acet
amip
rid
0.80
0.
93
2-20
34
4.
7 0.
94 (v
ery
low
)
clot
hian
idin
0.
91
1.92
13
-138
6 <1
40
.3
4.91
(ver
y hi
gh)
dino
tefu
ran
-0.5
5 -
50-1
00
<2
- 4.
95 (v
ery
high
)
imid
aclo
prid
0.
57
0.99
10
4-22
8 <1
30
3.
76 (h
igh)
thia
clop
rid
1.26
-
9-27
10
-63
8.5
1.44
(low
)
thia
met
hoxa
m
-0.1
3 1.
85
7-72
2.
7-39
.5
30.6
3.
82 (h
igh)
dws,
dew
ater
ed sl
udge
- dr
y.
a M
orris
sey,
Min
eau
et a
l. 20
15; b B
onm
atin
, Gio
rio e
t al.
2015

23
Fate of Acetamiprid Across WWTP.
During sampling period, average concentration of acetamiprid detected in plant
influent was 3.7 ± 0.3 ng/L, corresponding to an average loading of 0.90 ± 0.07
grams/day. After primary treatment, the average mass leaving the primary clarifier was
0.82 ± 0.05 grams/day. To determine the significance of difference between masses, t-test
was performed and with p=0.06 it concluded that the difference is not statistically
significant, implying no removal due to primary treatment. Prior studies have shown that
acetamiprid undergoes relatively fast dissipation in neutral environment having an
aqueous dissipation half-life of 4.7 days (Table 4). Similar results were observed during
the secondary treatment with effluent concentration being half of the influent, confirming
microbial and chemical degradation of acetamiprid in the aeration basin with a resulting
mass leaving in the secondary clarifier effluent of 0.43 ± 0.03 grams/day. No change in
acetamiprid concentration was observed after disinfection, causing the average mass
leaving in disinfected effluent of 0.40 ± 0.04 grams/day with p=0.33 indicating no
chemical oxidation by chlorine. The average massload of acetamiprid lost during full-
scale treatment was 0.50 ± 0.08 grams/day, which was transformed or experienced
dissipation and/or accumulated onto the sludge particulates. The average mass of
acetamiprid for 5 day period in each treatment stream is shown in Figure 3 and resultant
mass balance on the wastewater treatment train showed 56 ± 6 % aqueous removal of
acetamiprid.
Upon analysis aqueous phase of the primary sludge and waste activated sludge
showed concentration of 1.0 ± 0.2 ng/L and 1.5 ± 0.4 ng/L, respectively. Though
corresponding sorbed concentrations onto the particulates were below the limit of

24
detection (< 5 µg/kg), based on experiential distribution coefficient (Table 4), predicted
sorbed concentration value from Equation 5 was 8.4 ± 2.1 ng/kg for primary sludge and
12.7 ± 3.7 ng/kg for waste activated sludge. Hence, the average mass in primary sludge
and waste activated sludge was 2.8 ± 0.7 mg/day and 3.0 ± 0.9 mg/day, respectively,
negligible in comparison to mass in aqueous phase. The concentration of acetamiprid in
dewatered sludge was below the detection limit but based on primary sludge and waste
activated sludge concentration it was estimated to be in the range of 0-10 ng/kg.
Detection of Clothianidin Across WWTP.
Clothianidin was detected, but not consistently in all wastewater treatment
streams with detection frequency ranging between 40-60% making fate determination by
mass balance indeterminate. Influent concentrations of clothianidin entering treatment
facility was 64.6 ± 56.2 ng/L (40% detection frequency) and corresponding effluent
concentrations leaving facility was 70.4 ± 48.3 ng/L (60% detection frequency). Detected
concentrations of clothianidin in all wastewater and wetland streams with corresponding
detection frequency are shown in Table 5 and respective average masses over 5 day
period are shown in Figure 4.
Aqueous phase of the primary sludge and waste activated sludge showed
clothianidin concentration of 4.9 ± 3.9 ng/L and 3.7 ± 1.5 ng/L, respectively. Though
corresponding sorbed concentrations onto the particulates were below the limit of
detection (< 5 µg/kg), based on experiential distribution coefficient, predicted sorbed
concentration value from Equation 5 was 41.8 ± 33.0 ng/kg for primary sludge and 27.2 ±
6.5 ng/kg for waste activated sludge. Hence, the average mass in primary sludge and

25
waste activated sludge was 14.5 ± 11.6 mg/day and 6.9 ± 2.3 mg/day, respectively,
negligible in comparison to mass in aqueous phase. The concentration of clothianidin in
dewatered sludge was below the detection limit but based on primary sludge and waste
activated sludge concentration it was estimated to be in the range of 0-0.05 µg/kg.
Table 5
Aqueous Concentration of Clothianidin in Wastewater Treatment and Wetland Streams
with Respective Detection Frequency
process stream range of concentrations (ng/L) detection frequency (%)
wastewater treatment plant
influent 32-288 40
primary effluent 178-191 40
secondary effluent 21-260 60
disinfection effluent 19-256 60
engineered wetland
influent 25-208 60
effluent 24-80 60

26
Figure 4. Average mass of clothianidin in wastewater streams over a 5-day period.
Fate of Neonicotinoids Across Wetland Treatment System.
Effluent water from all five parallel treatment trains was combined and a portion
of it was directed into the engineered wetland located downstream studied having
hydraulic retention time (HRT) of 4.7 days. The difference in concentration of
imidacloprid between the effluent of the studied treatment train and the wetland influent
was statistically insignificant (p=0.9, CI=95%), implying similar removal of imidacloprid
in all treatment trains. However, for acetamiprid this difference was significant (p< 0.01,
CI=95%) suggesting discrepancy in the removal between treatment trains, with overall
treatment plant acetamiprid removal efficiency being 43 ± 13% vs 56 ± 9% of the
treatment train analyzed. Average wastewater received and discharged by the wetland for
the sampling period was around 280 MLD and 250 MLD, respectively. Considered
possible mechanism triggering change in the concentration of these compounds during
0
5
10
15
20
25
30
Primary influent
Primary effluent
Secondary effluent
Disinfected effluent
mas
s, gr
ams/
day

27
passage through the constructed wetland are photodegradation, chemical transformation,
biological degradation, accumulation into sediments, plant uptake, leaching into
groundwater because of infiltration, and possible biotic uptake if any.
Figure 5. Mass and concentrations of imidacloprid and acetamiprid in engineered
wetland streams, implying persistence to treatment. Wastewater treatment train and
wetland were analyzed as different control volumes as the wetland received effluent from
multiple parallel but similar treatment trains.
Fate of Imidacloprid Across Wetland Treatment.
Imidacloprid concentrations entering and leaving the engineered wetland after 5
days was 54.4 ± 3.4 ng/L and 49.9 ± 14.6 ng/L, respectively; consequent average daily
mass loading and output was 15.1 ± 0.9 grams/day and 11.4 ± 3.3 grams/day as shown in
Figure 5. Though studies have shown that water photolysis half-life is less than 1 day
(Wamhoff and Schneider 1999), no significant removal of imidacloprid was observed
after wetland treatment suggesting possible persistence in surface water bodies, too.
During the sampling period (5 days) average concentration of imidacloprid
entering and leaving the engineered wetland was 48.2 ± 1.5 ng/L and 41.5 ± 3.6 ng/L,
respectively; consequent average daily mass loading and output was 13.6 ± 0.4 grams/day

28
and 10.2 ± 0.8 grams/day. Though comparison of these results don’t consider hydraulic
retention time (HRT) of wetland, data consistently aligns with the HRT considered value
as steady mass loading was received by the wetland, also implying no significant removal
of imidacloprid.
Fate of Acetamiprid Across Wetland Treatment.
As shown in figure 5, the concentration of acetamiprid in influent and effluent of
the wetland was 2.00 ± 0.03 and 2.30 ± 0.21 ng/L respectively, showing no decline in the
concentration during the passage. Corresponding daily mass entering and leaving the
wetland was 0.55 ± 0.01 and 0.52 ± 0.05 grams/day, indicating no aqueous removal by
the wetland treatment. Similar consistency was observed during the five-day sampling
period as the average concentration of acetamiprid in influent and effluent of the wetland
was 2.1 ± 0.4 and 2.0 ± 0.2 ng/L, respectively.
Detection of Clothianidin in Wetland.
Clothianidin was detected in 60% composite samples during the sampling days,
with concentrations ranging from 25 – 208 ng/L and 24 – 80 ng/L in the influent and
effluent streams, respectively. Based on the HRT of the wetland, though concentration of
clothianidin on day 1 was below the method limit of detection (< 2 ng/L) corresponding
detected clothianidin concentration in effluent was 80 ng/L; making fate determination
inconclusive.

29
Environmental Emission of Neonicotinoids Through WWTPs.
Based on detected concentration of neonicotinoids in treatment plant influent and
population served by the studied treatment facility, the total neonicotinoid annual loading
in sewage will range between 5.6-16.0 mg/person. This will correspond to national level
surface water contamination by approximately 1.9-4.8 metric tons of neonicotinoids –
acetamiprid, clothianidin, and imidacloprid by discharged effluent of WWTPs. Obtaining
state specific information on annual trends in relative quantities used and mode of
agricultural application from peer review literature was tough thus calculated emission
might be under or over predicted. Crude estimates for mass loading in influent and
effluent of imidacloprid, acetamiprid and clothianidin are shown in Table 6.

30
Tabl
e 6
Estim
ated
Em
issio
ns o
f Neo
nico
tinoi
ds b
y W
WTP
Effl
uent
mas
s est
imat
es
valu
e to
tal
neon
icot
inoi
ds
imid
aclo
prid
ac
etam
iprid
cl
othi
anid
in
estim
ated
ann
ual m
ass e
nter
ing
the
plan
t (kg
/y)
9.8-
11.0
0.
6-0.
8 1.
6-23
.0
12.1
-34.
8
estim
ated
ann
ual m
ass d
isch
arge
d fr
om th
e pl
ant (
kg/y
) 8.
6-9.
6 0.
3-0.
4 4.
2-22
.6
13.0
-32.
5
calc
ulat
ed a
vera
ge p
er-c
apita
load
ing
(mg/
y)
4.5-
5.1
0.3-
0.4
0.7-
10.6
5.
6-16
.0
estim
ated
nat
iona
l mas
s loa
ding
to th
e W
WTP
s (kg
/y)
1440
-162
0 10
0-11
0 24
0-33
90
1780
-511
0
estim
ated
nat
iona
l ann
ual m
ass d
isch
arge
d in
to su
rfac
e w
ater
(k
g/y)
12
60-1
410
40-5
0 61
0-33
20
1920
-478
0
US
popu
latio
n is
con
side
red
318.
9 m
illio
n (2
014)
(Sou
rce.
Uni
ted
Stat
es C
ensu
s Bur
eau)
.

31
Study Limitations.
Since portable automated samplers could not be deployed at the sludge outlet of
the primary clarifier, grab samples were collected once daily. As flow and composition of
wastewater may change with time, grab samples yield limited information about the daily
composition of primary sludge, though acetamiprid and imidacloprid were detected
consistently. But as primary sludge represented only 1% of the total flow, and for all
compounds most of the mass was detected in the clarifier effluent, ambivalence in
primary sludge mass would not affect the mass balance and be negligible. The mass
sorbed onto the sludge particulates was calculated from theory yielding conservative
estimates. Sorption coefficients were determined for dewatered sludge particles –
comprised of both primary and waste activated sludge. Differences in the composition of
the two sludge may result in minor differences in sorption of neonicotinoids, a
phenomenon that was not further investigated here. However, regardless of the individual
value, the respective KD values and volumes were not high enough to influence the mass
balance significantly. Influent to primary clarifier was considered the treatment plant
influent, and it can under-predict the calculated per capita loading per person, as mass
lost during pretreatment, for example, grit removal, will be unaccounted for. Emission
extrapolation is a function of per capita pesticides usage, state wide annual trends of
relative usage, and characteristics of treatment; thus, having inherent unpredictability. No
wetland sediments were collected during the study thus making determination of
accumulation into sediments inconclusive.

32
Chapter 4
CONCLUSION
Imidacloprid, thiamethoxam, clothianidin, and acetamiprid are frequently detected
in global surface waters. This study detected three neonicotinoids, imidacloprid,
acetamiprid and clothianidin in raw wastewater and in WWTP effluent. According to a
recent study, 74% of global surface waters exhibit individual neonicotinoids
concentrations exceeding 35 ng/L (n=17) (Morrissey, Mineau et al. 2015). Treated waste
discharge, according to the results of this study, could contribute to the reported global
surface water contamination. Though the clothianidin loading was not consistent enough
to enable performing a mass balance, it was detected during the sampling period in all
treatment streams. The results of this study demonstrate the occurrence of neonicotinoids
at considerable concentrations in wastewater streams at all locations within a treatment
train, whereas mass balances conducted over primary, secondary, tertiary, and
quaternary treatment showed these compounds to resist aerobic digestion, chlorine
disinfection, and wetland attenuation. Imidacloprid migrated through the WWTP without
undergoing any significant partitioning and transformation, whereas acetamiprid
experienced limited aqueous removal of 56 ± 9%. Additionally, imidacloprid and
acetamiprid experienced no significant mass reduction during passage through the
wetland. The fates of these compounds in the wetland are illustrative of their slow natural
attenuation in the environment.
.
33
REFERENCES
Altman, D. G., & Bland, J. M. (2005). Standard deviations and standard errors. BMJ : British Medical Journal, 331(7521), 903-903.
Bonmatin, J. M., Giorio, C., Girolami, V., Goulson, D., Kreutzweiser, D. P., Krupke, C.,
Tapparo, A. (2015). Environmental fate and exposure; neonicotinoids and fipronil. Environmental Science and Pollution Research, 22(1), 35-67. doi: 10.1007/s11356-014-3332-7
Bucchianico, A. D. (2014). Pooled Variance, Pooled Estimate Wiley StatsRef: Statistics
Reference Online: John Wiley & Sons, Ltd. EPA (U.S. Environmental Protection Agency). December 2007. Method 1698: Steroids
and Hormones in Water, Soil, Sediment, and Biosolids by HRGC/HRMS. EPA (U.S. Environmental Protection Agency). 1991. Site Characterization for
Subsurface Remediation. EPA/625/4-91/026, Office of Research and Development, U.S. Environmental Protection Agency, Cincinnati, Ohio.
Goulson, D. (2014). Ecology: Pesticides linked to bird declines. Nature, 511(7509), 295-
296. doi: 10.1038/nature13642 Groot, A. C. d., & Weyland, J. W. (1988). Kathon CG: A review. Journal of the
American Academy of Dermatology, 18(2, Part 1), 350-358. doi: http://dx.doi.org/10.1016/S0190-9622(88)70051-1
Hallmann, C. A., Foppen, R. P. B., van Turnhout, C. A. M., de Kroon, H., & Jongejans,
E. (2014). Declines in insectivorous birds are associated with high neonicotinoid concentrations. Nature, advance online publication. doi: 10.1038/nature13531 http://www.nature.com/nature/journal/vaop/ncurrent/abs/nature13531.html#supplementary-information
Jeschke, P., Nauen, R., Schindler, M., & Elbert, A. (2011). Overview of the Status and
Global Strategy for Neonicotinoids. Journal of Agricultural and Food Chemistry, 59(7), 2897-2908. doi: 10.1021/jf101303g
MacCrehan, W. A., Bedner, M., & Helz, G. R. (2005). Making chlorine greener:
Performance of alternative dechlorination agents in wastewater. Chemosphere, 60(3), 381-388. doi: http://dx.doi.org/10.1016/j.chemosphere.2004.11.075
Main, A. R., Headley, J. V., Peru, K. M., Michel, N. L., Cessna, A. J., & Morrissey, C. A.
(2014). Widespread Use and Frequent Detection of Neonicotinoid Insecticides in Wetlands of Canada's Prairie Pothole Region. PLoS ONE, 9(3), e92821. doi: 10.1371/journal.pone.0092821
34
Masiá, A., Campo, J., Vázquez-Roig, P., Blasco, C., & Picó, Y. (2013). Screening of currently used pesticides in water, sediments and biota of the Guadalquivir River Basin (Spain). Journal of Hazardous Materials, 263, Part 1(0), 95-104. doi: http://dx.doi.org/10.1016/j.jhazmat.2013.09.035
Matsuda, K., Buckingham, S. D., Kleier, D., Rauh, J. J., Grauso, M., & Sattelle, D. B.
(2001). Neonicotinoids: insecticides acting on insect nicotinic acetylcholine receptors. Trends in Pharmacological Sciences, 22(11), 573-580. doi: http://dx.doi.org/10.1016/S0165-6147(00)01820-4
Morrissey, C. A., Mineau, P., Devries, J. H., Sanchez-Bayo, F., Liess, M., Cavallaro, M.
C., & Liber, K. (2015). Neonicotinoid contamination of global surface waters and associated risk to aquatic invertebrates: A review. Environment International, 74(0), 291-303. doi: http://dx.doi.org/10.1016/j.envint.2014.10.024
Sanchez-Bayo, F., & Hyne, R. V. (2014). Detection and analysis of neonicotinoids in
river waters--development of a passive sampler for three commonly used insecticides. Chemosphere, 99, 143-151. doi: 10.1016/j.chemosphere.2013.10.051
Starner, K., & Goh, K. S. (2012). Detections of the neonicotinoid insecticide
imidacloprid in surface waters of three agricultural regions of California, USA, 2010-2011. Bull Environ Contam Toxicol, 88(3), 316-321. doi: 10.1007/s00128-011-0515-5
Suchail, S., Guez, D., & Belzunces, L. P. (2001). Discrepancy between acute and chronic
toxicity induced by imidacloprid and its metabolites in Apis mellifera. Environmental Toxicology and Chemistry, 20(11), 2482-2486. doi: 10.1002/etc.5620201113
Tomizawa, M., & Casida, J. E. (2005). NEONICOTINOID INSECTICIDE
TOXICOLOGY: Mechanisms of Selective Action. Annual Review of Pharmacology and Toxicology, 45(1), 247-268. doi: doi:10.1146/annurev.pharmtox.45.120403.095930
van der Sluijs, J. P., Amaral-Rogers, V., Belzunces, L. P., Bijleveld van Lexmond, M. F.
I. J., Bonmatin, J. M., Chagnon, M., . . . Wiemers, M. (2015). Conclusions of the Worldwide Integrated Assessment on the risks of neonicotinoids and fipronil to biodiversity and ecosystem functioning. Environmental Science and Pollution Research, 22(1), 148-154. doi: 10.1007/s11356-014-3229-5
van der Sluijs, J. P., Simon-Delso, N., Goulson, D., Maxim, L., Bonmatin, J.-M., &
Belzunces, L. P. (2013). Neonicotinoids, bee disorders and the sustainability of pollinator services. Current Opinion in Environmental Sustainability, 5(3–4), 293-305. doi: http://dx.doi.org/10.1016/j.cosust.2013.05.007

35
Van Dijk, T. C., Van Staalduinen, M. A., & Van der Sluijs, J. P. (2013). Macro-Invertebrate Decline in Surface Water Polluted with Imidacloprid. PLoS ONE, 8(5), e62374. doi: 10.1371/journal.pone.0062374
Wamhoff, H., & Schneider, V. (1999). Photodegradation of Imidacloprid. Journal of
Agricultural and Food Chemistry, 47(4), 1730-1734. doi: 10.1021/jf980820j Zheng, W., & Liu, W. (1999). Kinetics and mechanism of the hydrolysis of imidacloprid.
Pesticide Science, 55(4), 482-485. doi: 10.1002/(SICI)1096-9063(199904)55:4<482::AID-PS932>3.0.CO;2-3