Embed Size (px)
Citation preview

FastMap� A Fast Algorithm for Indexing� Data�Mining and
Visualization of Traditional and Multimedia Datasets
Christos Faloutsos�
Institute of Systems Research
and Dept� of Computer Science
Univ� of Maryland� College Park
King�Ip �David� LinDept� of Computer Science
Univ� of Maryland� College Park
Abstract
A very promising idea for fast searching in traditional and multimedia databases is to map objects
into points in k�d space� using k feature�extraction functions� provided by a domain expert �Jag����
Thus� we can subsequently use highly ne�tuned spatial access methods SAMs�� to answer several
types of queries� including the �Query By Example type which translates to a range query�� the �all
pairs query which translates to a spatial join �BKSS����� the nearest�neighbor or best�match query�
etc�However� designing feature extraction functions can be hard� It is relatively easier for a domain
expert to assess the similarity�distance of two objects� Given only the distance information though�
it is not obvious how to map objects into points�
This is exactly the topic of this paper� We describe a fast algorithm to map objects into points in
some k�dimensional space k is user�dened�� such that the dis�similarities are preserved� There are
two benets from this mapping� a� e�cient retrieval� in conjunction with a SAM� as discussed before
and b� visualization and data�mining� the objects can now be plotted as points in ��d or ��d space�
revealing potential clusters� correlations among attributes and other regularities that data�mining is
looking for�
We introduce an older method from pattern recognition� namely� Multi�Dimensional Scaling
MDS� �Tor���� although unsuitable for indexing� we use it as yardstick for our method� Then�
we propose a much faster algorithm to solve the problem in hand� while in addition it allows for
indexing� Experiments on real and synthetic data indeed show that the proposed algorithm is sig�
nicantly faster than MDS� being linear� as opposed to quadratic� on the database size N �� while it
manages to preserve distances and the overall structure of the data�set�
� Introduction
The objective of this work is to provide a retrieval and visualization tool for large collections of traditional
as well as �exotic� and multimedia datasets� An excellent idea� suggested by Jagadish �Jag��� was to
�This work was partially supported by the National Science Foundation �IRI�������� and IRI����� � with matching
funds from Empress Software Inc� and Thinking Machines Inc�
�

rely on domain experts to derive k featureextraction functions� thus mapping each object into a point
in kdimensional space� Then the problem is reduced to storing� retrieving and displaying kdimensional
points� for which there is a plethora of algorithms available�
However� it is not always easy to derive the above featureextraction functions� Consider the case�
eg�� of typed English words� where the distance function is the editing distance �minimum number of
insertion� deletions and substitutions to transform one string to the other�� It is not clear which the
features should be in this case� Similarly� in matching digitized voice excerpts� we typically have to do
some timewarping �SK �� which makes it di�cult to design featureextraction functions�
Overcoming these di�culties is exactly the motivation behind this work� Generalizing the approach
by Jagadish� we try to map objects into kdimensional points� assuming that a domain expert has only
provided us with a distance�dissimilarity function D��� ��� Notice that this setting includes the case
of features� by using eg�� the Euclidean distance between two feature vectors as the distance function
between the corresponding objects�
Given such a set of objects and the distance function D��� users would like �a� to �nd objects similar
to a given query object� �b� to �nd the pairs of objects that are most similar to each other� as well as
�c� to visualize the distribution of objects into some appropriately chosen space� in order to check for
clusters and other regularities�
Next� we shall use the following terminology�
De�nition � The kdimensional point Pi that corresponds to the object Oi� will be called �the image�
of object Oi� That is� Pi � �xi��� xi��� � � � � xi�k�
De�nition � The kdimensional space containing the �images� will be called target space�
Some of the applications that motivated the present work are listed next� Some distance functions
are also described�
� Image and� in general� multimedia databases� In a collection of shapes �Jag�� we would like to �nd
shapes similar to a give one� in a collection of color images� we would like to �nd images with similar
colors� shapes or texture �NBE���� There we used the Euclidean distance between appropriately
selected feature vectors �color attributes� moments of inertia for shape� etc�� Searchbycontent
is highly desirable in multimedia databases� with audio �voice� music�� video etc� �NC��� For
example� users might want to retrieve� music scores� or video clips that are similar to a target
music score or video clip� Once the similarity �or dissimilarity� function has been determined�
our proposed method can be immediately applied�
� Medical databases� where �d objects �eg�� ECGs�� �d images �eg�� Xrays� and �d images �eg��
MRI brain scans� �ACF��� are stored� Ability to retrieve quickly past cases with similar symp
toms would be valuable for diagnosis� as well as for medical teaching and research purposes� Notice
that the distance functions are complicated� typically requiring some warping of the two images�
to make sure that the anatomical structures �eg�� bones� are properly aligned� before we consider
the di�erences �TBS��� This warping makes it di�cult to �nd features that would adequately
describe each image �and therefore� map it into a point in feature space��
�

� Time series� with� eg� �nancial data� such as stock prices� sales numbers etc�� or scienti�c
databases� with time series of sensor data� weather �CoPES��� geological� environmental� as
trophysics �Vas�� data� etc�� In such databases� typical queries would be ��nd companies whose
stock prices move similarly�� or ��nd past days in which the solar magnetic wind showed patterns
similar to today�s pattern� �Vas��� The goal is to aid forecasting� by examining similar patterns
that may have appeared in the past� In �AFS�� we used the Euclidean distance �sum of squared
errors� as the distance function between two time series�
� Similarity searching in string databases� as in the case of spelling� typing �Kuk�� and OCR error
correction �JSB��� There� given a wrong string� we should search a dictionary to �nd the closest
strings to it� Conceptually identical is the case of approximate matching in DNA databases�
where there is a large collection of strings from a fourletter alphabet �A�G�C�T�� a new string
has to be matched against the old strings� to �nd the best candidates �AGM���� In all these
applications� the distance is typically the editing distance ie�� minimum number of insertions�
deletions or substitutions that are needed to transform the �rst string to the second�
� Data mining �AS��� �AIS�� and visualization applications� For example� given records of patients
�with attributes like gender� age� bloodpressure etc��� we would like to help the physician detect
any clusters� or correlations among symptoms� demographic data and diseases�
From the above descriptions� two types of queries seem to be very desirable� �querybyexample�
requests and �all pairs� queries� Speci�cally�
De�nition � The term query�by�example �or� equivalently �range query� or �similarity query�� will
signify queries of the following form� Given a desirable object �termed query object�� search a collection
of objects to �nd the ones that are within a user�de�ned distance � from the query object�
De�nition � The term all pairs query �or� equivalently �spatial join�� will signify queries of the form�
In a collection of objects� �nd the pairs of objects which are within distance � from each other� Again�
� is userde�ned�
All the above applications would bene�t by a mapping of objects into points in some kd space� Such
a mapping provides two major bene�ts�
�� It can accelerate the search time for queries� The reason is that we can employ highly �netuned
Spatial Access Methods �SAMs�� like the R�trees �BKSS�� and the zordering �Ore �� These
methods provide fast searching for range queries as well as spatial joins �BKSS���
�� it can help with visualization� clustering and datamining� Plotting objects as points in k�� or
� dimensions can reveal much of the structure of the dataset� such as the existence of major
clusters� the general shape of the distribution �linear versus curvilinear versus Gaussian� etc��
These observations can provide powerful insights in formulating hypotheses and discovering rules�
Thus� as discussed before� the general problem is de�ned as follows� We shall refer to it as the �dis�
tance case�� to highlight the fact that only the distance function is known�
General Problem ��distance� case�
�

Given N objects and distance information about them �eg�� an N �N distance matrix� or
simply the distance function D��� �� between two objects�
Find N points in a kdimensional space�
such that the distances are maintained as well as possible�
We expect that the distance function D�� is nonnegative� symmetric and obeys the triangular in
equality� In the �target� �kd� space� we typically use the Euclidean distance� because it is invariant
under rotations� Alternative distance metrics could be any of the Lp metrics� like the L� ��cityblock�
or �Manhattan� distance��
A special case is when we have already extracted features from the objects� but we still want to do
a projection� usually because the features are too many ��dimensionality curse��� We shall refer to it as
the �features� case�
Specialized Problem ��features� case�
Given N vectors with n attributes each�
Find N vectors in a kdimensional space�
such that the distances are maintained as well as possible�
Again� the distance between two vectors in either of the two spaces could be any Lp metric� As
before� we choose to use the Euclidean distance �L� metric��
In the above problems� the ideal mapping should ful�ll the following requirements�
�� It should be fast to compute� O�N� or O�N logN�� but not O�N�� or higher� because the cost
will be prohibitive for large databases�
�� It should preserve distances� leading to small discrepancies �low �stress� see �Eq� ����
�� It should provide a very fast algorithm to map a new object �eg�� a query object� to its image�
The algorithm should be O��� or O�logN�� This requirement is vital for �queriesbyexample��
The outline of this paper is as follows� In section � we present a brief survey of MultiDimensional
Scaling �MDS�� related dimensionality reduction methods �KL� SVD etc� and pointers to literature on
clustering and spatial access methods� In section � we present our method� In section � we give some
experimental results on real and synthetic datasets� In section � we list the conclusions�
� Survey
Here we present some background information about older attempts to solve the problem� First we
discuss the Multidimensional Scaling �MDS� method that has been used in several diverse �elds �eg��
social sciences� psychology� market research� physics �You �� to solve the �distance� case problem�
Then� we present the KarhunenLo�eve transform and the closely related Singular Value Decomposition
that has been used for dimensionality reduction ��features� case�� Finally� we provide a brief survey of
spatial access methods� as well as pointers to clustering algorithms�
�

��� Multi�Dimensional Scaling �MDS�
Multidimensional scaling �MDS� is used to discover the underlying �spatial� structure of a set of data
items from the �dis�similarity information among them� There are several variations� but the basic
method �eg�� see �KW� � is described next� Following the �distance� case setting� the method expects
�a� a set of N items� �b� their pairwise �dis�similarities and �c� the desirable dimensionality k�
Then� the algorithm will map each object to a point in a k dimensional space� to minimize the stress
function�
stress �
vuutP
i�j � �dij � dij��
Pi�j dij
����
where dij is the dissimilarity measure between objectOi and objectOj and �dij is the �Euclidean� distance
between their �images� Pi and Pj � The �stress� function gives the relative error that the distances in kd
space su�er from� on the average�
To achieve its goal� MDS starts with a guess and iteratively improves it� until no further improvement
is possible� In its simplest version� the algorithm works roughly as follows� It originally assigns each item
to a kd point �eg�� using some heuristic� or even at random�� Then� it examines every point� computes
the distances from the other N � � points and moves the point to minimize the discrepancy between
the actual dissimilarities and the estimated kd distances� Technically� MDS employs the method of
�steepest descent� to update the positions of the kd points� Intuitively� it treats each pairwise distance
as a �spring� between the two points� then� the algorithm tries to rearrange the positions of the kd
points to minimize the �stress� of the springs�
The above version of MDS is called metric multidimensional scaling �Tor��� because the distances
are given as numbers� Several generalizations and extensions have been proposed to the above basic
algorithm� Kruskal �KW� proposed a method that automatically determines a good value for k�
Shepard �She��� and Kruskal �Kru�� proposed the non�metric MDS where the distance between items
are speci�ed qualitatively� Young �You � describes the individual di�erence MDS� which incorporates
multiple distance measures� corresponding to di�erent observers� perception of the data�s di�erence�
MDS has been used in numerous� diverse applications� including the following� semantic structure
analysis of words� perceived personality trait relationships �RSN��� operating on �� di�erent person
ality traits and people�s perception of what goes together �like �warm� and �trusting��� physics �nuclear
gammaray spectra pattern recognition� recognizing the di�erent type of spins and their relationships��
political science �determining ideological shifts� �You �� texture analysis �RL���
However� for our applications� MDS su�ers from two drawbacks�
� It requires O�N�� time� where N is the number of items� Thus� it is impractical for large datasets�
In the applications presented above� the number of items was small �typically� N��������
� Its use for fast retrieval is questionable� In the �querybyexample� setting� the query item has to
be mapped to a point in kd space� MDS is not prepared for this operation� Given that the MDS
algorithm is O�N��� an incremental algorithm to search�add a new item in the database would be
O�N� at best� Thus� the complexity of answering a query would be as bad as sequential scanning�
�

The above two drawbacks are the motivation behind this present paper� Despite the above problems�
we use MDS as a yardstick� against which we measure the speed and �stress� of our method�
��� Dimensionality reduction techniques
In the �features� case� the problem has been studied extensively in statistical pattern recognition and
matrix algebra� The optimal way to map ndimensional points to kdimensional points �k � n� is
the Karhunen�Lo�eve ��KL�� transform �eg�� see �DH��� �Fuk���� KL is optimal in the sense that it
minimizes the mean square error� where the error is the distance between each nd point and its kd
image�
Figure � shows a set of �d points� and the corresponding � directions �x� and y�� that the KL
transform suggests� If we are allowed only k��� the best direction to project on is the direction of x��
the next best is y� etc�
x
x’
y
y’
Figure �� Illustration of the KarhunenLo�eve transformation the �best� axis to project is x��
�KL� is often used in pattern matching �Fuk�� to choose the most important features �actually�
linear combinations of features�� for a given set of vectors� It computes the eigenvectors of the covariance
matrix� sorts them in decreasing eigenvalue order� and approximates each data vector with its projections
on the �rst k eigenvectors� The operation is closely related to the Singular Value Decomposition
�SVD� �Str �� PFTV � GV � of the objectfeature matrix� Appendix A gives our implementation of
the KL transform in Mathematica �Wol���
However� the KL transform su�ers from two drawbacks�
� it can not be applied at all on the �distance� case
� even in the �features� case� it may be slow for large databases �N � �� with many attributes
�n� ��
The latter situation appears� eg�� in information retrieval and �ltering �FD��� �Dum��� where docu
ments correspond to V dimensional vectors �V being the vocabulary size of the collection� typically in
the tens of thousands�� Subsection ��� provides such an example�
��� Retrieval and Clustering
As mentioned before� the retrieval engine will be a Spatial Access Method �SAM�� which� by de�nition�
is a method that can handle kdimensional points� rectangles� or even more complicated shapes� The
most popular methods form three classes� �a� treebased methods like the Rtree �Gut �� and its
variants �R�tree �SRF �� hBtree �LS��� Ptree �Jag��a� R�tree �BKSS��� Hilbert Rtrees �KF��
�

Symbols De�nitions�
N Number of objects in databasen dimensionality of original space ��features� case only�k dimensionality of �target space�
D��� �� the distance function between two objectsjj�xjj� the length �� L� norm� of vector �x�AB� the length of the line segment AB
Table �� Summary of Symbols and De�nitions
etc�� �b� methods using linear quadtrees �Gar � or� equivalently� the zordering �Ore �� Ore��� or
other space�lling curves �FR �� Jag��b and �nally �c� methods that use grid�les �NHS �� HN ��
There are also retrieval methods for the case where only the triangular inequality holds �BK���
�Sha��� �SW��� �BYCMW��� All these methods try to exploit the triangular inequality in order to
prune the search space on a range query� However� none of them tries to map objects into points in
�target space�� nor to provide a tool for visualization�
Finally� our work could be bene�cial to research on clustering algorithms� where several approaches
have been proposed� See� eg�� �Mur �� �Har�� for surveys� �NH�� for a recent application in GIS�
�SM � �VR�� for applications in Information Retrieval�
� Proposed Method
In the �rst part� we describe the proposed algorithm� which achieves a fast mapping of objects into
points� so that distances are preserved well� Then� we give an arithmetic example with a small distance
matrix� and a larger example with real data� Table � lists the symbols and their de�nitions�
��� Algorithm
The goal is to solve the problem for the �distance� case� that is� to �nd N points in kd space� whose
Euclidean distances will match the distances of a given N � N distance matrix� The key idea is to
pretend that objects are indeed points in some unknown� ndimensional space� and to try to project
these points on k mutually orthogonal directions� The challenge is to compute these projections from
the distance matrix only� since it is the only input we have�
For the rest of this discussion� an object will be treated as if it were a point in an nd space� �with
unknown n��
The heart of the proposed method is to project the objects on a carefully selected �line�� To do that�
we choose two objects Oa and Ob �referred to as �pivot objects� from now on�� and consider the �line�
that passes through them in nd space� The algorithm to choose pivot objects is discussed later �see
Figure �����
�

The projections of the objects on that line are computed using the cosine law� See Figure � for an
illustration�
Theorem � �Cosine Law� In any triangle OaOiOb� the cosine law gives�
db�i� � da�i
� � da�b� � �xida�b ���
Proof� From the Pythagorean theorem in the two rectangles OaEOi and ObEOi�
Eq� � can be solved for xi� the �rst coordinate of object Oi�
xi �da�i
� � da�b� � db�i
�
�da�b���
In the above equations� dij is a shorthand for the distance D�Oi� Oj� �for i� j � �� � � � � N � Notice that
the computation of xi only needs the distances between objects� which are given�
Oa E
Oi
Ob
dab
xi
dbidai
Figure �� Illustration of the �cosine law� projection on the line OaOb�
Observe that� thanks to Eq� �� we can map objects into points on a line� preserving some of the
distance information� For example� if Oi is close to the pivot Oa� xi will be small� Thus� we have solved
the problem for k���
Oj
Oi
C
Oi’
Oj’
H
Oa
Ob
D
E
xi -xj
Figure �� Projection on a hyperplane H� perpendicular to the line OaOb of the previous �gure�
The question is whether we can extend this method� so that we can map the objects into points in
�d space� and eventually� kd space� The answer is a�rmative� and the idea is as follows� Pretending

that the objects are indeed points in nd space� consider a �n���d hyperplane H that is perpendicular
to the line �Oa� Ob�� then� project our objects on this hyperplane� Let Oi� stand for the projection of
Oi �for i � �� � � � � N�� The problem is the same as the original problem� with n and k decreased by one�
This should not create problems� because n was unknown to begin with�
The only missing part is to determine the distance function D��� between two of the projections on
the hyperplane H� such as� Oi� and Oj
�� Once this is done� we can recursively apply the previous steps�
Figure � depicts two objects Oi� Oj � and their projections Oi�� Oj
� on the H hyperplane� A key
observation is the next Lemma�
Lemma � On the hyperplane H� the Euclidean distance D��� between the projections Oi� and Oj
� can
be computed from the original distance D��� as follows�
�D��Oi�� Oj
���� � �D�Oi� Oj��� � �xi � xj�
� i� j � �� � � � � N ���
Proof From the Pythagorean theorem on the triangle OiCOj �with the right angle at �C�� we have�
�Oi�Oj
��� � �COj�� � �OiOj�
� � �OiC�� ���
where �AB� indicates the length of the line segment AB� Since �OiC� � �DE� � jjxi � xj jj�� the proof
is complete�
Ability to compute the distance D��� allows us to project on a second line� lying on the hyperplane
H� and� therefore� orthogonal to the �rst line �Oa� Ob� by construction�
Thus� we can solve the problem for a �d �target� space� More importantly� we can apply the same
steps recursively� k times� thus solving the problem for any k�
The point that we have not discussed is how to choose the �pivot objects� Oa and Ob� Clearly� we
would like to �nd a line on which the projections are as far apart from each other as possible� To
achieve that� we need to choose Oa and Ob such that the distance D�Oa� Ob� is maximized� However�
this would require O�N�� distance computations� Thus� we propose the linear heuristic algorithm
choose�distant�objects�� illustrated in Figure ���
Algorithm � choose�distant�objects � O� dist�� �
begin
�� Chose arbitrarily an object� and declare it to be the second pivot object Ob
�� set Oa � �the object that is farthest apart from Ob� �according to the distance function
dist���
�� set Ob � �the object that is farthest apart from Oa�
�� report the objects Oa and Ob as the desired pair of objects�
end
Figure �� Heuristic to choose two distant objects�
All the steps in the above algorithm are linear on N � The middle two steps can be repeated a
constant number of times� still maintaining the linearity of the heuristic� In all our experiments� we
�

have � iterations�Now we are ready to describe our basic algorithm� According to the problem de�nition ��distance�
case�� the algorithm accepts as input �a� a set O of N objects �eg�� typed words� ASCII documents�
color images� or nd vectors� �b� a distance function D�� that obeys the triangular inequality and �c� the
desired number of dimensions k� and it maps the objects into points in kd space� so that the distances
are preserved as well as possible� The output vectors are written in a global variable� the N � k array
X�� The algorithm also records the �pivot objects� for each recursive call� in the global ��k array PA��
Figure ��� gives the pseudocode for FastMap�
Algorithm � FastMap
begin
Global variables�N � k array X�
� At the end of the algorithm� the ith row will be the image of the ith object� �
�� k pivot array PA�
� stores the ids of the pivot objects one pair per recursive call �
int col! ���
� points to the column of the X� array currently being updated �
Algorithm FastMap� k� D��� O �
�� if �k � ��
f return� gelse
fcol! ���g�� � choose pivot objects �
let Oa and Ob be the result of choose�distant�objects� O� D������ � record the ids of the pivot objects �
PA��� col! � a� PA��� col!� b�
�� if � D�Oa� Ob� � ��
set X� i� col! �� for every i and return
� because all interobject distances are zeros �
�� � project the objects on the line �Oa� Ob� �
for each object Oi�
compute xi using Eq� � and update the global array� X�i� col! � xi
�� � consider the projections of the objects on a hyperplane perpendicular to the line �Oa�
Ob�� the distance function D��� between two projections is given by Eq� � �
call FastMap� k � �� D���� O�
end
Figure �� Algorithm �FastMap�
Thus� the algorithm determines the coordinates of the N objects on a new axis� after each of the k
��

O� O� O� O� O�
O� � � � ��� ���O� � � � ��� ���O� � � � ��� ���
O� ��� ��� ��� � �O� ��� ��� ��� � �
Table �� Distance matrix for arithmetic example
recursive calls� Therefore� the ith object is mapped to the point Pi� �X�i� ��X�i� �� � � �X�i� k� where
X�i� j is the jth coordinate Pi� the image of the ith object�
The complexity of the �FastMap� algorithm is O�Nk� distance calculations� At each recursive call�
the longest steps are steps � and �� each of which is O�N��
The reason that we need to record the �pivot objects� in each recursive call is to facilitate queries�
The search algorithm is as follows� when a �querybyexample� request arrives� the query object Oq is
mapped into a kd point in �target space�� by projecting it on the lines of appropriate �pivot objects��
with the appropriate distance function each time� That is� we repeat step � of the FastMap algorithm
for the query object only�
Notice that the complexity of the mapping operation is constant �O���� with respect to the database
size N � More detailed� the algorithm requires "�k� distancecalculation operations� because we need
to compute the distance of the query object from each of the � � k pivot objects� Even if we decide to
compute the distances between the pivot objects on the #y� we have to add k more distance calculations
to the count� for a total of � � k�
��� Arithmetic Example
Next we provide an arithmetic example� to illustrate how the algorithm works� Consider a set of �
objects� with the distance matrix of Table �� Notice that the �rst three objects seem to form a cluster�
and so do the rest two� the two clusters are roughly ��� units apart� With the above input and k���
the algorithm produces the output matrix X�� as shown in Table �� Notice that each row corresponds
to one object� columns give the coordinates of each object� The coordinates in the space created by
FastMap will be referred to by �FastMapcoordinates�� f�� f�� f� etc�
The jth column of the X� matrix is produced at the jth recursive call of FastMap� O� and O� were
chosen as the pivot objects in the �rst recursive call� because D�O�� O������ ties in the �rst place for
length �see Table ���
The projection of the �rst pivot object is always zero� the projection of the second pivot object is
always its distance from the �rst� Thus� X������� X�����D�O��O������� The pivot objects were
�O� � O��� and �O�� O�� in the next two recursive calls� Notice that the stress is decreasing after each
recursive call� as expected� Figure � shows the scatterplot� using the �rst two �FastMapcoordinates�
f� and f� of the �target� space� Notice that the two clusters already can be distinguished�
��

X� f� f� f�O� � ������ � ���� ���O� ����� ������ ��������O� ����� ������� �O� ��� ������ � ���� ���O� ������ � �
Iteration! Pivot Stress
� O�� O� ���� � O�� O� ������ O�� O� �����
Table �� Results of FastMap� �left� �images� of the � objects� �right� pivot objects and �stress� values in
each recursive call
20 40 60 80 100f1
2
4
6
8
10f2
O1O2O3 O4
O5
Figure �� Scatterplot for the � objects of the arithmetic example
��� Case Study� Document Vectors and Information Retrieval�
Here we trace the algorithm on an information retrieval application �SM �� There� documents are
represented as vectors in V dimensional space� where V is the size of the vocabulary of the collection�
For the English language� we can expect V to range from ����� up to and exceeding ������� �the
vocabulary of everyday English� and the size of a very detailed dictionary� respectively �Pet ��� The
coordinates of such vectors are called term weights and can be binary ���� if the term appears in
the document� ��� if not� or realvalued� with values increasing with the importance �eg�� occurrence
frequency� of the term in the document�
Consider two documents d� and d�� with vectors �u�� �u� respectively� The similarity between two
documents is typically measured by the cosine similarity of their vectors �SM ��
similarity�d�� d�� ��u� � �u�
jj �u�jj��jj�u�jj� ���
where ��� stands for the inner product of two vectors and jj � jj� stands for the Euclidean norm of the
vector� Clearly the cosine similarity takes values between � and �� Figure � gives an example� There�
cos��� is considered as the similarity of the two vectors �u� and �u�� Intuitively� the cosine similarity
projects all the document vectors on the unit hypersphere �see vectors �u��� and �u��� in the �gure� and
measures the cosine of the angle of the projections�
��

(0,0) (1,0)
(0,1)
θ
OA
B
θ/2C
u2,0
u1u1,0
u2
Figure �� Two vectors �u�� �u�� their angle � and the cosine similarity function cos���
In order to apply our method� we �rst need to de�ne a distance function that decreases with increasing
similarity� From Figure � it would make sense to use the length of the line segment AB� �AB� �
jj �u��� � �u���jj�� After trigonometric manipulations� the result is
D�d�� d�� � � � sin�����
�q� � ��� cos����
�q� � ��� similarity�d�� d��� ���
Notice that Eq� � de�nes a distance function �nonnegative� symmetric� satisfying the triangular
inequality� and that it decreases with increasing similarity�
Also notice that it allows us to respond to range queries� Suppose that the user wants all the
documents d that are similar to the query document q�
similarity�d� q� � � �
Thanks to Eq� �� the requirement becomes
D�d� q� �q� � ��� �� ���
which eventually becomes a range query in our �target� space and can be handled e�ciently by any
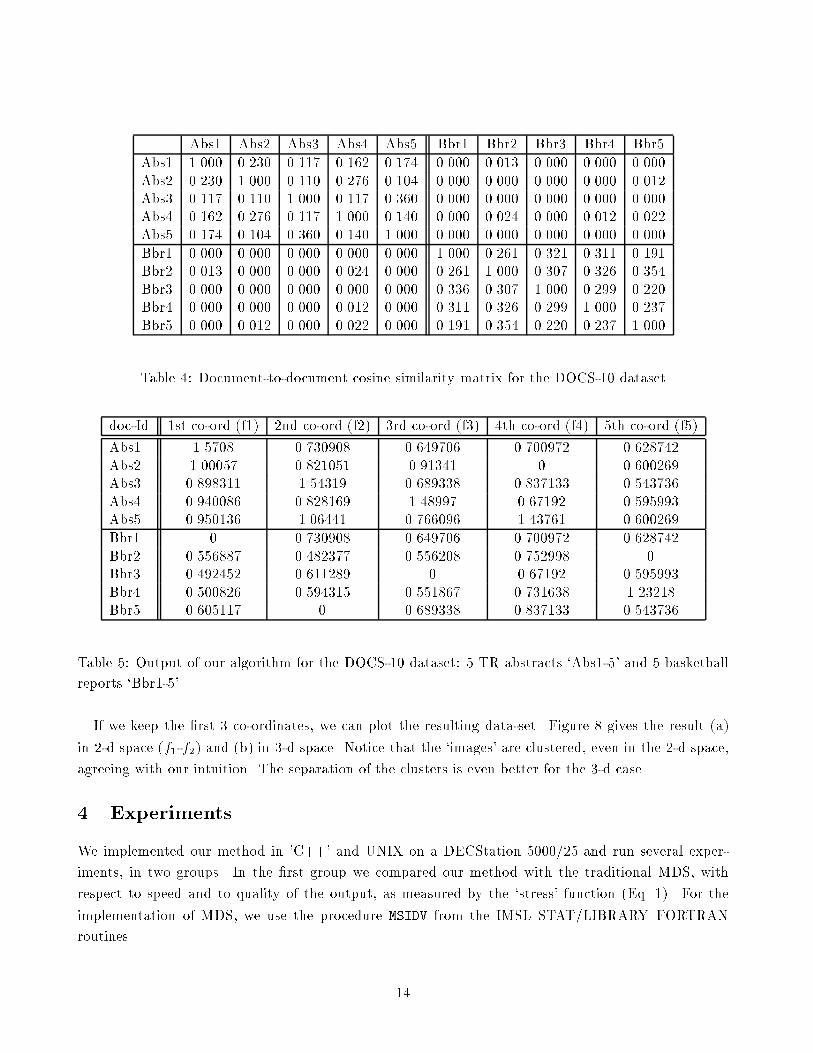
SAM�Next we show the results of our algorithm for �� documents �referred to as the �DOCS��� dataset��
The set contains � abstracts of computer science technical reports �labelled �Abs����� and � reports
about basketball games �labelled �Bbr����� To create the document vector for a document� we deleted
all the nonalphabetic characters� turned everything to lowercase� and deleted the most common words
�using a stoplist of ��� common words�� We used binary term weights� and we computed the cosine
similarity among all these documents� The cosinesimilarity matrix is given in Table �� Notice that there
are high similarities among the abstracts� as well as among the basketball reports� and low similarities
across the two groups�
Using Eq� �� we turned similarities into distances� and we applied �FastMap�� The �rst � recursive
calls of the algorithm give the matrix in Table ��
��
Abs� Abs� Abs� Abs� Abs� Bbr� Bbr� Bbr� Bbr� Bbr�
Abs� ����� ����� ����� ����� ����� ����� ����� ����� ����� �����Abs� ����� ����� ����� ����� ����� ����� ����� ����� ����� �����Abs� ����� ����� ����� ����� ����� ����� ����� ����� ����� �����Abs� ����� ����� ����� ����� ����� ����� ����� ����� ����� �����Abs� ����� ����� ����� ����� ����� ����� ����� ����� ����� �����
Bbr� ����� ����� ����� ����� ����� ����� ����� ����� ����� �����Bbr� ����� ����� ����� ����� ����� ����� ����� ����� ����� �����Bbr� ����� ����� ����� ����� ����� ����� ����� ����� ����� �����Bbr� ����� ����� ����� ����� ����� ����� ����� ����� ����� �����Bbr� ����� ����� ����� ����� ����� ����� ����� ����� ����� �����
Table �� Documenttodocument cosine similarity matrix for the DOCS�� dataset
docId �st coord �f�� �nd coord �f�� �rd coord �f�� �th coord �f�� �th coord �f��
Abs� ����� ������� �������� �������� ���� ���Abs� ������� �� ����� ������� � ��������Abs� �� � ��� ������� ��� ��� �� ����� ��������Abs� ������ � �� � ��� ��� ��� ������� ��������Abs� �������� ������� �������� ������� ��������
Bbr� � ������� �������� �������� ���� ���Bbr� ����� � ��� ���� ������� ������� �Bbr� �������� ������ � � ������� ��������Bbr� ����� �� �������� ����� �� ������� ������ Bbr� �������� � ��� ��� �� ����� ��������
Table �� Output of our algorithm for the DOCS�� dataset� � TR abstracts �Abs��� and � basketball
reports �Bbr���
If we keep the �rst � coordinates� we can plot the resulting dataset� Figure gives the result �a�
in �d space �f�f�� and �b� in �d space� Notice that the �images� are clustered� even in the �d space�
agreeing with our intuition� The separation of the clusters is even better for the �d case�
� Experiments
We implemented our method in �C��� and UNIX on a DECStation ������� and run several exper
iments� in two groups� In the �rst group we compared our method with the traditional MDS� with
respect to speed and to quality of the output� as measured by the �stress� function �Eq� ��� For the
implementation of MDS� we use the procedure MSIDV from the IMSL STAT�LIBRARY FORTRAN
routines�
��

0.25 0.5 0.75 1 1.25 1.5
0.25
0.5
0.75
1
1.25
1.5
AbsAbs
Abs
Abs
Abs
Bbr
BbrBbr
Bbr
Bbr
0
0.5
1
1.5
f1
0
0.5
1
1.5f2
0
0.5
1
1.5
f3
0
0.5
1
1.5
f1
0
0.5
1
1.5f2
Abs
Abs
Abs
Abs
Abs
Bbr
BbrBbr
Bbr
Bbr
�a� �b�
Figure � The DOCS�� dataset� after FastMap in �a� k��d space �f� vs f�� �b� k��d space� �Abs�
and �Bbr� indicate CS TR abstracts and basketball reports� respectively�
The second group of experiments is designed to illustrate the visualization and clustering abilities
of our algorithm for several applications� We used several datasets� real as well as synthetic� The real
datasets are�
DOCS It consists of �� text documents� It includes the DOCS�� dataset �� CS TR abstracts �ABS�� �
basketball reports �BBR��� and in addition it has the following � groups �each with � documents��
CAL �Call for papers� for technical conferences�
MAT Five portions of the Bible in King James� Version �taken from the Gospel of Matthew��
REC Cooking recipes�
WOR �World News�� documents about the Middle East �October ������
SAL Sale advertisements for computers and software
All of the above � datasets are taken from various newsgroups on USENET� except for MAT�
which is available electronically from wuarchive�wustl�edu� The distance function is based on
the cosinesimilarity function� as explained in subsection ����
WINE N���� records� with results of a chemical analysis of wines grown in the same region in
Italy� but derived from three di�erent cultivars� Thus� we expect to see � clusters� The �le
was obtained from the �UCIrvine repository of machine learning databases and domain theories�
�ics�uci�edu� ��ftp�pub�machine�learning�databases�wine�� Each row has �� attributes�
indicating the amount of each of the �� constituents found in the speci�c sample of wine� For the
dissimilarity measure� we used the Euclidean distance� after normalizing each attribute domain
to the unit interval�
The synthetic datasets are as follows�
GAUSSIAND We generated a dataset of N���� points in �dimensional space� The points form �
clusters� with the same number of points in each cluster� The centers of the clusters were chosen
to be the points ����������� ������������ ������������ ������������ ������������ ������������� The data
points in each cluster follow a Gaussian distribution� with standard deviation � � on each axis
and covariance i�j � � for any i � j� Again� the distance between two such points is the Euclidean
��

distance� This dataset is a simpli�ed version of the one used in a Pattern Recognition textbook
��Fuk�� p� ����
SPIRAL �� points on a �d spiral� as suggested by Duda and Hart ��DH�� p������
x��i� � cosx��i�
x��i� � sin x��i�
x��i� � i�p�� i � �� �� � � ��� ����
�� Comparison with MDS
In the �rst group of experiments� we compare our method with the traditional MDS� using the �WINE�
dataset� To see the dependency on N � we run both algorithms on subsets of varying sizes� namely� N
� ��� ��� ��� �� and ���� For both methods� we experiment with k�� and �� Figure � plots the time
required by each method as a function of the number of records N �a� in doublylinear scales and �b� in
doublylogarithmic scales� We used the time utility of UNIX� and we report user times� In Figure ��b�
we also plotted a linear and a quadratic curve� which� in loglog scales� become straight lines with slopes
� and �� respectively� These lines� labelled as �O�x�� and �O�x���� respectively� are intended as visual
aids� to highlight the fact that MDS requires roughly quadratic time while FastMap requires linear
time on the database size N �The important conclusion is that FastMap achieves dramatic time savings over MDS� even for small
datasets�Next� we want to study the performance of each method as the dimensionality k of the target space
increases� We used the ��point subset and we varied k from � to �� Figure �� shows the time for each
method versus k� again in doubly linear and doubly logarithmic axis� ��a� and �b� respectively�� Notice
that the time of our method increases with k� as expected� while the time for MDS grows even faster�
Again� FastMap provides dramatic savings in time�
0
50
100
150
200
250
45 60 75 90 105
Tim
e (in
sec
onds
)
Number of items (N)
MDS (2d)Fastmap (2d)
MDS (3d)Fastmap (3d)
0.1
1
10
100
1000
45 60 75 90 105 120
log(
Tim
e)
log(N)
MDS (2d)Fastmap (2d)
MDS (3d)Fastmap (3d)
O(x)O(x^2)
�a� �b�
Figure �� Response time vs� database size N for the WINE dataset� MDS and FastMap� with k�����
��

0
50
100
150
200
250
300
350
400
2 3 4 5 6
Tim
e (in
sec
onds
)
Number of dimensions (k)
MDSFastmap
0.1
1
10
100
1000
2 3 4 5 6
log(
Tim
e)
log(k)
MDSFastmap
�a� doublylinear �b� doublylogarithmic
Figure ��� Response time vs� number of dimensions k for the WINE subset �N���� MDS and FastMap
0
0.05
0.1
0.15
0.2
0.25
0.3
0.35
0.4
0 50 100 150 200 250 300 350 400
Str
ess
Time (in seconds)
MDSFastmap
0.001
0.01
0.1
1
0.1 1 10 100 1000
log(
Str
ess)
log(Time)
MDSFastmap
�a� doublylinear �b� doublylogarithmic
Figure ��� Response time vs� stress with varying k� for the WINE subset with N��� MDS and
FastMap
The �nal experiment is to estimate the stress of each method� For the same dimensionality k� MDS
clearly takes longer� as we saw� but it gives lower stress� The question is to �nd the �price�performance�
of each algorithm� that is� how much can each algorithm reduce the �stress�� in a given amount of time�
Thus� Figure �� gives the �stress� for each method� as a function of the response time� in �a� doubly
linear and �b� doubly logarithmic axis� The independent variable was the dimensionality k� In these
graphs� the �ideal� method should give zero �stress�� in zero time� The closer a method goes to the origin
������ the better it is� From the doublylogarithmic graph� we see that FastMap is in general closer to
the �ideal� point ������ Alternatively� for the same value of �stress� �� quality�� we see that FastMap can
produce a mapping almost an order of magnitude faster�
The conclusion of this group of experiments is that� thanks to its linearity� FastMap achieves signif
icant savings in time� without loss in output quality�
��

�� Clusteringvisualization properties of FastMap
In this group of experiments our goal is to show that the proposed algorithm is useful for visualization
and clustering� Here we present the results on several datasets� Unless otherwise stated� we ask for k��
dimensions� Recall that f�� f� and f� stand for the �rst three �FastMapattributes��
First we present the results with the synthetic datasets and then with the real ones�
����� Synthetic Data
Figure �� gives the resulting mapping for k��� for the GAUSSIAN�D dataset �N���� points� forming
� clusters� with �� points per cluster�� In the plots� the points of a given cluster are all indicated by
the same letter� Figure ���a� gives the scatterplot of f� vs f�� while �b� gives the scatterplot of f� vs�
f�� and �c� gives the �d plot with all three �FastMapattributes� Notice that� even with the �rst two
only dimensions f� and f�� we can detect roughly � clusters� using the next scatterplot �b�� we see that
the clusters can be completely separated� because any two clusters are disjoint in at least one of the
scatterplots� Figure ���c� con�rms the previous observation� showing that all � clusters are disjoint in
the �d �target� space�
Although it uses a �ctitious dataset� this example illustrates the ability of FastMap to help with
visualization and clustering�
2.5 5 7.5 10 12.5 15 17.5f1
2.5
5
7.5
10
12.5
15
17.5
f2
AAA
AA
A
AAA A
A
AA
AA
AA
AAABB
BB
BB BB
B
BB
BBBBB BBB
B
C
C CC
CCC
CCCC
CCCC
C
CCC
C
D
DDD
DDD
D
D
DD
D
DDD
D
DD
D
D
E
E
EEE EE
EE
EE
EE EEE
EE
EE
F
FF
FFF
F
FFF FFF
F FF FFF
F
2.5 5 7.5 10 12.5 15 17.5f1
2.5
5
7.5
10
12.5
15
17.5
f3
A
AA
AA
AAAA
AAAA
AAA
AAA
A
BBB
B
BB B
BB
BBBBB
BBBB
BB
C
C CC
CCC CCCCCC CC C
C
CC C
DDDD
D
DD
DDD DDD
D
DDD
DDD
EEEEE EEE
EEEEE E
EEE
E
EE
F
FF F
FF F
F
FF
F
F
FF FF F
F
FF
0
5
10
15f1
0
5
10
15f2
0
5
10
15
f3
0
5
10
15f1
0
5
10
15f2
AAA
AA A A
AA
AA
AA
AAA AAAA
BBB
B
BBBB
BB
B BBBBB
BB
B
B
C CCC
CCC
CCCCCC C C
C
C
CC
C
DDDDD
D
DDD DDD D
DD
D
DD
DD
E
E
EEE
EE
EEEE EE
EE
E EE
E
E
F
FF FF
F F
F
FF
F
F
FF
FF FFF
F
�a� �b� �c�
Figure ��� FastMap on the GAUSSIAN�D dataset �a� f� vs f� �b� f� vs f� and �c� the �d scatterplot
�f�� f�� f��
The next experiment involves the SPIRAL dataset� Figure ���a� plots the original dataset in �d and
�b� shows the result of FastMap for k�� dimensions� Notice that the projections �Figure ���b�� give
much information about the original dataset� the points seems to form a �d curve� with no obvious
clusters� and with some type of oscillation�
�

-10-50 510
-10-505100
50
100
20 40 60 80 100 120
5
10
15
20
25
30
�a� �b�
Figure ��� �a� �d points on a spiral �SPIRAL dataset� and �b� the result of FastMap� for k��
����� Real Data
Next� we present the results for the WINE dataset� in Figure ��� The layout is as in the Figure for the
GAUSSIAN�D dataset� �a� gives a �d scatterplot using the �rst two �FastMapcoordinates� f�� f�� �b�
gives the scatterplot for f� and f� and �c� combines the previous two into a �d scatterplot�
The symbols ����� �$�� �%�� denote members of the �rst� second and third class� respectively� Notice
that the f�f� scatterplot manages to separate one of the three clusters �the one labelled with �%���
The f�f� scatterplot provides some more information to help separate the clusters even better� The
�d scatterplot gives the whole picture and separates the clusters almost completely�
0.25 0.5 0.75 1 1.25 1.5 1.75f1
0.5
1
1.5
2
f2
++
+ +
+
+
+
+
+
+
+
+++
+
++++ +
+++
++
++++
++++
++ +
+
+++
+++
++++
@@
@@
@
@
@@
@
@@@
@
@
@
@
@
@@@@
@
@ @@@ @@
@
@
@@
@
@
@
@
@@@@@
@@
@
@
@@
@
@
@
@@
@
@
@
@
@
@
@
@
@
@
???
??
?? ??
???
??
??
?
?
??
?
??? ? ??
??
??
?
?
???
??? ??
?
?
?
?
0.25 0.5 0.75 1 1.25 1.5 1.75f1
0.25
0.5
0.75
1
1.25
1.5
f3
++
+
+
+
+
++
+
+++++
+ +
+
++
++ +
+
++
+
+ ++
+
++
+++
+
+
+
+
++
+
+
++++
@
@@ @@ @ @
@@
@
@
@@
@
@
@
@
@@ @@@
@
@
@@
@
@
@@
@@
@
@@
@
@@
@
@
@
@
@
@
@@
@ @
@
@
@
@
@
@
@
@@
@
@@
@@
??
??
?
??
?
?
?
?
?
??
?
??
?
?
? ?
?
?
??
??
????
?
?
?
?
???
?
??
?
??
?
0
0.5
1
1.5f1
0
0.5
1
1.5
2
f2
0
0.5
1
1.5
f3
0
0.5
1
1.5f1
0
0.5
1
1.5
2
f2
+++
++
+
+
+
+++
+++
+++
++
++ +
+
++
++
+++
++
+
++
+
+
+
+
+ +
+
+
++
+
+
@@
@ @
@
@
@@
@
@@
@@
@
@
@@
@
@ @@@
@@@@ @@@
@@
@@
@
@
@
@@@
@
@
@@@
@
@
@ @@
@
@
@
@
@
@
@@ @
@ @@
@
??
??
???
??
?
?
??? ?
????
??
?
??? ??
?
?
???
?
?
?
?
??
?
??
?
??
?
�a� �b� �c�
Figure ��� FastMap on WINE dataset �a� k�� with f� vs f�� �b� f� vs f� and �c� k��
For our last dataset� DOCS� the results are shown in Figure ��� The �gure shows the �d scatterplot�
�a� in its entirety and �b� after zooming into the center� to illustrate that FastMap manages to cluster
well the documents of each class� Notice that the � classes are separated well� in only k�� dimensions�
��

0
0.5
1
1.5
f1
0
0.5
1
1.5
f2
0.4
0.6
0.8
1
f3
0
0.5
1
1.5
f1
AbsAbs
Abs
Abs Abs
BbrBbr
Bbr
BbrBbr
Cal
Cal
CalCalCal
Mat
Mat
MatMatMat
Rec
RecRecRecRec
SalSal
Sal
SalSalWorWorWorWorWor
0.5
0.6
0.7
0.8
0.9
f1
0.6
0.7
0.8
0.9
f2
0.7
0.75
0.8
0.85
f3
0.5
0.6
0.7
0.8
0.9
f1
AbsAbsAbs
BbrBbrBbr
Bbr
Cal
Cal
Cal
Cal
MatMat
Mat
Mat
Rec
Rec
Rec
Rec
SalSalSalSal
WorWorWor
WorWor
�a� �b�
Figure ��� The DOCS dataset� after FastMapin k��d space� �a� The big picture� �b� the contents of
the dashed box in more detail�
� Conclusions
We have proposed a fast algorithm to map objects into points in kdimensional space� so that the
distances between the objects are preserved as well as possible�
In an earlier approach for similarity searching in nontraditional�multimedia databases �Jag��� a
domain expert was expected to provide feature extraction functions� Thanks to the proposed �FastMap�
algorithm� the domain expert need only provide a distance function� from which our algorithm will infer
the appropriate features for each object�
Mapping objects into points has the following two applications� Firstly� it can accelerate searching for
several types of queries ��querybyexample� or �range� queries� �all pairs� queries or spatial joins �BKS���
BKSS��� nearest neighbor queries etc��� because several� highly optimized spatial access methods are
readily available �Rtrees �Gut �� R�trees �BKSS�� etc��� Secondly� such a mapping is useful for
datamining� cluster analysis and visualization of a highdimensionality dataset�
The main contribution of this paper is the design of FastMap� a linear algorithm that ful�lls all the
design goals�
�� it solves the general problem ��distance� case� �while� eg�� KL and SVD can only solve the spe
cialized version ��features� case��
�� it is linear on the database size� and therefore much faster than MDS and
�� at the same time� it leads to fast indexing� being able to map a new� arbitrary object into a kd
point in O�k� distance calculations� regardless of the database size N �
The algorithm uses theorems from traditional geometry �such as the cosine law�� and it quickly
projects each object on an appropriate direction at each of the k recursive calls� With respect to quality
��

of output �measured by the �stress� function�� we experimented with FastMap on real datasets� The
result is that it achieves the same �stress� levels as MDS� for a fraction of the time�
A second� smaller contribution� is Eq� �� which turns the cosine similarity into a distance function� that
can be immediately handled by FastMap� Our experiments on real documents showed good clustering
results� Thus� coupled with Eq� �� FastMap seems promising for document clustering and indexing�
The last contribution of the paper is that it introduces tools from pattern recognition� social sciences
and matrix algebra� and speci�cally� the Multi�Dimensional Scaling method �MDS� and the Karhunen
Lo�eve transform �or Singular Value Decomposition� SVD�� Although not as general or as fast as the
proposed algorithm� these tools could be added to the arsenal of database research� to help with indexing
and visualization of nontraditional datasets� MDS has been used in diverse applications to map objects
into kd points using a quadratic� iterative algorithm� Being quadratic on N and unable to handle
�queriesbyexample� easily� MDS is a good choice for visualization of small datasets� The SVD and
the KL transform provide the optimal solution for the �features� case �although unable to handle the
general problem of the �distance� case��
Finally� we have demonstrated the speed and the output quality of our proposed algorithm on real
and synthetic datasets� There� �FastMap� managed to separate all or most of the existing clusters� even
with low values for the dimensionality k of the target space �k�� or � dimensions��
Future work includes�
� Application of the algorithm to multimedia databases� where FastMap should automatically de
termine the features for the given dataset� from the given distance function�
� study of its bene�ts for interactive data mining and clustering and
� the application of the algorithm for document retrieval�
� Acknowledgments
We would like to thank Dr� Joseph B� Kruskal from AT&T Bell Labs for providing the source code for
the MDS algorithms and for answering several questions on them� Patrick M� Murphy and David W�
Aha for maintaining the UCIrvine Repository of Machine Learning Databases and Domain Theories�
Prof� Howard Elman and Doug Oard for help with SVD algorithms�
A Karhunen�Lo�eve Transform
This is the code for the KL transform in Mathematica �Wol��
�� given a matrix mat with n vectors of m attributes�
it creates a matrix with n vectors and their
first k most �important� attributes
�ie�� the K�L expansions of these n vectors �
KLexpansion� mat� k��� �� mat � Transpose� KL�mat� k� ��
�� given a matrix with n vectors of m dimensions�
computes the first k singular vectors�
��

ie�� the axes of the first k Karhunen�Lo���e�ve expansion �
KL� mat � k�� ��� Module�
�n�m� avgvec� newmat�i� val� vec ��
�n�m� � Dimensions�mat��
avgvec � Apply� Plus� mat� � n ��N�
�� translate vectors� so the mean is zero �
newmat � Table� mat��i�� � avgvec � �i���n� ��
�val� vec� � Eigensystem� Transpose�newmat� � newmat ��
vec�� Range���k� ��
�
References
�ACF��� Manish Arya� William Cody� Christos Faloutsos� Joel Richardson� and Arthur Toga�Qbism� a prototype �d medical image database system� IEEE Data Engineering Bulletin�������� '��� March �����
�AFS�� Rakesh Agrawal� Christos Faloutsos� and Arun Swami� E�cient similarity search insequence databases� In Foundations of Data Organization and Algorithms �FODO Con�ference� Evanston� Illinois� October ����� also available through anonymous ftp� fromolympos�cs�umd�edu� ftp�pub�TechReports�fodo�ps�
�AGM��� S�F� Altschul� W� Gish� W� Miller� E�W� Myers� and D�J� Lipman� A basic local alignmentsearch tool� Journal of Molecular Biology� ����������'���� �����
�AIS�� Rakesh Agrawal� Tomasz Imielinski� and Arun Swami� Mining association rules betweensets of items in large databases� Proc� ACM SIGMOD� pages ���'���� May �����
�AS�� Rakesh Agrawal and Ramakrishnan Srikant� Fast algorithms for mining association rulesin large databases� Proc� of VLDB Conf�� pages � �'���� September �����
�BK�� W�A� Burkhard and R�M� Keller� Some approaches to bestmatch �le searching� Comm�of the ACM �CACM� ���������'���� April �����
�BKS�� Thomas Brinkho�� HansPeter Kriegel� and Bernhard Seeger� E�cient processing ofspatial joins using rtrees� Proc� of ACM SIGMOD� pages ���'���� May �����
�BKSS�� N� Beckmann� H�P� Kriegel� R� Schneider� and B� Seeger� The r tree� an e�cient androbust access method for points and rectangles� ACM SIGMOD� pages ���'���� May�����
�BKSS�� Thomas Brinkho�� HansPeter Kriegel� Ralf Schneider� and Bernhard Seeger� Multistepprocessing of spatial joins� ACM SIGMOD� pages ���'�� � May �����
�BYCMW�� Ricardo A� BaezaYates� Walter Cunto� Udi Manber� and Sun Wu� Proximity matchingusing �xed queries trees� In M� Crochemore and D� Gus�eld� editors� th CombinatorialPattern Matching� LNCS ���� pages �� '���� SpringerVerlag� Asilomar� CA� June �����
��

�CoPES�� Mathematical Committee on Physical and NSF Engineering Sciences� Grand Challenges�High Performance Computing and Communications� National Science Foundation� �����The FY ���� U�S� Research and Development Program�
�DH�� R�O� Duda and P�E� Hart� Pattern Classi�cation and Scene Analysis� Wiley� New York������
�Dum�� Susan T� Dumais� Latent semantic indexing �LSI� and TREC�� In D� K� Harman�editor� The Second Text Retrieval Conference �TREC��� pages ���'���� Gaithersburg�MD� March ����� NIST� Special Publication �������
�FD�� Peter W� Foltz and Susan T� Dumais� Personalized information delivery� an analysis ofinformation �ltering methods� Comm� of ACM �CACM� ���������'��� December �����
�FR � C� Faloutsos and S� Roseman� Fractals for secondary key retrieval� Eighth ACM SIGACT�SIGMOD�SIGART Symposium on Principles of Database Systems �PODS� pages ���'���� March �� �� also available as UMIACSTR ��� and CSTR�����
�Fuk�� Keinosuke Fukunaga� Introduction to Statistical Pattern Recognition� Academic Press������ �nd Edition�
�Gar � I� Gargantini� An e�ective way to represent quadtrees� Comm� of ACM �CACM�����������'���� December �� ��
�Gut � A� Guttman� Rtrees� a dynamic index structure for spatial searching� Proc� ACMSIGMOD� pages ��'��� June �� ��
�GV � G� H� Golub and C� F� Van Loan� Matrix Computations� The Johns Hopkins UniversityPress� Baltimore� second edition� �� ��
�Har�� John A� Hartigan� Clustering Algorithms� John Wiley & Sons� �����
�HN � K� Hinrichs and J� Nievergelt� The grid �le� a data structure to support proximity querieson spatial objects� Proc� of the WG��� �Intern� Workshop on Graph Theoretic Conceptsin Computer Science� pages ���'���� �� ��
�Jag��a H� V� Jagadish� Spatial search with polyhedra� Proc� Sixth IEEE Int�l Conf� on DataEngineering� February �����
�Jag��b H�V� Jagadish� Linear clustering of objects with multiple attributes� ACM SIGMODConf�� pages ���'���� May �����
�Jag�� H�V� Jagadish� A retrieval technique for similar shapes� Proc� ACM SIGMOD Conf��pages �� '���� May �����
�JSB�� Mark A� Jones� Guy A� Story� and Bruce W� Ballard� Integrating multiple knowledgesources in a bayesian ocr postprocessor� In First International Conference on DocumentAnalysis and Recognition� SaintMalo� France� September ����� to appear�
�KF�� Ibrahim Kamel and Christos Faloutsos� Hilbert rtree� an improved rtree using fractals�In Proc� of VLDB Conference�� pages ���'���� Santiago� Chile� September �����
�Kru�� Joseph B� Kruskal� Nonmetric multidimensional scaling� Psychometrika� ����'��� �����
��

�Kuk�� Karen Kukich� Techniques for automatically correcting words in text� ACM ComputingSurveys� ���������'���� December �����
�KW� Joseph B� Kruskal and Myron Wish� Multidimensional scaling� SAGE publications�Beverly Hills� ��� �
�LS�� David B� Lomet and Betty Salzberg� The hbtree� a multiattribute indexing method withgood guaranteed performance� ACM TODS� ���������'�� � December �����
�Mur � F� Murtagh� A survey of recent advances in hierarchical clustering algorithms� TheComputer Journal� ���������'���� �� ��
�NBE��� Wayne Niblack� Ron Barber� Will Equitz� Myron Flickner� Eduardo Glasman� DragutinPetkovic� Peter Yanker� Christos Faloutsos� and Gabriel Taubin� The qbic project� Querying images by content using color� texture and shape� SPIE ��� Intl� Symposium onElectronic Imaging� Science and Technology� Conf� ���� Storage and Retrieval for Imageand Video Databases� February ����� Also available as IBM Research Report RJ ����� ������ Feb� �� ����� Computer Science�
�NC�� A� Desai Narasimhalu and Stavros Christodoulakis� Multimedia information systems� theunfolding of a reality� IEEE Computer� ��������' � October �����
�NH�� Raymond T� Ng and Jiawei Han� E�cient and e�ective clustering methods for spatialdata mining� Proc� of VLDB Conf�� pages ���'���� September �����
�NHS � J� Nievergelt� H� Hinterberger� and K�C� Sevcik� The grid �le� an adaptable� symmetricmultikey �le structure� ACM TODS� ������ '��� March �� ��
�Ore � J� Orenstein� Spatial query processing in an objectoriented database system� Proc� ACMSIGMOD� pages ���'���� May �� ��
�Ore�� J�A� Orenstein� A comparison of spatial query processing techniques for native and parameter spaces� Proc� of ACM SIGMOD Conf�� pages ���'���� �����
�Pet � J�L� Peterson� Computer programs for detecting and correcting spelling errors� CACM�����������'� �� December �� ��
�PFTV William H� Press� Brian P� Flannery� Saul A� Teukolsky� and William T� Vetterling�Numerical Recipes in C� Cambridge University Press� �� �
�RL�� A� Ravishankar Rao and Jerry Lohse� Identifying high level features of texture perception�In SPIE Conference� San Jose� February �����
�RSN�� A� Kimball Romney� Roger N� Shepard� and Sara Beth Nerlove� Multidimensional scaling�Theory and applications in the behavioral sciences � vol II � Applications� Seminar Press�New York� �����
�Sha�� M� Shapiro� The choice of reference points in bestmatch �le searching� Comm� of theACM �CACM� ���������'���� May �����
�She�� R� N� Shepard� The analysis of proximities� Multidimensional scaling with an u nknowndistance i and ii� Psychometrika� ������'���� ���'���� �����
��

�SK � David Sanko� and Joseph B� Kruskal� Time Warps� String Edits and Macromolecules�the Theory and Practice of Sequence Comparisons� AddisonWesley Publishing Company�Inc�� Reading� MA� �� ��
�SM � G� Salton and M�J� McGill� Introduction to Modern Information Retrieval� McGrawHill��� ��
�SRF � T� Sellis� N� Roussopoulos� and C� Faloutsos� The r� tree� a dynamic index for multidimensional objects� In Proc� �th International Conference on VLDB� pages ���'�� �England�� September �� �� also available as SRCTR ���� UMIACSTR ��� CSTR�����
�Str � Gilbert Strang� Linear Algebra and its Applications� Academic Press� �� �� �nd edition�
�SW�� Dennis Shasha and TsongLi Wang� New techniques for bestmatch retrieval� ACM TOIS� �������'�� � April �����
�TBS�� A�W� Toga� P�K� Banerjee� and E�M� Santori� Warping �d models for interbrain comparisons� Neurosc� Abs�� ������� �����
�Tor�� W� S� Torgerson� Multidimensional scaling� I� theory and method� Psychometrika� ������'���� �����
�Vas�� Dimitris Vassiliadis� The inputstate space approach to the prediction of auroral geomagnetic activity from solar wind variables� Int� Workshop on Applications of Arti�cialIntelligence in Solar Terrestrial Physics� September �����
�VR�� C�J� VanRijsbergen� Information Retrieval� Butterworths� London� England� ����� �ndedition�
�Wol�� Stephen Wolfram� Mathematica� Addison Wesley� ����� Second Edition�
�You � Forrest W� Young� Multidimensional scaling � History� Theory and Applications�Lawrence Erlbaum associates� Hillsdale� New Jersey� �� ��
��

Contents
� Introduction �
� Survey ���� MultiDimensional Scaling �MDS� � � � � � � � � � � � � � � � � � � � � � � � � � � � � � � ���� Dimensionality reduction techniques � � � � � � � � � � � � � � � � � � � � � � � � � � � � � ���� Retrieval and Clustering � � � � � � � � � � � � � � � � � � � � � � � � � � � � � � � � � � � � �
� Proposed Method ���� Algorithm � � � � � � � � � � � � � � � � � � � � � � � � � � � � � � � � � � � � � � � � � � � � ���� Arithmetic Example � � � � � � � � � � � � � � � � � � � � � � � � � � � � � � � � � � � � � � ����� Case Study� Document Vectors and Information Retrieval� � � � � � � � � � � � � � � � � � ��
� Experiments ����� Comparison with MDS � � � � � � � � � � � � � � � � � � � � � � � � � � � � � � � � � � � � � ����� Clustering�visualization properties of FastMap � � � � � � � � � � � � � � � � � � � � � � � �
����� Synthetic Data � � � � � � � � � � � � � � � � � � � � � � � � � � � � � � � � � � � � � � ����� Real Data � � � � � � � � � � � � � � � � � � � � � � � � � � � � � � � � � � � � � � � � ��
Conclusions �
� Acknowledgments ��
A Karhunen�Lo�eve Transform ��
i


![DiskANN: Fast Accurate Billion-point Nearest Neighbor ... · datasets are often graph-based algorithms such as HNSW [21] and NSG [13] where the indexing algorithm constructs a navigable](https://img.dokumen.tips/doc/110x75/5f028d4e7e708231d404d44f/diskann-fast-accurate-billion-point-nearest-neighbor-datasets-are-often-graph-based.jpg)