Embed Size (px)
Citation preview
Ap
plica
tion
No
te 2
14
65
Fast Online Desalting of mAbs Using a Reversed-Phase Desalting Cartridge for LC-MS AnalysisMartin Samonig,¹ Shane Bechler,² Kelly Flook², and Remco Swart¹¹Thermo Fisher Scientific, Germering, Germany²Thermo Fisher Scientific, Sunnyvale, CA, USA
IntroductionMonoclonal antibodies (mAbs) as biopharmaceutical therapeutics have grown rapidly over the last decade. This class of drug is forecasted to be the primary treatment for a wide range of diseases including cardiovascular, autoimmune disorders, and cancers.1 During drug development, biopharmaceutical companies typically use mass spectrometry (MS) to structurally characterize mAbs produced by hundreds of different monoclonal cell lines. The main objective is to determine monoclonal cell populations that produce the desired mAb with a high degree of fidelity and high activity for a specific antigen. To make the MS characterization process economical, high-throughput methods must be developed that enable rapid and inexpensive characterization of mAbs to select promising cell lines for further development.
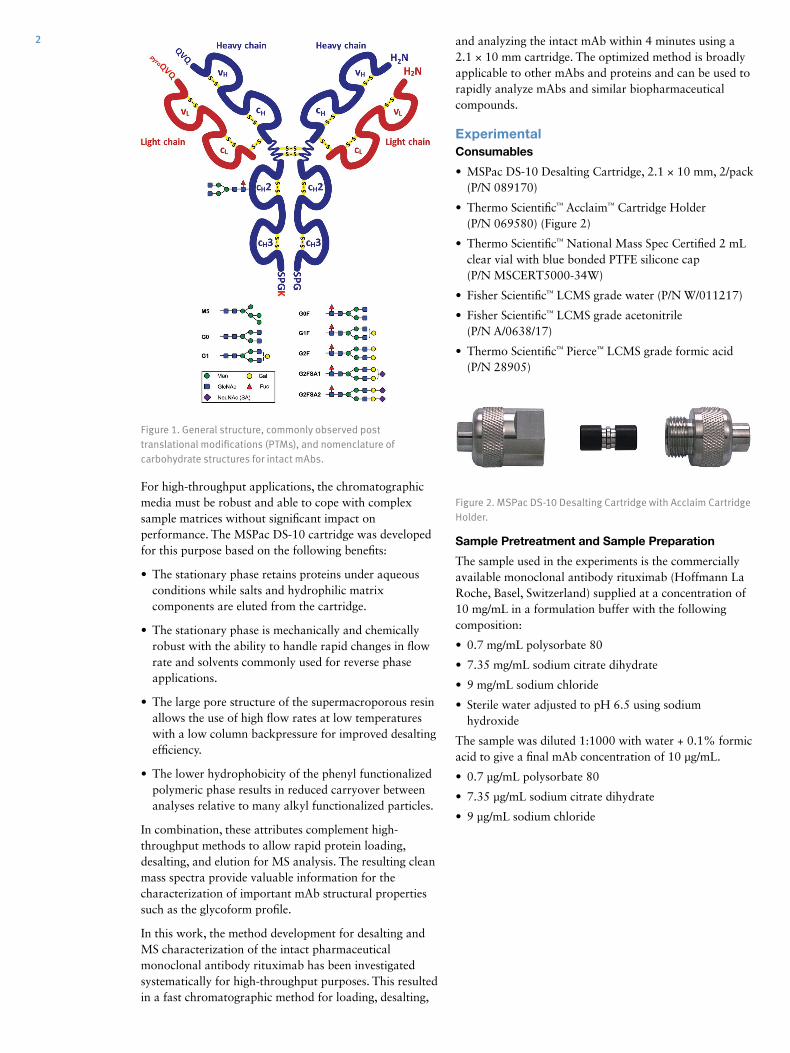
Mass spectrometry is an essential tool in the characterization of mAbs, providing molecular weight determination and structural information of intact mAbs as shown in Figure 1. Direct infusion of the dissolved mAb into the MS is the simplest approach to characterize the proteins. However, the sample matrix of the recovered and purified mAb possesses a variety of salts, stabilizers, detergents, and other adduct forming ions. These can interfere with MS characterization by decreasing sensitivity and can result in instrument fouling, ultimately leading to downtime.
Key WordsDesalting, MSPac, monoclonal antibody, mAb, Vanquish, reversed phase, mass spectrometry, Q Exactive, biopharmaceutical, biomolecules, glycosylation, intact protein
GoalTo demonstrate a simple on-line desalting method for rapid, automated analysis of mAbs with LC-MS to obtain information-rich, high-quality spectra. The desalting method optimization was conducted on a 2.1 × 10 mm Thermo Scientific™ MSPac™ DS-10 cartridge using conventional water/acetonitrile-based separations on the Thermo Scientific™ Vanquish™ UHPLC system and MS detection using the Thermo Scientific™ Q Exactive™ Plus Hybrid Quadrupole-Orbitrap™ mass spectrometer.
Liquid chromatography can be used to remove salts and other buffer components prior to MS detection. Reversed-phase chromatographic approaches are particularly well suited for protein desalting prior to MS analysis due to the technique’s ability to retain proteins under aqueous conditions, allowing salts and other hydrophilic matrix components to elute to waste. However, careful column selection and method development is required for effective protein desalting using reversed phase methods.
2
For high-throughput applications, the chromatographic media must be robust and able to cope with complex sample matrices without significant impact on performance. The MSPac DS-10 cartridge was developed for this purpose based on the following benefits:
• The stationary phase retains proteins under aqueous conditions while salts and hydrophilic matrix components are eluted from the cartridge.
• The stationary phase is mechanically and chemically robust with the ability to handle rapid changes in flow rate and solvents commonly used for reverse phase applications.
• The large pore structure of the supermacroporous resin allows the use of high flow rates at low temperatures with a low column backpressure for improved desalting efficiency.
• The lower hydrophobicity of the phenyl functionalized polymeric phase results in reduced carryover between analyses relative to many alkyl functionalized particles.
In combination, these attributes complement high-throughput methods to allow rapid protein loading, desalting, and elution for MS analysis. The resulting clean mass spectra provide valuable information for the characterization of important mAb structural properties such as the glycoform profile.
In this work, the method development for desalting and MS characterization of the intact pharmaceutical monoclonal antibody rituximab has been investigated systematically for high-throughput purposes. This resulted in a fast chromatographic method for loading, desalting,
and analyzing the intact mAb within 4 minutes using a 2.1 × 10 mm cartridge. The optimized method is broadly applicable to other mAbs and proteins and can be used to rapidly analyze mAbs and similar biopharmaceutical compounds.
Experimental Consumables
• MSPac DS-10 Desalting Cartridge, 2.1 × 10 mm, 2/pack (P/N 089170)
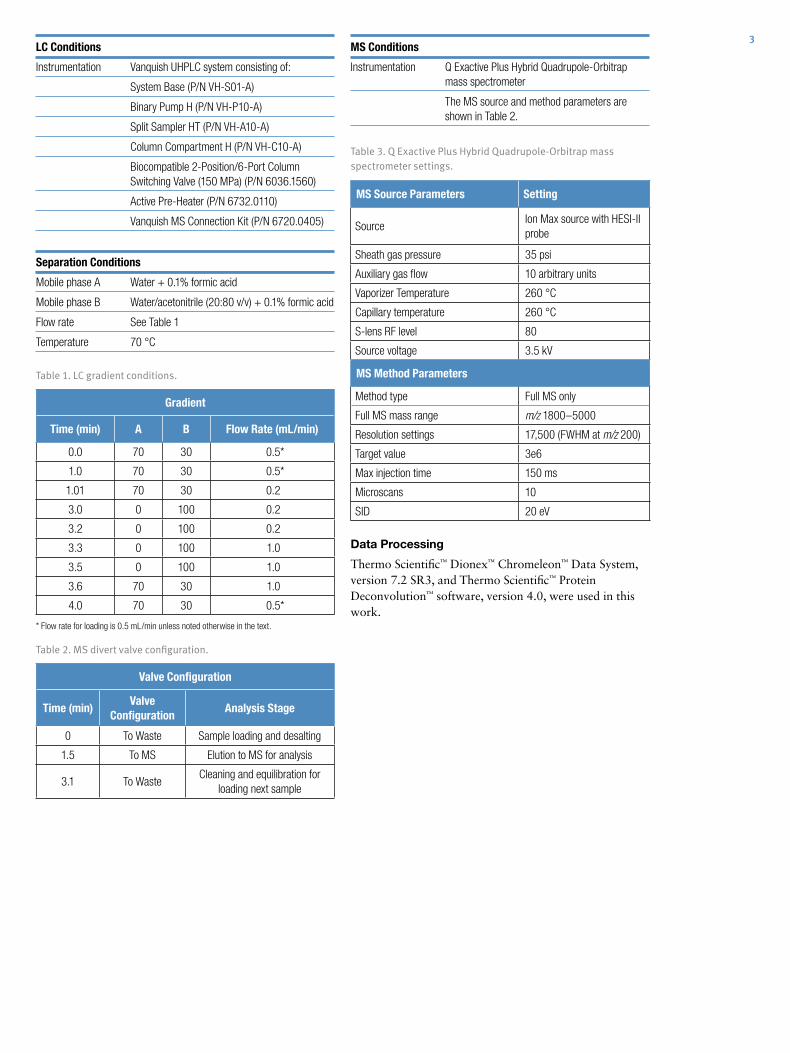
• Thermo Scientific™ Acclaim™ Cartridge Holder (P/N 069580) (Figure 2)
• Thermo Scientific™ National Mass Spec Certified 2 mL clear vial with blue bonded PTFE silicone cap (P/N MSCERT5000-34W)
• Fisher Scientific™ LCMS grade water (P/N W/011217)
• Fisher Scientific™ LCMS grade acetonitrile (P/N A/0638/17)
• Thermo Scientific™ Pierce™ LCMS grade formic acid (P/N 28905)
Figure 1. General structure, commonly observed post translational modifications (PTMs), and nomenclature of carbohydrate structures for intact mAbs.
Sample Pretreatment and Sample Preparation
The sample used in the experiments is the commercially available monoclonal antibody rituximab (Hoffmann La Roche, Basel, Switzerland) supplied at a concentration of 10 mg/mL in a formulation buffer with the following composition:
• 0.7 mg/mL polysorbate 80
• 7.35 mg/mL sodium citrate dihydrate
• 9 mg/mL sodium chloride
• Sterile water adjusted to pH 6.5 using sodium hydroxide
The sample was diluted 1:1000 with water + 0.1% formic acid to give a final mAb concentration of 10 µg/mL.
• 0.7 µg/mL polysorbate 80
• 7.35 µg/mL sodium citrate dihydrate
• 9 µg/mL sodium chloride
Figure 2. MSPac DS-10 Desalting Cartridge with Acclaim Cartridge Holder.
3
Data Processing
Thermo Scientific™ Dionex™ Chromeleon™ Data System, version 7.2 SR3, and Thermo Scientific™ Protein Deconvolution™ software, version 4.0, were used in this work.
LC Conditions
Instrumentation Vanquish UHPLC system consisting of:
System Base (P/N VH-S01-A)
Binary Pump H (P/N VH-P10-A)
Split Sampler HT (P/N VH-A10-A)
Column Compartment H (P/N VH-C10-A)
Biocompatible 2-Position/6-Port Column Switching Valve (150 MPa) (P/N 6036.1560)
Active Pre-Heater (P/N 6732.0110)
Vanquish MS Connection Kit (P/N 6720.0405)
MS Conditions
Instrumentation Q Exactive Plus Hybrid Quadrupole-Orbitrap mass spectrometer
The MS source and method parameters are shown in Table 2.
Separation Conditions
Mobile phase A Water + 0.1% formic acid
Mobile phase B Water/acetonitrile (20:80 v/v) + 0.1% formic acid
Flow rate See Table 1
Temperature 70 °C
Gradient
Time (min) A B Flow Rate (mL/min)
0.0 70 30 0.5*
1.0 70 30 0.5*
1.01 70 30 0.2
3.0 0 100 0.2
3.2 0 100 0.2
3.3 0 100 1.0
3.5 0 100 1.0
3.6 70 30 1.0
4.0 70 30 0.5*
Table 1. LC gradient conditions.
* Flow rate for loading is 0.5 mL/min unless noted otherwise in the text.
Valve Configuration
Time (min)Valve
ConfigurationAnalysis Stage
0 To Waste Sample loading and desalting
1.5 To MS Elution to MS for analysis
3.1 To WasteCleaning and equilibration for
loading next sample
Table 3. Q Exactive Plus Hybrid Quadrupole-Orbitrap mass spectrometer settings.
MS Source Parameters Setting
SourceIon Max source with HESI-II probe
Sheath gas pressure 35 psi
Auxiliary gas flow 10 arbitrary units
Vaporizer Temperature 260 °C
Capillary temperature 260 °C
S-lens RF level 80
Source voltage 3.5 kV
MS Method Parameters
Method type Full MS only
Full MS mass range m/z 1800–5000
Resolution settings 17,500 (FWHM at m/z 200)
Target value 3e6
Max injection time 150 ms
Microscans 10
SID 20 eV
Table 2. MS divert valve configuration.
4 Results and DiscussionSeparation Method for High-Throughput Desalting and MS Analysis
The objective of high-throughput analysis is characterization of the samples of interest with minimal total analysis time for each sample. LC-MS methods for high-throughput analysis must be carefully designed in order to optimize the chromatographic separation for accurate MS analysis. Flow rate, temperature, gradient
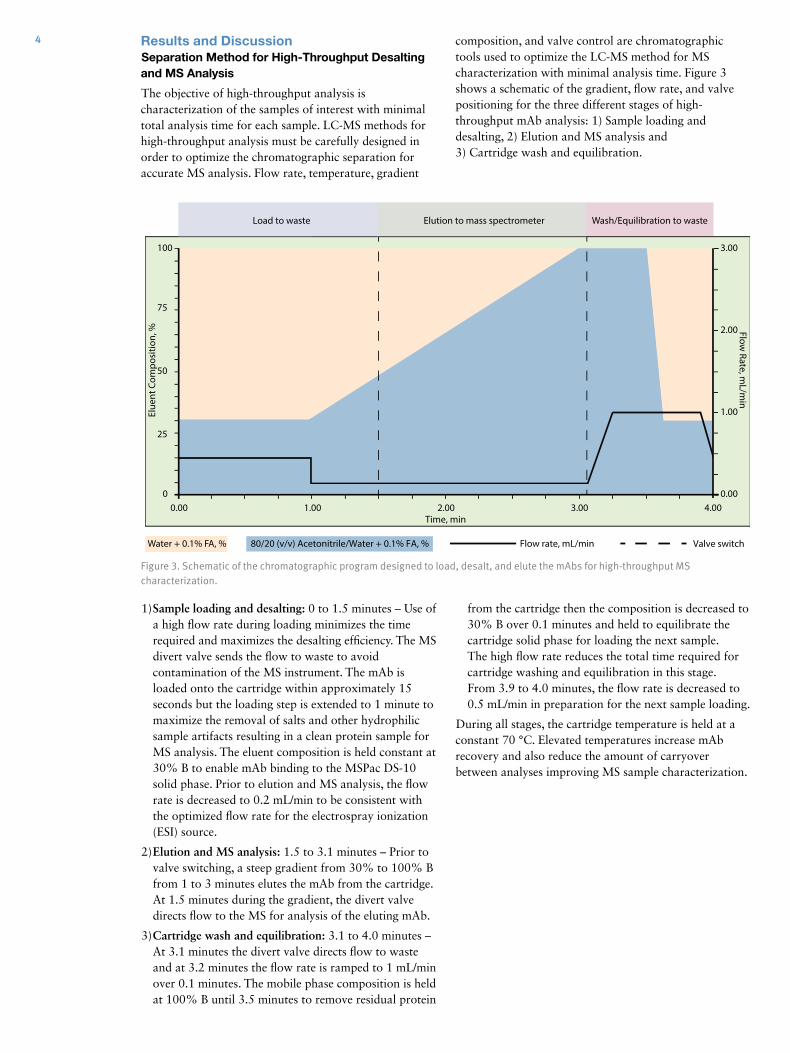
composition, and valve control are chromatographic tools used to optimize the LC-MS method for MS characterization with minimal analysis time. Figure 3 shows a schematic of the gradient, flow rate, and valve positioning for the three different stages of high-throughput mAb analysis: 1) Sample loading and desalting, 2) Elution and MS analysis and 3) Cartridge wash and equilibration.
Figure 3. Schematic of the chromatographic program designed to load, desalt, and elute the mAbs for high-throughput MS characterization.
alve switch
Elue
nt C
ompo
sitio
n, %
0
25
50
75
100
0.00 1.00 2.00 3.00 4.00
Flow Rate, m
L/min
0.00
1.00
2.00
3.00
Load to aste Wash/Equilibration to waste
Water + 0.1% FA, % Flow rate, mL/min
Elution to ass pectrometer
80/20 (v/v) Acetonitrile/Water + 0.1% FA, %
Time, min
1) Sample loading and desalting: 0 to 1.5 minutes – Use of a high flow rate during loading minimizes the time required and maximizes the desalting efficiency. The MS divert valve sends the flow to waste to avoid contamination of the MS instrument. The mAb is loaded onto the cartridge within approximately 15 seconds but the loading step is extended to 1 minute to maximize the removal of salts and other hydrophilic sample artifacts resulting in a clean protein sample for MS analysis. The eluent composition is held constant at 30% B to enable mAb binding to the MSPac DS-10 solid phase. Prior to elution and MS analysis, the flow rate is decreased to 0.2 mL/min to be consistent with the optimized flow rate for the electrospray ionization (ESI) source.
2) Elution and MS analysis: 1.5 to 3.1 minutes – Prior to valve switching, a steep gradient from 30% to 100% B from 1 to 3 minutes elutes the mAb from the cartridge. At 1.5 minutes during the gradient, the divert valve directs flow to the MS for analysis of the eluting mAb.
3) Cartridge wash and equilibration: 3.1 to 4.0 minutes – At 3.1 minutes the divert valve directs flow to waste and at 3.2 minutes the flow rate is ramped to 1 mL/min over 0.1 minutes. The mobile phase composition is held at 100% B until 3.5 minutes to remove residual protein
from the cartridge then the composition is decreased to 30% B over 0.1 minutes and held to equilibrate the cartridge solid phase for loading the next sample. The high flow rate reduces the total time required for cartridge washing and equilibration in this stage. From 3.9 to 4.0 minutes, the flow rate is decreased to 0.5 mL/min in preparation for the next sample loading.
During all stages, the cartridge temperature is held at a constant 70 °C. Elevated temperatures increase mAb recovery and also reduce the amount of carryover between analyses improving MS sample characterization.
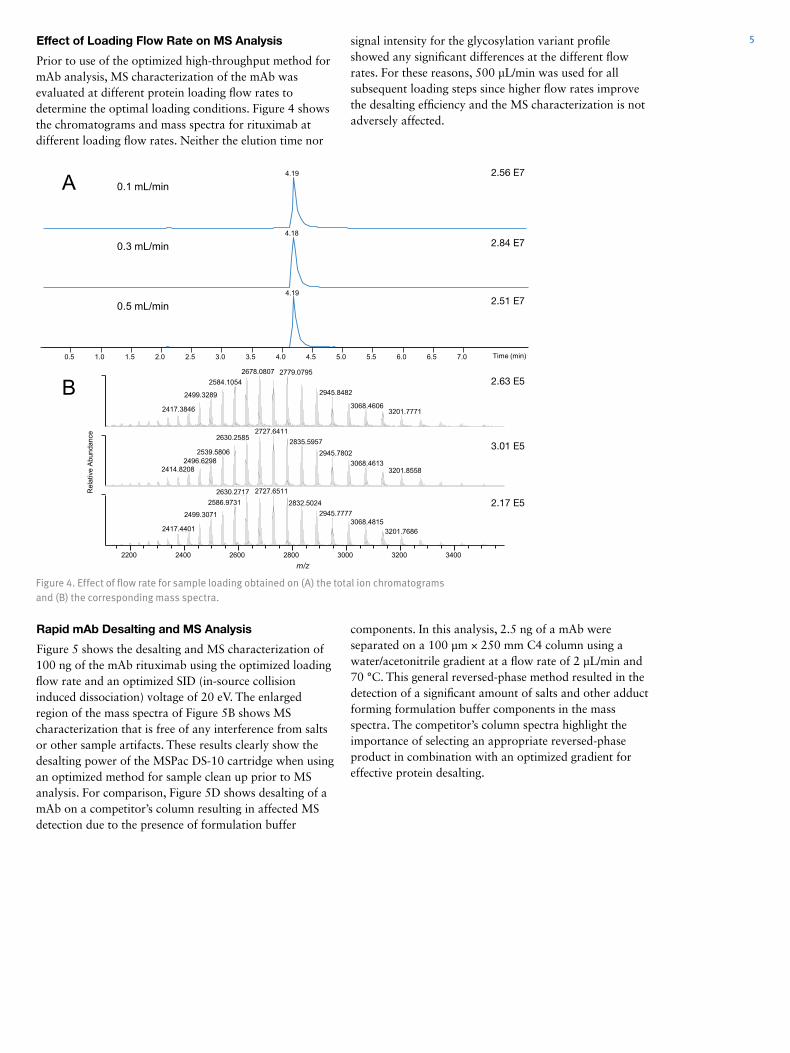
5Effect of Loading Flow Rate on MS Analysis
Prior to use of the optimized high-throughput method for mAb analysis, MS characterization of the mAb was evaluated at different protein loading flow rates to determine the optimal loading conditions. Figure 4 shows the chromatograms and mass spectra for rituximab at different loading flow rates. Neither the elution time nor
Figure 4. Effect of flow rate for sample loading obtained on (A) the total ion chromatograms and (B) the corresponding mass spectra.
m/z
2.56 E7
2.84 E7
2.51 E7
2.63 E5
3.01 E5
2.17 E5
signal intensity for the glycosylation variant profile showed any significant differences at the different flow rates. For these reasons, 500 µL/min was used for all subsequent loading steps since higher flow rates improve the desalting efficiency and the MS characterization is not adversely affected.
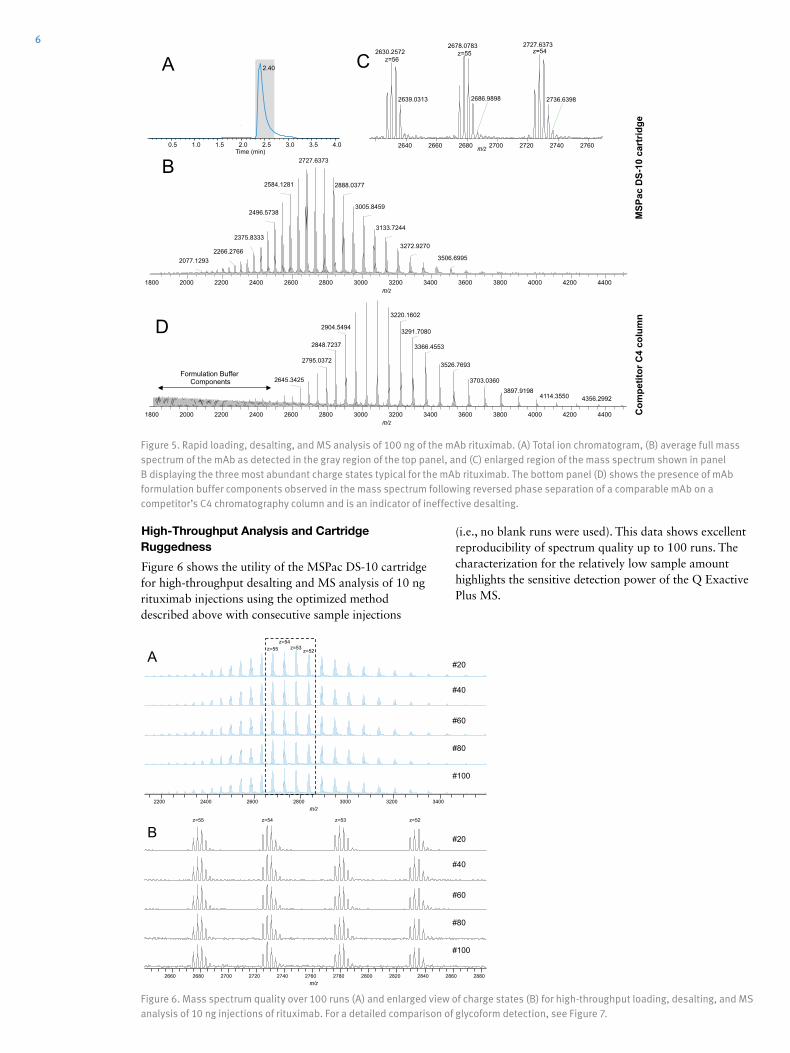
Rapid mAb Desalting and MS Analysis
Figure 5 shows the desalting and MS characterization of 100 ng of the mAb rituximab using the optimized loading flow rate and an optimized SID (in-source collision induced dissociation) voltage of 20 eV. The enlarged region of the mass spectra of Figure 5B shows MS characterization that is free of any interference from salts or other sample artifacts. These results clearly show the desalting power of the MSPac DS-10 cartridge when using an optimized method for sample clean up prior to MS analysis. For comparison, Figure 5D shows desalting of a mAb on a competitor’s column resulting in affected MS detection due to the presence of formulation buffer
components. In this analysis, 2.5 ng of a mAb were separated on a 100 µm × 250 mm C4 column using a water/acetonitrile gradient at a flow rate of 2 µL/min and 70 °C. This general reversed-phase method resulted in the detection of a significant amount of salts and other adduct forming formulation buffer components in the mass spectra. The competitor’s column spectra highlight the importance of selecting an appropriate reversed-phase product in combination with an optimized gradient for effective protein desalting.
6
Figure 5. Rapid loading, desalting, and MS analysis of 100 ng of the mAb rituximab. (A) Total ion chromatogram, (B) average full mass spectrum of the mAb as detected in the gray region of the top panel, and (C) enlarged region of the mass spectrum shown in panel B displaying the three most abundant charge states typical for the mAb rituximab. The bottom panel (D) shows the presence of mAb formulation buffer components observed in the mass spectrum following reversed phase separation of a comparable mAb on a competitor’s C4 chromatography column and is an indicator of ineffective desalting.
2640 2660 2680 2700 2720 2740 2760 m/z
2727.6373 z=54 2678.0783
z=55 2630.2572 z=56
2736.6398 2686.9898 2639.0313
0.5 1.0 1.5 2.0 2.5 3.0 3.5 4.0 Time (min)
2.40
B
A C
1800 2000 2200 2400 2600 2800 3000 3200 3400 3600 3800 4000 4200 4400 m/z
3220.1602 2904.5494
3291.7080 2848.7237 3366.4553
2795.0372 3526.7693
2645.3425 3703.0360 3897.9198
4114.3550 4356.2992
D
Formulation Buffer Components
nmuloc 4
C rotitepmo
CM
SPac
DS-
10 c
artr
idge
1800 2000 2200 2400 2600 2800 3000 3200 3400 3600 3800 4000 4200 4400 m/z
2727.6373
2888.0377 2584.1281 3005.8459
2496.5738 3133.7244
2375.8333 3272.9270
2266.2766 3506.6995 2077.1293
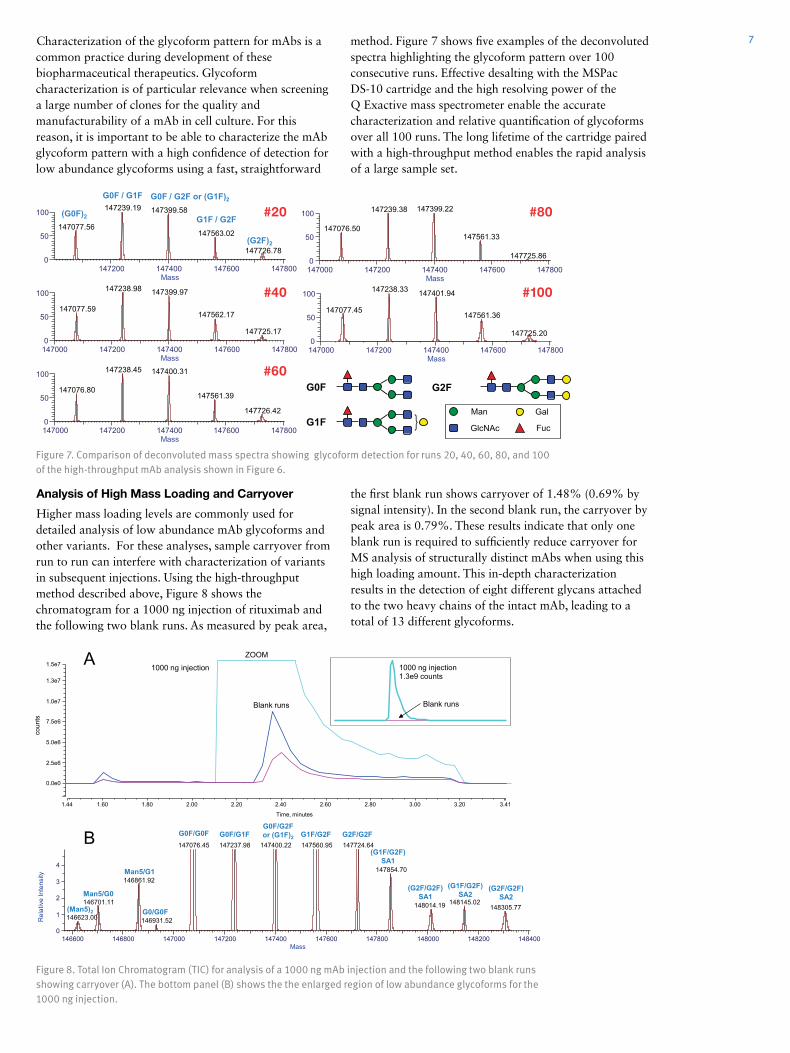
High-Throughput Analysis and Cartridge Ruggedness
Figure 6 shows the utility of the MSPac DS-10 cartridge for high-throughput desalting and MS analysis of 10 ng rituximab injections using the optimized method described above with consecutive sample injections
#20
#40
#60
#80
#100
#20
#40
#60
#80
#100
2200 2400 2600 2800 3000 3200 3400 m/z
2660 2680 2700 2720 2740 2760 2780 2800 2820 2840 2860 2880 m/z
z=55 z=54 z=53 z=52
z=55 z=53 A
B
z=54 z=52
Figure 6. Mass spectrum quality over 100 runs (A) and enlarged view of charge states (B) for high-throughput loading, desalting, and MS analysis of 10 ng injections of rituximab. For a detailed comparison of glycoform detection, see Figure 7.
(i.e., no blank runs were used). This data shows excellent reproducibility of spectrum quality up to 100 runs. The characterization for the relatively low sample amount highlights the sensitive detection power of the Q Exactive Plus MS.
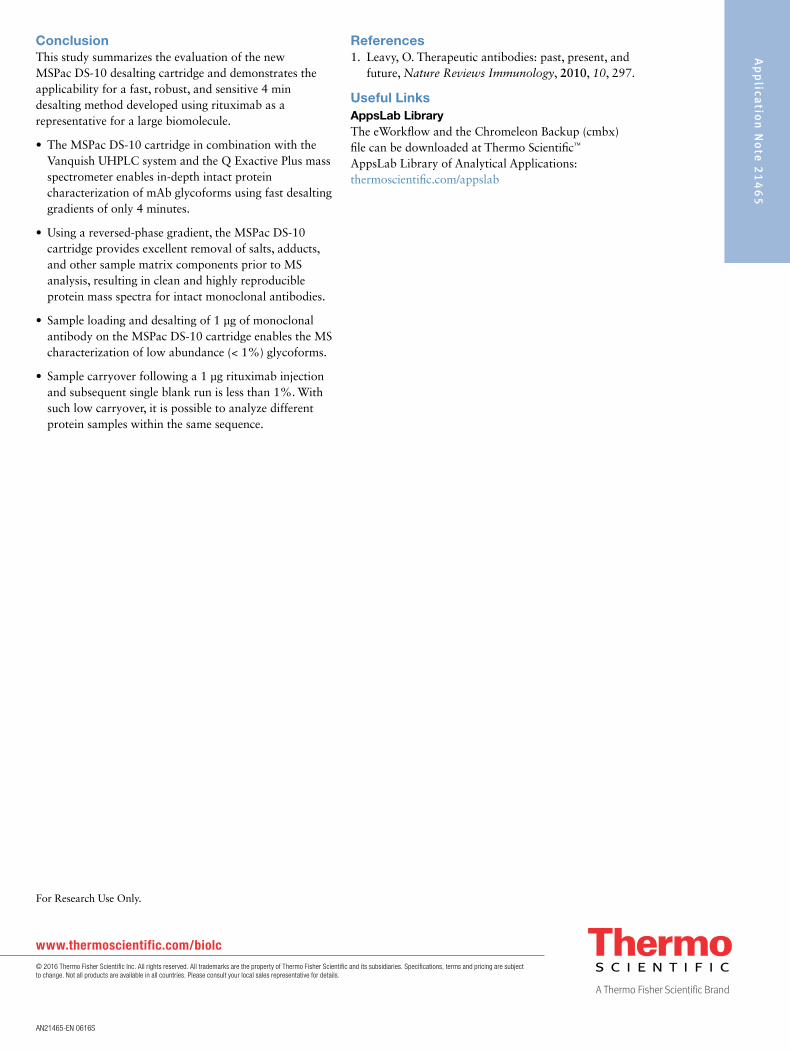
Characterization of the glycoform pattern for mAbs is a common practice during development of these biopharmaceutical therapeutics. Glycoform characterization is of particular relevance when screening a large number of clones for the quality and manufacturability of a mAb in cell culture. For this reason, it is important to be able to characterize the mAb glycoform pattern with a high confidence of detection for low abundance glycoforms using a fast, straightforward
method. Figure 7 shows five examples of the deconvoluted spectra highlighting the glycoform pattern over 100 consecutive runs. Effective desalting with the MSPac DS-10 cartridge and the high resolving power of the Q Exactive mass spectrometer enable the accurate characterization and relative quantification of glycoforms over all 100 runs. The long lifetime of the cartridge paired with a high-throughput method enables the rapid analysis of a large sample set.
Figure 7. Comparison of deconvoluted mass spectra showing glycoform detection for runs 20, 40, 60, 80, and 100 of the high-throughput mAb analysis shown in Figure 6.
}
G0F
G1F
G2F
Fuc
Gal
Analysis of High Mass Loading and Carryover
Higher mass loading levels are commonly used for detailed analysis of low abundance mAb glycoforms and other variants. For these analyses, sample carryover from run to run can interfere with characterization of variants in subsequent injections. Using the high-throughput method described above, Figure 8 shows the chromatogram for a 1000 ng injection of rituximab and the following two blank runs. As measured by peak area,
the first blank run shows carryover of 1.48% (0.69% by signal intensity). In the second blank run, the carryover by peak area is 0.79%. These results indicate that only one blank run is required to sufficiently reduce carryover for MS analysis of structurally distinct mAbs when using this high loading amount. This in-depth characterization results in the detection of eight different glycans attached to the two heavy chains of the intact mAb, leading to a total of 13 different glycoforms.
1000 ng injection 1.3e9 counts
Blank runs
Figure 8. Total Ion Chromatogram (TIC) for analysis of a 1000 ng mAb injection and the following two blank runs showing carryover (A). The bottom panel (B) shows the the enlarged region of low abundance glycoforms for the 1000 ng injection.
7
#20
#40
#60
#100
#80
Ap
plica
tion
No
te 2
14
65
ConclusionThis study summarizes the evaluation of the new MSPac DS-10 desalting cartridge and demonstrates the applicability for a fast, robust, and sensitive 4 min desalting method developed using rituximab as a representative for a large biomolecule.
• The MSPac DS-10 cartridge in combination with the Vanquish UHPLC system and the Q Exactive Plus mass spectrometer enables in-depth intact protein characterization of mAb glycoforms using fast desalting gradients of only 4 minutes.
• Using a reversed-phase gradient, the MSPac DS-10 cartridge provides excellent removal of salts, adducts, and other sample matrix components prior to MS analysis, resulting in clean and highly reproducible protein mass spectra for intact monoclonal antibodies.
• Sample loading and desalting of 1 μg of monoclonal antibody on the MSPac DS-10 cartridge enables the MS characterization of low abundance (< 1%) glycoforms.
• Sample carryover following a 1 μg rituximab injection and subsequent single blank run is less than 1%. With such low carryover, it is possible to analyze different protein samples within the same sequence.
References1. Leavy, O. Therapeutic antibodies: past, present, and future, Nature Reviews Immunology, 2010, 10, 297.
Useful Links AppsLab Library The eWorkflow and the Chromeleon Backup (cmbx) file can be downloaded at Thermo Scientific™ AppsLab Library of Analytical Applications:thermoscientific.com/appslab
For Research Use Only.
AN21465-EN 0616S
www.thermoscientific.com/biolc© 2016 Thermo Fisher Scientific Inc. All rights reserved. All trademarks are the property of Thermo Fisher Scientific and its subsidiaries. Specifications, terms and pricing are subject to change. Not all products are available in all countries. Please consult your local sales representative for details.