Embed Size (px)
Citation preview

FAST(Femoral Artery Stenting Trial)
Final Results
FAST(Femoral Artery Stenting Trial)
Final Results
Hans KrankenbergHans Krankenberg(on behalf of the FAST Investigators)(on behalf of the FAST Investigators)Hamburg University Cardiovascular CenterHamburg University Cardiovascular Center
Prof. Schofer, Prof. Mathey & PartnersProf. Schofer, Prof. Mathey & PartnersHamburg, GermanyHamburg, Germany

Institution Investigators Enrollment
Berlin, Germany H. Steinkamp 60
Bad Krozingen, Germany T. Zeller 57
Hamburg, Germany H. Krankenberg 39
Leipzig, Germany D. Scheinert 28
Berlin, Germany K.L. Schulte 18
Tübingen, Germany G. Tepe 4
Vienna, Austria E. Minar 14
Bonheiden, Belgium P. Peeters 13
Dendermonde, Belgium M. Bosiers 5
Mirano, Italy B. Reimers 4
Bern, Switzerland F. Mahler 3
FASTParticipating Centers
FASTParticipating Centers

FASTPurposeFAST
Purpose
To assess the efficacy of nitinol stent implantation (Bard® Luminexx® 3 Vascular Stent [C.R. Bard, Inc.]) vs. stand-alone balloon angioplasty (PTA) in patients with superficial femoral artery (SFA) disease
Primary Endpoint::Binary restenosis (>50% stenosis on duplex Binary restenosis (>50% stenosis on duplex ultrasound)ultrasound) at 12 monthsat 12 months
The The Bard® Luminexx® 3 Vascular Stent is not available in the U.S.

FASTHypothesis
FASTHypothesis
Assumptions: 12-month restenosis rate in the PTA arm:
45% 12-month restenosis rate in the nitinol
stent arm: 25% (relative reduction by 44%)
To establish this difference (45% vs. 25%) with statistical significance (2-sided error of 0.05, 80% power) and assuming a 15% drop-out rate, a total of 244 patients (122 per arm) would be required.

FAST Key Inclusion Criteria
FAST Key Inclusion Criteria
Clinical: Rutherford classification ≥ 2
Angiographic: Single de novo SFA lesion ≥ 1 cm from origin Target lesion length 1–10 cm
(visual estimate) Target lesion stenosis 70–100%
(visual estimate) Popliteal artery patent At least one infrapopliteal artery patent
(for distal run-off)

FASTTrial Profile
FASTTrial Profile
244 244 PatientsPatients
PTAPTA(n = 121)(n = 121)
RR
Intention-to-Treat
Analysis
PTAPTA(n = 108)(n = 108)
StentStent(n = 136)(n = 136)
CrossoverCrossover(n = (n = 1313 [ [11%11%])])
On-TreatmentAnalysis
Luminexx® 3 (C.R. Bard)
StentStent(n = 123)(n = 123)
12/03–3/05:12/03–3/05:
0
20
40
60
80
PTA(n=121)
Stent(n=123)
[mm
]FAST
Lesion CharacteristicsFAST
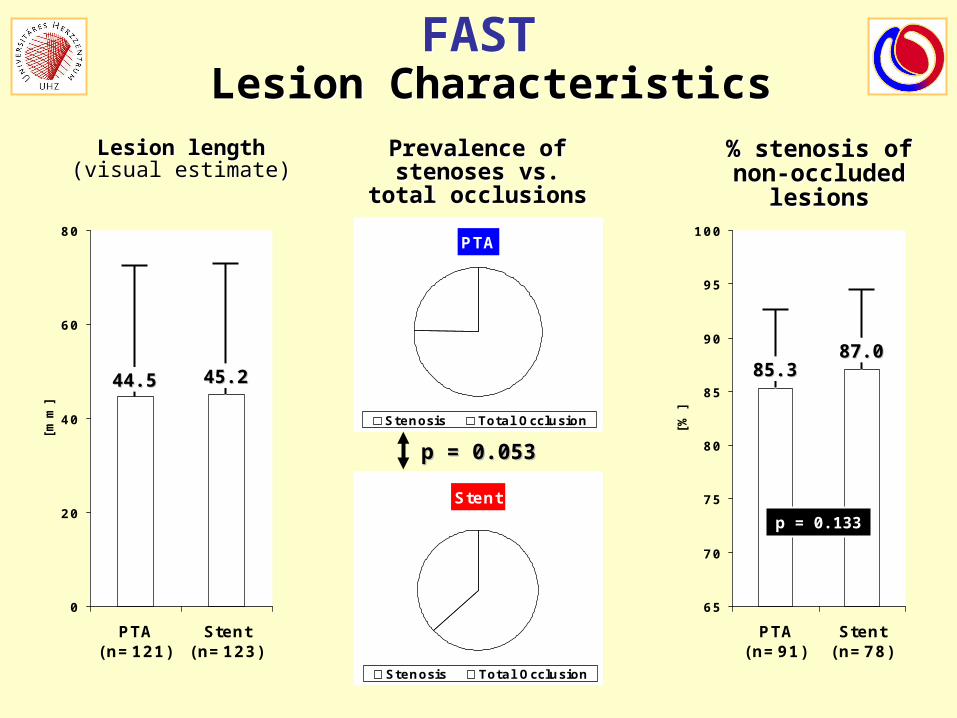
Lesion CharacteristicsLesion length
(visual estimate)Lesion length
(visual estimate)
44.544.5 45.245.2
PTA
75%
25%
Stenosis Total Occlusion
Stent
63%37%
Stenosis Total Occlusion
p = 0.053p = 0.053
Prevalence of stenoses vs.
total occlusions
Prevalence of stenoses vs.
total occlusions
65
70
75
80
85
90
95
100
PTA(n=91)
Stent(n=78)
[%]
8585.3.38787.0.0
% stenosis of non-occluded
lesions
% stenosis of non-occluded
lesions
p = 0.133

FAST 12-Month Results
FAST 12-Month Results
Binary Restenosis (1ry End Point) Binary Restenosis (1ry End Point)
38.6 37.8
31.7 33.0
0
10
20
30
40
I ntention to Treat On Treatment
(% )
PTA Stent
p = 0.554p = 0.377
39/10139/101 32/10132/101 34/9034/90 37/11237/112

0.70 (0.37-1.33)
0.94 (0.46-1.90)
0.53 (0.25-1.09)
FAST 12-Month Results – ITT
FAST 12-Month Results – ITT
Impact of treatment modality on 12-month restenosis in patient/lesion subgroups
Impact of treatment modality on 12-month restenosis in patient/lesion subgroups
0.0 0.5 1.0 1.5 2.0 2.5 3.0 3.5 4.0 4.5 5.0
Women
Men
Normal cholesterol
Hyperlipidemia
Smoker (ex/current)
Hypertension
Nondiabetics
Diabetics
Stenosis @ baseline
Total occlusion @ baseline
Lesion length ≤50mm
Lesion length >50mm
No distal vessel occluded
≥1 distal vessels occluded
Stent better PTA better
1.52 (0.49-4.73)
0.59 (0.29-1.20)
0.43 (0.16-1.15)
1.00 (0.47-2.10)
0.97 (0.45-2.13)
0.52 (0.22-1.26)
0.48 (0.17-1.34)
0.84 (0.42-1.69)
0.51 (0.17-1.52)
0.73 (0.35-1.54)
0.73 (0.29-1.85)
0.93 (0.45-1.91)
0.50 (0.18-1.36)
OR (95% CI)
No calcification
Calcification

FASTDifference in Restenosis Rates
@ 12 Months
FASTDifference in Restenosis Rates
@ 12 Months Absolute reduction in restenosis rate (RR) con-
ferred by stenting in selected patient subgroups Absolute reduction in restenosis rate (RR) con-
ferred by stenting in selected patient subgroups
-40%
-30%
-20%
-10%
0%
10%
20%
30%
RR
[S
ten
t] –
RR
[P
TA
]
Men Women Diabetics Smokers Total Occlusions
Mod./sev.Calcification
≥1 dist. ves. occluded
RR [PTA] 43.4% (76) 24.0% (25) 38.7% (31) 40.3% (72) 45.5% (22) 44.4% (45) 36.1% (36)
RR [Stent] 31.2% (61) 32.5% (40) 23.1% (39) 26.2% (65) 29.7% (37) 29.6% (44) 22.0% (41)
Point estimate with 95% CIPoint estimate with 95% CI
-15.6%-12.3%
+8.5%
-14.1% -15.7% -14.9% -14.2%

FAST 12-Month Results – ITT
FAST 12-Month Results – ITT
Stent fractures X-ray in 83/101 stent patients in whom
restenosis was assessed @ 12 months 10 stent fractures
Stent fractures X-ray in 83/101 stent patients in whom
restenosis was assessed @ 12 months 10 stent fractures
Binary Restenosis (% )
28.8
20.0
0
10
20
30
Stent OK(n=73)
Fracture(n=10)
Stent Integrity
12%
88%
OK (n=73)
Fracture (n=10)
p = 0.719

FAST 12-Month Results
FAST 12-Month Results
Target Lesion Revascularizations Target Lesion Revascularizations
18.3 18.6
14.9 15.0
0
5
10
15
20
I ntention to Treat On Treatment
(% )
PTA Stent
p = 0.479p = 0.595
21/11521/115 17/11417/114 19/10219/102 19/12719/127
–19%–19%

FAST12 Month Results – ITT
FAST12 Month Results – ITT
Absolute walking distance and ankle-brachial index at rest in patients who were able to undergo treadmill testing at both baseline and 12-month follow-up
Absolute walking distance and ankle-brachial index at rest in patients who were able to undergo treadmill testing at both baseline and 12-month follow-up
0
50
100
150
200
250
300
350
Baseline 12 Mos. Δ (Baseline-12 Mos.)
Ab
so
lute
Wa
lkin
g D
ista
nc
e (
m)
PTA (n=75) Stent (n=61)
p=0.936 p=0.089 p=0.015
110 100
185
150
52
20
0,0
0,2
0,4
0,6
0,8
1,0
1,2
Baseline 12 Mos. Δ (Baseline-12 Mos.)
An
kle
-Bra
ch
ial I
nd
ex
PTA (n=75) Stent (n=61)
p=0.007 p=0.386 p=0.161
0.680.75
0.880.90
0.210.15
FAST12 Month Results – ITT
FAST12 Month Results – ITT

Absolute Walking Distance*
0
50
100
150
200
250
300
350
Baseline 12 Months Δ (Baseline-12Months)
(m)
PTA (n=75) Stent (n=61)
FAST12 Month Results – ITT
FAST12 Month Results – ITT
Absolute walking distance in patients who were able to undergo treadmill testing at both baseline and 12-month follow-up
Absolute walking distance in patients who were able to undergo treadmill testing at both baseline and 12-month follow-up
FAST12 Month Results – ITT
FAST12 Month Results – ITT
p=0.936 p=0.089 p=0.015
110 100
185
150
5220
FAST12 Month Results – ITT
FAST12 Month Results – ITT
**medians and interquartile rangesmedians and interquartile ranges

FAST12 Month Results – ITT
FAST12 Month Results – ITT
Change in Rutherford Category from baseline to 12 months in patients who were able to undergo treadmill testing at both baseline and 12-month follow-up
Change in Rutherford Category from baseline to 12 months in patients who were able to undergo treadmill testing at both baseline and 12-month follow-up
24
1719
32
25
13
18
23
0
10
20
30
+1 0 -1 -2 -3
Change in Rutherford Category*
No.
of
Pati
en
ts
PTA (n=75) Stent (n=61)
**negative numbers denote improvementnegative numbers denote improvement

FAST12 Month Results – OT
FAST12 Month Results – OT
Change in Rutherford Category from baseline to 12 months in patients who were able to undergo treadmill testing at both baseline and 12-month follow-up
Change in Rutherford Category from baseline to 12 months in patients who were able to undergo treadmill testing at both baseline and 12-month follow-up
24
1518
28
25
1519
27
0
10
20
30
+1 0 -1 -2 -3
Change in Rutherford Category*
No.
of
Pati
en
ts
PTA (n=75) Stent (n=61)
**negative numbers denote improvementnegative numbers denote improvement
FASTConclusions
FASTConclusions
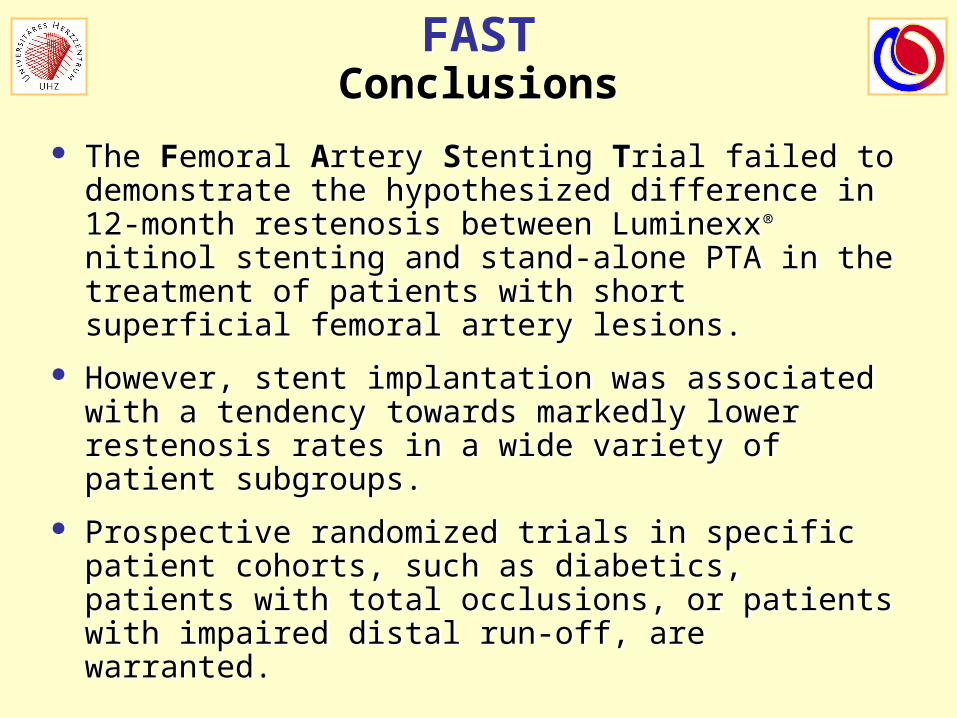
The Femoral Artery Stenting Trial failed to demonstrate the hypothesized difference in 12-month restenosis between Luminexx® nitinol stenting and stand-alone PTA in the treatment of patients with short superficial femoral artery lesions.
However, stent implantation was associated with a tendency towards markedly lower restenosis rates in a wide variety of patient subgroups.
Prospective randomized trials in specific patient cohorts, such as diabetics, patients with total occlusions, or patients with impaired distal run-off, are warranted.