Embed Size (px)
Citation preview

Farrington High1564 North King Street, Honolulu, Hawaii | Oahu | Farrington-Kaiser-Kalani Complex Area
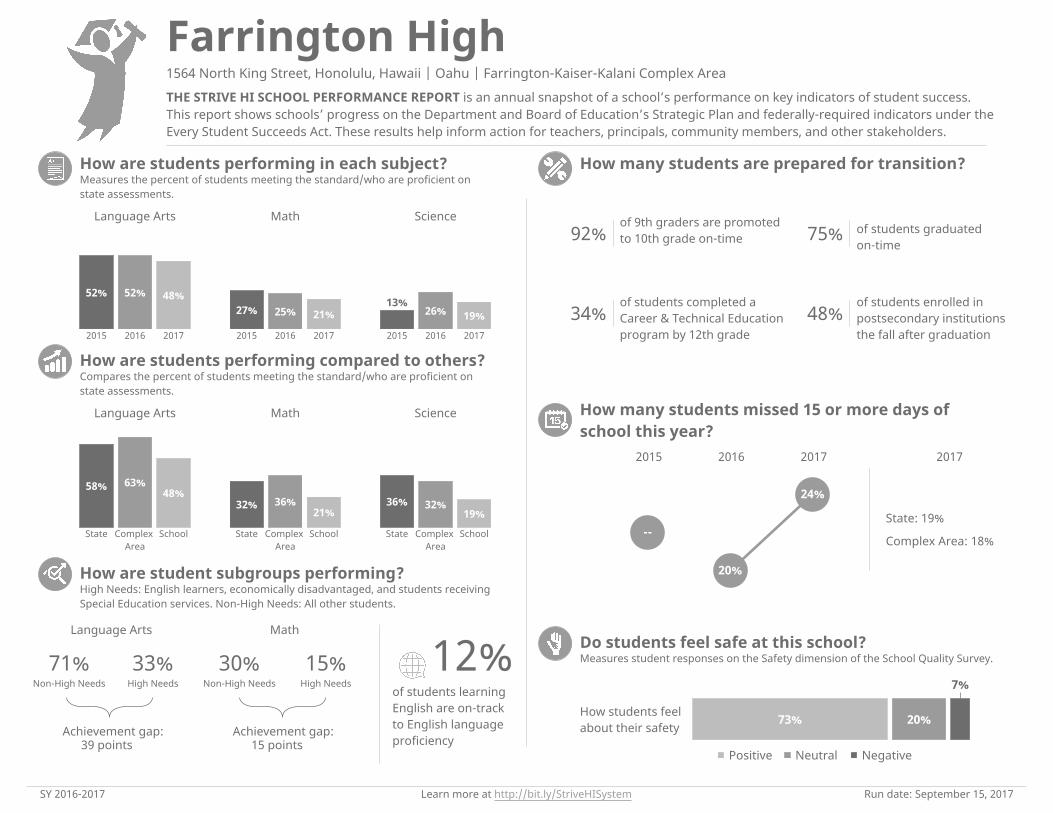
THE STRIVE HI SCHOOL PERFORMANCE REPORT is an annual snapshot of a school’s performance on key indicators of student success. This report shows schools’ progress on the Department and Board of Education’s Strategic Plan and federally-required indicators under the Every Student Succeeds Act. These results help inform action for teachers, principals, community members, and other stakeholders.
How are students performing in each subject?Measures the percent of students meeting the standard/who are proficient on state assessments.
Language Arts Math Science
52%
2015
52%
2016
48%
2017
27%
2015
25%
2016
21%
2017
13%
2015
26%
2016
19%
2017
How are students performing compared to others?Compares the percent of students meeting the standard/who are proficient on state assessments.
Language Arts Math Science
58%
State
63%
Complex Area
48%
School
32%
State
36%
Complex Area
21%
School
36%
State
32%
Complex Area
19%
School
How are student subgroups performing?High Needs: English learners, economically disadvantaged, and students receiving Special Education services. Non-High Needs: All other students.
Language Arts Math
71%Non-High Needs
33%High Needs
30%Non-High Needs
15%High Needs
Achievement gap:39 points
Achievement gap:15 points
12%of students learning English are on-track to English language proficiency
How many students are prepared for transition?
92%of 9th graders are promoted to 10th grade on-time 75% of students graduated
on-time
34%of students completed a Career & Technical Education program by 12th grade
48%of students enrolled in postsecondary institutions the fall after graduation
How many students missed 15 or more days of school this year?
2015 2016 2017
--
20%
24%
2017
State: 19%
Complex Area: 18%
Do students feel safe at this school?Measures student responses on the Safety dimension of the School Quality Survey.
How students feel about their safety 73% 20%
7%
Positive Neutral Negative
SY 2016-2017 Learn more at http://bit.ly/StriveHISystem Run date: September 15, 2017
Farrington High1564 North King Street, Honolulu, Hawaii | Oahu | Farrington-Kaiser-Kalani Complex Area
How do you measure how well a school is doing? In our estimation, it's more than scores on high-stakes tests. Schools should show that they are supporting children along the educational pipeline toward college, career, and community readiness. Are our students attending school? Are they graduating? Are they going to college? And how successfully are schools reducing the achievement gap between high-needs and non-high needs students?
The Strive HI Performance System was designed to account for these factors in student success. Initially created in 2013 by a U.S. Department of Education waiver from certain aspects of the former No Child Left Behind Act, Strive HI has been refocused by the goals and priorities of the 2017-2020 Department of Education and Board of Education Strategic Plan, the governing document for the public education system. Our Strategic Plan provides a common foundation of expectations and supports for public education, centering on closing the achievement gap to ensure equity and excellence in our schools.
Learn more athttp://bit.ly/StriveHISystem
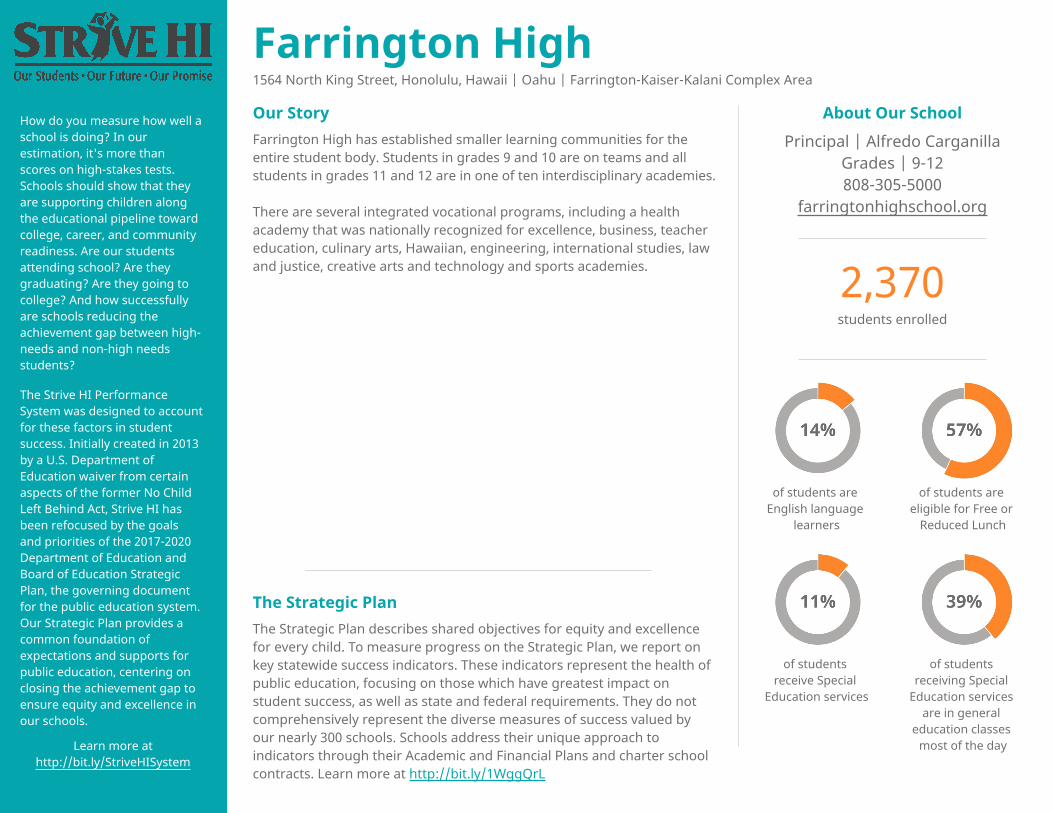
Our StoryFarrington High has established smaller learning communities for the entire student body. Students in grades 9 and 10 are on teams and all students in grades 11 and 12 are in one of ten interdisciplinary academies.
There are several integrated vocational programs, including a health academy that was nationally recognized for excellence, business, teacher education, culinary arts, Hawaiian, engineering, international studies, law and justice, creative arts and technology and sports academies.
The Strategic PlanThe Strategic Plan describes shared objectives for equity and excellence for every child. To measure progress on the Strategic Plan, we report on key statewide success indicators. These indicators represent the health of public education, focusing on those which have greatest impact on student success, as well as state and federal requirements. They do not comprehensively represent the diverse measures of success valued by our nearly 300 schools. Schools address their unique approach to indicators through their Academic and Financial Plans and charter school contracts. Learn more at http://bit.ly/1WggQrL
About Our SchoolPrincipal | Alfredo Carganilla
Grades | 9-12808-305-5000
farringtonhighschool.org
2,370students enrolled
of students are English language
learners
of students are eligible for Free or
Reduced Lunch
of students receive Special
Education services
of students receiving Special
Education services are in general
education classes most of the day
Farrington High1564 North King Street, Honolulu, Hawaii | Oahu | Farrington-Kaiser-Kalani Complex Area
THE STRIVE HI SCHOOL PERFORMANCE REPORT is an annual snapshot of a school’s performance on key indicators of student success. This report shows schools’ progress on the Department and Board of Education’s Strategic Plan and federally-required indicators under the Every Student Succeeds Act. These results help inform action for teachers, principals, community members, and other stakeholders.
How are students performing in each subject?Measures the percent of students meeting the standard/who are proficient on state assessments.
Language Arts Math Science
52%
2015
52%
2016
48%
2017
27%
2015
25%
2016
21%
2017
13%
2015
26%
2016
19%
2017
How are students performing compared to others?Compares the percent of students meeting the standard/who are proficient on state assessments.
Language Arts Math Science
58%
State
63%
Complex Area
48%
School
32%
State
36%
Complex Area
21%
School
36%
State
32%
Complex Area
19%
School
How are student subgroups performing?High Needs: English learners, economically disadvantaged, and students receiving Special Education services. Non-High Needs: All other students.
Language Arts Math
71%Non-High Needs
33%High Needs
30%Non-High Needs
15%High Needs
Achievement gap:39 points
Achievement gap:15 points
12%of students learning English are on-track to English language proficiency
How many students are prepared for transition?
92%of 9th graders are promoted to 10th grade on-time 75% of students graduated
on-time
34%of students completed a Career & Technical Education program by 12th grade
48%of students enrolled in postsecondary institutions the fall after graduation
How many students missed 15 or more days of school this year?
2015 2016 2017
--
20%
24%
2017
State: 19%
Complex Area: 18%
Do students feel safe at this school?Measures student responses on the Safety dimension of the School Quality Survey.
How students feel about their safety 73% 20%
7%
Positive Neutral Negative
SY 2016-2017 Learn more at http://bit.ly/StriveHISystem Run date: September 15, 2017
Farrington High1564 North King Street, Honolulu, Hawaii | Oahu | Farrington-Kaiser-Kalani Complex Area
How do you measure how well a school is doing? In our estimation, it's more than scores on high-stakes tests. Schools should show that they are supporting children along the educational pipeline toward college, career, and community readiness. Are our students attending school? Are they graduating? Are they going to college? And how successfully are schools reducing the achievement gap between high-needs and non-high needs students?
The Strive HI Performance System was designed to account for these factors in student success. Initially created in 2013 by a U.S. Department of Education waiver from certain aspects of the former No Child Left Behind Act, Strive HI has been refocused by the goals and priorities of the 2017-2020 Department of Education and Board of Education Strategic Plan, the governing document for the public education system. Our Strategic Plan provides a common foundation of expectations and supports for public education, centering on closing the achievement gap to ensure equity and excellence in our schools.
Learn more athttp://bit.ly/StriveHISystem
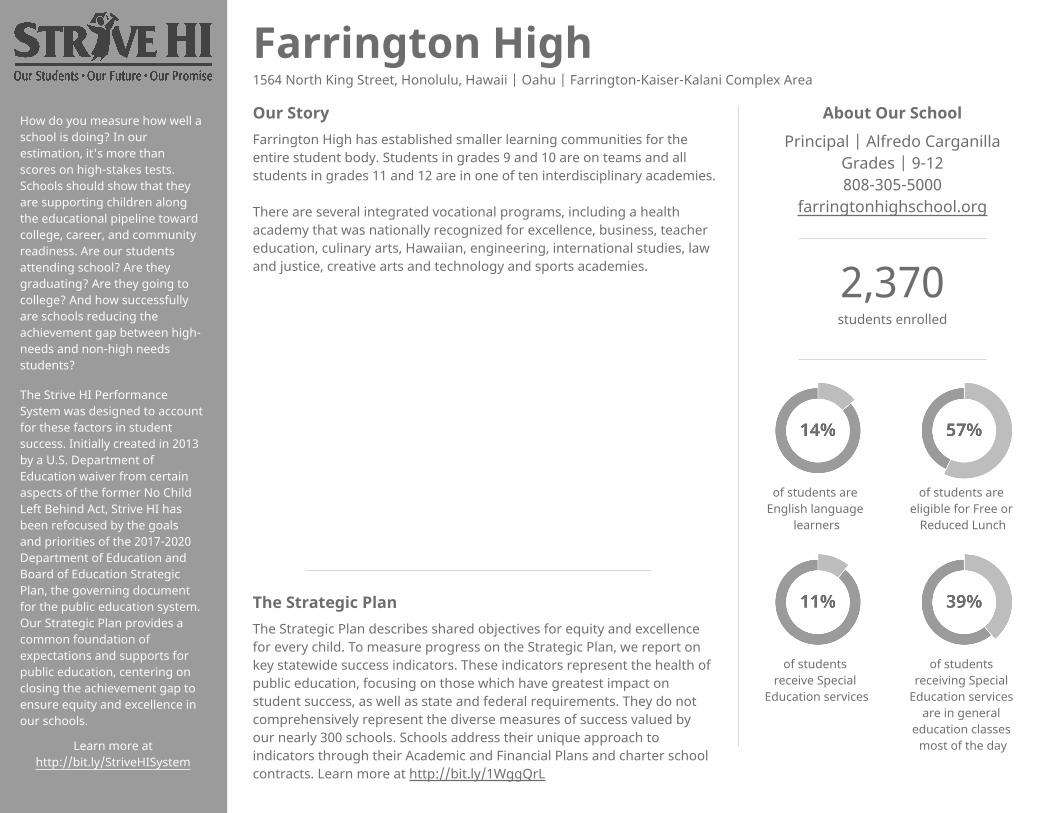
Our StoryFarrington High has established smaller learning communities for the entire student body. Students in grades 9 and 10 are on teams and all students in grades 11 and 12 are in one of ten interdisciplinary academies.
There are several integrated vocational programs, including a health academy that was nationally recognized for excellence, business, teacher education, culinary arts, Hawaiian, engineering, international studies, law and justice, creative arts and technology and sports academies.
The Strategic PlanThe Strategic Plan describes shared objectives for equity and excellence for every child. To measure progress on the Strategic Plan, we report on key statewide success indicators. These indicators represent the health of public education, focusing on those which have greatest impact on student success, as well as state and federal requirements. They do not comprehensively represent the diverse measures of success valued by our nearly 300 schools. Schools address their unique approach to indicators through their Academic and Financial Plans and charter school contracts. Learn more at http://bit.ly/1WggQrL
About Our SchoolPrincipal | Alfredo Carganilla
Grades | 9-12808-305-5000
farringtonhighschool.org
2,370students enrolled
of students are English language
learners
of students are eligible for Free or
Reduced Lunch
of students receive Special
Education services
of students receiving Special
Education services are in general
education classes most of the day