Embed Size (px)
Citation preview

i
FARMERS’ USE OF MOBILE PHONE TECHNOLOGY FOR AGRICULTURAL
INFORMATION SERVICES IN LILONGWE DISTRICT, MALAWI
A Thesis
Submitted to the Faculty
of
Purdue University
by
Benjamin Franklin Chisama
In Partial Fulfillment of the
Requirement for the Degree
of
Master of Science
August 2016
Purdue University
West Lafayette, Indiana

ii
When I received a “no” on my first admission attempt into Purdue University, it seemed
that all the doors were closed. Darling, you were so right that ‘many more doors were opened.’
In disbelief, I was given a second chance as a proof to your point. This thesis is dedicated to you
my dear wife, Chrissy Chisama, and to my little daughters, Esther and Ellen Chisama. I am
greatly indebted to you for the sacrifices you made which enabled me to study abroad for a year
when you needed me most. Your recognition of the importance of the value to our family of my
advanced study and your endurance throughout the entire year to make it happen was dearly
appreciated. Chrissy, I am very thankful for your encouragement during my entire study period. I
fall short of words for your big heart, taking care of our kids and my mum while I was busy
studying. My song compositions, cannot fully explain how much I appreciate your love. To my
beautiful daughters, I know you have brighter futures and I am glad you are working hard
towards the right path. May God richly bless you, my sweeties.

iii
ACKNOWLEDGEMENTS
I owe my deepest gratitude to my co-advisors, Dr. Roger Tormoehlen and Dr. Neil
Knobloch for remarkable guidance, consideration, and determination throughout this research
study. I am greatly indebted for walking me through every step of the research process up to the
end. I am very grateful for facilitating a special visit to work with me directly on my research
project and composition of the thesis in Malawi. The support, encouragement, wisdom and
inspiration have propelled me to accomplish this challenging level of my education. I think to
myself that your co-advisory services were of a higher rating than I had imagined on both academic
and professional levels. It was a complete privilege working with both of you, Roger and Neil. I
also thank Dr. Dieudonne Baributsa for his support during my graduate studies at Purdue
University. Your suggestions and experiences shaped this research study into a doable
undertaking.
I also appreciate the support provided by members and staff in the Department of
Agricultural Research Services and Department of Agricultural Extension Services within the
Ministry of Agriculture, Irrigation and Water Development (MoAIWD). I am personally thankful
to Dr. W. Makumba, Dr. C. Chowa, and Mr. D. Kamangira for their positive contributions towards
this research. I am also thankful to the District Agricultural Development Officer for Lilongwe
West, Mr. H. Yotumu, for allowing me to conduct this study in Mpingu and Mitundu Extension
Planning Areas (EPAs). A very special thanks to the staff of Mpingu and Mitundu EPAs for their
assistance. I would also thank the 291 farmers who took part in the study from Traditional
Authority Njewa, Malili, Chadza, and Chiseka. You gave of your precious time to answer most
difficult questions on behalf of all the farmers with mobile phones and I appreciate it.

iv
I would like to thank my research team members, specifically, Mr. F. Matekera, Mr. W.
Chibwana, Mrs. E. Katunga, Mrs. M. Kankhande, Mr. M. Ng’omacheza, and Mr. R.M.C. Phiri
for the wonderful job done. You owned this work and it all reflected in quality of the results. I
would also like to personally thank the following people for their commitments and assistance on
my study: Mr. H. Saiti, Mr. H. Malaidza, Ms. S. Bota, Mr. K. Makoko, Ms. G. Munthali, Mrs. T.
Chitsulo, Mr. E. Nkhoma, Mr. I. Abudullah, and Ms. C. Nowa for assisting me in many ways.
I would like to thank my siblings, Peter, Evance Jr., Sylvia, and Jacqueline Chisama as
well as my close friends for giving me a chance of staying very far away for an entire year. Bravo
to you all. Kudos to my father and mother in-laws, Mr. T. and Mrs. S. Gambatuka for your
encouragement during my studies. I should also thank my fellow graduate students at Purdue
University, Melissa Welsh, Cecilia Espinoza Morales, Amanda Gee, Alli E. Lee, Brittini Brown,
Amonte Martin, Kaylie Scherer, Jessica Mills, Matt Kararo, and Torrie Crops for supporting me
throughout my stay. My heartfelt thanks also go to Purdue University members of staff namely
Jayne Price, Carol Braund, Lonni D. Kucik and Richard J. Fox for assistance rendered to me
before, during, and after my stay on compass.
Lastly, I would like to thank USAID through its ended Michigan State University‘s
UITLCB program for funding my entire study at Purdue University. Being the last student
supported by this program meant a lot to me and I will never forget the experiences of this journey.
Lastly, I should also thank all the people whose names are missing from the long list, but
contributed in various ways to this research work. My appreciations to you all once again.

v
PERSONAL REFLECTION
The results of this study will support further efforts to develop innovative agricultural
extension systems in Malawi’s Lilongwe district and beyond. The evidence provided by the
farmers will facilitate appropriate changes in Malawi’s mobile agricultural information services.
These results of this study should be disseminated to all who have a stake in mobile phone-based
extension and rural development initiatives. A couple of simple questions from my experience
were: ‘are farmers with mobile phone accessing mobile agricultural information services; and
can we say that they have already surpassed information asymmetry challenges and the digital-
divide age?’ Farmers with these gadgets might have a very special tool for accessing mobile
agricultural information services and additional mobile services. Through the literature review
process, I learned a lot on how our colleagues in East and West Africa as well as East Asia
embraced mobile phone-based extension services. The research studies, whether basic in nature
or complex modeling studies, provided a diversity of conceptual and theoretical frameworks.
Prior to this study, I would not have predicted that farmers needed and valued an integrated
approach to mobile agricultural information services with additional interactivity for their use
and gratification. Nor would I have recommended enhancing extension programming to increase
farmers’ awareness and knowledge on mobile agricultural information services (MAIS). The
discussion for future research areas would not have been possible without the hard and soft
evidence obtained through this study. My new role now is to disseminate these results further
and advocate for integrated MAIS.

vi
ACRONYMS ADMARC Agricultural Development and Marketing Corporation
AEDC Agricultural Extension Development Coordinator
AEDO Agricultural Extension Development Officer
AHL Action Holdings limited
APA American Psychological Association
ARET Agricultural Research and Extension Trust
ATCC Agricultural Technology Clearing Committee
CADECOM Catholic Development Commission of Malawi
CBO Community Based Organization
CDs Compact Disks
CITI Collaborative Institutional Training Initiative
DAES Department of Agricultural Extension Services
DAHL Department of Animal Health and Livestock Development
DAO District Agricultural Office
DAPS Department of Agricultural Planning Services
DARS Department of Agricultural Research Services
DCD Department of Crop Development
DFAD Department of Fisheries and Aquaculture Development
DoI Department of Irrigation
Dr. Doctorate of Philosophy
DVDs Digital Versatile Discs
EPAs Extension Planning Areas
FAO Food and Agriculture Organization

vii
FM Frequency Modulation
GoM Government of Malawi
ICRISAT International Crops Research Institute for Semi-Arid Tropics
ICT Information and Communication Technologies
ICT4D Information and Communication Technology for Development
IFPRI International Food Policy Research Institute
IRB Institutional Review Board
ITU International Telecommunication Union
IWMI International Water Management Institute
IVR Integrated Voice Response
GDP Gross Domestic Product
GVH Group Village Headman
LRCD Land Resources Conservation Department
LUANAR Lilongwe University of Agriculture and Natural Resources
M Mean
MACE Malawi’s Agricultural Commodity Exchange
MACRA Malawi Communications Regulatory Authority
MAIS Mobile Agricultural Information Services
MF Mobile Farmer
MIRC Malawi Industrial Research Council
MIS Mobile Information Services
MK Malawi Kwacha
MNSP Mobile Network Service Providers

viii
MMS Multimedia Messaging Service
MTL Malawi Telecommunications Limited
MoAIWD Ministry of Agriculture Irrigation and Water Development
M4D Mobile Phone Technology for Development
NACDC-ICT Nation Agricultural Content Development Committee for ICTs in Malawi
NARS National Agricultural Research System
NASFAM National Smallholder Farmers’ Association of Malawi
NGOs Non-Governmental Organizations
NSO National Statistics Office
PDA Personal Digital Assistant
PPP Public Private Partnerships
SD Standard Deviation
SIM Subscriber Identity Module
SMS Short Message Service
SMSs Subject Matter Specialists
SSA Sub-Saharan Africa
TA Traditional Authority
TAMA Tobacco Association of Malawi
TV Television
TNM Telecom Networks of Malawi
UILTCB USAID Initiative for Long-term Training and Capacity Building
USAID United States Agency for International Development
VDC Village Development Committee
VH Village Headman

ix
TABLE OF CONTENTS
ACKNOWLEDGEMENTS ..................................................................................................................... iii
PERSONAL REFLECTION .................................................................................................................... v
ACRONYMS ............................................................................................................................................. vi
TABLE OF CONTENTS ......................................................................................................................... ix
LIST OF TABLES ...................................................................................................................................xiii
LIST OF FIGURES ................................................................................................................................ xvii
ABSTRACT ............................................................................................................................................ xviii
CHAPTER 1: INTRODUCTION ............................................................................................................ 1
1.1 Background of the Study .................................................................................................... 1
1.2 Information about Malawi .................................................................................................. 3
1.3 Importance of Agriculture in Malawi ................................................................................. 4
1.4 Statement of the Research Problem .................................................................................... 5
1.5 Significance of the Study .................................................................................................... 6
1.6 Purpose of the Study ........................................................................................................... 8
1.7 Research Questions ............................................................................................................. 8
1.8 Delimitations of the Study .................................................................................................. 9
1.9 Assumptions of the Study ................................................................................................. 10
1.10 Definition of Terms......................................................................................................... 11
CHAPTER 2: REVIEW OF THE LITERATURE .............................................................................. 14
2.1 Introduction ....................................................................................................................... 14
2.2 Study Focus ....................................................................................................................... 14
2.3 Literature Review Methodology ....................................................................................... 14
2.4 Agricultural Information ................................................................................................... 15
2.4.1 Concept of Agricultural Information ....................................................................... 15

x
2.4.2 Agricultural Information Generation and Dissemination in Malawi ....................... 16
2.4.3 Challenges on Agricultural Information Dissemination in Malawi ......................... 18
2.5 Mobile Agricultural Information Services ........................................................................ 19
2.5.1 Mobile Agricultural Information Services in Developing Countries ...................... 19
2.5.2 Mobile Agricultural Information Services in Malawi ............................................. 22
2.6 Need for the Study ............................................................................................................ 24
2.7 Theoretical Frameworks ................................................................................................... 25
2.8 Conceptual Frameworks ................................................................................................... 27
CHAPTER 3: METHODOLOGY ......................................................................................................... 29
3.1 Introduction ....................................................................................................................... 29
3.2 Research Focus ................................................................................................................. 29
3.3 Study Area ........................................................................................................................ 29
3.4 Research Design................................................................................................................ 31
3.5 Institutional Review Board Approval ............................................................................... 32
3.6 Participants ........................................................................................................................ 32
3.7 Sampling Procedures ........................................................................................................ 33
3.8 Instruments ........................................................................................................................ 34
3.9 Training Interviewers ........................................................................................................ 34
3.10 Data Collection ............................................................................................................... 35
3.11 Data Analysis .................................................................................................................. 36
3.12 Demographic and Personal Information Results ............................................................ 36
3.12.1 Section Information ............................................................................................... 37
3.12.2 Personal Information .............................................................................................. 39
3.12.3 Literacy Test Information ...................................................................................... 46

xi
3.12.4 Farming Experience ............................................................................................... 48
3.12.5 Economic Information ........................................................................................... 53
3.12.6 Summary of Demographic Information ................................................................. 55
CHAPTER 4: RESULTS ........................................................................................................................ 57
4.1 Introduction ....................................................................................................................... 57
4.2 Results of the Study .......................................................................................................... 57
4.2.1 Participant Farmers’ Mobile Phone Technology ..................................................... 57
4.2.2 Participant Farmers’ Awareness and Use of MAIS ................................................. 63
4.2.3 Farmers Opinions on Mobile Agricultural Information Services ............................ 77
4.2.3 Farmer Participants’ Motivation to Use Mobile Agricultural Information Services 79
4.2.4 Mobile Phone Technology Used by Participant Farmers ........................................ 84
4.2.5 Farmer Participants’ Key Challenges and Opportunities for MAIS ........................ 94
CHAPTER 5: CONCLUSIONS AND POLICY IMPLICATIONS ................................................ 100
5.1 Introduction ..................................................................................................................... 100
5.2 Purpose of the Study ....................................................................................................... 100
5.3 Research Questions ......................................................................................................... 100
5.4 Conclusions ..................................................................................................................... 101
5.5 Recommendations for Practices ...................................................................................... 112
5.6 Implications for Policy .................................................................................................... 115
5.6.1 Implications on Extension Service Delivery and ICT Policy for Agriculture ....... 115
5.6.2 Implication on Policies for Mobile Service Providers ........................................... 116
5.7 Recommendations for Future Research Studies ............................................................. 117
REFERENCES ....................................................................................................................................... 120
APPENDICES ........................................................................................................................................ 129
APPENDIX A: Approval Letters to Conduct a Research Study .......................................... 130

xii
APPENDIX B: Research Instrument Used (English version) .............................................. 132
APPENDIX C: Maps for Study Location ............................................................................. 151
APPENDIX D: Extra Results ............................................................................................... 153

xiii
LIST OF TABLES
Table 1 Types of mobile phone applications used for agricultural information ......................... 21
Table 2 Number of participant farmers per Sections .................................................................. 38
Table 3 Number of participant farmers per Traditional Authorities location ............................. 39
Table 4 Gender categories of participant farmers ....................................................................... 40
Table 5 Age categories of participant farmers ............................................................................ 41
Table 6 Household sizes of participant farmers .......................................................................... 42
Table 7 Marital status of respondents ......................................................................................... 42
Table 8 Education level of participant farmers ........................................................................... 43
Table 9 Participant farmers’ multiple responses on occupation ................................................. 44
Table 10 Participants farmers community leadership involvement ............................................. 44
Table 11 Multiple responses on participant farmers community leadership roles ..................... 45
Table 12 Participant farmers’ responses on literacy abilities ...................................................... 46
Table 13 SMS text message-based reading test for participant farmers ..................................... 47
Table 14 Participant farmers’ copying mechanisms for SMS text messages ............................. 48
Table 15 Respondents’ farming years by EPA ........................................................................... 49
Table 16 Particintant farmers’ farming goals ............................................................................. 50
Table 17 Farmer participant’s farm sizes.................................................................................... 50
Table 18 Farmer participant's main farming enterprise .............................................................. 51
Table 19 Respondents’ main crops grown .................................................................................. 52
Table 20 Farmer participants’ main livestock enterprise ............................................................ 53
Table 21 Respondents’ multiple responses on income sources .................................................. 54
Table 22 Distribution of responses income level classes ............................................................ 55

xiv
Table 23 Brand of mobile phone used by participant farmers ..................................................... 58
Table 24 Types of mobile phones used by respondents .............................................................. 59
Table 25 Respondents’ responses on acquistion of mobile phones ............................................. 59
Table 26 Participant farmers’ subscriptions to mobile network service providers ...................... 60
Table 27 Respondents’ preferrences on mobile network service providers ................................ 61
Table 28 Mean distribution of responses on frequency of using mobile applications................. 62
Table 29 Participant farmers’ awareness of mobile agricultural information services ............... 63
Table 30 Respondents' awareness on formats of existing MAIS platforms ................................ 64
Table 31 Respondents' multiple response on awareness of MAIS providers .............................. 65
Table 32 Participant farmers’ multiple responses on awareness of MAIS platforms .................. 66
Table 33 Respondents' multiple responses on sources of knowledge on MAIS ......................... 67
Table 34 Farmer participants’ multiple responses on access to MAIS ........................................ 68
Table 35 Respondents’ multiple responses on the frequency of using MAIS ............................. 68
Table 36 Farmer participants’ multiple responses on information accessed via SMS messages 69
Table 37 Respondents’ multiple responses on topics accessed through Integrated Voice
Response (IVR) ............................................................................................................ 70
Table 38 Farmers’ responses on the payments made on MAIS ................................................... 71
Table 39 Respondents’ satisfaction level about accessed MAIS ................................................. 72
Table 40 Awareness of additional mobile services ...................................................................... 73
Table 41 Farmer participants’ multiple responses on types of additional mobile services .......... 73
Table 42 Respondents’ multiple responses on sources of knowledge about additional mobile
services ........................................................................................................................... 74
Table 43 Respondents' responses on use of additional mobile services ....................................... 75

xv
Table 44 Farmer participants’ multiple responses on sources of additional agricultural
information services ..................................................................................................... 76
Table 45 Respondents' multiple responses on communication channels used for accessing
additional agricultural information services ................................................................. 77
Table 46 Participant farmers’ multiple responses on reasons for using MAIS ........................... 81
Table 47 Participant farmers’ expression of interest on MAIS ................................................... 82
Table 48 Respondents' multiple responses on preferred crop productions topics for MAIS ...... 85
Table 49 Respondents’ multiple responses on preferred livestock production topics for MAIS 86
Table 50 Respondents’ multiple responses on preferred communication channels to deliver
agricultural information ................................................................................................ 87
Table 51 Participant farmers’ multiple responses on preferred sources of agricultural
information on MAIS ................................................................................................... 88
Table 52 Farmer participants’ multiple responses on preferred mobile information and
communication formats ................................................................................................ 89
Table 53 Participant farmers’ willingness to pay for mobile agricultural information services . 90
Table 54 Respondents’ multiple responses on payments for mobile format for MAIS .............. 90
Table 55 Participant farmers’ fees for various mobile agricultural information services ........... 91
Table 56 Farmer participants’ challenges on mobile technology and MAIS .............................. 95
Table 57 Respondents’ main challenges for mobile agricultural information services ............... 96
Table 58 Respondents’ land size allocated to crops grown in acres .......................................... 153
Table 59 Cropping system employed by participating farmers ................................................. 154
Table 60 Participant farmers’ mean distribution for main livestock ......................................... 155
Table 61 Participant farmers’ possession of various assets ........................................................ 156

xvi
Table 62 Partcipant farmers’ mean distribution of various assets .............................................. 157
Table 63 Participant farmers' types of mobile phone brands………..……………....………….157
Table 64 Mobile applications available in three mobile categories ........................................... 157
Table 65 Respondents’ multiple responses on reasons for preferred MNSP .............................. 160
Table 66 Respondents’ multiple responses on topics from additional sources .......................... 161
Table 67 Respondents' mean distributions on motivational reasons for using MAIS .………...161

xvii
LIST OF FIGURES
Figure 1, Conceptual framework for the research study ............................................................... 31
Figure 2, District Extension Services System in Malawi ............................................................. 30
Figure 3, Approval letter from Purdue University IBR .............................................................. 130
Figure 4, Approval letter from DAES Malawi ........................................................................... 131
Figure 5, Map of Malawi with 28 Districts................................................................................. 151
Figure 6, Map of Extension Planning Areas in Lilongwe District ............................................. 152

xviii
ABSTRACT Chisama, Benjamin, F., Purdue University, August 2016. Farmers' use of mobile phone technology for agricultural information services in Lilongwe District, Malawi. Co-Advisors: Roger Tormoehlen and Neil Knobloch.
Mobile phone technology can be a useful tool to provide farmers with relevant and
reliable agricultural information for critical farming decisions in developing countries such as
Malawi. An increasing number of rural farmers have been faced with information asymmetry
challenges due to some pitfalls in the extension systems. In addition, knowledge gaps on
farmers’ use of mobile phone technology; their awareness and use of MAIS; and their preferred
topics to be delivered using mobile platforms were identified. However, little was known on how
farmers were using existing MAIS. This study’s aim was to explore the potential of providing
mobile agricultural information services to farmers in Malawi’s Lilongwe District. The mixed
research modes was used to capture information from 291 participants using a structured
questionnaire. Data analysis was done using descriptive statistics in SPSS (Version 16) and
thematic analysis. The study’s findings showed that only 14% of farmer participants were aware
of MAIS, with only 12% and 6% using IVR and SMS services, respectively. The farmers
expressed a strong desire for an integrated MAIS system with additional interactive approaches
incorporated into existing extension programs. It was concluded that farmers were quite a bit
motivated and optimistic to use MAIS with nearly half indicating willingness to pay for voice
call and SMS text services. As per farmer’s perceptions on values of MAIS, it was recommended
for service providers to increase awareness and seek farmers’ inputs on various topics.
Keywords: Mobile phone, agricultural information, advisory services, mobile agricultural
information services, Information and Communication Technology.

1
CHAPTER 1: INTRODUCTION
1.1 Background of the Study
Mobile phone technology can be a useful tool to provide farmers with access to relevant
and reliable agricultural information for making critical farming decisions. Over the past decade,
mobile phone technology has emerged as the primary form of electronic communication and
information dissemination channels even in the rural areas of developing countries such as
Malawi (Tenhunen, 2008). According to data compilation by the International
Telecommunication Union (ITU; 2014), mobile phone penetration in the developing world has
reached about 97%, Africa was reported to have 69% and Sub-Saharan Africa (SSA) region was
estimated at 52%. SSA was predicted to reach 79-90 % by 2020 (ITU, 2014; AMGOO
Marketing Team, 2015). It was also noted, that the majority of the rural population used mobile
phones to access agricultural information (Duncombe, 2012; Aker, 2011). The results of a study
conducted by the Malawi Communications Regulatory Authority in 2014, indicated that 85 of
100 inhabitants were reported to have a mobile phone in the country and out of total rural
population constitute 42%. Analysis of the statistics on mobile phone subscription for two years
there is a 31% increase in the number of rural people with a mobile phone in Malawi. It was
clear that use of mobile phones has changed significantly the landscape of information
dissemination in many disciplines propelling rural development including agriculture, health,
education, and banking (Chhachhar & Hassan, 2013). It was therefore, important to understand
how farmers with mobile phones use the technology to access agricultural information services
in Malawi’s context.
In Malawi, agricultural information dissemination had been largely done through face-to-
face or interpersonal communication using the agricultural extension and advisory systems. Like

2
most Sub-Saharan African (SSA) countries, Malawi’s agricultural extension system has been
overwhelmed with the diverse information needs of farmers (Davis, 2008; Oladele, 2011). Most
rural farmers still remain largely dispersed in wider geographic locations and depend on
interpersonal exchange of agricultural information disseminated by agricultural extension
officers (Cole & Fernando, 2012). In addition, farmers face barriers to obtaining agricultural
information due to limited access to radio, television, newspapers and landlines (Aker, 2011).
According to Cole & Fernando (2012), limited resources prevent the rural extension system from
delivering information beyond the targeted easy-to-reach or resource advantage farmers. In most
studies, the lack of information by the farmers affects agricultural productivity and economic
development negatively because they make uninformed decisions (Molony, 2006). This implied
that there has been persistent challenges of information symmetry because most farmers failed
to access timely, consistent and actionable agricultural information services (Aker, 2011;
Duncombe, 2012; Baumüller, 2012). On the other hand, Information and Communication
Technologies (ICT) such as mobile phone technology have been viewed as an innovative way to
reduce the disparities in extension services provision and speed up rural development.
Of late, the proliferation of mobile agricultural information services has been noted in
most developing countries (Duncombe, 2012). The services ranged from SMS text message-
based, voice-based, integrated text to voice systems, help lines, market information sharing
platforms and other services (Donovan, 2011). Usually, farmers with mobile phones willingly
subscribe to such services and therefore access push-based information (FAO, 2013). Most
previous studies focused on the economic impact of mobile phone technology and the
established Marketing Information System (MIS) in rural areas of developing countries
(Katengaza, 2012; Aker, 2011; Muto & Yamano, 2009). A study by Duncombe (2012)

3
indicated that, there was a requirement to understand the needs of the farmers and their context
before implementing MAIS. These results have drawn a wider view to understanding the
research aspects so far conducted on farmers’ use of mobile phone technology. Among them was
a need to conduct context-specific studies on how farmers were accessing mobile agricultural
information services. An exploratory study was conceived to gain a greater understanding of how
farmers were currently using mobile phones and how they foresee them being used in the future
to access agricultural information in the Lilongwe district. The next section covers the
importance of agriculture in Malawi as a background context for this study.
1.2 Information about Malawi
Malawi is one of the top-five least developed countries located in the southeast part of
Africa. The country has an area of over 118,000 km2 that includes land and several water bodies.
It shares borders with Zambia to the west, Mozambique to the south and Tanzania to the north. It
is geographically divided into three parts namely: southern region, which covers 3,176 km2,
central region that covers 3,559 km2, and northern region which covers 2,690 km2. The regions
are further sub-divided into 28 districts (Appendix C, Figure 4). Lilongwe is in central part of the
country.
Malawi had an estimated population of 14 million (NSO, 2008), and is regarded as one
of the most densely populated countries in Sub-Saharan Africa with 46 people/ km2 (FAO,
2006). Eighty (80) percent of the total population lives in rural areas where they are directly or
indirectly involved in agriculture (GoM, 2009). Smallholder farming is the primary occupation,
and provides food and income for most rural dwellers.

4
1.3 Importance of Agriculture in Malawi
Agriculture is very important to Malawi because it is the mainstay of the economy,
contributing about 40% of its gross domestic product (GDP), 90% of its export earnings, and
employing 85% of the population (GoM, 2009). The agricultural sector is sub-divided into
smallholder and estate farming sub-sectors. Smallholder farming still produces 90% of the food
crops, although a decrease in land holding size from 0.8 to 1.53 ha per household has occurred
(Chirwa, Kumwenda, Jumbe, Chilonda, & Minde, 2008). The estate sector is oriented towards
cash crops such as tobacco, maize, tea, sugarcane for export markets and commercial livestock
production operations. The majority of the smallholder farmers are involved with crop
production. Some smallholder farmers integrate small-scale livestock production alongside their
crop operation and a few solely depend on livestock production. Crop production accounts for
74% of the rural income (Chirwa et al., 2008). Smallholder farmers grow crops such as maize,
rice, sorghum, millet, groundnuts, soybeans, pigeon pea, cowpeas, sweet potato, cassava, and
common beans for food with the excess sold to provide cash to the family (Masambuka-
Kanchewa, 2013). Maize is the main food crop, and is grown by 90% of the smallholder farmers
(Chirwa et al., 2008). The smallholder farmers grow cash crops such as tobacco, tea, cotton,
sugarcane, banana, coffee and chilies, which are sold locally or exported through farmer
associations (GoM, 2009). Livestock production contributes 20% to the total agricultural
production (Chimera, Gondwe, & Mgomezulu, 2008). Farmers raise dairy cattle, beef cattle,
poultry, pigs, goats, sheep and other small ruminants for their source of protein and to supply
domestic market demands.

5
While the number of smallholder farmers has increased, the level of productivity has not
increased and remains quite low. Smallholder farmers faces a number of challenges, including
lack of agricultural information on productivity, input and output markets, and financial services
(Katengeza, 2012). According to Cole & Fernando (2012), the root causes of the problem are
spatial dimension, temporal dimension, and institutional rigidities within the agricultural
extension system. Further complicating the issue is that most farmers are marginalized from
accessing agricultural information due to failure of the extension systems to reach them using
traditional in-person communication methodologies. Facing the dilemma of limited credible
information, farmers resort to getting information from local available information sources
including family, friends and colleagues, who provide inconsistent information and experiences
(FAO, 2013). New extension innovations incorporate the use of Information and Communication
Technologies (ICTs) such as mobile phone to improve agricultural information services delivery.
However, the reviewed literature indicated that most research has been focused on the supply
side of agricultural information (Duncombe, 2012). In that regards, there is little documentation
on the demands from the farmers’ side for mobile phone-based agricultural information services
in Malawi. This research study was conducted to understand farmers’ use of mobile technology,
their mobile agricultural information needs, and their motivations to use mobile agricultural
information services in Malawi’s, Lilongwe District.
1.4 Statement of the Research Problem
The smallholder farmers have diverse agricultural information needs that can be provided
through mobile phones to assist them in decision-making. As discussed in the introduction sub-
section, the number of farmers using mobile phone has increased and the issue of information

6
asymmetry still exists among them. However, the issues of ‘digital divide’ in terms of the
individual’s basic skills (literacy or digital skills), motivation values and use of information
accessed through mobile phone were overlooked in past studies conducted in most developing
countries. Globally, farmers’ information needs falls in three broad categories, which are
production system management, market access, and financial inclusion (Vodafone, 2011). In
respect to Malawi, similar gaps were noted in studies conducted on the effectiveness of Mobile
Market Information Systems (MIS) where farmers demanded more agricultural advisory
information (Katengeza, 2012; Simuja, 2012). This implies that little has been done to
understand the farmers’ mobile information needs, the farmers’ desire to be engaged with the
MAIS providers in developing content, and application tools.
There was limited documentation of farmers’ motivations to use mobile agricultural
information services (MAIS). However, it was important to get their perspectives on appropriate
information to match with their motivations and intentions of MAIS providers. Therefore,
understanding these motivations and the use of mobile agricultural information services would
contribute to the body of existing knowledge with farmer-centered MAIS orientation.
1.5 Significance of the Study
This study was significant for four main reasons: 1) contributes to a body of knowledge
on innovative agricultural extension services, and therefore, potentially improving the quality of
mobile agricultural information services; 2) provides insights to various institutions providing
agricultural information to farmers for improved productivity and increased income; 3) enables
mobile network service providers and other key players in the mobile industry to improve their

7
service packages on agriculture; and, 4) informs the research and policy institutions in making
decisions on innovative extension systems.
First, the study contributes to a body of knowledge on innovative agricultural extension
services from the perspectives of farmers with access to mobile phone technology. Mobile
agricultural information services are a relatively new field in Malawi and therefore it was
important to explore various mobile technologies, already being used by farmers. Results from
the study can also assist to inform on how to address the farmers’ information needs within
traditional extension system. This study offers an opportunity to learn from farmers concerning
their motivation, resources and capabilities to use context-specific or generalized information
from the extension service providers.
Second, provide justification for the various institutions that provide mobile agricultural
information services to incorporate the farmers’ informational needs in their programs and
therefore improve agricultural productivity and increase incomes. It was therefore, important to
conduct this study to explore how to deal with the challenge of information asymmetry within
agricultural extension systems that limit agricultural productivity and rural development.
Third, information from the study will enable mobile network operators and other key
players in the mobile industry improve their services packages for agricultural development. The
industry has the capability to improve customer care that includes reliable mobile networks,
affordable mobile services and scalability of mobile agricultural information services capacities
at local and national levels.
Finally, various research and policy institutions in their decision-making processes may
use the findings from the study including government institutions, non-governmental
organizations and private sector groups (i.e. mobile network operators, marketers, and

8
producers). Incorporating mobile agricultural information programs will assist farmers to achieve
appropriate productivity levels. Agricultural Extension policy advocates for pluralistic and
demand-driven service provision (GoM, 2002). Currently, the Malawi Communications
Regulatory Authority was legislated under the Malawi’s Communications Act of 2005 regulates
information and communication technologies (ICTs).
1.6 Purpose of the Study
The purpose of this needs assessment study was to identify the potential for using mobile
technology to provide agricultural information and advisory services to farmers in Lilongwe
District of Malawi.
1.7 Research Questions
The research questions guiding this study were:
1. What types of mobile phone were the farmers using and to what extent did they
use the technology?
2. Were the farmers aware of mobile agricultural information services and to what
extent do they use them with additional mobile services?
3. What were the farmer participants’ motivations and optimism to use mobile
agricultural information services?
4. What were the farmers’ preferred agricultural information (topics, channels and
sources) and willingness to pay for mobile agricultural information services?

9
5. What were the key challenges, suggestions for improvement and opportunities for
farmers to access mobile agricultural information services?
1.8 Delimitations of the Study
The results of the study may be limited due to some external validity threats. The study
was conducted in two of the 19 Extension Planning Areas (EPAs). Within the two selected
EPAs, there were additional farmers with mobile phone who were not included in the survey.
However, the study managed to identify a large sample frame of about 80%, which necessitated
the need to increase sample size for subsets that were included in the study. The subset
multistage random selected reduced the potential for unbiased conclusions.
Because ubiquity of the mobile phone is a relatively new concept in most rural areas,
high illiteracy levels, lack of digital skills, and lack of awareness on existing developments
(Aker, 2011) may affect the topics of discussion. A deliberate question was included to check the
literacy capabilities of individual respondents who claimed the ability to read and write if they
received SMS text messages. The instruments were pre-tested and reviewed by extension experts
to increase instrument reliability. Due to low literacy levels, some farmers struggled to articulate
their issues and new needs, which made it difficult to reach any conclusions on specific
individual cases with few responses. However, they provided a general picture that was
triangulated by the key informants (extension officers) who were contacted later for more clarity.
This cross sectional survey did not exhaust all the farmers’ agricultural information needs
since they were numerous. This study focused on farmers with mobile phones, their digital skills,
and their motivation to access the mobile agricultural information services. It was noted that
mobile phone-based information services are dynamic so the farmer’s access might change with

10
time and advancements in mobile technology. It was therefore important to note that a cross-
section survey was use to explore the recent developments on MAIS.
Lastly, the survey methodology employed lacked the ability to gain more in-depth
information on farmers’ use of mobile phone technology to access agricultural information.
However, a mixed method design was used to capture quantitative and qualitative responses,
triangulated by information from key informants before drawing conclusions of the study. Three
experts on the thesis committee assessed the internal validity of the results before and after data
collection.
1.9 Assumptions of the Study
This study had five main underlying assumptions to guide the understanding on how
farmers were interfacing with mobile phones technology for mobile agricultural information
services:
• Mobile phones were a household asset and could be accessed by household members
especially heads of the family who were supposed to access agricultural information.
• Mobile phone technology offered an opportunity for all farmers with an appropriate
phone to demand and get agricultural information services ranging from productivity,
input and output markets, finances, to risk or uncertainty management.
• Farmers had access to mobile phone available alternative sources of agricultural
information and preferred channel (e.g. radio, TV and printed materials).

11
• The farmer participants possessed different capacity levels to use mobile phone-based
communications media such voice calling, SMS text messaging and other applications
for agricultural information services.
• The mobile agricultural information service providers had various information and
communication technology (ICT) tools at their disposal to disseminate agricultural
information.
1.10 Definition of Terms The following terms were defined and contextualized for used in this study.
• Agricultural Extension Services: Refers to all activities that include information,
technical skills, and new technologies offered by various agricultural organizations to
support the efforts of the farmers and other players to solve their own problems (Babu,
Glendenning, Asenso-Okyere, & Govindarajan, 2012). Its main goal is to assist in
promoting the use of scientific knowledge and therefore increase productivity or income
to improve rural livelihoods. In this study, agricultural extension services means all the
various approaches and methodologies used to deliver agricultural information and new
knowledge on farming techniques to farmers.
• ‘Digital divide’: Digital divide refers to a popular concept where the advancements in
communication and information technology creates a gaps or inequalities on those who
have and do not have access to technology, as well as inequalities on capabilities and
outcomes of using the information (Wei, Toe, Chan, & Tan, 2011). In this study, the
concept was operationalized to cater for farmer who had mobile phone and do not have

12
the capacity to access mobile agricultural information services in existing extension
systems for their benefits due to various challenges.
• Participant farmers: For this study, it included smallholder farmers, individuals who were
small-scale rural producers with various land holding size, producing crops and livestock
and possessing mobile phones for their communications. In this study, the term participant
farmers was used interchangeably with respondents throughout the context since it only
focused on farmers with mobile phones.
• Information and Communication Technologies (ICTs): Indicates a wide-range of
software applications, network infrastructures and communication media that aided
information acquisition, processing, storage, retrieval and dissemination among linked
computer devices at both local and global levels (Zahedi & Zahedi, 2012; Russell &
Steele, 2013). In the case of Malawi, radio and mobile phones are the most common type
of ICT used in typical rural areas. In this study, the term ICT is used to identify other
ICTs devices including mobile phones, which are already subject matter of this study.
• Mobile agricultural information services (MAIS): These were referred to as a series of
activities to produce agricultural-related information and dissemination efforts through
mobile phone platforms. MAIS characteristics were also referred to as intangibility,
inseparability of production and consumption, potential variability, perishability and lack
of ownership (Mathiassen & Sorensen, 2008). In this study MAIS was referred to as the
key product of mobile services that have been directed towards agricultural productivity,
weather information, market prices, agro-processing and other messages that enhances
farmers rural livelihoods through the extension systems (FAO, 2012).

13
• Mobile phone: An electronic device that is used for voice communication and exchange
of data through SMS text messages, audios and videos over a network with other mobile
phone and computer devices.
• Motivation: In this study, the term “motivation” is used to represent farmer participants’
opinions on sources of their inner drive to access agricultural information perceived
useful for future agricultural activities that could affect their rural livelihoods.
• Sections: A physically demarcated area designated for extension officers to operate
within and generally considered to have two or more blocks of farming communities. In
this study, the term “section” is used to refer to extension services delivery in a particular
block of an Extension Planning Area.

14
CHAPTER 2: REVIEW OF THE LITERATURE
2.1 Introduction
This chapter provides an overview of previous research studies, academic books,
workshop proceedings and credible online sources to understand further the topics that were
investigated. The chapter provides a review of the literature on various topics as follows: (1)
agricultural information; (2) agricultural information generation and dissemination in Malawi;
(3) mobile agricultural information services; (4) farmers’ agricultural information needs and
additional mobile services; and, (5) theoretical/conceptual frameworks. In addition, the chapter
discusses the analysis of the recent past research related to the study.
2.2 Study Focus
The study assessed the potential for using mobile technology to provide agricultural
information and advisory services to farmers in Lilongwe District of Malawi. The five research
questions covered farmers’ use of mobile technology, awareness and use of MAIS, information
needs, challenges and opportunities for MAIS.
2.3 Literature Review Methodology
The study was informed by literature sources across several academic disciplines, using
various search methods. References were identified using the Purdue University e-Journal
Database, Purdue University Catalogue, Google Scholar and Google Search. The search terms
used were “mobile phone,” “mobile agricultural information services,” “agricultural
information,” “agricultural extension services,” “farmers’ agricultural information needs,”
“agricultural information generation and dissemination,” “digital divide concept,” “expectancy

15
values of motivation,” and “use and gratification theory.” The analysis of literature also included
some important documents from the Malawi Government, institutional reports and general
information from the ‘Open Sources’ libraries. This was done to understand the context of
similar studies, identify the research gaps in the existing body of knowledge, and to compare or
conclude on the findings of this study. The citations were made using the APA style as required
faculty of Agriculture Education at Purdue University.
2.4 Agricultural Information 2.4.1 Agricultural Information
Agricultural information is a loaded term that is extensively used without any description
by most studies reviewed (Mittal & Mehar, 2013; Egbule, Agwu, & Uzokwe, 2014; Kashem,
2010). It combines two broad terms; “information” which is defined as an aspect that one notices
or differences in the pattern of reality within your environment or oneself that can be processed
into data to enhance knowledge (Case, 2012; Prihandoyo, Muljono, & Susanto, 2014); and
“agriculture" which can be contextualized in various disciplines. Agriculture is an increasingly
information and knowledge intensive sector that involves many new emerging and complexing
issues such as climate change, variations on market input prices, and loss of biodiversity that
impact rural livelihoods (FAO, 2012). Agricultural information accounts for internal and external
differences in farmers’ knowledge and perceptions on adoption of agricultural technologies and
relevant ideas to help them improved productivity as well as their rural livelihood (Case, 2012;
FAO, 2012). Numerous studies indicated that (agricultural) information is associated with
various behaviors such as information needs, seeking, and practices disseminated by information
sources in a particular information systems (Case, 2012; Prihandoyo et al., 2014). Several

16
authors recommended that future information studies should focus on the information end-users
because they are also finders and interpreters, and hence drivers of information systems (Case,
2012; FAO, 2012). It was, therefore, important to focus this study on the farmers with mobile
phones who were highly regarded as the end users of mobile agricultural information services or
additional mobile services.
2.4.2 Agricultural Information Generation and Dissemination in Malawi
Agricultural technologies and information have been developed and dissemination by
various agricultural research institutions, local or international universities, and extension
organizations operating in Malawi. The research institutions of agricultural generating
technologies is done by the Department of Agricultural Research Services (DARS), Agricultural
Research and Extension Trust (ARET), Lilongwe University of Agriculture and Natural
Resources (LUANAR), international research institutions, Malawi Institute for Industrial
Research, and private companies and consultants (Mviha, Mtukuso, Banda, & Chisama, 2011).
The authors also noted that the Agricultural Technology Clearing Committee (ATCC) approves
all agricultural technologies and information generated by institutions in the National
Agricultural Research Systems (NARS) for release. This national committee oversees the
scientific processes in the development of technology and its appropriateness for deployment
with the end-users in Malawi’s agricultural sector. Various extension service providers formally
disseminate the approved technologies and information generated by National Agricultural
Research System (NARS; Mviha et al., 2011).
On the other hand, Malawi's agricultural extension system has been disseminating
agricultural information and knowledge using a pluralistic approach that is demand-driven as

17
stipulated by national agricultural extension policy (GoM, 2002). According to Masangano &
Mtinda (2012), there were 37 institutions providing extension and advisory services across the
country. The Department of Agricultural Extension Services (DAES) under the Ministry of
Agriculture, Irrigation and Water Development has been the major extension service provider
with 98 percent of the field staff in the 28 districts (Masangano & Mtinda, 2012). The authors
further clarified that the other institutions disseminating agricultural information and knowledge
were universities, non-governmental organizations (NGOs), agro-dealers, multilateral
organizations, private-sector organizations, parastatal organizations, cooperatives, associations,
and farmers’ organizations (Masangano & Mtinda, 2012; Masambuka-Kanchewa, 2013). The
ministerial departments such as the Department of Agricultural Research Services (DARS);
Department of Crop Development (DCD); Department of Animal Health and Livestock
Development (DAHLD); Land Resources Conservation Department (LRCD); Department of
Fisheries and Aquaculture Development (DFAD); Department of Agricultural Planning Services
(DAPS); and Department of Irrigation (DoI), provide technical support to increase the
effectiveness of the existing extension systems (Masambuka-Kanchewa, 2013). Apart from
public institutions, non-governmental organizations, private companies, universities,
international organizations and farmers’ associations offers formal agricultural information and
technologies dissemination pathways. In this regards, DAES has been coordinating and
collaborating with research as well as all other extension providers to reach out effectively to
farming communities.
In Malawi, the public agricultural extension system is organized into eight Agricultural
Development Divisions (ADDs) which are further subdivided into 800 Extension Planning Areas
(EPA) which are managed by the 28 Districts Agricultural Offices (Masangano & Mtinda, 2012).

18
The authors indicated that extension services are provided to farmers through Agricultural
Extension Development Officers (AEDO) working in several villages also called ‘Sections’ and
coordinated by Agricultural Extension Development Coordinators (AEDCs) at the EPA level.
Within each district, Subject Matter Specialist (SMS) such as Extension Methodology Officers,
Communications Officers, Crops Officers, and Livestock experts support them. Recent
developments also advocate for a lead farmers’ (farmer to farmer) approach in delivering
specific agricultural technologies (Masambuka-Kanchewa, 2013). This was done to close the
gaps between extension officers and farmers which was at a ratio of 1:2500 instead of the
recommended 1:750 due to limited staff (Tegha, 2014).
2.4.3 Challenges on Agricultural Information Dissemination in Malawi
Malawi like most SSA countries, disseminate agricultural information primarily using face-to-
face communication strategies (Masambuka-Kanchewa, 2013). The other modes of
communication used were Information Communication Technologies (ICT) such as television,
radio, newspapers, and landlines (Katengeza, 2012; Davis, 2008). The innovative agricultural
information dissemination strategies used by agricultural extension include the use of new ICTs
such as Internet connected computers, mobile phones, and information sharing platforms (Davis,
2008). However, the agricultural extension system faces some challenges with the dissemination
of agricultural information. These include: 1) limited funding; 2) failure to implement policy
regarding timely information delivery; 3) weak linkage between research-universities-extension-
farmers; 4) limited staff; and, 5) low motivated field staff (Aker, 2011; Aker & Mbiti, 2010;
Oladele, Lepetu, Subair, & Obuh, 2009; Anderson, 2007). The FAO, in 2013, reported that
limited agricultural extension services in most areas create a situation where farmers seek

19
information from multiple sources, which are inconsistent (FAO, 2013). Therefore, ICTs such as
mobile phones can be used to assist rural farmers, extension providers and other key players in
sharing information, solving some of the timeliness issues with the traditional face-to-face
system (Davis, 2008). The question is how best to use mobile phone-based extension services to
disseminate information needed by the farmers in their context.
2.5 Mobile Agricultural Information Services 2.5.1 Mobile Agricultural Information Services in Developing Countries
The widespread usage of mobile phones in developing countries, over the past decade,
has created a focus on this technology as the instrument for development (FAO, 2012). Fu and
Akter (2011), observed that the use of mobile phones could benefit, in many ways, the majority
of rural people who are at bottom of the economic pyramid. A sub-discipline called Mobile for
Development (M4D) has gained attraction as part of the Information Communication for
Development (ICT4D) agenda which was formulated in the early 2000s (Duncombe, 2012; Aker
& Mbiti, 2010). Dissemination of information, via mobile technology, has proliferated in all
sectors including health, marketing, financing, education, agriculture, risk management, transport
and governance (FAO, 2013). According to Donovan, (2011), M4D is focused on rural
livelihood services and development of applications. However, with the mobile phone being the
first electronic communication device for many farmers, there is a concern that the leapfrogging
of some of the electronic-based technologies may have resulted in farmers failing to understand
how to use mobile-based technologies effectively (FAO, 2013). In the rural setting, mobile
phones are the primary tool of communication and the core technology to support social change
and empower the farming communities (Hernandez, 2012). It was evident that mobile phones

20
provide a new opportunity for farmers to have direct access to agricultural information from
extension agents, researchers, processors and consumers.
Studies conducted in Sub-Saharan African countries, such as Tanzania, Uganda, Kenya,
Nigeria and Malawi, provide evidence that the use of mobile phones is benefiting rural farmers
(Duncombe, 2012; Aker, 2011). The types and capabilities of mobile phones possessed by
farmers determine the type of agricultural information to disseminate for effective
communication (Table 1). According to Aker (2011), SMS text messages are used extensively
because they are easy to create and customize, and they are cheap to distribute to a large group of
people simultaneously. Each mobile communication channel has its limitations. Among them
were high illiteracy level, which requires real-time interactions in terms of farmers-help lines and
interactive voice systems (Duncombe, 2012). However, little has been done to identify the types
and functionality of the mobile phones possessed by farmers to determine the type of information
to disseminates in Malawi.

21
Table 1
Types of mobile phone applications used for agricultural information
Technology Description Availability
Voice The most basic channel; avoids most literacy of linguistic barriers
Basic phones
Short Message Service (SMS) Ubiquitous text-based messaging limited to 160 characters
Basic phones
Unstructured Supplementary Services Data (USSD)
A protocol used by Global Service for Mobile Community (GSM) phones to communicate with the mobile network
Basic phones
Interactive Voice Response (IVR)
Computer programs that respond to the voice input of callers
Basic phones
General Packet Radio Services (GPRS)
Low band width data services Midrange phones
(Mobile) Software Applications (e.g. Java, iOS)
Preinstalled or downloaded software of varied sophistication
Midrange phones but increased sophistication with smartphones
Mobile Wireless Application Protocol (WAP)
A limited manner of browsing the internet
Midrange phones
Multimedia Messaging Service (MMS)
SMS-based technology to transmit multimedia (Including images and videos)
Midrange phones
Camera For capturing still and movie images Midrange phones
Bluetooth Protocol for transmitting data over a short distance
Midrange phones
Mobile Web Full-fledged web access Smart phones
Global Positioning System (GPS)
Technology allowing for location-based information
Smart phones
Source: Donovan (2011, p. 56)

22
The information in the table presents a summary on how mobile phone’s different
capabilities can be used to disseminate various types of information. According to Duncombe,
(2012), the functions can be used as stand-alone or integrated services. Most rural farmers use
basic cell phones and therefore have limited mobile channel options. However, the results from
studies conducted indicated that the majority of the farmers prefer voice calling over SMS text
messaging in India, Tanzania, Kenya and Uganda (Cole & Fernando, 2012; Kashem, 2010;
Candalla, 2012). This has been attributed to low literacy skills, complexity of retrieving the
information and incomplete messages due to the 160 character limit (FAO, 2012). On the other
hand, voice calls are costly and difficult to customize messages to match the individual user’s
informational needs (Aker, 2011). The literature validates that face-to-face communication is
useful sharing confidential information, developing skills, and providing feedback (Duncombe,
2012). It is important to understand farmers’ needs and develop appropriate information based on
use of mobile applications.
2.5.2 Mobile Agricultural Information Services in Malawi
In 2014, the Malawi Communications Regulatory Authority (MACRA) conducted a
study and found that 42% of the rural households and 31% of individuals were using mobile
phone technology as a communication tool (MACRA, 2015). However, the report did not
specify whether the participants were farmers or if they were using the technology for obtaining
agricultural information services. Additional studies focused on the agricultural information
perceptions and behaviors of smallholder farmers on ICTs (Masambuka-Kanchewa, 2013), and
effectiveness of ICTs initiatives to promote market information systems along the value chain
(Katengeza, 2012; Simuja, 2012). An in-depth study conducted by Masambuka-Kanchewa

23
(2013), found that farmers in the central part of Malawi used various ICT tools such as radio,
print media and mobile phones. Radio was reported as the most used media despite the increased
informal use of mobile phones. The study used a small sample (20 farmers and 12
Communication Officers) size limiting its validity and generalization. Therefore, there was a
need to conduct further studies on mobile agricultural information services with a larger sample.
The literature indicates that mobile enabled SMS push-based platforms such as Esoko,
are being used to send market information, transport tracking systems and good agricultural
practices to smallholder farmers, traders and producers (Katengeza, 2012; Simuja, 2012;
MoAIWD, 2013). These two authors also reported that the Malawi Agricultural Commodity
Exchange (MACE), Department of Agricultural Extension Services (DAES) under the Ministry
of Agriculture, Irrigation and Water Development (MoAIWD), National Smallholder Farmers
Association (NASFAM), Agricultural Development and Marketing Cooperation (ADMARC)
were just a few of the organizations and companies using the Esoko platform. It was also noted
that farmers had to register their mobile phone numbers with the various host institutions, to
enable access to market prices, weather information and reminders on the agronomic practices
(Simuja, 2012). It was reported that SMS text messaging was the cheapest delivery system, easy
to use, and messages can be bulk distributed, but messages are limited to 160 characters per
message (Duncombe, 2012).
Clodina Chowa said that there were a growing number of mobile phone-based
agricultural information services such as 3-2-1 by Airtel Malawi Limited and the newly
established Voice Call Center (VCC) by Farm Radio Trust (Personal communication, February,
11, 2015). Malawi was advocating for implementation of the same services that are being
implemented in neighboring countries. In 2014, various concerned stakeholders formed a Nation

24
Content Development Committee for ICTs in Malawi (NCDC-ICT). Its main aim was to approve
all the multimedia content uploaded to the various platforms such as 3-2-1 and Esoko. This truly
reflected a need to document developments taking place with MAIS in Malawi.
2.6 Need for the Study
Mobile agricultural information services (MAIS) is a relatively new discipline of study
with limited amount of research conducted to-date. Consequently, to promote sustainable rural
development there is a need to understand the farmer’s use of mobile phones and the impact on
reducing the digital divide (FAO, 2012). The mobile phone was regarded as a direct tool
contributing to agricultural productivity and indirectly empowering farmers to make informed
decisions on agriculture and allied networks (FAO, 2013; Zahedi & Zahedi, 2012). Literature
shows that mobile phone usage is at the center of agriculture and rural development in most
developing countries (Duncombe, 2012). However, it is evident that there is limited
documentation on rural farmers’ information and knowledge needs to access MAIS suitable for
local context in Malawi. Studies indicate that considerable research attention has been focused
on the technology itself, especially mobile information platforms and mobile money transfers,
but little has been done to determine the agricultural production needs of farmers (FAO, 2013).
The use of mobile phones is a critical step to increase access to knowledge, and the most obvious
and cost-effective way to improve agricultural information dissemination in many rural areas
(Donovan, 2011). It was believed that having MAIS without integrating the real farmers’
information needs and capabilities was not sustainable. The study was conducted to understand
the farmers’ motivations to use MAIS, in order, to inform future research processes, content
generation and development of appropriate mobile applications.

25
2.7 Theoretical Framework
This study focused on two theoretical frameworks, expectance-value motivational theory
and ‘digital-divide’ concept, to guide in contextualizing the research methodologies and its
findings. Previous studies used adoption of mobile technology theory and the rural technology
acceptance model (Islam & Ake, 2011), however many did not employ theories due to
unavailability of specific theories on mobile agricultural information services. It was important
to use two different theoretical/conceptual frameworks relating them, contributing to new
knowledge.
The expectancy-value theory of motivation (EVTM) by Eccles & Wigfield (2002),
discussed the motivations, beliefs, values and goals related to developmental and educational
psychology. The authors modeled the expectancies and values by focusing on school children to
explain their performance as well as choice of different activities. However, the theory has been
used beyond the scope of education such as in organizational analysis, health, communications,
marketing and economics (Lunenburg, 2011; Eklof, 2006; Cooper, Burgoon, & Roter, 2001).
According to the analysis pertaining to organization, several underlying assumptions were used
for EVTM by: 1) people have expectations about their needs and past experiences; 2) people
want different things for their personal benefits; and, 3) people will choose alternative options to
optimize outcomes for them personally (Lunenburg, 2011). This study only focused on utility
value or usefulness and cost-benefits in the view that farmers as individuals have plans to fulfill
certain requirements in various enterprises. They were also making various decision to engage in
activities which may be valued to match their efforts to accomplish some emotional and real
costs (Wigfield & Eccles, 2000).

26
‘Digital divide’ is not a theoretical framework but rather an abstract term originally
describing the differences created between the users of computer and non-users because of socio-
economic differences (Pearce, 2013; Van Dijk, 2012). An analysis by Russell and Steele (2013),
found that with the digital revolution, Sub-Saharan Africa region has encountered the following
significant issues leading to a ‘digital divide’: 1) lack of access due to an insufficient information
infrastructure; 2) lack of finances to acquire hardware and software; 3) lack of education and
trainings on digital skills; and, 4) lack of sharing of information resources. The ‘digital divide’
concept was categorized into three social aspects: the first-level digital divide refers to the
inequality pertaining to access of information technology (IT); the second level concerns the
inequalities due to capabilities to use IT; and, the third level covers the inequalities of outcomes
(Wei et al., 2011). However, the study utilized the social cognitive theory basing on home
ownership of computers to create three levels of digital divide. It was worthy to note that the
results do not apply to all ICTs but specifically mobile technology, but since mobile technologies
are gaining more applications, and computational and storage power as stated by ‘Mores Law’
(Van Dijk, 2012); the concept may be applicable. Concerning this study, the first level digital
divide did apply as all the farmer participants had access to ICT through a mobile phone. The
critics indicated that there was a need to expand the conceptual framework to suite the current
context for theoretical relevance of mobile media and communication in developing countries
(Pearce, 2013). The digital divide concept was chosen to be part of the theoretical framework
because this study explored the issues of farmers’ digital skills and perceived outcomes from
accessing mobile agricultural information services. It also assisted to understand social-economic
aspects that can hamper the farmers’ potential to access agricultural information in general.

27
2.8 Conceptual Framework
The combination of two theoretical frameworks enabled the author to build a conceptual
framework for this study in relation to mobile agricultural information services. Demographics
such as personal information, literacy skills, farming experiences and socio-economic
characteristics, constituted part of the preliminary findings in the methodologies section, to assist
in interpretation of the results. The concept of mobile phone technology was contextualized to
refer to hardware and software used by the farmer participants at the study’s particular point in
time. Mobile phone technology advancements are dynamic, as stated by ‘More’s Law, thus it
was necessary for the technology utilized to be specified during the study’s time. Mobile
technology was closely related to the mobile-based information sharing platforms also known as
mobile agricultural information services. These were defined as various mobile enabled media to
disseminate the information to farmers and other key stakeholders in the agricultural sector. It
was assumed that MAIS services would be provided to all farmers with mobile phones,
regardless of their enterprises and needs.
It was noted that the farmers were not a homogeneous group and therefore, they have
different agricultural information needs. Previous studies used extensively the term agricultural
information without proper definition. The key components of this study were obtaining farmers’
perceived agricultural information needs and their inputs on how to improve delivery and
timeliness of the information. The expectancy value motivations were drawn to assess whether
the farmers were able to foresee usefulness and cost-benefits of mobile agricultural information
services and therefore the contribution of the body of knowledge on innovative agricultural
extension systems.

28
Lastly, challenges and opportunities were drawn to assist in assessing the potential that
farmers will use mobile agricultural information services and ascertain availability of ‘digital
divide’. The findings and conclusions of this study were based on the self-reported behaviors of
individual farmers, aggregated into the bigger and general picture of MAIS in Lilongwe a central
district of Malawi. Below is the summarized conceptual framework for this study.
Source: Chisama, 2014
Farmers Demographics
Age, gender, education, income,
experiences, literacy and leadership
Agricultural Information Needs
Productivity, processing &
utilization, finances and markets
Challenges /Opportunities
Technological access, network coverage, financial
resources, digital skills, cultural access, & timely
information
Mobile Phone Technology Brand, types,
applications and network
Mobile Agricultural Information
Services (MAIS) SMS text messages, voice
calls, integrated voice responses, videos, audios
and photos
Motivational Values
Utility values and cost belief
Alternative ICT Channels
Face-to-face, radio, TV, print media computers, and
internet
Self-reported Behavior
Productivity, processing &
utilization, finances and markets

29
CHAPTER 3: METHODOLOGY
3.1 Introduction
This chapter provides an overview on the research methods and procedures used to
collect, process, analyze and interpret data for the study. The chapter discusses the research
design, participant-sampling methods, of data types collected, data analysis and demographical
characteristics of the participant farmers. The instrumentation, validity, reliability, data
collection, data management, and data analyses processes are also discussed. The following
sections are also covered to reflect the research focus of the study.
3.2 Research Focus
The study assessed the potential for using mobile technology to provide agricultural
information services to farmers in Lilongwe District of Malawi. The five research questions
covered farmers’ use of mobile technology, awareness and use of MAIS, information needs,
challenges and opportunities for MAIS.
3.3 Study Area
The study was conducted in the Republic of Malawi’s Lilongwe District, which is located
in the central part of the country. Lilongwe lies between the latitudes 13 30’ South and 14 45’
South, and longitudes 33 15’ East and 33 30’ East. The district covers 6,159 km2 and hosts
Lilongwe City, which is the capital city of Malawi (Appendices C, Figure 4). In total the district
had a population of 1,897,167 with 1,230,834 (65%) living in rural areas (NSO, 2008). The
Lilongwe District Assembly coordinates all developments efforts by all sectors governed by the
District Assembly. Following the government’s restructuring initiative, the district operates

30
utilizing the decentralized system at the local level with various offices for agriculture,
education, health, transport, and many more sectors.
In terms of agriculture, Lilongwe District Agriculture Offices (DAO) coordinates all
activities related to agriculture and rural development. Lilongwe has both urban and rural
farming due to the expansion of the city and peri-urban areas. The DAO coordinates various
extension programs in collaboration with other public outreach organizations and non-
governmental actors. It has been using the District Agricultural System Structures (DAES) where
various agricultural development committees comprised of farmers, agricultural experts and
other stakeholders make decisions on district development and programs (Figure 2, below).
Source: DAES, 2015
Figure 1, District Agricultural Extension Services System in Malawi

31
The District Agricultural Office has 19 Extension Planning Areas (EPAs) that were
demarcated based on the agro-ecologies and Traditional Authority boundaries. This study
involved Mpingu and Mitundu EPAs, selected randomly to represent all other EPAs in the
district (Appendix C, Figure 5). The EPAs are further sub-divided into blocks also known as
‘Sections’ with a minimum of nine and maximum of 19. For this study, five sections from
Mpingu and five from Mitundu were also randomly selected from a total of 19 and 12
respectively.
3.4 Research Design
The research had a post-positivist perspective and mix methods research design was used
to draw the inferences from the two EPAs that could be generalized to the entire Lilongwe
District. This aimed at overcoming the limitation of a single design and to triangulate the results.
A cross-sectional survey method targeted exploring various aspects of farmers using mobile
phone technology to access agricultural information and services. According to Schutt (2012),
survey research was deemed an efficient and versatile method of collecting systematic data from
individuals within their social setting (Lilongwe). The participant farmers’ opinions, suggestions
and foreseen opportunities of using mobile agricultural information services were collected using
open-ended questions. The pre-arranged in-person interviews focused on both quantitative and
qualitative data from the farmers’ perspectives on MAIS in the two EPAs. A research team was
trained before conducting in-person interviews and key informants’ validations because there are
high illiteracy levels in rural communities. In-person interviews ensured quantity and quality of
data collected because the interviewer asked the question and the respondents provided answers
rather than filling out a questionnaire themselves (Ingrid, 2011). In this study, using ‘survey’

32
methodology was ideal to cover several topics related to the farmers’ use of mobile phone
technology to access agricultural information to make decisions (Schutt, 2012). According to
Ingrid (2011), the disadvantages of in-person survey interviews are: 1) high costs on travel and
time; 2) difficult access into the typical rural remote areas; 3) resistance by potential respondents;
and 4) interviewer biases due to personal presence during interviews. However, the challenges
regarding costs were minimized through strategic planning and timing for quality data. Other
challenges were minimized by collaborating with the field extension officers, community leaders
and lead farmers.
3.5 Institutional Review Board Approval
Purdue University Institutional Review Board (IRB) approved the protocols of this study
in February 2015 for the reason that it involved the use of human subjects. The project’s key
researcher completed the Collaborative Institution Training Initiative (CITI) Group 2: The
Protection of Human Subjects in October 2014. The CITI report and data collection instrument
were submitted to IRB in December 2015. In Malawi, permission was obtained from the Director
of the Agricultural Extension Services under the Ministry of Agriculture, Irrigation and Water
Development in January 2015 (Appendices A, Figure 3). A graduate research committee at
Purdue University as stipulated by the Graduate School approved all procedures as stipulated by
the IRB issued approval letter for the study in March 2015 (Appendices A, Figure 2).
3.6 Participants
The researcher involved two Extension Planning Areas for which a database of farmers
with mobile phones did not exist. Agricultural Extension Development Officers (AEDOs) in

33
each EPA were able to compile a list of farmers within the selected five clusters (Sections) who
possessed a mobile phone. The accessible population meeting the study’s parameters for
participation was 1402 farmers drawn from unexhausted theoretical population predicted for the
research sites. Probability online sampling tools were used to determine a total number of
participant from a sample frame, at 95% confidence level. Results indicated a sample size of 302.
The actual number of farmers who agreed to participate in the study was 291. Information
provided by the farmers was validated by10 key experts (nine extension officers and a Deputy
Director of Agricultural Extension Services) who clarified some ambiguous issues raised by the
farmers during the study. Therefore, it is important to note that the results presented in this study
report were collected from the participant farmers and confirmed by these experts for validity.
3.7 Sampling Procedures
The study used multistage sampling procedures to get a representative sample from
Lilongwe DAO. Nineteen EPAs under the Lilongwe District Agricultural Office were listed and
assigned random numbers. A simple random number selection was conducted to identify two
EPAs as opposed to a purposive selection to avoid researchers’ biases. The two identified EPAs
were Mpingu and Mitundu with 19 and 12 sections respectively. Five Sections were randomly
identified per EPA using a random number selection applet. Within each Section, a list of
individual farmers with mobile phones was compiled. A total of 1402 farmers with a mobile
phone were identified as a sample frame as discussed in the participants sub-section. An online
sample size calculation program for surveys provided by Creative Research Systems (CRS,
2012) was used to determine the total number of participants needed to achieve a 95%
confidence level. The calculated representative proportion was 302 that could be attained by

34
identifying approximately 30 participants per Section. However, the actual number of
participants who agreed to participate in the study was 291. Nine respondents failed to turn up
for interviews.
3.8 Instruments
The survey instrument was a structured questionnaire for participant farmers. The author
developed most of the questions in the instruments based on the literature and similar research
studies. The questions covered various topics such as: 1) demographic characteristics and
personal information; 2) types, brands, mobile phone technology categories and frequency of
using mobile phone applications; 3) farmers access to mobile agricultural information services
(MAIS); 4) farmers’ agricultural information needs; and 5) farmers’ challenges and opportunities
to access MAIS. Responses were provided for each question by individual farmers to facilitate
completion of the oral interviews that lasted approximately 45 minutes. Various experts such as
agricultural research scientists, extension officers and graduate committee (youth development,
extension educators and social research scientists) validated the information contained in the
tool. A team of five language experts translated the questionnaires from English into the national
language for Malawi (Chichewa). It was later pre-tested by the research team in areas close to
the study’s sites for uniformity.
3.9 Training Interviewers
Eight interviewers were recruited as a team from research and extension institutions to
collect data and process it according to objectives of the study. This was done through targeted
recruiting on social media to extension experts who were willing to take part in the survey. Team

35
members were trained for two days using principle of adult learning approaches. The topics
covered: 1) breaking the ice and seeking the farmers’ consent; asking research questions and
capturing data; and, probing and seeking clarification from farmers. The plenary discussion also
covered issues of validation of responses, capturing extra information and logistical
arrangements for the study. The interviewers had a hands-on opportunity to practice
administering the questionnaires to at least three farmers before conducting their first official
survey. Practical sessions were supervised by the researcher to ensure teamwork and provide
directions on completing various sections of the questionnaire. The exercise also assisted to time
the actual interviews, and reword and sequence some questions in the instrument. The team
members were also familiarized with other research protocols to be followed in village set-ups
where local leaders expect to be respected and provide permission to interview only those
farmers with mobile phones.
3.10 Data Collection
The research team collected data from selected participant farmers for a period of four
weeks in their respective Sections during August and September 2015. The study followed
Dillman’s tailored modes for conducting in-person surveys (Dillman, 2011). The selected
farmers were notified about the interview schedules (day, time and locations) through extension
officers. On the day of interviews the farmers in each ’Section’ were notified to meet at one of
two sites depending on distance from their home/farm. This was done to cut travel costs of
visiting individual farmers in their homesteads. Farmer participants were briefed about the study
objectives and had to provide a verbal consent before commencement of the interviews.
Individual interviews were done separately and privately, giving respondents the opportunity to

36
answer as, they felt appropriate per IRB standards (Appendix B, Figure 6). The interviews
ranged from 30 to 50 minutes to complete filling out a questionnaire as anticipated. The
researcher supervised the data collection exercise to ensure that interviewers stayed focused and
remain impartial in capturing farmers’ given responses. The Agricultural Extension
Development Officers for the area were present during the interviews to clarity some pertinent
issues raised by farmer participants. Each completed questionnaire was checked for
completeness and accuracy by the researcher before final submission of data entry.
3.11 Data Analysis
In this study, quantitative data sets were analyzed using the Statistical Package for Social
Scientists (SPPS, Version 16). The analysis was done by descriptive statistics, cross tabulation,
multiple responses, reliability test and non-parametric tools. The results were presented by
frequencies and percentages comparing two EPAs and the totals. On the other hand, qualitative
data was organized and evaluated by a simple open axial coding system, developing categories
and then summarizing categories into six assertions. Codes, categories, and assertions were
vetted through a peer debriefing, and checked by two social science researchers. The qualitative
findings were presented using six assertions, followed by categories with some supporting
quotations from participants. The key informants validated the farmers’ claims.
3.12 Demographic Information Results
The research tool gathered some demographic and personal information about the study’s
farmer participants. The categories covered were age, gender, education, income, occupation,
leadership roles, land size, farming experience, and economic information. The results are

37
presented in this section of Chapter 3 to permit Chapter 4 to focus on the study’s five research
questions. Sections below are the demographic information results of farmer participants from
Mpingu and Mitundu EPAs.
3.12.1 Section Information
Table 2 indicated that approximately half (51%) of the respondents were Mpingu
residents with slightly less from Mitundu (49%). It should be noted that a largest percentage was
from Katate (11%) with Umodzi (9%) providing the smallest percentage. The mean number of
farmer participants per section was 29.10 farmers (SD = 1.20) with no differences between the
two Extension Planning Areas (EPAs).

38
Table 2
Number participant farmers per Sections
Sections
Extension Planning Area (EPA) Total (N = 291) Mpingu (n = 149) Mitundu (n = 142)
Frequency Percent (%) Frequency Percent
(%) Frequency Percent (%)
Katope 0 0.00 30 21.13 30 10.31
Namphande 0 0.00 29 20.42 29 9.96
Khubwi 0 0.00 28 19.72 28 9.62
Katayansengwa 0 0.00 28 19.72 28 9.62
Umodzi 0 0.00 27 19.01 27 9.28
Katate 31 20.81 0 0.00 31 10.65
Kandere 30 20.13 0 0.00 30 10.31
Mpenga 30 20.13 0 0.00 30 9.97
Kalima 29 19.46 0 0.00 29 9.97
Kagwatipenya 29 19.46 0 0.00 29 9.97
Percent for total 51.20 48.80 100.00
In terms of Traditional Authorities (TAs), the largest percentage of respondents was from
Malili (41%) and Chiseka (36%) in Mpingu and Mitundu respectively. Overall the number of
villages represented for each EPA were 55 in Mpingu and 73 in Mitundu with the mean number
of villages being 31.25 (SD = 17.50) per Traditional Authority (Table 3).

39
Table 3
Number of participant farmers per Traditional Authority location
Traditional Authorities
Extension Planning Area (EPA) Total (N = 291) Mpingu (n = 149) Mitundu (n = 142)
Frequency Percent
(%) Frequency Percent
(%) Frequency Percent
(%)
Chadza 0 0.00 38 26.76 38 13.06
Chiseka 0 0.00 104 73.24 104 35.74
Njewa 31 20.81 0 0.00 31 10.65
Malili 118 79.19 0 0.00 118 40.55
Note: Traditional Authority Areas are local political systems where the subjects consist of
several Group Village Headmen/women.
3.12.2 Personal Information
The results on gender indicate that there were more males (62%) as compared to females
(38%). In terms of the differences within EPAs the Mitundu sample had more males (77%)
whereas the Mpingu sample was just over fifty (51) percent female (Table 4).

40
Table 4
Gender categories of participant farmers
Gender Categories
Extension Planning Area (EPA) Total (N = 290) Mpingu (n = 148) Mitundu (n = 142)
Frequency Percent
(%) Frequency Percent
(%) Frequency Percent
(%)
Males 72 48.65 109 76.76 181 62.41
Females 76 51.35 33 23.24 109 37.59
In terms of age, the largest proportion of participant farmers were middle-aged (49%),
with remaining half divided between the older adults (21%) and young adult (19%) categories.
The overall mean age of the participants was 36 years of age (SD = 12.60). The respondents’
ages did not differ significantly between the two EPAs (Table 5).

41
Table 5
Age categories of participant farmers
Age Categories (years)
Extension Planning Area (EPA) Total
(N = 289) Mpingu (n = 147) Mitundu (n = 142)
Frequency Percent
(%) Frequency Percent
(%) Frequency Percent
(%)
18-25 (Young adults) 26 17.69 29 20.42 55 19.03
26-39 (Middle-age adults)
72 48.98 70 49.30 142 49.14
40-54 (Older adults) 28 19.05 32 22.54 60 20.76
55-69 (Senior adults) 17 11.56 10 7.04 27 9.34
Over 69 (Elderly) 4 2.72 1 0.70 5 1.73
The respondents were asked to indicate number of people living in their households. The
results in table 6 indicates that nearly half (46%) of the households were medium size, 37 percent
were small sized, and 16 percent were classified as large-sized households (Table 6). The overall
mean household size was 5.45 (SD = 2.18). There was no difference between the two Extension
Planning Areas.

42
Table 6
Household sizes of participant farmers
Number of household members
Extension Planning Area (EPA) Total (N = 289) Mpingu (n = 148) Mitundu (n = 141)
Frequency Percent
(%) Frequency Percent
(%) Frequency Percent
(%)
Small (1-4) 57 38.51 51 36.17 108 37.37
Medium (5-7) 66 44.59 68 48.23 134 46.37
Large (More than 7) 25 16.89 22 15.60 47 16.26
The results in table 7 on marital status categories of respondents indicated that the
majority of participant farmers were married (83%) with 13 percent reporting they were single.
There were slight differences on marital status between farmer participants from Mitundu and
Mpingu EPAs.
Table 7
Marital Status categories of respondents
Marital status Categories
Extension Planning Area (EPA) Total (N = 291)
Mpingu (n = 149) Mitundu (n = 142)
Frequency Percent
(%) Frequency Percent
(%) Frequency Percent
(%)
Single 18 12.08 18 12.68 36 12.37
Married 119 79.87 123 86.62 242 83.16
Divorced 5 3.36 1 0.70 6 2.06
Widowed 4 2.68 0 0.00 4 1.37
Separated 3 2.01 0 0.00 3 1.03

43
Respondents’ education levels included those who only attended and completed a
particular educational level. More than half of the participant farmers attended primary school
(65%) with just over a quarter (28%) working on a secondary school education. Mpingu had the
largest percentage of participants who attended primary schools (68%). In comparison of the two
EPAs, Mitundu had largest percent of farmers with a secondary education (30%; Table 8).
Table 8
Participant farmers education level categories
Educational Levels
Extension Planning Area (EPA) Total (N = 291)
Mpingu (n = 148) Mitundu (n = 142)
Frequency Percent
(%) Frequency Percent
(%) Frequency Percent
(%)
None 10 6.71 11 7.75 21 7.22
Primary 100 67.11 88 61.97 188 64.60
Secondary 38 25.50 42 29.57 80 27.49
Tertiary 0 0.00 1 0.70 1 0.34
Note: Primary school ages = 6 to 13 years, secondary school age = 14 to 18 years and tertiary education = 18 above. Educational levels refer all to those who attended or completed.
In terms of occupation, the participants gave multiple responses to the question. Most of
the respondents were engaged in full-time farming (98%) with a few holding full-time off-the-
farm jobs (3%). All Mitundu participants (100%) indicated they were full-time farmers unlike
Mpingu where 93 percent cited full-time farming as their major occupation. Mpingu had the
largest percent of casual laborers (7%) and full-time off-farm employment (6%; Table 9).

44
Table 9
Multiple responses on participant farmers’ occupation
Occupation Categories
Extension Planning Area (EPA) Total
Mpingu (n = 149) Mitundu (n = 142) (N = 291)
Frequency
Percent (%) Frequency
Percent (%) Frequency
Percent (%)
Full-time Farming
139 93.29 142 100.00 281 96.56
Small business 13 8.72 12 8.45 25 8.59
Casual labor 10 6.71 2 1.40 12 4.12
Full-time job 8 5.36 0 0.00 8 2.75
Student 4 2.68 2 1.40 6 2.06
Skilled labor 2 1.34 1 0.67 3 1.03
Regarding community leadership involvement, the minority (45%) of participant farmers
revealed that they had various community leadership roles (Table 10).
Table 10
Participant farmers’ community leadership involvement
Leadership Roles
Extension Planning Area (EPA) Total (N = 291)
Mpingu (n = 149) Mitundu (n = 142)
Frequency Percent
(%) Frequency Percent
(%) Frequency Percent
(%)
No 78 52.35 81 57.04 159 54.64
Yes 71 47.65 61 42.96 132 45.36

45
The most common specific major leadership roles cited were village headmen (25%) and
village headman’s advisor (17%). Mitundu EPA had a greater percentage of its participants who
were village headmen (36%) and religious leaders (13%). Mpingu had a greater percentage who
were Village Development Committee (VDC) members (20%) and lead farmers (8%). It was
also indicated that 3% of respondents in Mpingu did not disclose leadership roles (Table 11).
Table 11
Multiple responses on participant farmers’ community leadership roles
Leadership roles
Extension Planning Area (EPA) Total (N = 132)
Mpingu (n = 71) Mitundu (n = 61)
Frequency Percent
(%) Frequency Percent
(%) Frequency Percent
(%)
Village Headmen 11 15.49 22 36.07 33 25.00
VH Advisor 11 15.49 11 18.03 22 16.67
VDC1 members 14 19.72 7 11.48 21 15.91
CBO2 members 7 9.86 5 8.20 12 9.09
Religious leaders 4 5.63 8 13.11 12 9.09
Lead farmers 6 8.45 3 4.92 9 6.89
Volunteer Teachers
4 5.63 3 4.92 7 5.30
Farmer's clubs 2 0.00 2 2.90 4 0.00
School committee 2 2.82 2 3.27 4 3.03
Association leaders 3 2.82 1 1.63 4 3.03
Women's advisors 2 4.23 1 1.63 3 3.03
Group VH 2 2.82 1 1.63 3 2.27
Undisclosed roles 3 2.82 0 0.00 3 2.27
Note: 1VDC = Village Development Committee, 2COB=Community Based Organization.
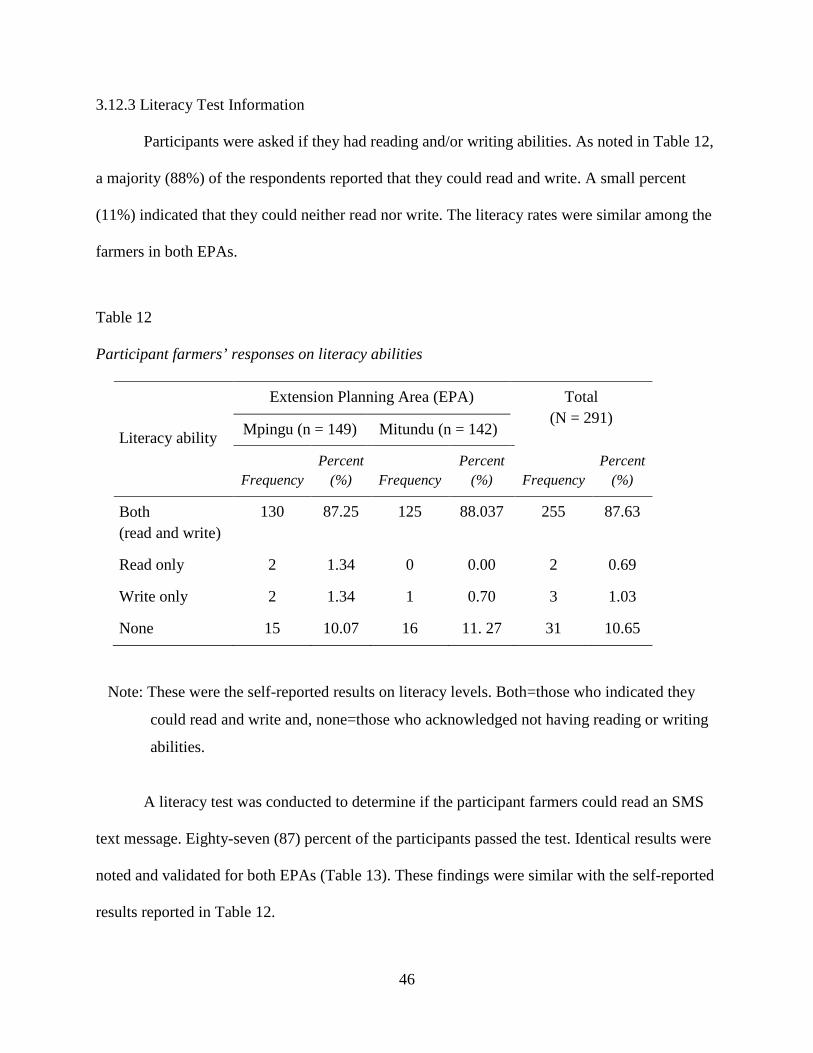
46
3.12.3 Literacy Test Information
Participants were asked if they had reading and/or writing abilities. As noted in Table 12,
a majority (88%) of the respondents reported that they could read and write. A small percent
(11%) indicated that they could neither read nor write. The literacy rates were similar among the
farmers in both EPAs.
Table 12
Participant farmers’ responses on literacy abilities
Literacy ability
Extension Planning Area (EPA) Total (N = 291)
Mpingu (n = 149) Mitundu (n = 142)
Frequency Percent
(%) Frequency Percent
(%) Frequency Percent
(%)
Both (read and write)
130 87.25 125 88.037 255 87.63
Read only 2 1.34 0 0.00 2 0.69
Write only 2 1.34 1 0.70 3 1.03
None 15 10.07 16 11. 27 31 10.65
Note: These were the self-reported results on literacy levels. Both=those who indicated they
could read and write and, none=those who acknowledged not having reading or writing
abilities.
A literacy test was conducted to determine if the participant farmers could read an SMS
text message. Eighty-seven (87) percent of the participants passed the test. Identical results were
noted and validated for both EPAs (Table 13). These findings were similar with the self-reported
results reported in Table 12.

47
Table 13
SMS text message-based reading test for participant farmers
Literacy test result
Extension Planning Area (EPA) Total (N = 291)
Mpingu (n = 149) Mitundu (n = 142)
Frequency Percent
(%) Frequency Percent
(%) Frequency Percent
(%)
Pass 129 86.58 123 86.62 252 86.60
Fail 20 13.42 19 13.38 39 13.40
The participant farmers who failed the literacy test reported they relied on their family
(41%) and friends (30%) to get content received through SMS text messages. Some respondents
consulted their neighbors (10%) and schoolteachers (5%) for literacy assistance. Overall,
Mitundu participants were more likely to seek assistance from friends (38%) and spouses (30%)
while those in Mpingu were more likely to use family (35%) and children (27%) to get SMS text
messages (Table 14).

48
Table 14
Participant farmers’ coping mechanisms for SMS text messages
Aids for who could not read
Extension Planning Area (EPA) Total (N = 39)
Mpingu (n = 20) Mitundu (n = 19)
Frequency Percent
(%) Frequency Percent
(%) Frequency Percent
(%)
Family 9 45.00 7 36.84 16 41.02
Friends 5 25.00 7 36.84 12 30.77
Spouse 2 10.00 6 31.58 8 20.51
Children 7 35.00 0 0.00 7 17.94
Neighbors 2 10.00 2 10.53 4 10.26
Teachers 1 5.00 1 5.26 2 5.13
Note: The data in Table 12 reflects a multi-response question
3.12.4 Farming Experience
Regarding farming experiences, a majority (58%) of the respondents had 15 years or less
farming experience (Table 15). The overall mean years of farming experience was 15.78 (SD =
11.30). Mpingu had a slightly larger percentage (37%) of respondents with less than 10 years of
experience. These results correspond with the ones on age in Table 5.

49
Table 15
Respondents farming years
Farming years
Extension Planning Area (EPA) Total (N = 285)
Mpingu (n = 146) Mitundu (n = 139)
Frequency Percent
(%) Frequency Percent
(%) Frequency Percent
(%)
Less than 10 years 55 37.67 43 30.93 98 34.39
10-15 years 32 21.92 38 23.34 70 24.56
16-20 years 19 13.01 26 18.71 45 15.78
21-25 years 13 8.90 8 5.76 21 7.37
26-30 years 11 7.53 11 7.91 22 7.73
More than 30 years 16 10.96 13 9.35 29 10.18
The study’s participant farmers indicated that their primary farming enterprise goals were
to both produce food and raise cash (83%). Only 16 percent of the subjects were farming for
food only and considerably fewer (1%) were farming to get cash only. As shown in Table 15,
Mitundu farmers were primarily dependents on both enterprise for food and cash (90%) whereas
in Mpingu farmers were less concerned with earning cash only and more focused on raising food
(26%).

50
Table 16:
Participant farmers’ farming goals
Farming Goals
Extension Planning Area (EPA) Total (N = 291)
Mpingu (n = 149) Mitundu (n = 142)
Frequency Percent
(%) Frequency Percent
(%) Frequency Percent
(%)
Both (Food + Cash) 107 71.81 134 89.93 241 82.82
Food only 40 26.85 6 4.02 46 15.80
Cash only 2 1.34 2 1.34 4 1.37
Farm sizes for most participating farmers (63%) were in the category of 1 to 3.99 acres
and followed by 4 to 6.99 acres (27%). Overall, mean land holding size was 3.60 (SD = 2.50).
The average farmers in Mitundu operated a 4 acre farm (SD = 2.50) while Mpingu farmers
operated farms that averaged 2.80 acres (SD = 2.00; Table 17).
Table 17
Farmer participant’s farm sizes
Farm sizes
Extension Planning Area (EPA) Total (N = 290)
Mpingu (n = 148) Mitundu (n = 142)
Frequency Percent
(%) Frequency Percent
(%) Frequency Percent
(%)
Less than an acre 2 1.35 2 1.40 4 1.38
1-3.99 acres 118 79.73 64 45.10 182 62.76
4-6.99 acres 23 15.54 54 38.03 77 26.55
7-9.99 acres 2 1.35 17 11.97 19 6.55
10 or more acres 3 2.02 5 3.52 8 2.76
Note: The land size includes farmers’ owned and rented land for agricultural production.

51
Table 18, shows that the most common farm enterprises reported by the respondents
were: crop production only (76%); crop and livestock production (22%); and, livestock
production only (2%). Mitundu had more respondents who only raised crops (82%) while
Mpingu had a greater percentage of farmers who operated both crop and livestock enterprises
(28%; Table 18).
Table 18
Farmer participant's main farming enterprise
Main farm enterprises
Extension Planning Area (EPA) Total (N = 290
Mpingu (n = 148) Mitundu (n = 142)
Frequency Percent
(%) Frequency Percent
(%) Frequency Percent
(%)
Crops only 104 70.27 117 82.39 221 76.20
Both (crops and livestock)
41 27.70 23 16.19 64 22.06
Livestock only 3 2.03 2 1.40 5 1.72
Overall, the main crops grown by participants were maize (86%), tobacco (12%) and
groundnuts (2%). Nearly all the farmers in Mpingu grew maize (95%) as compared with
Mitundu (76%). Tobacco was a more commonly grown crop in Mitundu (27%) as compared to
Mpingu (3%; Table 19). For more information on all crops grown by participating farmers, see
Appendix D, Tables 58 and 59.

52
Table 19
Respondents’ main crops grown
Crops
Extension Planning Area (EPA) Total (N = 286)
Mpingu (n = 147) Mitundu (n = 139)
Frequency Percent
(%) Frequency Percent
(%) Frequency Percent
(%)
Maize 139 94.55 106 76.30 245 85.7
Tobacco 4 2.72 30 21.58 34 11.89
Ground nuts 4 2.72 3 2.16 7 2.45
Goats (36%), chickens (26%), and pigs (25%) were the main livestock enterprises cited
by the respondents of this study. The two EPAs had similar results except for beef cattle where
Mitundu had a higher percentage of farms with beef cattle (12%; Table 20). The overall means
showed that goats with an overall mean of 3.54 (SD = 2.30) raised by 36% of participant farmers.
The second most common livestock was chickens with an overall mean of 12.46 (SD = 11.30)
raised by 26% of the participants. The third major livestock was pigs with an overall mean of
4.67 (SD =3.50) raised by 25% of the respondents. The other common animals found on the
participants’ farms are noted in Appendices D, Table 60.

53
Table 20
Farmer participants’ main livestock enterprise
Main livestock
Extension Planning Area (EPA) Total (N = 262)
Mpingu (n = 131) Mitundu (n = 131)
Frequency Percent
(%) Frequency Percent
(%) Frequency Percent
(%)
Goats 49 37.40 44 33.59 93 35.50
Chickens 36 27.48 32 24.43 68 25.95
Pigs 36 27.48 30 22.90 66 25.19
Beef Cattle 3 2.29 16 12.21 19 7.25
Dairy Cattle 3 2.29 5 3.82 8 3.05
Sheep 3 2.29 0 0.00 3 1.15
Pigeons 1 0.76 1 0.76 2 0.76
Donkey 0 0.00 1 0.76 1 0.38
Ducks 0 0.00 1 0.76 1 0.38
Fish 0 0.00 1 0.76 1 0.38
3.12.5 Economic Information
Regarding sources of income, farmers indicated that they depend primarily on selling
crop produce (91%). Mitundu respondents were financially dependent on selling crop produce
(90%) whereas other income sources play a more significant role in Mpingu (livestock sales,
small business, and casual labor with proportions of 13%, 12%, and 10% respectively). A
smaller number of farmers utilize livestock (10%) and small business enterprises (9%) as their
income sources (Table 21).

54
Table 21:
Respondents multiple responses on income sources
Sources of Income
Extension Planning Area (EPA) Total (N = 291)
Mpingu (n = 149) Mitundu (n = 142)
Frequency Percent
(%) Frequency Percent
(%) Frequency Percent
(%)
Selling crop produce
130 87.25 136 95.77 266 91.41
Selling livestock 27 18.12 9 6.34 36 12.37
Small Business 25 16.78 7 4.93 32 11.00
Casual Labor 21 16.78 0 0.00 21 7.41
Fulltime Employment
7 4.70 0 0.00 7 2.40
Skilled work 4 2.68 0 0.00 4 1.37
Note: This was a multiple response question.
Results on income levels, provided in Table 22, indicated that four out of every five
farmers (84%) are operating on a medium-low to low income (MK 399, 999 or less). The
average income level for respondents was MK 252, 410 (SD = MK 345, 311). To gain a deeper
appreciation for economic status farmer participants were asked to identify household assets
(Appendices D, Table 61).

55
Table 22
Distribution of responses income level classes
Income levels
Extension Planning Area (EPA) Total (N = 289)
Mpingu (n = 148) Mitundu (n = 141)
Frequency Percent
(%) Frequency Percent
(%) Frequency Percent
(%)
Low (Less than MK 100,000)
49 33.10 32 22.69 81 28.03
Medium low (MK 100,000-K399,999)
83 56.08 80 56.74 163 56.40
Medium (MK 400,000-K699,999)
13 8.78 19 13.47 32 11.07
Medium high (MK 700,000-K999,999)
0 0.00 3 2.10 3 1.04
High (More than MK 1,000,000)
3 2.02 7 4.96 10 3.46
Note: Income levels included estimates of annual revenue or gross earnings. All the means
were in Malawi Kwacha (MK). Conversion rate was MK 580 = $1.
3.12.6 Summary of Demographic Information
The summary of demographic information assisted to interpret the main conclusions of
this study because there were no available databases to provide this information. It was
concluded that the two hundred and ninety-one (291) farmer participants came from 128 villages
in four Traditional Authorities (TAs) namely Malili, Njewa, Chiseka, and Chadza of Lilongwe
District. The results also confirmed that all 10 Sections from two EPAs were involved in the
research study.

56
It was indeed concluded that the farmers with mobile phones were heterogeneous in all
ranges of ages, gender, marital status, family sizes, education levels, occupations, literacy levels,
farming experiences, farming goals, farming enterprises (crops grown and livestock), and
leadership roles. The notable variations were on main occupations, reading coping mechanisms
for SMS text messages, farming sizes and main crops grown in the two EPAs. On the other hand,
the results implied that the participant farmers from the two EPAs were similar and had the same
generalizable attributes based on agro-ecological zones.
On the other hand, at the individual level the results concluded that farmers’ reported
literacy skills corresponded with a test that was conducted based on SMS text message only. The
findings indicated that about nine tenth (87%) of the participant farmers were literate. This
concluded that the farmers with mobile phones, in general, were literate and those who cannot
read or write SMS text messages have some coping mechanisms to access the information.

57
CHAPTER 4: RESULTS
4.1 Introduction
This chapter presents the findings based on five research questions of the study. The
chapter covers the results on the following sub-topics: (1) farmers’ use of mobile phone
technology and mobile applications; (2) farmers’ awareness and use of existing mobile
agricultural information services (MAIS), and use of additional mobile services; (3) farmers’
motivations to use MAIS; (3) farmers’ agricultural information needs and willingness to pay for
mobile information services; and, (4) farmers’ challenges and opportunities to use MAIS. The
demographic information was covered in Chapter 3 for a summary see section 3.12.6. Below are
results of the study’s five research questions.
4.2 Results of the Study
Research Question 1: What types of mobile phone were farmers using and to what extent do they
use the technology?
4.2.1 Participant Farmers’ Mobile Phone Technology
4.2.1.1 Respondents’ mobile phone technology brands and categories
The participating farmers were asked to indicate the brand of mobile phone being used.
Most farmer participants used Nokia (48%), iTel (33%) and Techno (18%) brands.
Approximately three-fifths (59%) of the farmers in Mitundu had a Nokia phones and in Mpingu,
about a half (47%) had iTel. Table 23 contains a top 10 list of commonly used mobile brands by
the participant farmers. The complete list of mobile phones possessed by participant farmers is
listed in Appendix D, Table 63.

58
Table 23
Brands of mobile phone used by participant farmers
Brands of mobile phones
Extension Planning Area (EPA) Total
(N = 277) Mpingu (n = 139) Mitundu (n = 138)
Frequency Percent
(%) Frequency Percent
(%) Frequency Percent
(%)
Nokia 55 36.91 83 58.87 138 47.75
iTel 70 46.98 25 17.73 95 32.87
Techno 27 18.12 26 18.44 53 18.34
ZTE 20 13.42 17 12.06 37 12.80
Samsung 15 10.07 21 14.89 36 12.47
Donado 0 0.00 8 5.67 8 2.79
Corn 5 3.36 2 1.42 7 2.42
Huwel 4 2.68 2 1.42 6 2.08
KGTEL 2 1.34 3 2.13 5 1.73
Vodaphone 2 1.34 1 0.71 3 1.04
Note: The list of mobile phone brands was based on responses by the participant farmers. The results included basic, mid-range and smart phones categories.
Overall, approximately three-quarters (76%) of the participant farmers used mid-range
phones, some still had basic cell phone (23%) and a very few had smartphones (1%). The two
EPAs had similar results per the types of mobile technology utilized (Table 24). For a list of
mobile applications for all phone types, refer to Appendix D, Table 64.

59
Table 24
Types of mobile phones used by respondents
Mobile phone Types
Extension Planning Area (EPA) Total (N = 289) Mpingu (n = 149) Mitundu (n = 140)
Frequency Percent
(%) Frequency Percent
(%) Frequency Percent
(%)
Mid-range Phone 112 75.16 108 77.14 220 76.12
Basic Phone 36 24.16 30 21.42 66 22.83
Smart phone 1 0.67 2 1.42 3 1.03
4.2.1.2 Participant farmers acquisition of mobile phones technology
The results in Table 25 indicate the majority of participant farmers (92%) purchased their
mobile phones, five percent received them as gifts from relatives and three percent got them as
part of a project.
Table 25
Respondents’ responses on acquisition mobile phones
Acquisition of Mobile phone
Extension Planning Area (EPA) Total (N = 291) Mpingu (n = 149) Mitundu (n = 142)
Frequency Percent
(%) Frequency Percent
(%) Frequency Percent
(%)
Purchased 137 91.95 131 92.25 268 92.10
Gift from relatives 5 3.36 9 6.34 14 4.81
Under a project 7 4.70 2 1.41 9 3.09

60
4.2.1.3 Subscriptions to mobile network services
Farmers were asked to reveal their subscriptions to Mobile Network Service Providers
(MNSPs). Over three-quarters of the participant farmers subscribed only to Airtel Malawi
Limited only (78%), a few only used TNM only (5%) and some had SIM cards for both Airtel
and TNM (17%). Mitundu had the most users with only Airtel SIM cards (85%). One–fifth
(22%) of farmers in Mpingu had SIM cards for both Airtel and TNM (Table 26).
Table 26
Participant farmers’ subscriptions to mobile network service providers
Subscriptions to Mobile Network
Extension Planning Area (EPA) Total (N = 291)
Mpingu (n = 149) Mitundu (n = 142)
Frequency Percent
(%) Frequency Percent
(%) Frequency Percent
(%)
Airtel only 107 71.81 121 85.21 228 78.35
TNM only 8 5.37 6 4.23 14 4.81
MTL 1 0.67 0 0 1 0.34
Both (Airtel + TNM) 33 22.15 15 10.56 48 16.49
Participants were asked to indicate their preferred Mobile Network Service Providers
(MNSP). The results in Table 27 show that 90% of the farmers preferred Airtel because more of
their friends or relatives used the service creating a larger social network. Airtel was also cited
for having fairer airtime costs (Appendix D, Table, 65). The results on preferred MNSP were
similar in both EPAs.

61
Table 27
Respondents’ preferences on mobile network service providers
Preferred Mobile Service Provider
Extension Planning Area (EPA) Total (N = 288) Mpingu (n = 146) Mitundu (n = 142)
Frequency Percent
(%) Frequency Percent
(%) Frequency Percent
(%)
Airtel 131 89.73 129 90.85 260 90.28
TNM 14 9.58 13 9.15 27 9.38
MTL 1 0.68 0 0.00 1 0.35
4.2.1.4 Participant farmers’ use of mobile phone applications
Farmers were asked to indicate on a scale of 1 to 8, how often they use various mobile
applications. Voice calling application was the most commonly used with an overall mean of
7.87 (SD = 0.61) followed in second place by SMS text messages at 5.40 (SD = 2.55). Results
were similar for Mpingu and Mitundu EPAs (Table 28).

62
Table 28
Mean distribution of responses on frequency of using mobile applications
Statistics
Application Extension Planning Area (EPA)
Total Mpingu Mitundu
N Mean SD N Mean SD N Mean SD
Voice 149 7.79 0.67 141 7.87 0.54 290 7.82 0.61
SMS text messages 149 5.13 2.53 141 5.67 2.54 290 5.40 2.55
FM Radio 149 3.67 3.26 137 3.39 3.17 286 3.54 3.21
Multimedia player 149 3.60 3.39 136 3.3 3.22 285 3.46 3.30
PDA 149 3.33 2.93 141 3.49 2.92 290 3.41 2.92
Storage/memory card
149 2.13 2.75 137 3.07 3.16 286 2.58 2.99
Camera 149 1.93 2.41 137 2.35 2.54 286 2.13 2.48
Bluetooth 149 1.99 2.53 137 1.88 2.21 286 1.94 2.38
Multimedia recorder
148 1.90 2.54 136 1.74 2.28 284 1.82 2.42
Internet 149 1.4 1.83 137 1.53 2.00 286 1.47 1.91
MMS 149 1.03 1.26 137 1.37 1.82 286 1.19 1.56
Note: A scale of 1 to 8 was used where 1= none; 2 = once a month; 3= 2 to 3 times a month; 4= once a week; 5= 2 to 3 times a week; 6= Once a day; 7= 2 to 3 times a day; and 8= more than 3 times a day.

63
Research Question 2: Were the farmers aware of mobile agricultural information services and to
what extent do they use them with additional mobile services?
4.2.2 Participant Farmers’ Awareness and Use of Mobile Agricultural Information Services
4.2.2.1 Participant farmers’ awareness of MAIS
The participants were asked if they were aware of available Mobile Agricultural
Information Services (MAIS). Only one in five farmers (20%) was aware of MAIS to some
extent (Table 29). Results were similar in the two Extension Planning Areas.
Table 29
Participant farmers’ responses on awareness of mobile agricultural information services
Awareness about MAIS
Extension Planning Area (EPA) Total (N = 291) Mpingu (n = 149) Mitundu (n = 142)
Frequency Percent
(%) Frequency Percent
(%) Frequency Percent
(%)
Yes 29 19.46 30 21.13 59 20.27
No 120 80.54 112 78.87 232 79.73
The results in Table 30 indicate that, approximately half of the participant farmers aware
of MAIS had knowledge on Integrated Voice Response System (58%) with fewer having
knowledge on SMS text bases systems (33%). The results on Mitundu showed that almost three-
fifth (60%) of respondents who were aware of MAIS knew about IVR. It was observed that
Mpingu had a larger percentage of its participants who knew about SMS format (41%) versus
Mitundu (27%).

64
Table 30
Respondents' awareness on formats on existing MAIS platforms
Available Formats on Existing MAIS
Extension Planning Area (EPA) Total (N = 57) Mpingu (n = 27) Mitundu (n = 30)
Frequency Percent
(%) Frequency Percent
(%) Frequency Percent
(%)
Interactive Voice Response (IVR) 15 55.56 18 60.00 33 57.89
SMS text messaging 11 40.74 8 26.67 19 33.33
Mobile Internet Services 0 0.00 1 3.33 1 1.75
Voice calling 1 3.70 0 0.00 1 1.75
Note: Multiple response results. The frequencies and percentages presented were based on total number of farmer participants (N=57) who responded that they were aware about MAIS.
Farmers who were aware of the mobile agricultural information services knew that Airtel
(67%), Agricultural Commodity Exchange (19%) and the Ministry of Agriculture, Irrigation and
Water Development (19%) were the MAIS providers (Table 31). Some differences in knowledge
of MAIS providers existed between the two EPAs.

65
Table 31
Respondents' multiple response on awareness of MAIS providers
MAIS providers Names of Extension Planning Area
(EPA) Total (N = 57)
Mpingu (n = 29) Mitundu (n = 30)
Frequency Percent
(%) Frequency Percent
(%) Frequency Percent
(%)
Airtel 18 66.67 20 66.67 38 66.67
Malawi‘s Agricultural Commodity Exchange (MACE)
6 22.22 5 16.67 11 19.30
Ministry of Agriculture 8 29.63 3 10.00 11 19.30
Auction Holdings Limited 0 0.00 3 9.70 3 6.00
NASFAM 0 0.00 3 10.00 3 5.26
TAMA 2 7.4 0 0.00 2 3.31
Note: Multiple response results. The frequencies and percentages presented were based on total
number of farmer participants (N=57) who responded that they were aware about MAIS.
More than half of the participants (61%) who were aware of MAIS cited the 3-2-1 IVR
system. Esoko’s SMS text messaging was a distant second at 20 percent. Mitundu had the largest
percentage of farmer participants with knowledge on the 3-2-1 platform (65%) and Mpingu had a
greater percentage of respondents using SMS text messages (31%; Table 32).

66
Table 32
Participant farmers’ multiple responses on awareness of MAIS platforms
MAIS Platforms
Extension Planning Area (EPA) Total
(N = 60) Mpingu (n = 29) Mitundu (n = 31)
Frequency Percent
(%) Frequency Percent
(%) Frequency Percent
(%)
3-2-1 (IVR)1 16 55.17 20 64.51 36 61.00
Esoko (SMS text)2 9 31.3 3 9.68 12 20.00
ACE Mobile Market System 1 3.45 4 12.90 5 8.33
AHL SMS Membership 1 3.45 1 3.23 2 3.33
Voice calling 0 0.00 2 6.45 2 3.33
CADECOM Website3 2 6.90 0 0.00 2 3.33 Note: Multiple response results. The frequencies and percentages presented were based on total
number of farmer participants (N=60) who responded that they were aware about MAIS.
Table 33 shows that the most common ways farmers learned about mobile agricultural
information services were from Extension agents (27%), lead farmers (10%), and mobile phone
promotions messages (10%). There were some differences between the two EPAs. One-third
(33%) of the participant farmers in Mitundu learned from public extension officers, lead farmers
accounted for 17 percent and family an additional 13 percent. The Mpingu farmers were more
likely to have learned about MAIS through their phones (17%; Table 3).
_______ 13-2-1 uses an Integrated Voice Response (IVR) and USSD systems. 2Esoko platform uses push based SMS text messaging systems. 3The mentioned website was accessed using a mobile phone.

67
Table 33
Respondents' multiple responses on sources of knowledge on MAIS
Source of awareness on MAIS
Extension Planning Area (EPA) Total (n = 59) Mpingu (n = 29) Mitundu (n = 30)
Frequency Percent
(%) Frequency Percent
(%) Frequency Percent
(%)
Extension Agents 6 20.69 10 33.33 16 27.12
Lead Farmer 1 3.45 5 16.67 6 10.17
Mobile phone 5 17.24 1 3.33 6 10.17
Family 1 3.45 4 13.33 5 8.47
MAIS Agents 1 3.45 2 6.67 3 5.08
Radio 1 3.45 1 3.33 2 3.39 Note: Multiple response results. The frequencies and percentages presented were based on total
number of farmer participants (N=59) who responded that they were aware about MAIS. 4.2.2.2 Farmer participants’ use of mobile agricultural information services
The results in Table 34 indicate that one-third (34%) of the farmers who had knowledge
of MAIS had access to SMS text messages. Over two- thirds (71.5%) of farmer participants with
knowledge had access to IVR services (72%).

68
Table 34
Farmer participants’ multiple responses on access to MAIS
Format Name of Extension Planning Area (EPA) Total
(N = 59) Mpingu (n = 29) Mitundu (n = 30)
Frequency
Percent (%) Frequency
Percent (%) Frequency
Percent (%)
SMS Text
Yes 12 41.40 8 26.70 20 33.90
No 17 58.60 22 73.30 39 66.10
IVR Yes 19 65.50 23 76.70 42 71.50
No 10 34.35 7 23.30 17 28.80 Note: Multiple response results. The frequencies and percentages presented were based on total
number of farmer participants (N=59) who responded that they were aware about MAIS.
Respondents reported limited use of MAIS services (Table 35). Farmers who were aware
about MAIS indicated using SMS text messaging on average 2.68 times (SD=2.4) and IVR 1.94
(SD=1.90) times in their previous season. Results were similar for both EPAs.
Table 35
Respondents’ multiple responses on the frequency of use for MAIS
Statistics
Frequency of use
of MAIS
Extension Planning Areas (EPAs) Total
(N=59) Mpingu (n=29) Mitundu (n=30)
N Mean SD N Mean SD N Mean SD
SMS text messages 12 3.25 2.78 8 2.11 2.02 16 2.68 2.40
IVR 16 2.31 2.24 19 1.63 1.57 35 1.94 1.90
Note: Multiple response results. The frequencies and percentages presented were based on total number of farmer participants (N=59) who responded that they were aware about MAIS.

69
4.2.2.3 Type of information accessed through mobile agricultural information services
The farmer participants who were aware about MAIS were asked about the types of
agricultural information accessed through SMS text messages. The most common topics were
reminders related to farm management activities (21%), crop varieties (18%) and market prices
for crops (12%; Table 36)
Table 36
Farmer participants’ multiple responses on information accessed SMS messages
SMS Text Messages
Extension Planning Area (EPA) Total (N = 57) Mpingu (n = 27) Mitundu (n = 30)
Frequency Percent
(%) Frequency Percent
(%) Frequency Percent
(%)
Reminders on farm management activities 8 29.63 4 13.33 12 21.05
Crop varieties 5 18.52 5 16.67 10 17.54
Market prices 4 14.81 3 10.00 7 12.28
Fertilizer application rates 3 11.11 3 10.00 6 10.52
Soil fertility management 4 14.81 2 6.67 6 10.52
Pest management 4 14.81 1 3.33 5 8.77
Weather updates 3 11.11 2 6.67 5 8.77
Crop field management 3 11.11 1 3.33 4 7.02
Irrigation practices 0 0.00 1 3.33 1 1.75
Pasture management 1 3.70 0 0.00 1 1.75
Alerts on livestock distribution
0 0.00 1 3.33 1 1.75
Note: Multiple response results. The frequencies and percentages presented were based on total number of farmer participants (N=57) who responded that they were aware about MAIS.

70
In terms of accessed information on IVR (3-2-1 platform), the majority got messages on
crop varieties (40%) and crop field management (33%). A higher percentage of participant
farmers from Mpingu EPA accessed both crop variety (44%) and crop field management (44%)
information as shown in Table 37.
Table 37:
Respondents’ multiple responses on topics accessed through Integrated Voice Response (IVR)
IVR Messages
Extension Planning Area (EPA) Total (N = 57) Mpingu (n = 27) Mitundu (n = 30)
Frequency Percent
(%) Frequency Percent
(%) Frequency Percent
(%)
Crop varieties 12 44.44 11 36.67 23 40.35
Crop field management
12 44.44 7 23.33 19 33.33
Soil fertility management
3 11.11 3 10.00 6 10.52
Reminders on farm management activities
4 14.81 1 3.33 5 8.78
Fertilizer application rates
3 11.11 2 6.67 5 8.78
Field pest management
1 3.70 0 0.00 1 1.75
Market prices 0 0.00 1 3.33 1 1.75
Irrigation practices 0 0.00 1 3.33 1 1.75
Note: Multiple response results. The frequencies and percentages presented were based on total
number of farmer participants (N=57) who responded that they were aware about MAIS.

71
4.2.2.4 Cost of information accessed through mobile agricultural information services
Table 38 shows that farmers in Malawi were not willing to pay a fee to access
agricultural information using SMS and IVR messaging. When asked if they paid for the
information only a few of the respondents admitted to paying for both SMS text messages (4%)
and IVR messages (5%). In Mpingu, three farmer participants (11%) indicated they had paid for
IVR services. This indicates that most SMS text messages were accessed for free (Table 38).
Table 38
Participant farmers’ responses on payments made on MAIS
MAIS Payments made
Extension Planning Area (EPA) Total (N = 57) Mpingu (n = 27) Mitundu (n = 30)
Frequency Percent
(%) Frequency Percent
(%) Frequency Percent
(%)
SMS text messages
Yes 1 3.70 1 3.33 2 3.51
No 26 96.30 29 96.67 55 96.49
IVR messages
Yes 3 11.11 0 0.00 3 5.26
No 24 88.89 30 100.00 54 94.74 Note: The frequencies and percentages presented were based on total number of farmer
participants (N=57) who responded that they were aware about MAIS.
The overall results in Table 39 indicate that only about a quarter of the farmer
participants expressed satisfaction with both IVR messages (24%) and SMS text (21%). The
satisfaction level of IVR messaging was similar in the two EPAs. Approximately one-third
(29%) of the respondents from Mpingu were satisfied with SMS text messages.

72
Table 39
Respondents’ satisfaction level with accessed MAIS
Variable
Extension Planning Area (EPA) Total (N = 57) Mpingu (n = 27) Mitundu (n = 30)
Frequency
Percent (%) Frequency
Percent (%) Frequency
Percent (%)
SMS text messages
Yes 8 29.60 4 13.30 12 21.10
No 19 70.40 26 86.70 45 79.00
IVR messages Yes 7 25.90 8 26.70 14 24.60
No 20 74.10 22 73.30 21 75.40 Note: The frequencies and percentages presented were based on total number of farmer
participants (N=57) who responded that they were aware about MAIS.
4.2.2.5 Farmer participants awareness of additional mobile services
All farmer participants were asked about their awareness of additional mobile
information services related to rural development. Approximately nine-tenths (86%) of the
respondents indicated that they were aware (Table 40). Interestingly, when asked about their
awareness of mobile agricultural information services in Table 29 only 13 percent of the farmers
indicated awareness, compared to the 85% who indicate an awareness of additional mobile
services. The difference may be due to farmers’ perceptions and use of constituted services.
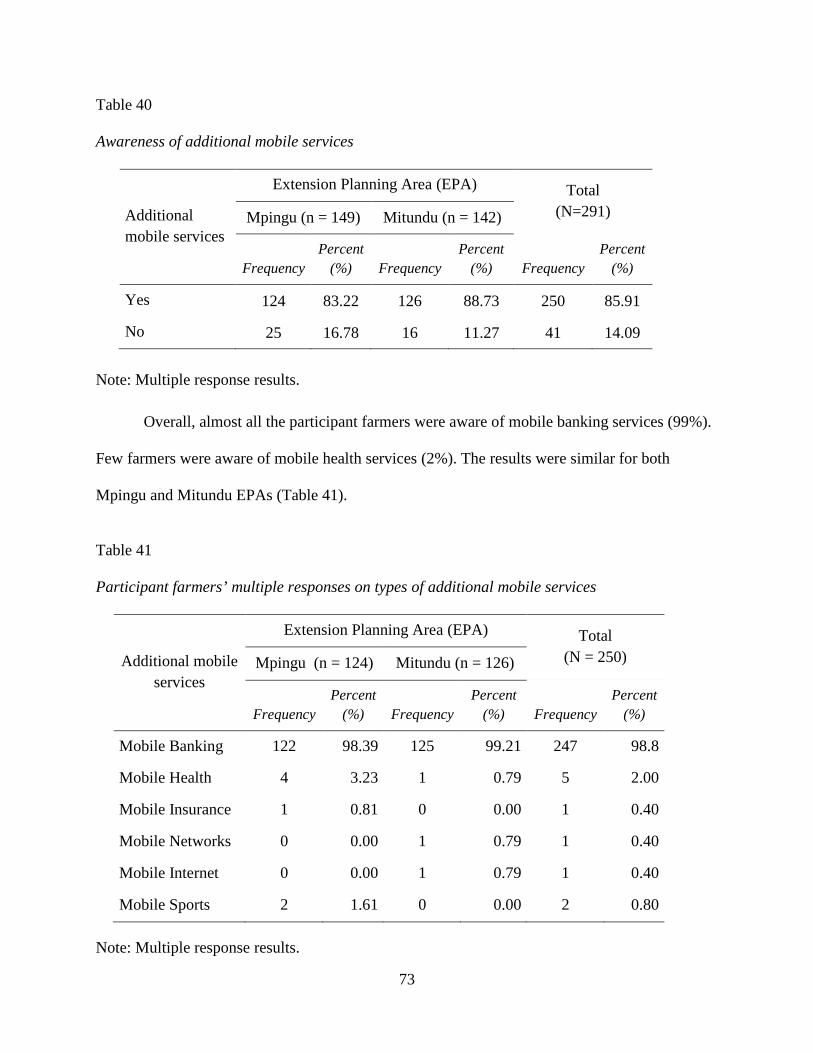
73
Table 40
Awareness of additional mobile services
Additional mobile services
Extension Planning Area (EPA) Total (N=291) Mpingu (n = 149) Mitundu (n = 142)
Frequency Percent
(%) Frequency Percent
(%) Frequency Percent
(%)
Yes 124 83.22 126 88.73 250 85.91
No 25 16.78 16 11.27 41 14.09 Note: Multiple response results.
Overall, almost all the participant farmers were aware of mobile banking services (99%).
Few farmers were aware of mobile health services (2%). The results were similar for both
Mpingu and Mitundu EPAs (Table 41).
Table 41
Participant farmers’ multiple responses on types of additional mobile services
Additional mobile services
Extension Planning Area (EPA) Total (N = 250) Mpingu (n = 124) Mitundu (n = 126)
Frequency Percent
(%) Frequency Percent
(%) Frequency Percent
(%)
Mobile Banking 122 98.39 125 99.21 247 98.8
Mobile Health 4 3.23 1 0.79 5 2.00
Mobile Insurance 1 0.81 0 0.00 1 0.40
Mobile Networks 0 0.00 1 0.79 1 0.40
Mobile Internet 0 0.00 1 0.79 1 0.40
Mobile Sports 2 1.61 0 0.00 2 0.80 Note: Multiple response results.

74
Seventy (70) percent of the participant farmers became aware of additional mobile
information services through the radio. Just over a quarter (26%) learned about additional
services through mobile services agents (Table 42). Based on the household assets reported in
Appendix D, Table 62, i three-quarters of the respondents who were aware were radio owners.
Table 42:
Farmer participants’ multiple responses on sources of knowledge on additional mobile services
Sources of knowledge
Extension Planning Area (EPA) Total (N = 247) Mpingu (n = 124) Mitundu (n = 123)
Frequency Percent
(%) Frequency Percent
(%) Frequency Percent
(%)
Radio 91 73.39 83 67.48 174 70.44
MS Agent 27 21.77 37 30.08 64 25.91
Friends 17 13.71 6 4.88 23 9.31
Mobile phone 9 7.26 5 4.07 14 5.67
Family 7 5.65 3 2.44 10 4.05
Newspapers 9 7.26 1 0.81 10 4.05
Extension Agents
3 2.42 4 3.25 7 2.83
TV 1 0.81 1 0.81 2 0.81
Note: Multiple response results
Farmer participants were asked to indicate which additional mobile services they used.
The results in Table 43 indicate that, while most respondents were aware of additional mobile
information services, few were using them. Mobile banking was being used by 16 percent and
mobile health by just 2 percent.

75
Table 43
Respondents' multiple responses on use of additional mobile services
Use of additional mobile services
Extension Planning Area (EPA) Total (N = 247) Mpingu (n = 124) Mitundu (n = 123)
Frequency Percent
(%) Frequency Percent
(%) Frequency Percent
(%)
Mobile banking 25 20.16 17 13.82 39 15.79
Mobile health 3 2.42 1 0.81 4 1.62
Mobile network membership 0 0.00 2 1.63 2 0.81
Note: Multiple response results. 4.2.2.6 Access to Additional Sources of Agricultural Information
Apart from mobile agricultural information services, the participant farmers indicated
that they had additional sources by which agricultural information could be obtained. The other
trusted sources of information included: public extension agents (53%); radio (34%); and, lead
farmers (13%). Mitundu farmers were more likely to get their information from public extension
agents (67%) and radio (41%). In comparison, Mpingu had almost double the percentage of
respondents who obtained information from lead farmers (14%) as indicated in Table 44.

76
Table 44:
Farmer participants’ multiple responses on additional sources of agricultural information
Additional sources of agricultural information
Extension Planning Area (EPA) Total (N = 291) Mpingu (n = 149) Mitundu (n = 142)
Frequency Percent
(%) Frequency Percent
(%) Frequency Percent
(%)
Public Extension Agents 59 39.60 95 66.90 154 52.92
Radio 42 28.19 58 40.85 100 34.36
Lead farmers 22 14.77 16 11.27 38 13.09
Non-Governmental Organizations 10 6.71 9 6.34 19 6.53
Family 8 5.37 4 2.87 12 4.12
Agro-dealers 2 1.34 4 2.82 6 2.06
Friends 4 2.68 1 0.70 5 1.72
Agro-Processing Companies 1 0.67 1 0.70 2 0.69
Researchers 2 1.34 0 0.00 2 0.69
Farmer clubs 2 1.34 0 0.00 2 0.69
Note: Multiple response results.
Concerning communication channels used to obtain additional agricultural information,
nearly all the respondents cited face-to-face (67%), followed by radio (54%) and mobile phones
(9%). Even in today’s technically advanced world, farmers still value face-to-face and radio as a
means to obtain agricultural information (Table 45).

77
Table 45:
Respondents' multiple responses on communication channels used for accessing additional
sources of agricultural information services
Communication channels use for additional sources
Extension Planning Area (EPA) Total (N = 291) Mpingu (n = 149) Mitundu (n = 142)
Frequency Percent
(%) Frequency Percent
(%) Frequency Percent
(%)
Face-to-face 87 58.39 108 76.06 195 67.01
Radio 67 44.97 91 64.08 158 54.30
Mobile Phone 4 2.68 22 15.49 26 8.93
Newspapers 3 2.01 3 2.11 6 2.06
TV 1 0.67 0 0.00 1 0.34
Internet 1 0.67 0 0.00 1 0.34
Note: Multiple response results. 4.2.3 Farmers Opinions on Mobile Agricultural Information Services
Upon completion of qualitative analysis on research question two it was asserted ‘Most
farmer participants need appropriate knowledge, and skills to use a mobile phone for
agricultural information services.’ The assertion was supported by two axial categories derived
from the farmers’ responses. The supporting categories include: 1) Enhance farmers’ capacities
on digital and literacy skills; and 2) create awareness about existing mobile agricultural
information services and providers. The supporting codes and quotations contained herein
represent the big data set.
Enhance farmers’ capacities on basic skills (literacy and digital). Several farmer
participants attributing to low use of MAIS due to lack of that basic (literacy and digital) skills

78
[92 word counts], suggesting the needed to increase their literacy skills for effectively use MAIS.
The respondents recognized that use certain media formats such as SMS text messages and
USSDs needs minimum reading and writing literacy level was needed (both numbers and word).
This challenge applied to only those farmers who lacked basic capacities. A male farmer from
Mpingu [MF1-1] said, “I fail to read SMS text messages and PDAs (notes, reminders and
calendars), because I did not attend formal school, and that is my biggest problem.” This
indicated that some participant farmers are unable to use important mobile applications thus
hampering their access to mobile agricultural information services.
Some respondents [4 word counts] wanted to know how farmers with mobile phones who
have limited basic skills could be assisted in accessing mobile agricultural information services.
A male farmer from Mitundu [MF1-2] asked, “What are you [researchers] going to do with the
farmers who have low literacy levels, willing to access mobile agricultural information
services?” The key informants [8 word counts] validated that there was a need to provide basic
skills to farmers with mobile technology so they may successfully utilize mobile agricultural
information services.
Create awareness about existing available mobile agricultural information services and
providers. The participant farmers [308 word counts] reported there was lack of awareness of
available mobile agricultural information services. This unawareness by farmers was preventing
them from utilizing the available mobile agricultural information services.
[MF2-1] said, “I have never heard of farmers getting agricultural information
services through mobile phones. This is my first time and I am getting it from you. I
remember one lead farmer came once telling us that she received a call from our

79
extension officer to mobilize famers who can manage a demonstration plot mounted in
our village. Is this a service you are talking about?”
The participant farmers who were aware of MAIS expressed that they lacked knowledge
on how to effectively use the available mobile agricultural information service platforms [47
word counts]. This was mainly referred to as 3-2-1 and Esoko platforms. [MF2-2] said, “When I
dialed 3-2-1 it was taking so long so I dropped-off the call fearing they will charge me dearly for
listening to one message for a long time.” However, many farmers do not known that the service
are free the first eight times each month accessed but charged from the ninth call onwards. This
potentially explains the low frequency of using MAIS (Table 34) as farmers who were aware of
the service lacked knowledge on use of it.
Participant farmers indicated they were not aware of the MAIS providers and who
provides the information for uploading to the services’ sources [27 word counts]. Not being
aware of the source(s) of the uploaded information makes it difficult for the farmers to forward
their questions related to the topic. It was suggested that the missing information must be made
available for validity check and dependability of the information uploaded on the platforms. A
lead farmer from Mpingu [LF1-1] said, “I am not sure whether the information uploaded on
Esoko platform is appropriate and it is hard to guess who sends the messages since we (farmers)
submitted our mobile phone numbers to extension officers.”
Research Question 3: What were the farmer participants’ motivation and optimism to use mobile
agricultural information services?
4.2.3 Farmer Participants’ Motivation to Use Mobile Agricultural Information Services
4.2.3.1 Farmers’ motivation on use of Mobile Agricultural Information Services

80
Results show that the participant farmers were highly motivated to use mobile
agricultural information services with an overall mean of 4.3 (SD=1.09) based on a scale of 1 to
5. Across the two EPAs, Mpingu had a mean of 4.36 (SD = 0.98) while Mitundu had a mean of
4.23 (SD = 1.91). More information is provided in Appendix D, Table 67. The reliability test
results indicated a maximum likelihood of 0.82 using Cronbach Alpha factor analysis. This was
supported by both utility values and cost-to-benefit ratio. There was a small effect size with a
delta value of 0.32 for the researcher to explain to other practitioners the difference between the
two Extension Planning Areas. This implied that they were the same.
Farmer participants were asked to agree or disagree with 15 statements related to utility
values and cost-benefit factors (Table 46). Overall results indicated that approximately 81% of
the respondents agreed with 14 of the reasons for using agricultural information services with the
exception being “Information sharing” (36%). Mitundu EPA had the least proportion citing
“information sharing” (21%). Since the mobile phone is an individualized communication tool,
‘conflict of interests’ issues may explained the low support to share such information to other
farmers in their community.

81
Table 46
Participant farmers’ multiple responses on reasons to use MAIS
Motivation items
Extension Planning Area (EPA) Total (N = 291) Mpingu (n = 149) Mitundu (n = 142)
Frequency Percent (%)
Frequency Percent (%)
Frequency Percent (%)
Relevance 140 93.96 123 86.62 263 90.38
Less costly 138 92.62 119 83.80 257 88.32
Livelihood 131 87.92 114 80.28 245 84.19
Fastness of communication 128 85.91 117 82.39 245 84.19
Profitability 123 82.55 118 83.10 241 82.82
Marketing 124 83.22 115 80.99 239 82.13
Decision making 121 81.21 111 78.17 235 80.76
Frequency of messaging 124 83.22 107 75.35 231 79.38
Appropriateness 124 83.22 105 73.94 229 78.69
Timeliness 120 80.54 106 74.65 226 77.66
Validity of information 117 78.52 108 76.06 225 77.32
Two-way interactivity 122 81.88 99 69.72 221 75.95
Information complexity 104 69.80 105 73.94 209 71.82
Reliability 107 71.81 96 67.61 203 69.76
Information sharing 74 49.66 29 20.42 103 35.40
Note: Multiple response results.
4.2.3.2 Farmers’ interest on use of Mobile Agricultural Information Service
The farmer participants were asked if they were interested in accessing mobile
agricultural information services. Nearly all the respondents expressed an interest in accessing

82
MAIS (98%). Similar results were noticed between the two EPAs (Table 47). Various reasons
for using MAIS are included in qualitative results on Assertion 5 on page 100.
Table 47
Participant farmers’ expression of interest in MAIS
Expression of interest in MAIS
Extension Planning Area (EPA) Total
(N = 269) Mpingu (n = 137) Mitundu (n = 132)
Frequency Percent
(%) Frequency Percent
(%) Frequency Percent
(%)
Yes 135 98.54 129 97.73 264 98.14
No 2 1.46 3 2.27 5 1.86
4.2.3.3 Farmers opinions on motivations to use MAIS
Qualitatively it was asserted that Most farmers with a mobile phone were optimistic about
the use of mobile agricultural information services for rural and extension development. This
was supported by two main categories: 1) Respondents’ interest in mobile agricultural
information services; and 2) participant farmers’ value of the importance of mobile agricultural
information services for rural development. These two categories were supported by two codes
for each as follows:
Farmers were interested in available mobile agricultural information services. Participant
farmers expressed their interest [35 word counts] in having access to available MAIS throughout
the interviews. They suggested that MAIS programs were ideal for not only farmers with a
mobile phone but to the farming communities at large. A village headman from Mitundu [VH1-
2] said, “I have learnt a lot from this interview and I will try from now onwards to use mobile

83
agricultural information services since they are so fast.” Some respondents [8 word counts]
expressed that MAIS were an innovative way of improving the extension services.
Some farmers [15 word counts] wanted to know when access to MAIS would be
available. This was an indication that they were eager to have mobile agricultural information
services as soon as possible. [MF2-2] asked, “When are we going to start receiving mobile
agricultural information services?” This result was in-line with the qualitative results that the
participant farmers were highly motivated for mobile agricultural information services for their
agricultural growth and development.
Farmers valued Mobile Agricultural Information Services for rural development. Most
participant farmers valued the importance of MAIS due to the challenges and limitations of the
traditional educational methodologies used by the agricultural extension system. They raised
concerns about a decline in the number of one-on-one farmer visits and the limited number of
extension officers available to respond to the needs of the farmers [25 word counts]. [MF3-1]
said, “I am eager to access mobile agricultural information services because extension officers
have a big area to cover and do not respond to individual farmers’ needs.” The farmers felt that
mobile agricultural information services would complement the current efforts to improve on
extension and rural development.
Some participant farmers replied that mobile agricultural information services are an
easy, fast and convenient way to disseminate agricultural information in the rural areas [14
words counts]. These intrinsic values supported the quantitative results that farmers were
motivated to use mobile agricultural information services. A female farmer from Mpingu [FF1-
1] said, “I hope that mobile agricultural information services will motivate them [farmers] to
improve their farming enterprises quickly.”

84
Research Question 4: What were the farmers’ preferred agricultural information (topics,
channels and sources) and willingness to pay for mobile agricultural information services?
4.2.4 Mobile Phone Technology Used by Participant Farmers
4.2.4.1 Respondents’ preferred agricultural information services
The farmers were asked to provide their preferred topics for agricultural information
services. The responses presented in Table 48 indicate that farmers desired information on soil
fertility management (28%), market prices (16%) and crop varieties (10%). The top issues for
Mitundu farmers were preferred soil fertility management (27%) and crop produce market prices
(27%). Mpingu farmers also cited soil fertility management (29%) as an area of need. The
second area of information need was crop varieties (13%).

85
Table 48:
Respondents’ multiple responses on preferred topics for crop productions on MAIS
Topics on demand for crop production
Extension Planning Area (EPA) Total (N=252) Mpingu (n=128) Mitundu (n=124)
Frequency Percent
(%) Frequency Percent
(%) Frequency Percent
(%)
Soil fertility management
37 28.91 33 26.61 70 27.78
Market price of produce 7 5.47 33 26.61 40 15.87
Crop varieties 16 12.5 10 8.06 26 10.32
Crop field management 13 10.16 9 7.26 22 8.73
Pest and disease management
8 6.25 11 8.87 19 7.54
Irrigation practices 12 9.38 6 4.84 18 7.14
Weather updates 9 7.03 2 1.61 11 4.37
Input prices 4 3.13 7 5.65 11 4.37
Fertilizer application 7 5.47 2 1.61 9 3.57
Climate change 4 3.13 3 2.42 7 2.78
Types of fertilizer 2 1.56 2 1.61 4 1.59
Types of chemicals 3 2.34 1 0.81 4 1.59
Processing & utilization 0 0.00 3 2.41 3 1.19
Tobacco nursery management
0 0.00 1 0.81 1 0.40
Agri-business 0 0.00 1 0.81 1 0.40
Other topics 6 4.69 0 0.00 6 2.48
Note: Multiple response results. Other topics includes specific technologies and technics used by farmers.

86
In terms of topics on livestock production, two-fifths (40%) of the farmer participants
expressed the need for parasite and disease management information. The same results were
obtained for farm management, and feeds and feeding, with each at six percent. No observable
difference was noted between the two EPAs with the top three preferred topics in each region
being parasite and disease management, farm management, and feeds and feeding (Table 49).
Table 49:
Respondents’ multiple responses on preferred livestock production topics for MAIS
Livestock production
Extension Planning Area (EPA) Total (N=252) Mpingu (n=128) Mitundu (n=124)
Frequency Percent (%)
Frequency Percent (%)
Frequency Percent (%)
Parasites and disease management 50 39.06 50 40.32 100 39.68
Farm management 7 5.47 7 5.65 14 5.56
Feeds and feeding 6 4.69 8 6.45 14 5.56
Housing and construction 4 3.13 3 2.42 7 2.78
Improved Breeds of Livestock 5 3.91 0 0.00 5 1.98
Breeding information 4 3.12 2 1.61 6 2.38
Livestock insurance 0 0.00 3 2.42 3 1.19
Marketing of livestock 0 0.00 1 0.81 1 0.39 Note: Multiple response results
4.2.4.2 Respondents preferred communication channels for agricultural information
The farmer participants indicated that their preferred information and communication
channels were mobile phone (99%), face-to-face (94%) and radio (80%). Mitundu had the

87
highest percentage of responses on mobile phone (100%), face-to-face (95%) and radio (86%) as
compared to Mpingu. Mpingu had a higher percentage of farmers who relied on print media
(16%) as a means of receiving information (Table 50).
Table 50
Respondents’ multiple responses on preferred communication channels to deliver agricultural
information
Preferred ICT Channel
Extension Planning Area (EPA) Total (N=284) Mpingu (n=144) Mitundu (n=140)
Frequency Percent
(%) Frequency Percent
(%) Frequency Percent
(%)
Mobile phone 141 97.92 140 100 281 98.94
Face-to-face 133 92.36 133 95 266 93.66
Radio 106 73.61 121 86.43 227 79.93
Print media 16 11.11 11 7.86 27 9.51
TV 3 2.08 4 2.86 7 2.46
Internet 0 0 3 2.14 3 1.06
CDs and DVDs 0 0 1 0.71 1 0.35
Note: Multiple response results.
4.2.4.3 Respondents preferred agricultural information sources
Respondents were asked to identify their preferred sources of agricultural information.
Overall, nearly all farmers preferred public extension agents (99%), some suggested lead farmers
(35%) and others identified broadcasters (17%). Results were similar between the two EPAs

88
except Mitundu farmers were more receptive to broadcasters (22%) where as Mpingu farmers
were slightly more favorable to NGOs (18; Table 51).
Table 51:
Participant farmers’ multiple responses on preferred sources of information on MAIS
Preferred information sources
Extension Planning Area (EPA) Total
(N=282)
Mpingu (n=143) Mitundu (n=139)
Frequency Percent
(%) Frequency Percent
(%) Frequency Percent
(%)
Public extension agents
141 98.60 137 98.56 278 98.58
Lead farmers 49 34.27 49 35.25 98 34.75
Broadcasters 17 11.89 30 21.58 47 16.67
Non-Governmental Organizations (NGOs)
26 18.18 20 14.39 46 16.31
Marketing agents 17 11.89 17 12.23 34 12.06
Researchers 11 7.69 9 6.47 20 7.09
Processing companies
7 4.89 10 7.19 17 6.03
Note: Multiple response results 4.2.4.4 Respondents preferred mobile media formats for agricultural information
In terms of formats for mobile agricultural information services, farmer participants
mainly preferred voice calls (95%) and SMS text messages (88%). A few farmers expressed the
need for short video clips (10%) and IVR (6%). Farmers did express that the format utilized
should be based on the complexity of the message (Table 52).

89
Table 52:
Farmer participants’ multiple responses on preferred mobile communication formats
Preferred mobile phone communication Channels
Extension Planning Area (EPA) Total
(N=281) Mpingu (n=141) Mitundu (n=140)
Frequency Percent
(%) Frequency Percent
(%) Frequency Percent
(%)
Voice calls 139 98.58 128 91.43 267 95.02
SMS text messages
123 87.23 123 87.86 246 87.54
Videos 13 9.22 16 11.43 29 10.32
IVR 13 9.22 4 2.86 17 6.05
Photos 1 0.71 2 1.43 3 1.07
Audio files 0 0.00 1 0.71 1 0.36
Mobile internet 0 0.00 1 0.71 1 0.36
Note: Multiple response results
4.2.9.5 Respondents willingness to pay for MAIS
When asked if they were willing to pay for mobile agricultural information, two-fifths
(40%) of the respondents responded positively. It was interesting to note that over half (53%) of
the farmer participants in Mitundu EPA indicated they were willing to pay for MAIS whereas
only a quarter (28%) of the Mpingu farmers said they would pay (Table 53).

90
Table 53
Participant farmers’ willingness to pay for mobile agricultural information services
Willingness to Pay for MAIS
Extension Planning Area (EPA) Total
(N=288) Mpingu (n=147) Mitundu (n=141)
Frequency Percent
(%) Frequency Percent
(%) Frequency Percent
(%)
Yes 41 27.89 74 52.48 115 39.93
No 106 72.11 67 47.52 173 60.07
Farmer participants who were willing to pay expressed willingness to pay for SMS text
messages (97%), voice calls (80%) and video clips (26%). No difference in the type of services
for which the farmers indicated they were willing to pay was observed between the two EPAs
(Table 54).
Table 54
Respondents’ multiple responses on payments for mobile format for MAIS
Mobile Channels
Extension Planning Area (EPA) Total (N=115) Mpingu (n=41) Mitundu (n=74)
Frequency
Percent (%) Frequency
Percent (%) Frequency
Percent (%)
SMS text 41 100.00 70 94.59 111 96.52
Voice call 40 97.56 52 70.27 92 80.00
Videos 21 51.22 9 12.16 30 26.09
MMS 0 0.00 3 4.05 3 2.61
Mobile internet 0 0.00 1 1.35 1 0.87
Note: Multiple response results. MMS=Multimedia Messaging Services

91
The farmer participants willfully suggested suitable fees for each of the mobile
agricultural information services. The overall mean fee for voice calls was MK63.10 (SD =
37.60), videos a mean fee of MK60.33 (SD = 29.10), audios a mean fee of MK36.67 (SD =
21.90) and SMS text messages a mean fee of MK15.95 (SD = 11.30). The farmer participants
from Mpingu indicated a willingness to pay higher fees for videos (MK66.19), audios
(MK39.38), and SMS text messages (MK18.71) as compared to Mitundu farmers (Table 55).
Table 55
Participant farmers’ fees for various mobile agricultural information services
Statistics
Mobile Communication formats
Extension Planning Areas (EPAs)
Total Mpingu Mitundu
n Mean (MK) SD n
Mean (MK) SD N
Mean (MK) SD
Voice calls 39 66.15 40.20 53 60.85 35.80 92 63.10 37.60
Videos 21 66.19 29.60 9 46.67 23.98 30 60.33 29.10
Audios 8 39.38 21.80 1 15.00 0.00 9 36.67 21.90
MMS 0 0.00 0.00 2 35.00 21.20 2 35.00 21.20
Podcast 1 20.00 0.00 3 23.33 5.80 4 22.50 5.00
SMS text 41 18.71 16.70 70 14.34 5.90 111 15.95 11.30
Mobile Internet Service 0 0.00 0.00 1 50.00 0.00 1 50.00 0.00
Note: Multiple response results. The means (M) and standard deviations (SD) are in Malawi Kwacha (MK). Conversion rate was $1 = MK580.

92
4.2.9.6 Respondents opinions on preferred agricultural information and willingness to pay
The fourth research question was designed to capture farmers’ preferred agricultural
information (topics, channels and sources) and their willingness to pay for MAIS. One assertion
supported the quantitative results that Farmer participants wanted mobile agricultural
information delivery systems that are accessible, current, relevant, timely, and dependable. This
was supported by four categories of respondents’ demands: 1) provide MAIS to all farmers with
mobile phones; 2) provide timely information and dependable services; 3) provide current,
specific and dependable information services; and, 4) provide user-friendly media formats.
Provide MAIS to all farmers with mobile phones. A majority of respondents [150 word
counts] expressed that all farmers with mobile phones should have access to mobile agricultural
information services. For those farmers who cannot afford to pay, the respondents felt a plan
needed to be developed to provide some level of access. The respondents acknowledged the need
for free access to general information services for those who cannot afford to pay for such
services. [MF4-1] said, “I free to see that most farmers in rural areas could not afford to pay for
MAIS, so just maintain the current status where almost everyone access them for free.”
Provide timely information and dependable services. The participant farmers indicated
that useful information must be delivered in a timely and dependable manner [20 word counts].
Farmers expressed concern about the lack of timely and actionable information on the current
MAIS. They suggested that information should be correlated between the specific enterprises
and the seasonal calendar. A young farmer [MF3-2] said, “I called several times for one mobile
agricultural information service, I was surprised to get a message on how to plant maize towards
the end of a rainy season.”

93
Though few respondents [5 word counts] voiced support for sustainable MAIS, it was
reported that one donor-funded project was phased out without appropriate backup informational
mechanisms in place. The farmers suggested that for all MAIS platforms to be successful they
should involve the users as equal partners from project conceptualization to implementation. A
female farmer [FF1-2] said, “I was getting some weekly SMS text messages from an
organization I registered with but suddenly it stopped without any notice.” A key informant
confirmed to have overheard that the project phased out after three years.
Provide current, specific and relevant information services. The participant farmers
indicated that up-to-date information is needed for both crops and livestock production [15 word
counts]. This will enable them to make appropriate decisions on their farming enterprise. It was
also suggested that the information should be current, relevant and actionable and tailored to the
farmers’ specific needs. A male lead farmer [MLF1-1] said, “We look for new information to
learn how to do things differently and improve on our farming enterprises.”
Provide farmer-friendly media formats. Participant farmers indicated they need MAIS
information available in a variety of media formats [11 word counts]. The preferred media
formats were SMS text messages to those with literacy skills [6 word counts] and voice calls or
Integrated Voice Response (IVR) for farmers with limited literacy skills who used MAIS
platforms [3 word counts]. A couple of farmers noted that video and audio files could be shared
via Bluetooth or social media matching digital skills of the farmers [2 word counts]. Respondents
suggested that the same message be developed into several media formats to provide farmers
with choices based on their literacy and digital skills. [MF4-2] said, “I would be glad to receive
SMS text messages and if there would be a possibility to access some illustrations through the
videos on best farming practices from farmers elsewhere.”

94
Research Question 5: What are the key challenges, suggestions for improvement and
opportunities for farmers to access mobile agricultural information services?
4.2.5 Farmer Participants’ Key Challenges and Opportunities for MAIS
4.2.5.1 Respondents’ responses on challenges for MAIS
Farmer participants were asked if they faced challenges concerning mobile technology
and mobile agricultural information services. The overall results in Table 56 indicate that 60% of
the participants had challenges. Over two-thirds (70%) of the respondents from Mitundu EPA
indicated they experienced challenges as compared to Mpingu where less than half (49%)
reported experiencing challenges.

95
Table 56
Farmer participants’ challenges on mobile technology and MAIS
Responses on challenges
Extension Planning Area (EPA) Total (N=289) Mpingu (n=147) Mitundu (n=142)
Frequency Percent
(%) Frequency Percent
(%) Frequency Percent
(%)
Yes 72 48.97 100 70.42 172 59.69
No 75 51.02 42 29.58 117 40.31
4.2.5.2 Respondents’ list of main challenges for MAIS
Most farmer participants indicated that their major challenges to accessing mobile
agricultural information services were lack of awareness (45%), followed by a poor quality
network (17%), limited electricity (11%), and lack of money (7%). Just over half (52%) of the
respondents from Mpingu indicated that their main problem was lack of awareness. In Mitundu,
poor network (25%) and lack of electricity (13%) were two noted problems (Table 57).

96
Table 57
Respondents’ main challenges for mobile agricultural information services
Main Challenges on MAIS
Extension Planning Area (EPA) Total (N=258) Mpingu (n=124) Mitundu (n=134)
Frequency Percent
(%) Frequency Percent
(%) Frequency Percent
(%)
Lack of awareness 64 51.61 51 38.06 115 44.57
Poor network 11 8.87 34 25.37 45 17.44
Electricity 11 8.87 18 13.43 29 11.24
Lack of money 13 10.48 7 5.22 20 7.75
High airtime cost 7 5.65 5 3.73 12 4.65
Costing of voice and SMS text messages 4 3.22 4 2.98 8 3.10
Lack of digital skills 4 3.22 4 2.98 8 3.10
Illiteracy 3 2.42 2 1.49 5 1.94
Lack of technological skills 3 2.42 1 0.75 4 1.55
Misconducts at battery charging points 1 0.81 3 2.24 4 1.55
Use of foreign languages 1 0.81 2 1.49 3 1.16
Outdated messages 0 0.00 2 1.49 2 0.78
Stopped sending 1 0.81 0 0.00 1 0.39 Note: Multiple response results 4.2.5.3 Farmer participants’ opinions on challenge and opportunities for MAIS
The fifth research question has two assertions that supported the challenges and
opportunities from the perspectives of the participant farmers. Firstly, the participant farmers
reported limited infrastructural capacity and marginal benefit to costs of mobile agricultural

97
information services and secondly the respondents suggested integrating MAIS into existing
extension programs with more interactive approaches. The two assertions were supported by
three themes and quotations to validate the farmers’ claims.
In the first set, the respondents were asked about the perceived challenges of MAIS in
rural areas. It was asserted that ‘Participant farmers reported limited infrastructural capacity
and marginal benefit-to-costs of mobile agricultural information services.’ This was supported
by three categories: 1) limited capacity of electricity; 2) limited capacity of mobile network; and,
3) marginal benefit-to-cost ratio. This was supported by quotations on each of the categories.
Limited capacity of electricity. Farmers reported that a significant issue hampering MAIS
in remote areas is the lack of electricity [64 word counts]. Farmers recharge, for a fee, their
phone at a trading center or a homestead close to their home that has electricity. In cases where
they do not have enough money to recharge their phone, their instantaneous access to MAIS is
severely limited. As a result, many farmers have extra batteries or a second mobile handset to
alternate charging. Limited access to electricity has also prompted farmers to use mid-range
phones with longer battery life.
[FF2-1] said, “We do not have electricity in our homes so we pay Mk50.00 ($0.09)
to charge mobile phones at the trading center. If we do not have enough money for
charging then we stay with dead mobile phones in pocket.”
The respondents also pointed out that frequent power outages (blackout) hinder phone
recharging. This is a major threat for effectively using MAIS in rural areas where they have few
alternative sources of power.

98
Limited capacity of mobile network. The participant farmers lamented over the poor
quality of the network in some typical rural areas [64 word counts]. They reported missing
important messages due to unavailability of network or network interruptions in voice call
conversations. To combat this, farmers must periodically move to a spot where network
reception is possible to enable receiving or making phone calls. A Village Headman from
Mpingu [VH1-1] said, “It must be told to them (Mobile Network Service Providers) we need
good quality mobile networks. We always have to search for an elevated place where we could
clearly talk on the phone.”
Limited benefit to cost ratio. A significant number of the farmers do not expect a positive
benefit to cost ratio from using MAIS [109 word counts]. This is due to the high cost of prepaid
recharge airtime. They indicated that affordable airtime charges are necessary which matches
with the quantitative results. Some demanded that some of the services in almost all media
formats be free.
In the second set of suggestions, the participant farmers requested that improvements be
made to the available MAIS. It was asserted that Participant farmers wanted to integrate MAIS
into existing extension programs with more interactive approaches. This was supported by the
following three categories: 1) promote an integrated MAIS approach within the existing
extension programs; 2) promote peer-to-peer interactions on MAIS; and 3) promote researcher-
extension-farmer interactions through MAIS. These were supported by the following quotations.
Promote integrated MAIS into existing extension programs. Participant farmers
suggested that there was a need to have MAIS fully supported by existing conventional extension
systems [36 word counts]. Farmers who wanted some assistance to apply the information and
validate the messages raised this. They desire to contact their nearest extension officer for

99
assistance, but often find an officer who is not aware of the messages sent. [FF2-1] said, “I still
feel that extension officers should assist us to successfully use MAIS, since they live nearby.” It
was also noted that other Information and Communication Technologies such as face-to-face,
radio and print media should be used to support MAIS [15 counts]. The farmers noted that other
mobile services such as mobile banking are very popular due to promotions on other media such
as radio, TV, and print media.
Promote peer-to-peer interactions on MAIS. The participant farmers expressed that there
is a need to mobilize farmers with the same farming enterprise(s) so they can share information
accessed from MAIS [21 counts]. It was suggested that this could encourage joint learning
processes and facilitate stronger feedback mechanisms to MAIS providers. The peer-to-peer
groups could also serve as the information hubs for indigenous knowledge sharing platforms.
[FF2-2] said, “It would be important to discuss the mobile messages with a group of other
farmers with same interest to learn from their actions too.”
Promote researcher-extension-farmers interactions. The participant farmers demanded to
be in contact with researchers as well as extension officers on appropriate information [9 word
counts]. They felt that MAIS should be complemented with researcher and extension visits to
farming communities. This would help farmers clearly understand new and complex information
through a richer and deeper learning process that is only available in a face-to-face learning
environment. A Group Village Headman from Mitundu [GVH1-1] said, “I have been observing
that we do not have any research and extension collaborative visits. This would be an important
option to give out our challenges which can be responded by MAIS.”

100
CHAPTER 5: CONCLUSIONS AND POLICY IMPLICATIONS
5.1 Introduction
This chapter contains conclusions that were drawn based on quantitative and qualitative
analysis in relation to the five research questions and the conceptual and theoretical frameworks.
The conclusions section presents a discussion based on importance of the results rather than
following the order of research questions. This chapter also presents the recommendations
discovered by researcher during analysis of results on: 1) mobile agricultural information
services on existing extension programs; 2) the policy implications on Mobile for Development;
and, 3) future studies based on limitations of this study. Following are the research study’s
purpose and research questions
5.2 Purpose of the Study
The purpose of this needs assessment study was to identify the potential for using mobile
technology to provide agricultural information and advisory services to farmers in Lilongwe
District of Malawi.
5.3 Research Questions
The research questions guiding this study were:
1. What types of mobile phone were farmers using and to what extent did they use the
technology?
2. Were the farmers aware of mobile agricultural information services and to what
extent do they use them with additional mobile services?

101
3. What were the farmer participants’ motivations and optimism to use mobile
agricultural information services?
4. What were the farmers’ preferred agricultural information (topics, channels and
sources) and willingness to pay for mobile agricultural information services?
5. What are the key challenges, suggestions for improvement and opportunities for
farmers to access mobile agricultural information services?
5.4 Conclusions 5.4.1 Although farmers were aware of mobile money transfer services, they were not aware and
were not using mobile agricultural information services (MAIS). Moreover, farmers with
mobile phones need knowledge and skills to use MAIS.
The results revealed that farmers with mobile phones were not aware of mobile
agricultural information services as compared to mobile money transfer services. This was a
major finding on why farmers were not using mobile phones technology for farming business in
rural remote areas. It also suggested that farmers were capable of using the same tool for
farming-based mobile money transfers. The increased percentage of farmers using mobile
phones for banking was a result of intensive promotions by Airtel money and TNM Mpamba. No
such promotional programs currently exist for MAIS. Similar studied in the East African Region
have found that farming communities have also embraced the use of mobile money transfer
services such as M-Pesa, M-Sente, Z-Pesa, and Zap (Masuki et al., 2011), as well as mobile
agricultural information services for agricultural business (Nyamba, 2012).

102
Although Malawi’s extension system has developed an IVR and SMS text messaging
system (platforms), few farmers were aware of these mobile agricultural informational systems.
The results also pointed out that even fewer farmers were using these services, even though
offered to them for free. In other terms, there were no financial restrictions to using MAIS.
While financially the barrier was removed, the farmers did indicate that they lacked the
knowledge and basic skills to use, effectively, the MAIS currently being developed by
Extension. This was in agreement with one of the resolutions from a workshop held in the Asia
and the Pacific Regions in 2012, where awareness and capacity development (for farmers) were
mentioned as critical solutions for successful MAIS (FAO, 2012).
This conclusion also supports the ‘digital divide’ on the second and third levels because
of the inequalities on capability and outcomes for farmer with mobile technology access due to
differences in awareness of MAIS (Wei et al., 2011). This applied to most farmers in Lilongwe
who were not aware of both SMS text and IVR services preventing them from using the existing
MAIS. Even for those farmers who indicated an awareness they reported only receiving
messages on a few crop production practices. It was discovered that using Rogers’, (2005)
diffusion of innovation theory, we could analyses the categories of farmers adopting MAIS could
assist in promoting the services from innovative to laggards at the local community level. The
promotion of this service by the early adopters could be limited by their dissatisfaction or
misunderstanding of the service and hence a reluctance to promote, by word-of-mouth, this new
technology with other farmers. Farmers who revealed that they quit an IVR call because they
thought they were getting charged verified this dissatisfaction and misunderstanding. Many of
the farmers were still evaluating MAIS and could not share the information about the benefits of
using the services such as free IVR messaging.

103
5.4.2 Farmers were motivated to use mobile technology and optimistic to access mobile
agricultural information services for develop rural communities.
Farmers generally agreed with statements that reflected the utility value and economic
benefits of using MAIS. In the Lilongwe context, farmers were motivated to use mobile
technology for advisory services, input and output market transactions, weather information, and
mobile banking services. They supported the mobile for development concept because it
encompasses a holistic approach to rural livelihood (Duncombe, 2012; Svensson & Wamala,
2012). Farmers, in the study, were reluctant to share information they received via MAIS with
other farmers. This may indicate they consider their mobile phone an individualized device,
containing personal information rather than public information such as is implied when
information is shared via radio. This result supported the evidence that mobile phone ownership
and use is allied to an emerging individualized culture as opposed to group based approaches
(Duncombe, 2012).
Farmers were interested and optimistic that MAIS could be used as a tool for rural
development. The qualitative results indicated that the farmers recognized the potential for
MAIS to improve the rural livelihood through direct communication, coordination and cost-
effective transactions. This supported studies that concluded mobile phones are using innovative
applications and services to transform lives and enhance rural and economic development
(Duncombe, 2012; Aker & Mbiti, 2010).
On the other hand, farmers recognized that there are a limited number of public extension
agents to cover a large working area and respond to the needs of all farmers. Most farmers
expressed that MAIS should complement other extension service delivery methods since they are
timely, reliable and less costly. Mobile agricultural information service providers and developers

104
should work to diversify their applications and increase their functionality to effectively support
farmers at different agricultural production levels (Baumüller, 2012). However, some farmers
wanted to know when they could begin accessing MAIS. This implied that the farmers surveyed
were anxious to use MAIS as a new extension innovation but needed technical support (Aker &
Mbiti, 2010).
Some of the farmers surveyed indicated that obtaining a handset was problematic. They
indicated an interest in receiving a free mobile phone handset, as some farmers received from a
grant-funded project. This was mainly a need voiced by farmers who could not afford the mid-
range mobile handsets with enhanced capabilities such as expandable memory, FM radio, and
Bluetooth for multimedia file sharing. This conclusion supports Eccles and Winfield’s
expectancy-value motivation theory (Wigfield & Eccles, 2000); and the ‘Digital Divide’ concept
(Wei et al., 2011). First, expectancy-value motivation theory focuses on utility values and cost
beliefs. Values cited by the farmers included: 1) usefulness and appropriateness for creating
awareness; 2) transferring knowledge about agriculture technologies; and 3) facilitating market
transactions of MAIS. This was in agreement with the conclusion that farmers feel more
comfortable with mobile technology and adapting to new things (Fu & Akter, 2011). Farmers
believed that MAIS was less expensive to implement (frequency, travel cost, time, and
incidentals) as compared to traditionally conducted extension meetings. When farmers were
asked about the effectiveness of the two methodologies, they indicated that, in their view, there is
no difference between the two methodologies on agricultural productivity and rural livelihood.
With each methodology seen as equally effective, the impact of a particular methodology will
rely heavily on the farmer’s motivational level. This conclusion supports the 'digital divide'
conceptual theory on the second and third levels where the differences in farmers’ motivation

105
will lead to inequalities in their capabilities to effectively use mobile agricultural information
services negatively impacting their agricultural operation (Wei et al., 2011). This will lead to
those with a high level of motivation being innovators and potentially benefitting from the more
accessible agricultural information while the less motivated will likely lag failing to use MAIS,
hindering them in growing and developing their farming operations and communities.
5.4.3 Farmers purchased and used mid-range mobile phones for voice and SMS text messages on
a daily and weekly-basis, respectively.
The results analysis concluded that most farmers purchased their own mid-range phones
with a few receiving them as gifts from relatives or projects. This confirms a report by Donovan,
(2011), that most farmers own mobile phones of different brands and capabilities that are
relevant for agriculture. In contrast, Malawian farmers are lagging behind the world on the use of
mobile agricultural applications powered by smart phones (FAO, 2012). It was also concluded
that the mobile media formats commonly used by farmers for their communications were voice
calls and SMS text messages on a daily and weekly basis, respectively. A study conducted by
Katengeza, found that some institutions like MACE, were using SMS text message mobile media
formats and were ready to deliver MAIS through IVR format in Malawi (Katengeza, 2012). The
analysis also concluded that farmers were not using other mobile phone capabilities, such as the
FM radio, personal digital assistant, multi-media player, camera and mobile internet. This
finding was attributed to several challenges like lack of basic skills (literacy and digital) and
limitations of mobile technology (battery life and high associated costs) indicated in Chapter 4.
The first conclusion supports the ‘digital divide’ conceptual model. According to the
study by Wei et al., (2011), digital divide was categorized into three levels: first level, access to
technology; second level, capability inequalities; and third level, outcome inequalities. In this

106
study, the emphasis was mainly on the second and third levels of the digital divide model
because all of the participant farmers owned a mobile phone. Farmers who lack the capabilities
to effectively use mobile technology fall in the second level of the ‘digital divide’ and their
limited abilities affects their outcomes (third level) reducing their benefit from MAIS. However,
the literacy test results indicated that most farmers with mobile phones (87%) were literate and
comprehended the content. The key issue that needs to be addressed is enhancing the farmer’s
digital skills since mobile technology continues to advance and most farmers are lagging behind.
5.4.4 Farmers preferred and nearly half were willing to pay for MAIS that deliver voice and text
messages in a timely, relevant, current, and dependable manner.
It was concluded that farmers preferred mobile agricultural information to be
supplemented by a variety of informational channels such as face-to-face, radio, television,
Internet, CD-ROMs and print media. This was in agreement with the idea that, as new
agricultural communications technologies brought changes in extension systems that has been
historically dominated by face-to-face interactions and paper-based information systems among
major agricultural extension providers (Simuja, 2012). Making reliable data available using
mobile phone-based information services has paved the pathway for expanding this technology
into other information dissemination content areas, such as agriculture, in rural areas (FAO,
2012). In previous studies the reported farmers’ preferred mobile media formats were also voice
and text messages as channels within MAIS (Simuja, 2012; Katengeza, 2012). This result
validates by the farmers’ current usage of mobile phones in Lilongwe.
Farmers preferred the extension service as a source of information and MAIS provider.
This is because farmers trust the information when provided in face-to-face settings with an
extension agent whereas the level of trust in mobile technology delivered information is less.

107
Therefore, if public extension (who farmers trust) was the source of the information delivered via
mobile-based technology than farmers may more likely utilize MAIS. This result agrees with
Duncombe’s (2012) findings that historically trust levels and the complexity of information
needs of the farmers are better when they feel more personally connected to the information
provider. In Malawi, the public extension system remains the largest agricultural information
provider in terms of staff and coverage at the national level (Masangano & Mtinda, 2012). This
implies that, the Department of Agricultural Extension Services under the Ministry of
Agriculture, Irrigation and Water Development is in an ideal position to spearhead the
development and validation of appropriate content for mobile agricultural information services.
It can also collaborate with other public and private institutions to execute effective mobile
agricultural information services.
It was also concluded that the farmers want agricultural information that is timely,
relevant, current and dependable and are willing to pay for the MAIS, if they perceive the
benefits to outweigh the cost of the service. This supports the fact that farming is an information
intensive sector that requires awareness of the best practices and technical know-how to assist in
making appropriate decisions at all productivity levels (Fu & Akter, 2011; FAO, 2013). The
results were in agreement with the notion that mobile agricultural information services have the
potential not only to reduce information and transaction costs, but also allow regular and timely
access when needed (Baumüller, 2012). This conclusion implies that farmers are motivated to
use agricultural information when the information is useful and can be applied to productively
manage their system, to enhance market access and to make financial decisions.
This conclusion supports the Expectancy-value of motivation and Blumler and Katz's
Use and Gratification Theory (Blumler & Katz, 1974). Firstly, the farmers expected MAIS

108
would provide them with frequent, relevant, timely and dependable services. Such a system
would motivate them to use the agricultural information for their knowledge and desired actions.
In Malawi's context, this translates to improving the current MAIS system so that it provides
information that is matched with specific farming tasks at a particular time of the season.
Secondly, the Use and Gratification Theory focuses on how people use media for all sorts of
their needs and gratifications (Ruggieo, 2000). The farmers clearly stated, based on their
experiences, the types of services desired and that the information must be timely and actionable
to meet their needs and satisfaction. They also reported that they were willing to pay for MAIS
that could satisfy their cognitive, personal integrative and tension-free needs in the short and
long term to improve on their productivity and rural livelihood. For example, some farmers
expressed their dissatisfaction with the current IVR services because it took them too long to
navigate through the leading parts to get to the three-minute voice message. In other cases, the
farmers expressed their desire for the information to be delivered via multiple mobile media
formats, thus making the information available in a user-friendly format (i.e., videos and step-by-
step audio instruction on agronomic practices) to suit rural information needs.
5.4.5 Farmers reported three major challenges: 1) lack of knowledge of mobile agricultural
information services (MAIS); 2) marginal benefits to costs of using mobile technologies
and MAIS; and, 3) limited capacity of infrastructures (i.e., electricity and mobile networks)
to support the use of mobile technologies.
Lack of knowledge of mobile agricultural information services was the most commonly
reported limitation among farmers with mobile phones. For those farmers who reported being
aware of MAIS they indicated they were not knowledgeable on how to use the existing MAIS.

109
Numerous farmers cited learning about the MAIS informally and expressed interest in learning
more about the existing MAIS from the study. This concurs with other studies (Aker, 2011;
FAO, 2012; Duncombe, 2012). Baumüller (2012) that found a number of challenges associated
with the use of mobiles agricultural information services, such as the lack of basic skills (literacy
and digital) and limited knowledge on the use of various mobile agricultural platforms (i.e.,
integrated voice response systems). Per this discovery, for farmers to effectively utilize MAIS
they will need training to provide a basic level of knowledge and information on how to operate
the technological systems.
The study found that farmers shared concerns about the costs of MAIS and expressed a
need for information shared via mobile phones to be free or at a reduced cost. At present, farmers
perceived there was a marginal benefits to costs ratio for using mobile agricultural information
services. This is likely because there was limited knowledge on the current MAIS programs and
the potential benefits they could offer their family, community, and them. According to
Baumüller (2012), issues worth consideration with MAIS in rural areas include providing the
service to those who are marginalized and poor, restricted by distance, lower in social standing,
and limited in their ability to pay for MAIS. An associated cost of doing business besides the
cost of accessing MAIS was the cost of maintaining the mobile phone.
Many farmers shared challenges with limited capacity of the infrastructure. Farmers rated
limited access to electricity as the most critical challenge for MAIS because it can cause them to
miss voice calls when the battery of mobile phone is dead and they find going to a business to
recharge the phone extremely inconvenient. Another significant concern was the poor quality of
the network, which limits the accessibility, and effectiveness of the MAIS. With a poor network,
farmers were forced to physically move to a point where they can receive a cellular signal

110
permitting reception of a clear message via IVR. The poor network can be even more
challenging for female farmers as they may be less likely to use innovative access strategies such
as climbing to the top of a tree to search for mobile network signal (Baumüller, 2012). The lack
of electricity affects many rural farmers who have to travel to trading centers where they spend
considerable time charging their phones. The cost for charging a phone is also a significant
problem for farmers. If the farmers do not have sufficient funds to recharge their phone, they
may miss important messages during times when their phone is not operational.
This conclusion supports the 'digital divide' on the first and second levels (access and
capability divide) due to infrastructure limitations and lack of knowledge and expectancy-value
theory on marginal benefits for the costs. Firstly, the limited infrastructural capacity contributes
to the marginalization of the farmers in rural areas where mobile networks are a problem. They
struggle accessing MAIS due to technological challenges as data from Mitundu EPA verified. On
the second level of 'digital divide’, those with limited knowledge on the use of MAIS platforms
were lagging behind as they were unable to access the available agricultural information. The
limited infrastructural capacity and MAIS knowledge tends to create, in the farmers, low
motivational levels because they are unaware of the potential associated cost-benefits. The
negative impact of these limitations were noted when farmers reported not using Esoko, a free
SMS text-based platform because of limited infrastructural capacities and knowledge.
5.4.6 Farmers expressed the need for an integrated mobile agricultural information service using
interactive two-way approaches within existing extension programs.
The farmers expressed that the current MAIS platforms provides one-way information
flow through both IVR and SMS text messages. An integrated system combining MAIS with the

111
traditional Extension system would provide the opportunity for a farmer to seek clarifying
information from an Extension agent or researcher on a message originally delivered using
MAIS. It was found that as the complexity of agricultural information increases and new services
are implemented the demand grows for more urgent and integrated services with broader support
from extension agents and researchers (Baumüller, 2012). It should be noted that mobile
agricultural information initiatives, those being developed beyond the extension services
capabilities are being implemented to support the existing traditional information sharing
platforms. For example, a Call Center3 was commissioned in 2015 by Farm Radio Trust in
Lilongwe where experts respond instantly to farmers’ information needs on various topics.
Farmers also shared that there was an opportunity for MAIS to facilitate group sharing of
ideas among farmers as they discuss ways to apply the content conveyed in IVR or SMS
messages. This was referred to as Farmers Information Hubs4 by one of the projects delivering
climate information in Malawi’s southern district of Balaka. This was conceptualized to gather
indigenous knowledge and share new MAIS-provided information.
Although farmers indicated a preference for MAIS, they expressed an interest in new
services being promoted through other communication channels such as radio, TV, print media
and face-to-face. Farmers noted that mobile money services were promoted heavily on other
media and as a result gained a lot of popularity unlike the agricultural information services.
Some farmers suggested that MAIS should be integrated with the above-mentioned
communication channels for successful message delivery.
3Call Center is a virtual service providers to farmers through phone calls
4Farmers Information Hubs are farmer clubs that discuss issues presented by media on farming

112
This conclusion supports the digital divide at the third level where output inequalities can
be reduced by peer-to-peer information sharing, calling experts and use of alternative
communication media. There is a need to find new and innovative ways to deliver appropriate
messages and engage farmers. In the context of Malawi, the existing MAIS were operating in
isolation and the farmers were not provided a mechanism to ask important questions. Integrating
MAIS with other communication channels and incorporating a human presence, whether
researcher or extension agent, will provide for a stronger and more consistent system. Secondly,
it supports the use and gratification theory where farmers receive gratification through a more
responsive and engaging MAIS that provides timely agricultural information. The farmers in the
study express a level of unhappiness with the MAIS not being connected more closely with
extension agents and researchers to whom the farmers turn when clarifying information is
needed on information they have received via SMS test messages.
5.5 Recommendations for Practices
The following recommendations were made based on the six conclusions of the study as
above. The recommendations for practice on mobile agricultural information services (MAIS)
were directed to all extension providers and Public Private Partnership (PPP) for successful
MAIS delivery in Lilongwe district.
It is recommended that mobile agricultural information service providers create
awareness among rural farming communities about their services employing the same strategies
used for promoting mobile money transfers services. This should be done since MAIS are a
relatively new innovative extension service delivery. According to Rogers (2003) adoption of
innovations, only the innovators use technological information since they have information

113
seeking behavior. Awareness campaigns using interpersonal, radio, television, and print
communication in more time dimensions would lead to more awareness among the farmers to
use MAIS, assisting them to make informed decisions. The opinion leaders (ones using MAIS)
would assist to promote MAIS amongst their peers if they were satisfied with these new
extension services. The analysis of the results indicated the need for external interventions to
boost awareness of MAIS providers, importance of services, business models and mobile media
formats used.
It is recommended that extension service providers register farmers with mobile phones
and develop a database to be used by MAIS service providers. The farmers’ profiles would assist
MAIS match their information with the timely and appropriate needs of the farmers. The updated
database could be populated through various strategies such as extension meetings, local field
days, market days, farmers clubs, and community centers. This should be done in partnership
with local leaders and mobile network service providers. The same can be done to promote
MAIS to extension officers, lead farmers and farmer clubs via Bluetooth, social media and web-
based tools.
Mobile agricultural information service providers should develop messages in formats
suitable for farmers’ mid-range and basic mobile phones. Ideally, farmers would be able to
access agricultural information using the most appropriate mobile-based media (i.e., voice calls,
SMS text messages, videos and audios). The messages uploaded should be up-to-date, delivered
on a daily and weekly basis, and available in multimedia formats as demanded by the farmers for
their choices and uses. MAIS should also be made more accessible to underprivileged farmers
who are unable to pay for them to make critical farm decisions.

114
Extension service providers must provide both crop and livestock production information
on MAIS formats in a sustainable manner. The majority of the farmers were not satisfied with
existing MAIS. There is a need to establish a variety of business models that will meet the needs
of all farmer categories. MAIS providers should be encouraged to develop and distribute relevant
agricultural information that may be retrieved easily for the benefit of the farmers.
It is recommended that extension service providers develop new and innovative program
to enhance the knowledge and skills of farmers so they can effectively use existing MAIS. There
is a need to train and motivate farmers to use their mobile phone’s digital capabilities to access
MAIS. The trainings must be done using participatory or farmer-to-farmer approaches in the
local facilities to avoid negative perceptions about the complementary innovative approaches.
The visual aids and experiential learning materials should be developed for farmers with
different learning abilities to understand the concepts and theories for their future use. There is a
need to enlighten farmers on the advantages and cost-benefits of using MAIS.
It is recommended farmers have a second battery for their phone to overcome current
mobile technology power challenges. A battery typically costs between MK 2500-6000 ($4-10).
This would substantially increase the likelihood that farmers will have access to messages and
other digital-based information, while alternating recharging the batteries. Additionally,
extension practitioners should encourage farmers to use alternative charging sources such as
solar power to recharge mobile phone batteries in rural areas.
It is recommended that mobile network service providers (MAIS) improve the quality of
their network in rural areas, such as Mitundu and Mpingu. Improving network capacities would
increase the probability of farmers being able to access timely and important agricultural

115
information. For MAIS to reach a large percentage of rural Malawian farmers cellular providers
must boost the reach and reliability of their network.
Lastly, it is recommended that MAIS providers collaborate with extension service
providers to deliver integrated mobile agricultural information services using interactive two-
dimensional approach in a harmonized manner. Farmers want opportunities to comment or get
clarifications on agricultural information accessed from MAIS. Expert opinions and facts from
researchers, extension officers and lead farmers should be provided in support of the new
innovative extension system since farmers still value face-to-face and radio communications.
MAIS providers should also seek input and feedback from farmers on diverse topics, appropriate
messages, and key sources of agricultural information for success of MAIS.
5.6 Implications for Policy
5.6.1 Implications on Extension Service Delivery and ICT Policy for Agriculture
• The Agricultural Extension System must fully embrace the National ICT policies,
incorporating them into existing programs while developing mobile phone
communication strategies specific for rural farmers.
• It is recommended that a new policy on mobile agricultural information services be
developed that is in-line with Malawi’s National Extension Policy of 2003. This will
assist in guiding and directing all players opting for a mobile phone-based extension
provision to combine their efforts to advance appropriate development agendas in rural
farming communities. Previous studies conducted by Katengeza in 2012 and Simuja in
2013 expressed the same need to formulate new policies in terms of mobile marketing

116
systems. The policy should also include the roles of various players in ensuring
provision of timely, relevant, current and sustainable MAIS to all including the
resource poor farmers with access to mobile phones.
• The Department of Agricultural Extension Services (DAES) must continue providing
leadership in establishment of an integrated MAIS that incorporates a two-way
interactive approach. It should be noted that the department formulated the National
Agricultural Content Development Committee for ICT (NACDC) in collaboration with
private and public sectors. In that regards, DAES has a rich history and farmers’ trust to
coordinate harmonized delivery of agricultural information through innovations such as
mobile phones.
• The extension system should form a coalition of public and private entities to explore
the feasibility of establishing phone-charging stations that would be more conveniently
located for the farmers and which offer recharging services at a price that farmers can
afford.
5.6.2 Implication on Policies for Mobile Service Providers
• Mobile Service Providers should help farmers navigate the limited capacity of the
infrastructure (i.e. electricity and mobile networks) to support the use of mobile
technologies. MAIS providers must invest in alternative energy sources such as solar
power to provide farmers with the capability to charge their phones on a regular basis as
battery life and recharging services were two limitations cited by farmers with mobile
phones.

117
• Public and private entities need to invest in alternative energy sources (i.e., solar power
and multiple batteries or power-bank batteries) to enable farmers the capability to charge
their phones on a regular basis. Battery life and recharging services were two limitations
cited by farmers to the use of mobile phones to obtain agricultural information.
• Extension should create a coalition, to include cellular and agricultural information
providers, to create a plan for implementing MAIS services designed to meet the needs of
a range of farmers with different levels of ability to pay. This study found that a majority
of the farmers indicated they had limited resources that would enable them to afford the
existing MAIS.
5.7 Recommendations for Future Research Studies
In the researcher’s view, this study was the first of its kind to looked at the potential of
using mobile phone technology to access agricultural information services to farmers in Malawi’
Lilongwe District. It is hoped that the study provided foundational information that can be used
by various practitioners including researchers, extension service providers, mobile network
operators and policy makers to improve MAIS in Malawi. However, the following limitations
were faced and therefore established a need for recommendations for further research.
Recommendation #1: Since the survey involved only participant farmers who represented
Malawi’s Lilongwe District, the results of this study cannot be generalized beyond the Lilongwe
District. To achieve a representative sample the two selected EPAs were randomly selected from
nineteen in the district. It is therefore recommended that future studies on MAIS in Malawi
should consider selecting more EPAs in other parts of Malawi for more generalizability on the
farmers’ use of MAIS and their information needs.

118
Recommendation #2: The second limitation was on representation of all the farmers with
mobile phones from the two randomly selected research sites. The problem was that there was no
existing registry or formal database of farmers with mobile phones at the EPA or District levels.
The study’s target population was identified by conducting a compilation exercise of all the
farmers with mobile phones in all ten (10) Sections to represent the two EPAs. For credibility of
the results, the local extension officers and local leaders were tasked with compiling a list of all
farmers with phones in their areas. However, not all farmers were registered since due to time
limits and long distances to typical rural areas. The researcher conducted a verification exercise
to establish the exact numbers. It was determined that at least 80% of the farmers with mobile
phones were captured and included on the list that formed the basis from which a random
sample of participants was selected. Future studies, for better representations and
generalizability, should identify existing databases or if they are not available, independent,
unbiased personnel should be utilized to create a list of farmers with mobile phones.
Recommendation #3: The process of translating the English questionnaire into Chichewa,
and testing and adapting the questions for better understanding of the farmers was tedious and
took too much time. Various language experts were involved to ensure that each aspect of the
tool was the same as the context of the study. The translated tools were pretested and utilized
with the participants and then coded back to proper English for easy data entry process. It is
therefore important for future studies to employ other ways of balancing the language or content
in the instruments to cut the translation costs to suite Malawian context. This might include
computer applications or language replacement charts to aid the process.
Recommendation #4: The study used a cross-sectional survey method that documented
the information at one point in time. This has some shortfalls since data was collected during

119
commencement of a new cropping season (2015) and at a time when there was some disease
outbreaks affecting chickens and pigs. It is therefore recommended that future studies be
conducted using a longitudinal survey approach to minimize the impact of seasonal farming
influences and specific agricultural events on the farmers’ responses.
Recommendation #5: There was limited application of the diffusion of innovation theory
as well as use and gratification theory since they were not considered during the research design
stage. Both theories were used, to a lesser extent, in the explanations focused on the farmers’
awareness of MAIS and how they felt about existing mobile services. Future MAIS-focused
studies should incorporate, in the early stages of the research design process, these theories since
they were deemed applicable.
Recommendation #6: It was also noted that use of the Survey research methodology
presented some typical limitations to capturing all the agricultural information needs of farmers
with mobile phones. The researchers in this study implemented a mixed modes research design
to triangulate the quantitative data and address other shortcomings of the Survey research design.
It is therefore recommended that, qualitative studies should be conducted to obtain more in-depth
information and to build solid Mobile for Development (M4D) theories.

120
REFERENCES
Aker, J. C. (2011). Dial "A" for agriculture: A review of information and communication
technologies for agricultural extension in developing countries. Agricultural Economics,
42(6), 631–647. doi:10.1111/j.1574-0862.2011.00545.x
Aker, J. C., & Mbiti, I. M. (2010). Mobile phones and economic development in Africa. Journal
of Economic Perspectives, 24(3), 207–232.
AMGOO Marketing Team (2015). Why Africa Mobile Phone Penetration Rising To 79% by
2020 Is Good News? Accessed from: http://www.amgoo.com/blog/why-africa-mobile-
phone-penetration-rising-to-79-by-2020-is-good-news. Accessed on: 20th May, 2015.
Anderson, J.R. (2007). Agricultural advisory services: Background paper for the World
Development Report for 2008. Washington, DC: World Bank.. Retrieved from:
http://siteresources.worldbank.org/INTWDR2008/Resources/2795087-
1191427986785/Anderson_AdvisoryServices.pdf
Babu, S. C., Glendenning, C. J., Asenso-Okyere, K., & Govindarajan, S. K. (2012). Farmers’
Information Needs and Search Behaviors Case Study in Tamil Nadu, India. Paper
presented at the IFPRI, Discussion Paper 01165. Retrieved from:
http://www.ifpri.org/sites/default/files/publications/ifpridp01165.pdf
Baumüller, H. (2012). Facilitating agricultural technology adoption among the poor: The role of
service delivery through mobile phones. Center for Development Research (ZEF). 93(1)
1–30.
Blumler, J. G., & Katz, E. (Eds). (1974). The uses of mass communications: Current perspectives
on gratifications research: Beverly Hills, CA: Sage Publications.

121
Candalla, A. (2012). Kenyan farmers, use of cell phones: Calling preferred over SMS. (Paper
presented at the Proceedings for M4D). Retrived from:
http://research.ihub.co.ke/uploads/2012/may/1337774145_819_425.pdf
Case, D. O. (2012). Looking for information: A survey of research on information, seeking,
needs, and behavior (3rd ed.). United Kingdom: Emerald Group Publishing Limited.
Chhachhar, A. R., & Hassan, M. S. (2013). The use of mobile phone among farmers for
agriculture development. International Journal of Scientific Research, 2(6), 2277–8179.
Retrieved from:
https://www.academia.edu/6011886/Research_Paper_The_Use_of_Mobile_Phone
Among_Farmers_for_Agriculture_Development.
Chimera, B. A. R., Gondwe, N. C., & Mgomezulu, R. (2008). Current status of livestock
production, marketing technology gaps and investment opportunities in Malawi.
Retrieved from: http://www.cabi.org/GARA/FullTextPDF/2008/20083326927.pdf
Chirwa, E. W., Kumwenda, I., Jumbe, C., Chilonda, P., & Minde, I. (2008). Agricultural growth
and poverty reduction in Malawi: Performance and recent trends. Retrieved from:
http://pdf.usaid.gov/pdf_docs/PNADS611.pdf
Cole, S. A., & Fernando, A. N. (2012). The value of advice: Evidence from mobile phone-based
agricultural extension, Harvard Business School Working Paper [Internet]. Retrieved
from: http://www.hbs.edu/faculty/Publication%20Files/13-047_08f3cd3a-dfb4-482e-
af80-f53b20f1ad46.pdf
Chowa, C. (2015, February, 11). Interviewed by B. F. Chisama [Office meeting]. Farmers’ use
of mobile phone technology for agricultural information services. Department of
Agricultural Extension Services offices. Lilongwe, Malawi.

122
Cooper, C., Burgoon, M., & Roter, D. L. (2001). An expectancy-value analysis of viewer interest
in television prevention news stories. Health Communication, 13(3), 227–240. doi:
10.1207/S15327027HC1303
Department of Agricultural Extension Services. (2015). Synergies of the district agriculture
extension services system and MaFAAS. Lilongwe. Malawi. Presented at Malawi Forum
for Advisory Services, Extension Week.
Davis, K. (2008). Extension in sub-Saharan Africa: Overview and assessment of past and current
models and future prospects. Journal of International Agricultural and Extension
Education, 15(3), 15–28.
Dillman, D. A. (2011). Mail and internet surveys: The tailor design method–2007. Update with
new internet, visual, and mixed-mode guide. Hoboken, New Jersey: John Wiley & Sons,.
Donovan, K. (Ed.) (2011). Anytime, anywhere: Mobile devices and services and their impact on
agriculture and rural development. (Module 3). Overview of ICT in agriculture;
opportunities, access, and cross cutting themes.Retrieved from:
http://www.ictinagriculture.org/sites/ictinagriculture.org/files/final_Module3.pdf
Duncombe, R. (2012). Mobile phones for agricultural and rural development: A literature
review and future research directions (Manchester Centre for Development Informatics
Working Paper 50). Retrieved from:
http://www.seed.manchester.ac.uk/medialibrary/IDPM/working_papers/di/di_wp50.pdf
Eccles, J. S., & Wigfield, A. (2002). Motivation beliefs, values, and goals. Review of Psychology.
53, 109–132. doi:10.1146/annurev.psych.53.100901.135153

123
Egbule, C.L., Agwu, A.E., & Uzokwe, U.N. (2014). Availability and use of mobile phones for
information dissemination by public extension agents in Delta State, Nigeria. Journal of
Agricultural Extension, 17(2), 23–30. doi:http://dx.doi.org/10.4314/jae.v17i2.4
Eklof, H. (2006). Development and validation of scores from an instrument measuring student
test-taking motivation. Educational & Psychological Measurement., 66(4), 643–656.
FAO. (2006). Framework on effective rural communication for development. R.D. Castello &
P.M. Braun (Eds.). Rome: Food and Agricultural Organization. Retrieved from:
http://www.fao.org/nr/com/gtzworkshop/a0892e00.pdf
FAO. (2012). Mobile technologies for food security, agriculture and rural development: Role of
public sector (RAP Publication 2012/19). Bangkok: Food and Agricultural Organization.
Retrieved from: http://www.fao.org/docrep/017/i3074e/i3074e.pdf
FAO. (2013). ICT for inclusive agricultural value chains. C. Miller, V.N. Saroja & C. Linder
(Eds.). Rome: Food and Agricultural Organization. Retrieved from:
http://www.fao.org/docrep/017/aq078e/aq078e.pdf
Fu, X., & Akter, S. (2011). The impact of ICT on agricultural extension services delivery:
Evidence from the rural e-services project in India. Retrieved from: This reference is
incomplete. Please update as I could not find it online.
GoM. (2002). Agricultural extension in the new millennium: Towards demand driven and
pluralistic services in Malawi. Lilongwe, Malawi: Ministry of Agriculture, Irrigation and
Water Development..
GoM. (2009). A guide to agricultural production and natural resource management. Lilongwe.
Malawi: Agricultural Communication Branch..

124
Hernandez, V. M. (2012). The Agricultural Commodity Exchange in Africa: Mapping the
progress of structured trade systems in Malawi. Retrieved from ACE: Retreived from:
http://www.aceafrica.org/media/7618/The%20ACE%20Model%20Valeria%20Morua%2
0-%20Revised.pdf
Ingrid. (Producer). (2011). Workbook G: Conducting in-person interviews. Retrieved from:
http://www.wallacefoundation.org/knowledge-center/Documents/Workbook-G-In-
Person-Interviews.pdf
Islam, S. M., & Ake, G. (2011). Factors influencing the adoption of mobile phone among the
farmers in Bangladesh: Theories and practices. International Journal on Advances in ICT
for Emerging Regions. 4(1), 4–14. doi:10.4038/icter.v4i1.4670 ITU. (2014). World
telecommunication/ICT indicators database 2014. Retrieved from:
http//www.itu.int/en/ITU-D/Statistics/Pages/stat/defualt.aspx
ITU. (2015). ICT facts and figures - the world in 2015. Retrieved from
http://www.itu.int/en/ITU-D/Statistics/Documents/facts/ICTFactsFigures2015.pdf
Kashem, M. A. (2010). Farmers’ use of mobile phones in receiving agricultural information
towards agricultural development. J. Svensson & G. Wicander (Eds), Proceedings of the
2nd International Conference on M4D Mobile Communication Technology for
Development, M4D2010. Karlstad: Karlstad University Studies 2010: 31.
Katengeza, S. (2012). ICT-based market information services, operational environment and
performance: The case of Malawi agricultural commodity exchange and food and
nutrition security joint task force. American International Journal of Social Science, 1(2),
34–43. Retrieved from:
http://www.aijssnet.com/journals/Vol_1__No_2_December_2012/4.pdf

125
Lunenburg, F. C. (2011). Expectancy theory of motivation: Motivating by altering expectations.
International Journal of Management, Business, and Adminstration, 15(1), 1–6.
MACRA. (2015). National survey on access to and usage of ICT services in Malawi. Retrieved
from: http://www.macra.org.mw
Masambuka-Kanchewa, F. (2013). Agricultural information perceptions and behaviors of
smallholder farmers in the central region of Malawi. (Master of Science Agricultural
Education), Purdue University, West Lafayette. Retrieved from:
http://docs.lib.purdue.edu/dissertations/AAI1544423/
Masangano, C., & Mtinda, C. (2012). Pluralistic Extension System in Malawi. IFPRI discussion
paper, Washington, DC: International Food Polilcy Research Institute. Retrieved from:
http://www.ifpri.org/publication/pluralistic-extension-system-malawi
Masuki, K. F., Tukahirwa, J., Kamugisha, R., Mowo, J., Tanui, J., & Mogoi, J. (2011). Mobile
phones in agricultural information delivery for rural development in Eastern Africa:
Lessons from Western Uganda. World Agroforestry Centre. Retrieved from: http://
http://www.worldagroforestry.org/downloads/Publications/PDFS/MM10320.pdf
Mathiassen, L., & Sorensen, C. (2008). Towards a theory of organizational information services.
Journal of Information Technology\, 23(4), 313–329. doi:10.1057/jit.2008.10
Mittal, S., & Mehar, M. (2013). Agricultural information networks, information needs and risk
management strategies: A survey of farmers in Indo-Gangetic plains of India.
Socioeconomics Working Paper 10. Mexico, D.F.: CIMMYT. Retrieved from:
http://repository.cimmyt.org:8080/xmlui/bitstream/handle/10883/3225/98167.pdf;sequen
ce=4

126
Tegha, Y. C. (2014). Effectiviness of field days on promoting the adoption of recommended
improved maize varieties by smallolder farmers in Lilongwe Malawi. (Master of Science
Agricultural Education), Purdue University, West Lafayette. Retrieved from:
http://search.proquest.com/docview/1654219250
MoAIWD. (2013). Minutes on Esoko Information Sharing Workshop held jointly by Umodzi
Consulting and Department of Agricultural Extension Services. Lilongwe. Malawi.
Molony, T. (2006). 'I dont trust the phone; it always lies': Trust and information and
communication technologies in Tanzania micro-and small enterprises. Information
Technologies and International Development, 3(4), 67–69.
Muto, M., & Yamano, T. (2009). The Impact of Mobile Phone Coverage Expansion on Market
Participation: Panel Data Evidence from Uganda. World Development, 37(12), 1887–
1896. doi:10.1016/j.worlddev.2009.05.004
Mviha, P. J. Z., Mtukuso, A. P., Banda, M. P. H., & Chisama, B. F. (2011). A catalogue of
agricultural technologies released by ATCC from 2004-2011. Lilongwe. Malawi:
Department of Agricultural Research Services.
NSO. (2008). Population and housing census results. Malawi: National Statistics Office.
Retrieved from http://www.nsomalawi.mw/2008-population-and-housing-census.html
Nyamba S.Y., & Malongo. .S., & Mlozi, S.D. (2012). Factors influencing the use of mobile
phones in communicating agricultural information: Case of Kilolo District, Iringa,
Tanzania. International Journal of Information and Communication Technology
Research, 2(7), 558–564. Retrieved from: http://www.esjournals.org

127
Oladele, O. I. (2011). Features of agricultural extension models and policy in selected sub -
Saharan Africa countries. Journal of Agriculture and Environment for International
Development,105(1), 35–44. doi:http://dx.doi.org/10.12895/jaeid.20111.10
Oladele, O. I., Lepetu, J., Subair, S. K., & Obuh, J. (2009). SWOT Analysis of extension systems
in southern African countries. Journal of Agriculture and Environment for International
Development, 103(4), 309–320. doi:http://dx.doi.org/10.12895/jaeid.20094.38
Pearce, K. (2013). Phoning it in: Theory in mobile media and communication in developing
countries. Mobile Media & Communications, 1(1), 76 –82. doi:
10.1177/2050157912459182
Prihandoyo, W. B., Muljono, P., & Susanto, D. (2014). Effectiveness of agricultural information
dissemination through media mobile phone on vegetable farmers in the District Pacet
Cianjur Regency. Asian Journal of Humanities and Social Sciences, 2(1), 68 - 76.
Retrieved from:
http://ajhss.org/pdfs/Vol2Issue1/Effectiveness%20of%20Media%20Mobile...pdf
Rogers, E. M. (2003). Diffusion of innovation (5 ed.). New York: Free Press.
Ruggiero, T.E. (2000). Uses and gratifications theory in the 21st century. Mass Communication
& Society, 3(1) 3–37.
Russell, S. E., & Steele, T. (2013). Information and communication technologies and the digital
divide in Africa: A review of the periodical literature, 2000–2012. Electronic Journal of
Africana Bibliography, 14. Retrieved from: http://ir.uiowa.edu/ejab/vol14/iss1/1/
Schutt, R. K. (2012). Investigating the social world: The process and practice of research.
Washington DC.: SAGE Publication Inc.

128
Simuja, C. (2012). Using mobile phone-based market information services to link smallholder
farmers to markets in Malawi. Zomba. Malawi: University of Malawi..
Svensson, J., & Wamala, C. (2012). M4D: Mobile communication for development. Paper
presented at the 3rd Sanord International Symposium, Aarhus, Denmark: Aarhus
University, 6-7 June 2012. Retrieved from: http://www.diva-
portal.org/smash/get/diva2:549742/FULLTEXT01.pdf
Tenhunen, S. (2008). Mobile technology in the village: ICTs, culture, and social logistics in
India. Journal of the Royal Anthropological Institute, 14(3), 515–534.
doi:10.1111/j.1467-9655.2008.00515.x
Van Dijk, J. (2012). The network society (3rd edition). UK: SAGE Publications, Ltd.
Vodafone. (2005). Africa: The impact of mobile phones. The Vodafone Policy Paper Series,
Number 2. Retrieved from:
https://www.vodafone.com/content/dam/vodafone/about/public_policy/policy_papers/pu
blic_policy_series_2.pdf
Wei, K. K., Toe, H. H., Chan, H. C., & Tan, B. C. Y. (2011). Conceptualizing and testing a
social cognitive model of the digital divide. Information Systems Research, 22(1), 170–
187. doi:10.1287/isre.1090.0273
Wigfield, A., & Eccles, J. S. (2000). Expectancy–value theory of achievement motivation.
Contemporary Educational Psychology, 25(1), 68–81. doi:10.1006/ceps.1999.101
Zahedi, S. R., & Zahedi, S. M. (2012). Role of information and communication technologies in
morden agriculture. International Journal of Agriculture and Crop Sciences. 4(23),
1725–1728.

129
APPENDICES

130
APPENDIX A: Approval Letters to Conduct Research Study
Figure 3, Approval letter from Purdue University IBR

131
Figure 4, Approval letter from DAES Malawi

132
APPENDIX B: Research Instrument Used (English version) Farmer’s Use of Mobile Phone Technology for Agricultural Information Service in Lilongwe
District, Malawi
Introduction
I want to thank you for taking your time to meet with me today. My name is
_______________ and I would like to talk to you about your use of mobile phone technology for
agricultural information and services. The outcome is going to assist the Department of
Agricultural Extension Services as a public service provider in developing flexible approaches to
disseminate agricultural information through information and communication technologies such
as mobile phone. For you to participate in this study you must be 18 years or older. Do you meet
this criterion? [ ] Yes [ ] No
The interview should take a maximum of forty-five minutes (45min). You must feel free
not to respond to a question(s) that you do not want to; you are also free to drop from the
interviews at any time you feel like you are no longer interested participating in the research. All
the responses will be kept confidential. This means that your interview responses will only be
shared with the principle investigator and any information included in the report does not
disclose the identity of participants. Do you have any questions about what I have just explained?
[ ] Yes [ ] No
Participation is voluntary and if you are not willing to participate there is no penalty or
loss of benefit to which you are entitled as a smallholder farmer of Lilongwe District. If you have
quarries or more information about the research please contact the principle Investigator or Co-
investigator on the addresses give below:
Principal investigator contacts Co-investigator contacts
Roger Tormoehlen, PhD Benjamin F. Chisama Youth Development and Agricultural Education Department of Agricultural Research Services 615 W. State Street P.O. Box 30779 West Lafayette, IN 47907 Lilongwe 3 Phone: +1 765 494 8422 Malawi Fax: +1 765 496 1152 Phone: +265 1 707 123 Mobile: +1 765 714 4941 Mobile: +265 999 667 728 Email: [email protected] Email: [email protected]

133
Section A: Demographic Characteristics
Name of EPA: _______________________ Name of Section: ________________________ Name of TA: ________________________ Name of Village: ___________________________ Age: ____________ Gender: 1. Male 2. Female Household Number: ___________
1. What is your marital status? (Select option)
1. Single 2. Married 3. Divorced
4. Widowed 5. Separated 6. Others (specify):_______________
2. What is your education level? (Select only one option)
0. None 1. Primary School 2. Secondary school
4. Post-secondary 5. Others (Specify):_________________
3. What is your main occupation? (Select only one option)
1. Farming 2. Off-farm casual work 3. Fulltime employment
4. Small Business owner 5. Student 6. Other (Specify) ________________
4. Do you hold a leadership position in your community? (If no, go to Q6)
1. Yes 0. No
5. If yes, what leadership position do you hold? (Select one or more option)
1. Village Head 2. Chief’s Advisor 3. Lead farmer 4. Community Based
Organization Leader 5. Farmer Club 6. Member of Political party
7. Member of Religious 8. Village Development Committee
Member 9. School Committee member 10. Volunteer teacher 11. Women’s group leader 12. Volunteer on health 13. Others (Specify) ______________

134
Literacy Test
6. Can you read or write? (Select one option; if neither go to Q10)
1. Read only 2. Write only 3. Both read 0. Neither read nor write
7. If you read, would you mind reading aloud an SMS text messages? (If yes go to 16)
1. Yes 0. No
8. Readability Observation (If pass go to Q10)
Score 1. Pass 0. Fail
9. If a fail, Who assist you to read the messages? (Select one or more options)
0. None 1. Spouse 2. Children 3. Friends
5. Household members 6. Neighbors 7. Teachers 8. Others (Specify)
Section B: Farm Characteristics
10. How long have you been farming? (Write down the number of years)
__________________________ (years)
11. What is your main reason for farming? (Select only one option)
1. Food 2. Cash 3. Other (Specify): _____________________________
12. What is the total land size of your farm? (Write down the total land size)
No. Parcels Area (Acres) No. Parcels Area (Acres)
1. 4.
2. 5.
3. Total

135
13. What is your major farming enterprise? (Select one) (If selected both (3) go to Q 15)
1. Crop production 2. Livestock production
3. Both 4. Others (specify):_______________
14. What have been your major crops enterprises for the past three seasons? (Select one or more options and indicate the land size grown per year)
Types of cropping systems S=Sole cropping I=Intercropping
Name of Crop: Area Grown (Acres):
Cropping System
Name of Crop: Area Grown (Acres):
Cropping System
1. Tobacco: 2. Maize: 3. Groundnuts 4. Soybean 5. Common bean 6. Cowpeas
________ ________________________
________
S/I
S/I
S/I
S/I
7. Cassava 8. Sunflower 9. Dimba crops 10. Fruit orchards 11. Others
(Specify: ___
________________________________
________
S/I
S/I
S/I
S/I
15. From the list above, which is the major crop enterprise? (Write down the response)
16. What have been your major types of livestock reared for the past three seasons? (Select one or more option and indicate the total number of livestock raised in three seasons)
Type Number Type Number
1. Dairy cattle 2. Beef cattle 3. Goats 4. Sheep 5. Pig 6. Donkeys
___________ ___________ ___________ ___________ ___________ ___________
7. Chickens 8. Ducks 9. Rabbits 10. Guinea pigs 11. Guinea fowl 12. Other (Specify):__
__________________________________________________ __________
17. From the list above, which is the livestock enterprise? (Write down the response)

136
Section C: Socio-Economic Characteristics
18. What is your primary source of income? (Select one option)
1. Selling crop produce 2. Selling livestock 3. Casual labor 4. Renting out land
5. Small business 6. Regular salary/wages 7. Others specify:
_________________________
19. How much money do you make in a year? Malawi Kwacha (MK)____________________________
20. What type of valuable assets do you have? (Select one or more options)
Asset No./ House Asset No./ House
1. Radio 2. Television set 3. Mobile phone 4. Bick house roofed
& Iron sheet 5. Bicycle 6. Moto bike 7. Ox-carts 8. Cars 9. Axes
____________________ __________ ____________________ ____________________ ____________________
10. Hoes 11. Ploughs 12. Wheel burrows 13. Treadle pump 14. Motorized pumps 15. Water cane 16. Sickle 17. Panga knife Other (Specific): ______
____________________ ____________________ ____________________ ____________________ __________
Section D: Mobile Phone Technology
21. Do you have a mobile phone? (Select only one option)
1. Yes 2. No
22. If more than one, how many phones do you have? (Indicate the number)
____________________________
23. What is the brand name(s) of the mobile phone(s)? (Indicate the brand name of the phones used most)
1. ________________ 2. ________________ 3. _________________

137
24. Which category of mobile technology is the handset? (Read out the options and select one)
1. Basic cell phone 2. Mid-range phone
3. Smartphone 4. Others (Specify): ____________
25. What are the functionalities or applications does your mobile phones have? (Select one or more options)
1. Voice Call 2. SMS text message 3. Multimedia player 4. Bluetooth 5. Personal Digital Assistance 6. Radio FM 7. MMs
8. Wi-Fi 9. Phone camera 10. GPS 11. Expandable memory 12. Internet 13. Social media apps 14. Other (Specify):_____________
Mobile functionalities 1 2 3 4 5 6 7 8 Reasons
26. How often do you use the mobile phone’s functionalities mentioned in 26? (Check a column number with selected options from below)
Scoring Scale 1=never, I don’t use 2=once per month 3=two to three times per month 4=once a week 5=two to three per week 6=once a day 7=two to three times per day 8=more than four times per day
1. Voice Call
2. SMS text message
3. Multimedia player
4. Multi-recorders
5. Bluetooth
6. MMS
7. Wi-Fi
8. GPS
9. MMS
10. Phone camera
11. Expandable Memory
12. Internet
13. Social media apps
14. Other (Specify):

138
27. How did you acquire your handset (Select one or more options)
1. Gift for a relative 2. Purchased 3. Given by an organization 4. Others (Specify)
28. Which mobile network(s) did you subscribe to? (Select one or more options)
1. Airtel 2. TNM 3. Access Mobile 4. Others (Specify): _________________________________
29. Which one do you prefer and why? (Select one or more options)
Preferred Mobile Network Reasons
1. Airtel 2. TNM 3. Access Mobile 4. Others (Specify)
____________________________________________________________________________________________
Section E: Farmer’s Access to Mobile Agricultural Information Services (MAIS)
30. Have you received any agricultural information on mobile phone in the past three months? (If no, go to Q35)
1. Yes 0. No
31. Who were the sources of agricultural information that you received on mobile phone? (Select one or more options)
1. Extension agents 2. Agro-dealers 3. Lead-farmers 4. Processors
5. Family or friends 6. Researchers 7. NGOs 8. Others (Specify): ______________
32. Do you know the institutions providing mobile phone agricultural information services in your area? (If no, go to Section H, Qn.54)
1. Yes 0. No

139
33. What are the names of the institutions providing MAIS? (Select one or more options)
1. Ministry of Agriculture (DAES)
2. Malawi Agricultural Commodity Exchange (MACE)
3. Tobacco Association of Malawi (TAMA)
4. Market Links
5. Malawi Milk Producers Association (MMPA)
6. Land O-Lakes 7. NASFAM 8. Concern World Wide 9. Airtel 10. TNM 11. Others (Specify) ____________
34. What are the names of the MAIS (Select one or more options)
1. Esoko 2. 3-2-1 3. ACE Mobile Market Information Service 4. Membership SMS texts messages 5. Organizational Websites 6. Others (specify): _________________________
35. How did you learn about mobile agricultural information services? (Select one or more options)
1. Extension Agent 2. MAIS Representative 3. Friends 4. Family 5. Farmer meetings
6. Agro-dealers 7. Radio 8. TV 9. Newspapers 10. Other (Specify):
___________
36. Did you subscribed to any SMS text services? (Select one option) [If no, go to Q 42]
1. Yes 0. No
37. Mention the name(s) of SMS text messaging platform? (Write down the name)
38. How did you join SMS platform? (Select one or more options)
1. Extension Agent 2. Lead farmers 3. MAIS Representative 4. Friends 5. Family
7. Radio 8. Agro-dealers 9. Mobile phone 10. TV 11. Other (Specify): __________

140
39. What type of information did you accessed through SMS text messaging? (Select one or more options)
Information on crops Information on Livestock
1. Reminder on field activities 2. Soil fertility management 3. Crop varieties 4. Fertilizer application rates 5. Types of fertilizer 6. Pest and disease
management 7. Alerts of outbreak of pest
and diseases 8. Weather updates 9. Market prices 10. Crop insurance cover 11. Transport system 12. Irrigation practices 13. Field management 14. Financing 15. Others (Specify)________
1. Reminders of daily activities 2. Housing of livestock 3. Improved breeds 4. Controlled breeding
programming 5. Pest and disease management 6. Outbreaks of pest and diseases 7. Pasture management 8. Market prices 9. Livestock insurance cover 10. Transport systems 11. Banking and financing
services 12. Livestock distribution system 13. Others (Specify)___________
40. Did you pay for SMS text message services? (Select one or more options)
1. Yes 0. No
41. How much did you pay for SMS text services? (Write down the response)
42. Did you have any challenges concerning SMS text message services? (Select one or more options)
1. Yes 0. No
43. Did you subscribed to any Integrated Voice Response (IVR) services? (Select one option) [If no, go to Q 60 ]
1. Yes 0. No
44. Mention the name(s) of Integrated Voice Response (IVR) platform? (Write down the response)
45. How many times did you use IVR services? (Write down the response)

141
46. How did you join IVR platform? (Write down the response)
1. Extension Agent 2. Lead farmers 3. MAIS Representative 4. Friends 5. Family
7. Radio 8. Agro-dealers 9. Mobile phone 10. TV 11. Other (Specify): ___________
47. What type of information did you accessed through SMS text messaging? (Select one or more responses)
Information on crops Information on Livestock
1. Reminder on field activities 2. Soil fertility management 3. Crop varieties 4. Fertilizer application rates 5. Types of fertilizer 6. Field pest and disease
management 7. Alert of outbreak of pest and
diseases 8. Weather updates 9. Market prices 10. Crop insurance cover 11. Transport system 12. Irrigation practices 13. Field management 14. Financing 11. Others (Specify): ________
1. Reminders of daily activities 2. Housing of livestock 3. Improved breeds 4. Controlled breeding
programming 5. Pest and disease management 6. Outbreaks of pest and diseases 7. Pasture management 8. Market prices 9. Livestock insurance cover 10. Transport systems 11. Banking and financing
services 12. Livestock distribution system 13. Others (Specify) ):
_________________________
48. Did you pay for IVR messaging services? (Select one response)
1. Yes 0. No
49. How much did you pay for IVR services? (Write down the figure)
(MK)__________________________
50. Were you satisfied with IVR messaging services and why? (Write down the response)
51. Do you know other mobile information service apart from agricultural ones? (Select one option)
1. Yes 0. No

142
52. What are the types of other mobile information services? (Select one or more responses)
1. Mobile Banking 2. Mobile Insurance 3. Mobile Health 4. Sports massaging
5. Weather services 6. Mobile web-based services 7. Membership 8. Others (Specify):
_________
53. How did you know about other mobile agricultural information services? (Select one or more responses)
1. Extension Agent 2. Lead farmers 3. MAIS Representative 4. Friends 5. Family 6. Radio
7. Agro-dealers 8. Mobile phone 9. TV 10. Other (Specify):
______________________
54. Did you join the membership of other mobile phone services? (Write down the response)
1. Yes 0. No
55. What are the names of services joined? (Write down the response)
____________________________________
56. How did you register for the services? (Select one of more responses)
1. Mobile Service Representative
2. Mobile phone
4. Web-based registry 5. Others (Specify):
__________
57. Did you access agricultural information through alternative channels of communication? (Select one response)
1. Yes 0. No
58. Which alternative form of communication did you access agricultural information? (Select one or more responses)
1. Face to face 2. Radio 3. TV 4. News papers
5. Computer 6. Internet 7. Others (Specify):
__________

143
59. What type of information did you access through alternatives channels? (Select one or more responses)
1. Reminders of activities 2. Conservation practices 3. Soil management 4. Pest and disease outbreaks 5. Alerts on weather 6. Crop varieties 7. Fertilizers 8. Pesticides 9. Processing and Utilization
10. Livestock management 11. Mobile Banking 12. Commodity prices 13. Climate change 14. Agricultural Insurance 15. Transport alternatives 16. Farming Business
Management 17. Irrigation 18. Other (Specify):_________
60. Who were the sources of alternative information? (Select one or more responses)
1. Extension agents 2. Lead farmers 3. Agro-dealers 4. Friends 5. Family
6. Broadcasters 7. Researchers 8. Non-Governmental
Organization 9. Others (Specify):________

144
Section J: Farmers Perceptions on Motivations
61. To what extent do you agree with the following statements on the use of mobile agricultural information services: Not at all A little Somewhat Quite a bit Absolutely
i. Mobile agricultural information services can be used to provide useful agricultural information.
1 2 3 4 5
ii. Mobile agricultural information services can be used to provide appropriate advisory services.
1 2 3 4 5
iii. Mobile agricultural information services would be providing trustworthy information.
1 2 3 4 5
iv. Mobile agricultural information services would be a convenient way of getting any type of agricultural information when needed.
1 2 3 4 5
v. Mobile agricultural information services would provide a two-way interaction between farmers and information sources.
1 2 3 4 5
vi. Mobile agricultural information services would be a reliable source of complex information.
1 2 3 4 5
vii. Mobile agricultural information services would be the way to validate the information from multiple sources.
1 2 3 4 5
62. To what extent do you agree with the following statements on costs-benefits of mobile agricultural information services: Not at all A little Somewhat Quite a bit Absolutely
i. Mobile phones are less expensive way of getting agricultural information. 1 2 3 4 5
ii. Mobile phones would increase the frequency of getting the information. 1 2 3 4 5
iii. Mobile agricultural information services would save time of sourcing the new information.
1 2 3 4 5
iv. Mobile agricultural information services would improve my decision making for my farm.
1 2 3 4 5

145
v. Mobile agricultural information services would help me expand my information-sharing network.
1 2 3 4 5
vi. Mobile agricultural information services would improve linkages with local and external markets.
1 2 3 4 5
vii. Mobile agricultural information services would increase my productivity. 1 2 3 4 5
viii. Mobile phones would improve the rural livelihood. 1 2 3 4 5
Section I: Farmer’s Challenges on the Access MAIS
63. Do you have any challenges accessing mobile agricultural information services? (If no, go to Qn. 55)
1. Yes 0. No
64. If yes, what challenges do you face accessing mobile agriculture information services? (Select one or more options)
1. Lack of electricity 2. Poor Network
coverage 3. Additional costs 4. Financial resources 5. Digital skills 6. Lack of awareness
7. Language on the technology
8. Illiteracy 9. Up-to date information 10. Privacy and security 11. Others (Specify)
____________________

146
65. Which one do you consider to be the most significant challenge? (Assign a rank to the option given)
Option Rank Reasons
1. Lack of electricity 2. Poor Network coverage 3. Lack of awareness 4. Financial resources 5. Digital skills 6. Language on the
technology 7. Illiteracy 8. Up-to date information 9. Others (Specify): _____
________ ________ ________________ ________ ________ _____________________
_____________________________ _____________________________ ________________________________________________________________________________________________________________________ ____________________________________________________________
66. What should be done to deal with the indicated challenges? (Write down the reasons in the next column)

147
Section F: Farmer’s Agricultural Information Needs and Means of Access
67. Do you have any specific agricultural information needs to help you in farming? (Select one options) (If no, go to section F, Q69)
1. Yes 0. No
69. If yes, what type of information would you need? (Select one or more options from crops and livestock)
Crops Information Livestock Information
1. Reminder of activities 2. Crop varieties 3. Land preparation 4. Soil fertility management 5. Field crop management 6. Conservation Agriculture 7. Types of fertilizers 8. Pest and disease management 9. Fertilizer application rate 10. Post-harvest management 11. Processing and utilization 12. Output market prices 13. Input market prices 14. Weather information 15. Climate change 16. Irrigation practices 17. Nursery management 18. Agri-business management 19. Financial services 20. Other (Specify):
_____________________
1. Improved livestock breeds 2. Livestock management 3. Housing and construction 4. Feeds and feeding 5. Parasite and disease management 6. Alert on pest and disease outbreaks 7. Controlled breeding techniques 8. Marketing of livestock’s 9. Livestock insurance 10. Transportation systems 11. Other (Specify):
_______________________

148
70. What is the main type of information need on crops and or livestock production? (Write down one or more responses)
Crop Information Livestock Information
71. When would you need agricultural information most? (Select one options)
Crop information Livestock information
1. All the time 2. Before season
commencement 3. During the season 4. At the end of the season 5. On specific Operation 6. Other (Specify):
_________
1. All the time 2. Before enterprising 3. Mid-season 4. End-season 5. On special Other (Specify):
______________
72. What would be the main communication channel for you to get access agricultural information? (Select one or more options)
1. Face to face 2. Radio 3. Television 4. Mobile phone 5. CDs and DVDs
6. Computers 7. Internet 8. Newspapers 9. Other (Specify) _____________
73. What is your best channel for accessing agricultural information? (Rank from the best to the least option)
Option Rank Option Rank
1. Face to face ________ 2. Radio ________ 3. Television ________ 4. Mobile phone ________ 5. CDs and DVDs ________
6. Computers _________ 7. Internet _________ 8. Newspapers _________ 9. Other (Specify) _________
_____________
74. How many times do you needed to access information during a period of one month? (Write number of times farmers need information per month)
75. Do you really need the information timely? (If yes, go to Section G, Qn. 84)
1. Yes 0. No

149
76. If yes, why? (Select one options)
77. Do you like to pay for the mobile agricultural information services (MAIS)? (Select one response)
1. Yes 0. No
78. Why would you pay or not pay for MAIS? (Write down one or more responses)
79. What are the suggested fees for each form of communication of MAIS? (Select one or more responses and write down the payment modes)
Communication Format Amount Payment mode
1. Voice Calls 2. SMS Text messages 3. Integrated Voice 4. Audio files 5. Podcast 6. Videos 7. MMS 8. Mobile internet 9. Others (Specify)
_______________ _______________ _______________ _______________ _______________ _______________ _______________ _______________ ______________
_________________ _________________ _________________ _________________ _________________ _________________ _________________ _________________ ________________

150
Section H: Farmers’ Suggestions and Opinion
80. Do you have any suggestion on how to improve mobile agricultural information services? (Select one option)
1. Yes No
81. What improvements would you like to see on mobile agricultural information services being offered? (If no that is the end of the interview)
82. If yes, which mobile phone channel would be most appropriate for you to access mobile agricultural information services? (Select the one or more options, rank the responses and give reasons)
Option Ranking Reasons
1. Voice Calls 2. SMS text
messages 3. MMS 4. Videos files 5. Audio files 6. Emails 7. Photos 8. Others (Specify):
_______________________________________________________________ __________________
_______________________________________________________________________________________________________________________________________________________________________________________________________________________________________________________________________________________
83. Do you have any comment or question relating to this study?
Ending remarks: Thank you for taking part in this survey. Your contribution will assist us to improve the quality of agricultural extension services in Malawi.

151
APPENDIX C: Maps for Study Location
Source: Nations Online Project, 2009.
Figure 5, Map of Malawi with 28 Districts

152
Source: District Assemble Report, 2001 (pp,) Figure 6, Map of Extension Planning Areas in Lilongwe District

153
APPENDIX D: Extra Results
Table 58
Responses on land size allocated to crops grown in acres
Statistical
Crops Extension Planning Area (EPA)
Total Mpingu Mitundu
N Mean SD N Mean SD N Mean SD
Maize 149 1.54 1.13 141 1.82 1.00 290 1.67 1.08
Tobacco 9 1.00 0.43 77 1.39 0.99 86 1.39 0.95
Ground nuts 120 0.87 0.48 123 1.17 0.71 243 1.02 0.62
Soybean 49 1.00 0.62 72 1.12 0.67 121 1.06 0.65
Common beans 10 0.88 0.49 7 1.21 0.57 17 1.05 0.53
Dimba crops 17 1.00 0.46 36 0.99 0.69 53 1.00 0.62
Cowpeas 3 0.83 0.29 0 0.00 0.00 3 0.83 0.29
Sweet potato 8 0.59 0.27 6 0.75 0.27 14 0.66 0.27
Bambara nut 1 0.50 0.00 1 0.50 0.00 2 0.50 0.00
Pop corn 0 0.00 0.00 1 0.50 0.00 1 0.50 0.00
Note: Means and standard deviation are in acres.

154
Table 59
Participating farmers employed cropping system
Crop Cropping system Extension Planning Area (EPA)
Total Mpingu Mitundu
Frequency Percent (%)
Frequency Percent (%)
Frequency Percent (%)
Tobacco
Sole cropping 9 100.00 75 98.68 84 98.82
Irrigated 0 0.00 1 1.32 1 1.18
Total 9 100.00 76 100.00 85 100.00
Maize
Sole cropping 132 89.79 132 92.96 264 92.31
Inter-planting 15 10.20 7 4.92 19 6.64
Irrigated 0 0.00 3 2.11 3 1.05
Total 147 100.00 142 100.00 286 100.00
Ground nuts
Sole cropping 113 94.95 121 100.00 234 97.50
Inter-planting 6 5.04 0 0.00 6 2.50
Total 119 100.00 121 100.00 240 100.00
Soybean
Sole cropping 32 66.67 60 85.71 92 77.97
Inter-planting 16 33.33 10 14.29 26 22.03
Total 48 100.00 70 100.00 118 100.00
Common beans
Sole cropping 3 42.85 5 71.43 8 57.15
Inter-planting 4 57.14 2 28.57 6 42.86
Total 7 100.00 7 100.00 14 100.00
Cowpeas Sole cropping 3 100.00 0 0.00 3 100.00
Dimba crops
Sole cropping 1 8.33 0 0.00 1 2.78
Inter-planting 5 41.67 11 45.83 16 44.44
Irrigated 6 50.00 13 54.17 19 52.78
Total 12 100.00 24 100.00 36 100.00
Note: Multiple response results. Sole cropping = single cropping system. Inter-planting = more crops planted in a field. Dimba cropping = small-scale irrigated land along riverbanks.

155
Table 60
Participant farmers’ mean distribution for main livestock
Statistics
Livestock Extension Planning Area (EPA)
Total Mpingu Mitundu
n Mean SD n Mean SD N Mean SD
Chickens 118 11.49 10.40 123 13.39 12.00 241 12.46 11.30
Goats 76 3.18 1.90 89 3.84 2.60 165 3.54 2.30
Pigs 39 4.41 2.70 48 4.88 4.00 87 4.67 3.50
Beef Cattle 4 3.25 1.90 22 3.27 1.90 26 3.27 1.70
Pigeons 6 21.00 20.80 8 28.25 20.79 14 25.14 20.30
Duck 6 2.50 1.90 3 3.00 1.00 9 2.67 1.60
Sheep 5 2.80 2.10 4 3.75 2.40 9 3.22 2.10
Dairy Cattle 3 5.00 2.90 4 2.50 1.30 7 3.71 2.40
Donkeys 2 3.00 1.41 4 2.75 0.50 6 2.83 0.753
Fish 0 0.00 0.00 1 200.00 0.00 1 200.00 0.00 Note: N = total number of livestock n = total frequency of farmers per EPA

156
Table 61
Participant farmers’ possession of various assets
Categories Household assets
Extension Planning Area (EPA) Total (N=291)
Mpingu (n=149) Mitundu (n=142)
Frequency Percent (%)
Frequency Percent (%)
Frequency Percent (%)
Information & Communication Technologies (ICT)
Mobile phones 149 100.00 142 100.00 291 100.00
Radio 99 66.44 122 85.92 221 75.95
TV sets 19 12.75 19 13.38 38 13.06
DVD players 9 6.04 16 11.26 25 8.59
Farm implements and tools
Hoes 139 93.29 136 95.77 275 94.50
Axes 96 64.43 111 78.17 207 71.13
Panga knife 8 5.37 33 23.24 41 14.09
Shovels 4 2.68 27 19.01 31 10.65
Wheelbarrows 16 10.74 11 7.75 27 9.28
Treadle pumps 3 2.01 16 11.27 19 6.53
Slashers 4 2.68 11 7.75 15 5.15
Sickle 1 0.67 15 10.56 16 5.50
Motorized pump 2 1.34 2 1.41 4 1.37
Knapsack sprayers 0 0.00 2 1.41 2 0.69
Transport and mobility
Push bikes 106 71.14 132 92.96 238 81.79
Ox-carts 6 4.03 26 18.31 32 11.00
Motor bikes 10 6.71 17 11.97 27 9.28
Cars 1 0.67 3 2.11 4 1.37
Infrastructure
Brick houses +iron sheets 95 63.76 82 57.75 177 60.82
Solar 2 1.34 8 5.63 10 3.44
Electricity 2 1.34 2 1.41 3 1.03

157
Table 62
Mean distribution of various assets in the study areas
Statistics
House Hold Assets
Extension Planning Area (EPA)
Total Mpingu Mitundu
N Mean SD n Mean SD N Mean SD
Mobile Phones 148 1.51 0.78 141 1.43 0.74 289 1.47 0.76
Radios 98 1.29 0.61 122 1.21 0.53 220 1.25 0.57
TV 19 1.21 0.54 18 1.06 0.24 37 1.14 0.42
DVD players 9 1 0.00 12 1.00 0.00 21 1.00 0.00
Hoes 140 3.67 2.06 136 3.97 2.04 276 3.82 2.05
Axes 96 1.20 0.50 111 1.22 0.46 207 1.21 0.47
Panga knife 8 1.25 0.46 33 1.64 0.96 41 1.56 0.90
Shovel 3 1 0.00 16 1.31 0.48 19 1.26 0.45
Wheel burrow 16 1 0.00 11 1.09 0.30 27 1.04 0.19
Treadle pump 3 1 0.00 7 1.57 1.51 10 1.40 1.27
Slasher 4 1 0.00 11 1.00 0.00 15 1.00 0.00
Sickle 1 1 0.00 15 1.13 0.35 16 1.12 0.34
Motorize pump 2 1 0.00 2 1.00 0.00 4 1.00 0.00
Water canes 4 2 0.82 27 2.41 1.6 31 2.35 1.52
Sprayers 0 0 0.00 2 1.00 0.00 2 1.00 0.00
Push bikes 106 1.36 0.67 132 1.50 0.92 238 1.44 0.82
Ox-carts 6 1 0.00 26 1.08 0.27 32 1.06 0.25
Motor bikes 10 1.1 0.32 16 1.13 0.50 26 1.12 0.43
Car 1 1 0.00 3 1.00 0.00 4 1.00 0.00
Houses + iron sheets 93 1.04 0.20 81 1.17 0.59 174 1.10 0.43
Solar panels 2 1 0.00 8 1.12 0.35 10 1.10 0.32 Note: Multiple response results

158
Table 63
Participant farmers’ types of mobile phone brands Brands of
Mobile Phones
Extension Planning Area (EPA) Total
(N=287) Mpingu (n=147) Mitundu (n=140)
Frequency Percent
(%)
Frequency Percent
(%)
Frequency Percent
(%)
Nokia 55 36.91 83 58.87 138 47.75
iTel 70 46.98 25 17.73 95 32.87
Techno 27 18.12 26 18.44 53 18.34
ZTE 20 13.42 17 12.06 37 12.80
Samsung 15 10.07 21 14.89 36 12.47
Corn 0 0.00 8 5.67 8 2.79
Donado 5 3.36 2 1.42 7 2.42
Huwel 4 2.68 2 1.42 6 2.08
KGTEL 2 1.34 3 2.13 5 1.73
Not known 1 0.67 3 2.13 4 1.38
Vodaphone 2 1.34 1 0.71 3 1.04
Oking 2 1.34 1 0.71 3 1.04
MTN 2 1.34 1 0.71 3 1.04
MTL 1 0.67 1 0.71 2 0.69
Blackberry 1 0.67 1 0.71 2 0.69
G.Five 2 1.34 0 0.00 2 0.69
Smart Profit 1 0.67 1 0.71 2 0.69
ZamTel 2 1.34 0 0.00 2 0.69
MobTel 1 0.67 0 0.00 1 0.35
LG 0 0.00 1 0.71 1 0.35
ForU 1 0.67 0 0.00 1 0.35
Asser 201 0 0.00 1 0.71 1 0.35
Enet 1 0.67 0 0.00 1 0.35
Note: Multiple Response

159
Table 64
Mobile applications available in three mobile categories
Mobile Applications Mobile phone categories Basic phone Mid-range
phone Smart-phone
Voice calling SMS text messaging Personal Digital Device (PDA)
FM Radio Audio players Voice recorders Video players Video recorders Bluetooth IM Camera Bluetooth Internet Memory card slot Social media File manager Mobile app store GPS Wi-Fi
Source: Chisama, 2014

160
Table 65
Respondents’ multiple responses on reasons for preferred Mobile Network Operators
Reasons
Extension Planning Area (EPA) Total
(N=255) Mpingu (n=130) Mitundu (n=125)
Frequency Percent
(%) Frequency Percent
(%) Frequency Percent
(%)
More Friends 36 27.69 44 35.20 80 31.37
Cheaper airtime 28 21.54 19 15.20 47 18.43
Just like it 14 10.77 16 12.80 30 11.76
Quality of network 12 9.23 18 14.40 30 11.76
First service register with 10 7.69 11 8.80 21 8.24
Given that way 11 8.46 7 5.60 18 7.06
Loyalty 10 7.69 8 6.40 18 7.06
Airtime Bonuses 2 1.54 2 1.60 4 1.57
Family members 2 1.54 0 0.00 2 0.78
Meant for one provider 1 0.77 0 0.00 1 0.39
Other network not working 1 0.77 0 0.00 1 0.39
Lost other service number 1 0.77 0 0.00 1 0.39
Airtime Loan Services 1 0.77 0 0.00 1 0.39
Airtime availability 1 0.77 0 0.00 1 0.39
Note: Multiple response results

161
Table 66
Respondents’ multiple responses on topics accessed from additional sources of information
Information offered by other sources
Extension Planning Area (EPA) Total (N=291) Mpingu (n=149) Mitundu (n=142)
Frequency Percent
(%) Frequency Percent
(%) Frequency Percent
(%)
Crop Varieties 28 18.79 40 28.17 68 23.36
Field Management 63 42.28 60 42.25 123 42.27
Livestock Management 21 14.09 32 22.54 53 18.21
Post-harvest management
28 18.79 18 12.68 46 15.81
Market prices 18 12.08 23 16.20 41 14.10
Weather updates 19 12.75 17 11.97 36 12.37
Conservation Agriculture
6 4.03 9 6.33 15 5.15
Input prices 3 2.01 8 5.63 11 3.78
Manure making 1 0.67 10 7.04 11 3.78
Utilization and Value Addition
2 1.34 7 4.93 9 3.09
Agribusiness Management
7 4.70 1 0.70 8 2.75
Irrigation practices 3 2.01 3 2.11 6 2.06
Nursery management 0 0.00 3 2.11 3 1.03
Climate change 2 1.34 0 0.00 2 0.69
Time of planting 2 1.34 0 0.00 2 0.69
Banking Facilities 0 0.00 1 0.70 1 0.34
Irrigation farming 1 0.67 0 0.00 1 0.34
Note: Multiple response results

162
Table 67: Respondents’ mean distribution on motivational reasons for using MAIS
Statistics
House Hold Assets
Extension Planning Area (EPA)
Total Mpingu Mitundu
n Mean SD n Mean SD N Mean SD
Relevance 148 4.81 0.67 140 4.52 1.23 288 4.67 0.99
Appropriateness 148 4.33 1.09 139 4.17 1.20 287 4.24 1.15
Reliability 148 3.99 1.35 140 3.86 1.54 288 3.93 1.44
Timeliness 146 4.45 1.04 140 4.19 1.13 286 4.32 1.09
Two-way interactivity 147 4.35 1.07 140 3.93 1.46 287 4.15 1.29
Complexity 146 3.84 1.41 140 3.98 1.30 286 3.91 1.35
Validity 147 4.34 1.02 139 4.37 2.84 286 4.24 1.17
Less costly 147 4.69 0.89 139 4.37 2.84 286 4.24 1.17
Frequency 145 4.21 0.89 139 3.76 0.96 284 3.99 0.95
Fastness 143 4.57 0.75 138 4.42 1.05 281 4.50 0.91
Decision making 145 4.33 1.04 138 4.31 1.07 283 4.32 1.05
Information sharing 145 3.84 1.15 138 3.20 1.03 283 3.53 1.14
Marketing 147 4.58 0.87 138 4.43 1.17 285 4.51 1.02
Profitability 145 4.50 1.00 136 4.52 1.03 278 4.56 1.00
Livelihood 145 4.65 0.76 133 4.46 1.20 278 4.56 1.00