Embed Size (px)
Citation preview

Farm Sustainability Assessment Report
Dr Harpinder SandhuFlinders University Australia
Quantifying the Social and Environmental Benefits and Costs of Different Production Systems
The Future of Food and Agriculture:
October 2016
Sustainable Food Trust


Farm Sustainability Assessment Report
The future of food and agriculture: quantifying social and environmental benefits and costs of different production systems
Dr Harpinder Sandhu Flinders University AustraliaOctober 2016
Published by the Sustainable Food Trust38 Richmond StreetBristol, UKhttp://sustainablefoodtrust.org

Farm Sustainability Assessment Report | 4
Executive Summary
The current economic and policy environment in the agriculture sector fails to account for various environmental and social benefits and costs. This results in making intensive agricultural systems – dependent on inputs of large amounts of agrochemicals and fossil fuel-based energy – more profitable than sustainable alternatives. What is not accounted for in intensive agricultural systems is the environmental and public health impacts this kind of system causes, the cost of nature’s ‘ecosystem services’ and the social benefit of farms. Without these impacts and costs figured in, it is impossible to determine the ‘true cost’ of varied farming systems.
There is need to assess, monetise and reflect the social and environmental benefits and costs of different production systems for the sustainability of agriculture. Public health impacts, such as antibiotic resistance and the risk it poses to humans and animals through resistant diseases, that are associated with intensive farming systems must be included in future assessments of the sustainability of varied farming systems. Revealing the actual monetary value of the costs and benefits of these can encourage farmers and practitioners to adopt technologies and practices that have less detrimental impacts on human health and the environment. Further, consumers can make informed decisions based on the benefits and costs of different production systems and choose products that have higher environmental and social benefits and less environmental costs.
A conceptual framework and farm sustainability assessment method to determine social and environmental externalities (benefits and impacts) has been developed in this study, which could guide management practices at farm level, raise consumer awareness and influence agriculture policies. Unrecognised environmental and social benefits are generated on some farms and this contributes to natural and social capital. The four farming systems investigated in this study are delivering more positive externalities than negative ones due to the sustainable practices already in place at these farms. There is a need to apply the same methods used here to industrial farming systems such as confined animal feed operations (CAFOs), confined dairy systems and high input farming systems to determine their positive and negative externalities.
The sustainability assessment method developed in this study can supplement wider global assessments investigating the benefits and costs of different farming systems. More studies are required to standardise methodology in order to develop a uniform metric system

Farm Sustainability Assessment Report | 5
that can be used by the food and agriculture industry to develop a standard for farm sustainability or packaging labels for consumers with this vital information. The assessment of environmental and social benefits and costs can help illustrate the long-term sustainability of production systems that supply nutritious food in required quantities without impacting on environment and human health.
Using the new farm sustainability assessment method developed for this study, the following costs were determined:
• A bushel of conventionally produced corn generates environmental benefits worth $0.40, social benefits of $0.60 and has an environmental cost of $1.00 as compared to its farm gate value of $4.00.
• A bushel of conventionally produced soybean generates environmental benefits worth $1.29, social benefits of $1.90 and has an environmental cost of $3.17 as compared to its farm gate value of $10.00.
• A gallon of certified organic milk generates environmental benefits worth $0.08, social benefits of $0.20 and has an environmental cost of $0.25 as compared to its farm gate value of $3.44.
• A pound of Polyface beef, the diversified farm, generates environmental benefits worth $0.70, social benefits of $2.67 and have an environmental cost of $0.63 as compared to its farm gate value of $1.60; a pound of Polyface pork generates environmental benefits worth $0.71, social benefits of $2.70 and have an environmental cost of $0.63 as compared to its farm gate value of $3.67; a pound of Polyface poultry meat generates environmental benefits worth $1.91, social benefits of $7.20 and have an environmental cost of $1.70 as compared to its farm gate value of $3.50; a dozen of Polyface poultry eggs generates environmental benefits worth $3.40, social benefits of $13.00 and have an environmental cost of $3.06 as compared to its farm gate value of $3.75.
• A pound of organic rice generates environmental benefits worth $0.01, social benefits of $0.06 and have an environmental cost of $0.003 as compared to its farm gate value of $0.25.

Farm Sustainability Assessment Report | 6
Acknowledgements
I would like to acknowledge guidance, direction, financial support and data provided by the members of following organisations:
Sustainable Food Trust, UKSustainable Food Alliance, USAGlobal Alliance for the Future of FoodMcKnight Foundation, USAErdahl Family Farm, MNPolyface Farm, VAStraus Family Creamery, CALundberg Family Farms, CABarbara Gemmill-Herren, CA

Farm Sustainability Assessment Report | 7
Table of contents
Executive Summary 4Acknowledgements 61. Introduction 82. Conceptual Framework to Assess Externalities 11 3. Ecological and Economic Methods 134. Corn and Soyabean Farm 175. Dairy Farm Cluster 196. Diversified Farm 217. Organic Rice Farm 238. Conclusions and Recommendations 25References 27Appendix A 28Appendix B 29Appendix C 39

Farm Sustainability Assessment Report | 8
1. Introduction
Current agricultural production systems have been calibrated to maximise return on investment, and utilise large amounts of inputs in terms of agrochemicals and energy (Schutter, 2010; Wratten et al., 2013). However, such production systems often ignore, (i) the contribution of ecosystem functions and services to the production systems, (ii) social aspects of farming, and (iii) the impact of intensive practices on public and environmental health (Pretty et al., 2000). Thus, these systems are increasing financial capital at the expense of both social and natural capital (Sandhu et al., 2015, 2016).
Moreover, the current economic and policy environment also supports such systems by subsidising agriculture with the costs to public and environment health. At the same time, these systems can appear to be more profitable than some of the sustainable alternatives due to the unrecognised and unaccounted costs associated with the previously mentioned damages that they are not being charged for. Therefore, there is need to recalibrate current agricultural systems by understanding, assessing and monetising the social and environmental benefits and costs of different production systems. This information then can be used to influence policies that may favour practices which enhance social and natural capital in agriculture and optimise food production systems.
The social and environmental benefits and costs of agriculture are often termed as ‘externalities’ (Tilman et al., 2001, 2002). These externalities can be divided into two categories – social and environmental. There is increasing recognition of social capital associated with agricultural systems. Typically, it involves the well-being of the farmer, the farming family and farm workers, and also extends beyond the farm gate to rural communities. Production systems may have both positive and negative impacts on the social capital of agriculture. There are production systems that value social capital and enhance it, such as agroecology, organic agriculture and community-based farming. However, some high input/output and industrialised systems have a negative impact on social capital. These industrialised production systems only focus on maximising net returns without considering social capital.
Natural capital includes all natural resources and assets and provides a range of benefits to human society. These benefits are often termed ‘ecosystem services’ (Daily, 1997; Sandhu et al., 2008, 2010, 2015, 2016). For example, biodiversity provides functions such as beneficial insects to control pests, soil biota which aids nutrient cycling, aquifers that provide freshwater and vegetation to regulate the flow of water.

Farm Sustainability Assessment Report | 9
Soil and vegetation also sequester and remove carbon dioxide from the atmosphere.
Agricultural production is an ecological process and it depends on many ecosystem functions and processes to produce food, fibre, milk and other outputs. At the same time, it can have impacts on some ecosystem services, which can then result in the depletion of natural capital. For example, the addition of large amounts of agrochemicals can impact negatively on soil health by affecting nutrient cycling in soil microbes. Agrochemical use also impacts greenhouse gas emissions through its use of fossil fuels. Monocropping can result in a loss of biodiversity and the suppression of natural enemies, as well as problems with surface runoff and the pollution of waterways.
It is well established that different production systems either suppress social and natural capital or enhance them (Sandhu et al., 2008, 2015). However, in the absence of a monetary value on the positive and negative externalities associated with different production systems, it is impossible for this to be reflected in farm or national accounts (UNEP, 2015). Therefore, these social and environmental benefits and costs remain hidden and unnoted in national and global food and agriculture policies. Due to a growing realisation of the social and environmental impacts of food and agriculture amongst consumers, policy makers and the farming and scientific communities, there is a need to better reflect the economic value of all social and environmental benefits and costs associated with different production systems. This monetisation of all externalities can be one way to re-set the economic and policy environment for the future of sustainable food and agriculture production.
The impact on natural resources and biodiversity of the current food and agriculture production system, which has dominated since the second half of the 20th century, has caused global concern. To address some of these concerns and to develop sustainable food and agriculture systems that are less detrimental to public and environmental health and which promote social and natural capital, efforts at a global level are being increased. One such initiative that is widely known is The Economics of Ecosystems and Biodiversity for Agriculture and Food (TEEB AgFood; UNEP, 2015) project primarily driven by the United Nations Environment Program. This initiative advocates an ”eco-agri-food” lens through which to examine and include all externalities in agriculture production systems. It aims to reflect the economic value of a range of inputs from nature, including nutrient cycling, pollination, freshwater flow, biological pest control, and others identified as ecosystem services (Daily, 1997; Costanza et al., 1997). Despite their immense value, these clear benefits are not typically accounted for in market transactions and are

Farm Sustainability Assessment Report | 10
consequently viewed as ”invisible” in economic terms.
The economic invisibility of these ecosystem services often leads to the degradation of ecosystems, with serious human and environmental costs. Unfortunately, there are very few incentives for farmers to maintain these ecosystem services eventhough they are vital to farm productivity. Instead, farmers tend to be rewarded on the basis of agricultural intensification and the expansion of agricultural land, both of which favour short-term gains. Maintaining healthy ecosystems and enhancing ecosystem services on farms – such as sequestering carbon, enhancing biological controls, managing crop residue and other ecosystem services – do not tend to generate direct income for farmers. Recognising these ecosystem services and demonstrating their economic value at farm and industry level, is the core value proposition of the TEEB AgFood project.
Drawing on the framework developed by the TEEB AgFood project to examine agricultural systems with an “eco-agri-food” lens, the current study aims to assess and monetise all positive and negative externalities associated with four production systems in the US – a conventional corn/soybean system in Minnesota, an organic dairy production system based in California, a diversified livestock system in Virginia, and organic rice farms in California.
A case study approach is used in the current work. This report comprises seven sections:
(i) an introduction that provides the background of and rationale for the study;
(ii) a conceptual framework developed to describe all externalities in terms of ecosystem services, using the concept of social and natural capital;
(ii) details about the ecological and economic methods used to evaluate all externalities;
(iv - vi) and case studies of the four production systemswith detailed descriptions and an assessment of their social and environmental benefits and costs, which are then presented in monetary units; (vii) a conclusion that provides recommendations for future research in development of sustainable agriculture and food systems.

Farm Sustainability Assessment Report | 11
2. Conceptual Framework to Assess Externalities
There are negative and positive externalities in agriculture, which are not accounted for by current policy and market environment, and thus they remain ‘invisible’ in the farm economy. Moreover, the dependency of agricultural production on healthy ecosystems is not being recognised either. These information gaps need to be filled to provide the right incentives for managing agricultural systems for productivity and environmental sustainability (UNEP, 2015). Therefore, the overarching aim of this study is to asses and highlight the economic value of all externalities at farm level.
The conceptual framework developed in this study to assess externalities is rooted in the economic and ecological theory of ecosystem services (Figure 1). Ecosystem services are typically classified into four categories – provisioning, regulating, supporting and cultural services (MEA, 2005; Wratten et al., 2013). Drawing from the description of these ecosystem services associated with agriculture, the framework used in this study is modified to include social, economic and natural capital. It classifies provisioning services as production benefits or outputs, for example production of milk, grains and meat. Regulating and supporting services are grouped into environmental benefits, whereas cultural services provide social benefits. Similarly, ecosystem disservices are grouped under an environmental and social impacts category and they result in environmental costs (see Appendix A for details on definitions and examples).
Although ecosystem services are critical to the productivity and health of agricultural production systems, they are often invisible in the economic choices we make (UNEP, 2015). Market prices paid for farm produce cover the cost of inputs such as seeds, fertilisers, and pesticides, but not the value of bees pollinating crops, or micro-organisms cycling nutrients into the soil, the lack of which can cause crops to fail. Likewise, agricultural producers are typically neither fined for causing negative externalities, such as pesticide run-off or soil erosion, nor rewarded for positive ones, such as ensuring groundwater recharge through farm vegetation or preserving scenic rural landscapes. These invisible costs and benefits are missing as key inputs into the economic system in which farmers and policy makers operate, creating a skewed and incomplete picture. The framework developed in this study recognises and captures the economic value of these invisible benefits and costs.

Farm Sustainability Assessment Report | 12
Figure 1 Conceptual framework to assess externalities at farm level. Environmental and social benefits are the benefits generated on the farm and they contribute to natural and social capital, respectively. Environmental benefits comprise regulating and supporting ecosystem services, whereas social benefits include cultural ecosystem services. Environmental costs comprise damage to environment and human health. Arrows indicate the flow of inputs and outputs (production benefits) from the farm. Broken arrows indicate those ‘invisible’ benefits and costs that are not accounted for in current agriculture.
Social benefits
Social capital
Cultural services
Environmentalbenefits
Natural capital
Regulating servicesSupporting services
EnvironmentalCosts
Impacts on human health
EnvironmentalCosts
Impacts on environmental
health
Outputs
FoodFibreMeat
Inputs
IrrigationPesticideFertiliser
Farm

Farm Sustainability Assessment Report | 13
3. Ecological and Economic Methods
This study focuses on monetising externalities which are divided into four categories – production benefits and their market value, environmental benefits, social benefits and environmental costs. Four farms are selected to carry out the assessment – a conventional corn and soybean farm, an organic dairy farm cluster (comprised of four individual dairy farms), a diversified livestock farm (Polyface Farm) and organic rice farms.
A farm survey has been designed to collect information on various aspects of each case study farm. Typically, it comprises information on the location, size and type of farm and includes all inputs and outputs. The data is used to develop a profile of each case study farm.
This data is then used to estimate the value of production benefits, environmental benefits, social benefits and environmental costs for each farm types (Equation 1; see Appendix C for details).
TC=(Pv+ Eb+ Sb) - Ec Equation 1
TC=True cost $ per acrePv=Production value $ per acreEb=Environmental benefits $ per acreSb=Social benefits $ per acreEc=Environmental cost $ per acre
Production valueEach farm produces a particular commodity which is recorded from the farm data for the production year 2015 (quantity Pq and value Pv, $ per acre). Its market value at farm gate (price that farmer gets at the farm gate) is obtained from the farm records in US dollars (year 2015).
Pq=∑(Pq1 + Pq2 ... ... ... Pqn ) Equation 2
Pv=∑(Pv1 + Pv2 ... ... ... Pvn ) Equation 3
Environmental benefitsThese include ecological processes that are generated by agriculture production system. In this study, following benefits were assessed and

Farm Sustainability Assessment Report | 14
valued (see Appendix C for details).
Eb=∑(Eb1 + Eb2 ... ... ... Ebn ) Equation 4
1. Water regulation: Crop and livestock consumes water in form of evapotranspiration by the crops and pastures (Equation 2). Deep drainage (water stored in soil profile) = Total Water input (rainfall and irrigation) – (Wateruse by crops and pastures + Runoff) Water recharged into soil profile is estimated using above equation and valued from the market price of irrigated water at each site ($0.006 per gallon).
2. Carbon sequestration by soil and vegetation: Both above ground and below ground vegetation captures carbon in the field. This is estimated from amount of soil carbon sequestered annually under different crops and pastures and value obtained from the carbon price in market ($15 per metric tonne).
3. Nitrogen fixation: It differs under different cropping systems, is estimated by the amount of nitrogen fixed, and is valued at the market price of nitrogen ($0.30 per kg).
4. Nutrient cycling: Nutrient cycling differs under different management practices. Its value is obtained from the amount of nutrients made available after breakdown of organic matter and is valued at the price of nutrients in market (nitrogen, $0.30 per kg; phosphorus $0.16 per kg; potassium $0.24 per kg).
5. Soil erosion control: Permanent pastures prevents soil erosion (as compared to bare soil) which is compared with crop cover. Soil replacement cost is estimated from the market price of topsoil ($50.3 per acre).
6. Biological control of pests/diseases: Different management practices use natural pest control of pests and disease and thus avoid cost of pesticides. Biological control of animal disease ($14.37 per acre) is attributed to those systems that enhance biological control.
Environmental costsIt includes damage to human health and environment. There are various practices used in pastures and cropping systems that are detrimental to the environment. Following categories are assessed and valued in each of four farm types (see Appendix C for details).

Farm Sustainability Assessment Report | 15
Ec=∑(Ec1+ Ec2 ... ... ... Ecn) Equation 5
1. Green house gas emissions: Various inputs such as agrochemicals, tillage practices, use of animal feed, fossil fuel for transportation, enteric fermentation in animals, etc. generate large amount of greenhouse gases. These are assessed as carbon di-oxide equivalents for each farm. There is social cost of carbon that takes into account economic damages associated with a small increase in carbon di-oxide emissions ($42.3 per metric tonne; EPA, 2015). This cost is used to estimate environmental costs associated with each farm.
2. External costs of pesticides and fertiliser used in US agriculture is used to estimate various impacts on human health and environment (Tegtmeier and Duffy, 2004). These are estimated from the annual cost in each category at national level. There is an annual external cost of fertiliser use ($0.41 per kg) and pesticides use at $46.03 per kg of active ingredient used. These costs are then calculated for each category as a cost per acre and considered in each of the four case study sites depending upon crops or livestock operations. These include following categories:
• Damage to water resources: It includes facility infrastructure needs for nitrate and pesticide treatment.
• Damage to soil resources: This includes soil sediments accumulated in water ways and cost to water industry, cost to replace lost capacity of reservoirs, water conveyance cost, flood damages, damages to recreational activities, cost to navigation due to shipping damages, dredging, in stream impacts to commercial fisheries, and off stream impacts such as industrial users, steam power plants.
• Damage to air resources: Cost of green house gas emissions from cropland and livestock.
• Damage to ecosystems and biodiversity: It includes honey bee and pollination losses, loss of beneficial predators by pesticides application, fish kills due to pesticides, bird kills due to pesticides and pesticides poisoning.
• Damage to human health: It includes pathogens and pesticides that cause human health issues.

Farm Sustainability Assessment Report | 16
In addition to the categories above, the annual budgets of the government agencies responsible for their management are also included in the calculation of the external costs of US agriculture for crops and livestock. These are US EPA budget for the non-point source programme, US EPA budget for reduce public and ecosystem, USDA budget for natural resources, USDA budget for farm advisory, USDA budget for food safety, USDA plant safety, USDA microbiological data, EPA safe food programme, USEPA programme to reduce public and ecosystem risks, and USDA pesticides data programme.
Social benefitsSocial benefits are the contribution to society and each of the four farm types is assessed and benefits are estimated from below categories (see Appendix C for details).
Sb=∑(Sb1+ Eb2 ... ... ... Ebn) Equation 6
Farm employment: This is considered as a social benefit of the production system. Data from farm survey is used to calculate annual employment generation per acre.Recreation: Many farms provides opportunities for ecotourism and recreation by offering farm tour and hence provide recreational benefits to wider community. Data from farm visits and amount charged is used to estimate recreational benefits. Education: Knowledge generated on farm can be disseminated to wider community through books, presentations at conferences etc. Data is collected on such activities at individual farm and is valued on per acre basis.
Above information is then used to calculate environmental and social benefits and environmental cost per unit of commodity (‘i’) using below equations 7, 8 and 9, respectively.
Eb/uniti = Eb1 per acre/ Pqi per acre Equation 7
Sb/uniti = Sb1 per acre/ Pqi per acre Equation 8
Ec/uniti = Ec1 per acre/ Pqi per acre Equation 9
where,
Eb/uniti =Environmental benefit of commodity ‘i’Sb/uniti=Social benefits of commodity ‘i’Ec/uniti =Environmental cost of commodity ‘i’
Farm Sustainability Assessment Report | 17
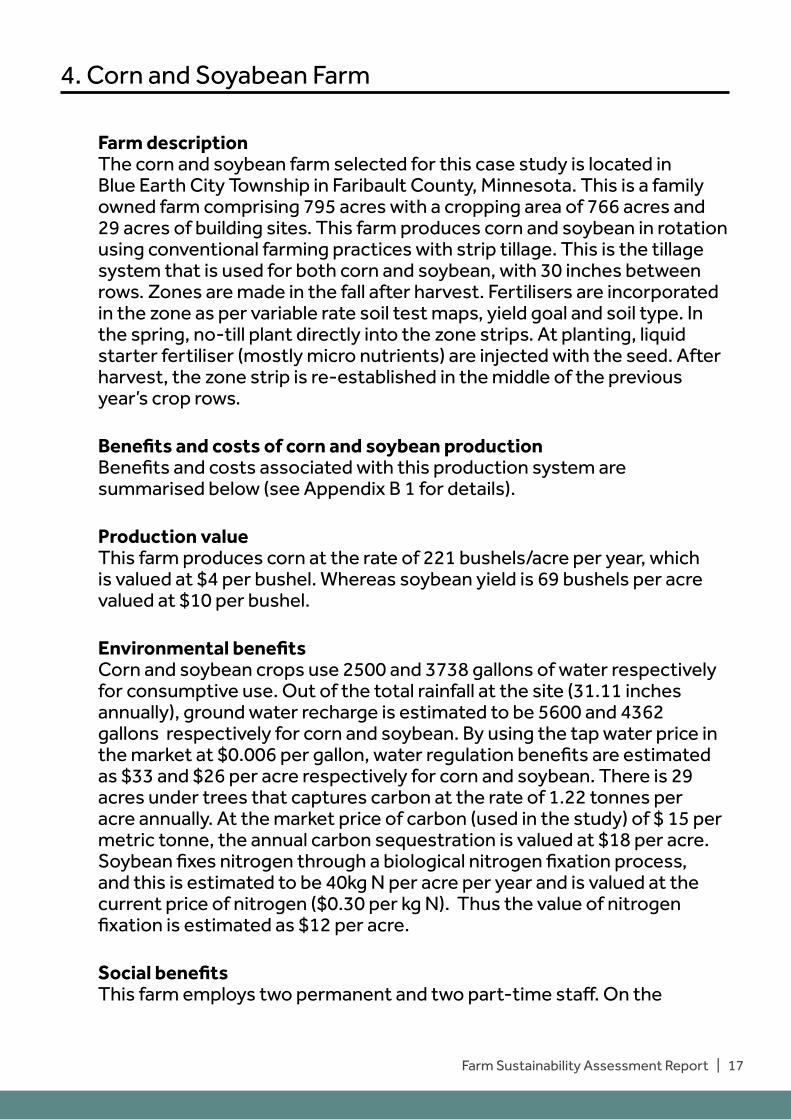
4. Corn and Soyabean Farm
Farm description The corn and soybean farm selected for this case study is located in Blue Earth City Township in Faribault County, Minnesota. This is a family owned farm comprising 795 acres with a cropping area of 766 acres and 29 acres of building sites. This farm produces corn and soybean in rotation using conventional farming practices with strip tillage. This is the tillage system that is used for both corn and soybean, with 30 inches between rows. Zones are made in the fall after harvest. Fertilisers are incorporated in the zone as per variable rate soil test maps, yield goal and soil type. In the spring, no-till plant directly into the zone strips. At planting, liquid starter fertiliser (mostly micro nutrients) are injected with the seed. After harvest, the zone strip is re-established in the middle of the previous year’s crop rows.
Benefits and costs of corn and soybean productionBenefits and costs associated with this production system are summarised below (see Appendix B 1 for details).
Production value This farm produces corn at the rate of 221 bushels/acre per year, which is valued at $4 per bushel. Whereas soybean yield is 69 bushels per acre valued at $10 per bushel.
Environmental benefitsCorn and soybean crops use 2500 and 3738 gallons of water respectively for consumptive use. Out of the total rainfall at the site (31.11 inches annually), ground water recharge is estimated to be 5600 and 4362 gallons respectively for corn and soybean. By using the tap water price in the market at $0.006 per gallon, water regulation benefits are estimated as $33 and $26 per acre respectively for corn and soybean. There is 29 acres under trees that captures carbon at the rate of 1.22 tonnes per acre annually. At the market price of carbon (used in the study) of $ 15 per metric tonne, the annual carbon sequestration is valued at $18 per acre. Soybean fixes nitrogen through a biological nitrogen fixation process, and this is estimated to be 40kg N per acre per year and is valued at the current price of nitrogen ($0.30 per kg N). Thus the value of nitrogen fixation is estimated as $12 per acre.
Social benefitsThis farm employs two permanent and two part-time staff. On the

Farm Sustainability Assessment Report | 18
basis of the annual wages, it is estimated that it generates employment benefits worth $134 per acre per year.
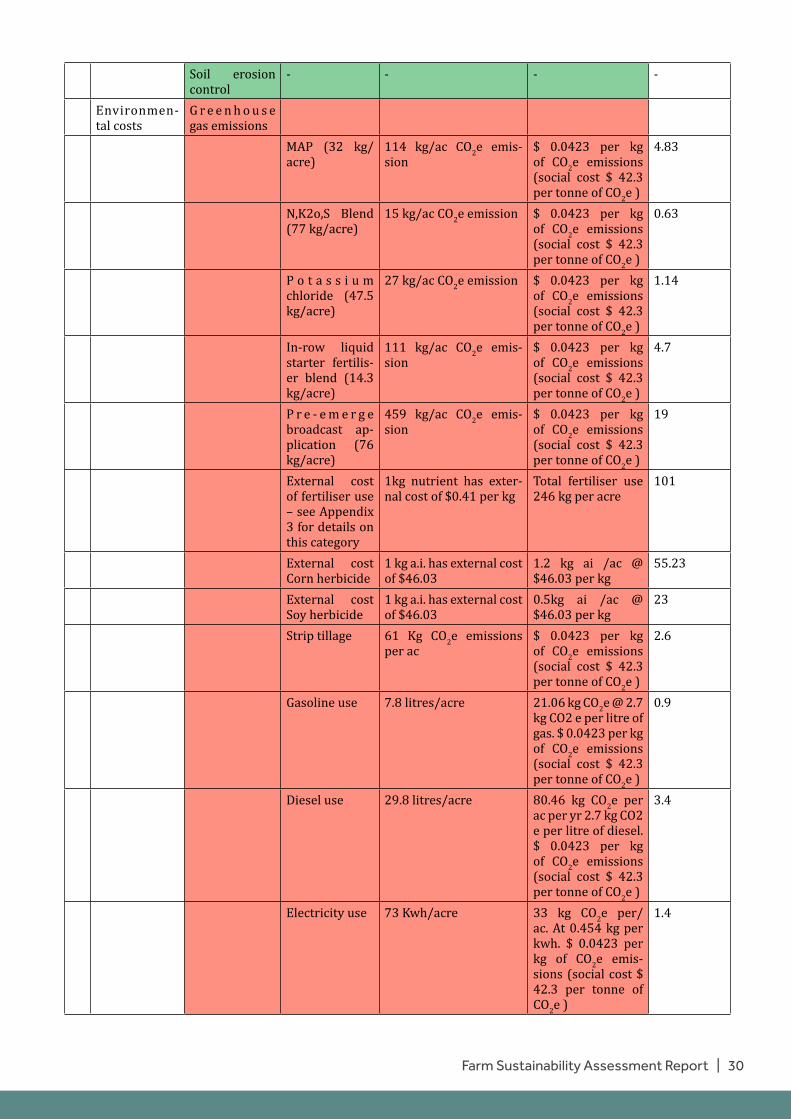
Environmental costsEnvironmental costs in this farm involves greenhouse gas emissions from the use of seed ($1.1 per acre), strip tillage ($2.6 per acre), fertilisers ($30.3 per acre), pesticides ($78.23 per acre), external costs associated with damage to human and environmental health ($101 per acre), transportation fuel ($4.1 per acre) and electricity ($1.4 per acre) used to dry corn. Summary of these values are provided in Table 1.
Table 1. Benefit and costs associated with corn and soybean.
True cost of corn and soybean: Value of production, environmental benefits, social benefits and environmental cost is calculated for each bushel of corn and soybean from the above data (using equations 7-9) and is provided in table 2.
Table 2. Summary of benefits and costs per bushel of corn and soybean.
Corn ($/bushel) Soybean ($/bushel)Production value 4.00 10.00Environmental benefits 0.40 1.29Social benefits 0.60 1.90Environmental cost -1.00 -3.17Net cost 4.00 10.02
Benefits ($/acre/year)
Cost ($/acre/year)
Net ($/acre/year)
Production value – Corn 884Production value – Soybean 690Environmental benefits 89Social benefits 134Environmental cost 219
Farm Sustainability Assessment Report | 19
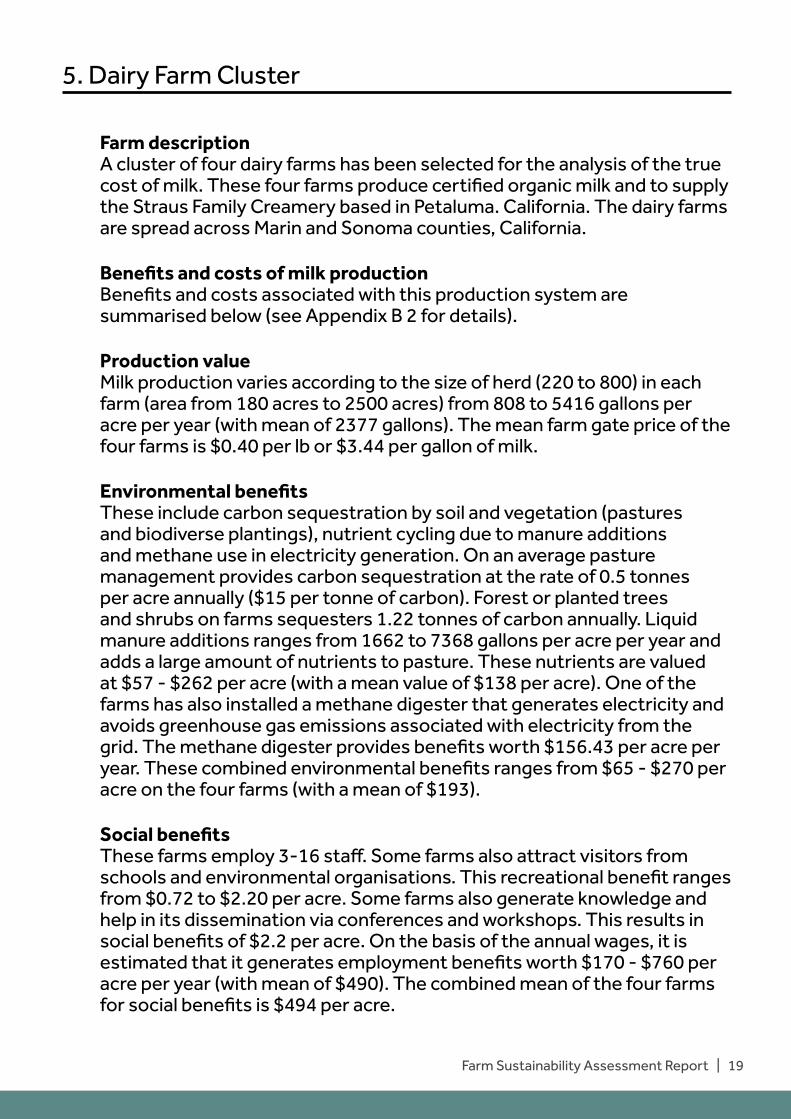
5. Dairy Farm Cluster
Farm description A cluster of four dairy farms has been selected for the analysis of the true cost of milk. These four farms produce certified organic milk and to supply the Straus Family Creamery based in Petaluma. California. The dairy farms are spread across Marin and Sonoma counties, California.
Benefits and costs of milk productionBenefits and costs associated with this production system are summarised below (see Appendix B 2 for details).
Production value Milk production varies according to the size of herd (220 to 800) in each farm (area from 180 acres to 2500 acres) from 808 to 5416 gallons per acre per year (with mean of 2377 gallons). The mean farm gate price of the four farms is $0.40 per lb or $3.44 per gallon of milk.
Environmental benefitsThese include carbon sequestration by soil and vegetation (pastures and biodiverse plantings), nutrient cycling due to manure additions and methane use in electricity generation. On an average pasture management provides carbon sequestration at the rate of 0.5 tonnes per acre annually ($15 per tonne of carbon). Forest or planted trees and shrubs on farms sequesters 1.22 tonnes of carbon annually. Liquid manure additions ranges from 1662 to 7368 gallons per acre per year and adds a large amount of nutrients to pasture. These nutrients are valued at $57 - $262 per acre (with a mean value of $138 per acre). One of the farms has also installed a methane digester that generates electricity and avoids greenhouse gas emissions associated with electricity from the grid. The methane digester provides benefits worth $156.43 per acre per year. These combined environmental benefits ranges from $65 - $270 per acre on the four farms (with a mean of $193).
Social benefits These farms employ 3-16 staff. Some farms also attract visitors from schools and environmental organisations. This recreational benefit ranges from $0.72 to $2.20 per acre. Some farms also generate knowledge and help in its dissemination via conferences and workshops. This results in social benefits of $2.2 per acre. On the basis of the annual wages, it is estimated that it generates employment benefits worth $170 - $760 per acre per year (with mean of $490). The combined mean of the four farms for social benefits is $494 per acre.

Farm Sustainability Assessment Report | 20
Environmental cost Environmental costs in this cluster of farms includes greenhouse gas emissions associated with milk production ($107 - $715 per acre), animal feed ($2 - $760), manure ($11 - £47) and fuel and electricity ($7-31 per acre), along with external costs associated with damage to human and environmental health ($13.29 per acre). Summary of these values are provided in Table 3.
Table 3. Benefit and costs associated with milk production.
Benefits ($/acre/year)
Cost ($/acre/year)
Net ($/acre/year)
Production value 8178Environmental benefits 193Social benefits 494Environmental cost 599
8865 8266
True cost of milk: Value of production, environmental benefits, social benefits and environmental cost is calculated for each gallon of milk from the above data (using equations 7-9) and is provided in Table 4.
Table 4. Summary of benefits and costs per gallon of milk.
Milk ($/gallon)Production value 3.44Environmental benefits 0.08Social benefits 0.20Environmental cost -0.25
3.47

Farm Sustainability Assessment Report | 21
6. Diversified Farm
Farm descriptionPolyface farm is located in the Shenandoah Valley in Virginia and is a unique pasture-based diversified farm that produces beef, pork, rabbit, poultry meat and eggs along with other products such as maple syrup and honey. As the name indicates, this farm produces multiple products.
Benefits and costs of livestock productionBenefits and costs associated with this production system are summarised below (see Appendix B 3 for details).
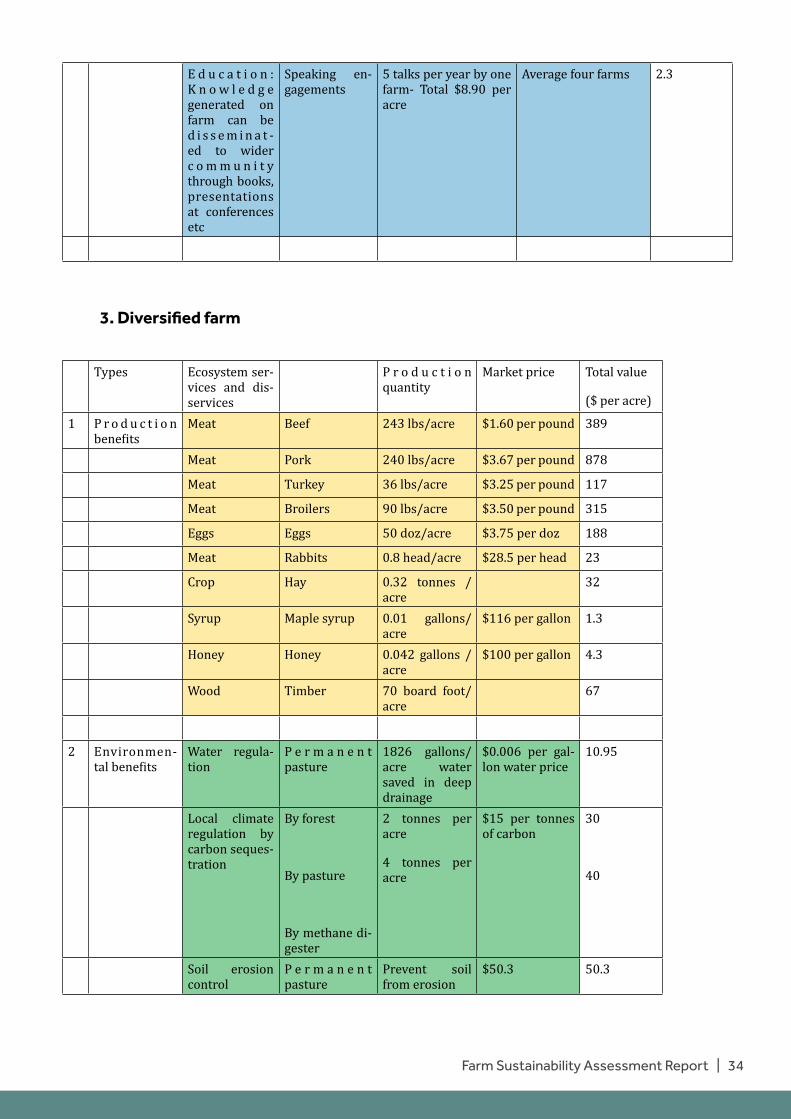
Production value This farm is a diversified farm that produces multiple products – beef, pork, turkey and chicken broilers, eggs, rabbits, honey, maple syrup and timber. The combined value of these products is estimated from the farm data and is valued at $2015 per acre per year.
Environmental benefits Diversified operations at this farm use 3.5 million gallons of water for consumptive use. Out of the total rainfall at the site (31 inches annually), ground water recharge is estimated to be 1826 gallons per acre per year. By using the tap water price in the market at $0.006 per gallon, water regulation benefits are estimated as $10.95. There are 500 acres under forest that captures carbon at the rate of 2 tonnes per acre annually.
At the market price of carbon (used in the study) of $ 15 per metric tonne, the annual carbon sequestration is valued at $30 per acre. Soil under pasture also sequesters carbon at the rate of 4 tons per acre and is valued at $60 per acre per year. Legumes in pasture fixes nitrogen through a biological nitrogen fixation process. This is estimated to be 22.7 kg N per acre per year and is valued at the current price of nitrogen ($0.30 per kg N). Thus the value of nitrogen fixation is estimated as $6.81 per acre. Continuous vegetation cover also offers soil erosion prevention which is valued at $ 50.3 per acre annually. Since animal diseases are managed naturally, the value of biological control of diseases is estimated at $14.37 per acre. The combined environmental benefits are valued at $172 per acre.
Social benefits This farm employs 25 permanent and part-time staff. On the basis of the annual wages, it is estimated that it generates employment benefits worth $285 per acre per year. Apart from this, annual recreational benefits

Farm Sustainability Assessment Report | 22
produced on the farm are $80 per acre and value of knowledge generated comes to $285 per acre. The total value of social benefits is $650 per acre.
Environmental cost Environmental costs on this farm include greenhouse gas emissions from livestock ($112 per acre), animal feed ($16 per acre), external costs associated with damage to human and environmental health ($13.29 per acre), transportation fuel ($4.2 per acre) and electricity ($7.6 per acre) used to process and store meat products. Summary of these values are provided in Table 5.
Table 5. Benefit and costs associated with diversified farm.
Benefits ($/acre/year)
Cost ($/acre/year)
Net ($/acre/year)
Production value 2015Environmental benefits 172Social benefits 650Environmental cost 153
2837 2684
True cost of various products: Value of production, environmental benefits, social benefits and environmental cost is calculated for each pound of beef, pork meat, poultry meat and eggs from the above data and is provided in Table 6.
Table 6. Benefit and costs associated with pound of beef, pork, poultry meat and eggs production.
Beef ($/pound)
Pork ($/pound)
Poultry ($/pound)
Eggs ($/dozens)
Production value 1.6 3.67 3.5 3.75
Environmental benefits 0.7 0.71 1.91 3.40
Social benefits 2.67 2.7 7.2 13.00
Environmental cost -0.63 -0.63 -1.7 -3.06
Net cost 4.34 6.45 10.91 17.09
Farm Sustainability Assessment Report | 23
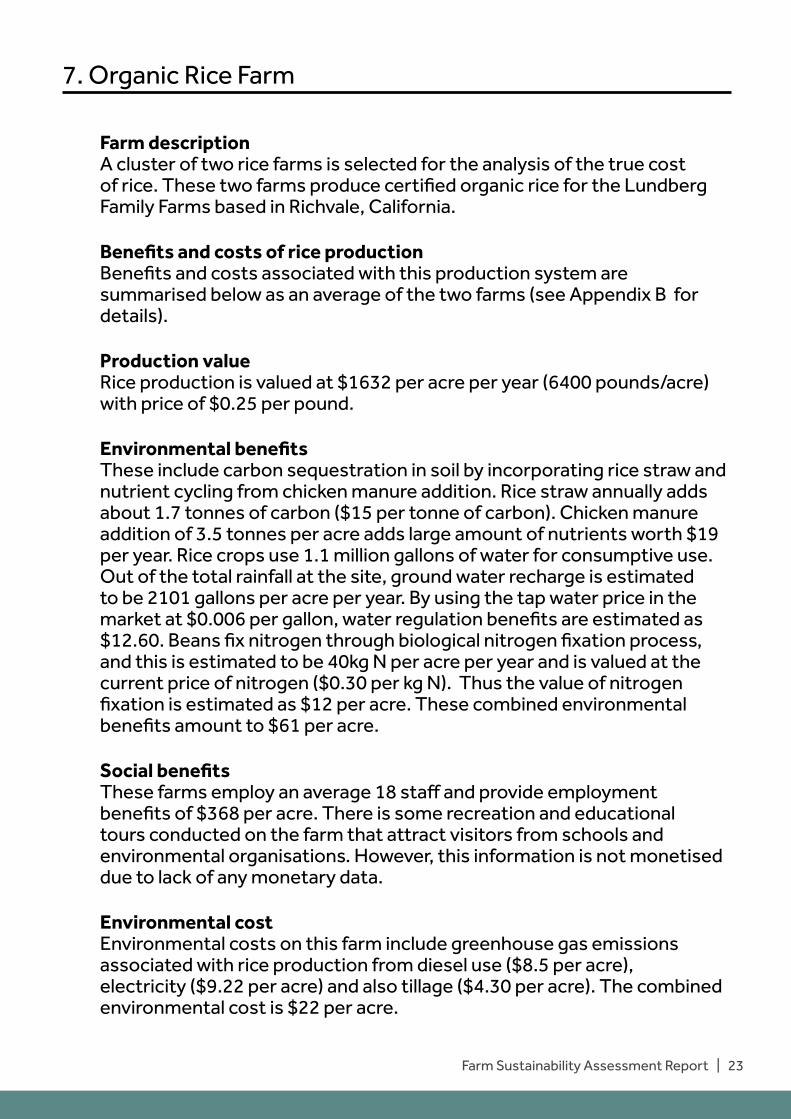
7. Organic Rice Farm
Farm description A cluster of two rice farms is selected for the analysis of the true cost of rice. These two farms produce certified organic rice for the Lundberg Family Farms based in Richvale, California.
Benefits and costs of rice production Benefits and costs associated with this production system are summarised below as an average of the two farms (see Appendix B for details).
Production value Rice production is valued at $1632 per acre per year (6400 pounds/acre) with price of $0.25 per pound.
Environmental benefits These include carbon sequestration in soil by incorporating rice straw and nutrient cycling from chicken manure addition. Rice straw annually adds about 1.7 tonnes of carbon ($15 per tonne of carbon). Chicken manure addition of 3.5 tonnes per acre adds large amount of nutrients worth $19 per year. Rice crops use 1.1 million gallons of water for consumptive use. Out of the total rainfall at the site, ground water recharge is estimated to be 2101 gallons per acre per year. By using the tap water price in the market at $0.006 per gallon, water regulation benefits are estimated as $12.60. Beans fix nitrogen through biological nitrogen fixation process, and this is estimated to be 40kg N per acre per year and is valued at the current price of nitrogen ($0.30 per kg N). Thus the value of nitrogen fixation is estimated as $12 per acre. These combined environmental benefits amount to $61 per acre.
Social benefits These farms employ an average 18 staff and provide employment benefits of $368 per acre. There is some recreation and educational tours conducted on the farm that attract visitors from schools and environmental organisations. However, this information is not monetised due to lack of any monetary data.
Environmental cost Environmental costs on this farm include greenhouse gas emissions associated with rice production from diesel use ($8.5 per acre), electricity ($9.22 per acre) and also tillage ($4.30 per acre). The combined environmental cost is $22 per acre.

Farm Sustainability Assessment Report | 24
Table 7. Benefit and costs associated with rice production.
Benefits ($/acre/year)
Cost ($/acre/year)
Net ($/acre/year)
Production value 1632Environmental benefits 61Social benefits 368Environmental cost 22
2061 2039
True cost of rice: Value of production, environmental benefits, social benefits and environmental cost is calculated for each pound of rice from the above data and is provided in Table 8.
Table 8. Summary of benefits and costs per pound of rice.
Rice ($/pound)Production value 0.25Environmental benefits 0.01Social benefits 0.06Environmental cost -0.003
0.31

Farm Sustainability Assessment Report | 25
8. Conclusions and Recommendations
These four case studies revealed the true cost of eight commodities which are associated with four different types of farming systems. The combined environmental and social benefits are proportionately higher in the diversified farm followed by the dairy farm cluster, rice farms and the corn/soybean farm. The diversified farm also generated very high social benefits as compared to the other four farming systems. The associated environmental benefits, social benefits and environmental costs are specific to the type of farming operation and should not be generalised from these four case studies.
The four farming systems investigated in this study are delivering more positive externalities than the negative ones due to the sustainable practices already in place at these farms. Therefore, in order to reflect the true cost of conventional production systems, there is need to include a greater number of farms and also include those farms that are using high amount of inputs and use intensive production systems such as confined animal feed operations, confined dairy systems, conventional tillage and high input farming systems.
Although data on all externalities is included in the current assessment, there is limited information on the public health impacts apart from the social cost of carbon, pesticide poisoning and some data on food safety. Therefore, the environmental and social costs category needs more attention, and further research is required to include monetary values on the impacts of pesticides, agrochemicals, antibiotic resistance, and the risks of human and animal diseases.
There are several gaps in the research literature on the greenhouse gas emissions of various management practices that need to be filled, in order to refine the methods used in this study. There is need to establish a bench mark by conducting a number of studies in each type of production system, such as organic, conventional, integrated systems under cropping and livestock production.
The results of this study can be used to influence sustainable farming practices and policies and also to raise awareness among consumers of the benefits and costs of various types of food and agriculture production systems. Some of the key recommendations are:
1. Farmers and practitioners can utilise this information to adopt technologies that have less detrimental impacts on the human health and the environment.

Farm Sustainability Assessment Report | 26
2. Consumers can make informed decisions to choose products that have higher environmental and social benefits and less environmental costs.
3. This study develops new farm sustainability assessment methods that reveal environmental benefits, social benefits and environment costs associated with different production systems. However, the research here should be developed further by conducting more studies to standardise and refine methodology in order to develop a uniform metric system that can be used by the food and agriculture industry as a label or a standard. These methods can supplement global assessments such as TEEB AgFood’s project to investigate the benefits and costs of different farming systems worldwide.
4. Assessment and quantification of all externalities in production systems is needed and would help the policy community to understand the costs and benefits of various farming systems. This could help to shift support mechanisms towards sustainable production systems. This information could then can be used to develop long term sustainable food and agriculture production systems that could supply nutritious food in required quantities without impacting the environment and human health.
Farm Sustainability Assessment Report | 27
References
Daily GC (Ed.) 1997. Nature’s Services: Societal Dependence on Natural Ecosystems. Island Press, Washington, DC.
Costanza R et al. 1997 The value of the world’s ecosystem services and natural capital. Nature 387, 253–260.
Millennium Ecosystem Assessment, 2005. Millennium ecosystem assessment synthesis report. Island Press, Washington, DC.
Pretty JN et al. 2000. An assessment of the total external costs of UK agriculture. Agricultural Systems 65, 113–136.
Sandhu HS et al. 2008. The future of farming: The value of ecosystem services in conventional and organic arable land. An experimental approach. Ecological Economics 64, 835–848.
Sandhu HS, Wratten SD, Cullen R. 2010. The role of supporting ecosystem services in conventional and organic arable farmland. Ecological Complexity 7, 302–310.
Sandhu, H et al. 2015. Significance and value of non-traded ecosystem services on farmland. PeerJ 3, e762 (doi.org.10.7717/peerj.762).
Sandhu HS, et al. 2016. Mainstreaming ecosystem services into future farming. Solutions 7, 40-47.
Schutter, OD. 2010. Right to food. Report submitted by the special rapporteur, United Nations, New York. http://www2.ohchr.org/english/issues/food/docs/A-HRC-16-49.pdf
Tegtmeier EM, Duffy MD. 2004. External costs of agricultural production in the United States. International Journal of Agricultural Sustainability 2, 1–20.
Tilman D et al. 2001. Forecasting agriculturally driven global environmental change. Science 292, 281–284.
Tilman D et al. 2002. Agricultural sustainability and intensive production practices. Nature 418, 671–677.
United Nations Environment Programme. 2015. TEEB for agriculture & food: an interim report. United Nations Environment Programme.
Wratten S, Sandhu H, Cullen R, Costanza R, editors. 2013. Ecosystem Services in Agricultural and Urban Landscapes. Oxford, UK, Wiley-Blackwell.

Farm Sustainability Assessment Report | 28
AppendixAppendix A
Ecosystem services categories assessed in this study are summarised in the table with brief description, examples and method for economic valuation used in each category.
Types Ecosystem services and disservices
Examples Description Method used for valuation
1 Production benefits
Crop, livestock, milk etc.
corn, soybean, milk, meat, eggs, timber, honey, maple syrup etc.
Provisioning services: These include food and services for human consumption, ranging from raw materials and fuel wood to the conservation of species and genetic material
Market value
2 Environmen-tal benefits
Water regulation: Influence ecosystems have on the timing and magnitude of water runoff, flooding, and aquifer recharge, particularly in terms of the water storage potential
Permanent groundcover and permeable soil facili-tates aquifer recharge; re-taining water can decrease flooding during runoff peaks
Regulating services: Ecosystems regulate essential ecological processes
and life-support sys-tems through bio-geo-chemical
cycles and other bio-spheric processes
Avoided cost
Local climate regula-tion by carbon seques-tration: Regulation of atmospheric chemical composition
Carbon sequestration by soil due to tillage practices, permanent pastures and by vegetation on farm.
Avoided cost
Soil erosion control: Role vegetative cover plays in soil retention
Permanent pastures pre-vent soil erosion
Avoided cost
Environmen-tal costs
Greenhouse gas emis-sions
Carbon di-oxide equivalent emissions from inputs, tillage, fuel use, livestock on farm
Direct cost
Damage to water resources
Infrastructure to treat pes-ticide and nitrate in water sources
Direct cost
Damage to soil re-sources
Soil losses due to manage-ment practices
Replacement cost
Damage to ecosystems and biodiversity
Loss of biodiversity and impacts on other species
Replacement cost
Damage to human health
Pathogens and agrochem-ical that can enter food chain
Replacement cost

Farm Sustainability Assessment Report | 29
3 Environmen-tal benefits
Nitrogen fixation Biological nitrogen fixation by legumes in crops and pastures
Supporting services: These are the services that are required to support the production of other ecosystem goods and services
Avoided cost
Nutrient cycling Organic matter breakdown to release stored nutrients for crop use
Avoided cost
Biological control of pests/diseases
Predators and parasites that control insect pests and diseases
Avoided cost
4 Social benefits Employment: Employ-ment generated on farm leads to benefits to wider community
Farm workers, families Cultural services: Cul-tural services contrib-ute to the maintenance of human health and well-being by providing recreation, aesthetics and education
Market value
Recreation: Recre-ational pleasure in agriculture
Farm tours, visits Market value
Education: Knowledge generated on farm can be disseminated to wider community through books, pre-sentations at confer-ences etc
Knowledge generation and dissemination
Market value
Appendix B
1. Corn and soybean farmTypes Ecosystem ser-
vices and dis-services
Production quantity Market price Total value
($ per acre)
1 P r o d u c t i o n benefits
Corn 221 bushels/acre $4 per bushel 884.0
Soybean 69 bushels/acre $10 per bushel 690.0
2 Environmen-tal benefits
Water regula-tion
Corn 5600 gallons/acre water saved in deep drainage
$0.006 per gallon of water
33
Soybean 4362 gallons/acre water saved in deep drainage
$0.006 per gallon 26
Local climate regulation by carbon seques-tration
By trees 1.22 tonnes/acre CO2e sequestered annually
$15 per tonne of CO2e
18.0
Farm Sustainability Assessment Report | 30
Soil erosion control
- - - -
Environmen-tal costs
G r e e n h o u s e gas emissions
MAP (32 kg/acre)
114 kg/ac CO2e emis-sion
$ 0.0423 per kg of CO2e emissions (social cost $ 42.3 per tonne of CO2e )
4.83
N,K2o,S Blend (77 kg/acre)
15 kg/ac CO2e emission $ 0.0423 per kg of CO2e emissions (social cost $ 42.3 per tonne of CO2e )
0.63
P o t a s s i u m chloride (47.5 kg/acre)
27 kg/ac CO2e emission $ 0.0423 per kg of CO2e emissions (social cost $ 42.3 per tonne of CO2e )
1.14
In-row liquid starter fertilis-er blend (14.3 kg/acre)
111 kg/ac CO2e emis-sion
$ 0.0423 per kg of CO2e emissions (social cost $ 42.3 per tonne of CO2e )
4.7
P r e - e m e r g e broadcast ap-plication (76 kg/acre)
459 kg/ac CO2e emis-sion
$ 0.0423 per kg of CO2e emissions (social cost $ 42.3 per tonne of CO2e )
19
External cost of fertiliser use – see Appendix 3 for details on this category
1kg nutrient has exter-nal cost of $0.41 per kg
Total fertiliser use 246 kg per acre
101
External cost Corn herbicide
1 kg a.i. has external cost of $46.03
1.2 kg ai /ac @ $46.03 per kg
55.23
External cost Soy herbicide
1 kg a.i. has external cost of $46.03
0.5kg ai /ac @ $46.03 per kg
23
Strip tillage 61 Kg CO2e emissions per ac
$ 0.0423 per kg of CO2e emissions (social cost $ 42.3 per tonne of CO2e )
2.6
Gasoline use 7.8 litres/acre 21.06 kg CO2e @ 2.7 kg CO2 e per litre of gas. $ 0.0423 per kg of CO2e emissions (social cost $ 42.3 per tonne of CO2e )
0.9
Diesel use 29.8 litres/acre 80.46 kg CO2e per ac per yr 2.7 kg CO2 e per litre of diesel. $ 0.0423 per kg of CO2e emissions (social cost $ 42.3 per tonne of CO2e )
3.4
Electricity use 73 Kwh/acre 33 kg CO2e per/ac. At 0.454 kg per kwh. $ 0.0423 per kg of CO2e emis-sions (social cost $ 42.3 per tonne of CO2e )
1.4

Farm Sustainability Assessment Report | 31
Corn 80,000 kernals = 43 pounds or 19.5 kg/acre
19.5 kg CO2e emis-sions 1.05 kg C per kg of seed = 20.5 kgCO2/acre $ 0.0423 per kg of CO2e emissions (social cost $ 42.3 per tonne of CO2e )
0.86
Soy 140,000 seeds=50 pounds or 22.7 kg/acre
22.7 kg seed CO2e emissions 0.25kg C per kg of seed = 5.7 kgCo2/ac $ 0.0423 per kg of CO2e emissions (social cost $ 42.3 per tonne of CO2e )
0.24
3 Environmen-tal benefits
Nitrogen fixa-tion
By soybean 40kg N/acre @ $0.30 kg N 12
Nutrient cy-cling
- - - -
Biological con-trol of pests/diseases
- - - -
4 Social benefits Employment: E m p l oy m e n t generated on farm leads to benefits to wider commu-nity
Four employ-ees over 790 acres
Average wage $26650 per workerW
Average worker manages 199
134
R e c r e a t i o n : Recreational pleasure in ag-riculture
- - - -
E d u c a t i o n : K n o w l e d g e generated on farm can be d i s s e m i n a t -ed to wider c o m m u n i t y through books, presentations at conferences etc
- - - -

Farm Sustainability Assessment Report | 32
2. Dairy farm cluster
Data is obtained from four dairy farms.
Types Ecosystem ser-vices and dis-services
Production quantity Market price Total value
($ per acre)
1 P r o d u c t i o n benefits
Milk Average of four farm is 2377 (808 to 5416 )gallons per acre)
$3.44 per gallon 8177
2 Environmen-tal benefits
Water regula-tion
- - - -
Local climate regulation by carbon seques-tration
Methane cap-ture
By trees
By pasture
By methane di-gester
1 tonne per acre
0.5 tonne per acre
575000 kwh electric-ity produced per year.
1266 MT per year CO2e avoided CH4 emis-sions. 3.05 Mt per acre
$15 per tonnes of car-bon
625 kg CO2e per acre are avoided by pro-ducing electricity from methane use. $ 0.0423 per kg of CO2e emissions (social cost $ 42.3 per tonne of CO2e )
15
7.5
26.43
130Soil erosion control
- - - -
Environmen-tal costs
G r e e n h o u s e gas emissions
Milk produc-tion
9282 kg milk per acre per year
7425 kg CO2e per acre per year @ 0.8 kg CO2e per kg of milk produced. $ 0.0423 per kg of CO2e emis-sions (social cost $ 42.3 per tonne of CO2e )
314
Animal feed 26 ton per acre 5434 kg CO2e per acre @ 209 kg CO2e per tonnes of animal feed used. $ 0.0423 per kg of CO2e emissions (social cost $ 42.3 per tonne of CO2e )
230
Propane gas 38.75 litres per acre. With CO2e of 2.3 kg per litre
89.7 kg CO2e per acre. $ 0.0423 per kg of CO2e emissions (so-cial cost $ 42.3 per tonne of CO2e )
3.75

Farm Sustainability Assessment Report | 33
Diesel use 44 litres per acre. CO2e of 2.7 kg per litre
118 kg CO2e per acre. $ 0.0423 per kg of CO2e emissions (so-cial cost $ 42.3 per tonne of CO2e )
5
Electricity use 400kwh per acre. CO2e of 0.45 kg per kwh
180.4 kg CO2e per acre. $ 0.0423 per kg of CO2e emissions (social cost $ 42.3 per tonne of CO2e )
7.66
Manure addi-tion
15 cubic metre ma-nure addition per acre
40kg CO2e per cubic metre. $ 0.0423 per kg of CO2e emissions (social cost $ 42.3 per tonne of CO2e )
25
External cost associated with manure
Treatment of surface water for microbial pathognes, manure spills, Cost of illness due to common food-borne pathogens, Cost to indutry to comply with HACCP
$1.85 per acre per year
1.85
External cost associated with infrastructure m a n a g e m e n t by various agencies
USEPA budget for non point source pro-gramme, USDA budegt for natural resources
$ 11.45 per acre per year
11.45
3 Environmen-tal benefits
Nitrogen fixa-tion
- - - -
Nutrient cy-cling
15.2 tonnes of liquid manure per acre
10% nutrients are uti-lised by pasture. Ma-nure NPK (0.26 % N, 0.03% P, 0.03% K)
$0.30 kg N, $0.16 kg P, $0.24 kg K
138
Biological con-trol of pests/diseases
- - - -
4 Social benefits Employment: E m p l oy m e n t generated on farm leads to benefits to wider commu-nity
Average acres per worker 25-166.
86 acres generates employment for one worker
Average wages 19000 to 54000 per worker per year.
490
R e c r e a t i o n : Recreational pleasure in ag-riculture
About 11 farm tours organ-ised per year
Attended by 214 peo-ple
Cost of travel $0.50 per mile distance travelled
0.90
Farm Sustainability Assessment Report | 34
E d u c a t i o n : K n o w l e d g e generated on farm can be d i s s e m i n a t -ed to wider c o m m u n i t y through books, presentations at conferences etc
Speaking en-gagements
5 talks per year by one farm- Total $8.90 per acre
Average four farms 2.3
3. Diversified farm
Types Ecosystem ser-vices and dis-services
P r o d u c t i o n quantity
Market price Total value
($ per acre)
1 P r o d u c t i o n benefits
Meat Beef 243 lbs/acre $1.60 per pound 389
Meat Pork 240 lbs/acre $3.67 per pound 878
Meat Turkey 36 lbs/acre $3.25 per pound 117
Meat Broilers 90 lbs/acre $3.50 per pound 315
Eggs Eggs 50 doz/acre $3.75 per doz 188
Meat Rabbits 0.8 head/acre $28.5 per head 23
Crop Hay 0.32 tonnes /acre
32
Syrup Maple syrup 0.01 gallons/acre
$116 per gallon 1.3
Honey Honey 0.042 gallons /acre
$100 per gallon 4.3
Wood Timber 70 board foot/acre
67
2 Environmen-tal benefits
Water regula-tion
P e r m a n e n t pasture
1826 gallons/acre water saved in deep drainage
$0.006 per gal-lon water price
10.95
Local climate regulation by carbon seques-tration
By forest
By pasture
By methane di-gester
2 tonnes per acre
4 tonnes per acre
$15 per tonnes of carbon
30
40
Soil erosion control
P e r m a n e n t pasture
Prevent soil from erosion
$50.3 50.3

Farm Sustainability Assessment Report | 35
Environmen-tal costs
G r e e n h o u s e gas emissions
Beef 110 kg per acre 13.44 kg CO2e per kg of beef produced. $ 0.0423 per kg of CO2e emissions (social cost $ 42.3 per tonne of CO2e )
63
Pork 109 kg per acre 6.1 kg CO2e per kg of beef pro-duced. $ 0.0423 per kg of CO2e emissions (so-cial cost $ 42.3 per tonne of CO2e )
28
Turkey meat 16.34 kg per acre
6.1 kg CO2e per kg of beef pro-duced. $ 0.0423 per kg of CO2e emissions (so-cial cost $ 42.3 per tonne of CO2e )
4
Poultry meat 41 kg per acre 5.4 kg CO2e per kg of beef pro-duced. $ 0.0423 per kg of CO2e emissions (so-cial cost $ 42.3 per tonne of CO2e )
9
Eggs 50 dozens per acre
3.7 kg CO2e per kg of beef pro-duced. $ 0.0423 per kg of CO2e emissions (so-cial cost $ 42.3 per tonne of CO2e )
8
Animal feed 580 tonnes per year (Corn 1kg per kg
1kg CO2e per kg of corn used, 0.25 1kg CO2e per kg of sot-bean used, 0.25 kg CO2e per kg of oats used (so-cial cost $ 42.3 per tonne of CO2e )
16
Diesel use 37 litres per acre. CO2e of 2.7 kg per litre
100 kg CO2e, Social cost $ 0.0423 per kg of CO2e emissions
4.2

Farm Sustainability Assessment Report | 36
Electricity use 200 kwh per acre. CO2e of 0.9 kg per kwh
180 kg CO2e, Social cost $ 0.0423 per kg of CO2e emissions
7.6
External cost associated with manure
Treatment of surface water for microbial pathognes, ma-nure spills, Cost of illness due to common food-borne patho-gens, Cost to in-dutry to comply with HACCP
$1.85 per acre per year
1.85
External cost associated with infrastructure m a n a g e m e n t by various agencies
USEPA budget for non point source pro-gramme, USDA budegt for nat-ural resources
$ 11.45 per acre per year
11.45
3 Environmen-tal benefits
Nitrogen fixa-tion
Nitrogen fixed by legumes in pasture @30%
22.7 kg N fixed per acre
$0.30 per kg N 6.81
Nutrient cy-cling
- - - -
Biological con-trol of pests/diseases
Animal disease suppression
14.37
4 Social benefits Employment: E m p l oy m e n t generated on farm leads to benefits to wider commu-nity
1753 acres managed by 25 workers
Average wage $20,000 per worker
Each worker manages 70 acres
285
R e c r e a t i o n : Recreational pleasure in ag-riculture
Visitors on farm, 16 per acre
16 per acre Each visitor pays farm tour fees $5
80
E d u c a t i o n : K n o w l e d g e generated on farm can be d i s s e m i n a t -ed to wider c o m m u n i t y through books, presentations at conferences etc
K n o w l e d g e generated on farming prac-tices is dissem-inated through books, talks etc.
I n f o r m a t i o n dissemination through books and talks.
Knowledge @ $171 per acre
Scientific infor-mation @ $114 per acre
285

Farm Sustainability Assessment Report | 37
4. Rice farm
Data is obtained from two rice farms.
Types Ecosystem ser-vices and dis-services
P r o d u c t i o n quantity
Market price Total value
($ per acre)
1 P r o d u c t i o n benefits
Rice Average of two farms is 6400 pounds per acre
$0.25 per pound ($0.33 and $0.18)
1632
2 Environmen-tal benefits
Water regula-tion
Rice 1723 gallons water recharge per acre
$0.006 per gal-lon water price
10.33
Local climate regulation by carbon seques-tration
Methane cap-ture
Rice straw 1.7 tonne per acre
$15 per tonnes of carbon
25.50
Environmen-tal costs
G r e e n h o u s e gas emissions
Diesel use 74 litres per acre. CO2e of 2.7 kg per litre
200 kg CO2e per acre. $ 0.0423 per kg of CO2e emissions (so-cial cost $ 42.3 per tonne of CO2e )
8.50
Electricity use 242 kwh per acre. CO2e of 0.45 kg per kwh
218 kg CO2e per acre. $ 0.0423 per kg of CO2e emissions (so-cial cost $ 42.3 per tonne of CO2e )
9.22
Tillage 102 kg CO2e per acre. $ 0.0423 per kg of CO2e emissions (so-cial cost $ 42.3 per tonne of CO2e )
4.30
3 Environmen-tal benefits
Nitrogen fixa-tion
Beans 20kg N/ac/yr $0.30 kgN 6
Nutrient cy-cling
3.5 tonnes chicken ma-nure
10.5 kg N, 4.5 kg P, 4.2 kg K
$0.30 kg N, $0.16 kg P, $0.24 kg K
19.20

Farm Sustainability Assessment Report | 38
4 Social benefits Employment: E m p l oy m e n t generated on farm leads to benefits to wider commu-nity
Average acres per worker 74-140.
107 acres gen-erates employ-ment for one worker
Average wag-es 35700 per worker per year.
368
R e c r e a t i o n : Recreational pleasure in ag-riculture
2000 to 5000 visitors per year
E d u c a t i o n : K n o w l e d g e generated on farm can be d i s s e m i n a t -ed to wider c o m m u n i t y through books, presentations at conferences etc
About 100 stu-dents visit to farm each year.
Over 170 dona-tions to charity, food organisa-tions per year.

Farm Sustainability Assessment Report | 39
Appendix C
External costs and benefits (quantity and values) used in calculations.
Ecosystem ser-vices and dis-services
Quantity and/or Value
Reference
1 P r o d u c t i o n benefits
Grains, meat or milk produced per acre
Farm records and own calcula-tions
2 Environmen-tal benefits
Water regula-tion
Freshwater value per gallon
$0.006 per gallon of water
Agricultural Resources and Envi-ronmental Indicators 2006 report
Local climate regulation by carbon seques-tration
Carbon sequestration $15 per tonne of CO2e
1.22 tonnes/acre CO2e sequestered annually in plant-ed forest
4 tonnes per acre in natural forest
http://calcarbondash.org/
http://www.epa.gov/energy/ghg-equivalencies-calculator-cal-culations-and-references
http://www.nrcs.usda.gov/wps/portal/nrcs/detai l//?cid=n-rcs143_014209
Soil erosion control
Prevention of soil ero-sion by maintain pas-ture cover
$50.3 per acre Costanza et al. 1997, 2014
Environmen-tal cost
G r e e n h o u s e gas emissions
Social cost of CO2e emissions
$ 42.3 per tonne of CO2e
http://www3.epa.gov/climat-echange/EPAactivities/econom-ics/scc.html
Fertilisers MAP 3.55 kg CO2e emission per kg
IPCC, 2006. Guidelines for National Greenhouse Gas Inventories 2006. Volume 3 Industrial Processes and Product Use, Chapter 3: Chemical Industry Emissions.
Kool et al., 2012. LCI data for the calculation tool Feedprint for greenhouse gas emissions of feed production and utilization. Blonk Consultants. The Netherlands.
N,K2o,S Blend 0.19 kg CO2e emission per kg
IPCC, 2006. Guidelines for National Greenhouse Gas Inventories 2006. Volume 3 Industrial Processes and Product Use, Chapter 3: Chemical Industry Emissions.
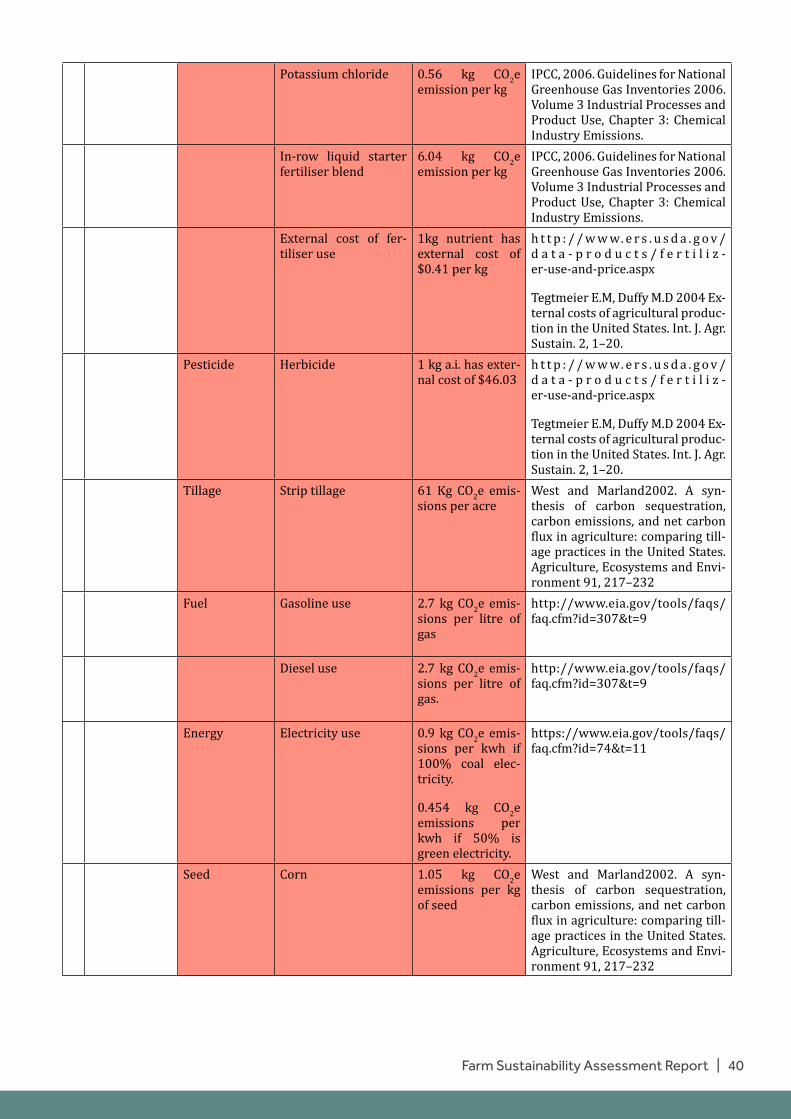
Farm Sustainability Assessment Report | 40
Potassium chloride 0.56 kg CO2e emission per kg
IPCC, 2006. Guidelines for National Greenhouse Gas Inventories 2006. Volume 3 Industrial Processes and Product Use, Chapter 3: Chemical Industry Emissions.
In-row liquid starter fertiliser blend
6.04 kg CO2e emission per kg
IPCC, 2006. Guidelines for National Greenhouse Gas Inventories 2006. Volume 3 Industrial Processes and Product Use, Chapter 3: Chemical Industry Emissions.
External cost of fer-tiliser use
1kg nutrient has external cost of $0.41 per kg
h t t p : / / w w w. e r s . u s d a . g o v /d a t a - p r o d u c t s / f e r t i l i z -er-use-and-price.aspx
Tegtmeier E.M, Duffy M.D 2004 Ex-ternal costs of agricultural produc-tion in the United States. Int. J. Agr. Sustain. 2, 1–20.
Pesticide Herbicide 1 kg a.i. has exter-nal cost of $46.03
h t t p : / / w w w. e r s . u s d a . g o v /d a t a - p r o d u c t s / f e r t i l i z -er-use-and-price.aspx
Tegtmeier E.M, Duffy M.D 2004 Ex-ternal costs of agricultural produc-tion in the United States. Int. J. Agr. Sustain. 2, 1–20.
Tillage Strip tillage 61 Kg CO2e emis-sions per acre
West and Marland2002. A syn-thesis of carbon sequestration, carbon emissions, and net carbon flux in agriculture: comparing till-age practices in the United States. Agriculture, Ecosystems and Envi-ronment 91, 217–232
Fuel Gasoline use 2.7 kg CO2e emis-sions per litre of gas
http://www.eia.gov/tools/faqs/faq.cfm?id=307&t=9
Diesel use 2.7 kg CO2e emis-sions per litre of gas.
http://www.eia.gov/tools/faqs/faq.cfm?id=307&t=9
Energy Electricity use 0.9 kg CO2e emis-sions per kwh if 100% coal elec-tricity.
0.454 kg CO2e emissions per kwh if 50% is green electricity.
https://www.eia.gov/tools/faqs/faq.cfm?id=74&t=11
Seed Corn 1.05 kg CO2e emissions per kg of seed
West and Marland2002. A syn-thesis of carbon sequestration, carbon emissions, and net carbon flux in agriculture: comparing till-age practices in the United States. Agriculture, Ecosystems and Envi-ronment 91, 217–232

Farm Sustainability Assessment Report | 41
Soy 0.25 kg CO2e emissions per kg of seed
West and Marland2002. A syn-thesis of carbon sequestration, carbon emissions, and net carbon flux in agriculture: comparing till-age practices in the United States. Agriculture, Ecosystems and Envi-ronment 91, 217–232
Feed Animal feed 209 kg CO2e per tonnes of animal feed
FAO 2010. Greenhouse Gas Emis-sions from the Dairy Sector
A Life Cycle Assessment. Rome.Milk production 0.8 kg CO2e per kg
of milk producedFAO 2010. Greenhouse Gas Emis-sions from the Dairy Sector
A Life Cycle Assessment. Rome.Manure Mnure addition 40kg CO2e emis-
sions per cubic metre
FAO 2010. Greenhouse Gas Emis-sions from the Dairy Sector
A Life Cycle Assessment. Rome.External cost associat-ed with manure
$1.85 per acre per year
h t t p : / / w w w. e r s . u s d a . g o v /d a t a - p r o d u c t s / f e r t i l i z -er-use-and-price.aspx
Tegtmeier E.M, Duffy M.D 2004 Ex-ternal costs of agricultural produc-tion in the United States. Int. J. Agr. Sustain. 2, 1–20.
Own calculationsExternal cost associat-ed with infrastructure management by vari-ous agencies
$11.45 per acre per year
h t t p : / / w w w. e r s . u s d a . g o v /d a t a - p r o d u c t s / f e r t i l i z -er-use-and-price.aspx
Tegtmeier E.M, Duffy M.D 2004 Ex-ternal costs of agricultural produc-tion in the United States. Int. J. Agr. Sustain. 2, 1–20.
Own calculationsExternal cost a s s o c i a t e d with pesticide and fertilser use ($46 per acre per year)
Facility infrastructure needs for nitrate tree-atment
$0.61 per acre h t t p : / / w w w. e r s . u s d a . g o v /d a t a - p r o d u c t s / f e r t i l i z -er-use-and-price.aspx
Tegtmeier E.M, Duffy M.D 2004 Ex-ternal costs of agricultural produc-tion in the United States. Int. J. Agr. Sustain. 2, 1–20.
Own calculationsFacility infratstruc-ture needs for pesti-cide treeatment
$0.36 per acre h t t p : / / w w w. e r s . u s d a . g o v /d a t a - p r o d u c t s / f e r t i l i z -er-use-and-price.aspx
Tegtmeier E.M, Duffy M.D 2004 Ex-ternal costs of agricultural produc-tion in the United States. Int. J. Agr. Sustain. 2, 1–20.
Own calculations

Farm Sustainability Assessment Report | 42
Cost to water industry $1.79 per acre h t t p : / / w w w. e r s . u s d a . g o v /d a t a - p r o d u c t s / f e r t i l i z -er-use-and-price.aspx
Tegtmeier E.M, Duffy M.D 2004 Ex-ternal costs of agricultural produc-tion in the United States. Int. J. Agr. Sustain. 2, 1–20.
Own calculationsCost to replace lost ca-pacity of reservioirs
$10.15 per acre h t t p : / / w w w. e r s . u s d a . g o v /d a t a - p r o d u c t s / f e r t i l i z -er-use-and-price.aspx
Tegtmeier E.M, Duffy M.D 2004 Ex-ternal costs of agricultural produc-tion in the United States. Int. J. Agr. Sustain. 2, 1–20.
Own calculationsWater conveyance cost
$1.71 per acre h t t p : / / w w w. e r s . u s d a . g o v /d a t a - p r o d u c t s / f e r t i l i z -er-use-and-price.aspx
Tegtmeier E.M, Duffy M.D 2004 Ex-ternal costs of agricultural produc-tion in the United States. Int. J. Agr. Sustain. 2, 1–20.
Own calculationsFlood damages $1.19 per acre h t t p : / / w w w. e r s . u s d a . g o v /
d a t a - p r o d u c t s / f e r t i l i z -er-use-and-price.aspx
Tegtmeier E.M, Duffy M.D 2004 Ex-ternal costs of agricultural produc-tion in the United States. Int. J. Agr. Sustain. 2, 1–20.
Own calculationsDamages to receation-al activities
$6.01 per acre h t t p : / / w w w. e r s . u s d a . g o v /d a t a - p r o d u c t s / f e r t i l i z -er-use-and-price.aspx
Tegtmeier E.M, Duffy M.D 2004 Ex-ternal costs of agricultural produc-tion in the United States. Int. J. Agr. Sustain. 2, 1–20.
Own calculationsCost to navigation: shipping damages, dredging
$1.04 per acre h t t p : / / w w w. e r s . u s d a . g o v /d a t a - p r o d u c t s / f e r t i l i z -er-use-and-price.aspx
Tegtmeier E.M, Duffy M.D 2004 Ex-ternal costs of agricultural produc-tion in the United States. Int. J. Agr. Sustain. 2, 1–20.
Own calculations

Farm Sustainability Assessment Report | 43
Instream impacts: commercial fisheries, preservation,
$2.33 per acre h t t p : / / w w w. e r s . u s d a . g o v /d a t a - p r o d u c t s / f e r t i l i z -er-use-and-price.aspx
Tegtmeier E.M, Duffy M.D 2004 Ex-ternal costs of agricultural produc-tion in the United States. Int. J. Agr. Sustain. 2, 1–20.
Own calculationsOff stream impacts: in-dustrial users, steam power plants
$1.03 per acre h t t p : / / w w w. e r s . u s d a . g o v /d a t a - p r o d u c t s / f e r t i l i z -er-use-and-price.aspx
Tegtmeier E.M, Duffy M.D 2004 Ex-ternal costs of agricultural produc-tion in the United States. Int. J. Agr. Sustain. 2, 1–20.
Own calculationsCost of green house gas emissions from cropland
$0.92 per acre h t t p : / / w w w. e r s . u s d a . g o v /d a t a - p r o d u c t s / f e r t i l i z -er-use-and-price.aspx
Tegtmeier E.M, Duffy M.D 2004 Ex-ternal costs of agricultural produc-tion in the United States. Int. J. Agr. Sustain. 2, 1–20.
Own calculationsHoney bee and polina-tion losses
$1.32 per acre h t t p : / / w w w. e r s . u s d a . g o v /d a t a - p r o d u c t s / f e r t i l i z -er-use-and-price.aspx
Tegtmeier E.M, Duffy M.D 2004 Ex-ternal costs of agricultural produc-tion in the United States. Int. J. Agr. Sustain. 2, 1–20.
Own calculationsLoss of beneficial predators by pesti-cides application
$2.15 per acre h t t p : / / w w w. e r s . u s d a . g o v /d a t a - p r o d u c t s / f e r t i l i z -er-use-and-price.aspx
Tegtmeier E.M, Duffy M.D 2004 Ex-ternal costs of agricultural produc-tion in the United States. Int. J. Agr. Sustain. 2, 1–20.
Own calculationsFish kills due to pesti-cides
$0.12 per acre h t t p : / / w w w. e r s . u s d a . g o v /d a t a - p r o d u c t s / f e r t i l i z -er-use-and-price.aspx
Tegtmeier E.M, Duffy M.D 2004 Ex-ternal costs of agricultural produc-tion in the United States. Int. J. Agr. Sustain. 2, 1–20.
Own calculations

Farm Sustainability Assessment Report | 44
Bird kills due to pesti-cides
$0.11 per acre h t t p : / / w w w. e r s . u s d a . g o v /d a t a - p r o d u c t s / f e r t i l i z -er-use-and-price.aspx
Tegtmeier E.M, Duffy M.D 2004 Ex-ternal costs of agricultural produc-tion in the United States. Int. J. Agr. Sustain. 2, 1–20.
Own calculationsPesticides poisioning $3.26 per acre h t t p : / / w w w. e r s . u s d a . g o v /
d a t a - p r o d u c t s / f e r t i l i z -er-use-and-price.aspx
Tegtmeier E.M, Duffy M.D 2004 Ex-ternal costs of agricultural produc-tion in the United States. Int. J. Agr. Sustain. 2, 1–20.
Own calculationsUSEPA budget for non point source pro-gramme
$0.49 per acre h t t p : / / w w w. e r s . u s d a . g o v /d a t a - p r o d u c t s / f e r t i l i z -er-use-and-price.aspx
Tegtmeier E.M, Duffy M.D 2004 Ex-ternal costs of agricultural produc-tion in the United States. Int. J. Agr. Sustain. 2, 1–20.
Own calculationsUSEPA budget for re-duce public and eco-system
$0.07 per acre h t t p : / / w w w. e r s . u s d a . g o v /d a t a - p r o d u c t s / f e r t i l i z -er-use-and-price.aspx
Tegtmeier E.M, Duffy M.D 2004 Ex-ternal costs of agricultural produc-tion in the United States. Int. J. Agr. Sustain. 2, 1–20.
Own calculationsUSDA budegt for natu-ral resources
$4.07 per acre h t t p : / / w w w. e r s . u s d a . g o v /d a t a - p r o d u c t s / f e r t i l i z -er-use-and-price.aspx
Tegtmeier E.M, Duffy M.D 2004 Ex-ternal costs of agricultural produc-tion in the United States. Int. J. Agr. Sustain. 2, 1–20.
Own calculationsUSDA budget for farm advisory
$6.36 per acre h t t p : / / w w w. e r s . u s d a . g o v /d a t a - p r o d u c t s / f e r t i l i z -er-use-and-price.aspx
Tegtmeier E.M, Duffy M.D 2004 Ex-ternal costs of agricultural produc-tion in the United States. Int. J. Agr. Sustain. 2, 1–20.
Own calculations

Farm Sustainability Assessment Report | 45
USDA budget for food safet y
$0.07 per acre h t t p : / / w w w. e r s . u s d a . g o v /d a t a - p r o d u c t s / f e r t i l i z -er-use-and-price.aspx
Tegtmeier E.M, Duffy M.D 2004 Ex-ternal costs of agricultural produc-tion in the United States. Int. J. Agr. Sustain. 2, 1–20.
Own calculationsUSDa plant safety $0.46 per acre h t t p : / / w w w. e r s . u s d a . g o v /
d a t a - p r o d u c t s / f e r t i l i z -er-use-and-price.aspx
Tegtmeier E.M, Duffy M.D 2004 Ex-ternal costs of agricultural produc-tion in the United States. Int. J. Agr. Sustain. 2, 1–20.
Own calculationsUSDA microbiological data
$0.01 per acre h t t p : / / w w w. e r s . u s d a . g o v /d a t a - p r o d u c t s / f e r t i l i z -er-use-and-price.aspx
Tegtmeier E.M, Duffy M.D 2004 Ex-ternal costs of agricultural produc-tion in the United States. Int. J. Agr. Sustain. 2, 1–20.
Own calculationsEP safe food pro-gramme
$0.28 per acre h t t p : / / w w w. e r s . u s d a . g o v /d a t a - p r o d u c t s / f e r t i l i z -er-use-and-price.aspx
Tegtmeier E.M, Duffy M.D 2004 Ex-ternal costs of agricultural produc-tion in the United States. Int. J. Agr. Sustain. 2, 1–20.
Own calculationsUSEPA reduce public and ecosystem risks
$0.09 per acre h t t p : / / w w w. e r s . u s d a . g o v /d a t a - p r o d u c t s / f e r t i l i z -er-use-and-price.aspx
Tegtmeier E.M, Duffy M.D 2004 Ex-ternal costs of agricultural produc-tion in the United States. Int. J. Agr. Sustain. 2, 1–20.
Own calculationsUSDA pesticides data programme
$0.05 per acre h t t p : / / w w w. e r s . u s d a . g o v /d a t a - p r o d u c t s / f e r t i l i z -er-use-and-price.aspx
Tegtmeier E.M, Duffy M.D 2004 Ex-ternal costs of agricultural produc-tion in the United States. Int. J. Agr. Sustain. 2, 1–20.
Own calculations

Farm Sustainability Assessment Report | 46
3 Environmen-tal benefits
Nitrogen fixa-tion
By soybean 40kg N/acre @ $0.30 kg N
Herridge et al. 2008. Global inputs of biological nitrogen fixation in agricultural systems. Plant Soil (2008) 311:1–18
Own calculationsNutrient cy-cling
NPK (0.26 % N, 0.03% P, 0.03% K),
@ $0.30 kg N, $0.16 kg P, $0.24 kg K
FAO 2010. Greenhouse Gas Emis-sions from the Dairy Sector
A Life Cycle Assessment. Rome.Biological con-trol of pests/diseases
Avoided cost of pesti-cide use
$20 per acre per year in animal diseases
Farm records and own calcula-tions
4 Social benefits Employment: E m p l oy m e n t generated on farm leads to benefits to wider commu-nity
Farm records and own calcula-tions
R e c r e a t i o n : Recreational pleasure in ag-riculture
Farm records and own calcula-tions
Education: Op-portunities for non-commer-cial uses
Farm records and own calcula-tions


Further [email protected]
Sustainable Food Trust38 Richmond StreetBristol, UK
http://sustainablefoodtrust.org