Embed Size (px)
Citation preview

United States Department of Agriculture
Farm Labor Markets in the United States and Mexico Pose Challenges for U.S. Agriculture
United States Department of Agriculture
Steven ZahniserJ. Edward TaylorThomas HertzDiane Charlton
Economic Research Service
Economic Information Bulletin Number 201
November 2018

Economic Research Service www.ers.usda.gov
United States Department of Agriculture
Recommended citation format for this publication:
Zahniser, Steven, J. Edward Taylor, Thomas Hertz, and Diane Charlton. Farm Labor Markets in the United States and Mexico Pose Challenges for U.S. Agriculture, EIB-201, U.S. Department of Agriculture, Economic Research Service, November 2018.
Cover image: Getty.
Use of commercial and trade names does not imply approval or constitute endorsement by USDA.
To ensure the quality of its research reports and satisfy governmentwide standards, ERS requires that all research reports with substantively new material be reviewed by qualified technical research peers. This technical peer review process, coordinated by ERS' Peer Review Coordinating Council, allows experts who possess the technical background, perspective, and expertise to provide an objective and meaningful assessment of the output’s substantive content and clarity of communication during the publication’s review.
In accordance with Federal civil rights law and U.S. Department of Agriculture (USDA) civil rights regulations and policies, the USDA, its Agencies, offices, and employees, and institutions participating in or administering USDA programs are prohibited from discriminating based on race, color, national origin, religion, sex, gender identity (including gender expression), sexual orientation, disability, age, marital status, family/parental status, income derived from a public assistance program, political beliefs, or reprisal or retaliation for prior civil rights activity, in any program or activity conducted or funded by USDA (not all bases apply to all programs). Remedies and complaint filing deadlines vary by program or incident.
Persons with disabilities who require alternative means of communication for program information (e.g., Braille, large print, audiotape, American Sign Language, etc.) should contact the responsible Agency or USDA's TARGET Center at (202) 720-2600 (voice and TTY) or contact USDA through the Federal Relay Service at (800) 877-8339. Additionally, program information may be made available in languages other than English.
To file a program discrimination complaint, complete the USDA Program Discrimination Complaint Form, AD-3027, found online at How to File a Program Discrimination Complaint and at any USDA office or write a letter addressed to USDA and provide in the letter all of the information requested in the form. To request a copy of the complaint form, call (866) 632-9992. Submit your completed form or letter to USDA by: (1) mail: U.S. Department of Agriculture, Office of the Assistant Secretary for Civil Rights, 1400 Independence Avenue, SW, Washington, D.C. 20250-9410; (2) fax: (202) 690-7442; or (3) email: [email protected].
USDA is an equal opportunity provider, employer, and lender.

United States Department of Agriculture
Economic Research Service
Economic Information Bulletin Number 201
November 2018
AbstractThe U.S. farm labor market shows many signs of tightening, including producer reports of labor shortages, increases in farm wages, more employment of guest workers through the H-2A Temporary Agricultural Program, and a shrinking supply of farm labor from rural Mexico—the source of most foreign-born farmworkers in the United States. Mexico’s farm labor market has also faced labor constraints over the past several decades. Although Mexican agricultural output continues to grow, rural Mexicans are less likely to work as farmworkers either in Mexico or in the United States, as the Mexican economy transitions toward more focus on the service sector. This report reviews evidence showing that rising educational levels and increased nonfarm employment in Mexico are among the leading drivers of farm labor supply changes in that country. Several options by which U.S. agricultural employers could respond to a tighter labor market are explored, including raising wages, further mechanization, greater employment of guest workers, and switching to less labor-intensive crops.
Keywords: Farm labor, immigration, H-2A program, United States, Mexico
AcknowledgmentsThe authors thank Cesar Escalante, University of Georgia; Peter Feather, USDA, Office of the Chief Economist; Phil Martin, University of California, Davis; and Travis Minor, USDA, Economic Research Service (ERS), for technical peer reviews and Cheryl Christensen and Fred Gale, USDA, ERS, for additional feedback. Thanks, also, to Maria Williams and Cynthia A. Ray, USDA, ERS, for editorial and design services, and to David Nulph, USDA, ERS, for making the map in figure 8. This research was supported by Cooperative Agreement No. 58-3000-5-0061 between ERS and the University of California, Davis.
About the AuthorsSteven Zahniser is an agricultural economist at USDA, ERS, and Thomas Hertz is an econo-mist at USDA, ERS. J. Edward Taylor is a professor at the University of California, Davis, Department of Agricultural and Resource Economics, and Diane Charlton is an assistant professor at Montana State University’s Department of Agricultural Economics and Economics.
Farm Labor Markets in the United States and Mexico Pose Challenges for U.S. Agriculture
Steven Zahniser, J. Edward Taylor, Thomas Hertz, and Diane Charlton

ii Farm Labor Markets in the United States and Mexico Pose Challenges for U.S. Agriculture, EIB-201
USDA, Economic Research Service
Summary . . . . . . . . . . . . . . . . . . . . . . . . . . . . . . . . . . . . . . . . . . . . . . . . . . . . . . . . . . . . . . . . . . . . . iii
Introduction . . . . . . . . . . . . . . . . . . . . . . . . . . . . . . . . . . . . . . . . . . . . . . . . . . . . . . . . . . . . . . . . . . . .1
A High Share of Foreign-Born Workers in Labor-Intensive Agriculture . . . . . . . . . . . . . . . . . .4
Signs of a Tighter Farm Labor Market in the United States . . . . . . . . . . . . . . . . . . . . . . . . . . . .6
Reports From Farmers . . . . . . . . . . . . . . . . . . . . . . . . . . . . . . . . . . . . . . . . . . . . . . . . . . . . . . . . . .6
Rising Agricultural Wages . . . . . . . . . . . . . . . . . . . . . . . . . . . . . . . . . . . . . . . . . . . . . . . . . . . . . . .6
H-2A Temporary Agricultural Program . . . . . . . . . . . . . . . . . . . . . . . . . . . . . . . . . . . . . . . . . . . . .7
Economic Development Reshapes Mexico’s Farm Labor Market . . . . . . . . . . . . . . . . . . . . . . . . . . . . . . . . . . . . . . . . . . . . . . . . . . . . . . . . . . . . . . . . .11
Mexico’s Rural Population Transitions Out of Farm Work . . . . . . . . . . . . . . . . . . . . . . . . . . . . 17
In Search of a More Stable Labor Supply . . . . . . . . . . . . . . . . . . . . . . . . . . . . . . . . . . . . . . . . . . .23
Expanding Guest Worker Programs . . . . . . . . . . . . . . . . . . . . . . . . . . . . . . . . . . . . . . . . . . . . . . .23
Further Mechanization and Use of Mechanical Aids . . . . . . . . . . . . . . . . . . . . . . . . . . . . . . . . .25
Sweetening the Employment Deal . . . . . . . . . . . . . . . . . . . . . . . . . . . . . . . . . . . . . . . . . . . . . . . .27
Changing the Crop Mix . . . . . . . . . . . . . . . . . . . . . . . . . . . . . . . . . . . . . . . . . . . . . . . . . . . . . . . .28
Conclusion . . . . . . . . . . . . . . . . . . . . . . . . . . . . . . . . . . . . . . . . . . . . . . . . . . . . . . . . . . . . . . . . . . . .31
References . . . . . . . . . . . . . . . . . . . . . . . . . . . . . . . . . . . . . . . . . . . . . . . . . . . . . . . . . . . . . . . . . . . .32
Appendix Table . . . . . . . . . . . . . . . . . . . . . . . . . . . . . . . . . . . . . . . . . . . . . . . . . . . . . . . . . . . . . . . .40
Contents

ERS is a primary source of economic research and
analysis from the U.S. Department of Agriculture, providing timely informa-
tion on economic and policy issues related to agriculture, food, the environment, and
rural America.
United States Department of Agriculture
A report summary from the Economic Research Service November 2018
Farm Labor Markets in the United States and Mexico Pose Challenges for U.S. Agriculture
Steven Zahniser, J. Edward Taylor, Thomas Hertz, and Diane Charlton
What Is the Issue?
Many U.S. growers of labor-intensive crops have long relied on immigrant workers from Mexico, including many who are not legally authorized to work in the United States. New data and analysis suggest that the numbers of unauthorized Mexican immigrants in the United States declined significantly after 2007. Research also suggests there has been a long-term decline in the number of people from rural Mexico who want to work in either U.S. or Mexican agricul-ture. Meanwhile, demand for farm labor in both U.S. and Mexican agriculture is rising. This report explores the likely causes of this relative reduction in farm labor supply and discusses the implications for U.S. agriculture.
What Did the Study Find?
Several indications suggest that the farm labor market is tightening in the United States:
• Reports of labor shortages from farmers, growers, and ranchers;
• Rising farm wages, as indicated by USDA’s Farm Labor Survey, including an increase in nonsupervisory wages from 55 percent of the nonfarm average in 2014 to 57 percent in 2017 (see chart, next page);
• Greater employment of nonimmigrant, foreign-born farmworkers through the H-2A Temporary Agricultural Program, as indicated in the program’s certification and visa statistics; and
• A decline in the number of unauthorized immigrants from Mexico living in the United States, as estimated by researchers studying Mexican immigration to the United States.
This last indication—a decline in unauthorized immigration from Mexico—stems from a variety of causes, suggesting that rural Mexico is not likely to generate a steady supply of farm-workers for U.S. agriculture over the long term:
• Expansion of agricultural employment in Mexico since 2008, serving an industry whose fruit, vegetables, and tree nuts are partly exported to the United States;
• Growth in nonagricultural employment opportunities in the Mexican economy, particu-larly in the service sector;
www.ers.usda.gov
United States Department of Agriculture
Farm Labor Markets in the United States and Mexico Pose Challenges for U.S. Agriculture
United States Department of Agriculture
Steven ZahniserJ. Edward TaylorThomas HertzDiane Charlton
Economic Research Service
Economic Information Bulletin Number 201
November 2018
Summary

Farm wages are rising, both in real (inflation-adjusted) terms and in relation to nonfarm wages
Dollars per hour (2017 dollars) Percent
Average real wage for nonsupervisory farm workers (left axis)
Percent of U.S. nonfarm production and nonsupervisory average (right axis)
0 0
50
51
52
53
54
55
56
57
58
9.00
9.50
10.00
10.50
11.00
11.50
12.00
12.50
13.00
1989 1991 1993 1995 1997 1999 2001 2003 2005 2007 2009 2011 2013 2015 2017
// //
Note: Nonfarm wage refers to the average hourly earnings of production and nonsupervisory employees in the private, nonfarm sector.
Source: USDA, Economic Research Service calculations based on data from U.S. Department of Labor, Bureau of Labor Statistics; and USDA, National Agricultural Statistics Service.
• Rising educational levels in rural Mexico, which enable workers to take advantage of the new employment opportunities outside of agriculture; and
• Declining fertility rates in Mexico.
For several reasons, U.S. agricultural employers may find it difficult to offset the decreased supply of farm labor from Mexico with more farmworkers from other countries:
• The United States will have to compete with Mexico and other countries in the Americas that are also expanding agricultural production and recruiting farmworkers;
• Recruiting from countries more distant than Mexico may be costlier; and• Many of the factors that pull Mexicans out of farm work—such as rising education levels and a growing
service economy—are also at play in other developing countries.
In responding to these long-term challenges, U.S. agricultural employers are likely to continue selecting crops and improving technologies to reduce labor requirements and employing management strategies that increase productivity and encourage employee retention.
How Was the Study Conducted?
This study draws conclusions about changing conditions in the U.S. and Mexican markets for hired farm labor using wage data collected by USDA’s Farm Labor Survey and the Bureau of Labor Statistics’ Current Population Survey, certification and visa statistics from the H-2A program, Mexican labor market statistics as reported by the World Bank’s World Development Indicators, and empirical estimates based on the Mexico National Rural Household Survey (Encuesta Nacional a Hogares Rurales de México–ENHRUM), among other sources of economic and policy data.
www.ers.usda.gov

1 Farm Labor Markets in the United States and Mexico Pose Challenges for U.S. Agriculture, EIB-201
USDA, Economic Research Service
Farm Labor Markets in the United States and Mexico Pose Challenges for U.S. Agriculture
Introduction
In the mid-20th century, as the U.S. workforce continued its longrun transition away from farm-work, U.S. growers turned to Mexico to bolster the supply of farm labor. During much of the latter half of the 20th century, workers from rural Mexico provided a plentiful supply of farm labor to the United States at relatively low wages (Martin, 1998; Kandel, 2008). Some entered as guest workers through the Bracero Program (1942-64), the H-2 Visa Program (1953-85), and its successor, the H-2A Temporary Agricultural Program (1986-present), while others crossed the border through either authorized or unauthorized immigration. This large supply of labor at low wages enabled U.S. production of labor-intensive fruit, vegetables, and other horticultural products to expand, despite lower supplies of U.S.-born workers to produce these crops (Martin, 2003). The ready supply of inexpensive labor also discouraged research and investment in labor-saving agri-cultural technologies (Sarig et al., 2000). Finally, it created challenges for unions seeking to orga-nize farmworkers, who had little bargaining power as long as plentiful new migrants were willing to work at prevailing wages.
Today, after decades of expanding agricultural production and increasing immigration from rural Mexico to U.S. farms, the supply of farmworkers from Mexico is declining, and the pace of unau-thorized immigration from Mexico has slowed substantially. Several scholars of Mexican migra-tion have concluded that unauthorized immigration from Mexico is no longer keeping pace with the rate at which unauthorized immigrants are returning to Mexico. Between 2007 and 2015, the estimated number of unauthorized immigrants from Mexico living in the United States declined from 6.9 million to 5.6 million—a decline of 19 percent (Passel and Cohn, 2017). Consistent with this finding, agricultural employers throughout the United States have reported increased difficulty in recent years in securing adequate supplies of labor at economically viable wages. There is also evidence that the remaining farm workforce is aging. All of these signs lead to the question are we reaching the end of an abundant supply of labor in U.S. agriculture? To answer this question, this report explores the likely causes of a diminishing farm labor supply, reviews the evidence indicating that the farm labor markets in both the United States and Mexico have become tighter, and discusses the implications of continued labor shortages for U.S. agriculture. (See box “What Is a Labor Shortage?”)

2 Farm Labor Markets in the United States and Mexico Pose Challenges for U.S. Agriculture, EIB-201
USDA, Economic Research Service
What Is a “Labor Shortage?”
In economics, a labor shortage exists when the number of workers employers wish to hire exceeds the number willing and available to work at the current wage. Under normal circum-stances, wages will rise in this situation to equilibrate supply and demand. However, in the short run, such as at peak harvest time, it may be that no feasible wage increase will attract additional workers: such workers simply are not there and cannot materialize in the timeframe needed. Wage increases in these situations tend to motivate workers to switch from lower wage to higher wage employers, without alleviating the overall shortage.
In the longer run, higher wages should induce more people to work in agriculture, but this supply response may be limited if agricultural jobs are perceived as being less desirable than other jobs in a growing economy, or if higher U.S. wages are not able to draw new immigrants across the border. Researchers have tended to find that the farm labor supply in the United States is not very responsive to wage changes; formally, this relationship is measured by the wage elasticity of labor supply. Three studies conducted more than a quarter century ago yielded estimates of this elasticity ranging from 0.77 to 1.55 (Duffield, 1990; Gunter et al., 1992; Duffield and Coltrane, 1992). More recent research supports the notion that the farm labor supply has a low elasticity, albeit without providing formal estimates (Taylor et al., 2012; Wei et al., 2016). For U.S.-born workers, Clemens (2017) finds that the wage elasticity of labor supplied to agriculture is less than 0.01; this implies that reductions in foreign-born labor do not lead to any appreciable increase in the number of U.S.-born workers seeking employment in agriculture.
On the demand side of the market, competition from lower wage countries that also grow labor-intensive crops limits the wages that U.S. growers can offer and still make a profit. Counter-factual simulations by Richards (2018)—based on an econometric model of equilibrium job search and wage dispersion in California’s farm labor market—suggest that growers can absorb an 8.5-percent increase in wages but not much more. This implies that labor demand falls sharply as wages rise—i.e., labor demand is highly elastic.
Under conditions of a relatively inelastic supply of farm labor and low profit margins, labor short-ages caused by a decrease in labor supply relative to demand will have a more significant effect on employment and production. To explore why, consider box figures 1 and 2, depicting supply and demand in the market for farm labor. In box figure 1, the labor supply schedules are drawn to indicate that supply responds fairly strongly to changes in the wage, whereas the steeper lines in box figure 2 indicate a more limited supply response, consistent with the evidence. Similarly, the labor demand schedule in box figure 1 corresponds to a situation in which growers can raise wages without losing much market share, whereas the demand schedule in box figure 2 applies to a situation in which foreign competition more tightly constrains the ability of growers to pay higher wages, as it does in the United States today.
Continued—

3 Farm Labor Markets in the United States and Mexico Pose Challenges for U.S. Agriculture, EIB-201
USDA, Economic Research Service
What Is a “Labor Shortage?”—continued
LaborDemand
EmploymentE2
Wage
E3 E1 E2 E3 E1
LaborDemand
W3W1
Employment
W3W1
ReducedLaborSupply
ReducedLaborSupply
InitialLaborSupply
InitialLaborSupply
Box figure 1 Box figure 2
Source: USDA, Economic Research Service.
In the initial market equilibrium, wages and employment are given by W1 and E1, respectively. Now suppose that a reduction in immigration from Mexico reduces labor supply, as indicated by the leftward shift of the supply schedule. This reduced supply initially results in a labor shortage indicated by the difference between E1 and E2. In box figure 1, this shortage is eliminated as wages rise from W1 to W3, and employment falls from E1 to E3. In box figure 2, however, the wage increase is more muted, and the employment decrease is larger. Thus, when the response of the labor supply is muted and when foreign competition limits the options of growers, the initial labor shortage will be more problematic: growers will observe that raising wages does not draw many more applicants to their farms, and fewer growers will be able to remain competitive at even modestly higher wages.

4 Farm Labor Markets in the United States and Mexico Pose Challenges for U.S. Agriculture, EIB-201
USDA, Economic Research Service
A High Share of Foreign-Born Workers in Labor-Intensive Agriculture
Labor’s importance to U.S. agriculture varies by sector, with some sectors being highly capital-intensive, while others remain labor-intensive and vulnerable to rising labor expenses. According to the 2012 Agricultural Census, contract and hired labor together accounted for 10 percent of U.S. agriculture’s total operating expenses (table 1). For some parts of agriculture, however, this share was much higher: 40 percent for greenhouse, nursery, and floriculture production; 39 percent for fruit and tree nut farming; and 27 percent for vegetable and melon farming. Contract labor (workers indirectly hired through farm labor contractors) accounted for 19 percent of U.S. agriculture’s total labor expenses (contract labor and hired labor combined) in 2012 but 38 percent of all labor expenses in fruit and tree nut farming and 31 percent in vegetable and melon farming.1
Table 1 Labor’s share of U.S. agriculture’s operating expenses varies by sector
Share of total operating expenses
Sector Contract labor Hired labor
Total (contract
plus hired)
Percent
Total, U.S. agriculture 2.0 8.2 10.2
Oilseed and grain farming 0.5 4.0 4.5
Vegetable and melon farming 8.3 18.8 27.1
Fruit and tree nut farming 14.7 24.0 38.7
Greenhouse, nursery, and floriculture production 2.8 37.6 40.4
Tobacco farming 6.6 17.7 24.3
Cotton farming 1.5 7.8 9.3
All other crop farming 2.4 10.9 13.2
Beef cattle ranching and farming 1.0 4.9 5.9
Cattle feedlots 0.2 1.7 1.8
Dairy cattle and milk production 0.5 9.6 10.2
Hog and pig farming 0.5 4.5 5.0
Poultry and egg farming 0.5 3.2 3.6
Sheep and goat farming 1.4 7.1 8.5
Aquaculture and other animal production 2.3 16.6 18.8
Source: USDA, Economic Research Service calculations using data from 2012 Census of Agriculture (USDA, National Agri-cultural Statistics Service, 2018c).
Many U.S. farmers, ranchers, and growers—especially the ones whose operations have a large share of their expenses devoted to labor—rely on foreign-born workers. According to recent data from the U.S. Department of Labor’s National Agricultural Workers Survey (NAWS), nearly 75 percent of the hired farmworkers in crop production surveyed in fiscal years (FYs) 2013-14 were born outside the United States, and just under 50 percent of hired crop workers lacked the U.S. immigration status needed to work legally in this country (USDOL, ETA, 2017). The Federal Government does not
1 The shares in this sentence are calculated using the data in table 1.

5 Farm Labor Markets in the United States and Mexico Pose Challenges for U.S. Agriculture, EIB-201
USDA, Economic Research Service
collect similar data for workers in livestock, poultry, and animal product production; however, other research suggests that unauthorized immigrants make up a significant share of the dairy farm work-force (Dudley, 2014; Maloney et al., 2016; Susman, 2015).
Estimates of these shares by privately funded research vary substantially from one source to another, reflecting the difficulties of measuring legal immigration status. For instance, the American Farm Bureau Federation (2017) indicates that the unauthorized share of U.S. farm labor overall (both crop and livestock production) is “[a]t least 50-70 percent,” which is potentially higher than the NAWS estimate for crop agriculture of nearly 50 percent. Lower estimates of the foreign-born share and the unauthorized share come from the Pew Research Center, which explored the presence of foreign-born workers in particular industries and occupations using data for 2014 (DeSilver, 2017). In that analysis, 60 percent of graders and sorters of agricultural products and 52 percent of miscellaneous agricultural workers were found to be foreign-born, and 28 percent of graders and sorters and 30 percent of miscellaneous agricultural workers were estimated to be unauthorized. The Pew Research Center’s lower figures, relative to the NAWS data, may reflect NAWS’s more accurate count of immigrant farmworkers using farm-based sampling, as opposed to the household-based methods of the U.S. Census Bureau’s Current Population Survey (CPS), whose data were used by the Pew Research Center.
The high shares of foreign-born workers and unauthorized workers in the U.S. agricultural work-force make the U.S. farm labor market sensitive to a variety of factors—including changes in immi-gration flows, the enforcement of immigration laws, the composition of the workforce with respect to immigration status, and demographic and economic conditions in the United States and in workers’ countries of origin. In a study of the time allocations of farmworkers in crop agriculture during 1994-2012, Luo and Escalante (2017b: 289-90) observe that workers “with flexible employment options” had a “diminished interest in agriculture.” Comparing the time allocations of U.S. citizens, Green Card holders, and undocumented workers, the authors find that undocumented farmworkers tended to devote the highest share of their work weeks to farm labor and Green Card-holding farm-workers the lowest.2 Moreover, the authors provide evidence that undocumented farmworkers were less likely than farmworkers with U.S. citizenship or a Green Card to reduce their number of agri-cultural work weeks when conditions in the nonfarm economy improved.
If the current agricultural workforce—the majority of which is foreign-born—is not replenished by people who are interested in doing farmwork even when they have other employment options, then the supply of farm labor will dwindle, and the average age of the agricultural workforce will rise. Between FYs 1998-2000 and FYs 2013-14, the average age of farmworkers in U.S. crop agriculture increased from 31 years to 38 years, and the share of crop farmworkers 55 or older climbed from 5 percent to 14 percent (USDOL, ETA, 2017). The aging of the agricultural workforce is especially relevant to hired farm labor given the physicality of that work and the tendency of farmworkers to exit the sector as they get older.
2Green Card holders are noncitizens with the legal U.S. immigration status of permanent resident, also known as Lawful Permanent Residents.

6 Farm Labor Markets in the United States and Mexico Pose Challenges for U.S. Agriculture, EIB-201
USDA, Economic Research Service
Signs of a Tighter Farm Labor Market in the United States
Reports From Farmers
Farmer reports of challenging hiring searches are not new, and news articles have signaled this concern for decades.3,4 In California, where farmers in multiple sectors have complained about labor shortages, producers have reportedly raised their wage offers in order to compete for farmworkers. “There’s not enough guys, and everybody is fighting for everybody else’s guys,” said one California grape producer (Kitroeff and Mohan, 2017). Some producers have indicated that a crackdown on the employment of unauthorized farmworkers would have a devastating impact on the California agri-cultural sector. As one producer of peaches, plums, and grapes put it, “If you only have legal labor, certain parts of this industry and this region will not exist” (Dickerson and Medina, 2017).
Producers in other parts of the country have expressed similar concerns. In a listening session held by the House Agriculture Committee, the president of the Florida Farm Bureau summarized the situation in his State: “An insufficient farm labor force continues to plague many agricultural commodity groups ranging from dairy to specialty crops” (Tomson, 2017). Commenting on recent efforts to enforce U.S. immigration restrictions, a representative of a large feed yard in Kansas stated, “The threat of deportation and the potential loss of our workforce has been very terrifying for all of [our] businesses here” (Jamrisko, 2017). A member of the Oregon Wine Board described the labor market as the tightest he has seen in “all my years (30-plus) of active involvement in farming” (Maylack, 2017).
Rising Agricultural Wages
In recent years, producer reports have been joined by other indicators of labor shortages, including rising agricultural wages, as reflected in data collected by the USDA National Agricultural Statistics Service’s (NASS) Farm Labor Survey. Between 2014 and 2017, the average hourly wage for nonsupervisory hired farmworkers (in 2017 dollars) rose from $11.71 to $12.47, an increase of 7 percent (fig. 1). Real wage growth slowed in 2017, largely due to lower rates of nominal wage growth and an uptick in inflation—a trend that has continued into 2018. As of April 2018, nonsupervisory farm wages averaged $12.74 per hour in nominal terms, an increase of 3 percent over April 2017 (USDA, NASS, 2018a).
As figure 1 reveals, the recent increases in the real wage were not unprecedented, but they were among the fastest recorded since 1989. Moreover, growth in farmworker wages was faster than growth in nonfarm wages. Over the period 2014-17, the hourly wage for all nonsupervisory produc-tion workers outside of agriculture rose from $21.37 to $22.05 (in 2017 dollars), an increase of just over 3 percent. As shown in figure 1, the farm wage was 57 percent of the nonfarm wage in 2017, compared with 55 percent in 2014. Furthermore, regional wage data (appendix table 1) show that
3See, for example, Turnbull’s (2011) examination of the Washington apple industry and McKissick and Kane’s (2011) survey of fruit and vegetable growers in Georgia.
4Many of the articles discussed in this section were drawn from a Google News search of recent articles using the search terms “farm labor shortage.”

7 Farm Labor Markets in the United States and Mexico Pose Challenges for U.S. Agriculture, EIB-201
USDA, Economic Research Service
farm wages rose over the past decade at a rate faster than the national rate of 11 percent in several regions: California (18 percent), Northern Plains (17 percent), and Pacific (16 percent).5
Figure 1 Real (inflation-adjusted), nonsupervisory wages in agriculture versus nonfarm average, 1989-2017
Dollars per hour (2017 dollars) Percent
Average real wage for nonsupervisory farm workers (left axis)
Percent of U.S. nonfarm production and nonsupervisory average (right axis)
0 0
50
51
52
53
54
55
56
57
58
9.00
9.50
10.00
10.50
11.00
11.50
12.00
12.50
13.00
1989 1991 1993 1995 1997 1999 2001 2003 2005 2007 2009 2011 2013 2015 2017
// //
Note: Nonfarm wage refers to the average hourly earnings of production and nonsupervisory employees in the private, non-farm sector.
Source: USDA, Economic Research Service calculations using nominal wages for U.S. nonfarm production and nonsuper-visory workers from U.S. Department of Labor, Bureau of Labor Statistics, Current Employment Statistics (USDOL, BLS, 2018b) and nominal wages for nonsupervisory farmworkers from USDA, National Agricultural Statistics Service (2018c). Both sets of nominal wages are converted to real wages using consumer price indices from USDOL, BLS (2018a).
H-2A Temporary Agricultural Program
In addition to reports from farmers and rising wages, another sign of labor scarcity has been the increased use of the H-2A Temporary Agricultural Program, which provides a mechanism for growers to bring in nonimmigrant foreign workers on a temporary or seasonal basis. This increase is noteworthy given the costs associated with the program: State-level minimum wages for H-2A workers are set at the prevailing average farm wage as determined by the Farm Labor Survey, and growers must pay application, visa, and transportation costs, and provide housing. In addition, growers have long complained about the program’s bureaucratic complexity, and some have charged that its administrative processes often move too slowly for workers to arrive on time (Rosenthal, 2016; Sheinin, 2016; Ong, 2015). Despite these barriers, the H-2A program has expanded rapidly in recent years, from about 48,300 positions certified in FY 2005 to 200,000 in FY 2017 (fig. 2). Data
5The Farm Labor Survey is conducted semi-annually by USDA, NASS in cooperation with the U.S. Department of Labor. It provides the basis for quarterly and annual estimates of employment and wages for all workers directly hired by U.S. farms and ranches (excluding Alaska). Farms and ranches in the sample are asked to provide payroll and employment data for their workforce (USDA, NASS, 2018a, 2018b). Undocumented workers should, in principle, be included in payroll and employ-ment estimates.

8 Farm Labor Markets in the United States and Mexico Pose Challenges for U.S. Agriculture, EIB-201
USDA, Economic Research Service
from the first three quarters of FY 2018 indicate that certifications were up 21 percent over the first three quarters of FY 2017.
Figure 2 Number of positions certified and visas granted under the H-2A Temporary Agricultural Pro-gram, fiscal years 1997-2017
Number
0
20,000
40,000
60,000
80,000
100,000
120,000
140,000
160,000
180,000
200,000
1997 1999 2001 2003 2005 2007 2009 2011 2013 2015 2017Fiscal year
Positions certified
Visas granted
Sources: U.S. Department of Labor, Employment and Training Administation, Office of Foreign Labor Certification (2018) (positions certified) and U.S. Department of State, Bureau of Consular Affairs (2018) (visas granted).
The number of H-2A visas granted is less than the number of H-2A positions certified because some recipients of the visa work in multiple H-2A positions and some certified positions go unfilled. Nonetheless, using visas as a measure of H-2A utilization, the program has increased rapidly by that stan-dard, also, from about 31,900 H-2A visas granted in FY 2005 to 161,600 in FY 2017. The vast majority of H-2A visas have gone to people from Mexico—91 percent in FY 2017 (USDOS, BCA, 2018).
The number of H-2A positions certified is an overestimate of average annual employment in the program partly because some H-2A certified positions go unfilled, but more importantly because H-2A jobs are not full-year positions. Using data on individual applications collected by the U.S. Department of Labor, Office of Foreign Labor Certification, we determined that the average dura-tion of an H-2A position in FY 2016 was 6.4 months. Calculated from this finding, the 165,700 H-2A positions certified in FY 2016 amounted to the equivalent of 88,000 full-year positions, or about 6.6 percent of total employment in agriculture and related support services, according to estimates by the U.S. Department of Commerce, Bureau of Economic Analysis (USDOC, BEA, 2018).

9 Farm Labor Markets in the United States and Mexico Pose Challenges for U.S. Agriculture, EIB-201
USDA, Economic Research Service
It is worth noting that despite concerns about farm labor shortages, farm employment has been rising, not falling, in recent years, implying that labor demand is growing. Employment estimates of total full- and part-time employment are available from USDOC, BEA, for two types of farm-workers: (1) directly hired wage and salary workers (excluding self-employed farm operators) and (2) agricultural support service employees (fig. 3). Added together, employment of these two types of farmworkers currently totals about 1.35 million. In evaluating farm employment, it is important to consider both types of workers, as the latter group includes those working for farm labor contrac-tors. Over the last two decades, growth in farm employment has been concentrated in this second category, whose share of the total rose from 34 percent in 1998 to 39 percent in all years since 2013.
Total farm employment has fluctuated since the turn of the 21st century. Between 2003 and 2007, the total fell from roughly 1.3 million to 1.2 million (see fig. 3). This period was one of sustained economic growth that may have drawn some workers out of agriculture. As the economy recovered from the Great Recession of 2007-09, demand for fruit and vegetables continued to increase, thereby stimulating the demand for farm labor. In this improved economic environment, wage and salary employment in agriculture rebounded to its prior levels—above 1.3 million by 2014—despite the decline in the number of unauthorized immigrants from Mexico living in the United States. Much of the growth in farm employment after 2012 reflected expanded use of the H-2A program. Between 2012 and 2017, the total number of wage and salary jobs in agriculture increased by about 90,000 (see fig. 3), while the number of H-2A positions certified increased by about 115,000 (see fig. 2), although on average these workers spent just about 6 months in farm employment.
Figure 3 Wage and salary employment in agriculture and related support services, 1998-2017
Full and part-time jobs (million)
0.0
0.2
0.4
0.6
0.8
1.0
1.2
1.4
1998 2000 2002 2004 2006 2008 2010 2012 2014 2016
Total
Direct hire
Support services
Note: Agricultural support services include a small number of workers in the fishing and forestry sectors.
Source: USDA, Economic Research Service calculations using data from U.S. Department of Commerce, Bureau of Economic Analysis (2018).

10 Farm Labor Markets in the United States and Mexico Pose Challenges for U.S. Agriculture, EIB-201
USDA, Economic Research Service
Wage and salary employment in agriculture and related support services has been concentrated in two parts of the United States: the Far West and the Southeast (fig. 4). Reflecting changes in the total number of farmworkers at the national level, the Far West’s share dropped from 40 percent during the late 1990s to 35 percent in 2006-08, and the Southeast’s share declined from 22 percent to 20 percent. By 2017, the Far West’s share had risen again to 40 percent, while the Southeast’s rebounded slightly to 21 percent. Between 2009 and 2017, farm labor employment grew from roughly 465,000 workers to 536,000 workers in the Far West and from 255,000 to 281,000 in the Southeast.
Figure 4 Regional distribution of wage and salary employment in agriculture and related support services (percent), 2017
New England, 2Mideast, 6
Great Lakes, 8
Plains, 8
Southeast, 21
Southwest, 9Rocky Mountain, 5
Far West, 40
Note: Agricultural support services include a small number of workers in the fishing and forestry sectors.Far West = Alaska, California, Hawaii, Nevada, Oregon, and Washington.Rocky Mountain = Colorado, Idaho, Montana, Utah, and Wyoming.Southwest = Arizona, New Mexico, Oklahoma, and Texas.Southeast = Alabama, Arkansas, Florida, Georgia, Kentucky, Louisiana, Mississippi, North Carolina, South Carolina, Tennes-see, Virginia, and West Virginia.Plains = Iowa, Kansas, Minnesota, Missouri, Nebraska, North Dakota, and South Dakota.Great Lakes = Illinois, Indiana, Michigan, Ohio, and Wisconsin.Mideast = Delaware, District of Columbia, Maryland, New Jersey, New York, and Pennsylvania.
New England = Connecticut, Maine, Massachusetts, New Hampshire, Rhode Island, and Vermont.
Source: USDA, Economic Research Service calculations using data from U.S. Department of Commerce, Bureau of Eco-nomic Analysis (2018).

11 Farm Labor Markets in the United States and Mexico Pose Challenges for U.S. Agriculture, EIB-201
USDA, Economic Research Service
Economic Development Reshapes Mexico’s Farm Labor Market
Many explanations are offered for the diminishing levels of immigration from Mexico, including sociopolitical factors originating on each side of the U.S.-Mexico border. Writing several years after the Great Recession, Cave (2011) emphasized “the buildup of border enforcement and tougher laws limiting illegal immigrants’ rights” in the United States and “expanding economic and educational opportunities, rising border crime, and shrinking families” in Mexico; Passel et al. (2012) identi-fied “the weakened U.S. job market … , heightened border enforcement, a rise in deportations, the growing dangers associated with illegal border crossings, the long-term decline in Mexico’s birth rates and broader economic conditions in Mexico.” Because traditionally most foreign-born farm-workers in the United States come from Mexico, net Mexico-to-U.S. migration levels that are low (or even negative) imply that the existing unauthorized farm workforce is not being replaced. As suggested earlier, this reduced flow of migration, combined with an increase in older workers exiting the agricultural workforce, will cause the U.S. farm labor supply to tighten.
Generally speaking, the long-term process of economic development is a fundamental cause of a dimin-ishing supply of farm labor—not just in Mexico but throughout the world. Many empirical studies have documented this transition of labor out of agriculture, analyzing various stages of the process and their consequences (Timmer, 1988; Alvarez-Cuadrado and Poschke, 2011; Taylor et al., 1996). Figure 5A illus-trates the magnitude and speed of the agricultural transition in countries worldwide.
This graph has two notable characteristics. The first is that nearly every arrow in the figure slopes downward, indicating that as per capita income rises, the share of the population working in agri-culture declines. The second is that the slopes of the arrows are steep at low levels of gross domestic product (GDP), meaning that, at those low levels, a small rise in per capita income leads to a dramatic decline in the share of individuals working in agriculture. The slopes of the arrows begin to flatten only once the vast majority of the workforce has already transitioned out of farm work.6 For the world as a whole, real per capita income increased from about $8,900 during 1991-93 to $14,800 during 2014-16, while the share of the total population employed in agriculture dropped from 42 percent to 29 percent (World Bank, 2018).
Figure 5B isolates three countries—China, Mexico, and the United States—at different stages of the agricultural transition. Still at the early stages of this transition, China’s rate of rural-to-urban migration in recent decades has been of historic proportions (Gale et al., 2002; Li and Zahniser, 2002; Zhang and Song, 2003; Wang et al., 2014), so the slope of China’s arrow is very steep. Mexico is further along in this transition, even though its agricultural employment share is still rapidly declining. The vast majority of the U.S. labor force transitioned out of agriculture well before 1990. By 1969, only 5 percent of the U.S. workforce was employed in agriculture. In 2017, agriculture accounted for about 13 percent of total employment in Mexico, compared with 1.5 percent in the United States (World Bank, 2018).
6In 18 of the 170 countries depicted in figure 5A—Argentina, Botswana, Central African Republic, Comoros, Djibouti, Ecuador, El Salvador, Ethiopia, Guatemala, Macedonia, Mali, Niger, Peru, Senegal, Tajikistan, Uganda, Venezuela, and Zimbabwe—agriculture’s share of total employment increased between 1991-93 and 2014-16. Most of the increases are less than 5 percentage points, and several of the larger increases seem to be the result of methodological changes in the share’s estimation (Ecuador, Mali, and Peru are noteworthy examples of this effect) implemented during the first decade of the 21st century.

12 Farm Labor Markets in the United States and Mexico Pose Challenges for U.S. Agriculture, EIB-201
USDA, Economic Research Service
Figure 5A Income growth and the share of labor working in agriculture worldwide
0
10
20
30
40
50
60
70
80
90
100
0 20,000 40,000 60,000 80,000 100,000 120,000
GDP per capita, PPP (2011 international dollars)
Employment in agriculture (percentage of total employment)
Figure 5B Focus on China, Mexico, and the United States
Employment in agriculture (percentage of total employment)
China, 1991-93
China, 2014-16
Mexico, 1991-93
Mexico, 2014-16
United States, 1991-93United States, 2014-16
0 20,000 40,000 60,000 80,000 100,000 120,000
GDP per capita, PPP (2011 international dollars)
100
90
80
70
60
50
40
30
20
10
0
Note: Figures are updated versions of similar figures in Taylor and Lybbert (2015: 247). Each arrow in the figure represents a country. Agriculture is broadly defined to include agriculture, forestry, hunting, and fishing. The origin of the arrow corresponds to the country’s position in 1991-93, and the endpoint of the arrow indicates the country’s position in 2014-16. (Both origin and endpoint are based on annual averages.) GDP = gross domestic product. PPP = purchasing power parity.
Source: USDA, Economic Research Service calculations using data from World Bank (2018).

13 Farm Labor Markets in the United States and Mexico Pose Challenges for U.S. Agriculture, EIB-201
USDA, Economic Research Service
A closer inspection of Mexico’s employment numbers reveals that agriculture’s share of total employment remained in the neighborhood of 13-14 percent after 2008. In absolute terms, the number of workers employed in Mexican agriculture declined from 8.1 million in 1991 to 5.9 million in 2008, before increasing to 7.1 million in 2017 (fig. 6).7 During 1991-2008, Mexico’s agricultural GDP tended to rise faster than agricultural employment declined, thereby allowing the sector’s average product of labor to increase by 76 percent. As agricultural employment increased after 2008, labor productivity initially fell, but from 2016 to 2017, labor productivity returned to levels to 2008.8
Figure 6 The average product of labor on Mexican farms increased roughly 75 percent between 1991 and 2008
Value added per worker (constant 2010 U.S. dollars)
4
5
6
7
8
9
10
0
1,000
2,000
3,000
4,000
5,000
6,000
1991 1993 1995 1997 1999 2001 2003 2005 2007 2009 2011 2013 2015 2017
Agriculture value added per worker (left axis)
Employment in agriculture (right axis)
Employment in agriculture (millions)
Notes: For the data presented in this figure, the agricultural sector is defined broadly to include agriculture, forestry, hunting, and fishing. Agricultural employment is calculated by multiplying the total population, age 15 or above, by the employment-to-population ratio for this age group and then by agriculture’s share of total employment.
Source: USDA, Economic Research Service calculations using data from World Bank (2018).
7The employment statistics in figure 6 are calculated using various indicators from World Bank (2018). Mexico’s National Occupation and Employment Survey (ENOE—Encuesta Nacional de Ocupación y Empleo) provides roughly similar num-bers, showing that employment in the primary sector (agriculture, forestry, fishing, and hunting) increased from 6.1 million in 2008 to 6.8 million in 2017 (INEGI, 2018b).
8It is not known what portion of the people who left agricultural employment in Mexico since 1991 migrated to the United States, with or without legal authorization. Gonzalez-Barrera (2015) estimates that the total number of unauthor-ized Mexican immigrants in the United States increased from 2.9 million in 1995 to a peak of 6.9 million in 2007 and then decreased to 5.6 million in 2014.
14 Farm Labor Markets in the United States and Mexico Pose Challenges for U.S. Agriculture, EIB-201
USDA, Economic Research Service
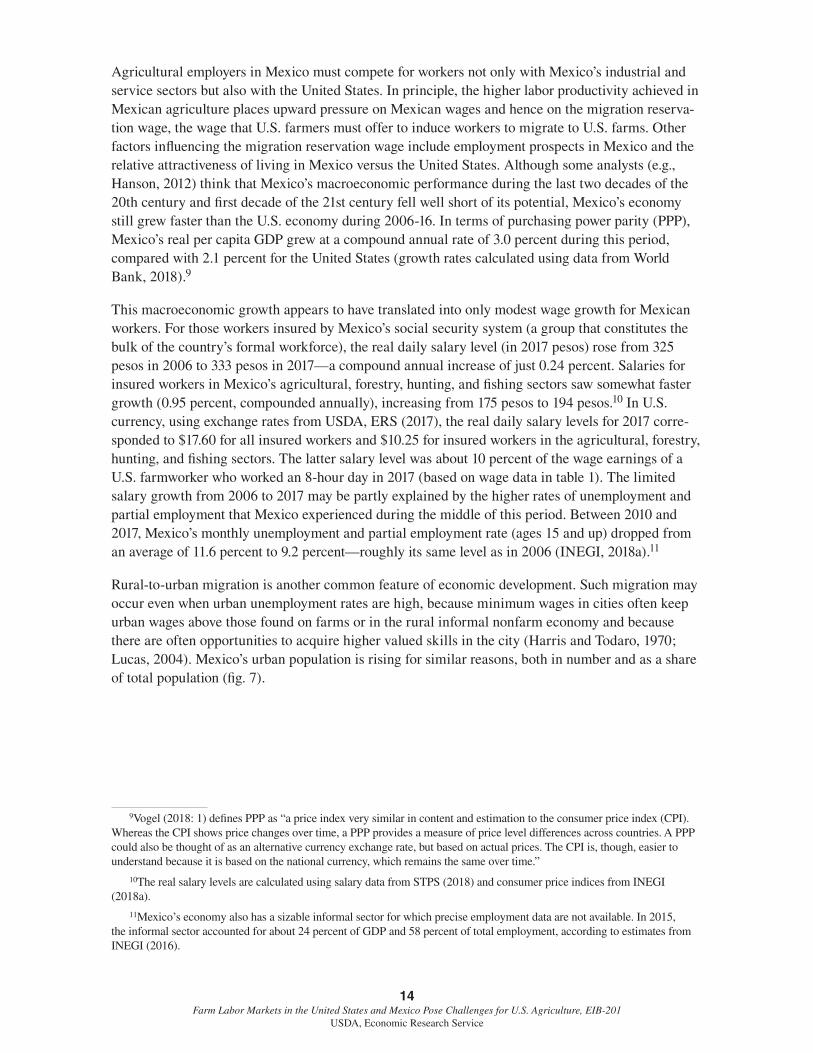
Agricultural employers in Mexico must compete for workers not only with Mexico’s industrial and service sectors but also with the United States. In principle, the higher labor productivity achieved in Mexican agriculture places upward pressure on Mexican wages and hence on the migration reserva-tion wage, the wage that U.S. farmers must offer to induce workers to migrate to U.S. farms. Other factors influencing the migration reservation wage include employment prospects in Mexico and the relative attractiveness of living in Mexico versus the United States. Although some analysts (e.g., Hanson, 2012) think that Mexico’s macroeconomic performance during the last two decades of the 20th century and first decade of the 21st century fell well short of its potential, Mexico’s economy still grew faster than the U.S. economy during 2006-16. In terms of purchasing power parity (PPP), Mexico’s real per capita GDP grew at a compound annual rate of 3.0 percent during this period, compared with 2.1 percent for the United States (growth rates calculated using data from World Bank, 2018).9
This macroeconomic growth appears to have translated into only modest wage growth for Mexican workers. For those workers insured by Mexico’s social security system (a group that constitutes the bulk of the country’s formal workforce), the real daily salary level (in 2017 pesos) rose from 325 pesos in 2006 to 333 pesos in 2017—a compound annual increase of just 0.24 percent. Salaries for insured workers in Mexico’s agricultural, forestry, hunting, and fishing sectors saw somewhat faster growth (0.95 percent, compounded annually), increasing from 175 pesos to 194 pesos.10 In U.S. currency, using exchange rates from USDA, ERS (2017), the real daily salary levels for 2017 corre-sponded to $17.60 for all insured workers and $10.25 for insured workers in the agricultural, forestry, hunting, and fishing sectors. The latter salary level was about 10 percent of the wage earnings of a U.S. farmworker who worked an 8-hour day in 2017 (based on wage data in table 1). The limited salary growth from 2006 to 2017 may be partly explained by the higher rates of unemployment and partial employment that Mexico experienced during the middle of this period. Between 2010 and 2017, Mexico’s monthly unemployment and partial employment rate (ages 15 and up) dropped from an average of 11.6 percent to 9.2 percent—roughly its same level as in 2006 (INEGI, 2018a).11
Rural-to-urban migration is another common feature of economic development. Such migration may occur even when urban unemployment rates are high, because minimum wages in cities often keep urban wages above those found on farms or in the rural informal nonfarm economy and because there are often opportunities to acquire higher valued skills in the city (Harris and Todaro, 1970; Lucas, 2004). Mexico’s urban population is rising for similar reasons, both in number and as a share of total population (fig. 7).
9Vogel (2018: 1) defines PPP as “a price index very similar in content and estimation to the consumer price index (CPI). Whereas the CPI shows price changes over time, a PPP provides a measure of price level differences across countries. A PPP could also be thought of as an alternative currency exchange rate, but based on actual prices. The CPI is, though, easier to understand because it is based on the national currency, which remains the same over time.”
10The real salary levels are calculated using salary data from STPS (2018) and consumer price indices from INEGI (2018a).
11Mexico’s economy also has a sizable informal sector for which precise employment data are not available. In 2015, the informal sector accounted for about 24 percent of GDP and 58 percent of total employment, according to estimates from INEGI (2016).

15 Farm Labor Markets in the United States and Mexico Pose Challenges for U.S. Agriculture, EIB-201
USDA, Economic Research Service
Figure 7 Mexico’s population is becoming increasingly urban
Number of people (million) Percent
55
60
65
70
75
80
85
90
40
50
60
70
80
90
100
110
1980 82 84 86 88 90 92 94 96 98 2000 02 04 06 08 10 12 14 16
Urban population (left axis) Urban share of total population (right axis)
Source: USDA, Economic Research Service calculations using data from World Bank (2018).
Mexico-U.S. migration has undergone many changes in recent years in addition to the great reduc-tion in net migration from Mexico to the United States observed by Passel et al. (2012) and Douglas Massey (as cited by Cave (2011)) of the Mexican Migration Project. Chort and de la Rupelle (2016) find that migration networks are a critical and changing component of migration. Income levels may be a constraining factor to migration in many of Mexico’s poorer regions, as families must be able to fund costs of migration. However, despite these cost constraints, migration from poorer states in Mexico has increased in recent years. Within the United States, farmworkers are now less migratory than in the past; more farmworkers are married and live with their families; and more farmworkers are women (Fan et al., 2015). These and other changes to the immigrant and farm workforces will change the availability of seasonal workers to U.S. farms.
Empirical research has reached mixed conclusions on the relationships among border enforcement, migration flows, and the total number of unauthorized immigrants in the United States. Hanson and Spilimbergo (1999) find that apprehensions at the border were positively associated with Federal expenditures on border enforcement, implying that enforcement should reduce the number of unau-thorized immigrants who succeed in entering the United States. Moreover, Alden (2017) reviews new evidence that the number of successful illegal crossings of the Southern border fell from 1.8 million in 2000 to just 200,000 in 2015. Alden argues that “Border enforcement has been a signifi-cant reason for the decline—in particular, the growing use of ‘consequences’ such as jail time for illegal border crossers has had a powerful effect in deterring repeated border crossing efforts” (p. 481). However, Cornelius and Salehyan (2007) find evidence that individuals from two rural communities in Mexico who intended to migrate to the United States without documentation were undeterred by increased border enforcement, even if they had to attempt crossing several times. Moreover, Massey et al. (2016) conclude that increased enforcement deterred immigrants from

16 Farm Labor Markets in the United States and Mexico Pose Challenges for U.S. Agriculture, EIB-201
USDA, Economic Research Service
returning to Mexico by reducing their possibility of re-entering the United States at a later date. They note that between 1986 and 2008, the unauthorized population in the United States grew four-fold, despite a four-fold increase in hours spent patrolling the border.
Several studies (Amuedo-Dorantes and Bansak, 2012; Kostandini et al., 2014; Bohn et al., 2015; Orrenius and Zavodny, 2015; Ifft and Jodlowski, 2016) have attempted to identify the effects of immigration enforcement on local labor markets by analyzing local enforcement programs (such as the 287(g) program, in which a State or local law enforcement entity receives delegated authority for immigration enforcement within its jurisdiction)12 and State-level immigration mandates (such as required use of E-Verify, a web-based system that allows enrolled employers to confirm the eligiblity of their employees to work in the United States [USDHS, 2018]). These studies generally find reduced populations of likely unauthorized immigrants in affected juris-dictions after the new enforcement mechanisms were implemented. Moreover, Kostandini et al. (2014) and Ifft and Jodlowski (2016) document that local immigration enforcement raised farm labor costs and reduced profitability. However, Orrenius and Zavodny (2015) find that unauthor-ized immigrants responded to local enforcement initiatives by moving to other U.S. locations rather than returning to their home country, suggesting that local enforcement does not affect national totals of the unauthorized population.
In sum, in the long run, economic development is associated with a reduced share of the popula-tion working in agriculture. Rural Mexicans have multiple economic opportunities, some of which require migration from their hometowns. U.S. farms, which depend heavily on a foreign-born work-force, must compete with the Mexican agricultural sector, the Mexican nonfarm sector (with jobs primarily located in urban locations), and the U.S. nonfarm sector for a limited supply of workers. Potential workers weigh the costs and benefits of each of these opportunities, including the costs and risks of migration to urban areas or across an international border, the returns to their skills and education in each sector and location, and the potential opportunities that may form from sector- and location-specific work experience and job networks.
12See USDHS, ICE (2018) for a description of the 287(g) program.

17 Farm Labor Markets in the United States and Mexico Pose Challenges for U.S. Agriculture, EIB-201
USDA, Economic Research Service
Mexico’s Rural Population Transitions Out of Farm Work
Social and demographic changes influence workers’ decisions to seek work in farm or nonfarm occupations in Mexico or to emigrate to the United States. For example, if returns to education are higher in the nonfarm sector, rising rural education in Mexico may decrease the probability that rural people choose to work in the farm sector. Likewise, if the returns to education are higher in Mexico than in the United States, as Chiquiar and Hanson (2005) demonstrate, then the probability that an individual locates in Mexico’s nonfarm sector rises with educational level, and the prob-ability that an individual selects any other option declines.
Rural Mexicans may migrate either to urban centers within Mexico, to other rural communities within Mexico, or to the United States, anticipating opportunities for higher pay and for gaining more valued skills (Lucas, 2004). Of the immigrants who join the U.S. farm sector, few remain in agricultural work for long. Policies intended to legalize the farm workforce, such as the opportuni-ties for legal residency offered by the Immigration Reform and Control Act of 1986 (IRCA), resulted in the transfer of newly legalized workers to other industries (Martin, 1994). Luo and Escalante (2017b) find that unauthorized workers spend more of their time in farm work and less of their time in nonfarm work than do Green Card holders and foreign-born citizens, suggesting that immigrants choose to work in the farm sector only when their options are more limited. Moreover, even unau-thorized workers spend less time in the farm sector and more time in the nonfarm sector the longer they remain in the United States. During the Great Recession, Green Card holders and citizens managed to increase the time they spent in the nonfarm sector and reduce their time in the farm sector, even though unemployment rates in the nonfarm sector were high. These findings suggest that many immigrant farmworkers anticipate that they will eventually secure better jobs outside of agriculture—with higher wages, better benefits, and more comfortable working conditions.
Charlton and Taylor (2016) examine the work histories of rural Mexicans to investigate the factors influ-encing the choice to migrate to jobs in Mexico or in the United States. Until recently, it was not possible to test for a downward trend in the farm labor supply from rural Mexico, or to explain why such a trend might be occurring, because the data for tracking the movement of rural Mexicans into and out of farm jobs were not available. Charlton and Taylor surmount this challenge by using data from the Mexico National Rural Household Survey (Encuesta Nacional a Hogares Rurales de México—ENHRUM).
ENHRUM was constructed to be representative of rural Mexico at the national level and within each of Mexico’s five census regions (fig. 8). Surveys were carried out in 80 randomly chosen communi-ties throughout rural Mexico, and the same households were interviewed in 2002, 2007, and 2010. Work histories were collected for everyone in the household, including all children of the household head and his or her spouse, going back to 1980. Thus, the ENHRUM data cover the entire period from 1991 to 2008 (see fig. 6) when total agricultural employment in Mexico declined, as well as the first 2 years of 2009-17 when such employment partially recovered (fig. 6). For every household member and every year, ENHRUM recorded whether the individual worked primarily in the agricul-tural or nonagricultural sector, whether self-employed or working for a wage (which could be in-kind in the case of farm work in the village), in the village, elsewhere in Mexico, or in the United States. The analytic sample was limited to working-age individuals, ages 15-65. If the individual worked primarily in agriculture in any one of these three locations, then it was recorded that the individual worked in agriculture that year. Overall, the sample contains 31 years of panel data, describing the labor histories of 9,837 individuals.

18 Farm Labor Markets in the United States and Mexico Pose Challenges for U.S. Agriculture, EIB-201
USDA, Economic Research Service
Figure 8 Map of villages in ENHRUM data
Center
Center-West
Northeast
Northwest
South-Southeast
Survey communities
Census regions
Source: USDA, Economic Research Service, using data from Encuesta Nacional a Hogares Rurales de México (ENHRUM) and from Instituto Nacional de Estadística y Geografía (INEGI), as compiled by Giovannelli (2011).
By applying regression models to the ENHRUM data, Charlton and Taylor (2016) estimate the probability that an individual from rural Mexico worked in agriculture in a given year during 1980-2010 in either Mexico or the United States. The authors find a significant negative trend in the farm labor supply from rural Mexico. During this period, the mean probability of working in agriculture declined by nearly a full percentage point (0.97) each year. Scaling by the size of the working-age population in rural Mexico, this amounts to a decline in the farm labor supply from rural Mexico of over 150,000 people per year. Moreover, the probability of working in agriculture is found to have declined in every Mexican region, and the negative trend in each region was significant at the 99-percent level of confidence.
Charlton and Taylor (2016) also find that the expected probability of working in agriculture differed substantially from one rural Mexican region to the next (fig. 9). At the start of the period studied (1980), the probability of working in agriculture was highest in Mexico’s Central, West-Central, and South-Southeast regions—each with a probability of about 50 percent. By the end of the period (2010), the ranking of the regions had changed. The Central and South-Southeast regions had the highest probabilities (each around 0.27), while the West-Central region had a probability of about 0.18, similar to the other two regions. The sharp decline in the probability for the West-Central region is particularly telling, as that region once had provided numerous workers to U.S. agriculture and other sectors of the U.S. economy (Massey et al., 1987). Though people in Mexico’s southern regions were more likely to work in agriculture in 2010, the trends indicated that individuals from all regions of rural Mexico were quickly transitioning away from agricultural work during 1980-2010 (see fig. 9). Thus, looking further South into Mexico in order to find farmworkers is not a likely long-term solution for supplying workers to U.S. farms.

19 Farm Labor Markets in the United States and Mexico Pose Challenges for U.S. Agriculture, EIB-201
USDA, Economic Research Service
Figure 9 Predicted probability of working in agriculture, by Mexican Census region, 1980-2010
.5
.4
.3
.2
Probability
South-Southeast
West-CentralNortheast
Central
Northwest
1980 1990 2000 2010
Source: Charlton and Taylor (2016).
Many aspects of economic development could potentially contribute to a decline in the supply of farm labor from rural Mexico. One factor is a declining fertility rate: in 1980, Mexico’s fertility rate was 4.6 births per woman; in 2017, it was 2.2 (USDOC, Census Bureau, 2017). By comparison, the U.S. fertility rate in 2017 was 1.9. Higher fertility rates are associated with lower levels of develop-ment and lower per capita income (Anker, 1978). Many factors are linked to reduced fertility rates, including improvements in agricultural efficiency, increased education, and increased female labor force participation (Self, 2008). Lower fertility rates mean fewer children who could grow up to be farmworkers. Worldwide, as women’s schooling levels and labor market opportunities have risen, fertility rates have fallen, and workers have moved out of agriculture.
Rising job opportunities outside of agriculture—particularly in the service sector—are also likely to pull workers out of agriculture. To see how this effect manifested in Mexico, consider how the size and structure of the Mexican economy have changed since the turn of the 21st century (table 2). In 2017, Mexico’s real GDP per capita was about 162,000 pesos, compared with about 145,000 pesos (at 2017 prices) in 2000, a 12-percent increase. In 2000-17, agriculture (including forestry, fishing, and hunting) grew faster than the economy as a whole, but the service sector grew nearly twice as fast as agriculture in real per capita terms. Specifically, real per capita GDP increased by 13.1 percent in agriculture; decreased by 8.5 percent in mining, construction, manufacturing, and utilities; and increased by 24.5 percent in services.

20 Farm Labor Markets in the United States and Mexico Pose Challenges for U.S. Agriculture, EIB-201
USDA, Economic Research Service
Table 2 Mexico’s service sector has strongly outpaced the agricultural sector since the turn of the 21st century, in terms of per capita GDP
Sector
Per capita GDP
Change2000 2017
Pesos (2017 prices) Percent
Agriculture, forestry, fishing, and hunting (primary) 4,799 5,427 13.1
Mining, utilities, construction, and manufacturing (secondary) 54,838 50,174 -8.5
Services (tertiary) 85,670 106,626 24.5
Total 145,307 162,226 11.6
GDP = gross domestic product. CPI = consumer price index.
Sources: USDA, Economic Research Service calculations using data from using GDP and CPI data from Instituto Nacional de Estadística y Geografía (2018a) and population data from U.S. Department of Commerce, Census Bureau (2017).
A major change in Mexican agriculture since the turn of the 21st century has been the expansion of fruit, vegetable, and tree nut production—the same sectors in which U.S. growers traditionally have relied on foreign-born labor. Between 2000 and 2016, Mexican production of these commodities increased from about 27 million metric tons to 40 million metric tons—an increase of 47 percent (table 3). This growth reflected both rising demand for such products in the Mexican market and greater participation of Mexican growers in the U.S. market. Among Mexico’s 20 leading produce commodities (all listed in table 3), production more than doubled between 2000 and 2016 for six crops, which increased as follows: blackberries (1,736 percent), asparagus (330 percent), strawber-ries (232 percent), pecans (136 percent), apples (112 percent), and avocados (108 percent). These increases translated into strong labor demand in certain parts of Mexican agriculture and help to explain the observed increase in total agricultural employment in Mexico since 2008. Part of this demand, however, was offset by improvements in labor productivity, which increased by 33 percent in Mexican agriculture as a whole between 2000 and 2017 (see fig. 6).
In the last two decades or so, rural Mexico has seen an expansion of education, which delays the entry of young Mexicans into the workforce and helps them move into higher skilled jobs—mostly outside agriculture. Public spending on education rose 36 percent between 1995 and 2001 (Santibañes et al., 2005), which was among the highest rates of the member countries of the Organization for Economic Co-operation and Development (OECD), though still low when compared with public spending on education in high-income countries. In 2014, public spending on primary through post-secondary, non-tertiary education equaled $3,049 per student in Mexico, compared with $12,176 in the United States, while public spending per student on tertiary education equaled $8,949 in Mexico and $29,328 in the United States (OECD, 2018a).13
13The OECD defines tertiary education as “the highest level of education,” ranging from “theoretical programmes leading to advanced research or high skill professions such as medicine and more vocational programmes leading to the labour market.”

21 Farm Labor Markets in the United States and Mexico Pose Challenges for U.S. Agriculture, EIB-201
USDA, Economic Research Service
Table 3 Mexican production of fruit, vegetables, and tree nuts: 2016 versus 2000
Crop
Agricultural year 2016 Agricultural year 2000
Area harvested Output Yield Value
Area har-vested Output Yield Value
Thousands of hectares
Thousands of metric
tonsMetric tons per hectare
Millions of U.S. dollars
Thousands of hectares
Thousands of metric
tonsMetric tons per hectare
Millions of U.S. dollars
Avocados 180.54 1,889.35 10.47 1,621.32 94.10 907.44 9.64 445.71
Green chiles 170.14 3,279.91 19.28 1,293.26 145.67 1,741.68 11.96 775.78
Tomatoes 51.30 3,349.15 65.29 1,278.77 74.63 2,086.03 27.95 846.03
Dry beans 1,575.99 1,088.77 0.69 710.95 1,502.82 887.87 0.59 490.33
Potatoes 64.34 1,796.81 27.93 579.78 67.97 1,627.22 23.94 571.10
Lemons 161.92 2,415.87 14.92 553.17 121.14 1,639.58 13.54 349.12
Pecans 83.51 141.82 1.7 524.24 48.82 59.98 1.23 133.14
Blackberries 12.96 248.51 19.17 496.01 1.15 13.53 11.73 16.45
Asparagus 24.79 216.87 8.75 426.98 13.41 50.44 3.76 99.05
Oranges 314.59 4,603.25 14.63 423.09 323.62 3,812.68 11.78 320.18
Onions 51.50 1,635.05 31.75 421.71 48.64 1,002.49 20.61 198.20
Strawberries 11.09 468.25 42.22 419.31 6.50 141.13 21.7 80.77
Bananas 78.32 2,384.78 30.45 365.72 72.36 1,870.63 25.85 318.72
Mangoes 184.89 1,888.19 10.21 322.40 154.30 1,559.35 10.11 318.97
Grapes 29.57 351.31 11.88 305.58 39.15 371.80 9.5 199.72
Cucumbers 18.60 886.27 47.64 257.92 17.47 459.26 26.28 79.46
Papayas 16.82 951.92 56.6 252.19 17.15 672.38 39.2 138.50
Apples 54.25 716.93 13.22 249.60 54.72 337.97 6.18 125.78
Raspberries 6.21 112.66 18.15 209.52 0.17 1.14 6.6 1.86
Watermelons 38.67 1,199.65 31.02 205.02 46.14 1,048.53 22.73 127.97
All other crops 830.00 10,358.78 -- 2,500.11 789.61 6,936.73 -- 1,771.03
Total 3,960.00 39,984.10 -- 13,416.66 3,639.55 27,227.85 -- 7,407.85
Source: USDA, Economic Research Service calculations using data from Secretaría de Agricultura, Ganadería, Desarrollo Rural, Pesca, y Ali-mentación, Servicio de Información Agroalimentaria y Pesquera (2018). Value of production converted from Mexican pesos to U.S. dollars using exchange rates from Board of Governors of the Federal Reserve System, as retrieved from Federal Reserve Bank of St. Louis (2018).
22 Farm Labor Markets in the United States and Mexico Pose Challenges for U.S. Agriculture, EIB-201
USDA, Economic Research Service
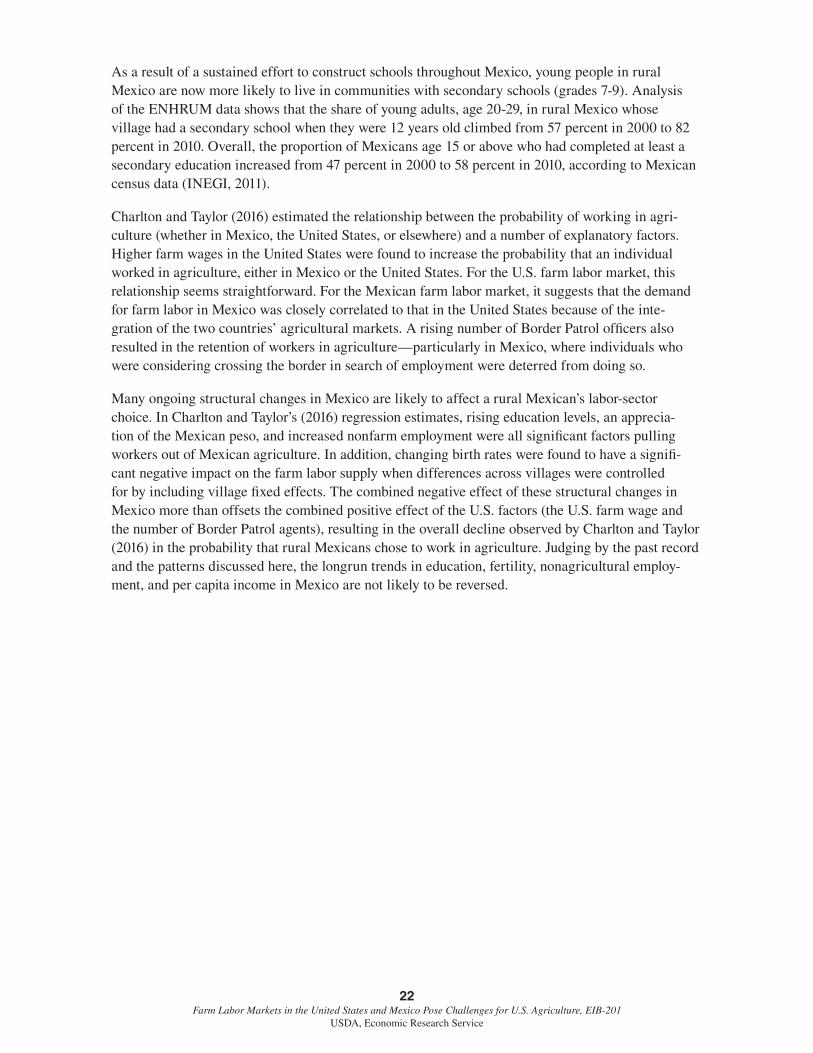
As a result of a sustained effort to construct schools throughout Mexico, young people in rural Mexico are now more likely to live in communities with secondary schools (grades 7-9). Analysis of the ENHRUM data shows that the share of young adults, age 20-29, in rural Mexico whose village had a secondary school when they were 12 years old climbed from 57 percent in 2000 to 82 percent in 2010. Overall, the proportion of Mexicans age 15 or above who had completed at least a secondary education increased from 47 percent in 2000 to 58 percent in 2010, according to Mexican census data (INEGI, 2011).
Charlton and Taylor (2016) estimated the relationship between the probability of working in agri-culture (whether in Mexico, the United States, or elsewhere) and a number of explanatory factors. Higher farm wages in the United States were found to increase the probability that an individual worked in agriculture, either in Mexico or the United States. For the U.S. farm labor market, this relationship seems straightforward. For the Mexican farm labor market, it suggests that the demand for farm labor in Mexico was closely correlated to that in the United States because of the inte-gration of the two countries’ agricultural markets. A rising number of Border Patrol officers also resulted in the retention of workers in agriculture—particularly in Mexico, where individuals who were considering crossing the border in search of employment were deterred from doing so.
Many ongoing structural changes in Mexico are likely to affect a rural Mexican’s labor-sector choice. In Charlton and Taylor’s (2016) regression estimates, rising education levels, an apprecia-tion of the Mexican peso, and increased nonfarm employment were all significant factors pulling workers out of Mexican agriculture. In addition, changing birth rates were found to have a signifi-cant negative impact on the farm labor supply when differences across villages were controlled for by including village fixed effects. The combined negative effect of these structural changes in Mexico more than offsets the combined positive effect of the U.S. factors (the U.S. farm wage and the number of Border Patrol agents), resulting in the overall decline observed by Charlton and Taylor (2016) in the probability that rural Mexicans chose to work in agriculture. Judging by the past record and the patterns discussed here, the longrun trends in education, fertility, nonagricultural employ-ment, and per capita income in Mexico are not likely to be reversed.

23 Farm Labor Markets in the United States and Mexico Pose Challenges for U.S. Agriculture, EIB-201
USDA, Economic Research Service
In Search of a More Stable Labor Supply
Martin (2017: 20-23) identifies four strategies that U.S. agricultural employers are pursuing in response to the contracting labor supply from Mexico:
1. Supplementing the current supply of labor with guest workers;
2. Substituting or replacing workers with machines;
3. Stretching the current supply of labor through the use of mechanical aids; and
4. Satisfying current workers by offering additional benefits and bonuses and improving working conditions, with the aim of retaining workers longer.
Another possibility is to shift production away from labor-intensive crops.
Expanding Guest Worker Programs
One option for growers is to continue to increase their reliance on the H-2A program, which has no numerical cap on the number of workers who may be employed. In recent years, some grower asso-ciations have sought modifications to the existing program or the creation of a new agricultural guest worker program that would reduce the wage and non-wage costs of employing such workers. If these changes were implemented, the number of guest workers employed in U.S. agriculture could grow more rapidly. The program would also likely expand if employers were allowed to recruit year-round workers, rather than being limited to seasonal workers who can work a maximum of 10 months. In particular, this might permit dairy farm employers, who have constant year-round labor needs, to employ guest workers.
The declining farm labor supply in Mexico suggests that securing more guest workers from rural Mexico will not adequately fill U.S. agriculture’s longrun labor needs. Looking farther south for guest workers would also involve challenges. The rural population of Central America is smaller than that of Mexico (19 million for Belize, Costa Rica, El Salvador, Guatemala, Honduras, Nicaragua, and Panama combined, versus 26 million for Mexico, according to 2017 data from the World Bank (2018)), and Central America’s share of population employed in agriculture has fallen quickly, making that region’s rural population too small to substitute completely for the Mexican workers who are currently transitioning out of agriculture (Martin and Taylor, 2013).
Furthermore, to employ more Central American workers, U.S. growers would have to compete not only with growers in Central America but also with those in Canada and Mexico. Canada oper-ates a guest worker program called the Temporary Foreign Worker Program (TFWP) that “allows Canadian employers to hire foreign nationals to fill temporary labour and skill shortages when quali-fied Canadian citizens are not available” (Government of Canada, 2015). The TFWP has several components (“streams” in the Canadian vernacular) that allow for the temporary employment of foreign-national farmworkers in primary agriculture. For production included in the National Commodities List, there is the Seasonal Agricultural Worker Program (SAWP) for temporary workers from Mexico or a set of participating Caribbean countries and the Agricultural Stream for

24 Farm Labor Markets in the United States and Mexico Pose Challenges for U.S. Agriculture, EIB-201
USDA, Economic Research Service
temporary workers from other countries.14 For production not included in the National Commodities List, there is a stream for high-wage positions and another for low-wage positions (Government of Canada, 2018). Including all of these components, there were about 53,000 positions for agricultural guest workers in Canada in 2015 (table 4). Not every position, however, leads to the issuance of a work permit by immigration authorities.
Table 4 Number of temporary foreign worker positions authorized by the Canadian Government’s labor market assessments
Type of foreign worker position 2008 2009 2010 2011 2012 2013 2014 2015
Seasonal Agricultural Worker Program (SAWP) 27,849 28,782 27,687 28,835 29,021 34,042 36,718 41,702
Agricultural Stream 0 0 0 2,156 7,680 8,480 8,106 9,977
Higher Skilled 1,190 946 1,131 928 1,192 937 858 485
Lower Skilled 6,145 7,475 7,042 6,033 2,381 1,907 1,795 1,139
Total 35,184 37,203 35,860 37,952 40,274 45,366 47,477 53,303
Source: Government of Canada (2017a).
Mexico has a guest worker program called the Border Worker Visitor Card (Tarjeta de Visitante Trabajador Fronterizo—TVTF) for people from Guatemala and Belize. This program, which has its roots in a program established in 1995 that allowed Guatemalans to perform agricultural work in the State of Chiapas, has been modified in recent years. It now allows qualifying Guatemalans and Belizeans to have paid employment—agricultural or nonagricultural—in four southern States: Campeche, Chiapas, Quintana Roo, and Tabasco. The TVTF has a duration of 1 year, can be renewed, and allows for multiple border crossings (Instituto Nacional de Migración, 2015; Meza González, 2017).
The number of agricultural guest workers from Guatemala using the TVTF appears to be much lower than the number using similar programs at the beginning of the century (fig. 10). During 2015-17, the annual number of foreigners holding a TVTF who were documented to have worked in the agricultural sector in Mexico averaged about 14,000, compared with 42,000 during 2001-03. The reasons for this decline have not been evaluated empirically, to the best of our knowledge. People from Belize were allowed to participate in these guest worker programs starting in 2008, but almost all of the participants are still from Guatemala.
14The National Commodities List consists of apiary products; fruit and vegetables (including the canning and processing of such products if grown on the farm); mushrooms; flowers; and nursery-grown trees, including Christmas trees and trees grown in greenhouses or nurseries. It also includes pedigreed canola seed, sod, tobacco, bovine, dairy, duck, horse, mink, poultry, sheep, and swine (Government of Canada, 2017b).

25 Farm Labor Markets in the United States and Mexico Pose Challenges for U.S. Agriculture, EIB-201
USDA, Economic Research Service
Figure 10 Number of participants in Mexico’s agricultural guest worker program, 1999-2017
Number of participants
0
10,000
20,000
30,000
40,000
50,000
60,000
70,000
1999 00 01 02 03 04 05 06 07 08 09 10 11 12 13 14 15 16 17
Entries, FMVA
Entries, FMTF
Documented to work, FMTF
Documented to work, TVTF
Notes: Figure displays participation data in successive guest worker programs in Mexico: FMVA = Forma Migratoria de Visitante Agrícola (Migratory Form of Agricultural Visitor); FMTF = Forma Migratoria de Trabajador Fronterizo (Migratory Form of Border Worker); and TVTF = Tarjeta Visitante de Trabajador Fronterizo (Visitor Card of Border Worker). Number of entries may differ conceptually from the number documented to work. Data for 2008-09 may include some nonagricultural workers.
Source: USDA, Economic Research Service calculations using data from Secretaría de Gobernación, Subsecretaría de Población, Migración, y Asuntos Religiosos, Unidad de Política Migratoria (2005-17).
Looking beyond Mexico and Central America, an alternative solution to the U.S. farm labor short-age would be to seek agricultural guest workers elsewhere, although the logistical and political bar-riers would likely be more difficult to surmount. Bringing large numbers of workers from Asia, for example, would be more expensive and challenging logistically. Allowing agricultural guest workers to stay for longer periods of time than currently permitted by the H-2A program, however, might make it cost effective for employers to hire workers from more distant lands.
Further Mechanization and Use of Mechanical Aids
Even with an expanding number of guest workers, growers are likely to make other economic adjust-ments in response to labor scarcity. One approach would be to focus on technology—either in the form of mechanization or through the development and application of innovations that increase labor productivity and reduce the physical burdens of farmwork. Research and development of new technologies is often expensive and slow to reach fruition, and the costs of adopting a new tech-nology—including costs of capital and of learning and acquiring the appropriate skills—are usually substantial. Indeed, Calvin and Martin (2010: iv) caution that mechanization is “a complicated process and usually requires an integrated approach that includes changes in crop varieties, cultural practices, and harvesting methods.” When rural Mexico provided an abundant and inexpensive labor supply, U.S. agricultural employers had far less incentive to implement new labor-saving tech-nologies or to adopt more efficient labor practices. As this labor supply diminishes and wages rise, employers’ incentives for change increase.

26 Farm Labor Markets in the United States and Mexico Pose Challenges for U.S. Agriculture, EIB-201
USDA, Economic Research Service
For many formerly labor-intensive crops, innovations already permeate production practices. For example, the traditional method of harvesting raisins (which used to be California’s most labor-intensive crop) required workers to walk the rows of the vineyard, cut by hand the canes that held the grapes, and then place the grapes on paper trays between the rows to dry. After the raisins had dried for 1 week, workers rolled the trays to facilitate uniform drying and 2-3 weeks later, collected the rolled trays.
Mechanical harvesters became available to raisin producers in the latter half of the 20th century, though only about 45 percent of farms had adopted this technology by 2007 (Calvin and Martin, 2010). Mechanical harvesters require either workers or a machine to clip the canes holding the grape clusters a few weeks before harvest, and the grapes remain on the vine while drying. Once the grapes have dried, a machine shakes the raisins off of the vine and collects them (Martin and Mason, 2009). The chief obstacle to “dry-on-the-vine” mechanical harvesting is high up-front costs to invest in infrastructure, adopt new grape varieties, and rent machinery. Nevertheless, mounting labor costs and a reduced supply of labor during the critical harvest months may induce wider adop-tion. Most recently, a variety of grape called the Sunpreme that dries naturally on the vine without cutting the cane has become available, thereby further reducing raisin production’s dependence on labor (Romero, 2015).
One segment of the push for technological solutions to U.S. farm labor shortages has been a rise in robotic research and development for agriculture. Adapting robotics to agriculture comes with substantial challenges, including the need for robots to discern ripe fruit, work as quickly as humans, and have sufficient dexterity (Charlton, 2016). These traits are difficult to replicate in a robot, but researchers and engineers are rising to the challenge. Sources predict that a robotic strawberry harvester will be available on the market within 5-10 years, though adoption of the harvester may take longer because growers will need to adapt their growing practices to the harvester and learn a new set of skills. In some crops, combinations of mechanical engineering, machine learning, and chemistry are reducing labor demands in specific tasks. For example, machines with optics and information technology determine the optimal spacing of lettuce plants and use a stream of fertilizer spray to knock out unwanted plants, eliminating the need for workers to hand-thin lettuce fields.
There are also many technological innovations short of full mechanization that raise labor’s produc-tivity and reduce the physical burdens of the job. Such changes permit farmworkers to remain productive at more advanced ages and expand the scope of employment for female farmworkers. Examples of these less mechanized but still significant advances include replacement of ladders in fruit orchards with hydraulic platforms and reduction of the distance that harvested produce needs to be carried by hand by using mobile conveyor belts.
Further mechanization may require the industry to seek specially trained workers with the requisite skills to operate new machinery. Agricultural education has traditionally focused on training farmers and food-system workers. However, as farmwork becomes more technically challenging and requires new skills, it becomes necessary to train school students for jobs in the field. As education rises in rural Mexico and throughout the world, agriculture will likely attract more workers by transforming farm work to utilize the more complex sets of skills that are honed in school. Potentially, U.S. agricultural employers may one day hire skilled workers from Mexico to operate and manage new equipment in the field. Per capita, Mexico produces more engineering, manufacturing, and construc-tion graduates than the United States (World Economic Forum and United Nations Educational, Scientific and Cultural Organization’s Institute for Statistics, as cited by Myers, 2016).

27 Farm Labor Markets in the United States and Mexico Pose Challenges for U.S. Agriculture, EIB-201
USDA, Economic Research Service
Sweetening the Employment Deal
One way to retain existing workers without increasing wages is to offer other inducements that sweeten the employment deal. These inducements can take a variety of forms, including benefits, bonuses, and an improved workplace environment. For instance, some growers offer low-cost health care or bonuses of around 5-10 percent to workers who stay the entire growing season (Martin, 2017). Also, several growers in the Yuma, AZ, and Salinas, CA, areas have sponsored a program called Labor of Love that provides farmworkers with gift cards and breakfast burritos on the last day of the harvest season in appreciation for their efforts (Szydlowski, 2017).
There is some evidence that health care benefits successfully increase the quantity of farm labor supplied. Using NAWS data for FYs 1989-2012, Luo and Escalante (2017a) examine the influence of employer-provided health benefits (EPHBs) on the labor supply of farmworkers in crop agriculture. The authors find that EPHBs have had a positive and statistically significant effect on the employ-ment duration of unauthorized farmworkers and that EPHBs seemed to be more important to the employment decisions of unauthorized farmworkers than to authorized farmworkers. Relatively few farmworkers in crop agriculture have had health insurance in recent years—about 33 percent according to NAWS data for FYs 2009-14 (Gabhard and Carroll, 2016).
Over the past decade, a number of reports have identified sexual harassment and sexual violence as persistent problems affecting immigrant farmworkers. (See, for example, Human Rights Watch, 2012; Kristen et al., 2015; Murphy et al., 2015; Southern Poverty Law Center, 2010; and Waugh, 2010.) To address this issue, some growers improved their training of supervisors regarding their responsibilities under State and Federal labor laws and regulations (Martin, 2017), and the Produce Marketing Association (PMA) and the United Fresh Produce Association (United Fresh) crafted an Ethical Charter on Responsible Labor Practices in the fresh produce and floral industries (PMA and United Fresh, 2018). Over 60 companies operating in various parts of the supply chain in these industries have formally endorsed the framework and committed themselves to its implementation. Also, some immigrant farmworkers have sought remedies to cases of sexual harassment through the legal system. In 2015, for instance, the U.S. Equal Employment Opportunity Commission (EEOC) won a jury verdict of over $17 million on behalf of four female immigrants who were former employees of a produce-growing and -packing company who had suffered sexual harassment and retaliation (U.S. EEOC, 2015).
Maintaining strong connections with the workforce will become more vital to U.S. agricultural employers as the economic transition unfolds in rural Mexico. In the past, migratory networks have played a critical role in connecting sending communities in Mexico with potential places of employ-ment in the United States. Networks can have multiplicative effects on future migration, because people are more likely to migrate if they have friends or family already working in the destination country who can help them with housing and introduce them to potential employers (Rojas Valdes et al., 2016). As networks of Mexican migrants working in U.S. agriculture shrink and as immigra-tion restrictions are enforced more assiduously, the likelihood that new migrants come to the United States from Mexico to perform farm work may decrease further. This reduced flow of immigrants places more of the onus for recruiting workers on agricultural employers and their representatives, including farm labor contractors.

28 Farm Labor Markets in the United States and Mexico Pose Challenges for U.S. Agriculture, EIB-201
USDA, Economic Research Service
Changing the Crop Mix
In the face of wage pressures, some growers might opt to shift production away from certain labor-intensive crops or even to exit farming altogether. In California, for instance, anecdotal reports indicate that many orchards of hand-picked fruit are being replaced with almond and walnut groves, which are harvested by machine. The available data show that dramatic changes in the crop mix have already taken place (table 5).
At the top of table 5 are seven commodities whose average annual production increased by 100,000 metric tons or more between 2003-05 and 2013-15: sweet potatoes, apples, almonds, tangerines and tangelos, strawberries, grapes, and broccoli. As a group, producers of these commodities are likely to have demanded more labor over the past decade, in light of the large increases in output. Almost all of these commodities have grown in popularity, as indicated by rising levels of per capita use. Import competition seems to be less of a concern for producers of these commodities than for producers of other commodities. Imports’ share of use increased by 5 percentage points or more for just two of the seven commodities: broccoli (+8.9 percentage points) and strawberries (+6.9 percentage points). In fact, imports’ share decreased for two of the commodities: grapes (−7.6 percentage points) and tangerines and tangelos (−1.4 percentage points).

29 Farm Labor Markets in the United States and Mexico Pose Challenges for U.S. Agriculture, EIB-201
USDA, Economic Research Service
Table 5 U.S. fruit, vegetable, and tree nut production features a changing crop mix
Commodity
Production Per capita use Imports’ share of use2003-
052013-
15 Change2003-
052013-
15 Change2003-
052013-
15 Change
Metric tons (thousands) Percent
Metric tons (thou-sands) Kilograms Percent Percent
Percent-age
points
Sweet potatoes 722 1,291 78.9 569.3 2.10 3.24 54.0 0.9 1.7 0.9
Apples, fresh1,2 2,747 3,271 19.1 523.8 7.92 8.03 1.4 7.0 7.3 0.3
Almonds1,2 448 874 95.3 426.4 0.41 0.82 103.0 2.2 5.6 3.3
Tangerines and tangelos, fresh1,2 278 629 125.8 350.5 1.21 2.49 106.8 27.4 26.0 -1.4
Strawberries, fresh2 778 1,122 44.2 343.9 2.51 3.59 43.0 6.3 13.2 6.9
Grapes, fresh1,2 812 972 19.8 160.4 3.64 3.51 -3.4 54.8 47.2 -7.6
Broccoli, fresh 785 933 18.7 147.1 2.40 3.16 31.4 9.4 18.3 8.9
Leaf and romaine lettuce 1,635 1,734 6.0 98.7 4.91 5.02 2.2 1.3 4.8 3.6
Collard greens 109 198 81.9 89.1 0.36 0.62 70.8 0.3 0.2 -0.1
Blueberries, fresh2 53 139 161.5 86.1 0.20 0.68 231.9 43.4 51.2 7.7
Lemons, fresh1,2 522 580 11.2 58.4 1.55 1.67 7.9 7.4 12.6 5.2
Mushrooms1 324 374 15.4 49.8 1.18 1.30 10.3 8.4 11.8 3.4
Pumpkins 651 697 7.1 46.1 1.98 1.98 -0.0 1.6 3.3 1.7
Pears, fresh1,2 477 503 5.3 25.4 1.35 1.27 -6.0 19.0 20.5 1.6
Cauliflower, fresh 290 293 1.1 3.1 0.76 0.65 -14.0 4.9 12.6 7.7
Sweet corn, fresh 1,225 1,227 0.2 1.9 4.07 3.80 -6.7 2.0 4.0 2.0
Spinach, fresh-market 271 266 -1.8 -4.9 0.86 0.76 -12.3 4.1 3.8 -0.3Bell peppers 734 702 -4.3 -31.9 3.96 4.81 21.4 43.2 57.7 14.5
Avocados, fresh1,2 219 175 -20.0 -43.8 1.41 3.03 115.2 48.2 83.1 35.0
Honeydew melon 213 165 -22.7 -48.5 3.04 3.49 14.9 28.3 39.1 10.8
Celery 912 863 -5.4 -49.4 2.78 2.48 -10.9 3.1 6.4 3.3
Squash 332 275 -17.2 -57.1 1.97 2.06 4.6 43.6 59.9 16.3
Mustard greens 100 43 -57.4 -57.3 0.35 0.14 -60.9 0.4 0.9 0.5
Carrots, fresh 1,203 1,140 -5.3 -63.7 3.96 3.83 -3.4 7.8 14.6 6.8
Garlic 245 179 -27.2 -66.7 1.18 1.04 -11.5 43.1 58.8 15.7
Snap beans, fresh-market 256 180 -29.6 -75.7 0.86 0.71 -17.5 10.6 29.0 18.4
Cabbage 1,051 954 -9.3 -97.5 3.51 3.01 -14.2 4.0 8.1 4.0
Cucumbers, fresh 433 321 -25.9 -112.3 2.84 3.36 18.1 50.6 71.4 20.8
Watermelon 1,697 1,580 -6.9 -117.3 4.07 3.10 -23.8 14.4 31.3 16.9
Walnuts1,2 398 223 -44.0 -175.3 0.22 0.20 -10.3 0.5 10.5 9.9
Peaches and nectarines, fresh2 712 499 -30.0 -213.4 2.29 1.39 -39.1 10.5 7.3 -3.1
Grapefruit, fresh1,2 680 442 -35.0 -237.9 1.38 0.98 -29.0 4.1 3.7 -0.4
Cantaloupe 965 683 -29.2 -281.9 2.30 2.69 17.1 33.2 40.6 7.3
Tomatoes, fresh 1,853 1,509 -18.5 -343.5 9.00 9.25 2.9 35.6 52.5 16.9
Onions, fresh 3,051 2,689 -11.9 -362.0 9.42 8.42 -10.6 11.2 18.2 7.0
Oranges, fresh1,2 1,964 1,398 -28.8 -566.3 4.91 4.09 -16.7 4.7 11.7 6.9
Potatoes, fresh market 5,833 4,945 -15.2 -887.8 20.25 15.44 -23.7 6.1 8.5 2.4Head lettuce, fresh 3,020 2,029 -32.8 -991.1 9.74 6.37 -34.6 1.6 6.2 4.5
Notes: Commodities represent types of fruit, vegetables, and tree nuts grown in the United States in large quantities (100,000 metric tons or more per year in either period). The commodities listed in the table are sorted by the absolute change in the volume of production. Data are not collected for all States that might produce these crops.1Data correspond to crop years 2003/04 to 2005/06 and 2013/14 to 2015/16. 2Production statistics refer to utilized production. 3Production statistics refer to marketable production.
Source: USDA, Economic Research Service (ERS) calculations using data from USDA, ERS (2018a, b).

30 Farm Labor Markets in the United States and Mexico Pose Challenges for U.S. Agriculture, EIB-201
USDA, Economic Research Service
At the bottom of the table are 11 commodities whose average annual production decreased by 100,000 metric tons or more between 2003-05 and 2013-15: head lettuce, potatoes, oranges, onions, tomatoes, cantaloupe, grapefruit, peaches and nectarines, walnuts, watermelon, and cucumbers. Higher labor costs may be partially responsible for these declines in production, but other causal factors may also enter into play. Citrus greening, also known as Huanglongbing (HLB), has adversely affected U.S. citrus production (University of Florida, IFAS Extension, 2018; USDA, APHIS, 2018), and consumer preferences may have played a role in the decreased production of some commodities, as per capita use has declined for 8 of the 11 commodities. Tomatoes, canta-loupe, and cucumbers are the exceptions.

31 Farm Labor Markets in the United States and Mexico Pose Challenges for U.S. Agriculture, EIB-201
USDA, Economic Research Service
Conclusion
Many U.S. agricultural employers have said that they are finding it hard to attract new workers and to retain their current ones. These reports are complemented by statistical evidence pointing to a tightening labor market. Over the last decade, wages for hired farmworkers have risen, the gap between agricultural and nonagricultural compensation has narrowed, and use of the H-2A program has more than doubled. Moreover, net immigration from Mexico—the leading country of origin for foreign-born farmworkers in the United States—has slowed appreciably. The slowdown is such that, for the first time in decades, reverse migration in which Mexicans return from the United States to Mexico may be outpacing migration from Mexico to the United States.
At about the same time, agricultural employment in Mexico has increased—from roughly 6 million workers in 2011 to 7 million in 2017—reflecting the expansion of fruit, vegetable, and tree nut production, some of which is destined for the U.S. market. This increase in agricultural employment follows a period of long-term contraction (roughly 1980-2010) in which the farm labor supply from rural Mexico decreased by nearly 1 percentage point per year. Falling fertility rates, rising rural education, and growth in the nonfarm sectors of the economy were among the factors in Mexico that contributed to this trend.
Because Mexicans who choose to work in agriculture have the option of working either in the United States (some legally, some illegally) or in their home country, the factors influencing the supply of farm labor in rural Mexico also affect the U.S. farm labor supply. Increased U.S. border enforcement was found by Charlton and Taylor (2016) to slow the decline of Mexico’s farm labor force, but by keeping workers in Mexico, such enforcement does not increase the supply of farm labor in the United States. Rising U.S. farm wages slow the decrease in the U.S. farm labor supply overall, but these wages have not risen fast enough to reverse the decline in the farm labor supply from Mexico. Meanwhile, expanding rural education in Mexico, as well as industrial growth in both Mexico and the United States, further reduces the number of Mexicans willing to work in agriculture in either country.
Looking to the future, immigration policy will play a role in the supply of foreign-born workers to U.S. farms. In the short run, an expanded agricultural guest worker program (or increased use of the existing H-2A program) could help U.S. farmers to compete with their Mexican counterparts to attract workers from a shrinking farm labor pool. However—given the apparent long-term decline in the U.S. farm labor supply and the various structural changes occurring in the Mexican economy—investments in less labor-intensive technologies, more efficient labor management practices, and a move away from the most labor-intensive crops may be more viable longrun strategies for U.S. agricultural employers.

32 Farm Labor Markets in the United States and Mexico Pose Challenges for U.S. Agriculture, EIB-201
USDA, Economic Research Service
References
Alden, E. 2017. “Is Border Enforcement Effective? What We Know and What It Means,” Journal on Migration and Human Security 5(2):481-490.
Alvarez-Cuadrado, F. and M. Poschke. 2011. “Structural Change Out of Agriculture: Labor Push versus Labor Pull,” American Economic Journal: Macroeconomics 3(3): 127-158.
American Farm Bureau Federation. 2017. “Economic Impact of Immigration.” Webpage.
Amuedo-Dorantes, C., and C. Bansak. 2012. “The Labor Market Impact of Mandated Employment Verification Systems,” American Economic Review: Papers & Proceedings 102(3): 543-548.
Anker, R. 1978. “An Analysis of Fertility Differences in Developing Countries,” The Review of Economics and Statistics 60(1): 58-69.
Bohn, S., M. Lofstrom, and S. Raphael. 2015. “Do E-Verify Mandates Improve Labor Market Outcomes of Low-Skilled Native and Legal Immigrant Workers?” Southern Economic Journal 81(4): 960-979.
Calvin, L., and P. Martin. 2010. The U.S. Produce Industry and Labor: Facing the Future in a Global Economy, ERR-106, U.S. Department of Agriculture, Economic Research Service, November 12.
Cave, D. 2011. “Better Lives for Mexicans Cut Allure of Going North,” New York Times, July 6.
Charlton, D. 2016. Personal interview with Stavros Vougioukas, Davis, California, April 20.
Charlton, D., and J. Taylor. 2016. “A Declining Farm Workforce: Analysis of Panel Data from Rural Mexico,” American Journal of Agricultural Economics 98(4): 1158-1180.
Chiquiar, D., and G. Hanson. 2005. “International Migration, Self-Selection, and the Distribution of Wages: Evidence of Mexico and the United States,” Journal of Political Economy 113(2): 239-281.
Chort, I., and M. de la Rupelle. 2016. “Determinants of Mexico-U.S. Outward and Return Migration Flows: A State-Level Panel Data Analysis,” Demography 53: 1453-1476.
Clemens, M. 2017. “The Effect of Occupational Visas on Native Employment: Evidence from Labor Supply to Farm Jobs in the Great Recession.” IZA Discussion Paper No. 10492.
Cornelius, W., and I. Salehyan. 2007. “Does Border Enforcement Deter Unauthorized Immigration? The Case of Mexican Migration to the United States of America,” Regulation & Governance 1: 139-153.
DeSilver, D. 2017. “Immigrants Don’t Make Up a Majority of Workers in Any U.S. Industry.” Pew Research Center. March 17.
Dickerson, C., and J. Medina. 2017. “California Farmers Backed Trump, but Now Fear Losing Field Workers.” New York Times. February 9.

33 Farm Labor Markets in the United States and Mexico Pose Challenges for U.S. Agriculture, EIB-201
USDA, Economic Research Service
Dudley, M. 2014. The Importance of Farm Labor in the NYS [New York State] Yogurt Boom. Cornell University, Community and Regional Development Instittue (CaRDI), Research and Policy Brief No. 62. October.
Duffield, J. 1990. Estimating Farm Labor Elasticities to Analyze the Effects of Immigration Reform. U.S. Department of Agriculture, Economic Research Service, Staff Report No. AGES 9013.
Duffield, J., and R. Coltrane. 1992. “Testing for Disequilibrium in the Hired Farm Labor Market,” American Journal of Agricultural Economics 74(2, May): 412-20.
Fan, M., S. Gabbard, A. Alves Pena, and J. Perloff. 2015. “Why Do Fewer Agricultural Workers Migrate Now?” American Journal of Agricultural Economics 97(3): 665–679.
Federal Reserve Bank of St. Louis. 2018. “Mexico / U.S. Foreign Exchange Rate [AEXMXUS].” Retrieved from FRED, online database.
Gabhard, S., and D. Carroll. 2016. “What Do We Know about Agricultural Workers’ Social Determinants of Health?” Presentation to East Coast Migrant Stream Forum, October.
Gale, F., A. Somwaru, and X. Diao. 2002. “Agricultural Labor: Where Are the Jobs?” in Gale, F., F. Tuan, B. Lohmar, H.H. Hsu, and B. Gilmour (eds.) (2002) China’s Food and Agriculture: Issues for the 21st Century, AIB-775, U.S. Department of Agriculture, Economic Research Service, pp. 44-46.
Giovannelli, C. 2011. nuestro-mexico. Website.
Gonzalez-Barrera, A. 2015. More Mexicans Leaving Than Coming to the US. Pew Research Center. November 19.
Government of Canada. 2018. “Hire a Temporary Foreign Agricultural Worker.” June 15.
Government of Canada. 2017a. “Annual Labour Market Impact Assessment statistics 2008-2015: Primary Agriculture stream.” April 5.
Government of Canada. 2017b. “Hire a Temporary Foreign Worker Through the Agricultural Stream – Overview.” April 12.
Government of Canada. 2015. “Fact Sheet – Temporary Foreign Worker Program.” February 19.
Gunter, L., J. Jarrett, and J. Duffield. 1992. “Effect of U.S. Immigration Reform on Labor Intensive Agricultural Commodities,” American Journal of Agricultural Economics 74(4): 897-906.
Hanson, G. 2012. Understanding Mexico’s Economic Underperformance. Woodrow Wilson International Center for Scholars and Migration Policy Institute, August.
Hanson, G., and A. Spilimbergo. 1999. “Illegal Immigration, Border Enforcement, and Relative Wages: Evidence from Apprehensions at the U.S.-Mexico Border,” American Economic Review 89(5): 1337-1357.
Harris, J., and M. Todaro. 1970. “Migration, Unemployment and Development: A Two-Sector Analysis,” American Economic Review 60(March): 126-42.

34 Farm Labor Markets in the United States and Mexico Pose Challenges for U.S. Agriculture, EIB-201
USDA, Economic Research Service
Human Rights Watch. 2012. Cultivating Fear: The Vulnerability of Immigrant Farmworkers in the US to Sexual Violence and Sexual Harassment. May 12.
Ifft, J., and M. Jodlowski. 2016. “Is ICE Freezing U.S. Agriculture? Impacts of Local Immigration Enforcement on U.S. Farm Profitability and Structure.” Selected paper presented at 2016 Agricultural and Applied Economics Association Annual Meeting, Boston, MA, July 31-August 2.
Instituto Nacional de Estadística y Geografía (INEGI). 2018a. Banco de Información Económica. April 10.
INEGI. 2018b. “Encuesta Nacional de Ocupación y Empleo (ENOE), población de 15 años y más de edad.”
INEGI. 2016. “Actualización de la Medición de la Economía Informal, 2015 Preliminar, Año Base 2008,” Press Bulletin No. 539/16. Aguascalientes, Aguascalientes, México. December 13.
INEGI. 2011. “Características educativas de la población: Distribución porcentual de la población de 15 y más años por nivel educativo, para cada sexo, 1960 a 2010.” Excel table. March 11.
Instituto Nacional de Migración. 2015. “Eres guatemalteco o beliceño y deseas trabajar en México?” Webpage. October 6.
Jamrisko, M. 2017. “‘I Need More Mexicans’: A Kansas Farmer’s Message to Trump.” Bloomberg Businessweek. June 20.
Kandel, W. 2008. Profile of Hired Farmworkers, A 2008 Update. U.S. Department of Agriculture, Economic Research Service. July.
Kitroeff, N., and G. Mohan. 2017. “Wages Rise on California Farms. Americans Still Don’t Want the Job,” Los Angeles Times. March 17.
Kostandini, G., E. Mykerezi, and C. Escalante. 2014. “The Impact of Immigration Enforcement on the U.S. Farming Sector,” American Journal of Agricultural Economics 96(1): 172-192.
Kristen, E., B. Banuelos, and D. Urban. 2015. “Workplace Violence and Harassment of Low-Wage Workers,” Berkeley Journal of Employment and Labor Law 36(1): 169-213.
Li, H., and S. Zahniser. 2002. “The Determinants of Temporary Rural-to-Urban Migration in China,” Urban Studies 39(12): 2219-2235.
Lucas, R., Jr. 2004. “Life Earnings and Rural-Urban Migration,” Journal of Political Economics 112(1): 29-59.
Luo, T., and Escalante, C. 2017a. “Employer-Provided Health Benefits and Employment Decisions of U.S. Farm Workers,” Agricultural Finance Review 77(3): 358-75.
Luo, T., and Escalante, C. 2017b. “U.S. Farm Workers: What Drives Their Job Retention and Work Time Allocation Decisions?” Economic and Labour Relations Review 28(2, June): 270-293.

35 Farm Labor Markets in the United States and Mexico Pose Challenges for U.S. Agriculture, EIB-201
USDA, Economic Research Service
Maloney, T., L. Eiholzer, and B. Ryan. 2016. Survey of Hispanic Dairy Workers in New York State 2016. Ithaca, New York: Charles H. Dyson School of Applied Economics and Management, College of Agriculture and Life Sciences, Cornell University.
Martin, P. 2017. Immigration and Farm Labor: Challenges and Opportunities. Giannini Foundation of Agricultural Economics, University of California, June.
Martin, P. 2008. “Evaluation of the H-2A Alien Labor Certification Process and the U.S. Farm Labor Market.” Report submitted by KRA Corporation to U.S. Department of Labor, Employment and Training Administration. September 18.
Martin, P. 2003. Promise Unfulfilled: Unions, Immigration, and the Farm Workers. Ithaca, NY: Cornell University Press.
Martin, P. 1998. “Guest Workers: Past and Present,” in Mexican Ministry of Foreign Affairs and U.S. Commission on Immigration Reform, Migration Between Mexico and the United States: Binational Study: Vol. 3: Research Reports and Background Materials (Austin, Texas): Morgan Printing), pp. 877-895.
Martin, P. 1994. “Good Intentions Gone Awry: IRCA and U.S. Agriculture,” The Annals of the American Academy of Political and Social Science 534(1): 44-57.
Martin, P., and B. Mason. 2009. “California’s Farm Labor Market: The Case of Raisin Grapes,” in Migration Files. University of California.
Martin, P., and J. Taylor. 2013. Ripe with Change: Evolving Farm Labor Markets in the United States, Mexico, and Central America. Washington DC: Wilson Center and Migration Policy Institute Report, February.
Massey, D., R. Alarcón, J. Durand, and H. González. 1987. Return to Aztlán: The Social Process of International Migration From Western Mexico. Berkeley, California, and Los Angeles, California: University of California Press.
Massey, D., J. Durand, and K. Pren. 2016. “Why Border Enforcement Backfired,” American Journal of Sociology 121(5): 1557-1600.
Maylack, J. 2017. “Labor Shortage Hits American Winegrowers,” Wine Enthusiast Magazine. June 21.
McKissick, J. and S. Kane. 2011. An Evaluation of Direct and Indirect Economic Losses Incurred by Georgia Fruit and Vegetable Producers in Spring 2011. The University of Georgia, Center for Agribusiness and Economic Development, Report No. CR-11-02. November.
Meza González, L. 2017. “Guatemalan, Salvadoran and Honduran Workers in Mexico.” Presentation delivered at the conference “Shifting Contexts and Patterns of Migration: Comparing Europe and Central-North America,” Catedra Humboldt, El Colegio de Mexico, Mexico City, May 24.
Myers, J. 2016. “Which Country Has the Most Engingeering Graduates?” Webpage. World Economic Forum, 17 September.
Ong, Y. 2015. “The H-2A Problem: Why a Perfectly Legal Farmworker Visa Program Isn’t Being Used More,” Associated Press. March 5.

36 Farm Labor Markets in the United States and Mexico Pose Challenges for U.S. Agriculture, EIB-201
USDA, Economic Research Service
Organization for Economic Co-operation and Development (OECD). 2018a. “Education spending (indicator).” February 1.
OECD. 2018b. “Population With Tertiary Education (Indicator).” November 8.
Orrenius, P., and M. Zavodny. 2015. “The Impact of E-Verify Mandates on Labor Market Outcomes.” Southern Economic Journal 81(4): 947-959.
Passel, J., D. Cohn, and A. Gonzalez-Barrera. 2012. “Net Migration from Mexico Falls to Zero—and Perhaps Less.” Pew Research Center. April 23.
Passel, J., and D. Cohn. 2017. “As Mexican Share Declined, U.S. Unauthorized Immigrant Population Fell in 2015 Below Recession Level,” Pew Research Center, April 25.
Produce Marketing Association and United Fresh Produce Association (PMA and United Fresh). 2018. “Ethical Charter on Responsible Labor Practices.” Website.
Richards, T. 2018. “Immigration Reform and Farm Labor Markets,” American Journal of Agricultural Economics 100(4): 1050-1071.
Rojas Valdes, R., C. Lin Lawell, and J. Taylor. 2016. “Strategic Interactions in Migration Decisions in Rural Mexico.” Selected Paper presented at 2016 Agricultural & Applied Economics Association Annual Meeting, Boston, MA, July 31-August 2.
Romero, E. 2015. “Sunpreme: The Grape that Could Revolutionize the Raisin Industry.” National Public Radio. October 7.
Rosenthal, L. 2016. “Farmers Wait, and Wait, For Guest Workers Amid H-2A Visa Delays,” National Public Radio, May 28.
Santibañes, L., G. Vernez, and P. Razquin. 2005. Education in Mexico: Challenges and Opportunities. RAND Corporation.
Sarig, Y., J. Thompson, and G. Brown. 2000. “Alternatives to Immigrant Labor?” adapted from a paper presented at 1999 annual international meeting of American Society of Agricultural Engineering and Canadian Society of Agricultural Engineering. December 1.
Secretaría de Agricultura, Ganadería, Desarrollo Rural, Pesca, y Alimentación, Servicio de Información Agroalimentaria y Pesquera (SAGARPA, SIAP). 2018. Anuario Estadístico de la Producción Agrícola. Online database.
Secretaría de Gobernación, Subsecretaría de Población, Migración, y Asuntos Religiosos, Unidad de Política Migratoria (SEGOB, UPM). 2005-17. Boletín Mensual de Estadísticas Migratorias. Various issues.
Secretaría de Trabajo y Previsión Social (STPS). 2018. “Trabajadores Asegurados en el IMSS: Registros Administrativos: Cuadro II.4.1. Salario Diario Asociado a Trabajadores Asegurados en el IMSS por Sector de Actividad Económica.”
Self, S. 2008. “Developing Countries and Fertility: Role of Agricultural Technology.” International Journal of Development Issues 7(1): 62-75.

37 Farm Labor Markets in the United States and Mexico Pose Challenges for U.S. Agriculture, EIB-201
USDA, Economic Research Service
Sheinin, A. 2016. “Losses Grow for Georgia Farmers Waiting on Feds to OK Foreign Workers.” Atlanta Journal-Constitution, May 3.
Southern Poverty Law Center. 2010. Injustice on Our Plates. November 7.
Susman, T. 2015. “Dairy Farmers, in Dire Need of Workers, Feel Helpless As Immigration Reform Sours.” March 30.
Szydlowski, J. 2017. “State: Drop in Farm Workers Offset by Uptick in Other Fields’ Payrolls,” Californian (Salinas, California). September 15.
Taylor, J., J. Arango, G. Hugo, A. Kouaouci, D. Massey, and A. Pellegrino. 1996. “International Migration and Community Development,” Population Index, pp. 397-418.
Taylor, J., D. Charlton, and A. Yunez-Naude. 2012. “The End of Farm Labor Abundance.” Applied Economic Perspectives and Policy 34(4): 587-598.
Taylor, J., and T. Lybbert. 2015. Essentials of Development Economics, second edition. Oakland, CA: University of California Press.
Timmer, C.P. 1988. “The Agricultural Transformation.” Handbook of Development Economics, 1(Part II): 276-331.
Tomson, B. 2017. “Southern Farmers Urge Research, Labor Focus in Upcoming Farm Bill,” Agri-Pulse Communications. June 24.
Turnbull, L. 2011. “Washington Apple Growers Scrambling to Find Workers,” Seattle Times. Updated version, October 31.
U.S. Department of Agriculture, Animal and Plant Health Inspection Service (USDA, APHIS). 2018. “Citrus Greening.” Webpage.
U.S. Department of Agriculture, Economic Research Service (USDA, ERS). 2018a. Fruit and Tree Nut Yearbook Tables. April 26.
USDA, ERS. 2018b. Vegetables and Pulses Yearbook Tables. July 17.
USDA, ERS. 2017. Agricultural Exchange Rate Dataset. December 11.
U.S. Department of Agriculture, National Agricultural Statistics Service (USDA, NASS). 2018a. Farm Labor. May 17.
USDA, NASS. 2018b. “Guide to NASS Surveys: Farm Labor.” Webpage.
USDA, NASS. 2018c. Quick Stats. Online database.
U.S. Department of Commerce, Bureau of Economic Analysis (USDOC, BEA). 2018. “SA27N Full-Time and Part-Time Wage and Salary Employment by NAICS Industry.” Employment by County, Metro and Other Areas. Online database.
38 Farm Labor Markets in the United States and Mexico Pose Challenges for U.S. Agriculture, EIB-201
USDA, Economic Research Service
U.S. Department of Commerce, Census Bureau (U.S. Census Bureau). 2017. International Data Base. December.
U.S. Department of Homeland Security (USDHS). 2018. “Learn More About E-Verify and myE-Verify.” Webpage.
U.S. Department of Homeland Security, Citizenship and Immigration Services (USDHS, CIS). 2018. “H-2A Temporary Agricultural Workers.” Webpage. March 8.
U.S. Department of Homeland Security, Immigration and Customs Enforcement (USDHS, ICE). 2018. “Delegation of Immigration Authority Section 287(g) Immigration and Nationality Act.” Webpage. June 12.
U.S. Department of Labor (USDOL). 2016. “Work Authorization for Non-U.S. Citizens: Temporary Agricultural Workers (H-2A Visas).” elaws: Employment Law Guide. December.
U.S. Department of Labor, Bureau of Labor Statistics (USDOL, BLS). 2018a. “CPI-All Urban Consumers (Current Series): All Items in U.S. City Average, All Urban Consumers, Not Seasonally Adjusted.”
USDOL, BLS. 2018b. Current Employment Statistics. Webpage.
U.S. Department of Labor, Employment and Training Administration (USDOL, ETA). 2017. National Agricultural Workers Survey. “Data Tables.” Webpage. August 28.
U.S. Department of Labor, Employment and Training Administation, Office of Foreign Labor Certification (USDOL, ETA, OFLC). 2018. “Foreign Labor Certification: OFLC Performance Data.” Webpage.
U.S. Department of State, Bureau of Consular Affairs (USDOS, BCA). 2018. Reports of the Visa Office. Various issues. Webpage. July 12.
U.S. Equal Employment Opportunity Commission (EEOC). 2015. “EEOC Wins Jury Verdict of Over $17 Million for Victims of Sexual Harassment and Retaliation at Moreno Farms,” press release, September 10.
University of Florida, Institute of Food and Agricultural Sciences (IFAS) Extension. 2018. “Citrus Greening (Huanglongbing).” Webpage.
Vogel, F. 2018. “What Is Purchasing Power Parity?” World Bank webpage.
Wang, C., N. Rada, L. Qin, and S. Pan. 2014. “Impacts of Migration on Household Production Choices: Evidence from China,” Journal of Development Studies 50(3, September): 413-425.
Waugh, I. 2010. “Examining the Sexual Harassment Experiences of Mexican Immigrant Farmworking Women,” Violence Against Women 16(3): 237-261.
Wei, X., Z. Guan, O. Gulcan, and F. Roka. 2016. “Imperfect Substitution Between Immigration and Native Farm Workers in the United States.” Selected paper presented at 2016 Agricultural and Applied Economics Association Annual Meeting, Boston, MA, July 31-August 2.

39 Farm Labor Markets in the United States and Mexico Pose Challenges for U.S. Agriculture, EIB-201
USDA, Economic Research Service
World Bank. 2018. World Development Indicators.
Wu, A. 2017. June 27. “Monterey County Ag Reports a 9.5% Drop in Crop Value,” The Californian (Salinas, CA).
Zhang, K. and S. Song. 2003. “Rural-Urban Migration and Urbanization in China: Evidence from Time-Series and Cross-Section Analyses.” China Economic Review 14(4): 386-400.

40 Farm Labor Markets in the United States and Mexico Pose Challenges for U.S. Agriculture, EIB-201
USDA, Economic Research Service
Appendix Table
Appendix table 1 Changes in the real wages paid to hired farmworkers, by region, 2017 versus 2006
Region 2006 2017 Change
Dollars per hour (2017 prices)
Dollars Percent
Appalachian I (NC, VA) 11.71 12.09 0.38 3.3
Appalachian II (KY, TN, WV) 11.29 12.00 0.71 6.3
California 12.25 14.46 2.21 18.0
Corn Belt I (IL, IN, OH) 12.86 13.65 0.79 6.1
Corn Belt II (IA, MO) 12.93 13.85 0.92 7.1
Delta (AR, LA, MS) 10.13 11.15 1.02 10.1
Florida 11.39 12.61 1.22 10.7
Hawaii 14.79 16.41 1.62 10.9
Lake (MI, MN, WI) 12.59 13.79 1.20 9.5
Mountain I (ID, MT, WY) 11.23 12.30 1.07 9.5
Moutain II (CO, NV, UT) 11.37 11.47 0.10 0.9
Mountain III (AZ, NM) 10.82 11.20 0.38 3.5
Northeast I (CT, MA, ME, NH, NY, RI, VT) 12.57 13.77 1.20 9.6
Northeast II (DE, MD, NJ, PA) 12.25 12.90 0.65 5.3
Northern Plains (KS, NE, ND, SD) 12.08 14.18 2.10 17.4
Pacific (OR, WA) 12.59 14.64 2.05 16.3
Southeast (AL, GA, SC) 10.99 11.55 0.56 5.1
Southern Plains (OK, TX) 11.33 12.53 1.20 10.6
US TOTAL 11.99 13.32 1.33 11.1
Source: USDA, Economic Research Service calculations using wage data from USDA, National Agricultural Statistics Service (2018c) and consumer price indices from U.S. Department of Labor, Bureau of Labor Statistics (2018a).