Embed Size (px)
Citation preview

S-1
Supporting Information
Recombinant-Fully-Human-Antibody Decorated Highly-Stable
Far-Red AIEdots for HER-2 Receptor-Targeted Imaging In-vivoYayun Wu a,e †, Zhizhen Chen b †, Pengfei Zhang* a, c, Lihua Zhou a, Tao Jiang a, Huajie Chen d, Ping Gong a, Dimiter S. Dimitrov f, Lintao Cai* a and Qi Zhao* b
a. Guangdong Key Laboratory of Nanomedicine, CAS Key Laboratory of Health Informatics, Institute of Biomedicine and Biotechnology, Shenzhen Institutes of Advanced Technology, Chinese Academy of Sciences, Shenzhen, 518055, P. R. China. E-mail: [email protected]. Faculty of Health Sciences, University of Macau, Taipa, Macau, China. E-mail: [email protected]. Division of Biomedical Engineering, The Hong Kong University of Science and Technology, Clear Water Bay, Kowloon, Hong Kong, China. E-mail: [email protected]. Key Laboratory of Advanced Functional Polymeric Materials of College of Hunan Province, and Key Laboratory of Environmentally Friendly Chemistry and Applications of Ministry of Education, College of Chemistry, Xiangtan University, Xiangtan 411105, P. R. Chinae. Key Laboratory of Molecular Nanostructure and Nanotechnology, CAS Research/Education Center for Excellence in Molecular Sciences, Institute of Chemistry, Chinese Academy of Sciences, Beijing 100190, China.f. Center for Antibody Therapeutics, University of Pittsburgh Medical School, PA, USA.
† These authors contributed equally to this work.
*Corresponding authors:Dr. Qi Zhao ([email protected]); Dr. Lintai Cai ([email protected]);Mr. Pengfei Zhang ([email protected]).
Electronic Supplementary Material (ESI) for ChemComm.This journal is © The Royal Society of Chemistry 2018

S-2
Table of Contents
Experiment section:Materials and general characterization . . . . . . . . . . . . . . . . . . . . . . . . . . . . . . . . . . . S-3Characterization of anti-HER2 fully-human- antibodies . . . . . . . . . . . . . . . . . . . . . . S-3Preparation of antibody-decorated RHA-AIEdots). . . . . . . . . . . . . . . . . . . . . . . . . . .S-4Structural characterization. . . . . . . . . . . . . . . . . . . . . . . . . . . . . . . . . . . . . . . . . . . . . .S-5In vitro Fluorescent and colloidal stability tests . . . . . . . . . . . . . . . . . . . . . . . . . . . .S-6 HER2 targeting cell line labeling and confocal imaging. . . . . . . . . . . . . . . . . . . . . .S-6Photobleaching test. . . . . . . . . . . . . . . . . . . . . . . . . . . . . . . . . . . . . . . . . .. . . . . . . . . S-7 Cytotoxicity assay. . . . . . . . . . . . . . . . . . . . . . . . . . . . . . . . . . . . . . . . . . . . . . . . . . . . S-7 In vivo imaging study. . . . . . . . . . . . . . . . . . . . . . . . . . . . . . . . . . . . . . . . . . . . . . . . . S-7
Figures and tables:Figure S1. . . . . . . . . . . . . . . . . . . . . . . . . . . . . . . . . . . . . . . . . . . . . . . . . . . . . . . . . . . .S-9Figure S2. . . . . . . . . . . . . . . . . . . . . . . . . . . . . . . . . . . . . . . . . . . . . . . . . . . . . . . . . .S-10Figure S3. . . . . . . . . . . . . . . . . . . . . . . . . . . . . . . . . . . . . . . . . . . . . . . . . . . . . . . . . . . S-11Figure S4. . . . . . . . . . . . . . . . . . . . . . . . . . . . . . . . . . . . . . . . . . . . . . . . . . . . . . . . . . . S-12Figure S5. . . . . . . . . . . . . . . . . . . . . . . . . . . . . . . . . . . . . . . . . . . . . . . . . . . . . . . . . . . S-13Figure S6. . . . . . . . . . . . . . . . . . . . . . . . . . . . . . . . . . . . . . . . . . . . . . . . . . . . . . . . . . . S-14Figure S7. . . . . . . . . . . . . . . . . . . . . . . . . . . . . . . . . . . . . . . . . . . . . . . . . . . . . . . . . . . S-15Figure S8. . . . . . . . . . . . . . . . . . . . . . . . . . . . . . . . . . . . . . . . . . . . . . . . . . . . . . . . . . . S-16Figure S9. . . . . . . . . . . . . . . . . . . . . . . . . . . . . . . . . . . . . . . . . . . . . . . . . . . . . . . . . . . S-17Figure S10. . . . . . . . . . . . . . . . . . . . . . . . . . . . . . . . . . . . . . . . . . . . . . . . . . . . . . . . . . S-18Figure S11. . . . . . . . . . . . . . . . . . . . . . . . . . . . . . . . . . . . . . . . . . . . . . . . . . . . . . . . . . S-19Figure S12. . . . . . . . . . . . . . . . . . . . . . . . . . . . . . . . . . . . . . . . . . . . . . . . . . . . . . . . . . S-20Table S1. . . . . . . . . . . . . . . . . . . . . . . . . . . . . . . . . . . . . . . . . . . . . . . . . . . . . . . . . . . . S-20

S-3
Experiment section:
1. Materials and general characterization All chemicals were purchased and used without further purification. Poly(styrene-co-maleic-anhydride) cumene terminated (PSMA, styrene: maleic anhydride=1.3:1), average Mw ~1600 by GPC was purchased from Aldrich. Boc-NH-PEG-NH2 (Mw ~1000) was purchased from biomatrik. EDC·HCl was purchased from Sangon Biotech (shanghai). NHS and DMSO were purchased from J&K chemical. DBCO-PEG5-NHS was purchased from Click Chemistry Tools. DBCO-Fluor488 was purchased from Interchim. Ultrapure water was obtained from a Millipore-Q system. Transmission electron microscope (TEM) images were taken on a Tecnai G2 F20 S-TWIN from FEI company. 1HNMR spectra of the polymers were recorded on a Bruker 400MHz nuclear magnetic resonance instrument using DMSO-d6 as the solvent. FT-IR spectra of the polymers were recorded on a Bruker Vertex 70 from Bruker Optics. UV-vis absorption spectra were taken on a PerkinElmer Lambda 25 UV-Vis absorption spectrophotometer. The particle sizes and zeta potential of particles were
characterized on a Nano-Zetasizer (Malvern Instruments) at 25℃. Images of AIEdots
in different pH and other conditions in vitro were obtained by a Sony camera and irradiated with a handled UV lamp. Photoluminescence (PL) spectra were recorded with an Edinburgh F900 fluorescent spectrometer. Confocal images were obtained from a Leica TCS SP5-II laser scanning confocal microscope and data were processed with internal software.
2. Characterization of anti-HER2 fully-human- antibodies2.1 Expression and purification of anti-HER2 fully-human- antibodies
The expression of anti-HER2 IgG antibodies was performed in suspension HEK293 cells. The recombinant human anti-HER2 antibody was identified from a human naive Fab phage library (unpublished data). The heavy and light chain variable sequences of theanti-HER2 antibody were cloned into the mammalian IgG expression vector. Briefly, using PEI transfection reagents, mixed the 20 μl of plasmids (1 μg/ml) and 40ul PEI transfection reagents (1 μg/ml) together into 2 ml phosphate buffered saline (PBS) buffer, incubated the mixture for 10 minutes at room temperature. Then plasmid complex was dorpwised to cells in 30ml FreeStyletm 293 expression medium. After four days of post-transfection, the culture supernatant was harvested. Antibodies were purified from cell culture supernatants by the Protein A Sepharose TM chromatography (GE Healthcare). The protein purity was examined by 12% SDS-PAGE and western blot.2.2 enzyme-linked immunosorbent assay (ELISA)
ELISA plate was coated with antigens (100 ng per well), washed by PBST and incubated with PBS containing 4% non-fat milk for 1h at room temperature. Antibodieswith different dilutions were incubated for 1 h. Bound antibodies were

S-4
detected with the secondary anti-human Fc-HRP antibody (1:2,000 dilution; Life Technologies). The 2,20-azino-bis-(3-ethylbenzthiazoline-6-sulfonic acid) substrate (Sigma) was added and the reaction was read at 450 nm.2.3 Flow Cytometry
Flow cytometry assay was used to test binding ability of anti-HER2 antibodies to target SKBR-3 (HER2+) and MD-MB-231 (HER2-) cell lines. Antibodies (1 μg/mL) were incubated with 5×10⁵ cells in 50µl PBSA (0.1% BSA in PBS) buffer and incubated for 30 min on ice. After once washing, cells were incubated with a secondary PE-conjugated anti-human Fc antibody (1:5000 dilution, Thermo Fisher) for 30 min on ice, then washed again and resuspended in 0.5 ml PBSA buffer. Analysis was performed using a CytoFLEX flow cytometers (Beckman Coulter). For azido-modified anti-HER2 IgG, DBCO-Fluor 488(1:2000 dilution, Click Chemistry Tools) was used as the secondary antibody in the experiment.
3. Preparation of antibody-decorated AIEdots (RHA-AIEdots)3.1 Azido modification of anti-HER2 antibodies
Azido modification of anti-HER2 IgG was performed by incubation of 10 µM antibodies with 20 µM NHS-PEG4-Azido reagent (Thermo Fisher) in the volume of 0.5 mL PBS for 1 h at room temperature. Then non-reacted azido was removed by dialysis. Immediately afterwards, the antibody conjugates were purified to remove unreacted reagents using a 3,000 MWCO Vivaspin centrifuge tube (Sartorius Stedim).3.2 Synthesis of PSMA-PEG-NH2and PSMA-PEG-DBCO co-polymer
PSMA-PEG-NH2 co-polymer was obtained through a simple one-pot method. 200 mg PSMA and 300 mg Boc-NH-PEG-NH2 powder were added in a 20mL screw thread vial equipped with a stirring bar and dissolved in 5mL anhydrous DMSO. Then 143 mg EDC·HCl and 86 mg NHS were also added for completely coupling. The solution was
then heated to 70℃ in oil bath and stirred overnight. After overnight reaction and cool
down to room temperature, the mixture solution was added with 1 mL HCl/MeOH and stirred 2 h in room temperature to deprotection of Boc(t-butyloxycarbonyl). The reaction solution was then placed in a dialysis bag (membrane cutoff: 3500Da) and dialyzed against 0.01 M phosphate buffer solution for 24 hours to neutralize the pH to ~7. Afterward, the phosphate buffer was replaced with ultrapure water and continued dialysis for 2 days to remove unreactive impurities. The dialyzed solution was freeze-dried and PSMA-PEG-NH2 co-polymer as white powder was obtained. The 1H NMR spectra of PSMA-PEG-NH2 was acquired using nuclear magnetic resonance instrument.3.3 Synthesis of amino-functionalized AIEdots
Amino-functionalized AIEdots were obtained by encapsulate hydrophobic fluorescent semiconducting polymer PDFDP with amphiphilic PSMA-PEG-NH2 co-polymer. 5mg Poly{9,9-dihexyl-2,7-bis(1-cyanovinylene) fluorenylene}-alt-co-{2,5-bis(N,N'-diphenylamino)-1,4-phenylene} (PDFDP, Mw: 471000) was dissolved with 2 mL chloroform in a 50 mL round-bottom flask. Meanwhile, 20 mg PSMA-PEG-NH2 powder was dissolved in 5 mL ultrapure water and also added in flask to form a

S-5
chloroform/water biphasic solution system. The flask was sonicated in water and bubbled with nitrogen for 30 minutes to completely remove chloroform and obtained a clear orange-colored aqueous solution. The solution was purified via centrifugation (5 minutes, 8000 rpm) and supernatant was concentrated with a centrifugal filtration device (Millipore, Mw cutoff= 100 kDa) to remove excess co-polymer. 3.4 Synthesis of DBCO-functionalized AIEdots
DBCO-functionalized AIEdots were obtained via mixed NH2-AIEdots with DBCO-PEG5-NHS in aqueous solution. 1mL NH2-AIEdots (2 mg/mL in PBS) was mixed with excess DBCO-PEG5-NHS (10uL, 5 mg/mL in DMSO) and reacted for 4 hours in room temperature. After complete reaction, DBCO- AIEdots were purified via dialysis and concentrated with a centrifugal filtration device (Millipore, Mw cutoff= 100 kDa) to remove excess unbounded DBCO molecules. The purified DBCO-AIEdots were also freeze-dried and redissolved in PBS (2 mg/mL).3.5 Synthesis of Anti-HER2 antibody conjugated AIEdots (RHA-AIEdots)
Anti-HER2 antibodies conjugated AIEdots were obtained via simply mixing DBCO- AIEdots with N3-Anti-HER2 antibodies, which could be completely conjugated via click chemistry. 10 uL DBCO- AIEdots (2 mg/mL) were mixed with 10uL N3-Anti-HER2
antibodies (1.2 mg/mL) and reacted for 2 hours in 37℃. Then, DBCO-AIEdots would
completely couple with N3-Anti-HER2 antibodies to acquire Anti-HER2-AIEdots (RHA-AIEdots). the coverage of antibodies on AIEdots was calculated as following: 3.6 Calculation of the coverage of antibodies on AIEdots
The amount of AIE dot in the solution was calculated according the previous method. The total mass of AIE dots was 2 mg in 1ml of water. As the AIEdots were stable in water, the density of the dot suspension could be estimated as ~ 1 g/cm3. As the average size of Apt-AIE dots determined from TEM is ~40 nm, the volume of the AIEdots was calculated from the following equation:
cm3 = 3.3 x 10⁻¹⁷ cm3𝑉𝑜𝑙𝑢𝑚𝑒𝐴𝐼𝐸𝑑𝑜𝑡𝑠 =
43
𝜋 (20 × 10 ‒ 7)3
The molar concentration of AIE dots was
= 0.1 μM𝐶𝐴𝐼𝐸𝑑𝑜𝑡𝑠 =
2
1 × 3.3 𝑥 10 ‒ 17
6.02 × 10²³
The molecule weight of the antibody was ~146KDa. The size of antibody was less than 10 nm. The total mass of antibody was 1.2 mg in 1ml of buffer. The molar concentration of antibody was 8.22 μM. 10ul of antibody solution was added into 1ml of AIEdots solution. We assume all of the antibodies were conjugated on AIEdots. The molar ratio of antibody / AIEdots = 8.22 x 10 / 1000 / 0.1 = 0.8. As a result, there were nearly one antibody on each nanoparticle. 4. Structural characterization
20 mg PSMA-PEG-NH2and PSMA-PEG-DBCO co-block polymers were dissolved in 600 uL DMSO-d6 and characterized in a nuclear magnetic resonance instrument. 1H spectrum was obtained and integrated to calculate the grafting efficiency of PEG and DBCO moieties. FTIR spectra of PSMA and PSMA-PEG-NH2 were recorded using a

S-6
Fourier transform infrared spectrometer with wavenumber range from 400 to 4000 cm-1. Fluorescamine was used to identify existence of amino groups in co-block polymers. 2 mg fluorescamine was dissolved in 100 uL acetone, half of it was added in 1 mL borate buffer (pH 8.5) as negative control and 10 mg PSMA-PEG-NH2 was dissolved in 1 mL borate buffer as positive control, another half was added in 1 mL PSMA-PEG-NH2 co-polymer solution (10mg in borate buffer, pH 8.5) to identify the amino groups. Absorption spectra of PDFDP in chloroform and DBCO-AIEdots in PBS were characterized and normalized in a UV-Vis absorption spectrophotometer. Fluorescence emission spectra were measured in a fluorescent spectrometer. TEM samples were prepared by spin coating AIEdots (10 uL) onto carbon-coated copper grid substrates and air dried naturally. TEM measurements were performed on a FEI Tecnai G2 F20 S-TWIN transmission electron microscope. Hydrodynamic sizes and zeta potential of DBCO-AIEdots and RHA-AIEdots were recorded in a Malvern zetasizer. These two kinds of AIEdots were also carried out electrophoresis in 1% agarose gel to identify successfully conjugation of AIEdots with anti-HER2 antibodies. Fluorescent quantum yields measurement
Fluorescent quantum yields were measured using Rhodamine 6G as a standard (100%). The QYs were obtained following:
𝑄𝑌𝑠𝑎𝑚𝑝𝑙𝑒 = 𝑄𝑌𝑟𝑒𝑓𝑒𝑟𝑒𝑛𝑐𝑒
𝐼𝑠𝑎𝑚𝑝𝑙𝑒
𝐼𝑟𝑒𝑓𝑒𝑟𝑒𝑛𝑐𝑒
𝐴𝑟𝑒𝑓𝑒𝑟𝑒𝑛𝑐𝑒
𝐴𝑠𝑎𝑚𝑝𝑙𝑒
𝑛 2𝑠𝑎𝑚𝑝𝑙𝑒
𝑛 2𝑟𝑒𝑓𝑒𝑟𝑒𝑛𝑐𝑒
Where n is the refractive index, A is the absorption, and l is the integrated fluorescence signal.
5. In vitro Fluorescent and colloidal stability testsFluorescent stability assay was carried out in different pH, ions and buffer
mediums. 10 uL DBCO-AIEdots were separately added in 490 uL PBS solution with pH ranging from 1 to 13, fluorescent intensity of DBCO-AIEdots were also measured to evaluateits stability. Other stability tests were also carried out via the same method, only changed the diluents to high concentrations of NaCl(0,0.5,1,2M) and 0.1 M different kinds of metal ions(Na+, K+,Mg2+,Ca2+,Cu2+,Zn2+,Mn2+,Pb2+,Co2+,Cd2+). DBCO-AIEdots were also dissolved in PBS, borate buffer, HEPES (biological buffer solutions), 1640, DMEM (cell culture mediums) and hydrogen peroxide (30%), ascorbic acid(0.1M) (oxidation/reduction reagents) to generally evaluate its fluorescent stability in vitro. DBCO-Fluor488 was used at same conditions as control for comparison. Afterwards, long term colloidal stability and fluorescent stability of DBCO-AIEdots which stored in room temperature and Photos of AIEdots were captured as long as 243 days.
6. HER2 targeting cell line labeling and confocal imagingSKBR-3 and MD-MB-231 cells were used as positive and negative cell lines for
HER2 targeting and labeling assay. SKBR-3 and MD-MB-231 (8000 cells/200 uL/well in DMEM) were seeded in 8-well chamber slide and incubated overnight for adherence. DBCO-AIEdots (40 uL, 2 mg/mL) and N3-Anti-HER2 (40 uL, 1.2 mg/mL) were mixed

S-7
and reacted for 2 hours in 37 ℃ to obtain RHA-AIEdots. Cells were incubated with
RHA-AIEdots (20uL, 1 mg/mL, as experimental group) and DBCO- AIEdots (10uL, 2mg/mL, as control group) for 1 hours. Afterwards, each group was washed thrice with PBS and fixed with paraformaldehyde (4%). Lastly, stained cell nucleus with Hoechst33258 and captured the confocal images.
7. Photobleaching testDBCO-AIEdots and commercial available DBCO-Fluor488 were bleached with
high intensity laser using a confocal microscopy to evaluate their stability against photobleaching in cell labeling and optical imaging. SK-BR-3 cells (8000 cells/200 uL/well in DMEM) were seeded in 8-well chamber slide. After adhered on glass, N3-Anti-HER2 (10 uL, 1.2 mg/mL) was added into the well and incubate for 1 hour in 37
℃ to allow HER2 antibody completely binding with the HER2 receptor of the cell on
cell membrane. Then washed the cells thrice with PBS to remove unbounded antibodies. Afterwards, DBCO-AIEdots and DBCO-Fluor488 (10 uL) were separately
added into the well and reacted for 2 hours in 37 ℃ to couple the fluorophores with the
antibodies via click chemistry. Go on washing each well and fixed it with paraformaldehyde (4%) and stained cell nucleus with Hoechst 33258. DBCO-AIEdots and DBCO-Fluor488 were irradiated with high intensity 458 nm laser for 20 minutes. Confocal images were captured every five minutes and parallel compared to evaluate their photobleaching speed. The photostability comparison of AIEdots with other commercial available dye (Atto 565 and Rhodamine) was also carried out by irradiation with 488 nm laser for 240s.
8. Cytotoxicity assay Cytotoxicity of DBCO-AIEdots was assessed with CCK-8 (Cell Counting Kit-8) on SKBR-3 and MCF-7 cell lines. The CCK-8 assay was a colorimetric test based on the cellular reduction of WST-8 by the mitochondrial dehydrogenase of viable cells, forming an orange formazan which can dissolved in aqueous solution and measured spectrophotometrically. SKBR-3 and MD-MB-231 in DMEM medium were seeded into 96-well micro-plates (5000 cells/100 uL/well) and then placed in an incubator overnight to allow adherence. Then 100 uL DBCO-AIEdots (0,10,20,60,100,200 ug/mL in DMEM) were added into the wells using a multichannel pipette to get 200 uL final
volume. After incubating for 24 hours in 37 ℃, CCK-8 solution was added into each
well and continued incubating for 4 hours. The absorbance at 450 nm was measured with a Thermo Scientific Multiskan GO microplate reader. Viability of cells was obtained via comparing the wells with the DBCO-AIEdots free wells.
9. In vivo imaging study

S-8
Female BALB/c nude mice (4–6 weeks old and weighted 15–20 g) were purchased from Vital River Laboratory Animal Technology Co. Ltd. (Beijing, China). The procedures and animals were approved by the Animal Study Committee of the Shenzhen Institutes of Advanced Technology, Chinese Academy of Sciences. To set up the tumor xenograft model, SK-BR-3 cells (2 × 10⁶) were administered by subcutaneous injection into the armpit of the mice. When the tumor volumes reached about 125 mm3, the mice were divided into two groups (n = 3): free AIEdots group and anti-HER2-AIEdots group. The samples (1mg/Kg for anti-HER2-AIEdots and equivalent free AIEdots) were injected to nude mice via tail vein. Images were taken at 0.5, 8, 24 and 48 h after injection using the Maestro in vivo imaging system. The nude mice were sacrificed 24 h after injection. Then the organs including heart, liver, spleen, lung, kidney and tumor were collected and analyzed by the Maestro in vivo imaging system.

S-9
Figures and tables:
Figure S1 (a) The Synthesis of PSMA-PEG-NH2 and (b)the indetification of amino groups on thepolymers. The amino groups of PSMA-PEG-NH2 were identified with fluorescamine, a commercial available amino detection reagent. None fluorescent fluorescamine was able to react with amino groups quickly, products emit obviously observed strong green fluorescence as displayed in (b).

S-10
Figure S2 1H NMR spectra of PSMA-PEG-NH2 polymers in DMSO-d6. A broad peak around 7 ppm ascribed to aromatic protons from benzene rings of co-block polymers backbone and a typical peak around 3.5 ppm attributed to the protons of grafted PEG moieties. The peak at 1.4ppm was attributed to the photons of methylene in backbones. The stoichiometry of the polymers for each component was calculated from the integral of corresponding 1H NMR spectrum. According to the molecule weight of PSMA (~1600) and molar ratio of styrene/maleic anhydride (1.3/1), theoretically existed 50 photons in benzene rings and 16 photons in methylene per polymer chain. From the integration, we measured 50 H and 15.5 H separately which is quite consistent with theoretical values. The coupling efficiency between maleic anhydride and amino PEG moieties was estimated by integration of PEG moieties (233.8 H, 83.5 %).

S-11
Figure S3 FT-IR spectra of PSMA and PSMA-PEG-NH2 co-block polymers.

S-12
Figure S4 Normalized UV/Vis absorption spectra (blue) and photoluminescence spectra (red) of PDFDP in chloroform.

S-13
Figure S5 The AIE properties characterization of PDFDP. (a) The molecular structure of PDFDP. (b) The photo of PDFDP powder under white light (left) and the imaging of the PDFDP powder under the UV lamp excitation. (c) Photoluminescence (PL) spectra of PDFDP in the H2O/THF mixtures with different fw. (D) The plot of relative PL intensities at 670 nm versus fw.

S-14
Figure S6 The stability test of the AIEdots. (a) Fluorescence intensity measurements and fluorescence images of the AIEdots (a) in various pH buffers; (b) under various concentrations of NaCl solution; (c) in the presence of various ions; (d) in the presence of various biological mediems and oxidizing/reducing species (PBS, borate buffer, HEPES, RPMI Medium1640, DMEM culture medium, 30%H2O2 solution, 0.1M ascorbic acid solution). Data represented the mean value ± standard deviation, n = 3.
S-15
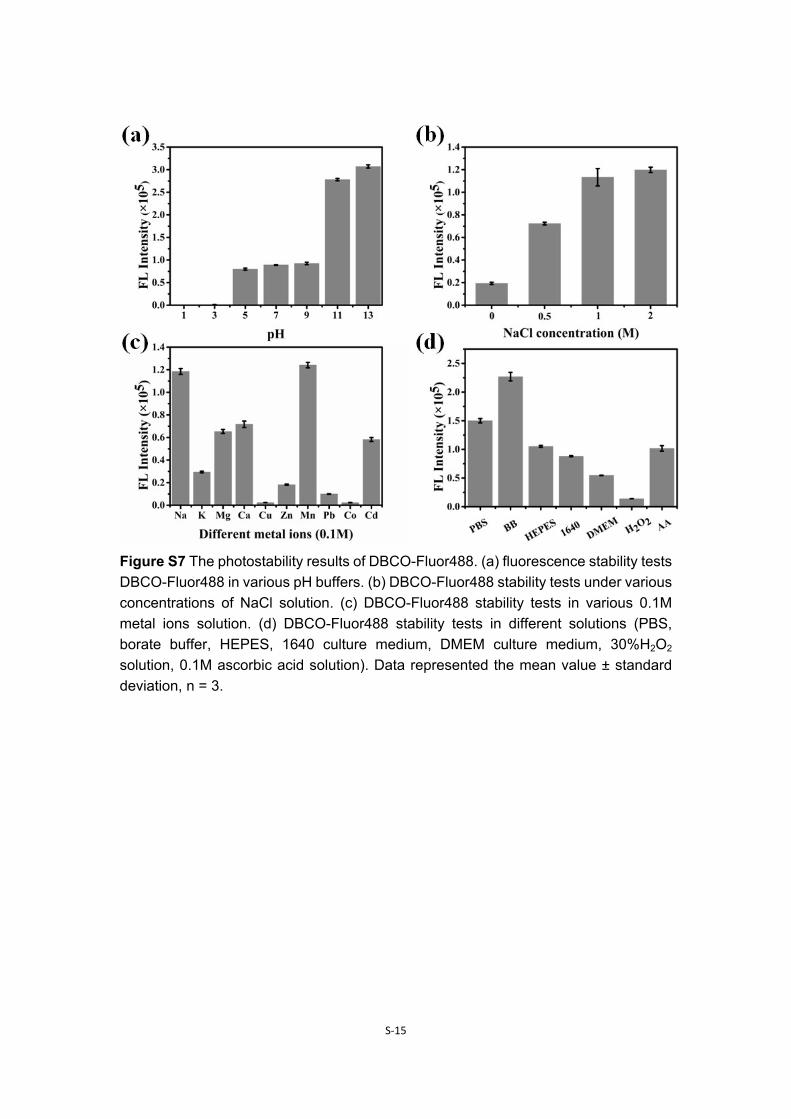
Figure S7 The photostability results of DBCO-Fluor488. (a) fluorescence stability tests DBCO-Fluor488 in various pH buffers. (b) DBCO-Fluor488 stability tests under various concentrations of NaCl solution. (c) DBCO-Fluor488 stability tests in various 0.1M metal ions solution. (d) DBCO-Fluor488 stability tests in different solutions (PBS, borate buffer, HEPES, 1640 culture medium, DMEM culture medium, 30%H2O2 solution, 0.1M ascorbic acid solution). Data represented the mean value ± standard deviation, n = 3.

S-16
Figure S8 Long term storage photostability and colloidal stability of AIEdots.
S-17
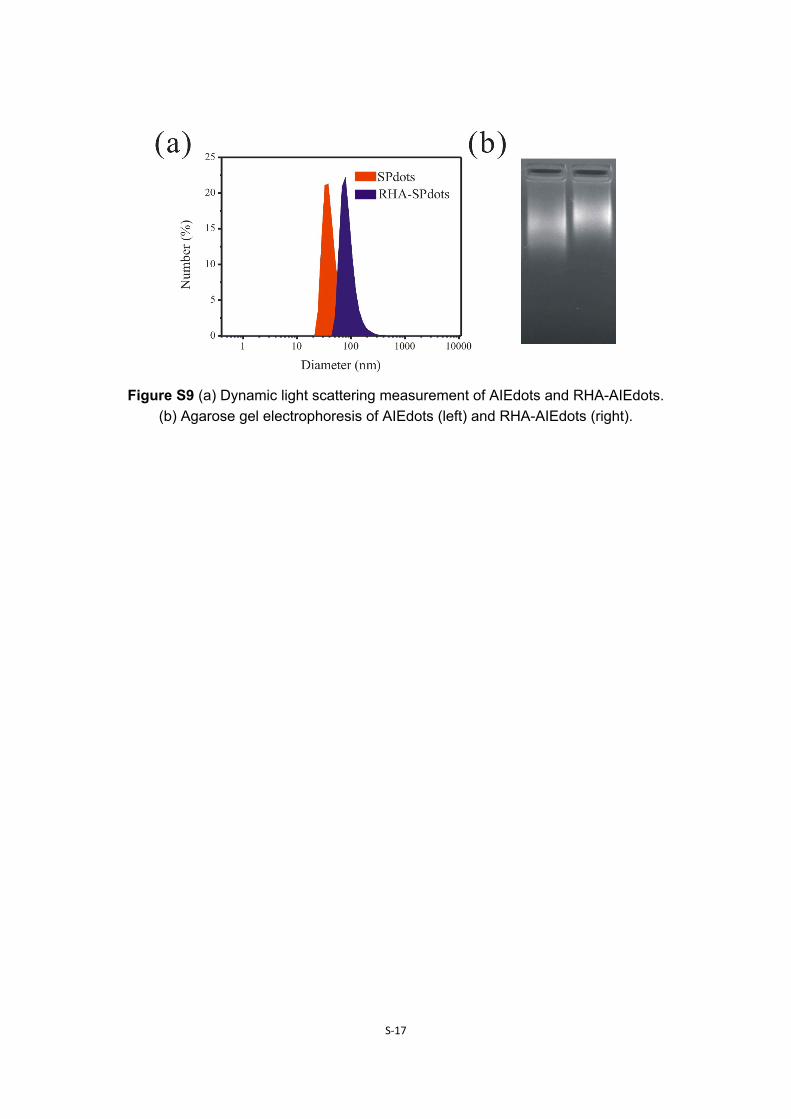
Figure S9 (a) Dynamic light scattering measurement of AIEdots and RHA-AIEdots. (b) Agarose gel electrophoresis of AIEdots (left) and RHA-AIEdots (right).

S-18
Figure S10 Photostability comparison of fluorescence signals of SK-BR-3 cells stained with the anti-HRE2 recombinant humanized antibody-AIEdots bioconjugates (RHA-AIEdots) (upper) and anti-HRE2 recombinant humanized antibody-Fluo488 bioconjugates (RHA-Fluo488) (lower) under laser continuously irradiation for 20 min, respectively. Scale bar: 50 μm. Excitation wavelength: 488 nm. Objective: 63x

S-19
Figure S11 Photostability comparison of AIEdots with PDFDP core with Atto 565 and Rhodamine under laser continuously irradiation for 240 s, respectively. Scale bar: 5 μm. Excitation wavelength: 488 nm. Objective: 100x

S-20
Figure S12 Cell viability of the RHA-AIEdots at various concentrations ranging from 0 μg/ml to 100 μg/ml after 24 h incubation. Data represented the mean value ± standard deviation, n = 5.
Table S1 Quantum yield of PDFDP in chloroform and AIEdots in water.


![Imaging the Urokinase Plasminongen Activator Receptor in ... · estrogen receptor (ER) positive luminal breast cancers [3, 4]. Despite the implementation of these targeted therapies,](https://img.dokumen.tips/doc/110x75/5f07ef307e708231d41f7e46/imaging-the-urokinase-plasminongen-activator-receptor-in-estrogen-receptor-er.jpg)


![Preliminary evidence of imaging of chemokine receptor-4 ... · ORIGINAL RESEARCH Open Access Preliminary evidence of imaging of chemokine receptor-4-targeted PET/CT with [68Ga]pentixafor](https://img.dokumen.tips/doc/110x75/5facc16b7ad6947dc85baa4d/preliminary-evidence-of-imaging-of-chemokine-receptor-4-original-research-open.jpg)


