Embed Size (px)
Citation preview
Children and Youth Services Review 35 (2013) 287–295
Contents lists available at SciVerse ScienceDirect
Children and Youth Services Review
j ourna l homepage: www.e lsev ie r .com/ locate /ch i ldyouth
Family group decision making: Measuring fidelity to practice principles in publicchild welfare
Mary Elizabeth Rauktis a,⁎, Lauren Bishop-Fitzpatrick a, Nahri Jung a, Joan Pennell b
a University of Pittsburgh, United Statesb North Carolina State University, United States
⁎ Corresponding author.E-mail address: [email protected] (M.E. Rauktis).
0190-7409/$ – see front matter © 2012 Elsevier Ltd. Allhttp://dx.doi.org/10.1016/j.childyouth.2012.11.001
a b s t r a c t
a r t i c l e i n f oArticle history:Received 11 October 2012Accepted 8 November 2012Available online 19 November 2012
Keywords:Family group decision makingModel fidelity scaleImplementation evaluation
This study describes the development and validation of a short, self-administered fidelity measure used tocapture the perspectives of a range of individuals participating in a family group decision making conference.Exploratory factor analyses suggested either a two or a three factor solution. Findings from confirmatory fac-tor analysis supported a three factor model that includes sets of practices yielding: (1) Productive DecisionMaking; (2) Family Group Inclusion; and (3) Professional Supportiveness. These results provide directionto public child welfare practitioners and policymakers about the importance and the feasibility of attendingto multiple perspectives in assessing program delivery.
© 2012 Elsevier Ltd. All rights reserved.
1. Introduction
Increasingly, public child welfare systems in the United States andother countries seek to engage family groups in decision makingabout their young relatives (Pennell, Burford, Connolly, & Morris,2011). This means that workers reach beyond the immediate familyto include their relatives and “social” kinship network in makingand implementing plans. The practice assumption is that children inneed of protection are better off if their family group takes responsi-bility for their welfare in partnership with public agencies and com-munity organizations. The guiding principles are that children andtheir families have the right to make decisions over their affairs andthat children have a right to remain connected to their cultural heri-tage (United Nations, 2007, 1989).
Although family group engagement is compelling both ethicallyand conceptually (Barth, 2002; Burford, Pennell, & Edwards, 2011;Crampton, 2007), additional research is needed to conclusively estab-lish its efficacy in terms of child safety, permanence, and well-being(Shlonsky et al., 2009). A critical element in establishing efficacy isto first determine model fidelity in order to make the connectionbetween service programs and their outcomes (Mowbray, Holter,Teague, & Bybee, 2003). Because family group engagement modelsare based on tenets of human rights and cultural respect, fidelity inthis context is defined as to whether “an intervention is carried outin a manner that is true to its key principles and their practices”(Pennell, 2005, p. 110, emphasis in original). A confounding factorin assessing the fidelity of family group practice is that child welfare,
rights reserved.
especially in the United States, has adopted a range of models. Thesego variously by such names as family group decision making, familygroup conferencing, family team meetings, family unity meetings,and team decision making (Merkel-Holguin & Wilmot, 2005). More-over, how agencies carry out a particular family group model is notnecessarily consistent with its central features.
Hayes (1998) predicted that one of the biggest challenges in theadoption of evidence-based practices would be measuring fidelityquickly and efficiently, and this was confirmed thirteen years later bySchoenwald et al. (2011). A lack of attention to core family group prin-ciples can lead to unintended “drift” in practice (Breitenstein et al.,2010; Crea, Crampton, Abramson-Madden, & Usher, 2008; Rauktis,Huefner, & Cahalane, 2011a). However, the fidelity measures for familygroupmodels described in the research literature usually require time-intensive activities such as reviewing records and plans (Stuczynski &Kimmich, 2010; Vesneski & Kemp, 2000) or phone interviews(Pennell, 2005), or they have been created for research studies andused only with small samples (Berzin, Thomas, & Cohen, 2007). Thereis a need for a psychometrically sound family group fidelity measurethat is both based onprinciples and implemented in the real-world con-text of child welfare practice.
The purpose of this paper is to describe the development and val-idation of a short, self-administered fidelity measure that capturesthe perspectives of multiple informants at the conference and thatcan be used to improve practice in public child welfare. The studytook place in Pennsylvania where nearly all county child welfareagencies had adopted the model of family group decision making(FGDM; Rauktis et al., 2011a). These agencies agreed to participatein a statewide survey that was conducted by the University of Pitts-burgh to measure model fidelity. The authors begin by examining dif-ferent approaches to measuring model fidelity and reviewing the
288 M.E. Rauktis et al. / Children and Youth Services Review 35 (2013) 287–295
North Carolina instrument (Pennell, 1999) on which the Pennsylva-nia survey was based. Turning to developments in Pennsylvania, theauthors describe the state's FGDM model and the process of refiningthe survey to fit the local context. Next they describe the sample of5456 usable surveys and the data analyses used to explore and thenconfirm the factor structure of the FGDM model fidelity scale. The re-sults yielded three reliable FGDM subscales measuring the extent ofProductive Decision Making, Family Group Inclusion, and ProfessionalSupportiveness. The conclusions discuss the importance of incorpo-rating model fidelity measures into public child welfare in order touphold agency accountability for family group engagement in deci-sion making.
1.1. Measuring model fidelity
Several theoretical approaches have been used in developingfidelity measures. One approach is founded on the assumption thatprograms consist of essential elements that can be operationalizedinto variables and indicators that then determine whether a programis present or absent (Hall & Hord, 1987). Another approach is to mea-sure the structure or framework of a program as well as the humaninteractions or processes that occur in its delivery (e.g., structureand process approach; Mowbray et al., 2003). Finally, there is also ahybrid of both of these approaches which combines elements of mea-suring and operationalizing the essential program elements and ele-ments of the human interactions or processes that occur in thedelivery of the model (Century, Rudnick, & Freeman, 2010). Regard-less of the methodology, the research is fairly consistent in rec-ommending the ongoing monitoring of fidelity in order to ensurehigh quality (Fixsen, Naoom, Blasé, Friedman, & Wallace, 2005). Notsurprisingly, a review of the implementation literature verifies thatfidelity has been measured more often than any other implementa-tion outcome (Proctor et al., 2011).
Several developers have devoted considerable effort to con-structing treatment fidelity tools, and these metrics are present acrossdifferent models and service systems. For example, the developers ofMultisystemic Therapy (MST) created adherence tools based uponpractice principles in order to offer clarity about the model withoutinhibiting the necessary responsiveness to local conditions (Henggeler,Schoenwald, Borduin, Rowland, & Cunningham, 1998). These toolscould be applied by MST supervisors and consultants in monitoringtreatment adherence (Henggeler, Borduin, Schoenwald, Huey, &Chapman, 2006). In addition, self-administered client fidelity measuresfor MST were also created so that the caregiver perspective of fidelitycould be assessed (Schoenwald et al., 2011). The fidelity to AssertiveCommunity Treatment (ACT) scale was developed due to concernsabout the contradictory results being reported by replication sites(Teague, Bond, & Drake, 1998). Furthermore, wraparound, the interven-tion most equivalent to FGDM has used the Wraparound Fidelity Indexto measure the quality of wraparound implementation from the per-spectives of the children's caregivers and the program facilitators(Bruns, Burchard, Suter, Leverentz-Brady, & Force, 2004).
Fidelity measures have also been shown to be related to program ormodel outcomes in a number of different contexts. For instance, imple-mentation studies of MST have found that MST treatment adherence isstrongly related to favorable outcomes such as improved symptomatol-ogy and decreased incarceration (Henggeler,Melton, Brondino, Scherer,& Hanley, 1997; Schoenwald, Henggeler, Brondino, & Rowland, 2000).Similarly, positive outcomes, such as reductions in substance abuseand fewer hospital stays for individuals with severe mental illnesswho were enrolled in ACT programs, were strongly and significantlyrelated to a program's fidelity (McHugo, Drake, Teague, & Xie, 1999).Finally, implementation studies using the Wraparound Fidelity Indexfound a relationship between model adherence and favorable childand family outcomes (Bruns, Suter, Force, & Burchard, 2005; Rast,
Peterson, Earnest, & Mears, 2003). As such, model fidelity may play avery large role in the achievement of positive treatment outcomes.
1.2. Measuring fidelity to critical components of family group decisionmaking
The family group decision making (FGDM) model used in Pennsyl-vania is based on the New Zealandmodel of family group conferencing.The practice of family group conferencing was first legislated in NewZealand after protests by Indigenous people against Euro-centric ap-proaches to child welfare and youth justice that were experienced asundermining to their kinship networks (Rangihau, 1986). The 1989New Zealand legislation upheld the responsibilities of the familygroup for their young relatives, children's rights to safety and tomakingdecisions over their lives, the importance of children's culture, and com-munity–state collaboration (Hassall, 1996). The model was institutedacross the country for child protection matters that would otherwisehave been resolved in the court, and coordinator positions wereestablished to organize and convene the conferences.
Family group conferencing and variations of the model wereadopted by child welfare systems around the globe (Burford,Connolly, Morris, & Pennell, 2010; Rotabi, Pennell, Roby, & Bunkers,2012). The term family group decision making was coined for an earlyCanadian demonstration project of theNewZealandmodel in situationsof family violence (Pennell & Burford, 1995) and later used in theUnitedStates to refer to family group conferencing applied in child welfare(American Humane Association & FGDM Guidelines Committee,2010). Feedback from the families and professionals was overwhelm-ingly positive, with high levels of satisfaction reported (Bell & Wilson,2006; Crampton & Jackson, 2007; Crea & Berzin, 2009; Pennell &Anderson, 2005; Pennell & Burford, 2000; Sheets et al., 2009; Sieppert,Hudson, & Unrau, 2000). However, the evidence on the effectivenessof family group models in preventing reoccurrence of maltreatmentand improving permanence has been conflicting (e.g., Berzin, 2006;Berzin et al., 2007; Pennell & Burford, 2000; Pennell, Edwards, &Burford, 2010; Sheets et al., 2009; Sundell & Vinnerljung, 2004;Weigensberg, Barth, & Guo, 2009). Without assurance of fidelity to amodel, it cannot be determined if the results are due to an ineffectivemodel or to faulty implementation.
1.3. Intervention model principles
Given the importance of model fidelity to understanding outcomesachieved in different contexts, key principles needed to be establishedin order to give direction to family group conferencing and to examinemodel fidelity (Pennell, 2003b). Based on her work in Canada (Pennell& Burford, 1995), Joan Pennell (1999) conceptualized themodel as a se-ries of nine principles: (1) build broad-based support and cultural com-petence; (2) enable the coordinators to work with family groups inorganizing their conferences; (3) have the conference belong to thefamily group; (4) foster understanding of the family and creativity inplanning; (5) help the conference participants take part safely and ef-fectively; (6) tap into the strengths of the family group in making theplan; (7) promote carrying out the plan; (8) fulfill the purpose of theplan; and (9) change policies, procedures and resources to sustain part-nerships among family groups, community organizations and publicagencies. Based on these principles, activities that should occur before,during, and after the family group meeting were then established. Forexample, the principle “have the conference belong to the family” isoperationalized as meeting with family members prior to the confer-ence to explain the purpose of the meeting, select its venue, and createa list of individuals to invite.
To check for practice integrity, Pennell next developed and tested inNorth Carolina a measure of adherence to these principles. This instru-ment, called the “Achievement of Family Group Conferencing (FCG)Ob-jectives” (Pennell, 2003a), operationalized the principles into a series of
289M.E. Rauktis et al. / Children and Youth Services Review 35 (2013) 287–295
questions about activities associated with the conference preparations,the meeting participation, and the resulting plan of action. A separatescale examined the post-conference work. In the Achievement of FGCObjectives measure, the family group conference became the object offidelity. For example, the principle “have the conference belong to thefamily group” is assessed by the item “more family group membersthan service providers were invited to the conference.” For each of theitems, the respondent is asked to give an answer of strongly disagree,disagree, agree, or strongly agree, with the additional options of don'tknow and not applicable.
The Achievement of FGC Objectives metric was completed with rel-ative ease by family groupmembers through a telephone interview, onaverage one month after the conference. A study of 151 respondentsfrom 30 conferences found that the Achievement of FGC Objectivesyielded ratings congruent with qualitative analyses of coordinators'documentation of their preparations and the conference proceedings,participants' narratives of their conference, and researchers' observa-tions of the conference deliberations; and the scale succeeded in identi-fying the convergences and divergences in viewpoints of family andservice providers and had strong internal consistency (Pennell, 2005).
Exploratory factor analyses (Pennell, 2004) identified three sub-scales: cultural safety (conference held in the right way for the familygroup), community partnerships (family group and service providersare clear about what they are doing), and family leadership (familygroup empowered to make a plan) (Pennell, 2009). Canonical correla-tion analysis of the FGC Evaluations (a participant satisfaction form)completed immediately at the conclusion of the conference and theAchievement of FGC Objectives identified a fourth FGC Objectivessubscale of inclusive planning (diverse family participants involved,and continued family–community–state planning supported) (Pennell,2006, 2009). Fig. 1 below displays the practice principles, FGC objectives,and four FGC objectives subscales.
As previously noted, creating measures that are psychometricallysound and that can be implemented in everyday practice presentsmul-tiple challenges (Schoenwald et al., 2011). Fidelity monitoring is a crit-ical need in child welfare because it ensures that evidence-based andpromising practices are implemented as intended in real-world con-texts (Kaye & Osteen, 2011). When FGDM is part of a clinical trial or aprogram evaluation, it is more likely that there are dedicated resourcesfor interviewing family members, viewing and coding video or audio-tapes, and using fidelitymeasures thanwhen it is part of the typical ser-vices. However, states, counties, tribes, and provinces rarely have theresources and expertise to routinely monitor fidelity.
Although the Achievement of Family Group Conferencing (FCG) Ob-jectives scale was promising and available free of charge, the adminis-tration method made it less likely to be used by public child welfareagencies. Amulti-informantmeasure offidelity to family group decisionmakingwas needed that could be self-administered by a variety of fam-ily, friends, and professionals, and used to guide implementation ofpractice. To address this gap, the current study aimed to revise and toexamine the factor structure of a self-administered version of theAchievement of FGC Objectives scale. This was a 3-year developmentproject undertaken by the Pennsylvania Office of Children Youth andFamilies and theUniversity of Pittsburgh, ChildWelfare Resource centerand approved by the University of Pittsburgh Institutional Reviewboard. This study fills a critical gap in the field of child welfare practiceby testing both the psychometric qualities of the scale aswell as the fea-sibility of broadly monitoring fidelity.
2. Method
2.1. Procedure
2.1.1. ContextIn Pennsylvania, the process begins with a referral of the family to
FGDM by the caseworker. The FGDM coordinator then meets with the
parents/caregivers, describes the purpose and process of FGDM, ex-plains the roles of the other participants, clarifies expectations, and ob-tains agreement. The next phase, preparation, involves the coordinatorand the parent working together to identify who should be invited tothe conference, what the objectives for the FGDM conference will be,where the conference will take place, andwhen it will happen. A searchis undertaken to widen the circle by contacting kin and other informalsupports or reviewing files in order to obtain information about peoplewho once played an important role in their lives, but with whomthey have lost contact. The FGDM coordinator may then become theFGDM facilitator at the meeting, or a different professional may serveas the conference facilitator who is responsible for convening and orga-nizing the deliberations. The meeting has four phases: (1) a welcome/introduction; (2) information sharing; (3) private family time in orderfor the family group to create a planwithout the service providers pres-ent; and (4) acceptance and finalizing the plan and then closing themeeting. When the family is done meeting privately, they presenttheir plan for the care and protection of the children. The plan isreviewed; if approved, then it is determined how the plan will beimplemented andmonitored, andwhich individuals will assist the fam-ily to secure needed services and resources.
In the past, at the end of every conference a satisfaction survey wasdistributed, completed by the members, and then returned to the re-source center. However, there were some indications of practice in-consistencies such as inadequate preparation of professionals andinconsistent follow through (Rauktis, 2008). As a result, participatingchild welfare agencies agreed to assess model fidelity by administeringthe Achievement of FGCObjectives scale. The instrumentwas revised toreflect practices specific to Pennsylvania and to accommodate self-administration.
2.1.2. Initial revisionsThe revision process of the scale is described in greater detail else-
where (Rauktis, Pennell, Burford, Crampton, & Merkel-Holguin, 2012;Rauktis, Pennell, & Reinhart, 2011b; Rauktis et al., 2011a). For the re-vision, new instructions, re-formatting, and demographic questionswere created and, at the request of the Office of Children Youth andFamilies, two new items were included: “the children will be saferas a result of this plan” and “I would recommend family group toother families.” After an initial period of six months of data collection,however, it became apparent that there were problems. There wasunanimous dislike of the look and feel of the measure which had aformat similar to standardized tests. Families felt that the languagewas confusing: the family group became the focus or object to berated rather than the individual. For example, “The family grouphad private time to make the plan” rather than “I had private timewith our family in order to make the plan.” The individuals whowere facilitating and coordinating the groups also were concernedabout how the information would be used.
Satisfaction ratings in the past had been uniformly high, and therationale for fidelity monitoring had not been widely communicatedto all of the stakeholders. A series of conference calls were conductedwith all of the FGDM coordinators and facilitators in order to clarifythe purpose, determine their concerns, and solicit suggestions for im-proving the measure as well as the process of administering the sur-vey. When the purpose was identified as improving the quality ofFGDM, there was greater cooperation and less resistance to measur-ing fidelity. The FGDM professionals felt that some of the languagewas confusing, and cognitive interviews conducted with family mem-bers identified language that was likely causing measurement error.Descriptive analyses revealed a large number of missing responseson certain items and improperly completed surveys suggested addi-tional problems (Rauktis et al., 2011b). Subsequently, six itemswere revised to simplify language and to be more consistent withthe model of FGDM used in Pennsylvania. The demographics were re-vised and moved to the end, and a new scanning application resulted
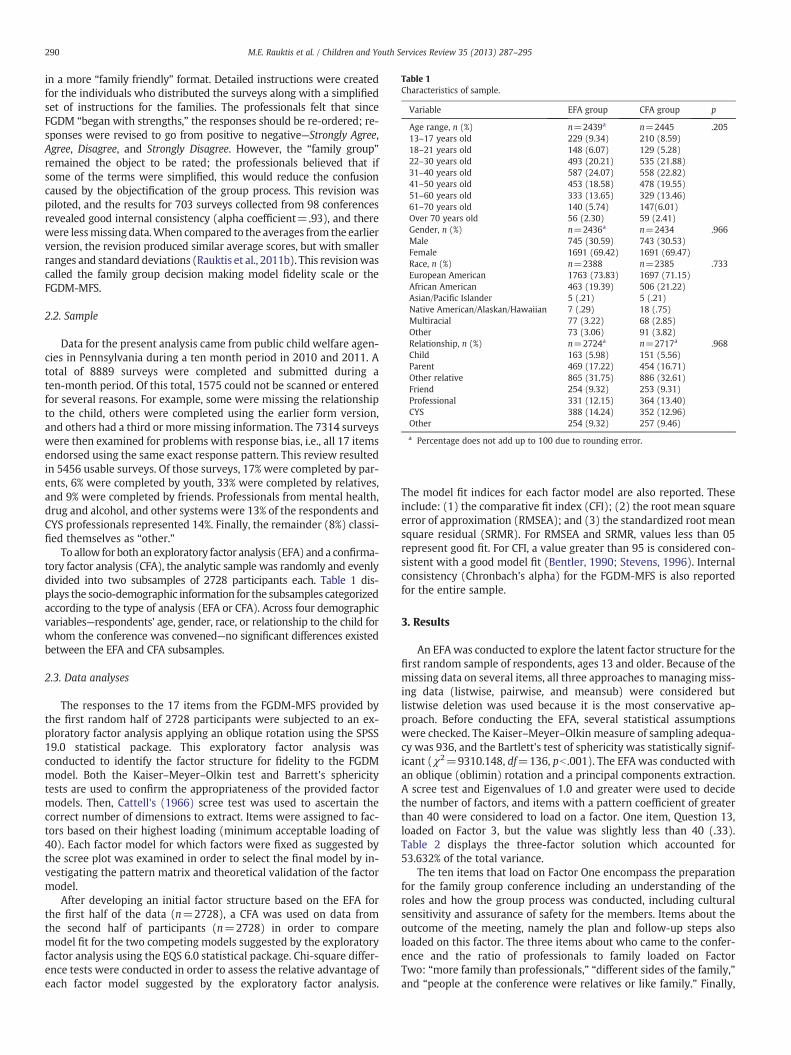
Table 1Characteristics of sample.
Variable EFA group CFA group p
Age range, n (%) n=2439a n=2445 .20513–17 years old 229 (9.34) 210 (8.59)18–21 years old 148 (6.07) 129 (5.28)22–30 years old 493 (20.21) 535 (21.88)31–40 years old 587 (24.07) 558 (22.82)41–50 years old 453 (18.58) 478 (19.55)51–60 years old 333 (13.65) 329 (13.46)61–70 years old 140 (5.74) 147(6.01)Over 70 years old 56 (2.30) 59 (2.41)Gender, n (%) n=2436a n=2434 .966Male 745 (30.59) 743 (30.53)Female 1691 (69.42) 1691 (69.47)Race, n (%) n=2388 n=2385 .733European American 1763 (73.83) 1697 (71.15)African American 463 (19.39) 506 (21.22)Asian/Pacific Islander 5 (.21) 5 (.21)Native American/Alaskan/Hawaiian 7 (.29) 18 (.75)Multiracial 77 (3.22) 68 (2.85)Other 73 (3.06) 91 (3.82)Relationship, n (%) n=2724a n=2717a .968Child 163 (5.98) 151 (5.56)Parent 469 (17.22) 454 (16.71)Other relative 865 (31.75) 886 (32.61)Friend 254 (9.32) 253 (9.31)Professional 331 (12.15) 364 (13.40)CYS 388 (14.24) 352 (12.96)Other 254 (9.32) 257 (9.46)
a Percentage does not add up to 100 due to rounding error.
290 M.E. Rauktis et al. / Children and Youth Services Review 35 (2013) 287–295
in a more “family friendly” format. Detailed instructions were createdfor the individuals who distributed the surveys along with a simplifiedset of instructions for the families. The professionals felt that sinceFGDM “began with strengths,” the responses should be re-ordered; re-sponses were revised to go from positive to negative—Strongly Agree,Agree, Disagree, and Strongly Disagree. However, the “family group”remained the object to be rated; the professionals believed that ifsome of the terms were simplified, this would reduce the confusioncaused by the objectification of the group process. This revision waspiloted, and the results for 703 surveys collected from 98 conferencesrevealed good internal consistency (alpha coefficient=.93), and therewere lessmissingdata.When compared to the averages from the earlierversion, the revision produced similar average scores, but with smallerranges and standard deviations (Rauktis et al., 2011b). This revisionwascalled the family group decision making model fidelity scale or theFGDM-MFS.
2.2. Sample
Data for the present analysis came from public child welfare agen-cies in Pennsylvania during a ten month period in 2010 and 2011. Atotal of 8889 surveys were completed and submitted during aten-month period. Of this total, 1575 could not be scanned or enteredfor several reasons. For example, some were missing the relationshipto the child, others were completed using the earlier form version,and others had a third or more missing information. The 7314 surveyswere then examined for problems with response bias, i.e., all 17 itemsendorsed using the same exact response pattern. This review resultedin 5456 usable surveys. Of those surveys, 17% were completed by par-ents, 6% were completed by youth, 33% were completed by relatives,and 9% were completed by friends. Professionals from mental health,drug and alcohol, and other systems were 13% of the respondents andCYS professionals represented 14%. Finally, the remainder (8%) classi-fied themselves as “other.”
To allow for both an exploratory factor analysis (EFA) and a confirma-tory factor analysis (CFA), the analytic sample was randomly and evenlydivided into two subsamples of 2728 participants each. Table 1 dis-plays the socio-demographic information for the subsamples categorizedaccording to the type of analysis (EFA or CFA). Across four demographicvariables—respondents' age, gender, race, or relationship to the child forwhom the conference was convened—no significant differences existedbetween the EFA and CFA subsamples.
2.3. Data analyses
The responses to the 17 items from the FGDM-MFS provided bythe first random half of 2728 participants were subjected to an ex-ploratory factor analysis applying an oblique rotation using the SPSS19.0 statistical package. This exploratory factor analysis wasconducted to identify the factor structure for fidelity to the FGDMmodel. Both the Kaiser–Meyer–Olkin test and Barrett's sphericitytests are used to confirm the appropriateness of the provided factormodels. Then, Cattell's (1966) scree test was used to ascertain thecorrect number of dimensions to extract. Items were assigned to fac-tors based on their highest loading (minimum acceptable loading of40). Each factor model for which factors were fixed as suggested bythe scree plot was examined in order to select the final model by in-vestigating the pattern matrix and theoretical validation of the factormodel.
After developing an initial factor structure based on the EFA forthe first half of the data (n=2728), a CFA was used on data fromthe second half of participants (n=2728) in order to comparemodel fit for the two competing models suggested by the exploratoryfactor analysis using the EQS 6.0 statistical package. Chi-square differ-ence tests were conducted in order to assess the relative advantage ofeach factor model suggested by the exploratory factor analysis.
The model fit indices for each factor model are also reported. Theseinclude: (1) the comparative fit index (CFI); (2) the root mean squareerror of approximation (RMSEA); and (3) the standardized root meansquare residual (SRMR). For RMSEA and SRMR, values less than 05represent good fit. For CFI, a value greater than 95 is considered con-sistent with a good model fit (Bentler, 1990; Stevens, 1996). Internalconsistency (Chronbach's alpha) for the FGDM-MFS is also reportedfor the entire sample.
3. Results
An EFAwas conducted to explore the latent factor structure for thefirst random sample of respondents, ages 13 and older. Because of themissing data on several items, all three approaches to managing miss-ing data (listwise, pairwise, and meansub) were considered butlistwise deletion was used because it is the most conservative ap-proach. Before conducting the EFA, several statistical assumptionswere checked. The Kaiser–Meyer–Olkin measure of sampling adequa-cy was 936, and the Bartlett's test of sphericity was statistically signif-icant (χ2=9310.148, df=136, pb .001). The EFA was conducted withan oblique (oblimin) rotation and a principal components extraction.A scree test and Eigenvalues of 1.0 and greater were used to decidethe number of factors, and items with a pattern coefficient of greaterthan 40 were considered to load on a factor. One item, Question 13,loaded on Factor 3, but the value was slightly less than 40 (.33).Table 2 displays the three-factor solution which accounted for53.632% of the total variance.
The ten items that load on Factor One encompass the preparationfor the family group conference including an understanding of theroles and how the group process was conducted, including culturalsensitivity and assurance of safety for the members. Items about theoutcome of the meeting, namely the plan and follow-up steps alsoloaded on this factor. The three items about who came to the confer-ence and the ratio of professionals to family loaded on FactorTwo: “more family than professionals,” “different sides of the family,”and “people at the conference were relatives or like family.” Finally,
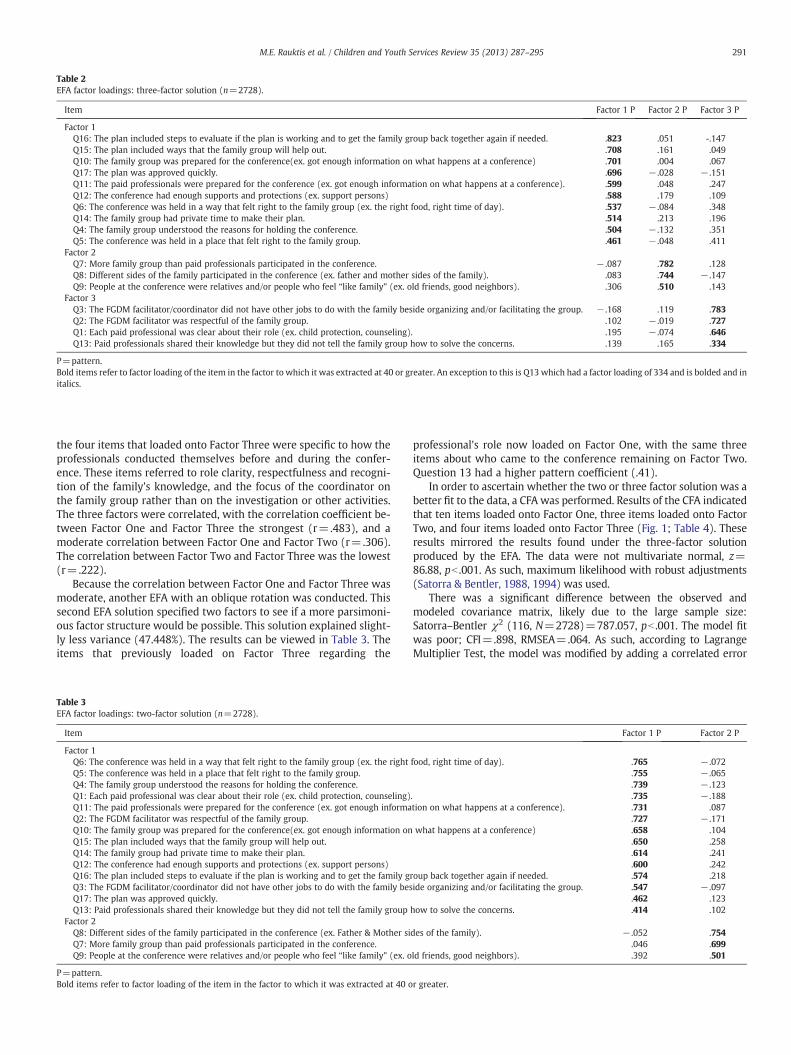
Table 2EFA factor loadings: three-factor solution (n=2728).
Item Factor 1 P Factor 2 P Factor 3 P
Factor 1Q16: The plan included steps to evaluate if the plan is working and to get the family group back together again if needed. .823 .051 -.147Q15: The plan included ways that the family group will help out. .708 .161 .049Q10: The family group was prepared for the conference(ex. got enough information on what happens at a conference) .701 .004 .067Q17: The plan was approved quickly. .696 − .028 − .151Q11: The paid professionals were prepared for the conference (ex. got enough information on what happens at a conference). .599 .048 .247Q12: The conference had enough supports and protections (ex. support persons) .588 .179 .109Q6: The conference was held in a way that felt right to the family group (ex. the right food, right time of day). .537 − .084 .348Q14: The family group had private time to make their plan. .514 .213 .196Q4: The family group understood the reasons for holding the conference. .504 − .132 .351Q5: The conference was held in a place that felt right to the family group. .461 − .048 .411
Factor 2Q7: More family group than paid professionals participated in the conference. − .087 .782 .128Q8: Different sides of the family participated in the conference (ex. father and mother sides of the family). .083 .744 − .147Q9: People at the conference were relatives and/or people who feel “like family” (ex. old friends, good neighbors). .306 .510 .143
Factor 3Q3: The FGDM facilitator/coordinator did not have other jobs to do with the family beside organizing and/or facilitating the group. − .168 .119 .783Q2: The FGDM facilitator was respectful of the family group. .102 − .019 .727Q1: Each paid professional was clear about their role (ex. child protection, counseling). .195 − .074 .646Q13: Paid professionals shared their knowledge but they did not tell the family group how to solve the concerns. .139 .165 .334
P=pattern.Bold items refer to factor loading of the item in the factor to which it was extracted at 40 or greater. An exception to this is Q13 which had a factor loading of 334 and is bolded and initalics.
291M.E. Rauktis et al. / Children and Youth Services Review 35 (2013) 287–295
the four items that loaded onto Factor Three were specific to how theprofessionals conducted themselves before and during the confer-ence. These items referred to role clarity, respectfulness and recogni-tion of the family's knowledge, and the focus of the coordinator onthe family group rather than on the investigation or other activities.The three factors were correlated, with the correlation coefficient be-tween Factor One and Factor Three the strongest (r=.483), and amoderate correlation between Factor One and Factor Two (r=.306).The correlation between Factor Two and Factor Three was the lowest(r=.222).
Because the correlation between Factor One and Factor Three wasmoderate, another EFA with an oblique rotation was conducted. Thissecond EFA solution specified two factors to see if a more parsimoni-ous factor structure would be possible. This solution explained slight-ly less variance (47.448%). The results can be viewed in Table 3. Theitems that previously loaded on Factor Three regarding the
Table 3EFA factor loadings: two-factor solution (n=2728).
Item
Factor 1Q6: The conference was held in a way that felt right to the family group (ex. the rightQ5: The conference was held in a place that felt right to the family group.Q4: The family group understood the reasons for holding the conference.Q1: Each paid professional was clear about their role (ex. child protection, counseling)Q11: The paid professionals were prepared for the conference (ex. got enough informaQ2: The FGDM facilitator was respectful of the family group.Q10: The family group was prepared for the conference(ex. got enough information onQ15: The plan included ways that the family group will help out.Q14: The family group had private time to make their plan.Q12: The conference had enough supports and protections (ex. support persons)Q16: The plan included steps to evaluate if the plan is working and to get the family gQ3: The FGDM facilitator/coordinator did not have other jobs to do with the family besQ17: The plan was approved quickly.Q13: Paid professionals shared their knowledge but they did not tell the family group
Factor 2Q8: Different sides of the family participated in the conference (ex. Father & Mother siQ7: More family group than paid professionals participated in the conference.Q9: People at the conference were relatives and/or people who feel “like family” (ex. o
P=pattern.Bold items refer to factor loading of the item in the factor to which it was extracted at 40 o
professional's role now loaded on Factor One, with the same threeitems about who came to the conference remaining on Factor Two.Question 13 had a higher pattern coefficient (.41).
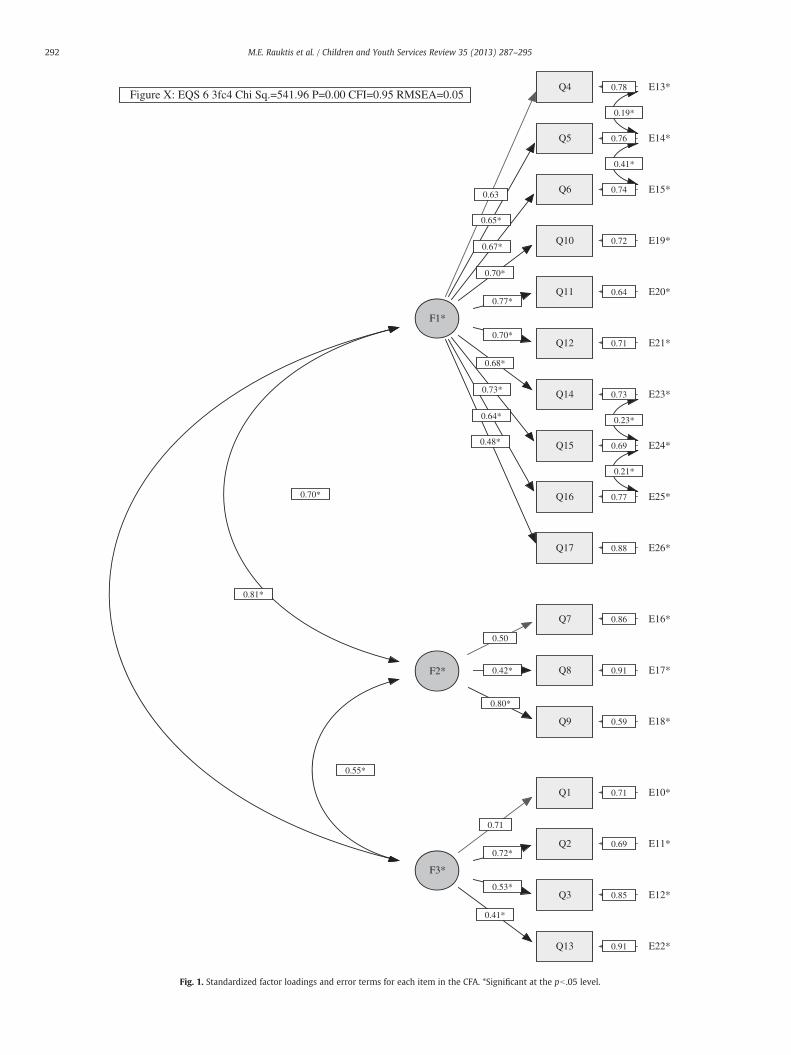
In order to ascertain whether the two or three factor solution was abetter fit to the data, a CFA was performed. Results of the CFA indicatedthat ten items loaded onto Factor One, three items loaded onto FactorTwo, and four items loaded onto Factor Three (Fig. 1; Table 4). Theseresults mirrored the results found under the three-factor solutionproduced by the EFA. The data were not multivariate normal, z=86.88, pb .001. As such, maximum likelihood with robust adjustments(Satorra & Bentler, 1988, 1994) was used.
There was a significant difference between the observed andmodeled covariance matrix, likely due to the large sample size:Satorra–Bentler χ2 (116, N=2728)=787.057, pb .001. The model fitwas poor; CFI=.898, RMSEA=.064. As such, according to LagrangeMultiplier Test, the model was modified by adding a correlated error
Factor 1 P Factor 2 P
food, right time of day). .765 − .072.755 − .065.739 − .123
. .735 − .188tion on what happens at a conference). .731 .087
.727 − .171what happens at a conference) .658 .104
.650 .258
.614 .241
.600 .242roup back together again if needed. .574 .218ide organizing and/or facilitating the group. .547 − .097
.462 .123how to solve the concerns. .414 .102
des of the family). − .052 .754.046 .699
ld friends, good neighbors). .392 .501
r greater.
E22*
Q4
Q5
Q6
Q10
Q11
Q12
Q14
Q15
Q16
Q17
F1*
E13*
E14*
E15*
E19*
E20*
E21*
E23*
E24*
E25*
E26*
Q7
Q8
Q9
F2*
E16*
E17*
E18*
Q1
Q2
Q3
Q13
F3*
E10*
E11*
E12*
Figure X: EQS 6 3fc4 Chi Sq.=541.96 P=0.00 CFI=0.95 RMSEA=0.05
0.63
0.78
0.65*
0.76
0.67*
0.74
0.70*
0.72
0.77*0.64
0.70*0.71
0.68*
0.730.73*
0.69
0.64*
0.77
0.48*
0.88
0.50
0.86
0.42* 0.91
0.80*
0.59
0.70*
0.71
0.71
0.72*0.69
0.53*0.85
0.41*
0.91
0.81*
0.55*
0.19*
0.41*
0.23*
0.21*
Fig. 1. Standardized factor loadings and error terms for each item in the CFA. *Significant at the pb .05 level.
292 M.E. Rauktis et al. / Children and Youth Services Review 35 (2013) 287–295
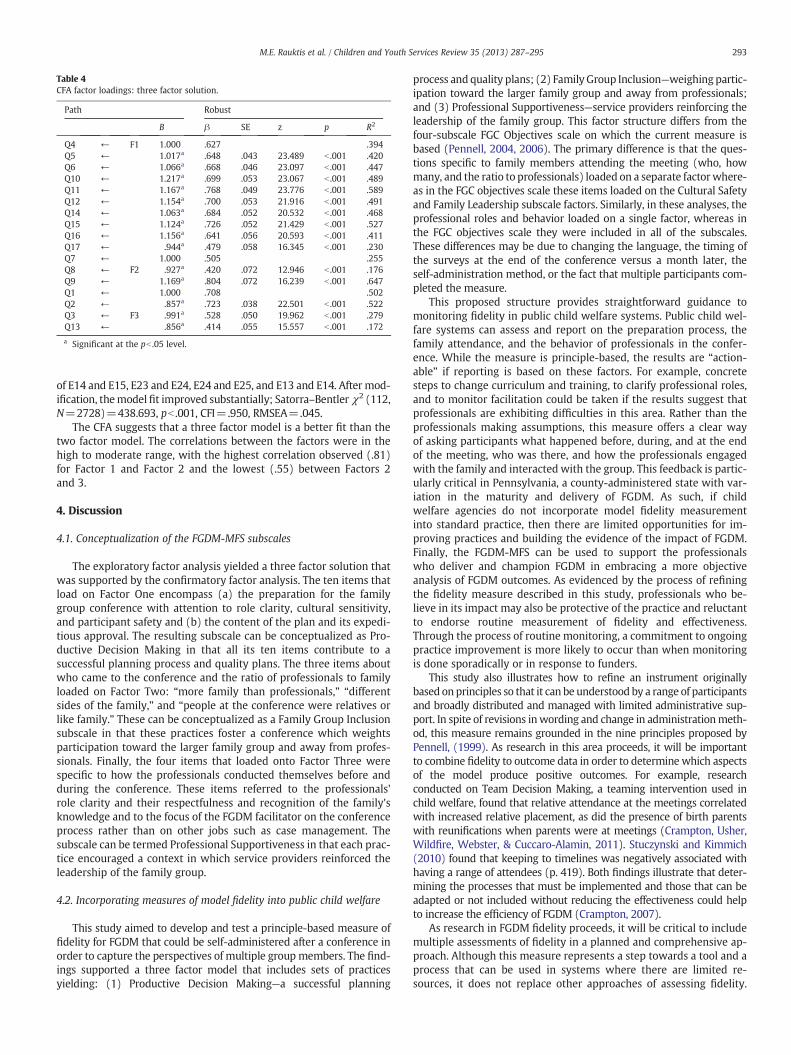
Table 4CFA factor loadings: three factor solution.
Path Robust
B β SE z p R2
Q4 ← F1 1.000 .627 .394Q5 ← 1.017a .648 .043 23.489 b .001 .420Q6 ← 1.066a .668 .046 23.097 b .001 .447Q10 ← 1.217a .699 .053 23.067 b .001 .489Q11 ← 1.167a .768 .049 23.776 b .001 .589Q12 ← 1.154a .700 .053 21.916 b .001 .491Q14 ← 1.063a .684 .052 20.532 b .001 .468Q15 ← 1.124a .726 .052 21.429 b .001 .527Q16 ← 1.156a .641 .056 20.593 b .001 .411Q17 ← .944a .479 .058 16.345 b .001 .230Q7 ← 1.000 .505 .255Q8 ← F2 .927a .420 .072 12.946 b .001 .176Q9 ← 1.169a .804 .072 16.239 b .001 .647Q1 ← 1.000 .708 .502Q2 ← .857a .723 .038 22.501 b .001 .522Q3 ← F3 .991a .528 .050 19.962 b .001 .279Q13 ← .856a .414 .055 15.557 b .001 .172
a Significant at the pb .05 level.
293M.E. Rauktis et al. / Children and Youth Services Review 35 (2013) 287–295
of E14 and E15, E23 and E24, E24 and E25, and E13 and E14. After mod-ification, themodel fit improved substantially; Satorra–Bentlerχ2 (112,N=2728)=438.693, pb .001, CFI=.950, RMSEA=.045.
The CFA suggests that a three factor model is a better fit than thetwo factor model. The correlations between the factors were in thehigh to moderate range, with the highest correlation observed (.81)for Factor 1 and Factor 2 and the lowest (.55) between Factors 2and 3.
4. Discussion
4.1. Conceptualization of the FGDM-MFS subscales
The exploratory factor analysis yielded a three factor solution thatwas supported by the confirmatory factor analysis. The ten items thatload on Factor One encompass (a) the preparation for the familygroup conference with attention to role clarity, cultural sensitivity,and participant safety and (b) the content of the plan and its expedi-tious approval. The resulting subscale can be conceptualized as Pro-ductive Decision Making in that all its ten items contribute to asuccessful planning process and quality plans. The three items aboutwho came to the conference and the ratio of professionals to familyloaded on Factor Two: “more family than professionals,” “differentsides of the family,” and “people at the conference were relatives orlike family.” These can be conceptualized as a Family Group Inclusionsubscale in that these practices foster a conference which weightsparticipation toward the larger family group and away from profes-sionals. Finally, the four items that loaded onto Factor Three werespecific to how the professionals conducted themselves before andduring the conference. These items referred to the professionals'role clarity and their respectfulness and recognition of the family'sknowledge and to the focus of the FGDM facilitator on the conferenceprocess rather than on other jobs such as case management. Thesubscale can be termed Professional Supportiveness in that each prac-tice encouraged a context in which service providers reinforced theleadership of the family group.
4.2. Incorporating measures of model fidelity into public child welfare
This study aimed to develop and test a principle-based measure offidelity for FGDM that could be self-administered after a conference inorder to capture the perspectives of multiple group members. The find-ings supported a three factor model that includes sets of practicesyielding: (1) Productive Decision Making—a successful planning
process and quality plans; (2) Family Group Inclusion—weighing partic-ipation toward the larger family group and away from professionals;and (3) Professional Supportiveness—service providers reinforcing theleadership of the family group. This factor structure differs from thefour-subscale FGC Objectives scale on which the current measure isbased (Pennell, 2004, 2006). The primary difference is that the ques-tions specific to family members attending the meeting (who, howmany, and the ratio to professionals) loaded on a separate factorwhere-as in the FGC objectives scale these items loaded on the Cultural Safetyand Family Leadership subscale factors. Similarly, in these analyses, theprofessional roles and behavior loaded on a single factor, whereas inthe FGC objectives scale they were included in all of the subscales.These differences may be due to changing the language, the timing ofthe surveys at the end of the conference versus a month later, theself-administration method, or the fact that multiple participants com-pleted the measure.
This proposed structure provides straightforward guidance tomonitoring fidelity in public child welfare systems. Public child wel-fare systems can assess and report on the preparation process, thefamily attendance, and the behavior of professionals in the confer-ence. While the measure is principle-based, the results are “action-able” if reporting is based on these factors. For example, concretesteps to change curriculum and training, to clarify professional roles,and to monitor facilitation could be taken if the results suggest thatprofessionals are exhibiting difficulties in this area. Rather than theprofessionals making assumptions, this measure offers a clear wayof asking participants what happened before, during, and at the endof the meeting, who was there, and how the professionals engagedwith the family and interacted with the group. This feedback is partic-ularly critical in Pennsylvania, a county-administered state with var-iation in the maturity and delivery of FGDM. As such, if childwelfare agencies do not incorporate model fidelity measurementinto standard practice, then there are limited opportunities for im-proving practices and building the evidence of the impact of FGDM.Finally, the FGDM-MFS can be used to support the professionalswho deliver and champion FGDM in embracing a more objectiveanalysis of FGDM outcomes. As evidenced by the process of refiningthe fidelity measure described in this study, professionals who be-lieve in its impact may also be protective of the practice and reluctantto endorse routine measurement of fidelity and effectiveness.Through the process of routine monitoring, a commitment to ongoingpractice improvement is more likely to occur than when monitoringis done sporadically or in response to funders.
This study also illustrates how to refine an instrument originallybased onprinciples so that it can be understood by a range of participantsand broadly distributed and managed with limited administrative sup-port. In spite of revisions inwording and change in administrationmeth-od, this measure remains grounded in the nine principles proposed byPennell, (1999). As research in this area proceeds, it will be importantto combine fidelity to outcome data in order to determine which aspectsof the model produce positive outcomes. For example, researchconducted on Team Decision Making, a teaming intervention used inchild welfare, found that relative attendance at the meetings correlatedwith increased relative placement, as did the presence of birth parentswith reunifications when parents were at meetings (Crampton, Usher,Wildfire, Webster, & Cuccaro-Alamin, 2011). Stuczynski and Kimmich(2010) found that keeping to timelines was negatively associated withhaving a range of attendees (p. 419). Both findings illustrate that deter-mining the processes that must be implemented and those that can beadapted or not included without reducing the effectiveness could helpto increase the efficiency of FGDM (Crampton, 2007).
As research in FGDM fidelity proceeds, it will be critical to includemultiple assessments of fidelity in a planned and comprehensive ap-proach. Although this measure represents a step towards a tool and aprocess that can be used in systems where there are limited re-sources, it does not replace other approaches of assessing fidelity.
294 M.E. Rauktis et al. / Children and Youth Services Review 35 (2013) 287–295
No one measure or method will give a comprehensive picture. Com-bining this measure with purposively selected record reviews, personalinterviews, and observation of groups would provide a more completeunderstanding of how FGDM is being implemented and whether it re-sults in positive changes in safety, permanence andwell-being. Qualita-tive data would help to explain the reasons for the level of agreementand divergences among youth, families, and professionals and betweenindividuals of different races (Rauktis et al., 2011a). The FGDM-MFS en-compasses the preparations and conference itself but not thepost-meeting work of carrying out the plan or revising it in responseto changing circumstances. Reviewing records and talkingwith familieswould help determine if the plan is being carried out.
The results and implications must be considered in the context ofthe following limitations. One is that this is a self-administered in-strument completed right at the end of the conference when partici-pants lack the time to reflect on the process. Limitations in the sampleare also present. Participation in the survey was voluntary, and it ispossible that some individuals opted to not participate. Missing datawere a problem; more troublesome, however, was the response setand the non-normality of the distribution. Although this was man-aged in the analyses, it begs the question of whether to reverseword items so that respondents may be less likely to endorse thesame rating for all items. On the other hand, doing this would in-crease the difficulty for individuals who have limited literacy skills,creating the potential for error.
Despite these limitations, the results from this study provide valu-able guidance to practitioners and policymakers about the importanceof attending to multiple perspectives in assessing program delivery.The experience in Pennsylvania supports the feasibility of incorporatingmodel fidelitymeasurement into standard practice and lays the founda-tion for building the evidence on the impact of FGDMfor diverse groups.
Acknowledgments
This research was funded by the Pennsylvania Office of ChildrenYouth and Families, and the University of Pittsburgh, School of SocialWork, Child Welfare Resource Center. The authors wish to acknowl-edge the following individuals for their assistance in this study andin preparing themanuscript: Helen Cahalane, Ph.D., Andrea Richardson,Susan Antonacci, Shauna Reinhart, Ilsung Nam, Ph.D., Katie Greeno,Ph.D., Gary Koeske, Ph.D., and Julia Scanlon.
References
American Humane Association, & FGDM Guidelines Committee (2010). Guidelines forfamily group decision making in child welfare. Englewood, CO: Author. (Retrievedfrom http://www.americanhumane.org/assets/pdfs/children/fgdm/guidelines.pdf)
Barth, R. P. (2002). In Gail Buford, & Joe Hudson (Eds.), Family group conferencing: Newdirections in community-centered child and family practice. Journal of Sociology &Social Welfare, 29(3). (pp. 199–201).
Bell, M., & Wilson, K. (2006). Children's views of family group conferences. British Journalof Social Work, 36(4), 671–681.
Bentler, P. M. (1990). Comparative fit indexes in structural models. Psychological Bulletin,107(2), 238–246.
Berzin, S. C. (2006). Using sibling data to understand the impact of family groupdecision-making on child welfare outcomes. Children and Youth Services Review,28(12), 1449–1458.
Berzin, S. C., Thomas, K. L., & Cohen, E. (2007). Assessing model fidelity in two familygroup decision-making programs: Is this child welfare intervention beingimplemented as intended? Journal of Social Service Research, 34(2), 55–71.
Breitenstein, S. M., Gross, D., Garvey, C. A., Hill, C., Fogg, L., & Resnick, B. (2010). Imple-mentation fidelity in community-based interventions. Research in Nursing andHealth, 33(2), 164–173.
Bruns, E. J., Burchard, J. D., Suter, J. C., Leverentz-Brady, K., & Force, M. M. (2004).Assessing fidelity to a community-based treatment for youth: The WraparoundFidelity Index. Journal of Emotional and Behavioral Disorders, 12(2), 79–89.
Bruns, E. J., Suter, J. C., Force, M. M., & Burchard, J. D. (2005). Adherence to wraparoundprinciples and association with outcomes. Journal of Child and Family Studies, 14(4),521–534.
Burford, G., Connolly, M., Morris, K., & Pennell, J. (2010). Annotated bibliography on engag-ing the family group in childwelfare decisionmaking. (2010/original 2009). Englewood,CO: American Humane Association. (Available at: http://www.americanhumane.org/
children/professional-resources/program-publications/family-group-decision-making/bibliographies.html)
Burford, G., Pennell, J., & Edwards, M. (2011). Family team meetings as principled ad-vocacy. Journal of Public Child Welfare, 5(2–3), 318–344.
Cattell, R. B. (1966). The scree test for the number of factors. Multivariate BehavioralResearch, 1(2), 245–276.
Century, J., Rudnick, M., & Freeman, C. (2010). A framework for measuring fidelity ofimplementation: A foundation for shared language and accumulation of knowl-edge. American Journal of Evaluation, 31(2), 199–218.
Crampton, D. S. (2007). Research review: Family group decision-making: a promisingpractice in need of more programme theory and research. Child & Family SocialWork, 12(2), 202–209.
Crampton, D. S., & Jackson, W. L. (2007). Family group decision making anddisproportionality in foster care: A case study. Child Welfare, 86(3), 51–69.
Crampton, D. S., Usher, G. L., Wildfire, J. B., Webster, D., & Cuccaro-Alamin, S. (2011).Does community and family engagement enhance permanency for children infoster care? Findings from an evaluation of the family-to-family initiative. ChildWelfare, 90(4), 61–78.
Crea, T.M., & Berzin, S. C. (2009). Family involvement in childwelfare decision-making: Stra-tegies and research on inclusive practices. Journal of Public ChildWelfare, 3(3), 305–327.
Crea, T. M., Crampton, D. S., Abramson-Madden, A., & Usher, C. L. (2008). Variability in theimplementation of teamdecisionmaking (TDM): scope and compliancewith the fam-ily to family practice model. Children and Youth Services Review, 30(11), 1221–1232.
Fixsen, D. L., Naoom, S. F., Blasé, K. A., Friedman, R. M., & Wallace, F. (2005). Implemen-tation research: A synthesis of the literature. The National Implementation ResearchNetwork (FMHI Publication #231). Tampa, FL: University of South Florida, Louis dela Parte Florida Mental Health Institute.
Hall, G. E., & Hord, S. M. (1987). Change in schools: Facilitating the process. Albany, NY:State University of New York Press.
Hassall, I. (1996). Origin and development of family group conferences. In J. Hudson, A.Morris, G. Maxwell, & B. Galaway (Eds.), Family group conferences: Perspectives onpolicy and practice (pp. 17–36). Monsey, NY: Willow Tree Press.
Hayes, S. C. (1998). President's message: Dissemination research now. The BehaviorTherapist, 21(9), 166–169.
Henggeler, S. W., Borduin, C. M., Schoenwald, S. K., Huey, S. J., & Chapman, J. E. (2006).Multisystemic Therapy Adherence Scale—Revised (TAM-R). Unpublished instru-ment. Charleston: Department of Psychiatry and Behavioral Sciences, MedicalUniversity of South Carolina.
Henggeler, S. W., Melton, G. B., Brondino, M. J., Scherer, D. G., & Hanley, J. H. (1997).Multisystemic therapy with violent and chronic juvenile offenders and their families:The role of treatment fidelity in successful dissemination. Journal of Consulting andClinical Psychology, 65(5), 821–833.
Henggeler, S. W., Schoenwald, S. K., Borduin, C. M., Rowland, M. D., & Cunningham, P. B.(1998). Multisystemic treatment of antisocial behavior in children and adolescents.New York: Guilford.
Kaye, S., & Osteen, P. J. (2011). Developing and validating measures for child welfareagencies to self-monitor fidelity to a child safety intervention. Children and YouthServices Review, 33(11), 2146–2151.
McHugo, G. J., Drake, R. E., Teague, G. B., & Xie, H. Y. (1999). Fidelity to assertive com-munity treatment and client outcomes in the New Hampshire dual disordersstudy. Psychiatric Services, 50(6), 818–824.
Merkel-Holguin, L., & Wilmot, L. (2005). Analyzing family involvement approaches. InJ. Pennell, & G. Anderson (Eds.), Widening the circle: The practice and evaluation offamily group conferencing with children, youths, and their families (pp. 183–201).Washington, DC: NASW Press.
Mowbray, C. T., Holter, M. C., Teague, G. B., & Bybee, D. (2003). Fidelity criteria: Develop-ment, measurement, and validation. American Journal of Evaluation, 24(3), 315–340.
Pennell, J. (2003a). Achievement of objectives, pre and during conference. Raleigh, NC:North Carolina State University, Department of Social Work.
Pennell, J. (2003b). Are we following key FGC practices? Views of conference partici-pants. Protecting Children, 18(1 & 2), 16–21.
Pennell, J. (2004). Family group conferencing in child welfare: Responsive and regula-tory interfaces. Journal of Sociology & Social Welfare, 31(1), 117–135.
Pennell, J. (2005). Checking for model fidelity. In J. Pennell, & G. Anderson (Eds.),Widening the circle: The practice and evaluation of family group conferencing withchildren, youths, and their families (pp. 107–121). Washington, DC: NASW Press.
Pennell, J. (2006). Stopping domestic violence or protecting children? Contributionsfrom restorative justice. In D. Sullivan, & L. Tifft (Eds.), Handbook of restorativejustice: A global perspective (pp. 286–298). New York: Routledge.
Pennell, J. (2009). Widening the circle: Countering institutional racism in child welfare.In S. Strega, S. A. Esquao, & J. Carrière (Eds.),Walking this path together: Anti-racist andanti-oppressive child welfare practice (pp. 78–95). Halifax, Nova Scotia, & Winnipeg,Manitoba: Fernwood.
Pennell, J., & Anderson, G. (Eds.). (2005). Widening the circle: The practice andevaluation of family group conferencing with children, youths, and their families.Washington, DC: NASW Press.
Pennell, J., & Burford, G. (1995). Family group decision making: New roles for ‘old’ part-ners in resolving family violence: Implementation Report (Vols. I–II). St. John's, NF:Memorial University of Newfoundland, School of Social Work.
Pennell, J., & Burford, G. (2000). Family group decision making: Protecting children andwomen. Child Welfare, 79(2), 131–158.
Pennell, J., Burford, G., Connolly, M., & Morris, K. (2011). Introduction: Taking child andfamily rights seriously: Family engagement and its evidence in child welfare. ChildWelfare, 90(4), 9–18.
Pennell, J., Edwards, M., & Burford, G. (2010). Expedited family group engagement andchild permanency. Children and Youth Services Review, 32, 1012–1019.
295M.E. Rauktis et al. / Children and Youth Services Review 35 (2013) 287–295
Pennell, J. (with the assistance of Hardison, J., & Yerkes, E.). (1999). North Carolina FamilyGroup Conferencing Project: Building partnerships with and around families: Report tothe North Carolina Division of Social Services, Fiscal year 1998-1999. Raleigh: North Car-olina State University, Social Work Program, North Carolina Family Group Conferenc-ing Project.
Proctor, E., Silmere, H., Raghavan, R., Hovmand, P., Aarons, G., Bunger, A., et al. (2011).Outcomes for implementation research: Conceptual distinctions, measurementchallenges, and research agenda. Administration and Policy in Mental Health andMental Health Services Research, 38(2), 65–76.
Rangihau, J. (1986). Puao-te-Ata-tu (Daybreak): Report of the Ministerial Advisory Com-mittee on a Maori perspective for the Department of Social Welfare. Wellington, NewZealand: Department of Social Welfare, Government Printing Office.
Rast, J., Peterson, C., Earnest, L., & Mears, S. L. (2003). Service process as a determinantof treatment effect: The importance of fidelity. Paper presented at the 16th AnnualResearch Conference Proceedings, a System of Care for Children's Mental Health:Expanding the Research Base, Tampa, FL.
Rauktis, M. E. (2008). Family group decision making: A profile of practices in Pennsylvania2008. University of Pittsburgh, Child Welfare Training Program. Retrieved August22, 2012 from http://www.pacwcbt.pitt.edu/organizational%20effectiveness/fgdm%20evaluation%20pdfs/final%20report%20-%20fgdm%20survey.pdf
Rauktis, M. E., Huefner, J., & Cahalane, H. (2011a). Perceptions of fidelity to familygroup decision-making principles: Examining the impact of race, gender, and rela-tionship. Child Welfare, 90(4), 41–59.
Rauktis, M. E., Pennell, J., Burford, G., Crampton, D., & Merkel-Holguin, L. (2012). Mea-suring fidelity of various family engagement approaches: Past, present, future.Paper presented at the 2012 American Humane Association Family Engagement Con-ference, Orlando, FL.
Rauktis, M. E., Pennell, J., & Reinhart, S. (2011b). Evaluation of family group decisionmaking: Strengthening practice through measuring and monitoring fidelity.Paper presented at the National Child Welfare Evaluation Summit, Washington, DC.
Rotabi, K. S., Pennell, J., Roby, J. L., & Bunkers, K. M. (2012). Family group conferencing as aculturally adaptable intervention: Reforming intercountry adoption inGuatemala. Inter-national Social Work, 55(3), 402–416. http://dx.doi.org/10.1177/0020872812437229.
Satorra, A., & Bentler, P. M. (1988). Scaling corrections for chi-square statistics andcovariance structure analysis. ASA 1988 Proceedings of the Business and EconomicStatistics Section (pp. 308–313). Alexandria, VA: American Statistical Association.
Satorra, A., & Bentler, P. M. (1994). Corrections to test statistics and standard errors incovariance structure analysis. In A. von Eye, & C. C. Clogg (Eds.), Latent variablesanalysis: Applications for developmental research (pp. 399–419). Thousand Oaks,CA: Sage.
Schoenwald, S. K., Garland, A. F., Chapman, J. E., Frazier, S. L., Sheidow, A. J., &Southam-Gerow, M. A. (2011). Toward the effective and efficient measurementof implementation fidelity. Administration and Policy in Mental Health and MentalHealth Services Research, 38(1), 32–43.
Schoenwald, S. K., Henggeler, S. W., Brondino, M. J., & Rowland, M. D. (2000).Multisystemic therapy: Monitoring treatment fidelity. Family Process, 39(1),83–103.
Sheets, J., Wittenstrom, K., Fong, R., James, J., Tecci, M., Baumann, D. J., et al. (2009).Evidence-based practice in family group decision-making for Anglo, African Americanand Hispanic families. Children and Youth Services Review, 31(11), 1187–1191.
Shlonsky, A., Schumaker, K., Cook, C., Crampton, D., Saini, M., Backe-Hansen, E., et al.(2009). Family group decision making for children at risk of abuse and neglect.Cochrane Database of Systematic Reviews, 3(1–33).
Sieppert, J. D., Hudson, J., & Unrau, Y. (2000). Family group conferencing in childwelfare: Lessons from a demonstration project. Families in Society: The Journal ofContemporary Human Services, 81(4), 382–391.
Stevens, J. (1996). Applied multivariate statistics for social sciences. Mahwah, NJ: LawrenceErlbaum Associates.
Stuczynski, A., & Kimmich, M. H. (2010). Challenges in measuring the fidelity of a childwelfare service intervention. Journal of Public Child Welfare, 4(4), 406–426(Article).
Sundell, K., & Vinnerljung, B. (2004). Outcomes of family group conferencing in Sweden: A3-year follow-up. Child Abuse & Neglect, 28(3), 267–287.
Teague, G. B., Bond, G. R., & Drake, R. E. (1998). Program fidelity in assertive communitytreatment: Development and use of a measure. The American Journal of Orthopsy-chiatry, 68(2), 216–232.
United Nations, General Assembly (September 13). Declaration on the rights of indig-enous peoples. Geneva, Switzerland: 107th Plenary Meeting. Retrieved June 30,2009, from http://www.un.org/esa/socdev/unpfii/documents/DRIPS_en.pdf
Convention on the rights of the child. Retrieved September 29, 2012. http://www2.ohchr.org/english/law/pdf/crc.pdf. (1989).
Vesneski, W., & Kemp, S. P. (2000). Family group conferencing in Washington State. InG. Burford, & J. Hudson (Eds.), Family group conferences: Perspectives on policy, prac-tice, and research (pp. 312–323). New York: Aldine de Gruyter.
Weigensberg, E. C., Barth, R. P., & Guo, S. (2009). Family group decision making: A pro-pensity score analysis to evaluate child and family services at baseline and after36-months. Children and Youth Services Review, 31(3), 383–390.


![MEASURING WELFARE CHANGE 1. - Economics · MEASURING WELFARE CHANGE 1. INTRODUCTION Welfareeconomicsisfirstandforemostapolicyscience. Inhisclassictreatise,A.K. Sen[30]says”Welfare](https://img.dokumen.tips/doc/110x75/5af3eb5c7f8b9a5b1e8bcf3a/measuring-welfare-change-1-welfare-change-1-introduction-welfareeconomicsisrstandforemostapolicyscience.jpg)