Embed Size (px)
Citation preview

©2009 IACPM1
Fall General Meeting
November 9-10, 2010
New York, NY
Assessing Sovereign Risk from the Bottom-Up
Edward I. Altman
New York University Stern School of Business
Director, Credit & Debt markets Research Program

www.riskmetrics.com 2
Measuring and Assessing Sovereign Risk
Some Recent Sovereign Crises
Asia – 1997
Argentina – 2000
Europe – 2010
Traditional Indicators of Risk
Macroeconomic Related Variables
Traditional Models
Statistical and Aggregative Techniques
Newer Market Based Techniques and Measures
Contingent Claims Structural Approach
Credit Default Swaps (CDS) Implied Probability of Defaults (PDs)
Corporate Statistical PD Measures to Assess Sovereign Health
The Z-Metrics Approach
A Bottom-Up analysis
(Outline for Discussion)

www.riskmetrics.com 3
Total filings and liabilities of companies filing for Chapter 11 Protection in the US: 1989-2010 (3Q)
Source: NYU Salomon Center Bankruptcy Filings Database
$0
$100
$200
$300
$400
$500
$600
$700
$800
89 90 91 92 93 94 95 96 97 98 99 00 01 02 03 04 05 06 07 08 (Excl. LEH
)
08 (Incl. LEH
)
09 10 (3Q)
$ B
illi
on
0
40
80
120
160
200
240
280
Pre- Petition Liabilities, in $ billions (left axis)
Number of Filings (right axis)
2009
234 filings and
liabilities of
$604.0 billion
2010 (3Q)
87 filings and
liabilities of $37.8
billion

www.riskmetrics.com 4
QUARTERLY DEFAULT RATE AND FOUR QUARTER MOVING AVERAGE
1989 – 2010 (3Q)
Source: Author’s Compilations
Default rates on high-yield bonds 1989-2010 (3Q)
0.0%
1.0%
2.0%
3.0%
4.0%
5.0%
6.0%
1989199019911992199319941995199619971998199920002001200220032004200520062007200820092010 (3Q
)
Qu
art
erly
Def
au
lt R
ate
0.0%
2.0%
4.0%
6.0%
8.0%
10.0%
12.0%
14.0%
16.0%
4 -
Qu
art
er M
ovin
g A
ver
age
Quarterly
Moving

www.riskmetrics.com 5
555
Par Value Par Value Default
Year Outstanding* Defaults Rates (%)
2009 $1,152,952 $124,130 10.766
2008 $1,091,000 $50,763 4.653
2007 $1,075,400 $5,473 0.509
2006 $993,600 $7,559 0.761
2005 $1,073,000 $36,181 3.372
2004 $933,100 $11,657 1.249
2003 $825,000 $38,451 4.661
2002 $757,000 $96,855 12.795
2001 $649,000 $63,609 9.801
2000 $597,200 $30,295 5.073
1999 $567,400 $23,532 4.147
1998 $465,500 $7,464 1.603
1997 $335,400 $4,200 1.252
1996 $271,000 $3,336 1.231
1995 $240,000 $4,551 1.896
1994 $235,000 $3,418 1.454
1993 $206,907 $2,287 1.105
1992 $163,000 $5,545 3.402
1991 $183,600 $18,862 10.273
1990 $181,000 $18,354 10.140
1989 $189,258 $8,110 4.285
1988 $148,187 $3,944 2.662
1987 $129,557 $7,486 5.778
1986 $90,243 $3,156 3.497
1985 $58,088 $992 1.708
2010 (3Q) $1,221,569 $8,166 0.668%
Straight Bonds Only Excluding Defaulted Issues From Par Value Outstanding, (US$ millions)
1971 – 2010 (3Q)
Historical Default Rates
Par Value Par Value Default
Year Outstandinga Defaults Rates (%)
1984 $40,939 $344 0.840
1983 $27,492 $301 1.095
1982 $18,109 $577 3.186
1981 $17,115 $27 0.158
1980 $14,935 $224 1.500
1979 $10,356 $20 0.193
1978 $8,946 $119 1.330
1977 $8,157 $381 4.671
1976 $7,735 $30 0.388
1975 $7,471 $204 2.731
1974 $10,894 $123 1.129
1973 $7,824 $49 0.626
1972 $6,928 $193 2.786
1971 $6,602 $82 1.242Standard
Deviation (%)
Arithmetic Average Default Rate
1971 to 2009 3.332% 3.226%
1978 to 2009 3.637% 3.424%
1985 to 2009 4.323% 3.550%
Weighted Average Default Rate*
1971 to 2009 4.552%
1978 to 2009 4.564%
1985 to 2009 4.601%
Median Annual Default Rate
1971 to 2009 1.896%
Source: Author’s compilation and Citigroup estimate
* Weighted by par value of amount outstanding for each year.
www.riskmetrics.com 6
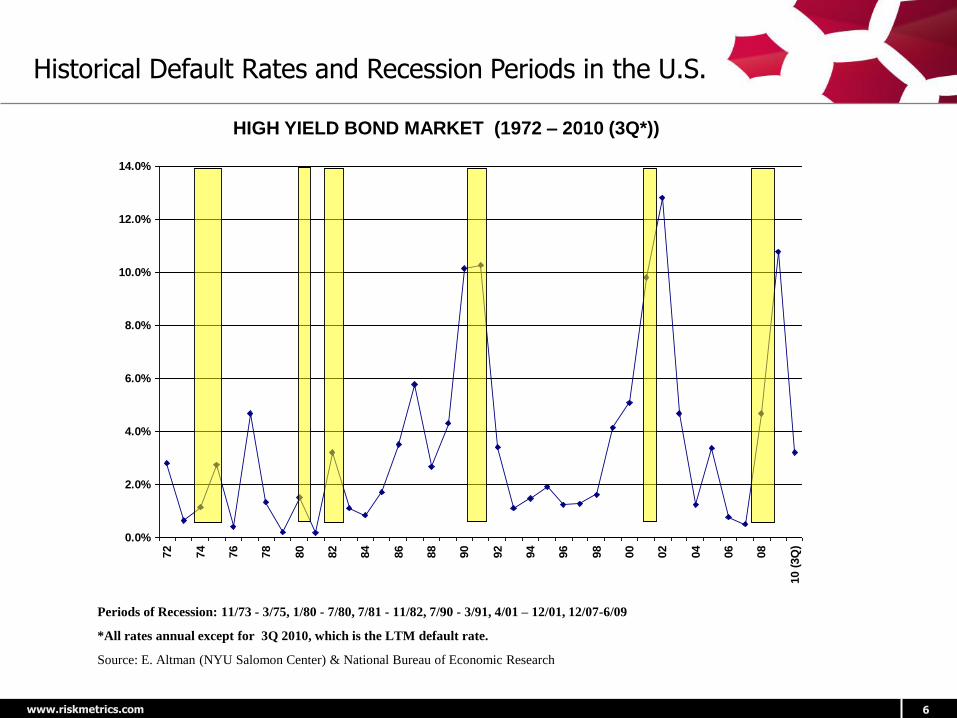
Periods of Recession: 11/73 - 3/75, 1/80 - 7/80, 7/81 - 11/82, 7/90 - 3/91, 4/01 – 12/01, 12/07-6/09
*All rates annual except for 3Q 2010, which is the LTM default rate.
Source: E. Altman (NYU Salomon Center) & National Bureau of Economic Research
HIGH YIELD BOND MARKET (1972 – 2010 (3Q*))
Historical Default Rates and Recession Periods in the U.S.
0.0%
2.0%
4.0%
6.0%
8.0%
10.0%
12.0%
14.0%72
74
76
78
80
82
84
86
88
90
92
94
96
98
00
02
04
06
08
10 (
3Q
)
www.riskmetrics.com 7
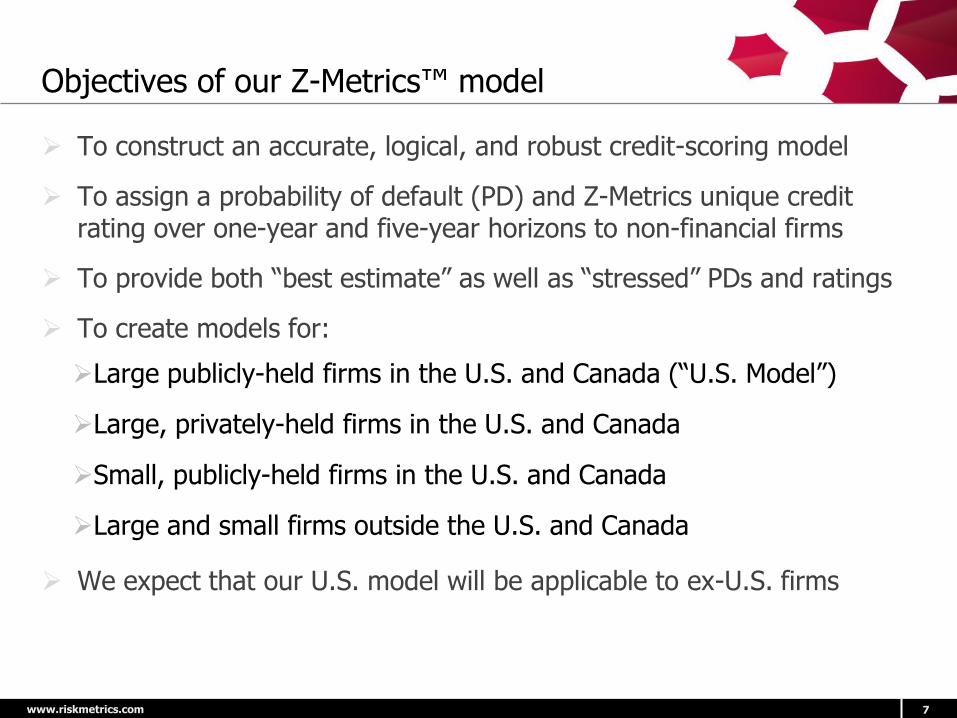
Objectives of our Z-Metrics™ model
To construct an accurate, logical, and robust credit-scoring model
To assign a probability of default (PD) and Z-Metrics unique credit rating over one-year and five-year horizons to non-financial firms
To provide both ―best estimate‖ as well as ―stressed‖ PDs and ratings
To create models for:
Large publicly-held firms in the U.S. and Canada (―U.S. Model‖)
Large, privately-held firms in the U.S. and Canada
Small, publicly-held firms in the U.S. and Canada
Large and small firms outside the U.S. and Canada
We expect that our U.S. model will be applicable to ex-U.S. firms

www.riskmetrics.com 8
Model characteristics
Based on over 1,000 U.S./Canadian defaulted (credit-event) non-financial firms and a control sample (~15:1) of non-defaulting observations
Credit-event date is default or bankruptcy date—whichever occurs first
Credit-event sample reduced to 638 firms in public firm sample and 802 in private firm sample after removing those with insufficient data
Sample period 1989-2008, out-of-sample tests based on two 10-year samples and 2009 credit-event firms

www.riskmetrics.com 9
Model characteristics (continued)
Over 260,000 quarterly & annual observations used to construct model
Macroeconomic factors included to capture time-series variation of default probabilities
For stressed ratings and PDs, two critical measures are examined: Share price and earnings
Final public model has 12 fundamental and market variables, including both static and trend measures plus two macroeconomic variables

www.riskmetrics.com 10
Variables assessed
Over 50 fundamental financial statement variables covering such performance characteristics as solvency, leverage, size, profitability, interest coverage, liquidity, asset quality, investment, dividend payout, and financing results
Analyzed trends in many of the fundamental variables
Included equity market price and return variables and their relative volatility patterns: typically used in structural, distance-to-default measures
Examined distribution of variable values: transformed variables to capture nature of distribution and to reduce influence of outliers
Supplemented fundamentals and market data with macroeconomic measures to adjust for macro stresses on the world’s economies

www.riskmetrics.com 11
Illustration of variable distribution
Credit-event rate as a function of Interest/EBIT for one and five year horizons(two sample periods)
credit-event (default/bankruptcy) rate
1 year horizon
0%
3%
6%
9%
12%
-4 -2 0 2 4 6
Interest/EBIT
cre
dit-e
vent
rate
1980 - 1999
2000 - 2008
credit-event (default/bankruptcy) rate
5 year horizon
0%
20%
40%
60%
-4 -2 0 2 4 6
Interest/EBIT
cre
dit-e
vent
rate
1980 - 1999
2000 - 2008

www.riskmetrics.com 12
Impact of log transformations on the distribution of credit-event rates for the variable RE/TA
one year
horizon
0%
2%
4%
6%
8%
10%
-3 -2 -1 0 1
RE/TA
cre
dit-e
vent
rate
one year
horizon
0%
2%
4%
6%
8%
10%
-1.5 -1 -0.5 0 0.5 1 1.5
-1*(ln(1 - RE/TA)
cre
dit-e
vent
rate
No transformation Log transformation

www.riskmetrics.com 13
Criteria for Variable Selection and Performance Assessment
Accuracy ratios (error rates) for credit-event prediction
Type I (Correct default prediction)
Type II (Correct non-default prediction)
Comparison of accuracy ratios to existing systems
Rating agencies, Altman’s Z-Score models
Comparison of accuracy ratios in-sample and out-of-sample
Comparison of implied Z-Metrics ratings with observed Agency ratings
Discriminatory power of model across full spectrum of ratings
One-year and five-year prediction horizons
Stability of explanatory power and parameters over time and across sectors
Macro variables that reflect timely changes in stress for firm credit-worthiness over time
Stress testing

www.riskmetrics.com 14
Case 1: Default Rate[t+1] Versus Yield Spread[t]
The regression equation is
Default Rate = - 3.25 + 1.39 * Spread
Predictor Coef SE Coef T P
Constant -3.2490 0.9072 -3.58 0.001
Spread 1.3904 0.1741 7.99 0.000
S = 1.86079 R-Sq = 69.5% R-Sq(adj) = 68.4%
Application
Applying Yield spread (12/31/2008) of 1,731 bps, PD = -3.25 + 1.39*17.31 = 20.811%
Applying Yield spread (12/31/2009) of 513 bps, PD = -3.25 + 1.39*5.13 = 3.883%
Applying Yield spread (6/30/2010) of 622 bps, PD = -3.25 + 1.39*6.22 = 5.398%
Dollar Denominated (Altman) Default Rate Predictions

www.riskmetrics.com 15
Logit model estimation
Standard logit regression functional form
CSi,t = α + ΣβXi,t + εi,t
CSi,t = Z-Metrics credit score of company i at time t
β = variable parameters (or weights)
Xi,t = set of fundamental, market based and macroeconomic variables for firm/quarter observations
εi,t = error terms (assumed to be identically and independently distributed)
CSi,t is transformed into a probability of default by
tiCStie
PD,1
1,

www.riskmetrics.com 16
Type I and Type II error rates for Agency ratings, Z-Metrics and Z’’-score Agency Equivalent (AE) ratings (1989-2008): One year prediction horizon for public firms
type I error rate (defaulters classified as non-defaulters / total defaulters)
0
0.2
0.4
0.6
0.8
1
CCC/C
C/C B
- B B+
BB-
BB
BB+
BBB-
rating class
(cutoff score = score at upper boundary of rating class N)
typ
e I e
rro
r ra
te
AE rating: Z" score
Agency rating
AE rating: Z-Metrics public one year
type II error rate
(non defaulters classified as defaulters/total non defaulters)
0
0.2
0.4
0.6
0.8
1
CCC/C
C/C B
- B B+
BB-
BB
BB+
BBB
-BBB
BBB
+ A- A A
+AA-
AA
AA/A
AA
rating class N
(cutoff score = score at upper boundary of rating class N)
typ
e II e
rro
r ra
teAE rating: Z" score
Agency rating
AE rating: Z-Metrics public one year

www.riskmetrics.com 17
Definition of Z-Metrics ratings for one and five-year horizon Public Models
% Representation % Representation
Rating Min Max 1989/2008 2008 Min Max 1989/2008 2008
High Grade ZA+ 0.00% 0.02% 3.50% 2.10% 0.00% 0.75% 3.40% 2.40%
ZA 0.02% 0.04% 5.80% 4.60% 0.75% 1.25% 7.00% 5.40%
ZA- 0.04% 0.06% 7.60% 6.10% 1.25% 1.75% 7.60% 6.40%
ZB+ 0.06% 0.09% 10.60% 10.00% 1.75% 2.50% 10.60% 9.90%
ZB 0.09% 0.14% 10.90% 11.20% 2.50% 3.50% 11.10% 11.30%
ZB- 0.14% 0.20% 8.80% 9.10% 3.50% 4.50% 8.10% 8.60%
Medium Grade ZC+ 0.20% 0.30% 9.40% 10.80% 4.50% 6.00% 8.60% 9.70%
ZC 0.30% 0.50% 10.10% 10.40% 6.00% 9.00% 11.10% 12.10%
ZC- 0.50% 1.00% 10.60% 11.40% 9.00% 14.00% 10.00% 10.30%
Low Grade ZD+ 1% 2% 7.60% 8.20% 14% 20% 6.30% 6.80%
ZD 2% 4% 5.20% 5.80% 20% 30% 6.00% 6.60%
ZD- 4% 10% 4.50% 4.70% 30% 45% 4.50% 4.90%
ZF+ 10% 25% 2.60% 2.60% 45% 65% 3.00% 3.20%
ZF 25% 50% 1.50% 1.60% 65% 80% 1.40% 1.60%
ZF- 50% 100% 1.20% 1.30% 80% 100% 1.00% 1.00%
Z-Metrics One-Year Public Model Z-Metrics Five-Year Public Model
One Year PD Five Year PD

www.riskmetrics.com 18
Default prediction examples for 2009 defaults,comparing Agency and Z-Score ratings to Z-Metrics ratings
Company Accuride General Motors Spectrum Brands
Time to Default (Months) 11 10 12
Agency rating 4 2 1
1Y Public Z-Metrics AE Rating 2 1 2
Z Score AE Rating 5 1 3
Z" score AE Rating 5 1 4
1Y Public Z-Metrics PD Values 29.80% 31.60% 14.10%
5Y Public Z-Metrics PD Values 66.80% 67.30% 47.10%
1Y Public Z-Metrics Ratings ZF ZF ZF+
5Y Public Z-Metrics Ratings ZF ZF ZF+
AE Ratings, where 1 = CCC, 2 = B-, …, 16 = AAA/AA+

www.riskmetrics.com 19
Defaulted firms’ rating comparison (Z-Metrics, Z score, Agency rating) – In sample test
Performance of Z-Metrics compared to rating agencies
Public Private Public Private Z Score Z'' Score
Average 0.62 0.05 0.6 0.15 -0.9 -0.81
Minimum 8 9 7 9 9 9
Maximum -7 -11 -5 -9 -12 -11
51% 40% 51% 40% 34% 31%
24% 34% 24% 30% 50% 50%
25% 26% 26% 30% 17% 19%
402 535 402 535 451 451
(Agency rating - AE rating) For In-Sample Period
In Sample: Issuers Defaulted 1989-2008 Z-Metrics 1Y Z-Metrics 5Y Z Score
[Agency rating] minus [AE rating]
% Firms with higher Agency rating
% Firms with lower Agency rating
% Firms with equal rating
Total number of firms

www.riskmetrics.com 20
Defaulted firms’ rating comparison (Z-Metrics, Z score, Agency rating) – Out of sample test
Performance of Z-Metrics compared to rating agencies
Out of Sample: Issuers Defaulted in 2009
Public Private Public Private Z Score Z'' Score
Average 0.5 -0.14 0.47 0.03 -1.31 -0.62
Minimum 3 2 2 3 4 3
Maximum -3 -5 -2 -2 -7 -4
50% 31% 50% 28% 17% 28%
19% 31% 16% 33% 66% 52%
31% 39% 34% 39% 17% 21%
32 36 32 36 29 29
(Agency rating - AE rating) For Out-Of-Sample Period
% Firms with equal rating
Total number of firms
Z-Metrics 1Y Z-Metrics 5Y Z Score
[Agency rating] minus [AE rating]
% Firms with higher Agency rating
% Firms with lower Agency rating

www.riskmetrics.com 21
Financial Health of the Private, Non-Financial Sector: Selected European Countries and U.S.A. in 2010/2009
(Z-Metrics PD Estimates and Implied PDs from CDS Spreads)
Z-Metrics PD Estimates: Five-Year Public Model* No. of Listed Five-Year Implied PD
Companies 2010 2009 2010 2009 from CDS Spread **† Country 2010 2009 Median PD Median PD Std. Dev. Std. Dev. 2010 2009
Netherlands 61 60 3.33% 5.62% 7.52% 9.33% 2.83% 6.06%
U.K. 442 433 3.62% 5.75% 11.60% 12.70% 6.52% 8.13%
U.S.A. 2226 2171 3.93% 6.97% 9.51% 15.15% 3.28% 4.47%
France 297 294 5.51% 7.22% 9.72% 12.34% 3.75% 4.05%
Germany 289 286 5.54% 7.34% 13.10% 15.16% 2.67% 3.66% Spain 82 78 6.44% 7.39% 9.63% 11.26% 9.39% 8.07%
Ireland 28 26 6.45% 7.46% 16.29% 16.30% 12.20% 17.00%
Italy 155 154 7.99% 10.51% 10.20% 14.11% 8.69% 11.20%
Portugal 30 30 9.36% 12.07% 7.25% 12.44% 10.90% 7.39%
Greece 79 77 10.60% 11.57% 14.40% 12.99% 24.10% 13.22%
* Based on median Z-Metrics PDs from January 1 – June 30, 2009 and January 1 – April 30, 2010.**Assuming a 40% recovery rate; based on the median CDS spread observed for first six months of 2009 and first three months of 2010.†PD Computed as 1-e(-5*s/(1-R))
Sources: RiskMetrics Group (MSCI), Markit, Compustat.

www.riskmetrics.com 22
Median Percent Change in Various Country Stock Market Index Values and Z-Metrics’ PDs
*Median of the various trading day stock index values and PDs
Sources: Z-Metrics Model calculations from RiskMetrics (MSCI) Group, Bloomberg for stock index values
(First Six Months of 2010 Vs. 2009)
Country Index
Median Percent
Change
(2010 vs. 2009)*
Median Z-Metrics
PDs: Percent Change
(2010 vs. 2009)*
France CAC40 24.1% -23.6%
Germany DAX 31.8% -24.5%
Greece ASE 5.5% -8.4%
Ireland ISEQ 26.2% -7.4%
Italy FTSEMIB 18.2% -24.0%
Netherlands AEX 34.4% -25.3%
Portugal PSI-20 17.8% -22.4%
Spain IBEX35 20.9% -12.9%
U.K. FTSE100 27.8% -37.6%
U.S.A. S&P500 31.9% -43.6%

www.riskmetrics.com 23
Five Year Implied Probabilities of Default (PD) FromCDS Spreads
Greece, Jan 2009 to Oct 2010
Source: Markit
0
10
20
30
40
50
60
1-J
an
-09
22
-Ja
n-0
9
12
-Fe
b-0
9
5-M
ar-
09
26
-Ma
r-0
9
16
-Ap
r-0
9
7-M
ay
-09
28
-Ma
y-0
9
18
-Ju
n-0
9
9-J
ul-
09
30
-Ju
l-0
9
20
-Au
g-0
9
10
-Se
p-0
9
1-O
ct-0
9
22
-Oct
-09
12
-No
v-0
9
3-D
ec-
09
24
-De
c-0
9
14
-Ja
n-1
0
4-F
eb
-10
25
-Fe
b-1
0
18
-Ma
r-1
0
8-A
pr-
10
29
-Ap
r-1
0
20
-Ma
y-1
0
10
-Ju
n-1
0
1-J
ul-
10
22
-Ju
l-1
0
12
-Au
g-1
0
2-S
ep
-10
23
-Se
p-1
0
14
-Oct
-10
Date
5 Y
ea
r P
D (
As
Pe
rce
nt)