Embed Size (px)
Citation preview

Fall 2017 Sangamon County Economic Outlook Survey
Prepared by the Survey Research Office, Center for State Policy and Leadership at the University of Illinois Springfield for the Greater Springfield Chamber of Commerce
November 10, 2017

Table of Contents
Page Executive Summary 2 Project Methodology 3 Table A1. Organization Statistics 4 The Sangamon County Economy 5 Examining Expectations for Economic Sectors 8 Overall Expectations for Own Firm/Organization 12 Biggest Challenges Facing Sangamon County Employers 14 Topical Section: Online Presence and E-Commerce 18 Appendix A: Topline Report 19 Appendix B: Answers to Open-ended Question 31

2
Executive Summary
Since 2008, the Sangamon County Economic Outlook Survey has examined the economic perceptions, expectations and challenges businesses, nonprofit organizations and public entities face. The survey asks representatives of organizations who are members of the Greater Springfield Chamber of Commerce to respond to questions on their organizations’ economic outlook over the next 12 months. Each survey, in addition to standard questions, includes a special, topical question on issues organizations in Sangamon County currently face. Topical questions are developed with the assistance of the survey planning committee, a group of individuals involved with the project for several years. This year’s topical section is on e-commerce.
The fall 2017 survey results are from 233 local organizations contacted in October 2017, via email invitations using Qualtrics Research Suite. A more detailed discussion of the methodology is available on the next page.
For more information about this survey, please contact Center for State Policy and Leadership Executive Director David Racine at [email protected] or (217) 206-8417. Special thanks to steering committee members Richard Schuldt, Dr. Beverly Bunch and Dr. Patricia Byrnes at the University of Illinois Springfield, and to Josh Collins at the Greater Springfield Chamber of Commerce for their guidance. Some key findings from the current survey include:
• State finances continue, for the forth survey in a row, to be a concern for employers: Despite the breaking of the state budget impasse, 58 percent cite “state government finances” as one of the top three concerns facing their organization during the next 12 months. This is only slightly below the 61percent level captured by the spring 2017 survey.
• Expectations for higher interest rates and inflation have come down some since spring 2017 but remain pronounced: Sixty-four percent expect interest rates to increase compared to 83percent in the spring, and 63 percent expect inflation to grow compared to 76percent in the spring.
• The medical/health care sector continues to be perceived as having the strongest growth prospects: Sixty-one percent expect this sector to increase in the next year. The next closest is construction, at a distant 38 percent.
• Expectations for one’s own firm’s revenue/sales, profitability, and overall status are all up compared to spring 2017 and fall 2016: Fifty-five percent for revenue/sales compared to 51 percent in spring 2017 and 49 percent in fall 2016; 46 percent for profitability compared to 43 percent in spring 2017 and 45 percent in fall 2016; and 50 percent for overall status compared to 46 percent in spring 2017 and 43 percent in fall 2016.
• The effects of e-commerce competition are seen as slightly more positive than negative: Most report the effect as neutral, while 36 percent indicate it as positive and 26 percent a negative.

3
Project Methodology
In 2015, the UIS Survey Research Office (SRO) became a charter member of the American Association for Public Opinions Research’s Transparency Initiative (TI). By joining the TI, the SRO supports broader and more effective disclosure of research methods. The Transparency Initiative provides formal, public recognition by AAPOR of an organization's voluntary commitment to abide by the disclosure standards in the AAPOR Code of Professional Ethics and Practices, while benefiting the public by providing more information with which to evaluate the quality of individual surveys. As part of SRO’s continued investment in this initiative, it has committed to providing a detailed methodological report for all its survey projects. For more information on the Transparency Initiative, please visit: http://transparency.aapor.org/index.php/transparency/about SANGAMON COUNTY ECONOMIC OUTLOOK SURVEY The Sangamon County Economic Outlook Survey is sponsored by the Greater Springfield Chamber of Commerce, with a contribution from the University of Illinois Springfield’s Office of the Chancellor. It was conducted by researchers at the University of Illinois Springfield’s SRO. A steering committee comprised of university and Chamber representatives assisted with questionnaire development for the topical section of the project. The topline report in Appendix A (pg. 19) includes actual question wording and frequency. Open-ended responses are presented in Appendix B (pg. 31). SAMPLE AND METHODOLOGY A list of local firms and organizations included in the Spring 2017 Sangamon County Economic Outlook Survey was generated by examining a list of Greater Springfield Chamber of Commerce members. After review, 1,269 individuals were deemed eligible to participate. On October 9, at 8:30 a.m., SRO sent emails to all 1,298 email addresses. Reminder emails were sent to respondents on October 13 at 8:30 a.m., October 17 at 9:30 a.m., and October 20 at 9:05 a.m. Responses were accepted until October 29 at 11:59 p.m. Of the 1,298 respondents in the sample, 233 completed the survey. Additionally, 14 emails failed to send and 31 emails bounced. The response rate for the survey is 16.2 percent (AAPOR Response Rate 3). The margin of error for this project is +7 percent. When examining subgroups, owing to smaller numbers, the margin of error increases. Margins of error for this survey were not adjusted for design effect, nor have the data been weighted.

4
Table A1. Organization Statistics (N=233)
Sector Percent Private sector (for-profit) 75 Nonprofit sector 15 Public sector 10 Primary Economic Activity (Self-Described) Percent Construction 9 Manufacturing 3 Retail trade 12 Transportation/ warehousing 1 Finance/ insurance/ real estate 16 Medical/ health care 6 Education/ educational services 4 Accommodations/ food/ entertainment/ recreation 11 Information and communications systems 5 Business and professional support services 19 Personal services 6 Natural resources and mining 1 Public administration 8 Wholesale trade 1 Years in Operation Years (median) Years in current location 17 Years in Sangamon County 28 Years in Illinois 30 Number of Full-Time Employees Percent 20 or less 63 21 – 50 11 51 -100 11 More than 100 16

5
The Sangamon County Economy
As with past surveys, the current survey looks at respondents’ expectations regarding different aspects of the Sangamon County economy. The survey asks respondents their expectations during the next 12 months of overall employment, capital investments, interest rates, gross sales, inflation, contributions to nonprofits, and the overall economy. Table One shows the percentage of respondents who expect to see an increase in each of these areas over the past three survey administrations.
Table 1. Percentage of Respondents Who Expect to See an Increase in the Following Aspects of the Local Economy Fall 2017 Spring 2017 Fall 2016 Overall Employment 32 29 27 Capital Investment 28 34 25 Interest Rates 64 83 63 Gross Sales/ Revenue 32 33 33 Inflation/ Price of Goods 63 76 66 Contribution to Non-Profits 15 14 15 Overall Economy 33 36 31
The survey finds expectations for overall economic growth have changed little since the fall of 2016, with approximately a third of respondents anticipating an increase. Interest rate expectations have shifted the most, although across all three surveys majorities have anticipated increases. Currently, 64 percent of respondents expect interest rates to rise during the next 12 months, about the same as a year ago. However, last spring (six months ago), 83 percent of respondents predicted interest rates would increase. The Federal Reserve increased the short-term benchmark rate in March of this year and again in June, and some have predicted the rate may be upped one more time in December. Expectations of higher inflation in Sangamon County followed a similar pattern. Clear majorities in the last three administrations of the survey predicted increases in inflation, with a peak level – 76 percent in the spring of 2017 – bookended by somewhat lower expectations in the fall of 2016 and fall of 2017. The consumer price index nationally rose 2.2 percent between September of last year and September of this year, with energy prices leading the way. Local expectations for employment, capital investment, and sales/revenue remained relatively weak throughout.

6
The figure below provides a more complete picture of expectations for Sangamon County’s economy during the next 12 months. Note roughly a third of respondents predict declines in capital investment, sales/revenue, and the overall economy. While the data are not shown, this reflects some moderation from higher levels of expected decline in these areas last spring.
Table Two (next page) breaks down expectations by different types of employers. Private employers and public/nonprofit employers do not diverge markedly on expectations for increases in employment, sales/revenue, inflation, and the overall economy. They diverge more on expectations regarding capital investment, with public/nonprofit employers having higher expectations for growth, and interest rates, where private employers’ expectations are higher. Also, public/nonprofit employers are twice as likely as private employers to predict increases in contributions to nonprofit organizations. Expectations do not differ much across employers based on how long they have been doing business in Sangamon County. However, there is considerable divergence based on number of employees. The smallest employers (20 or fewer employees) and the two groups of larger employers (51-100 employees and more than 100 employees) worried most about interest rates and inflation, while employers with 21-50 employees are almost equally worried about inflation but concerned relatively little about interest rate increases. Interestingly, this last group is much more likely to expect the overall economy to grow, with almost half saying this. Expectations for increased capital investment are also highest in this group, at 35 percent, while few employers with 51-100 employees (just 17 percent) foresee more investment during the next 12 months. Employers who provide goods and services to the state and those who don’t have similar expectations (except for employment and contributions to nonprofits) with the former type of employer more likely to anticipate increases.
33%
31%
5%
34%
2%
30%
23%
34%
54%
32%
35%
34%
42%
45%
33%
15%
63%
32%
64%
28%
32%
0% 20% 40% 60% 80% 100%
Overall Economy
Contribution to Non…
Inflation/Price of Goods
Gross Sales/Revenue
Interest Rate
Capital Investment
Overall Employment
Figure 1: Expectations of the Sangamon County Economy
Decline Stay the same Increase

7
Table 2. Percentage Who Say They Expect an Increase In______ During the Next 12 Months.
Employment Capital
Investment Interest
Rate
Gross Sales/
Revenue
Inflation/ Price of Goods
Contribution to Non-Profits
The Overall
Economy Type of Organization
Private 32 25 67 33 63 12 33 Public or Nonprofit 34 34 56 29 61 23 29
Years in Sangamon County
15 years or less 32 32 67 31 63 32 33 16-30 years 33 20 59 30 65 33 33 30+ years 35 29 65 32 63 35 32 Number of Employees
20 or less 23 28 68 29 68 34 30 21-50 18 35 29 35 59 29 47 51 – 100 33 17 61 22 56 22 33 More than 100 20 24 72 40 52 32 32 Goods/Services Provided to State
Yes 38 29 65 31 61 19 29 No 28 26 63 33 65 9 36 Survey Year Fall 2017 32 28 64 32 63 15 33 Spring 2017 29 34 83 33 76 14 36 Fall 2016 27 25 63 33 66 15 31
8
Examining Expectations for Economic Sectors
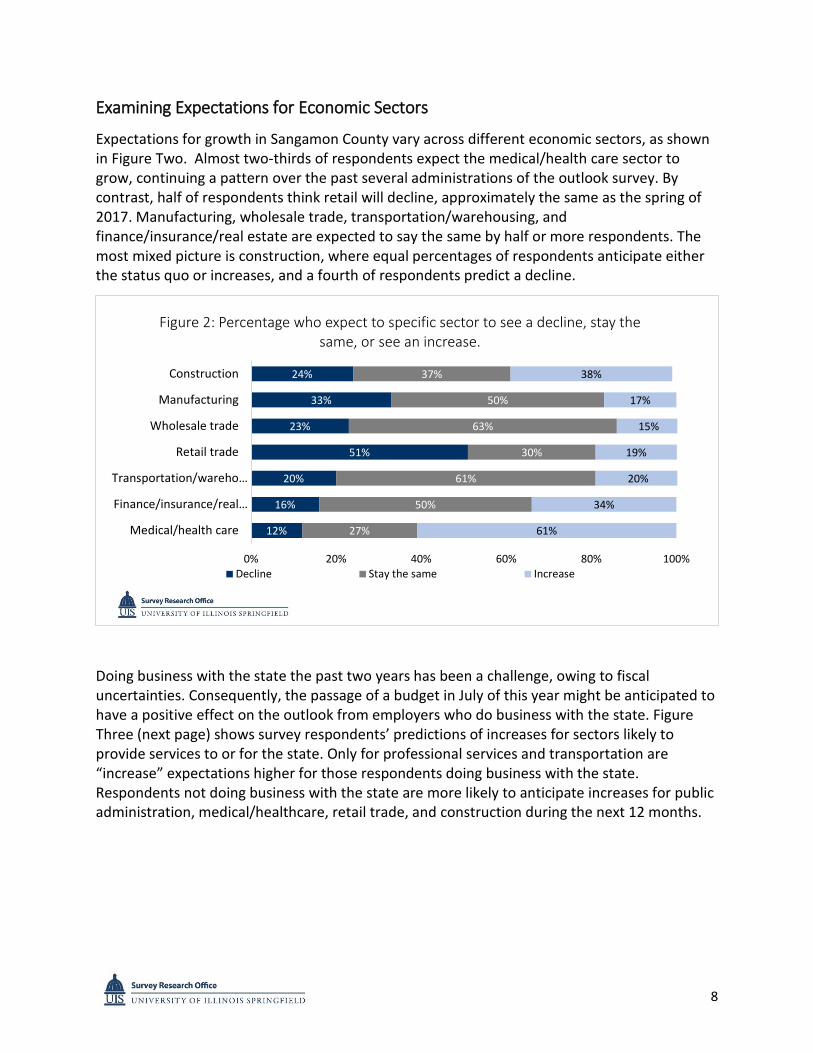
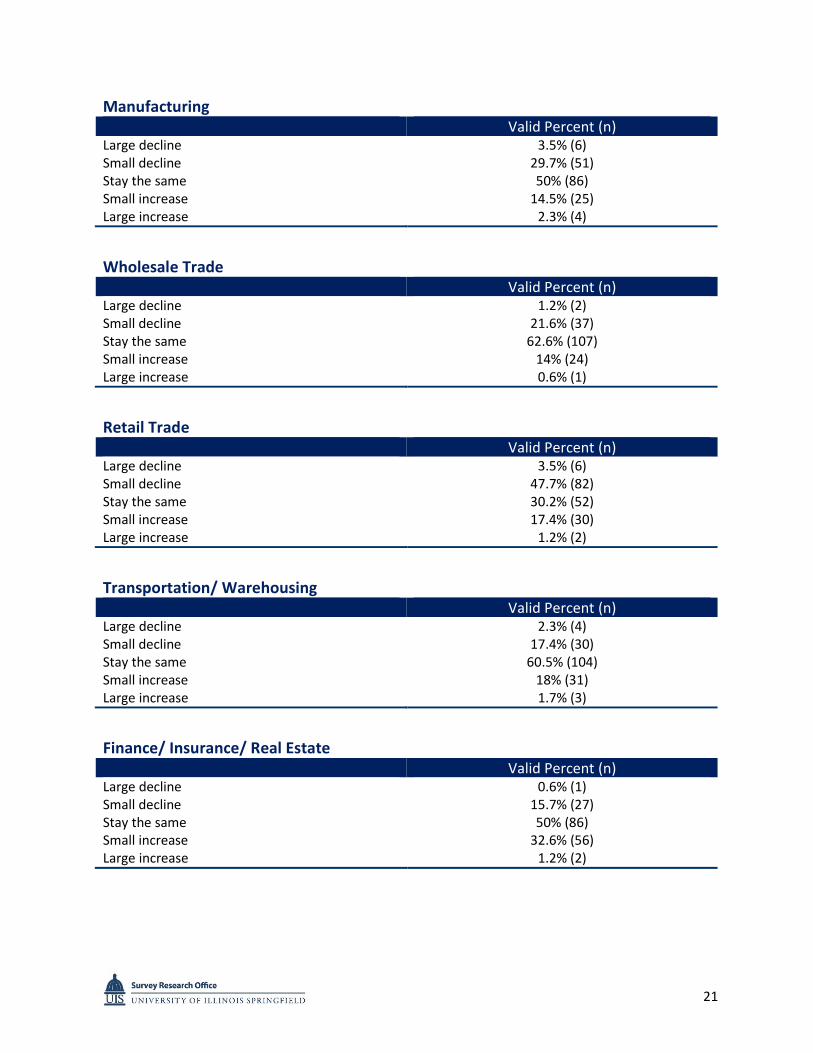
Expectations for growth in Sangamon County vary across different economic sectors, as shown in Figure Two. Almost two-thirds of respondents expect the medical/health care sector to grow, continuing a pattern over the past several administrations of the outlook survey. By contrast, half of respondents think retail will decline, approximately the same as the spring of 2017. Manufacturing, wholesale trade, transportation/warehousing, and finance/insurance/real estate are expected to say the same by half or more respondents. The most mixed picture is construction, where equal percentages of respondents anticipate either the status quo or increases, and a fourth of respondents predict a decline.
Doing business with the state the past two years has been a challenge, owing to fiscal uncertainties. Consequently, the passage of a budget in July of this year might be anticipated to have a positive effect on the outlook from employers who do business with the state. Figure Three (next page) shows survey respondents’ predictions of increases for sectors likely to provide services to or for the state. Only for professional services and transportation are “increase” expectations higher for those respondents doing business with the state. Respondents not doing business with the state are more likely to anticipate increases for public administration, medical/healthcare, retail trade, and construction during the next 12 months.
12%
16%
20%
51%
23%
33%
24%
27%
50%
61%
30%
63%
50%
37%
61%
34%
20%
19%
15%
17%
38%
0% 20% 40% 60% 80% 100%
Medical/health care
Finance/insurance/real…
Transportation/wareho…
Retail trade
Wholesale trade
Manufacturing
Construction
Figure 2: Percentage who expect to specific sector to see a decline, stay the same, or see an increase.
Decline Stay the same Increase

9
As shown in Tables Three and Four, private and public/nonprofit respondents do not differ much in their expectations for growth in different economic sectors. The two notable exceptions are professional services and personal services, where public/nonprofit respondents are clearly more likely than private respondents to anticipate increases. While how long an employer has operated in Sangamon County is not predictive of expectations for different measures of economic activity (Table 2 above), it does appear to be a more meaningful differentiator of expectations for different economic sectors. On average, employers in business 16-30 years are less likely to expect sectors to grow (21 percent) than are younger (28 percent) and older (29 percent) employers. Respondents from the two smallest groups of employers in terms of employees (20 or less and 21-50) and the largest group of employers (100+ employees) are, on average, similar in their expectations for growth across the various sectors, at just under 30 percent. Respondents from employers with 51-100 employers are more pessimistic. On average, only 18 percent of this group expects sectoral growth, which is consistent with their lower expectations for the economy overall, as previously indicated in Table Two.
34
12
22
58
29
8
41
25
17
65
18
13
0 20 40 60
Construction
Retail trade
Transportation
Medical/Health care
Professional Services
Public Administration
Figure 3. Percentage who expect to see an increase in the following sectors over the next 12 months by whether the respondent's organization
typically does businees with the state of Illinois
No business with State Business with State

10
Table 3. Percentage Indicating Economic Activity Will Increase During the Next 12 Months for the Following Economic Sectors (1 of 2).
Construct
-ion Manufact
uring Wholesale
trade Retail trade
Transportation
Finance/ Insurance
Medical/ Health
care Type of Organization
Private 38 15 17 19 19 31 60 Public or Nonprofit 37 20 10 15 24 37 64
Provides Goods and Services to State
Yes 34 16 13 12 22 33 58 No 41 17 17 25 17 33 65 Years in Sangamon County
15 Years or Less 31 22 20 24 18 35 61
16 to 30 Years 35 10 15 13 18 23 53
More than 30 years 43 14 12 17 25 39 66
Full-Time Employees
20 or less 37 14 17 19 20 35 59 21 to 50 41 18 12 29 35 35 71 51 to 100 39 11 17 11 11 22 50 More than 100 36 24 12 16 16 32 68
Survey Year Fall 2017 38 17 15 19 20 34 61 Spring 2017 41 20 19 19 20 31 55 Fall 2016 34 6 14 28 20 28 68

11
Table 4. Percentage Indicating Economic Activity Will Increase During the Next 12 Months for the Following Economic Sectors (2 of 2).
Education Entertain
ment Inform-
ation Profess. Services
Personal Services
Natural Resources
Public Admin.
Type of Organization
Private 20 39 36 20 21 11 11 Public or Nonprofit 24 39 41 34 34 10 10
Provides Goods and Services to State
Yes 24 40 38 29 24 10 8 No 23 37 38 18 26 12 13 Years in Sangamon County
15 Years or Less 22 37 47 22 24 18 8
16 to 30 Years 18 30 28 20 15 5 13
More than 30 years 32 46 37 27 34 9 11
Full-Time Employees
20 or less 24 43 37 21 27 13 11 21 to 50 29 29 59 13 29 6 18 51 to 100 17 17 22 11 17 6 6 More than 100 28 44 36 52 24 8 8
Survey Year Fall 2017 23 39 38 24 25 11 11 Spring 2017 9 26 34 25 24 20 7 Fall 2016 20 33 45 24 25 6 13

12
Overall Expectations for Own Firm/Organization
The Fall 2017 Economic Outlook Survey finds respondents’ views for their own firm or organization have changed relatively little since the fall of 2016 (Table Five). In only one of the five aspects measured do a majority of respondents indicate they expect to see an increase during the next 12 months: in gross revenue/sales. Though not a majority, a growing percentage of respondents anticipate an improvement in the overall status of their firm, with 50 percent in fall 2017, compared to 46 percent in spring 2017 and 43 percent in fall 2016. While capital investment and number of employees are expected to remain stable for the most part, higher expectations for revenue/sales and profitability, along with overall status, point toward a moderately improving outlook among respondents for their own businesses (Figure Four). Expectations of increased sales/revenue and profitability are especially strong among private, mid-sized, and younger employers (Table Six).
Table 5. Expectations for Own Business/ Firm/ Organization Aspects (Percentage Indicating They Expect to See an Increase During the Next 12 Months) Fall 2017 Spring 2017 Fall 2016 Capital Investment 30 31 32 Total Number of Employees 30 31 26 Gross Revenue/ Sales 55 51 49 Profitability 46 43 45 Overall Status 50 46 43
14%
13%
15%
16%
11%
57%
57%
30%
39%
39%
30%
30%
55%
46%
50%
0% 20% 40% 60% 80% 100%
Capital Investment
Total Number ofEmployess
Gross Revenue/Sales
Profitability
Overall Status
Figure 4: Expectations for Own Firm/Organization
Decline Stay the same Increase

13
Table 6. Growth Expectations for Own Business/ Firm/ Organization by Demographics (% Increase)
Capital
Investment
Total Number of Employees
Gross Revenue/
Sales Profitability Overall Status
Type of Organization
Private 30 34 63 50 54 Public or Nonprofit 27 15 29 24 37 Provide Goods and Services to State
Yes 32 34 61 44 51 No 27 25 47 45 49 Years in Sangamon County
15 Years or Less 37 43 71 59 67 16 to 30 Years 15 13 45 40 30 More than 30 Years 31 29 46 35 48 Number of Full-Time Employees
20 or less 27 32 53 44 55 21 to 50 6 12 71 53 35 51 to 100 33 17 50 22 28 More than 100 52 44 56 56 56 Survey Year Fall 2017 30 30 55 46 50 Spring 2017 31 31 51 43 46 Fall 2016 32 26 49 45 43

14
Biggest Challenges Facing Sangamon County Employers
The survey asks respondents to identify the three biggest challenges for their organization during the next 12 months from a list of 13 possibilities (including the option to specify some other, unlisted challenge). As with the most recent previous surveys, a majority of respondents (58 percent) list state government finances as one of their three biggest challenges (Figure Five). This is only a slight drop from the 61 percent who indicated this last spring. State government finances as a challenge has been a top-of-the-mind concern for local employers since the spring of 2016, roughly half a year into Illinois’ state budget impasse.
Other significant challenges for survey respondents, both currently and last spring, include consumer confidence, government regulations and taxation, availability of skilled workers, and employee healthcare (Table Seven). Concerns about consumer confidence increased the most, five percentage points, between spring and fall of 2017. This contrasts to some extent with national data on consumer confidence. The Conference Board in October 2017 reported consumer confidence was at its highest level in nearly 17 years. The hang-over from the state budget impasse, which may be stronger in Sangamon County than other parts of the state, and out migration contributing to population loss could fuel more pessimistic local perceptions.
35%41%
32% 34% 33% 31%
45%
55% 56%61% 58%
0%
20%
40%
60%
80%
100%
Fall 2012 Spring2013
Fall 2013 Spring2014
Fall 2014 Spring2015
Fall 2015 Spring2016
Fall 2016 Spring2017
Fall 2017
Figure 5. Percentage of respondents who identify state government finances as one of the three biggest challenges facing their organization
over time
15
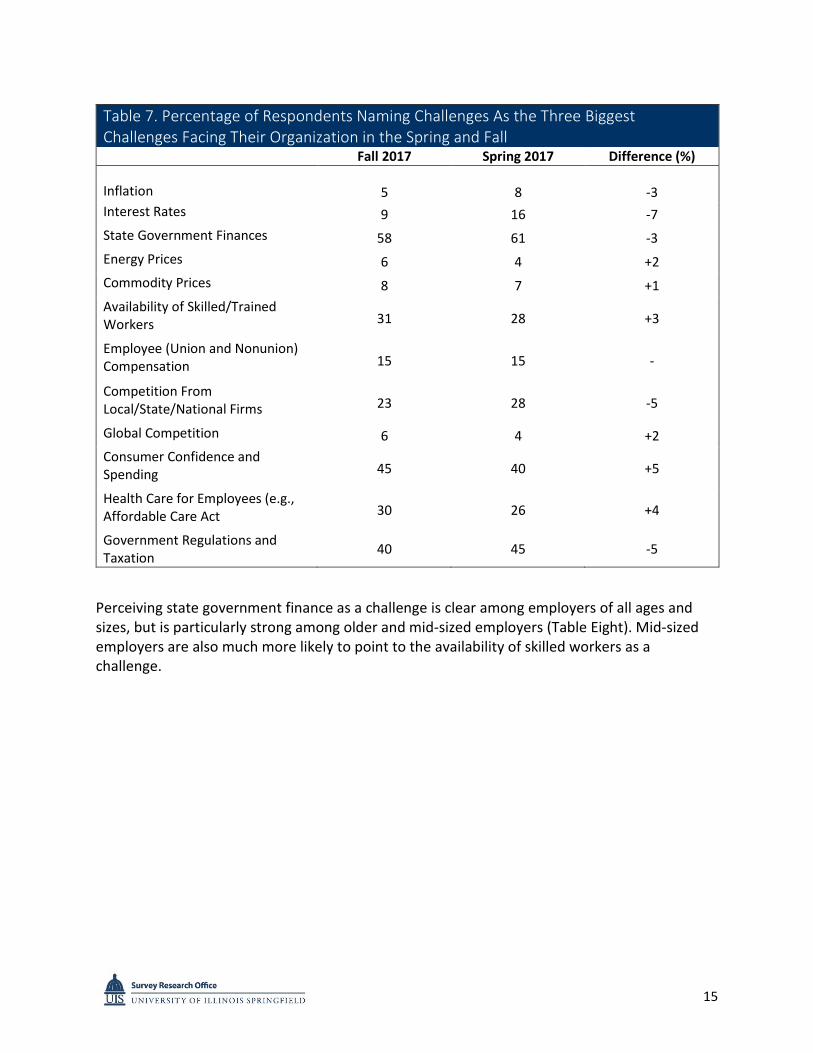
Perceiving state government finance as a challenge is clear among employers of all ages and sizes, but is particularly strong among older and mid-sized employers (Table Eight). Mid-sized employers are also much more likely to point to the availability of skilled workers as a challenge.
Table 7. Percentage of Respondents Naming Challenges As the Three Biggest Challenges Facing Their Organization in the Spring and Fall
Fall 2017 Spring 2017 Difference (%) Inflation 5 8 -3 Interest Rates 9 16 -7 State Government Finances 58 61 -3 Energy Prices 6 4 +2 Commodity Prices 8 7 +1 Availability of Skilled/Trained Workers 31 28 +3
Employee (Union and Nonunion) Compensation 15 15 -
Competition From Local/State/National Firms 23 28 -5
Global Competition 6 4 +2 Consumer Confidence and Spending 45 40 +5
Health Care for Employees (e.g., Affordable Care Act 30 26 +4
Government Regulations and Taxation 40 45 -5

16
Non-global competition is more of a challenge for younger and older employers than for middle-aged ones, while firm age appears to be largely unrelated to perceptions of global competition as a challenge (Table Nine). The challenge posed by government regulation and taxation is felt more strongly among middle-aged and older firms than among younger firms. Interestingly, private employers and public/nonprofit employers weight the regulation/tax challenge about the same. Regarding consumer confidence as a top concern varies consistently with the number of employees an employer has: the smaller the employer the bigger the concern.
Table 8. Percent of Respondents Indicating ____ Is One of the Top Three Challenges Facing Their Organization (1 of 2)
Inflation Interest
Rates
State Government
Finances Energy Prices
Commodity Prices
Availability of Skilled/Trained
Workers Type of Organization
Private 4 11 56 6 7 31 Public or Nonprofit 5 2 68 10 7 39
Provide Goods and Services to State
Yes 3 9 71 5 6 36 No 5 9 45 9 9 29 Years in Sangamon County
15 Years or Less 6 12 49 10 6 37
16 to 30 Years 3 10 60 8 8 28 More than 30 Years 3 6 66 5 8 34
Number of Full-Time Employees
20 or less 5 13 55 7 5 25 21 to 50 0 0 77 0 0 53 51 to 100 6 0 72 6 6 56 More than 100 0 8 67 8 21 29

17
Table 9. Percent of respondents indicating that ____ is one of the top three challenges facing their organization (2 of 2)
Employee
Compensa-tion and Benefits
Competition from
Local/State/National
Firms Global
Competition
Consumer Confidence/
Spending
Health care for
Employees
Government Regulations
and Taxation
Type of Organization
Private 7 24 9 50 32 43 Public or Nonprofit 39 17 2 32 27 42
Provide Goods and Services to state
Yes 15 23 3 45 35 36 No 16 23 12 45 25 49 Years in Sangamon County
15 Years or Less 12 29 8 53 29 31
16 to 30 Years 13 10 10 45 30 50
More than 30 Years 15 28 6 40 32 45
Number of Full Time Employees
20 or less 9 23 7 53 34 43 21 to 50 18 24 6 41 29 29 51 to 100 17 17 0 33 22 56 More than 100 29 29 17 21 29 38

18
Topical Section: Online Presence and E-Commerce
The National Retail Federation reported in February 2017 it expected retail sales in the United States to grow 3.7-4.2 percent in 2017, but it expected online retail to grow 8-12 percent, two and three times higher. According to the federal Bureau of Labor Statistics, e-commerce employment grew 334 percent since 2002, while employment in the retail industry overall remained flat. Because of the rapid ascent of online/e-commerce, it made sense in the fall 2017 outlook survey to find out more what local employers think about this trend.
The survey finds nearly all respondents’ firms/organizations (97 percent) have an online presence and 39 percent of responding employers sell goods or services online. In response to a question about the effect of online competition on their organization’s growth, respondents reported the following:
A large positive effect 16% A small positive effect 20% No effect 38% A small negative effect 21% A large negative effect 5%
So, while a plurality of respondents reported no effect, somewhat more indicate a positive effect (36 percent) than a negative effect (27percent) of online competition on their business.
The topical section dug a little deeper into the effects of online competition. It first asked respondents whether in the past year they experienced a decline in gross revenue or sales, taking into account the fact that sales tax revenue declined in the city of Springfield. Thirty-three percent (55) respondents indicated their revenue/sales had dropped in the past year. The survey then asked respondents who indicated a decline in revenue/sales to say how much of this decline they would attribute to e-commerce. Most respondents reported the effect was “not much” (67 percent), while 24 percent said there was some effect and nine percent attributed “a great deal” of the decline to e-commerce.

19
Appendix A: Topline Report1
Section 1: Sangamon County Economic Expectations
During the next 12 months, do you expect the following aspects of the local economy to see a large decline, small decline, stay the same, a small increase, or a large increase?
Overall Employment Valid Percent (n) Large decline 1.8% (3) Small decline 21.2% (36) Stay the same 44.7% (76) Small increase 30% (51) Large increase 2.4% (4)
Capital Investment Valid Percent (n) Large decline 4.1% (7) Small decline 25.4% (43) Stay the same 42.0% (71) Small increase 27.2% (46) Large increase 1.2% (2)
Interest Rates Valid Percent (n) Large decline 0% (0) Small decline 1.8% (3) Stay the same 33.9% (58) Small increase 60.8% (104) Large increase 3.5% (6)
Gross Sales/ Revenue Valid Percent (n) Large decline 2.9% (5) Small decline 31.0% (53) Stay the same 34.5% (59) Small increase 29.8% (51) Large increase 1.8% (3)
1 For this section, due to rounding, the totals may not always equal 100 percent.
20
Inflation/ Price of Goods Valid Percent (n) Large decline 0% (0) Small decline 4.7% (8) Stay the same 32% (55) Small increase 57.6% (99) Large increase 5.8% (10)
Contributions to Nonprofits Valid Percent (n) Large decline 3.5% (6) Small decline 27.6% (47) Stay the same 54.1% (92) Small increase 13.5% (23) Large increase 1.2% (2)
The Overall Economy Valid Percent (n) Large decline 2.3% (4) Small decline 30.2% (52) Stay the same 34.3% (59) Small increase 30.8% (53) Large increase 2.3% (4)
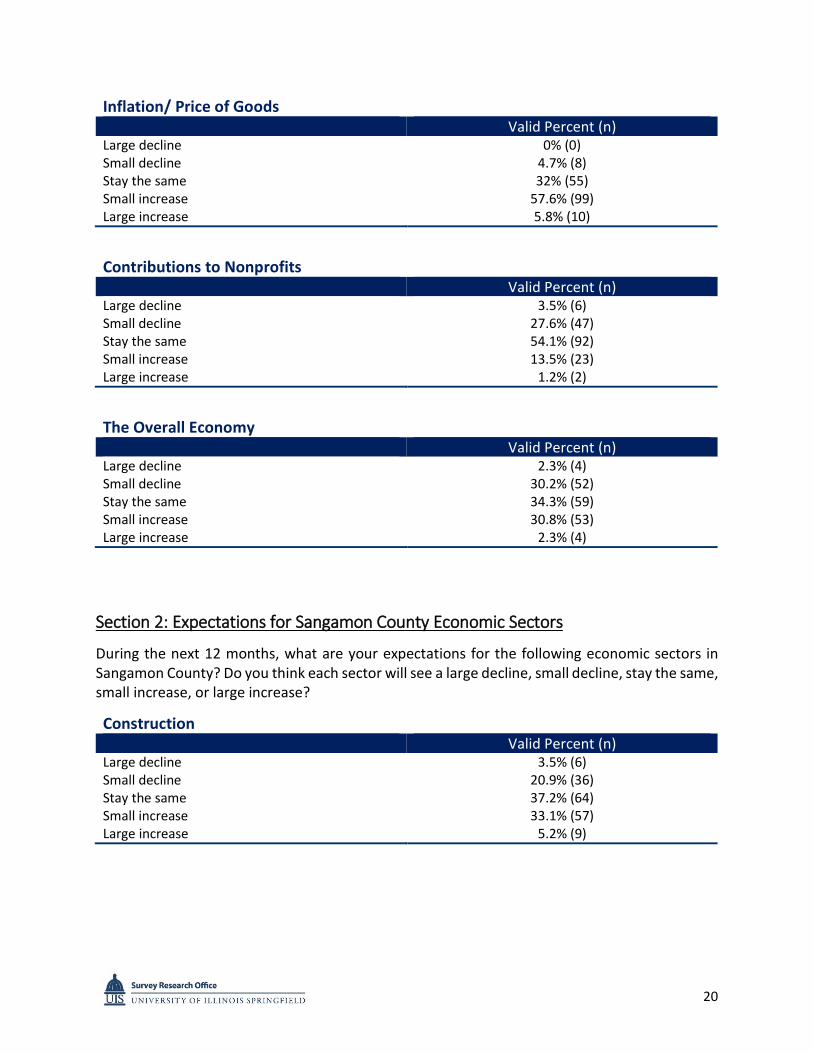
Section 2: Expectations for Sangamon County Economic Sectors
During the next 12 months, what are your expectations for the following economic sectors in Sangamon County? Do you think each sector will see a large decline, small decline, stay the same, small increase, or large increase?
Construction Valid Percent (n) Large decline 3.5% (6) Small decline 20.9% (36) Stay the same 37.2% (64) Small increase 33.1% (57) Large increase 5.2% (9)
21
Manufacturing Valid Percent (n) Large decline 3.5% (6) Small decline 29.7% (51) Stay the same 50% (86) Small increase 14.5% (25) Large increase 2.3% (4)
Wholesale Trade Valid Percent (n) Large decline 1.2% (2) Small decline 21.6% (37) Stay the same 62.6% (107) Small increase 14% (24) Large increase 0.6% (1)
Retail Trade Valid Percent (n) Large decline 3.5% (6) Small decline 47.7% (82) Stay the same 30.2% (52) Small increase 17.4% (30) Large increase 1.2% (2)
Transportation/ Warehousing Valid Percent (n) Large decline 2.3% (4) Small decline 17.4% (30) Stay the same 60.5% (104) Small increase 18% (31) Large increase 1.7% (3)
Finance/ Insurance/ Real Estate Valid Percent (n) Large decline 0.6% (1) Small decline 15.7% (27) Stay the same 50% (86) Small increase 32.6% (56) Large increase 1.2% (2)

22
Medical/ Health Care Valid Percent (n) Large decline 1.2% (2) Small decline 11% (19) Stay the same 27.3% (47) Small increase 51.2% (88) Large increase 9.3% (16)
Education/ Educational Services Valid Percent (n) Large decline 2.3% (4) Small decline 16.4% (28) Stay the same 57.9% (99) Small increase 22.8% (39) Large increase 0.6% (1)
Accommodations/ Food/ Entertainment/ Recreation Valid Percent (n) Large decline 1.2% (2) Small decline 18.6% (32) Stay the same 41.3% (71) Small increase 38.4% (66) Large increase 0.6% (1)
Information and Communications Systems Valid Percent (n) Large decline 1.2% (2) Small decline 9.3% (16) Stay the same 51.7% (89) Small increase 35.5% (61) Large increase 2.3% (4)
Business and Professional Support Services Valid Percent (n) Large decline 1.2% (2) Small decline 21.1% (36) Stay the same 53.8% (92) Small increase 22.8% (39) Large increase 1.2% (2)

23
Personal Services Valid Percent (n) Large decline 1.2% (2) Small decline 13.5% (23) Stay the same 60.2% (103) Small increase 24% (41) Large increase 1.2% (2)
Natural Resources and Mining Valid Percent (n) Large decline 6.4% (11) Small decline 30.2% (52) Stay the same 52.3% (90) Small increase 8.7% (15) Large increase 2.3% (4)
Public Administration Valid Percent (n) Large decline 1.7% (3) Small decline 26.2% (45) Stay the same 61.6% (106) Small increase 9.3% (16) Large increase 1.2% (2)
Which of the above economic sectors best describes your firm’s primary economic activity? Valid percent (n) Construction 69% (14) Manufacturing 2.6% (4) Retail Trade 11.6% (18) Transportation/ Warehousing 1.3% (2) Finance/ Insurance/ Real Estate 16.1% (25) Medical/ health care 6.5% (10) Education/ Educational Services 3.9% (6) Accommodations/ Food/ Entertainment/ Recreation 11% (17) Information and Communications Systems 4.5% (7) Business and Professional Support Services 18.7% (29) Personal Services 5.8% (9) Natural Resources and Mining 0.6% (1) Public Administration 7.7% (12) Wholesale Trade 0.6% (1)

24
Section 3: Expectations for Your Business/Firm/Organization in Sangamon County
During the next 12 months, what are your expectations for your business/firm/ organization in Sangamon County? Do you think each aspect of your organization will see a large decline, small decline, stay the same, small increase, or a large increase?
Capital Investment in Firm Valid Percent (n) Large decline 2.4% (6) Small decline 11.3% (41) Stay the same 56.5% (144) Small increase 25% (77) Large increase 4.8% (10)
Total Number of Employees Valid Percent (n) Large decline 1.8% (3) Small decline 11.2% (19) Stay the same 56.8% (96) Small increase 27.2% (46) Large increase 3.0% (5)
Gross Revenue/ Sales Valid Percent (n) Large decline 1.2% (2) Small decline 13.6% (23) Stay the same 30.2% (51) Small increase 46.7% (79) Large increase 8.3% (14)
Profitability Valid Percent (n) Large decline 1.2% (2) Small decline 14.8% (25) Stay the same 38.5% (65) Small increase 39.1% (66) Large increase 6.5% (11)

25
Overall Status Valid Percent (n) Large decline 1.2% (2) Small decline 10.1% (17) Stay the same 38.5% (65) Small increase 43.2% (73) Large increase 7.1% (12)
Right now, as you look over the next 12 months, what are the three biggest challenges facing your organization? Valid Percent (n) Inflation 4.7 % (8) Interest rates 9.3% (16) State government finances 58.1% (100) Energy prices 6.4% (11) Commodity prices 7.6% (13) Availability of skilled/trained workers 30.8% (53) Employee (union and nonunion) compensation and benefits (not health care) 15.1% (26)
Competition from local/ state/ national firms 22.7% (39) Global competition 6.4% (11) Consumer confidence/ spending 45.3% (78) Health care for employees (e.g., Affordable Care Act) 29.7% (51) Government regulations and taxation 40.1% (69) Other, specify: 11.6% (20)
Other: Corporate affiliations; Change in society norms; City county state and federal interference; Competition from the internet; Corporate and individual Philanthropy; Declining economy; Decrease in federal funding; Individuals, families are all looking for ways to save money. I work with images. They, regardless of law copy, use and share images that by law should go through me; Internet purchasing; Internet taxation regulation/equality; Lack of demand; Lack of infrastructure spending and growth; Lack of vision and capabilities to grow the economy; Local economy is stagnant- Sangamon Government is great- Stat government sucks- they need to get out the way- cut or freeze Real Estate taxes—Too much regulation- get out of the way- Government grows economy slows- that is my slogan; Local inability to attract new business to the area; New President; Online shopping; People moving from the area; Taxes; Workman’s comp insurance, IRS, Federal Audits

26
Section 4: Online presence and E-commerce
This section is the topical portion of the survey and changes during each survey administration.
Does your organization, either at the local or national level, have an online presence? (This could be a Facebook page, a web page, or something else) Valid Percent (n)
Yes 97.1% (165) No 2.9% (5)
Does your organization sell goods or services online? Valid Percent (n) Yes 38.8% (64) No 54.5% (90) What effect, if at any do you believe online competition (e-commerce) has on your organization’s growth?
Valid Percent (n) Large positive effect 16.0% (27) A small positive effect 19.5% (33) No effect 37.9% (64) A small negative effect 21.3% (36) A large negative effect 5.3% (9)
The city of Springfield experienced a decline in sales tax revenue compared to the previous year. Thinking about the past year, has your organization experienced a decline in it gross revenue or sales?
Valid Percent (n) Yes. Our organization has experienced a decline. 32.7% (55) No. Our organization has not experienced a decline. 67.3% (113)
To what extent do you attribute this decline to e-commerce (for instance, online sales)? Valid Percent (n) Not much 67.3% (37) Some 23.6% (13) A great deal 9.1% (5)

27
Is there anything else you would like to tell us about how e-commerce affects your organization? Commercial real estate and taxes are too high considering all the empty store fronts and lagging real estate market in the area. These things NEVER go down even with less demand. You wish to spur growth then get them in line with demand. Congress should pass the market fairness legislation to charge sales tax for on-line sales. E Commerce only helps promote our business and our abilities to current and prospective customers. E-commerce and state budget impasse are not the only causes of local retail trade slow down. Massive local dollars going into video gaming machines is also a cause. E-commerce does not give the full spectrum of customized services. Difficult to evaluate and compare quality and deliverables fully. E-commerce does not really affect our service oriented business. E-commerce is irrelevant to our organization. E-commerce is the continued wave of future for our business. We need markets outside of Springfield to survive and grow. I believe e-commerce has lowered pricing of goods across the board due to increased competition and access. This in turn leads to having to sell more of the same items to hit the same sales/tax which has not been the case. In addition, the tax subsidy given to some internet sellers like Amazon has hurt the local economies as we do not see that money coming back to the local level. For example, consumer from Springfield purchases item on Amazon. Amazon sales go up and helps the corporate office of Amazon but doesn’t specifically help the local level. You pay 6.25% vs if you buy from local stores at the mall where you're paying 8.5% or at a store like SCHEELS where you're paying 9.5%. That is significant money tax loss. Also, there are still too many internet sellers not paying/charging taxes at all or the right amount. I not only lose money, it costs me money. Internet shoppers come in to my store, try on my clothes and shoes, make a mess and leave my staff to pick up after them, clean the make up off the product and then they go purchase off the internet. I have researched this and honestly in most cases my prices beat the internet or come very close. It is becoming a culture. And most frustrating are the other offices that do this to me. I have physician and dental offices actually send their staff in to try on clothing with the sole intent to tell the secretary their size so she can online shop. What happens is that they (secretary or office) get points and use credit cards with perks, which basically give them kickbacks. Even if my prices are cheaper, it won't matter because I cannot compete with their mindset and selfish choices. These are local business owners doing this. Some don't realize what their staff is doing or don't care and everyone fails to appreciate the trickle down. We are all in a "buying/sending" food chain, and those missing links makes up weak. I sell services, so it's via word of mouth rather than e-commerce. Is has changed our business model slightly to accommodate the online user who now come less frequently to our branch locations. We are considering closing a branch office which would then allow us to put additional resources toward our online presence. It affects many of our clients in different ways. It helps with exposure such as with marketing efforts and expanding their reach. However, the security issues associated with it are a constant threat. The services to combat and prepare against cyber-attacks is gaining traction among businesses of all sizes. It also affects the advertising impact. We are not just spending against other local advertisers, our advertising spend must compete with national advertiser spends.
28
It is imperative for our "new" way of selling to clients. We have been selling photos for over 18 years now, with the internet or e-commerce, the flow has been wonderful. It's hard to be competitive with e-commerce businesses. They often sell on line at or below our cost for the same products. No No No other issue None Not at this time On low margin goods often online offers will entice customers away from buying locally. Our online presence is for branding and awareness. We do not directly sell services online. There are many factors impacting our economic outlook. Some are not in our control - the stability of our government and its impact on our customers' spending confidence and the change in shoppers' behavior and their reliance on on-line shopping. However, we are responsible to recognize the changes and respond to them in a manner which is positive for our business. While responding may be challenging, it is much easier than trying to change those elements not in our control. People will shop online if they do not feel they have enough choices. While it may hurt some local retailers, a regional outlet mall would increase spending and add to the tax base. Puts burden on sales tax. Should eliminate sales and property taxes and move to progressive income tax. Business should be able to reduce their taxes by the amount of income tax their employees pay. Some services we provide are available on-line Springfield is afraid to think BIG. Only in Springfield does it take years to get anything done, be it permitting, construction, public works, etc. Our city fathers will talk something to death before it gets done. Even Chicago moves faster on bureaucracy than Springfield. Wake up! State government needs to get their act together! Tanning laws We are covering more ground logistically than ever before, but this has help maintain our sales and volume but we are working twice as hard. We need a sale take on internet
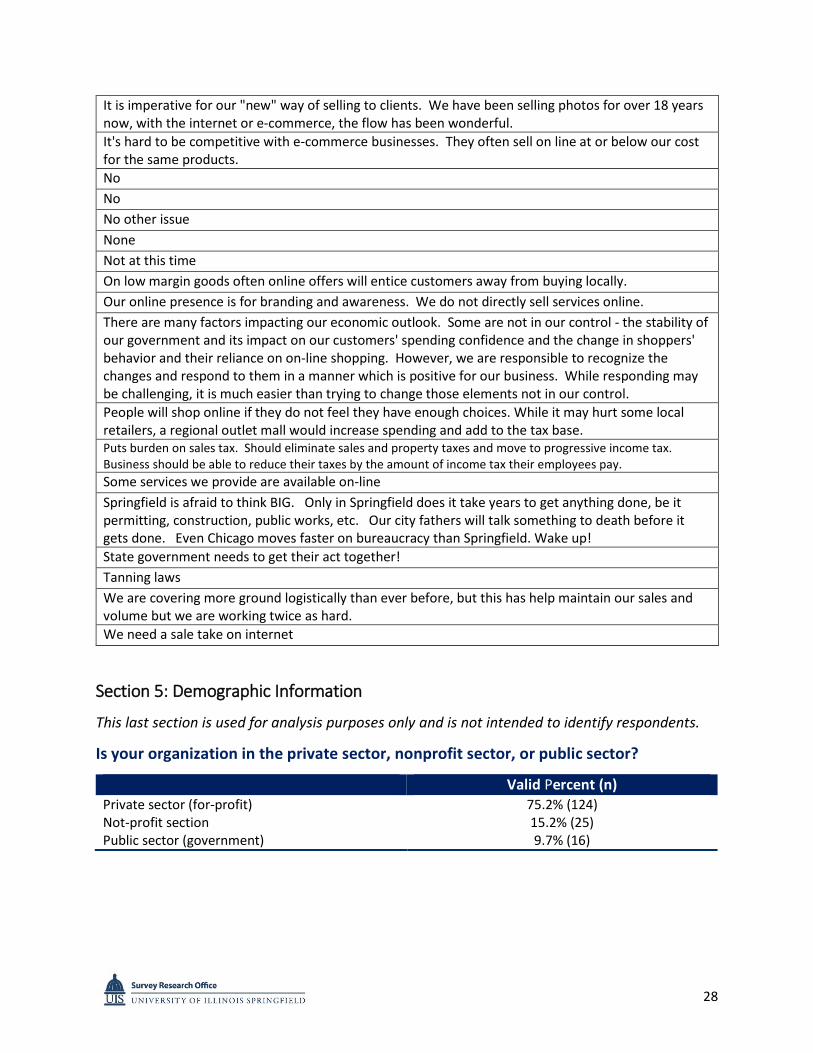
Section 5: Demographic Information
This last section is used for analysis purposes only and is not intended to identify respondents.
Is your organization in the private sector, nonprofit sector, or public sector?
Valid Percent (n) Private sector (for-profit) 75.2% (124) Not-profit section 15.2% (25) Public sector (government) 9.7% (16)
29
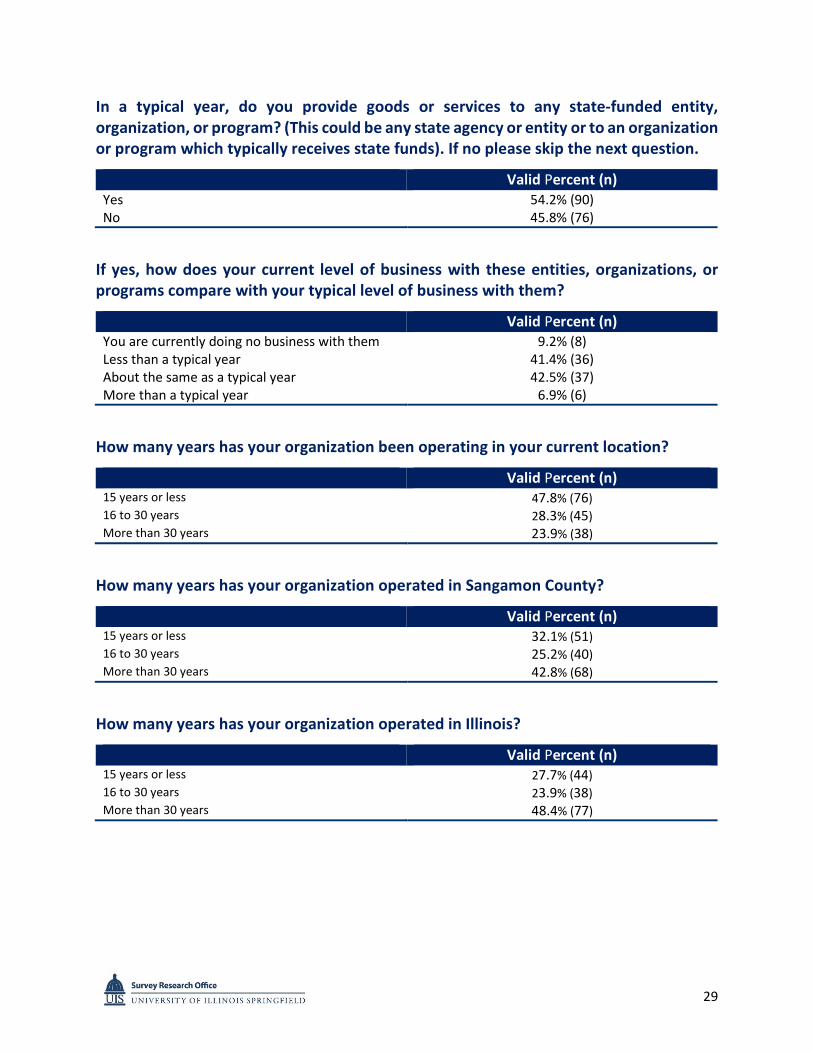
In a typical year, do you provide goods or services to any state-funded entity, organization, or program? (This could be any state agency or entity or to an organization or program which typically receives state funds). If no please skip the next question.
Valid Percent (n) Yes 54.2% (90) No 45.8% (76)
If yes, how does your current level of business with these entities, organizations, or programs compare with your typical level of business with them?
Valid Percent (n) You are currently doing no business with them 9.2% (8) Less than a typical year 41.4% (36) About the same as a typical year 42.5% (37) More than a typical year 6.9% (6)
How many years has your organization been operating in your current location?
Valid Percent (n) 15 years or less 47.8% (76) 16 to 30 years 28.3% (45) More than 30 years 23.9% (38)
How many years has your organization operated in Sangamon County?
Valid Percent (n) 15 years or less 32.1% (51) 16 to 30 years 25.2% (40) More than 30 years 42.8% (68)
How many years has your organization operated in Illinois?
Valid Percent (n) 15 years or less 27.7% (44) 16 to 30 years 23.9% (38) More than 30 years 48.4% (77)

30
Total number full-time employees at your organization:
Valid Percent (n) 20 or less 61.5% (96) 21 to 50 10.9% (17) 51 to 100 11.5% (18) More than 100 16% (25)
31
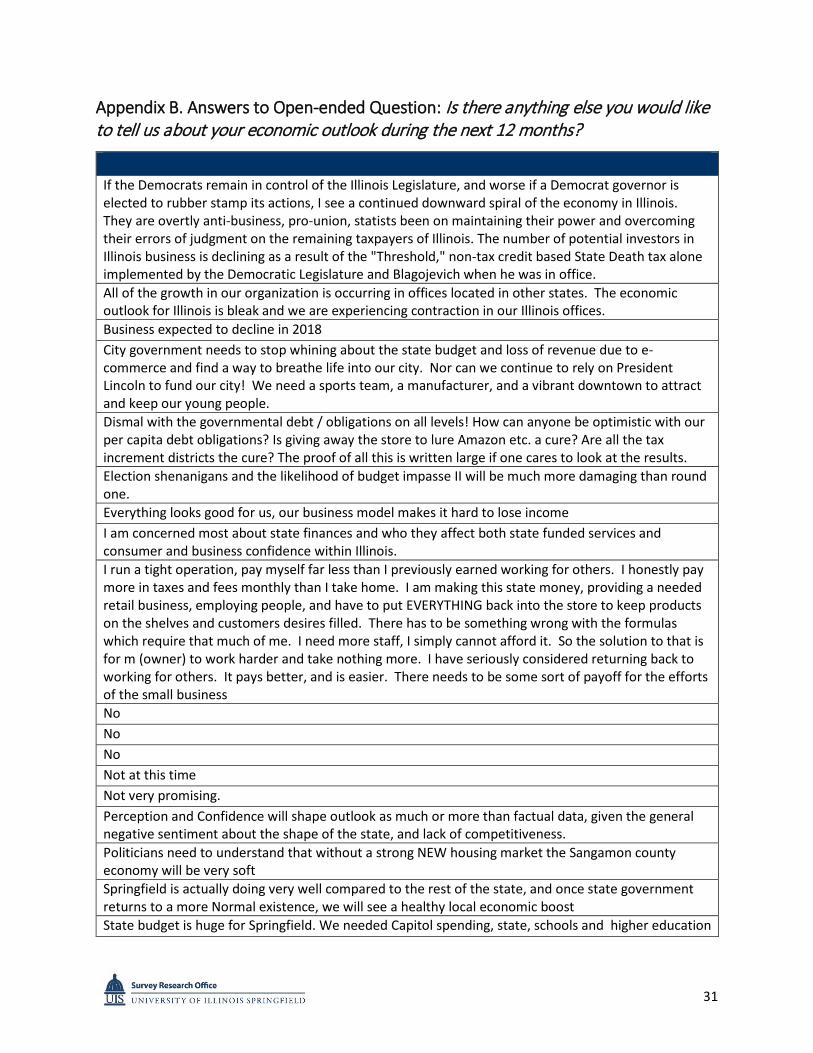
Appendix B. Answers to Open-ended Question: Is there anything else you would like to tell us about your economic outlook during the next 12 months?
If the Democrats remain in control of the Illinois Legislature, and worse if a Democrat governor is elected to rubber stamp its actions, I see a continued downward spiral of the economy in Illinois. They are overtly anti-business, pro-union, statists been on maintaining their power and overcoming their errors of judgment on the remaining taxpayers of Illinois. The number of potential investors in Illinois business is declining as a result of the "Threshold," non-tax credit based State Death tax alone implemented by the Democratic Legislature and Blagojevich when he was in office. All of the growth in our organization is occurring in offices located in other states. The economic outlook for Illinois is bleak and we are experiencing contraction in our Illinois offices. Business expected to decline in 2018 City government needs to stop whining about the state budget and loss of revenue due to e-commerce and find a way to breathe life into our city. Nor can we continue to rely on President Lincoln to fund our city! We need a sports team, a manufacturer, and a vibrant downtown to attract and keep our young people. Dismal with the governmental debt / obligations on all levels! How can anyone be optimistic with our per capita debt obligations? Is giving away the store to lure Amazon etc. a cure? Are all the tax increment districts the cure? The proof of all this is written large if one cares to look at the results. Election shenanigans and the likelihood of budget impasse II will be much more damaging than round one. Everything looks good for us, our business model makes it hard to lose income I am concerned most about state finances and who they affect both state funded services and consumer and business confidence within Illinois. I run a tight operation, pay myself far less than I previously earned working for others. I honestly pay more in taxes and fees monthly than I take home. I am making this state money, providing a needed retail business, employing people, and have to put EVERYTHING back into the store to keep products on the shelves and customers desires filled. There has to be something wrong with the formulas which require that much of me. I need more staff, I simply cannot afford it. So the solution to that is for m (owner) to work harder and take nothing more. I have seriously considered returning back to working for others. It pays better, and is easier. There needs to be some sort of payoff for the efforts of the small business No No No Not at this time Not very promising. Perception and Confidence will shape outlook as much or more than factual data, given the general negative sentiment about the shape of the state, and lack of competitiveness. Politicians need to understand that without a strong NEW housing market the Sangamon county economy will be very soft Springfield is actually doing very well compared to the rest of the state, and once state government returns to a more Normal existence, we will see a healthy local economic boost State budget is huge for Springfield. We needed Capitol spending, state, schools and higher education

32
State budget uncertainty and lack of intentional economic development and planning locally have a negative impact on profitability, business and resident growth, and ability to attract workers to the Springfield area. State of Illinois is still not paying its bills to private sector companies. State finances are continuing to hinder our growth in Sangamon county. We do not anticipate this changing in the foreseeable future. The stagnancy will continue The State of Illinois needs to set the pace, set a good fiscal example and pay for goods and services on time.....not 14, 15, 16 months behind.... The delinquency of payments from the State is rampant and inexcusable. Service and goods cost money, paying employees on time is important and all the State of Illinois does is speak of fiscal responsibility but act irresponsible when meeting its obligations. It's beyond political, it has become an accepted mindset. Abe Lincoln would have ran out of paper by now had he been asked to comment on the state of affairs about the State he loved so much. There are many factors impacting our economic outlook. Some are not in our control - the stability of our government and its impact on our customers' spending confidence and the change in shoppers' behavior and their reliance on on-line shopping. However, we are responsible to recognize the changes and respond to them in a manner which is positive for our business. While responding may be challenging, it is much easier than trying to change those elements not in our control. Very hard to make any predictions for the next 12 months, IMO We are a B to B business. Most small businesses and companies are reluctant to take risks and spend money. Uncertainty over state government finances is probably the cause. We are currently undertaking a close down of our business and selling of all of the equipment, property and assets. We look for a 20% sales increase We need more jobs in our region. Lack of regional growth and even declining employment is hurting our economy. More innovation and leadership is needed. Thank you. We used to be the largest provider of metal office furniture to the State of Illinois. We refuse to sell to them unless the funding comes from other than the General Revenue Fund. It has been so long I find it hard to believe they can function......terrible environment!! We went through a Federal audit that lasted three years. In that three years, they switched auditors three different times. Due to the changes the audit pretty much had to start over each time. This audit cost our company so much time and money (because we had to pay the accountants close to $20,000 over a 3 year period). One of our auditors took over a month long vacation due to a small surgery that should've been healed in one week. There were no problems reported that they found, but it cost us so much time and money. Everybody suffered. We're experiencing the worst year ever. The lack of a state budget for so long makes all aspects of our local economy become more cautious in spending. So not only state workers and retired state workers hesitant to spend, the many associations and not-or-profits as well as all levels of education aren't spending. High level professionals are leaving our state and that affects our business as well. For the first time in my life of owning a business, I am truly concerned about our future success. Yes, your silly survey would not let me tell you how many years our business has been thriving. This is exactly the reason I don’t take these surveys, nothing comes of them. I am quite sure none of you have an idea about our struggles. But, without us none of you have a job. Not sour grapes, just the truth. Try doing what we do sometime.