Embed Size (px)
Citation preview
Fall 2006 Radar Surveys of Nighttime Migration Activity at the Proposed Windpark in Coos County, New Hampshire by Granite Reliable Power, LLC
FINAL October 2007 Prepared For: Granite Reliable Power, LLC and Vermont Environmental Associates 1209 Harvey Farm Road Waterbury Center, VT 05677 Prepared By: Stantec Consulting (formerly Woodlot Alternatives, Inc.) 30 Park Drive Topsham, ME 04086

Fall 2006 Radar Surveys of Nighttime Migration Activity at the Proposed Windpark in Coos County, NH
October 2007 Page i
Executive Summary During fall 2006, Woodlot Alternatives, Inc. conducted a radar survey of nocturnal migration at the proposed windpark in Coos County, New Hampshire. The surveys are part of permitting efforts by Granite Reliable Power, LLC (Granite) for the development of a wind power development at that site. The field investigation included a survey of nighttime activity in the vicinity of the project using radar and represents the first of a set of field investigations planned by Granite at this site. The surveys were conducted from September 9 to October 12, 2006. The overall goal of the survey was to document nocturnal migration in the vicinity of the proposed wind farm, including the number of migrants, their flight direction, and their flight altitude. The results of these field surveys, especially when reviewed along with results of the spring 2007 surveys, will provide useful information about site-specific migration activity and patterns in the vicinity of the project. The fall radar survey targeted 30 nights of radar surveys to collect and record video samples of the radar during horizontal operation, which documents the abundance, flight path, and speed of targets moving through the project area, and vertical operation, which documents the altitude of targets. Nightly passage rates varied from 22 ± 6 targets per kilometer per hour (t/km/hr) to 1,098 ± 177 t/km/hr, with an overall passage rate for the entire survey period of 469 ± 46 t/km/hr. The mean passage rate for this study is generally comparable to other studies conducted during previous years at different locations in the region. Mean flight direction through the project area was to the southwest, 223º ± 57º, which is typical of fall migration in the region. Flight direction varied between nights and was probably due to nightly variation in weather (particularly wind direction and speed). The mean flight height of targets was 455 meters (m) ± 15 m (1,493’ ± 269’) above the radar site. The average nightly flight height ranged from 310 m ± 20 m (1,017’ ± 207’) to 638 m ± 25 m (2,094’ ± 280’). The percent of targets observed flying below 125 m (125’), the approximate maximum height of modern wind turbines, also varied by night, from 0 percent to 5 percent. The seasonal average percentage of targets flying below this height was 1 percent.
Fall 2006 Radar Surveys of Nighttime Migration Activity at the Proposed Windpark in Coos County, NH
October 2007 Page ii
Table of Contents 1.0 INTRODUCTION...............................................................................................................1 2.0 METHODS ........................................................................................................................1
2.1 Field Methods................................................................................................................1 2.2 Data Collection..............................................................................................................4 2.3 Data Analysis ................................................................................................................4
3.0 RESULTS .........................................................................................................................5 3.1 Passage Rates..............................................................................................................5 3.2 Flight Direction ..............................................................................................................6 3.3 Flight Altitude.................................................................................................................7 3.4 Ceilometer and Moonwatching Observations................................................................8
4.0 DISCUSSION....................................................................................................................8 5.0 CONCLUSIONS..............................................................................................................10 6.0 LITERATURE CITED......................................................................................................11 List of Tables Table 1 Summary of available radar survey results List of Figures Figure 1 Radar survey location map Figure 2 Ground clutter in project area Figure 3 Nightly passage rates observed Figure 4 Hourly passage rates for entire season Figure 5 Mean flight direction through the project area Figure 6 Mean nightly flight height of targets Figure 7 Percent of targets observed flying below a height of 125 m (410’) Figure 8 Hourly target flight height distribution List of Appendices Appendix A Radar Survey Summary Data Tables WAI# 106195

Fall 2006 Radar Surveys of Nighttime Migration Activity at the Proposed Windpark in Coos County, NH
October 2007 Page 1
1.0 Introduction Granite Reliable Power, LLC (Granite) has proposed the construction of a wind development located in Coos County, New Hampshire (Figure 1). The project layout would include the erection of up to 67 wind turbines on or near the summits of Mt. Kelsey, Owlhead Mountain, the east side of Whitcomb Mountain, the east side of Long Mountain, and an un-named peak just west of Mt. Patience (herein referred to as Fish Brook Ridge) (the project). The project would include turbine pads, turbines, access roads to and along the ridgelines, and a power collection system. The proposed turbines would have a height of approximately 125 meters (410’). The topography within this region of New Hampshire is mountainous with elevations ranging from approximately 305 m (1,000’) to 1,036 m (3,400’). These mountains occur within a landscape dominated by industrial forestry practices. High elevation spruce-fir forest exists at some of the summits, with the surrounding side slopes and valleys predominately yellow-birch (Betula alleghaniensis), American beech (Fagus grandifolia), and sugar maple (Acer saccharum), species typically found in northern hardwood – conifer forests. Woodlot Alternatives, Inc. (Woodlot), now Stantec Consulting1, conducted a radar survey of nocturnal migration activity in the vicinity of the project during the fall 2006 migration period. This was the first of two seasons of radar surveys planned at this site. The overall goal of the survey was to document nocturnal migration in the vicinity of the project area, including the number of migrants, their flight direction, and their flight altitude.
2.0 Methods
2.1 Field Methods
The radar study was conducted near the northeastern end of the project area (Figure 1). The radar was located across the valley east of Mt. Kelsey and Owlhead Mountain, at an elevation of approximately 610 m (2,000’)2. A marine surveillance radar similar to that described by Cooper et al. (1991) was used during field data collection. The radar has a peak power output of 12 kW and has the ability to track small animals, including birds, bats, and even insects, based on settings selected for the radar functions. It cannot, however, readily distinguish between different types of animals being detected. Consequently, all animals observed on the radar screen are called targets. The radar has an echo trail function that maintains past echoes of trails. During all operations, the radar’s echo trail was set to 30 seconds.
1 On October 1, 2007 Woodlot Alternatives, Inc. was formally acquired by Stantec Consulting, Inc. 2 Efforts were made to locate the radar survey station along one of the ridgelines proposed for development. However, inadequate access and logistical constraints precluded this. Consequently, a lower elevation site near the ridgelines proposed for development was selected.


Fall 2006 Radar Surveys of Nighttime Migration Activity at the Proposed Windpark in Coos County, NH
October 2007 Page 3
The radar was equipped with a 2-m (6.5’) waveguide antenna. The antenna has a vertical beam height of 20º (10º above and below horizontal) and the front end of the antenna was inclined approximately 5º to increase the proportion of the beam directed into the sky. Objects on the ground detected by the radar cause returns on the radar screen (echoes) that appear as blotches called ground clutter. Large amounts of ground clutter reduce the ability of the radar to track birds and bats flying over those areas. However, vegetation and hilltops near the radar can be used to reduce or eliminate ground clutter by ‘hiding’ clutter-causing objects from the radar. These nearby features also cause ground clutter, but their proximity to the radar antenna can limit the ground clutter to the center of the radar screen (Figure 2). The presence of ground clutter and other objects that could reduce clutter were important factors considered during the site selection process.
Figure 2. Ground clutter in project area
Nightly radar surveys were conducted from sunset to sunrise. Thirty nights of surveys were targeted for sampling beginning the night of September 9 and ending the night of October 12, 2006. Because the anti-rain function of the radar must be turned down to detect small songbirds and bats, surveys could not be conducted during periods of inclement weather. Therefore, surveys were targeted largely for nights without rain. However, to characterize nighttime movement patterns during nights without optimal migration conditions, nights with weather forecasts including occasional showers were sampled. The radar was operated in two modes during each hour of each night surveyed. In the first mode, surveillance, the antenna spins horizontally to survey the airspace around the radar and detects targets moving through the area. By analyzing the echo trail, the flight direction of targets can be determined. In the second mode of operation, vertical, the antenna is rotated 90º to vertically survey the airspace above the radar (Harmata et al. 1999). In vertical mode, target
Fall 2006 Radar Surveys of Nighttime Migration Activity at the Proposed Windpark in Coos County, NH
October 2007 Page 4
echoes do not provide directional data but do provide information on the altitude of targets passing through the vertical, 20º radar beam. The radar was operated at a range of 1.4 kilometers (km) (0.75 nautical miles). At this range, the echoes of small birds can be easily detected, observed, and tracked. At greater ranges, larger birds can be detected, but the echoes of small birds are reduced in size and restricted to a smaller portion of the radar screen, reducing the ability to observe the movement pattern of individual targets.
2.2 Data Collection
The radar display was connected to video recording software of a computer. Based on a random sequence for each night, approximately 25 minutes of video samples were recorded during each hour of operation. These included 15 one-minute horizontal samples and 10 one-minute vertical samples. The pattern of randomly recorded horizontal and vertical samples was repeated each hour of the night after sunset and throughout each night surveyed. During each hour, additional information was also recorded, including weather conditions and ceilometer observations. Ceilometer observations involved directing a one-million candlepower spotlight vertically into the sky in a manner similar to that described by Gauthreaux (1969). The ceilometer beam was observed by eye for 5 minutes to document and characterize low-flying (below 125 m [410’]) targets. The ceilometer was held in-hand so that any birds, bats, or insects passing through it could be tracked for several seconds, if needed. Observations from each ceilometer observation period were recorded, including the number of birds, bats, and insects observed. This information was used during data analysis to help characterize activity of insects, birds, and bats.
2.3 Data Analysis
Video samples were analyzed using a digital analysis software tool developed by Woodlot. For horizontal samples, targets were identified as birds and bats rather than insects based on their speed. The speed of targets was corrected for wind speed and direction; targets traveling faster than approximately 6 m per second were identified as a bird or bat target (Larkin 1991, Bruderer and Boldt 2001). The software tool recorded the time, location, and flight vector for each target traveling fast enough to be a bird or bat. The results for each sample were output to a spreadsheet. For vertical samples, the software tool recorded the entry point of targets passing through the vertical radar beam, the time, and flight altitude above the radar location. The results for each sample were output to a spreadsheet. These datasets were then used to calculate passage rate (reported as targets per km of migratory front per hour [t/km/hr]), flight direction, and flight altitude of targets. Mean target flight directions (± 1 circular standard deviation) were summarized using software designed specifically to analyze directional data (Oriana2© Kovach Computing Services). The statistics used for this are based on Batschelet (1965), which take into account the circular nature of the data. Nightly wind direction was also summarized using similar methods using data collected from the Berlin regional airport. Flight altitude data were summarized using linear statistics. Mean flight altitudes (± 1 standard error) were calculated by hour, night, and overall season. The percent of targets flying below
Fall 2006 Radar Surveys of Nighttime Migration Activity at the Proposed Windpark in Coos County, NH
October 2007 Page 5
125 m (410’) (the approximate maximum height of the proposed wind turbines) was also calculated hourly, for each night, and for the entire survey period.
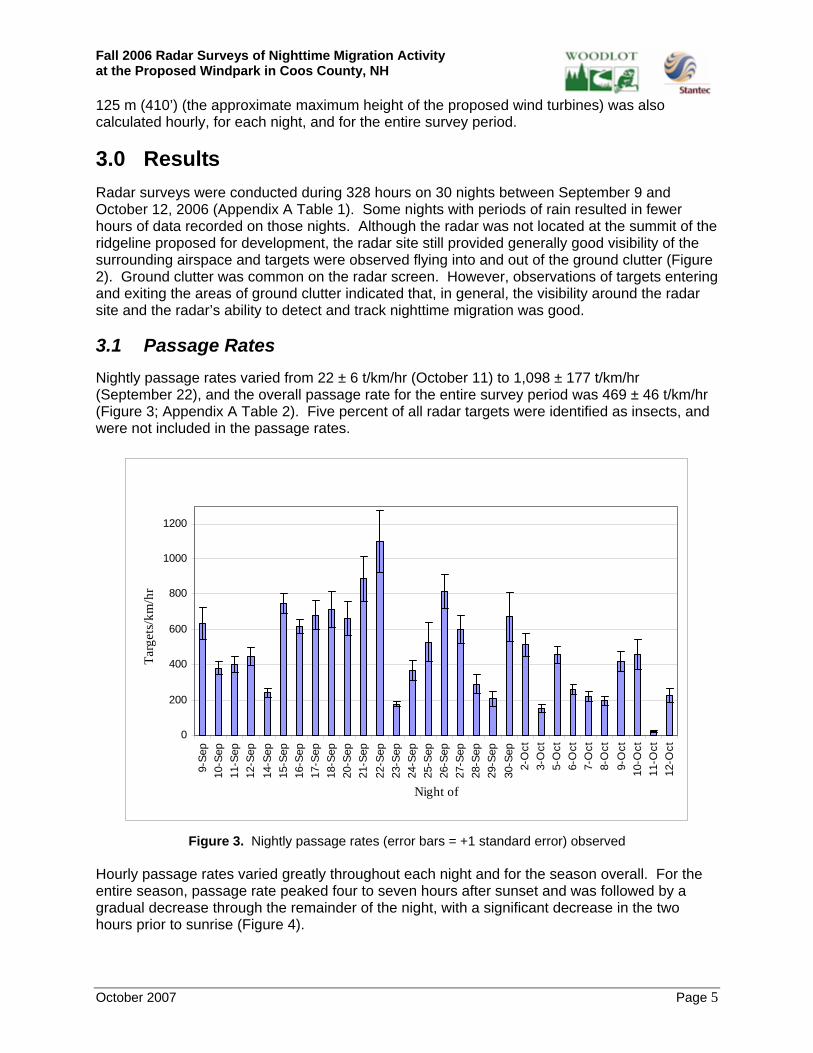
3.0 Results Radar surveys were conducted during 328 hours on 30 nights between September 9 and October 12, 2006 (Appendix A Table 1). Some nights with periods of rain resulted in fewer hours of data recorded on those nights. Although the radar was not located at the summit of the ridgeline proposed for development, the radar site still provided generally good visibility of the surrounding airspace and targets were observed flying into and out of the ground clutter (Figure 2). Ground clutter was common on the radar screen. However, observations of targets entering and exiting the areas of ground clutter indicated that, in general, the visibility around the radar site and the radar’s ability to detect and track nighttime migration was good.
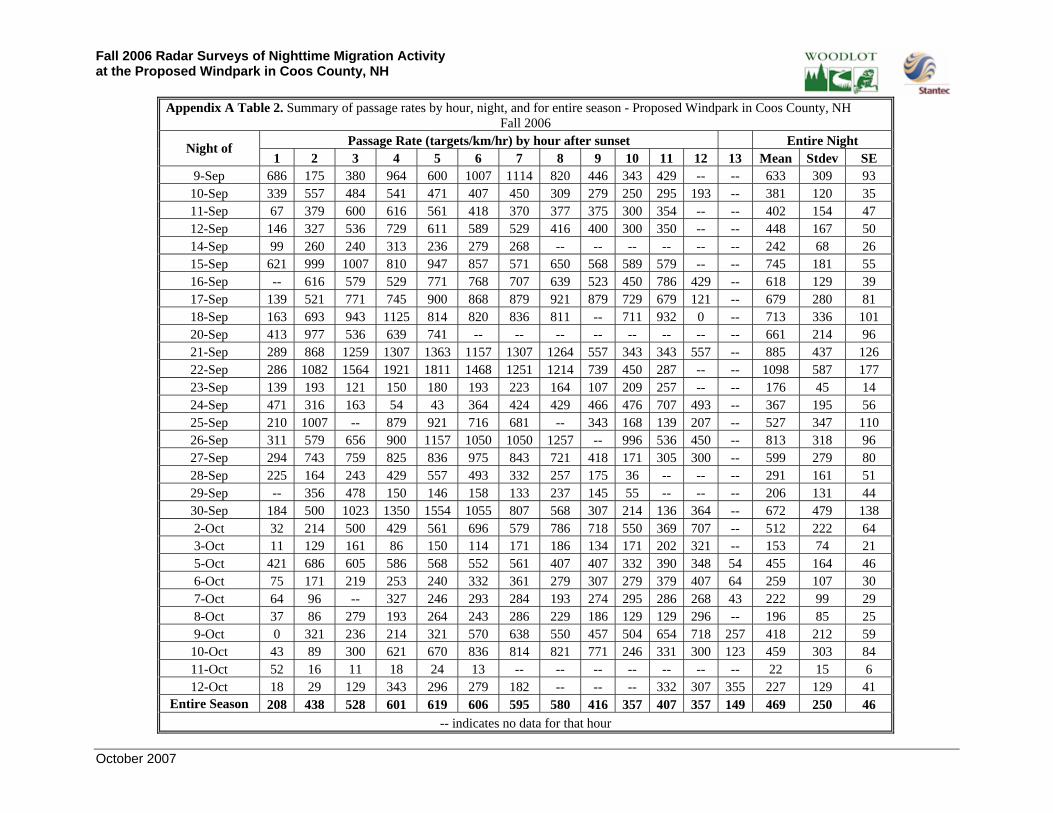
3.1 Passage Rates Nightly passage rates varied from 22 ± 6 t/km/hr (October 11) to 1,098 ± 177 t/km/hr (September 22), and the overall passage rate for the entire survey period was 469 ± 46 t/km/hr (Figure 3; Appendix A Table 2). Five percent of all radar targets were identified as insects, and were not included in the passage rates.
0
200
400
600
800
1000
1200
9-Se
p10
-Sep
11-S
ep12
-Sep
14-S
ep15
-Sep
16-S
ep17
-Sep
18-S
ep20
-Sep
21-S
ep22
-Sep
23-S
ep24
-Sep
25-S
ep26
-Sep
27-S
ep28
-Sep
29-S
ep30
-Sep
2-O
ct3-
Oct
5-O
ct6-
Oct
7-O
ct8-
Oct
9-O
ct10
-Oct
11-O
ct12
-Oct
Night of
Targ
ets/
km/h
r
Figure 3. Nightly passage rates (error bars = +1 standard error) observed
Hourly passage rates varied greatly throughout each night and for the season overall. For the entire season, passage rate peaked four to seven hours after sunset and was followed by a gradual decrease through the remainder of the night, with a significant decrease in the two hours prior to sunrise (Figure 4).
Fall 2006 Radar Surveys of Nighttime Migration Activity at the Proposed Windpark in Coos County, NH
October 2007 Page 6
0
100
200
300
400
500
600
700
1 2 3 4 5 6 7 8 9 10 11 12 13
Hours after Sunset
Targ
ets/
km/h
r
Figure 4. Hourly passage rates for entire season
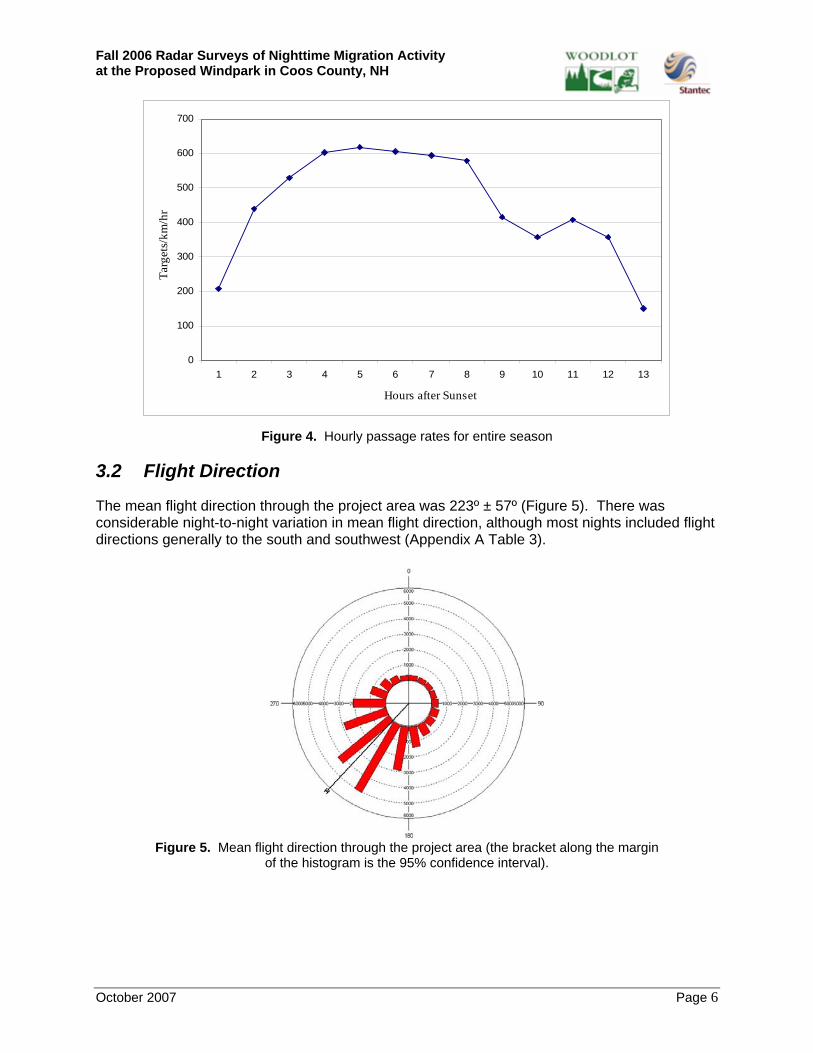
3.2 Flight Direction
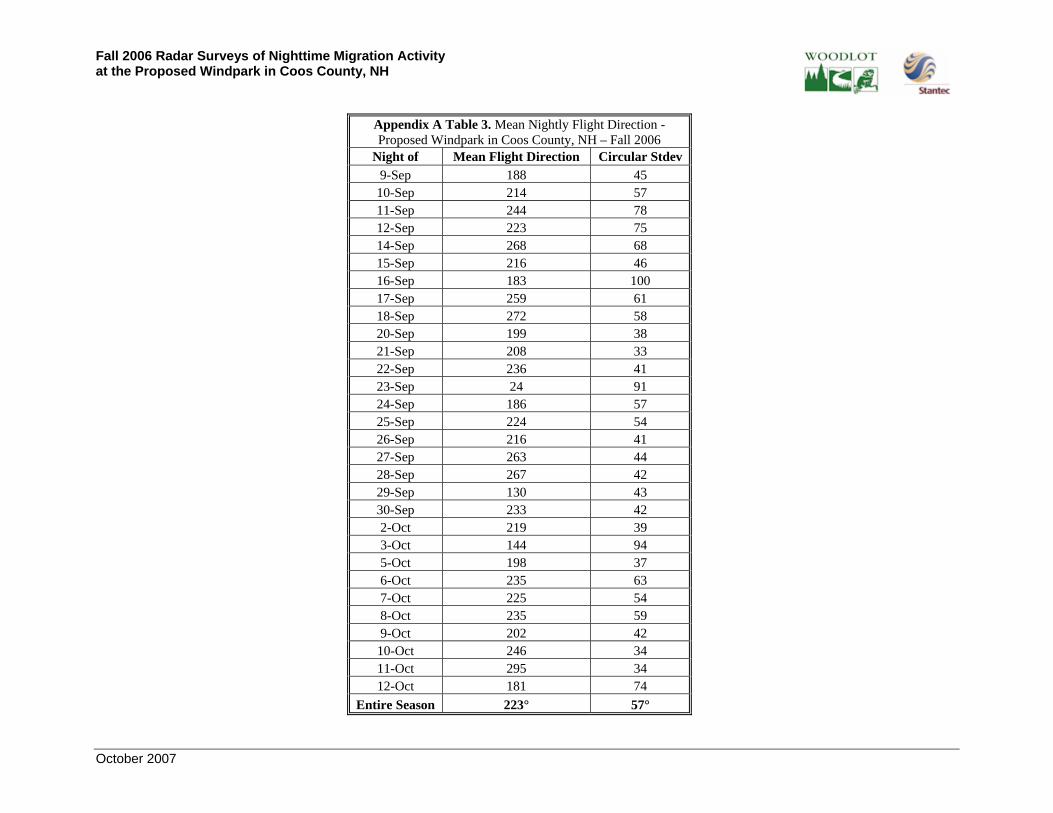
The mean flight direction through the project area was 223º ± 57º (Figure 5). There was considerable night-to-night variation in mean flight direction, although most nights included flight directions generally to the south and southwest (Appendix A Table 3).
Figure 5. Mean flight direction through the project area (the bracket along the margin
of the histogram is the 95% confidence interval).
Fall 2006 Radar Surveys of Nighttime Migration Activity at the Proposed Windpark in Coos County, NH
October 2007 Page 7
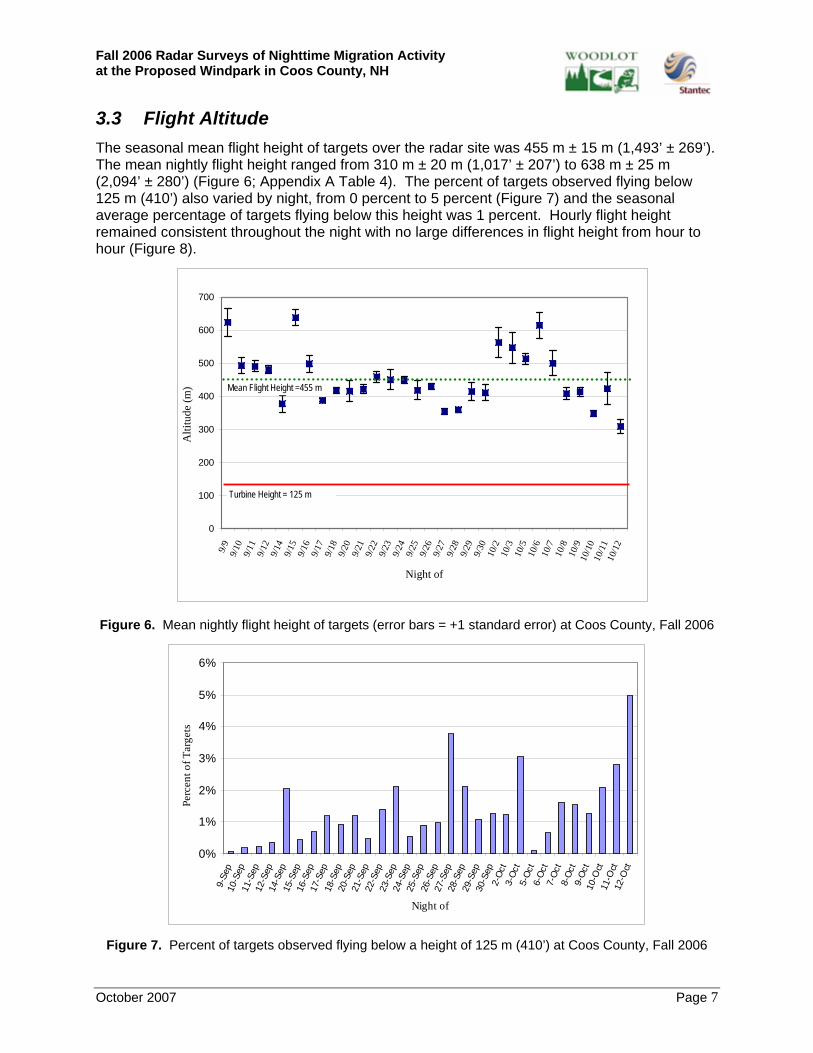
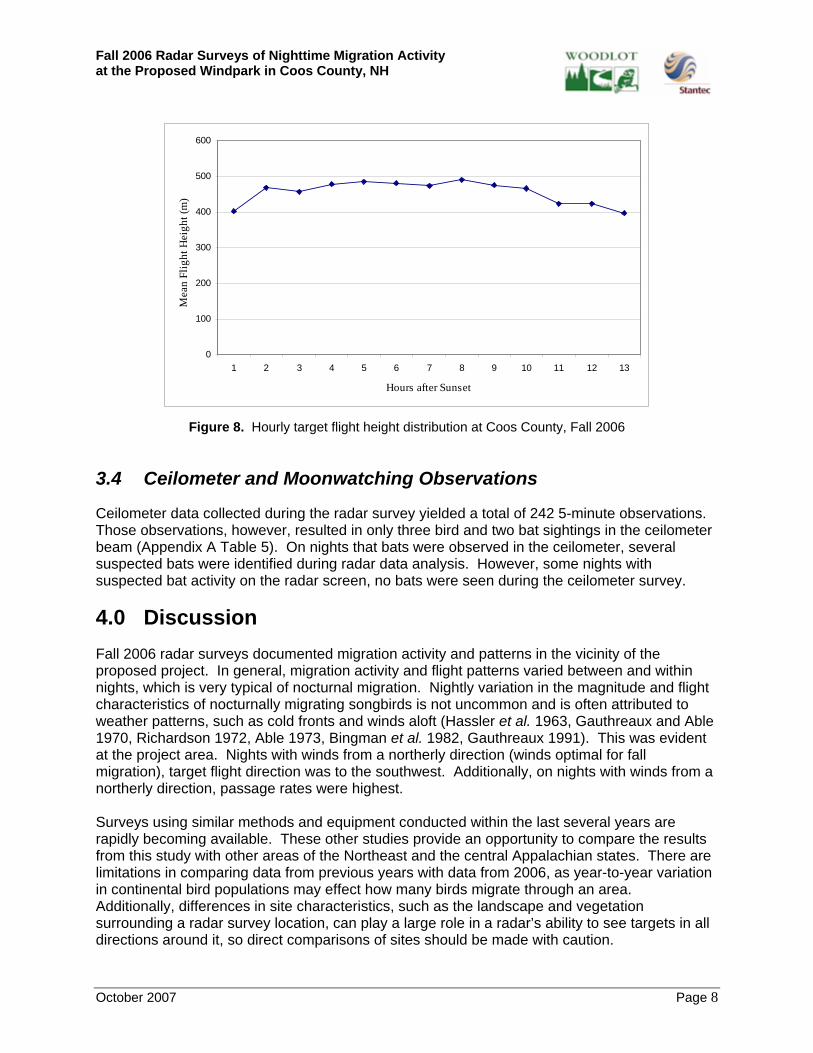
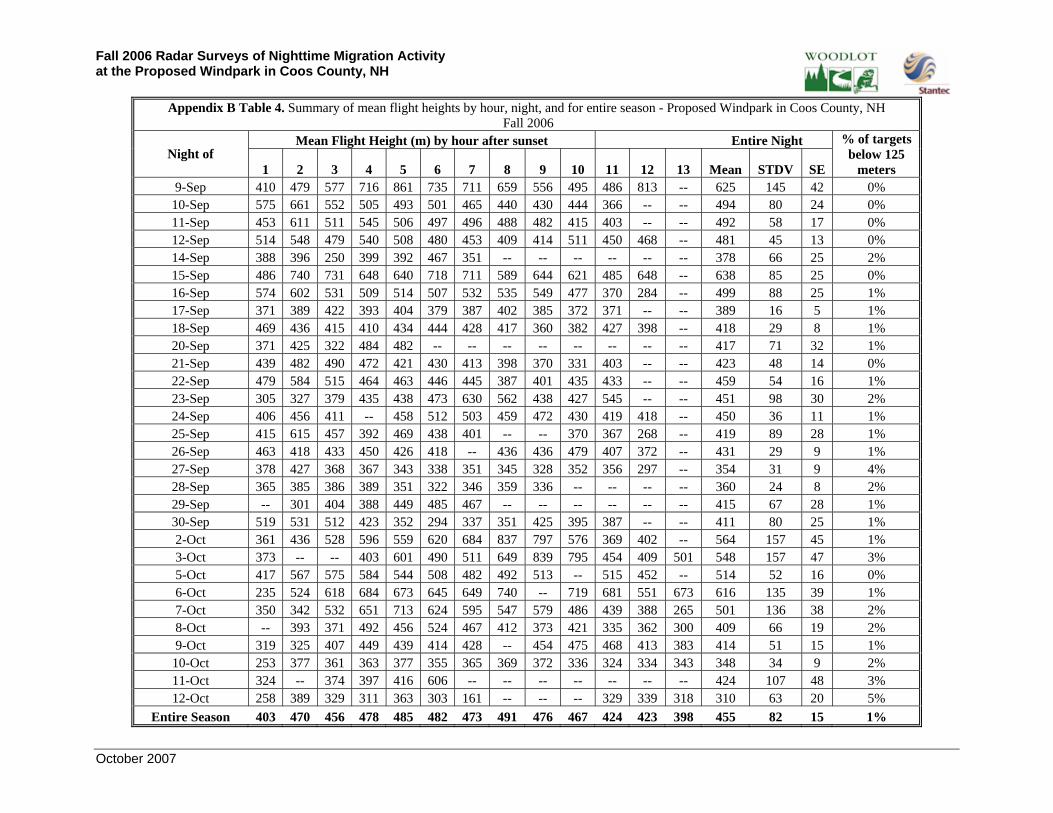
3.3 Flight Altitude The seasonal mean flight height of targets over the radar site was 455 m ± 15 m (1,493’ ± 269’). The mean nightly flight height ranged from 310 m ± 20 m (1,017’ ± 207’) to 638 m ± 25 m (2,094’ ± 280’) (Figure 6; Appendix A Table 4). The percent of targets observed flying below 125 m (410’) also varied by night, from 0 percent to 5 percent (Figure 7) and the seasonal average percentage of targets flying below this height was 1 percent. Hourly flight height remained consistent throughout the night with no large differences in flight height from hour to hour (Figure 8).
0
100
200
300
400
500
600
700
9/9
9/10
9/11
9/12
9/14
9/15
9/16
9/17
9/18
9/20
9/21
9/22
9/23
9/24
9/25
9/26
9/27
9/28
9/29
9/30
10/2
10/3
10/5
10/6
10/7
10/8
10/9
10/1
010
/11
10/1
2
Night of
Alti
tude
(m)
Turbine Height = 125 m
Mean Flight Height =455 m
Figure 6. Mean nightly flight height of targets (error bars = +1 standard error) at Coos County, Fall 2006
0%
1%
2%
3%
4%
5%
6%
9-Se
p10
-Sep
11-S
ep12
-Sep
14-S
ep15
-Sep
16-S
ep17
-Sep
18-S
ep20
-Sep
21-S
ep22
-Sep
23-S
ep24
-Sep
25-S
ep26
-Sep
27-S
ep28
-Sep
29-S
ep30
-Sep
2-Oc
t3-
Oct
5-Oc
t6-
Oct
7-Oc
t8-
Oct
9-Oc
t10
-Oct
11-O
ct12
-Oct
Night of
Perc
ent o
f Tar
gets
Figure 7. Percent of targets observed flying below a height of 125 m (410’) at Coos County, Fall 2006
Fall 2006 Radar Surveys of Nighttime Migration Activity at the Proposed Windpark in Coos County, NH
October 2007 Page 8
0
100
200
300
400
500
600
1 2 3 4 5 6 7 8 9 10 11 12 13
Hours after Sunset
Mea
n Fl
ight
Hei
ght (
m)
Figure 8. Hourly target flight height distribution at Coos County, Fall 2006
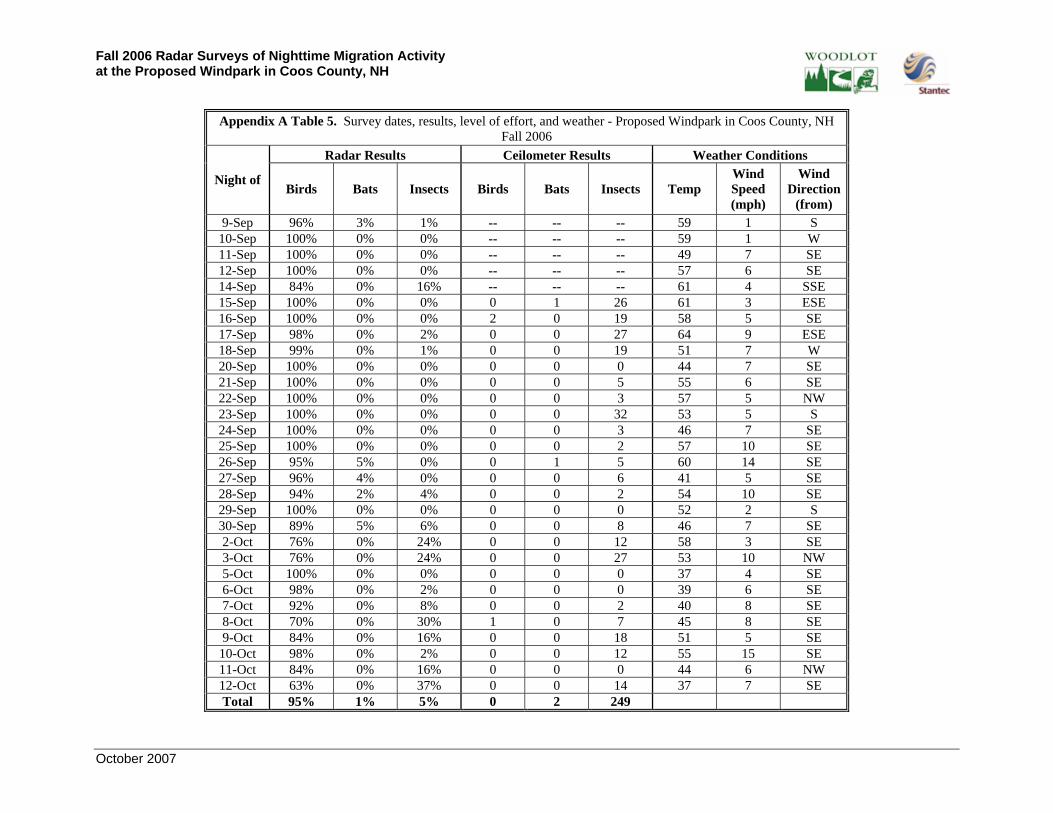
3.4 Ceilometer and Moonwatching Observations
Ceilometer data collected during the radar survey yielded a total of 242 5-minute observations. Those observations, however, resulted in only three bird and two bat sightings in the ceilometer beam (Appendix A Table 5). On nights that bats were observed in the ceilometer, several suspected bats were identified during radar data analysis. However, some nights with suspected bat activity on the radar screen, no bats were seen during the ceilometer survey.
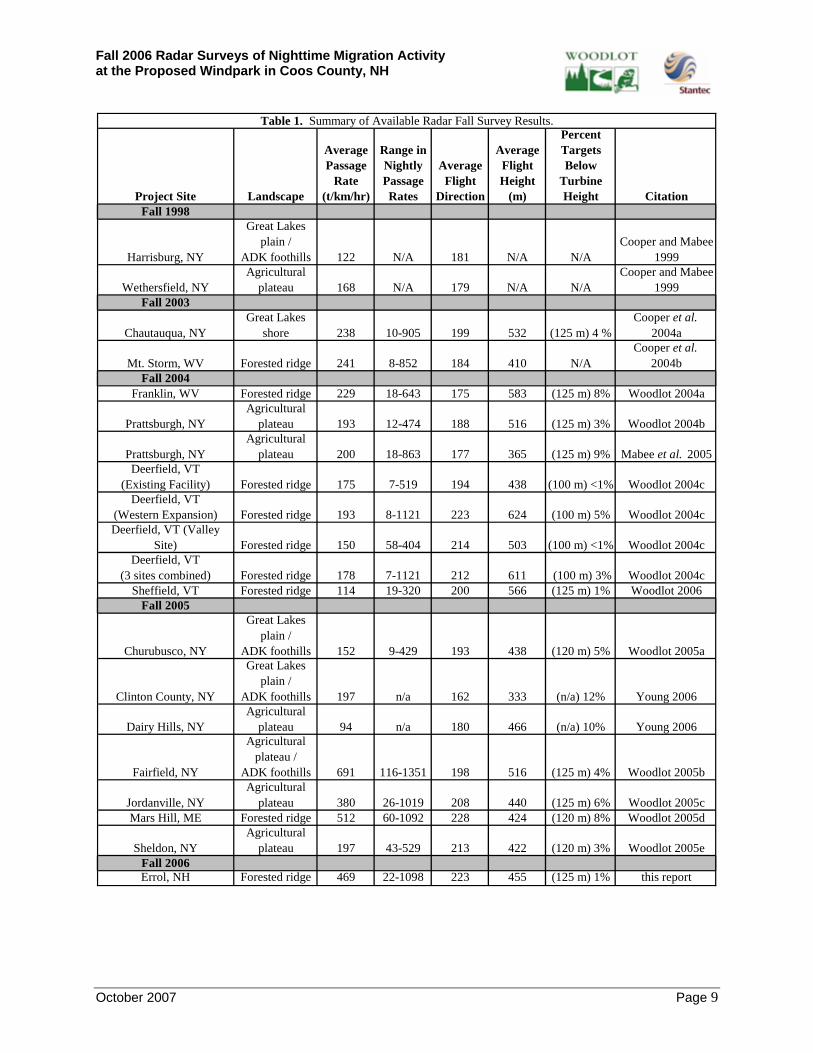
4.0 Discussion Fall 2006 radar surveys documented migration activity and patterns in the vicinity of the proposed project. In general, migration activity and flight patterns varied between and within nights, which is very typical of nocturnal migration. Nightly variation in the magnitude and flight characteristics of nocturnally migrating songbirds is not uncommon and is often attributed to weather patterns, such as cold fronts and winds aloft (Hassler et al. 1963, Gauthreaux and Able 1970, Richardson 1972, Able 1973, Bingman et al. 1982, Gauthreaux 1991). This was evident at the project area. Nights with winds from a northerly direction (winds optimal for fall migration), target flight direction was to the southwest. Additionally, on nights with winds from a northerly direction, passage rates were highest. Surveys using similar methods and equipment conducted within the last several years are rapidly becoming available. These other studies provide an opportunity to compare the results from this study with other areas of the Northeast and the central Appalachian states. There are limitations in comparing data from previous years with data from 2006, as year-to-year variation in continental bird populations may effect how many birds migrate through an area. Additionally, differences in site characteristics, such as the landscape and vegetation surrounding a radar survey location, can play a large role in a radar’s ability to see targets in all directions around it, so direct comparisons of sites should be made with caution.
Fall 2006 Radar Surveys of Nighttime Migration Activity at the Proposed Windpark in Coos County, NH
October 2007 Page 9
Project Site Landscape
Average Passage
Rate (t/km/hr)
Range in Nightly Passage Rates
Average Flight
Direction
Average Flight Height
(m)
PercentTargetsBelow
TurbineHeight Citation
Fall 1998
Harrisburg, NY
Great Lakes plain /
ADK foothills 122 N/A 181 N/A N/ACooper and Mabee
1999
Wethersfield, NYAgricultural
plateau 168 N/A 179 N/A N/ACooper and Mabee
1999Fall 2003
Chautauqua, NYGreat Lakes
shore 238 10-905 199 532 (125 m) 4 %Cooper et al.
2004a
Mt. Storm, WV Forested ridge 241 8-852 184 410 N/ACooper et al.
2004bFall 2004
Franklin, WV Forested ridge 229 18-643 175 583 (125 m) 8% Woodlot 2004a
Prattsburgh, NYAgricultural
plateau 193 12-474 188 516 (125 m) 3% Woodlot 2004b
Prattsburgh, NYAgricultural
plateau 200 18-863 177 365 (125 m) 9% Mabee et al. 2005Deerfield, VT
(Existing Facility) Forested ridge 175 7-519 194 438 (100 m) <1% Woodlot 2004cDeerfield, VT
(Western Expansion) Forested ridge 193 8-1121 223 624 (100 m) 5% Woodlot 2004cDeerfield, VT (Valley
Site) Forested ridge 150 58-404 214 503 (100 m) <1% Woodlot 2004cDeerfield, VT
(3 sites combined) Forested ridge 178 7-1121 212 611 (100 m) 3% Woodlot 2004cSheffield, VT Forested ridge 114 19-320 200 566 (125 m) 1% Woodlot 2006
Fall 2005
Churubusco, NY
Great Lakes plain /
ADK foothills 152 9-429 193 438 (120 m) 5% Woodlot 2005a
Clinton County, NY
Great Lakes plain /
ADK foothills 197 n/a 162 333 (n/a) 12% Young 2006
Dairy Hills, NYAgricultural
plateau 94 n/a 180 466 (n/a) 10% Young 2006
Fairfield, NY
Agricultural plateau /
ADK foothills 691 116-1351 198 516 (125 m) 4% Woodlot 2005b
Jordanville, NYAgricultural
plateau 380 26-1019 208 440 (125 m) 6% Woodlot 2005cMars Hill, ME Forested ridge 512 60-1092 228 424 (120 m) 8% Woodlot 2005d
Sheldon, NYAgricultural
plateau 197 43-529 213 422 (120 m) 3% Woodlot 2005eFall 2006Errol, NH Forested ridge 469 22-1098 223 455 (125 m) 1% this report
Table 1. Summary of Available Radar Fall Survey Results.
Fall 2006 Radar Surveys of Nighttime Migration Activity at the Proposed Windpark in Coos County, NH
October 2007 Page 10
Some research suggests that bird migration may be affected by landscape features, such as coastlines, large river valleys, and mountain ranges. This has been documented for diurnally migrating birds, such as raptors, but is not as well established for nocturnally migrating birds (Sielman et al. 1981; Bingman et al. 1982; Bruderer and Jenni 1990; Richardson 1998; Fortin et al. 1999; Williams et al. 2001; Diehl et al. 2003; Woodlot, unpublished data). The landscape in the project area is of mountainous terrain. The overall elevation differential across the site is approximately 305 m (1,000’) to 1,036 m (3,400’). This differential is fairly considerable when comparing to other sites in the northeast that are at lower elevation. The mean flight height of 455 ± 15 suggests some migrants might fly below ridgelines while others might be flying well above the ridgelines in the area. The emerging body of studies characterizing nighttime bird movements shows a relatively consistent trend in regards to the altitude at which night migrants fly (Table 1). In general, nighttime migration typically occurs several hundred meters or more above the ground. The range in mean flight heights is approximately 300 to 600 m (1,000’ to 2,000’) above the ground. The percentage of targets documented at heights below that of modern wind turbines is variable, but is typically 3 to 15 percent. Some studies, however, have documented even smaller percentages of targets below turbine height. The average flight height documented in Coos County (455 m, or 1,493’) is well within the range of other studies in the region and the percent flying below maximum turbine height is much lower than at other studies.
5.0 Conclusions Radar surveys during the fall 2006 migration period have provided information on nocturnal bird migration patterns in the vicinity of the project area. The results of the surveys indicate that bird migration patterns are generally similar to patterns observed at other sites in the region. Migration activity varied throughout the season, which is largely attributable to weather patterns. The mean passage rate was comparable to passage rates documented at other recent studies in the region, indicating that migration activity over the project is not particularly unique. Additionally, the flight height data indicate that the majority of migration during the fall survey period took place well above the height of the proposed turbines over the radar station.

Fall 2006 Radar Surveys of Nighttime Migration Activity at the Proposed Windpark in Coos County, NH
October 2007 Page 11
6.0 Literature Cited Able, K.P. 1973. The role of weather variables and flight direction in determining the magnitude
of nocturnal migration. Ecology 54(5):1031-1041.
Batschelet, E. 1965. Statistical Methods for the Analysis of Problems in Animal Orientation and Certain Biological Rhythms. AIBS Monograph. American Institute of Biological Sciences. Washington, DC.
Bingman, V.P., K.P. Able, and P. Kerlinger. 1982. Wind drift, compensation, and the use of landmarks by nocturnal bird migrants. Animal Behavior 30:49-53.
Bruderer, B., and A. Boldt. 2001. Flight characteristics of birds: I. Radar measurements of speeds. Ibis. 143:178-204.
Bruderer, B., and L. Jenni. 1990. Migration across the Alps. In Bird Migration: Physiology and Ecophysiology (E. Gwinner, Ed.). Springer Verlag, Berlin.
Cooper, B.A., A.A. Stickney, and T.J. Mabee. 2004a. A radar study of nocturnal bird migration at the proposed Chautauqua wind energy facility, New York, Fall 2003.
Cooper, B.A., and T. Mabee. 1999. Bird migration near proposed wind turbine sites at Wethersfield and Harrisburg, New York. Niagara Mohawk Power Corporation, Syracuse, NY.
Cooper, B.A., R.H. Day, R.J. Ritchie, and C.L. Cranor. 1991. An improved marine radar system for studies of bird migration. Journal of Field Ornithology 62:367-377.
Cooper, B.A., T. Mabee, and J. Plissner. 2004b. Radar study of nocturnal bird migration at the proposed Mount Storm wind power development, West Virginia, Fall 2003. Appendix in: Baseline Avian studies Mount Storm wind power project, Grant County, West Virginia, final report April 2004. Prepared for NedPower Mount Storm, LLC.
Diehl, R., R. Larkin, and J. Black. 2003. Radar observations of bird migration over the Great Lakes. The Auk 120(2):278-290.
Fortin, D., F. Liechti, and B. Bruderer. 1999. Variation in the nocturnal flight behaviour of migratory birds along the northwest coast of the Mediterranean Sea. Ibis 141:480-488.
Gauthreaux, S.A., Jr. 1969. A Portable ceilometer technique for studying low-level nocturnal migration. Bird-Banding 40(4):309-320.
Gauthreaux, S.A., Jr. 1991. The flight behavior of migrating birds in changing wind fields: radar and visual analyses. American Zoologist 31:187-204.
Gauthreaux, S.A., Jr., and K.P. Able. 1970. Wind and the direction of nocturnal songbird migration. Nature 228:476-477.
Harmata, A., K. Podruzny, J. Zelenak, and M. Morrison. 1999. Using marine surveillance radar to study bird movements and impact assessment. Wildlife Society Bulletin 27(1):44-52.
Fall 2006 Radar Surveys of Nighttime Migration Activity at the Proposed Windpark in Coos County, NH
October 2007 Page 12
Hassler, S.S., R.R. Graber, and F.C. Bellrose. 1963. Fall migration and weather, a radar study. The Wilson Bulletin 75(1):56-77.
Larkin, R.P. 1991. Flight speeds observed with radar, a correction: slow “birds” are insects. Behavioral Ecology and Sociobiology. 29:221-224.
Mabee, T.J., J.H. Plissner, and B.A. Cooper. 2005. A Radar and Visual Study of Nocturnal Bird and Bat Migration at the Proposed Prattsburgh-Italy Wind Power Project, New York, Fall 2004. Final Report prepared for Ecogen LLC, March 2005.
Richardson, W.J. 1972. Autumn migration and weather in eastern Canada: a radar study. American Birds 26(1):10-16.
Richardson, W.J. 1998. Bird migration and wind turbines: migration timing, flight behavior, and collision risk. Proceedings: National Avian-Wind Power Planning Meeting III, sponsored by Avian Workgroup of the National Wind Coordinating Committee, June 2000.
Sielman, M., L. Sheriff, and T. Williams. 1981. Nocturnal Migration at Hawk Mountain, Pennsylvania. American Birds 35(6):906-909.
Williams, T.C., J.M. Williams, P.G. Williams, and P. Stokstad. 2001. Bird migration through a mountain pass studied with high resolution radar, ceilometers, and census. The Auk 118(2):389-403.
Woodlot Alternatives, Inc. 2004a. A Radar and Acoustic Survey of Bird and Bat Migration at the Proposed Liberty Gap Wind Project in Franklin, West Virginia – Fall, 2004. Prepared for US Wind Force, LLC.
Woodlot Alternatives, Inc. 2004b. A Fall 2004 Radar, Visual, and Acoustic Survey of Bird and Bat Migration at the Proposed Windfarm Prattsburgh Project in Prattsburgh, New York. Prepared for UPC Wind Management, LLC.
Woodlot Alternatives, Inc. 2004c. Fall 2004 Avian Migration Surveys at the Proposed Deerfield Wind/Searsburg Expansion Project in Searsburg and Readsboro, Vermont. Prepared for Deerfield Wind, LLC and Vermont Environmental Research Associates.
Woodlot Alternatives, Inc. 2005a. A Fall 2005 Radar, Visual, and Acoustic Survey of Bird and Bat Migration at the Proposed Marble River Wind Project in Clinton and Ellenburg, New York. Prepared for AES Corporation.
Woodlot Alternatives, Inc. 2005b. A Fall 2005 Radar Survey of Bird and Bat Migration at the Proposed Top Notch Wind Project in Fairfield, New York. Prepared for PPM Atlantic Renewable.
Woodlot Alternatives, Inc. 2005c. A Fall 2005 Radar and Acoustic Survey of Bird and Bat Migration at the Proposed Jordanville Wind Project in Jordanville, New York. Prepared for Community Energy, Inc.
Woodlot Alternatives, Inc. 2005d. A Fall 2005 Radar, Visual, and Acoustic Survey of Bird and Bat Migration at the Proposed Mars Hill Wind Project in Mars Hill, Maine. Prepared for UPC Wind Management, LLC.
Fall 2006 Radar Surveys of Nighttime Migration Activity at the Proposed Windpark in Coos County, NH
October 2007 Page 13
Woodlot Alternatives, Inc. 2005e. A Fall 2005 Radar, Visual, and Acoustic Survey of Bird and Bat Migration at the Proposed High Sheldon Wind Project in Sheldon, New York. Prepared for Invenergy.
Woodlot Alternatives, Inc. 2006. Avian and Bat Information Summary and Risk Assessment for the Proposed Sheffield Wind Power Project in Sheffield, Vermont. Prepared for UPC Wind Management, LLC.
Young, D. 2006. Wildlife Issue Solutions: What Have Marine Radar Surveys Taught Us About
Wildlife Risk Assessment? Presented at Windpower 2006 Conference and Exhibition. June 4-7, 2006. Pittsburgh, PA.

Fall 2006 Radar Surveys of Nighttime Migration Activity at the Proposed Windpark in Coos County, NH
October 2007
Appendix A
Radar Survey Summary Data Tables

Fall 2006 Radar Surveys of Nighttime Migration Activity at the Proposed Windpark in Coos County, NH
October 2007
Appendix A Table 1. Survey dates, results, level of effort, and weather - Proposed Windpark in Coos County, NH – Fall 2006
Date Passage rate Flight Direction Flight Height (m)
Hours of Survey Temperature (F) Wind Speed
(mph) Wind Direction
(from)
9-Sep 633 188 625 11 52 4 NW 10-Sep 381 214 494 12 37 0 N/A 11-Sep 402 244 492 11 36 0 N/A 12-Sep 448 223 481 11 38 0 N/A 14-Sep 242 268 378 7 58 0 SSE 15-Sep 745 216 638 11 57 0 0 16-Sep 618 183 499 11 51 0 0 17-Sep 679 259 389 12 49 0 0 18-Sep 713 272 418 11 50 0 0 20-Sep 661 199 417 5 49 3 NW 21-Sep 885 208 423 12 45 1 NW 22-Sep 1098 236 459 11 45 0 N 23-Sep 176 24 451 11 54 0 W 24-Sep 367 186 450 12 53 6 NW 25-Sep 527 224 419 10 41 1 NW 26-Sep 813 216 431 11 33 0 SW 27-Sep 599 263 354 12 38 0 SE 28-Sep 291 267 360 10 55 10 SE 29-Sep 206 130 415 9 42 3 West 30-Sep 672 233 411 12 46 3 ESE 2-Oct 512 219 564 12 40 0 NNW 3-Oct 153 144 548 12 58 1 W 5-Oct 455 198 514 13 32 0 N 6-Oct 259 235 616 13 29 0 0 7-Oct 222 225 501 12 29 0 0 8-Oct 196 235 409 12 33 0 0 9-Oct 418 202 414 13 40 0 SW 10-Oct 459 246 348 13 N/A N/A N/A 11-Oct 22 295 424 6 51 4 W 12-Oct 227 181 310 10 41 2 W
Fall 2006 Radar Surveys of Nighttime Migration Activity at the Proposed Windpark in Coos County, NH
October 2007
Appendix A Table 2. Summary of passage rates by hour, night, and for entire season - Proposed Windpark in Coos County, NH Fall 2006
Passage Rate (targets/km/hr) by hour after sunset Entire Night Night of 1 2 3 4 5 6 7 8 9 10 11 12 13 Mean Stdev SE
9-Sep 686 175 380 964 600 1007 1114 820 446 343 429 -- -- 633 309 93 10-Sep 339 557 484 541 471 407 450 309 279 250 295 193 -- 381 120 35 11-Sep 67 379 600 616 561 418 370 377 375 300 354 -- -- 402 154 47 12-Sep 146 327 536 729 611 589 529 416 400 300 350 -- -- 448 167 50 14-Sep 99 260 240 313 236 279 268 -- -- -- -- -- -- 242 68 26 15-Sep 621 999 1007 810 947 857 571 650 568 589 579 -- -- 745 181 55 16-Sep -- 616 579 529 771 768 707 639 523 450 786 429 -- 618 129 39 17-Sep 139 521 771 745 900 868 879 921 879 729 679 121 -- 679 280 81 18-Sep 163 693 943 1125 814 820 836 811 -- 711 932 0 -- 713 336 101 20-Sep 413 977 536 639 741 -- -- -- -- -- -- -- -- 661 214 96 21-Sep 289 868 1259 1307 1363 1157 1307 1264 557 343 343 557 -- 885 437 126 22-Sep 286 1082 1564 1921 1811 1468 1251 1214 739 450 287 -- -- 1098 587 177 23-Sep 139 193 121 150 180 193 223 164 107 209 257 -- -- 176 45 14 24-Sep 471 316 163 54 43 364 424 429 466 476 707 493 -- 367 195 56 25-Sep 210 1007 -- 879 921 716 681 -- 343 168 139 207 -- 527 347 110 26-Sep 311 579 656 900 1157 1050 1050 1257 -- 996 536 450 -- 813 318 96 27-Sep 294 743 759 825 836 975 843 721 418 171 305 300 -- 599 279 80 28-Sep 225 164 243 429 557 493 332 257 175 36 -- -- -- 291 161 51 29-Sep -- 356 478 150 146 158 133 237 145 55 -- -- -- 206 131 44 30-Sep 184 500 1023 1350 1554 1055 807 568 307 214 136 364 -- 672 479 138 2-Oct 32 214 500 429 561 696 579 786 718 550 369 707 -- 512 222 64 3-Oct 11 129 161 86 150 114 171 186 134 171 202 321 -- 153 74 21 5-Oct 421 686 605 586 568 552 561 407 407 332 390 348 54 455 164 46 6-Oct 75 171 219 253 240 332 361 279 307 279 379 407 64 259 107 30 7-Oct 64 96 -- 327 246 293 284 193 274 295 286 268 43 222 99 29 8-Oct 37 86 279 193 264 243 286 229 186 129 129 296 -- 196 85 25 9-Oct 0 321 236 214 321 570 638 550 457 504 654 718 257 418 212 59 10-Oct 43 89 300 621 670 836 814 821 771 246 331 300 123 459 303 84 11-Oct 52 16 11 18 24 13 -- -- -- -- -- -- -- 22 15 6 12-Oct 18 29 129 343 296 279 182 -- -- -- 332 307 355 227 129 41
Entire Season 208 438 528 601 619 606 595 580 416 357 407 357 149 469 250 46 -- indicates no data for that hour
Fall 2006 Radar Surveys of Nighttime Migration Activity at the Proposed Windpark in Coos County, NH
October 2007
Appendix A Table 3. Mean Nightly Flight Direction - Proposed Windpark in Coos County, NH – Fall 2006
Night of Mean Flight Direction Circular Stdev 9-Sep 188 45 10-Sep 214 57 11-Sep 244 78 12-Sep 223 75 14-Sep 268 68 15-Sep 216 46 16-Sep 183 100 17-Sep 259 61 18-Sep 272 58 20-Sep 199 38 21-Sep 208 33 22-Sep 236 41 23-Sep 24 91 24-Sep 186 57 25-Sep 224 54 26-Sep 216 41 27-Sep 263 44 28-Sep 267 42 29-Sep 130 43 30-Sep 233 42 2-Oct 219 39 3-Oct 144 94 5-Oct 198 37 6-Oct 235 63 7-Oct 225 54 8-Oct 235 59 9-Oct 202 42 10-Oct 246 34 11-Oct 295 34 12-Oct 181 74
Entire Season 223° 57°
Fall 2006 Radar Surveys of Nighttime Migration Activity at the Proposed Windpark in Coos County, NH
October 2007
Appendix B Table 4. Summary of mean flight heights by hour, night, and for entire season - Proposed Windpark in Coos County, NH Fall 2006
Mean Flight Height (m) by hour after sunset Entire Night Night of
1 2 3 4 5 6 7 8 9 10 11 12 13 Mean STDV SE
% of targets below 125
meters 9-Sep 410 479 577 716 861 735 711 659 556 495 486 813 -- 625 145 42 0% 10-Sep 575 661 552 505 493 501 465 440 430 444 366 -- -- 494 80 24 0% 11-Sep 453 611 511 545 506 497 496 488 482 415 403 -- -- 492 58 17 0% 12-Sep 514 548 479 540 508 480 453 409 414 511 450 468 -- 481 45 13 0% 14-Sep 388 396 250 399 392 467 351 -- -- -- -- -- -- 378 66 25 2% 15-Sep 486 740 731 648 640 718 711 589 644 621 485 648 -- 638 85 25 0% 16-Sep 574 602 531 509 514 507 532 535 549 477 370 284 -- 499 88 25 1% 17-Sep 371 389 422 393 404 379 387 402 385 372 371 -- -- 389 16 5 1% 18-Sep 469 436 415 410 434 444 428 417 360 382 427 398 -- 418 29 8 1% 20-Sep 371 425 322 484 482 -- -- -- -- -- -- -- -- 417 71 32 1% 21-Sep 439 482 490 472 421 430 413 398 370 331 403 -- -- 423 48 14 0% 22-Sep 479 584 515 464 463 446 445 387 401 435 433 -- -- 459 54 16 1% 23-Sep 305 327 379 435 438 473 630 562 438 427 545 -- -- 451 98 30 2% 24-Sep 406 456 411 -- 458 512 503 459 472 430 419 418 -- 450 36 11 1% 25-Sep 415 615 457 392 469 438 401 -- -- 370 367 268 -- 419 89 28 1% 26-Sep 463 418 433 450 426 418 -- 436 436 479 407 372 -- 431 29 9 1% 27-Sep 378 427 368 367 343 338 351 345 328 352 356 297 -- 354 31 9 4% 28-Sep 365 385 386 389 351 322 346 359 336 -- -- -- -- 360 24 8 2% 29-Sep -- 301 404 388 449 485 467 -- -- -- -- -- -- 415 67 28 1% 30-Sep 519 531 512 423 352 294 337 351 425 395 387 -- -- 411 80 25 1% 2-Oct 361 436 528 596 559 620 684 837 797 576 369 402 -- 564 157 45 1% 3-Oct 373 -- -- 403 601 490 511 649 839 795 454 409 501 548 157 47 3% 5-Oct 417 567 575 584 544 508 482 492 513 -- 515 452 -- 514 52 16 0% 6-Oct 235 524 618 684 673 645 649 740 -- 719 681 551 673 616 135 39 1% 7-Oct 350 342 532 651 713 624 595 547 579 486 439 388 265 501 136 38 2% 8-Oct -- 393 371 492 456 524 467 412 373 421 335 362 300 409 66 19 2% 9-Oct 319 325 407 449 439 414 428 -- 454 475 468 413 383 414 51 15 1% 10-Oct 253 377 361 363 377 355 365 369 372 336 324 334 343 348 34 9 2% 11-Oct 324 -- 374 397 416 606 -- -- -- -- -- -- -- 424 107 48 3% 12-Oct 258 389 329 311 363 303 161 -- -- -- 329 339 318 310 63 20 5%
Entire Season 403 470 456 478 485 482 473 491 476 467 424 423 398 455 82 15 1%
Fall 2006 Radar Surveys of Nighttime Migration Activity at the Proposed Windpark in Coos County, NH
October 2007
Appendix A Table 5. Survey dates, results, level of effort, and weather - Proposed Windpark in Coos County, NH Fall 2006
Radar Results Ceilometer Results Weather Conditions
Night of Birds Bats Insects Birds Bats Insects Temp
Wind Speed (mph)
Wind Direction
(from) 9-Sep 96% 3% 1% -- -- -- 59 1 S
10-Sep 100% 0% 0% -- -- -- 59 1 W 11-Sep 100% 0% 0% -- -- -- 49 7 SE 12-Sep 100% 0% 0% -- -- -- 57 6 SE 14-Sep 84% 0% 16% -- -- -- 61 4 SSE 15-Sep 100% 0% 0% 0 1 26 61 3 ESE 16-Sep 100% 0% 0% 2 0 19 58 5 SE 17-Sep 98% 0% 2% 0 0 27 64 9 ESE 18-Sep 99% 0% 1% 0 0 19 51 7 W 20-Sep 100% 0% 0% 0 0 0 44 7 SE 21-Sep 100% 0% 0% 0 0 5 55 6 SE 22-Sep 100% 0% 0% 0 0 3 57 5 NW 23-Sep 100% 0% 0% 0 0 32 53 5 S 24-Sep 100% 0% 0% 0 0 3 46 7 SE 25-Sep 100% 0% 0% 0 0 2 57 10 SE 26-Sep 95% 5% 0% 0 1 5 60 14 SE 27-Sep 96% 4% 0% 0 0 6 41 5 SE 28-Sep 94% 2% 4% 0 0 2 54 10 SE 29-Sep 100% 0% 0% 0 0 0 52 2 S 30-Sep 89% 5% 6% 0 0 8 46 7 SE 2-Oct 76% 0% 24% 0 0 12 58 3 SE 3-Oct 76% 0% 24% 0 0 27 53 10 NW 5-Oct 100% 0% 0% 0 0 0 37 4 SE 6-Oct 98% 0% 2% 0 0 0 39 6 SE 7-Oct 92% 0% 8% 0 0 2 40 8 SE 8-Oct 70% 0% 30% 1 0 7 45 8 SE 9-Oct 84% 0% 16% 0 0 18 51 5 SE
10-Oct 98% 0% 2% 0 0 12 55 15 SE 11-Oct 84% 0% 16% 0 0 0 44 6 NW 12-Oct 63% 0% 37% 0 0 14 37 7 SE Total 95% 1% 5% 0 2 249