Embed Size (px)
Citation preview

INVESTOR
PRESENTATION
July 2015

2
Notes on Forward Looking Statements
and Non-GAAP Measures • Comments in this presentation other than statements of historical fact may constitute forward looking statements and are
based on Fairchild’s management’s estimates and projections and are subject to various risks and uncertainties
• These risks and uncertainties are described in the Company’s periodic reports and other filings with the Securities and Exchange Commission (see the Risk Factors section) and are available at http://sec.gov and investor.fairchildsemi.com
• Actual results may differ materially from those projected in the forward looking statements
• Some data in this presentation may include non-GAAP measures that we believe provide useful information about the operating performance of our businesses that should be considered by investors in conjunction with GAAP measures that we also provide. You can find a reconciliation of non-GAAP to comparable GAAP measures at the Investor Relations section of our web site at http://investor.fairchildsemi.com
Recent additions to our website at http://investor.fairchildsemi.com
Updated Financials (through current quarter with segment revenue/gross margin breakouts)
• Quarterly Fact Sheet with current quarter highlights
• This investor presentation

3
Fairchild Overview

4
Fairchild Today…
Fairchild Semiconductor
2014 Revenue $1.43B Analog Power & Signal Solutions Group
(APSS)
(28% of 2014 Revenue)
Mobile
Power Conversion
Motion Tracking
Innovative analog power, signal and sensor solutions
Switching Power Solutions
(SPS)
(58% of 2014 Revenue)
Automotive
HV MOSFET, IGBT & SPM
LV & MV MOSFET
Cloud
Highly efficient discrete and integrated power management solutions
Standard Products Group
(SPG)
(14% of 2014 Revenue)
Standard Discrete, Analog & Logic
Optoelectronics
Essential functions for key customers

5
• Energy efficiency, mobility and cloud
mega-trends
• Power silicon content grows faster than
end market sales – premium paid for
efficiency
• Fairchild has deep power system
knowledge to support greater integration
and higher efficiency
• Company focused on delighting all
customers from large OEMs to the ―long
tail‖
Markets That Drive Our Business

6
Building a Great Leadership Team
• Promoting from within in areas of progress
Automotive, Supply Chain, Assembly & Test
• Recruiting & upgrading in areas of weakness
Sales & Marketing, Fab Operations, Engineering
• Opportunistically adding talent
Strategy, Finance
7
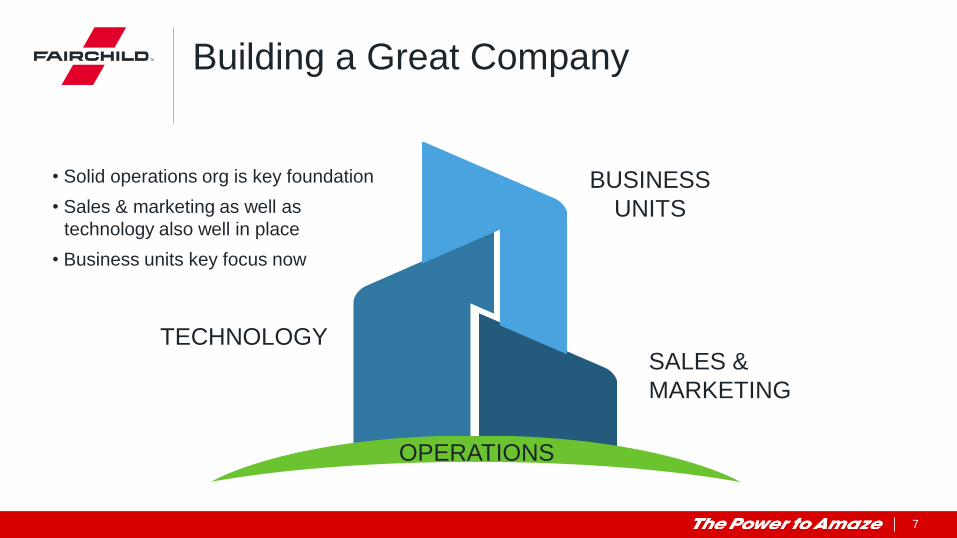
Building a Great Company
SALES &
MARKETING
TECHNOLOGY
OPERATIONS
BUSINESS
UNITS
• Solid operations org is key foundation
• Sales & marketing as well as
technology also well in place
• Business units key focus now

8
Our Culture
EXCEL
ENGAGED EMPLOYEE
DELIGHTED CUSTOMER
RESPECT
SPEED
EXPLORE SIMPLIFY
PLAY
DIRECT
WORLD-
CLASS
COMPANY
CHALLENGE

9
Fairchild Strategy

10
Strategy as a Daily Activity
Differentiated Products
Application-Centric
Customer Focus
Product-Centric
BEFORE
Commoditized Technology Approach
NOW
Driving Innovation & Disruption

11
$0
$6
$12
$18
$24
$30
$36 $
B U
SD
MOBILITY
ENERGY
CLOUD
App-Centric vs. Product-Centric Fairchild Addresses 45% of the TAM in 2018
New
strategic
focus
areas
enable
Fairchild to
address
45% of
TAM
$24.6B TAM
2013 2018
Source: TAM – WSTS 2014 Spring Forecast (excluding standard products, such as logic)
Addressable Percentage - Fairchild Internal Data
$32.2B TAM
% of TAM addressed based on product-centric % of TAM with new strategic focus
13%

12
All companies have PRODUCTS
Good companies have STRATEGY
LINKING the two
LEADS TO a
GREAT company
50,000 ft
1,000 ft

13
13
50,000 ft
1,000 ft
CLOUD ENERGY MOBILITY
25vFET 100vFET 600vFET GATE DRIVER MUX INTEGRATED SOLUTION WIRELESS IC DIODE FUEL GAUGE
CHARGER
Systems solutions
that serve the
needs
Technologies that
build the systems
50 product ideas
Power System in
Package,
Sensing Systems,
Intelligent Sensors
Today
Application Themes: Customer Empathy

14
Controller IP
Isolation IP
LV/MV FET IP Packaging IP
Driver IP
Sensor IP
HV FET IP
COMPETITOR
14
Power Systems Landscape

15
Controller IP
Isolation IP
LV/MV FET IP HV FET IP
Sensor IP
Driver IP
Packaging IP
Controller IP
Isolation IP Sensor IP
Driver IP
HV FET IP LV/MV FET IP
15
Power Systems Landscape
16
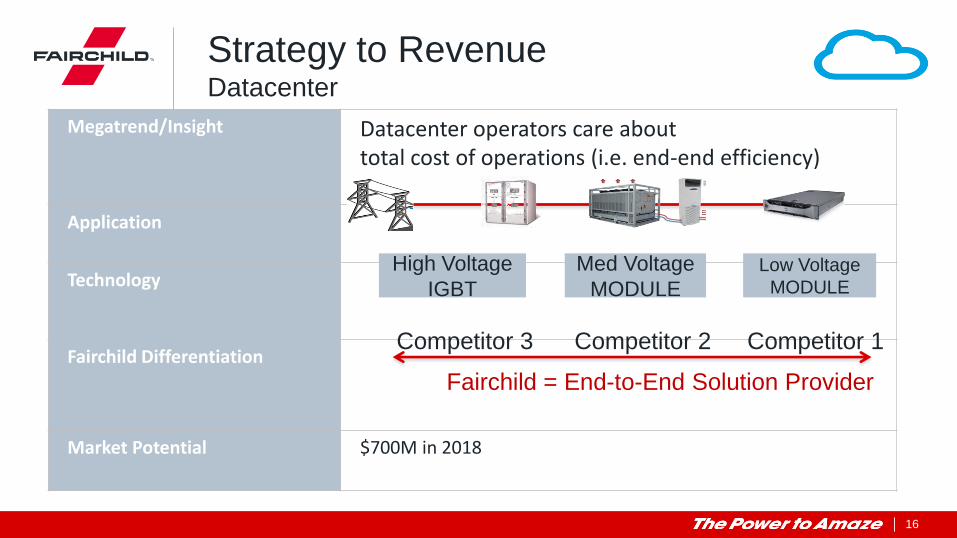
Megatrend/Insight Datacenter operators care about total cost of operations (i.e. end-end efficiency)
Application
Technology
Fairchild Differentiation
Market Potential $700M in 2018
Strategy to Revenue Datacenter
High Voltage
IGBT
Med Voltage
MODULE
Low Voltage
MODULE
Competitor 1 Competitor 2
Fairchild = End-to-End Solution Provider
Competitor 3

17
Megatrend/Insight Consumers don’t want to think about charging
Application Mobile, Phone, & Tablet
Technology Adaptive, Smart-Charging ICs
Design In 2015 Large Chinese Mobile Customer — Fairchild Total System Solution Fairchild communications protocol enables customers to provide a total system solution, from wall AC adaptor to battery.
Market Potential $3.8B in 2018
Strategy to Revenue Wall to Battery (W2B)

18
Megatrend Reduce vehicle CO2 emissions through electrification
Insight 48V Technology allows OEMs to reduce losses and provides better return ($ spent / CO2 reduction)
Application of Focus Mild hybrid
Technologies High-performance power modules SPM®
Design In 2015 3 Tier 1, 4 OEM in 3 continents
Market Potential $2.1B in 2018
Strategy to Revenue Automotive
19
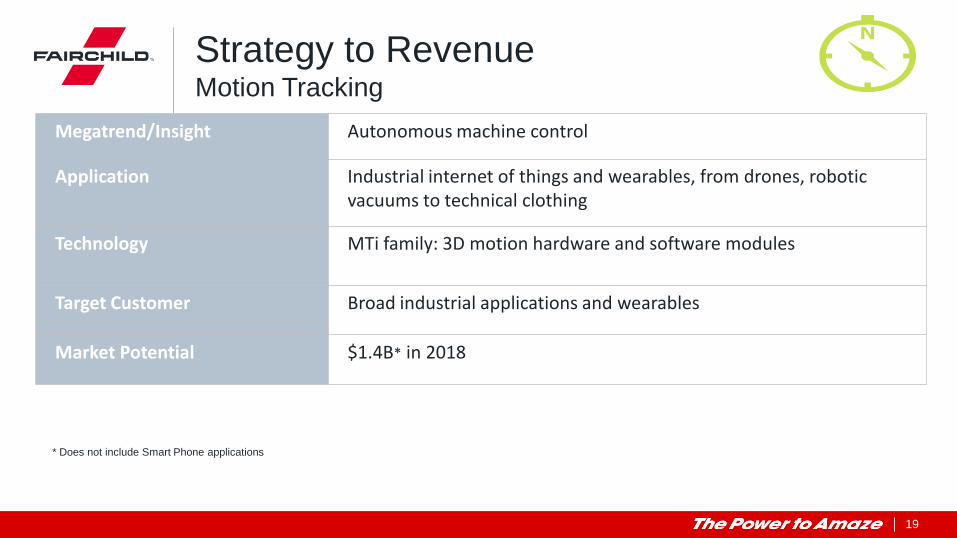
Megatrend/Insight Autonomous machine control
Application Industrial internet of things and wearables, from drones, robotic vacuums to technical clothing
Technology MTi family: 3D motion hardware and software modules
Target Customer Broad industrial applications and wearables
Market Potential $1.4B* in 2018
Strategy to Revenue Motion Tracking
* Does not include Smart Phone applications

20
Marketing & Sales Overview

21
Sales Overview
• Foundation — New sales strategy
• People — New leaders, skills, mindset
• Deployment — New growth opportunities
• Execution — New customer engagement model

22
Foundation New Sales Strategy
• DEMAND CREATION - Design In/Win — shift coverage to R&D
- System approach — understand the application
- Customer empathy — fill a latent need, solve a problem
• CLOSER TO CUSTOMERS - Proximity — quick response
- Adaptive — fragmented customer base
- Agile — early engagement with emerging customers
• ACCOUNTABILITY - Revenue accountability moved to design origin
- Pay on results — new sales bonus on design-in, revenue growth

23
• NEW SKILLS – VALUE ADDED TO CUSTOMERS
- More technical sales – EE
- More Field Applications Engineers (FAE) – FAE as application experts
• NEW MINDSET – PROACTIVE, DRIVE DEMAND
- More field-based people, less operations
- Relationship-builders
People New Leaders, Skills, Mindset
JOSEPH KARIM Americas VP
22 years Atmel, Intersil, ADI
ANDY LAI China VP 22 years
ADI, NSC, TI
ANDREAS HAMMER EMEA VP 16 years SiLabs, TI
JOSEPH NOTARO Motion Tracking VP
22 years STM
WEI LI Taiwan GM
20 years Lucent, Maxim
• RAISING THE BAR – NEW LEADERSHIP TEAM

24
Resources Best Deployed
• Increase investment on most significant markets
- China
- Germany
- Silicon Valley
• Shift resources to most promising opportunities
- Generated revenue vs. transacted revenue locations
- Invest where the growth will be vs. where revenue is today
- Aligned company focus segments
• Expand customer base
- More in fragmented markets: (i.e. Industrial, Auto)
- Emerging segments and customers: (i.e. Wearables)
- Mass market

25
Resources Go-to-Market
ASSIGNED
ACCOUNTS
MASS MARKET
LONG TAIL
Growth
Potential
• Biggest growth opportunity
• Focus, depth — 80% of resources
• Demand creation
• More customers
• Leveraging distribution
• More engineers
• Leverage the web & catalog distributors
• Build brand awareness

26
New Customer Engagement
• CUSTOMERS DRIVE PRODUCT DEFINITION - System expertise provides unique insight - FAE conduit of customer pain points
• INCREASE COMPLETE RECEIVED VALUE
- Product to solution, design expertise - Supply chain excellence - No EOL policy
• RELATIONSHIPS MAKE A DIFFERENCE
- Attention to every customer - Focus on customer empathy

27
• CLOUD & TELECOM - Move to IC & System approach - More strategic engagement - Growth acceleration
• MOBILE POWER & W2B - Full end-end solution - Huge value to customer - Major ASP increase YR13 Y14 $M Y15 $M Y16 $M
Others
Mobile Power & W2B
Cloud & Telecom
Source: Fairchild Internal Data
Execution Customer Showcase Relationship, Focus, System Approach Drives Growth

28
Marketing Overview
• New Brand
• New Go-to-Market
• Success
• Customer Count

29
Why Reposition The Brand?
• Brand history: older company & commodity sales Stagnation in customer growth & revenue
• A new Fairchild brand Energize employees
Attract top-notch engineering & sales talent
Grow relationships with design engineers
• Long-Tail customers create innovative products

30
Old brand identity
2013

31
New Brand Identity
2014

32
New Branding ―Xiantong‖ in China
• Historical significance
• Strong awareness
• Positive connotation

33
New Go-to-Market Website: Optimized for Long-Tail Lead Generation
• SHIFT commodity sales content to
value-added content
• MOVE design engineers through
the entire buying journey

34
New Go-to-Market Success Via Power Seminars in 2014
• 3x new customer leads
• Scalability
Live streaming to remote locations
Post-seminar engagement
• Wider awareness
New prospects
Social media & community
Boston, MA – May 1
Taichung, Taiwan – May 15
Beijing, China – May 20
Shenzhen, China – May 22
San Jose, CA – June 3

35
New Go-to-Market Success Via Accelerating Customer Acquisition
0
10,000
20,000
30,000
40,000
50,000
60,000
70,000
80,000
# of CustomerLocations
Source: Fairchild Internal Data

36
Finance Overview
37
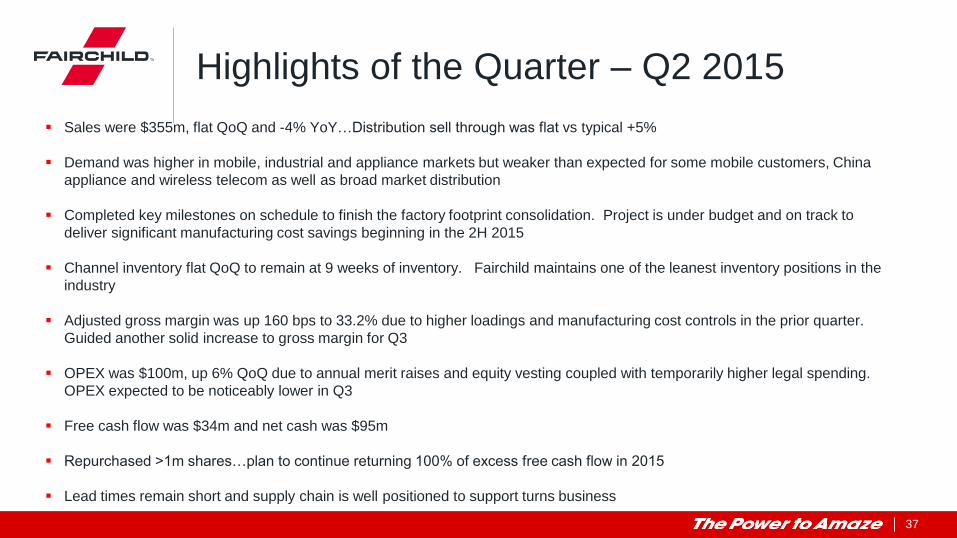
Highlights of the Quarter – Q2 2015
Sales were $355m, flat QoQ and -4% YoY…Distribution sell through was flat vs typical +5%
Demand was higher in mobile, industrial and appliance markets but weaker than expected for some mobile customers, China
appliance and wireless telecom as well as broad market distribution
Completed key milestones on schedule to finish the factory footprint consolidation. Project is under budget and on track to
deliver significant manufacturing cost savings beginning in the 2H 2015
Channel inventory flat QoQ to remain at 9 weeks of inventory. Fairchild maintains one of the leanest inventory positions in the
industry
Adjusted gross margin was up 160 bps to 33.2% due to higher loadings and manufacturing cost controls in the prior quarter.
Guided another solid increase to gross margin for Q3
OPEX was $100m, up 6% QoQ due to annual merit raises and equity vesting coupled with temporarily higher legal spending.
OPEX expected to be noticeably lower in Q3
Free cash flow was $34m and net cash was $95m
Repurchased >1m shares…plan to continue returning 100% of excess free cash flow in 2015
Lead times remain short and supply chain is well positioned to support turns business

38
Q3 Forward Guidance Provided at Q2 Earnings Call
• Sales expected to be $355 – 375m
• Gross margin expected to be 34 – 35% due primarily to lower
manufacturing unit costs and improved product mix
• R&D and SG&A forecast at $95 to 97m
• Adjusted tax rate forecast to be between 12% +/-3%

39
Adjusted Revenue & GM%
0.0%
7.0%
14.0%
21.0%
28.0%
35.0%
42.0%
200.0
250.0
300.0
350.0
400.0
450.0
500.0
Adj G
M %
Reve
nue
(M$)
Revenue Adj Gm%
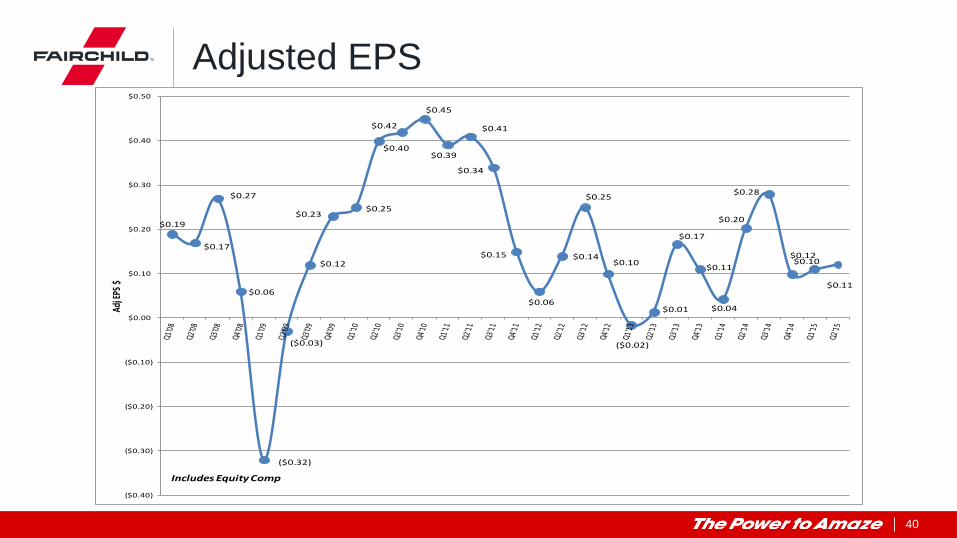
40
Adjusted EPS
$0.19
$0.17
$0.27
$0.06
($0.32)
($0.03)
$0.12
$0.23 $0.25
$0.40
$0.42
$0.45
$0.39
$0.41
$0.34
$0.15
$0.06
$0.14
$0.25
$0.10
($0.02)
$0.01
$0.17
$0.11
$0.04
$0.20
$0.28
$0.10
$0.11
$0.12
($0.40)
($0.30)
($0.20)
($0.10)
$0.00
$0.10
$0.20
$0.30
$0.40
$0.50
Adj E
PS $
Includes Equity Comp

41
4 Qtr Rolling Adjusted EPS
$0.23
$0.24 $0.24
$0.17
$0.05
$(0.01)
$(0.04)
$0.00
$0.14
$0.25
$0.33
$0.38
$0.42 $0.42
$0.40
$0.32
$0.24
$0.17
$0.15 $0.14
$0.12
$0.09
$0.07 $0.07
$0.08
$0.13 $0.16
$0.16
$0.17
$0.15
$(0.10)
$-
$0.10
$0.20
$0.30
$0.40
$0.50
Adj E
PS $

42
Disciplined Asset Management
• Balance sheet summary:
• Cash and investments exceed debt by $95m
• Internal inventory up $22m to 111 DOI…target range 100 – 110 DOI
• DSO decreased seasonally QoQ to 40 days
• Days of payables increased QoQ to 44 days
• FCF was $34m
• Primary focus remains investing in our business and funding stock buyback
• Repurchased >1m shares of stock in Q2
• Plan to return 100% of excess FCF to investors in 2015

43
Free Cash Flow
($40)
($20)
$0
$20
$40
$60
$80
$100
Free
Cas
h Fl
ow $
M

44
4 Qtr Rolling FCF % Revenue
(2.0%)
0.0%
2.0%
4.0%
6.0%
8.0%
10.0%
12.0%
14.0%
($10)
$0
$10
$20
$30
$40
$50
$60
% o
f Rev
enue
4 Q
tr R
ollin
g Fr
ee C
ash
Flow
$M
4Qtr Rolling Avg % to Revenue

45
Debt Composition
0
200,000
400,000
600,000
800,000
1,000,000
1,200,000
1997 1999 2001 2007 2008 2009 2010 2011 2012 2013
Drawn Revolver Term Loan Convert High Yield

46
Net Debt and Interest Trend
0.0%
1.0%
2.0%
3.0%
4.0%
5.0%
6.0%
7.0%
8.0%
9.0%
-$700.0
-$600.0
-$500.0
-$400.0
-$300.0
-$200.0
-$100.0
$0.0
$100.0
$200.0
$300.0
Net Cash Interest % of Revenue

47
Follow us on Twitter @ twitter.com/fairchildSemi
View product and company videos, listen to podcasts and comment on our
blog @ www.fairchildsemi.com/engineeringconnections
Visit us on Facebook @ www.facebook.com/FairchildSemiconductor

THANK YOU