Embed Size (px)
Citation preview

FAIR HOUSING & EQUITY ASSESSMENT REPORTNORTHERN NEW JERSEY REGION, 2015
DATA ANALYSIS
DELIBERATION
DECISION MAKING

TOGETHER North Jersey Fair Housing & Equity in Northern New Jersey
i
Fair Housing & Equity Assessment Report
Northern New Jersey Region
March, 2015

TOGETHER North Jersey Fair Housing & Equity in Northern New Jersey
i
ABOUT TOGETHER NORTH JERSEY In November 2011, the U.S. Department of Housing and Urban Development (HUD) awarded TOGETHER
NORTH JERSEY a $5 million Sustainable Communities Regional Planning Grant. The grant is matched with an
additional $5 million in leveraged funds from project partners. Grant funds have been used to implement the
Local Demonstration Project (LDP) Program, fund the Local Government Capacity Grant and NGO Micro‐
Grant Programs, develop a Regional Plan for Sustainable Development (RPSD) for the 13‐county planning
region, and provide technical assistance and offer education opportunities that build the capacity of
jurisdictions, organizations and the public to advance sustainability projects and initiatives. The plan is both
“place‐based” and “issue based” and uses sustainability, transit system connectivity and Transit‐Oriented
Development (TOD) as the central framework for integrating plans, regulations, investments, and incentive
programs at all levels of government to improve economic and environmental conditions, while promoting
regional equity and resource efficiency. For more information, please visit togethernorthjersey.com
TOGETHER NORTH JERSEY (TNJ) PROJECT TEAM • Edward J. Bloustein School for Planning and Public Policy at Rutgers University
• North Jersey Transportation Planning Authority (NJTPA)
• NJ TRANSIT
NJ Office of Planning Advocacy (NJOPA)
• Housing and Community Development Network of New Jersey (HCDN‐NJ)
• NJ Future
• Building One New Jersey
• PlanSmart NJ
• Regional Plan Association (RPA)
Sustainability Institute/Sustainable Jersey at The College of New Jersey
Participating local and county governments of the NJTPA region
FUNDING ACKNOWLEDGEMENT
The work that provided the basis for this report was supported by funding under an award from the U.S.
Department of Housing and Urban Development. The substance and findings of the work are dedicated to
the public. The authors of the report are solely responsible for the accuracy of the data, statements and
interpretations contained in this document. Such statements and interpretations do not necessarily reflect
the views of the Government.
FHEA REPORT PREPARATION ACKNOWLEDGMENTS
Edward J. Bloustein School for Planning and Public Policy University, Rutgers University – David
Aimen PP/AICP, Scott Fishberg, Julius Jessup
PlanSmart NJ – Bob Kull, PP/AICP, Alisa Goren, Zlata Kobzantsev
Housing and Community Development Planning, Vito Gallo, PP
Thank you to all the participating members of the TNJ project team as well as David Troutt from the Rutgers
Center on Law in Metropolitan Equity (CLiME) for their valued contributions as advisory group members and
for holding and attending events to promote discussion of the issues and recommendations of the FHEA.

TOGETHER North Jersey Fair Housing & Equity in Northern New Jersey
ii
TABLE OF CONTENTS
Executive Summary ..................................................................................................... 1
1 Introduction ....................................................................................................... 1‐1
1.1 About TOGETHER North Jersey ..................................................................................................... 1‐1
1.2 About the Project ....................................................................................................................... 1‐1
1.3 What is the FHEA ....................................................................................................................... 1‐2
1.4 Why is TNJ Preparing an FHEA? ................................................................................................. 1‐3
1.5 How the FHEA Informs the RPSD ............................................................................................... 1‐5
Data Analysis & Tools ......................................................................................................... 1‐5 1.5.1
Deliberations ...................................................................................................................... 1‐6 1.5.2
Decision Making ................................................................................................................. 1‐6 1.5.3
2 Background ........................................................................................................ 2‐1
2.1 Municipality Types of the TOGETHER North Jersey Region .......................................................... 2‐1
2.2 Population Trends ...................................................................................................................... 2‐1
Post WWII‐Decentralization and the Steady Growth in Suburbia ..................................... 2‐1 2.2.1
Post 2000 – Shifting Dynamics ........................................................................................... 2‐4 2.2.2
2.3 Employment Trends ................................................................................................................... 2‐5
Metropolitan Spillover and the Suburban Growth Corridor .............................................. 2‐5 2.3.1
Shifting Dynamics and Slower Employment Growth ......................................................... 2‐7 2.3.2
2.4 Family Income Growth ............................................................................................................... 2‐7
Median Family Income, 1990‐2010 ................................................................................... 2‐7 2.4.1
Growing Gap in Income ..................................................................................................... 2‐8 2.4.2
Persistent Poverty – Poverty Rate ..................................................................................... 2‐9 2.4.3
2.5 Enduring Significance of Foreign Born Populations ................................................................. 2‐10
Changing Origin of TNJ Foreign Born Populations, pre 1980 to 2010 ............................. 2‐10 2.5.1
Location of Foreign Born Populations by Municipality Type, 2000 to 2010 .................... 2‐12 2.5.2
Origin and Location of Foreign Born Populations by Municipality Type, 2000 to 2010 .. 2‐13 2.5.3
2.6 Changing Racial Composition of North Jersey ......................................................................... 2‐14
Race Distribution by Counties of TNJ Region Comparison, 1990‐2010 ........................... 2‐14 2.6.1

TOGETHER North Jersey Fair Housing & Equity in Northern New Jersey
iii
Dot Density Maps, 2010 ................................................................................................... 2‐16 2.6.2
2.7 Building an Adaptive Housing Stock......................................................................................... 2‐24
Housing Types ‐ Size and Number of Units in Structure .................................................. 2‐24 2.7.1
Renter vs. Owner ............................................................................................................. 2‐26 2.7.1
Age of Structures .............................................................................................................. 2‐26 2.7.2
2.8 Diversity’s Role in Building Stable and Sustainable Communities ........................................... 2‐27
Public Safety Personnel and Community Diversity .......................................................... 2‐27 2.8.1
Crime Per Capita by Municipality Type ............................................................................ 2‐30 2.8.2
3 Segregation and Integration ............................................................................... 3‐1
3.1 Dissimilarity Index ...................................................................................................................... 3‐1
3.2 Isolation Index ............................................................................................................................ 3‐2
3.3 Predicted Racial and Ethnic Composition .................................................................................. 3‐4
4 Racially & Ethnically Concentrated Areas of Poverty ........................................... 4‐1
5 Factors Driving Segregation and Concentrated Areas of Poverty ......................... 5‐1
5.1 Persistence of Patterns of Exclusionary Zoning ......................................................................... 5‐1
5.2 Cultural Barriers ......................................................................................................................... 5‐2
5.3 Market/Shadow Market Forces ................................................................................................. 5‐4
5.4 Realtor Steering ......................................................................................................................... 5‐6
5.5 Covenants .................................................................................................................................. 5‐7
5.6 FHA Redlining ............................................................................................................................. 5‐8
5.7 Predatory Lending .................................................................................................................... 5‐10
5.8 Disinvestment .......................................................................................................................... 5‐10
5.9 Gentrification ........................................................................................................................... 5‐10
5.10 Costs of Accessibility Compliance ............................................................................................ 5‐12
Disability Discrimination under the Fair Housing Act ...................................................... 5‐12 5.10.1
Disability Discrimination under the Americans with Disabilities Act ............................... 5‐13 5.10.2
Accessibility Requirements under the Fair Housing Act .................................................. 5‐13 5.10.3
Universal Design ............................................................................................................... 5‐15 5.10.4
Visitability ......................................................................................................................... 5‐15 5.10.5
Resistance to Accessibility ............................................................................................... 5‐16 5.10.6

TOGETHER North Jersey Fair Housing & Equity in Northern New Jersey
iv
Financial Assistance ......................................................................................................... 5‐16 5.10.7
6 Communities of Concern: EJ and Other Disadvantaged Populations ................... 6‐1
6.1 Definitions of Community of Concern ....................................................................................... 6‐1
Minority Populations – Definition, Regional Threshold, Table, Map ................................. 6‐1 6.1.1
Households in Poverty ....................................................................................................... 6‐4 6.1.2
Female Head of Households with Children ........................................................................ 6‐6 6.1.3
Carless Households ............................................................................................................ 6‐8 6.1.4
Persons with Limited English Proficiency ......................................................................... 6‐10 6.1.5
Elderly Over 75 Years of Age ............................................................................................ 6‐12 6.1.6
Persons with Disabilities .................................................................................................. 6‐14 6.1.7
Communities of Concern ................................................................................................. 6‐18 6.1.8
Growth in Communities of Concern ................................................................................ 6‐20 6.1.9
7 Access to Opportunities ..................................................................................... 7‐1
7.1 Geographies of Opportunity ...................................................................................................... 7‐1
7.2 Education ................................................................................................................................... 7‐1
Elementary School Reading Proficiency ............................................................................. 7‐1 7.2.1
High School Graduation Rate ............................................................................................. 7‐4 7.2.2
Learning Environment Offenses ......................................................................................... 7‐6 7.2.3
7.3 Poverty ..................................................................................................................................... 7‐11
Percent of Students Receiving Free & Reduced Price Meals ........................................... 7‐11 7.3.1
Percent of Households Receiving Public Assistance Income ........................................... 7‐13 7.3.2
7.4 Economic Health ...................................................................................................................... 7‐16
Change in Private Sector Jobs, 1990‐2010 ....................................................................... 7‐16 7.4.1
Percent of Persons with Bachelor’s or Higher ................................................................. 7‐20 7.4.2
7.5 Municipal Fiscal Health ............................................................................................................ 7‐23
Median Family Income, 2010 ........................................................................................... 7‐23 7.5.1
Tax Base per Capita .......................................................................................................... 7‐26 7.5.2
7.6 Housing & Housing Affordability .............................................................................................. 7‐29
Occupied Housing Units ................................................................................................... 7‐29 7.6.1
Multifamily Units .............................................................................................................. 7‐33 7.6.2

TOGETHER North Jersey Fair Housing & Equity in Northern New Jersey
v
Housing Affordability ....................................................................................................... 7‐37 7.6.3
Location of HUD Units (Units/1,000 persons) .................................................................. 7‐50 7.6.4
7.7 Health and the Environment .................................................................................................... 7‐58
Foreclosures per Square Mile .......................................................................................... 7‐58 7.7.1
Cancer Risk ....................................................................................................................... 7‐61 7.7.1
Access to Healthy Food .................................................................................................... 7‐63 7.7.2
Access to Open Space ...................................................................................................... 7‐65 7.7.3
7.8 Transportation, Access & Mobility ........................................................................................... 7‐67
Population per Square Mile Served by Transit ................................................................ 7‐67 7.8.1
Jobs within 45 Minutes by Transit ................................................................................... 7‐69 7.8.2
Jobs within 45 Minutes by Auto ....................................................................................... 7‐71 7.8.3
Percent of Commuters who Walk, Bike, Carpool or Use Transit to Work ....................... 7‐73 7.8.4
7.9 Social Engagement ................................................................................................................... 7‐80
8 Physical Infrastructure and Public Investments ................................................... 8‐1
8.1 Introduction ............................................................................................................................... 8‐1
8.2 Economic Development ............................................................................................................. 8‐1
Grow NJ Assistance Program ............................................................................................. 8‐2 8.2.1
Economic Redevelopment and Growth Program .............................................................. 8‐6 8.2.2
Hazardous Discharge Site Remediation Fund .................................................................... 8‐9 8.2.3
8.3 Transportation ......................................................................................................................... 8‐13
Mass Transit Assets .......................................................................................................... 8‐13 8.3.1
Multimodal Programs ...................................................................................................... 8‐17 8.3.2
Safety ............................................................................................................................... 8‐20 8.3.3
8.4 Safe Routes to School .............................................................................................................. 8‐23
8.5 Utilities ..................................................................................................................................... 8‐28
Pay for Performance ........................................................................................................ 8‐28 8.5.1
8.6 Arts ........................................................................................................................................... 8‐32
8.7 Recommendations ................................................................................................................... 8‐36
9 Assessment of Fair Housing Issues ...................................................................... 9‐1
9.1 Introduction ............................................................................................................................... 9‐1

TOGETHER North Jersey Fair Housing & Equity in Northern New Jersey
vi
9.2 Federal Efforts to Address Barriers to Fair Housing ................................................................... 9‐1
Federal Statutes ................................................................................................................. 9‐1 9.2.1
Federal (Presidential) Executive Orders ............................................................................. 9‐7 9.2.2
Fair Housing Initiatives Program ........................................................................................ 9‐8 9.2.3
Fair Housing Assistance Program ....................................................................................... 9‐8 9.2.4
Housing Discrimination Complaints in New Jersey ............................................................ 9‐8 9.2.5
Enforcement..................................................................................................................... 9‐10 9.2.6
Fair Housing Testing Program .......................................................................................... 9‐10 9.2.7
Vouchers/Mixed Income .................................................................................................. 9‐11 9.2.8
Consolidated Housing Plans/Annual Action Plan for Housing ......................................... 9‐12 9.2.9
Analysis of Impediments/Affirmatively Furthering Fair Housing ..................................... 9‐14 9.2.10
9.3 New Jersey Efforts to Address Barriers to Fair Housing .......................................................... 9‐20
New Jersey Law against Discrimination ........................................................................... 9‐20 9.3.1
Mt. Laurel Doctrine .......................................................................................................... 9‐21 9.3.2
NJ Strategic Housing Plan (2008) ..................................................................................... 9‐28 9.3.3
9.4 Fair Housing Observations from TNJ Housing Baseline Topic Report ...................................... 9‐29
Concentration .................................................................................................................. 9‐31 9.4.1
Deconcentration .............................................................................................................. 9‐31 9.4.2
9.5 Fair Housing Implications of Housing Market Collapse ........................................................... 9‐32
Foreclosure ...................................................................................................................... 9‐32 9.5.1
Neighborhood Impacts .................................................................................................... 9‐32 9.5.2
Availability of Mortgage Credit ........................................................................................ 9‐32 9.5.3
9.6 Fair Housing Impacts of Hurricane Sandy in New Jersey ......................................................... 9‐33
9.7 Zoning Effects on Fair Housing ................................................................................................. 9‐34
9.8 Loopholes of Age Restricted Households, Family Exclusion .................................................... 9‐35
Hurricane Sandy Exemption ............................................................................................. 9‐35 9.8.1
Conversion of Age‐Restricted Developments .................................................................. 9‐36 9.8.2
9.9 Housing Mobility Counseling ................................................................................................... 9‐37
10 Conclusions and Recommendations .............................................................. 10‐1
10.1 Challenges to Fair & Affordable Housing in the Region ........................................................... 10‐1

TOGETHER North Jersey Fair Housing & Equity in Northern New Jersey
vii
Federal Fair Housing Act Enforcement Has Been Indirect and Underfunded ................. 10‐1 10.1.1
Affordable Housing Programs Have Not Resulted in Fair Housing Outcomes................. 10‐1 10.1.2
Municipal Land Use Zoning Remains Exclusionary and Counterproductive .................... 10‐3 10.1.3
Housing Policy is Education Policy ................................................................................... 10‐3 10.1.4
Tax Policy is Housing Policy .............................................................................................. 10‐4 10.1.5
Transportation Policy & Investments Affect Access to Opportunities ............................ 10‐5 10.1.6
10.2 A Vision for a Regional Fair & Equitable Housing Policy .......................................................... 10‐5
10.3 Vision 1: The Region Affirmatively Furthers Fair Housing ..................................................... 10‐12
Strategy: Maintain Fair Housing Assessments ............................................................... 10‐13 10.3.1
Strategy: Improve Regional Oversight to Affirmatively Further Fair Housing ............... 10‐14 10.3.2
Strategy: Use the FHEA in Decision Making ................................................................... 10‐15 10.3.3
Strategy: Improve Data for Decision Making ................................................................. 10‐15 10.3.4
10.4 Vision 2: Housing Supply Is Diversified to Meet Current and Future Demand ...................... 10‐18
Strategy: Mandate and Enforce Inclusionary Housing Policies...................................... 10‐19 10.4.1
Strategy: Provide Incentives and Financial Support for Development of Housing Types Not 10.4.2
Being Produced by the Market ...................................................................................................... 10‐22
Strategy: Locate Affordable Housing in Places with High Access to Opportunities ...... 10‐23 10.4.3
Strategy: Create Employer Assisted Housing Accessible to Employment Centers ........ 10‐30 10.4.4
10.5 Vision 3: Access to Opportunity Is Increased through Housing Mobility .............................. 10‐32
Strategy: Regionalize Housing Choice Voucher Programs ............................................. 10‐32 10.5.1
Strategy: Link Regional HCV Programs to COAH Housing .............................................. 10‐36 10.5.2
Strategy: Link Regional HCV Programs with School Funding Programs ......................... 10‐37 10.5.3
10.6 Vision 4: Public Investment Creates, Connects, and Strengthens Access to Opportunity .... 10‐38
Strategy: Ensure Public Investment Programs Connect and Strengthen Communities of 10.6.1
Concern 10‐39
Strategy: Adopt Program and Project Prioritization Criteria to Better Connect 10.6.2
Communities of Concern to Places of Opportunity and In‐Place Solutions .................................. 10‐40
10.7 Vision 5: CDBG Funding Substantially Increases Fair Housing Activities ............................... 10‐41
Strategy: Increase Fair Housing Activities through CDBG Funding ................................ 10‐42 10.7.1
10.8 Vision 6: More Housing Opportunities Are Available for People with Disabilities ................ 10‐43
Strategy: Increase the Supply of Accessible Housing for Persons with Disabilities ....... 10‐43 10.8.1

TOGETHER North Jersey Fair Housing & Equity in Northern New Jersey
viii
11 REFERENCES .................................................................................................. 11‐1
12 APPENDICES .................................................................................................. 12‐1

TOGETHER North Jersey Fair Housing & Equity in Northern New Jersey
ix

TOGETHER North Jersey Fair Housing & Equity in Northern New Jersey
ES-1
Executive Summary
Equity and access to opportunity are critical underpinnings of TOGETHER North Jersey’s Regional Plan for Sustainable Development. Therefore, the planning process includes the preparation of this assessment of Fair Housing and Equity in the Northern New Jersey region.
As part of the process to develop a Regional Plan for Sustainable Development (RPSD) for the TOGETHER North Jersey planning region, the TNJ Project Team worked with the TOGETHER North Jersey Steering Committee and Standing Committees to conduct a Fair Housing and Equity Assessment (FHEA) for the region, resulting in this report.
The Fair Housing and Equity Assessment (FHEA) provides a framework for considering what it may mean to live in places of “high” or “low opportunity” in Northern New Jersey. The FHEA identifies how the benefits or burdens of residential settlement location may be experienced differently by various groups across the region and provides a platform for addressing these disparities. Among other issues, the FHEA includes an assessment of:
Patterns of segregation, diversity, and racial and ethnic integration;
Concentrations of poverty; and
Accessibility to areas of high “opportunity”
The FHEA also examines how patterns of planned and recent infrastructure investments; fair housing issues, services, and activities; and regulatory and private market barriers to fair housing choice may contribute to existing socioeconomic patterns.
In preparing the FHEA, TNJ has conducted extensive data analysis, held an array of deliberative processes that considered the methods and findings of the analysis, and invited participating stakeholders to explore and recommend strategies and actions to address regional disparities in fair housing and access to opportunity to inform the development of the TOGETHER North Jersey RPSD.
Chapter 1: Introduction describes the TOGETHER North Jersey initiative, the purpose of the FHEA and how the FHEA will inform the RPSD through data analysis and tools, deliberations, and decision making. The FHEA is not meant as a “desktop” exercise, but rather a means to frame and advance public discussions about equity throughout the development of the Regional Plan for Sustainable Development. Further education and a better understanding of the issues raised by the FHEA were a key component of TNJ’s planning and implementation process.
Chapter 2: Background examines trends in population, employment, and family income growth; changes in ethnic and racial composition; and the suitability of the region’s housing stock to adapt to these changes. The U.S. is undergoing a major demographic transition in which non‐White racial groups are becoming a larger portion of the population with youth at the forefront of this change. By 2042, it is projected that the majority of the U.S. population will be persons of color. While not majority‐minority, the TNJ region is undergoing its own demographic transition and adapting to this change will be integral to the region’s economic future.
Minority populations are far from distributed evenly across the region. Black and Hispanic populations are more likely to live in the region’s urban cities and its older, inner ring suburbs in places highly concentrated with non‐White populations. Most residents of the TNJ 13‐county region reside today – as they did 20 years ago – in communities that are not racially diverse (i.e., 20 to 60% of population is minority).
TOGETHER North Jersey Fair Housing & Equity in Northern New Jersey
ES-2
In this chapter, the region’s municipalities are categorized into five distinct types by their relative racial diversity (i.e., the percentage of minority persons as a share of population) and their housing stock inclusivity (i.e., multifamily and rental housing options as a percentage of the total housing supply). The resulting cross‐tabulations provide a lens through which to examine aggregate differences in demography and “places of opportunity” indicators at the municipal level.
The strong suburban character of the region can be observed in the distribution of housing types. In non‐inclusive municipalities, both low minority and racially diverse municipalities had much lower percentages of multifamily units (11.8% and 14.8%, respectively) than in the housing inclusive jurisdictions (32% to 70.4% of the stock). Similarly, housing inclusive municipalities had a higher percentage of rental units than their non‐inclusive counterparts, ranging from 27% to 46% of all housing units.
The TNJ region’s private sector job growth – 9 out of every 10 jobs – occurred in the non‐inclusive municipalities of the region over the 1990‐2010 period, while 100% of net job losses occurred in the municipalities that were either racially diverse or high minority communities offering a range of housing options. This absence of housing types makes it more inefficient for the region’s workers to connect to employment destinations and a secure economic future for themselves and their families.
Non‐inclusive municipalities had median family incomes that were at least $10,000‐$20,000 greater than any type of housing inclusive municipalities, and median family incomes in non‐inclusive municipalities generally grew by at least 87% or more from 1990 to 2010 with only the low‐minority, housing inclusive municipalities showing comparable income growth.
Over the last two decades, there has also been a persistent and widening gap between those at the top and the bottom of the income distribution in the TNJ region. Growth in the income gap was considerably higher in the region’s inclusive municipalities, generally due to the fact that 90th percentile family incomes grew faster than their 10th percentile counterparts.
Foreign‐born residents accounted for 40% of the population in high minority municipalities in 2010, but their proportions grew by more than 20% in every municipality type except for the high minority areas of the TNJ. Foreign‐born residents, however, remain more likely to settle in places of diversity (i.e., 20 to 60% minority) than low‐minority communities – a pattern that did not change over the 2000‐2010 period.
The geographic distribution of African American residents was much more concentrated than that of both White residents and Asian residents, with a strong focus in the high density urban municipalities and a near perfect geographic correlation with the locations of Non‐White Hispanic Latino communities.
A broader mix of housing choices is warranted in non‐inclusive communities to ensure that more persons – and a greater diversity of person in terms of race and income – have an opportunity to live closer to the places of high opportunity in the region.
Chapter 3: Segregation and Integration analyzes the region using multiple indicators, including a dissimilarity Index, Isolation Index, and its Predicted Racial and Ethnic Composition which reveal a region with significant patterns of racial concentration, separation and exclusion. This persistent racial

TOGETHER North Jersey Fair Housing & Equity in Northern New Jersey
ES-3
separation has significant and troubling implications for public policy and the region’s economic development.
The Dissimilarity Index can be loosely interpreted as the percentage of one group that would need to move in order for each block group to match the composition of the area. The dissimilarity index indicates significant levels of segregation for Black, Hispanic, and Pacific Islander populations. The Together North Jersey region is ranked sixth worst in terms of the dissimilarity index among HUD grantees in receipt of their Sustainable Communities Grants. The TNJ’s region’s Hispanic to white rate is among the highest in the nation.
The Isolation Index compares a group’s share of the overall population in a jurisdiction to the average neighborhood share for members of that group. The index reveals that Blacks, Hispanics, and, to a lesser extent, Asians are the most isolated minority groups in Northern New Jersey. For example, the isolation index indicates that 47.8% of the average Black individual’s neighbors are Black, even though only 11.8% of residents of the region are Black (47.8 ‐11.8 = 36). Hispanics are more isolated in Northern New Jersey than in nearly any other metropolitan area that we benchmarked except Chicago. Similarly, Blacks are more isolated in Northern New Jersey than in any other region except Chicago, Detroit and St. Louis.
The Predicted Racial/Ethnic Composition Index addresses the question, “given the current household income characteristics for each area, what would we expect the racial/ethnic composition to look like?” This index confirms that income is not a good predictor, or is insufficient for explaining the patterns of racial settlement and segregation evident in Northern New Jersey. Based on this method, Blacks and Hispanic populations should be dispersed among a many more communities in Northern New Jersey than they currently are.
Overall, these patterns suggest that one cause of the region’s growing household and municipal resource inequality is a lack of spatial balance in the jobs, schools and housing opportunities available to North Jersey residents by race and income.
Chapter 4: Racially & Ethnically Concentrated Areas of Poverty (RCAP/ECAP) are defined as census tracts with a majority non‐white population and a family poverty rate that is greater than or equal to 23.7% in the Northern New Jersey region. The TNJ Region has 155 RCAP/ECAP tracts located in 25 municipalities. More than one‐half million persons reside in these places of racially concentrated poverty. However, over 50% of all people in RCAP/ECAPs are concentrated in three cities: Newark, Paterson, and Jersey City.
Chapter 5: Factors Driving Segregation and Concentrated Areas of Poverty are described in this chapter, making clear that the patterns of segregation and concentration are not new, but rather the result of past decisions and expressed in the prevailing values of the society. They have been expressed in governance – for example, in executive actions, legislative initiatives, judicial decisions, funding priorities – and permeate our economic, cultural, and political spheres. As a means for further understanding the challenges of affirmatively furthering fair housing, the chapter highlights several of the driving factors that have shaped the TNJ region’s current socioeconomic patterns.
Patterns of exclusionary zoning are persistent. When opportunities for affordable residential development are substantially restricted or prohibited while non‐residential development is encouraged, the effect of such zoning is exclusionary and subject to challenge.

TOGETHER North Jersey Fair Housing & Equity in Northern New Jersey
ES-4
Both “internal” and “external” cultural barriers tolerate and enforce segregation and concentrated areas of poverty. External cultural barriers tend to wall‐in, or steer, cultural groups into concentrations through exclusion but may be overcome with attention to physical and social details. Internal cultural barriers tend to retain people within their cultural concentrations through extensive family, social, and economic networks.
Realtor steering is now relatively rare in the region but the chapter illustrates how important training is to ensure that questions that narrow the field of places and dwellings which may suit a client’s needs are not discriminatory on the basis of race, religion, sex, national origin, familial status or handicap.
Racially restrictive covenants enforcing segregation are long gone, but the persistence of neighborhoods of exclusion created by these covenants is remarkable. These covenants established a norm for neighborhoods that date back to eras of legally enforced racial segregation.
Like racially restrictive covenants, the effects of 30 years of federally approved redlining linger to this day. While all communities of people became able to receive mortgage loans from financial institutions by the 1990s, the locations and terms of these loans continue to be less favorable to minority populations as patterns of segregation established by redlining persist.
The housing abandonment and home foreclosures in neighborhoods of minority concentration in the TNJ region are the legacy of the economic crisis that was precipitated, in large part, by predatory lending practices, typically in the form of subprime mortgage refinancing or home equity loans – at higher interest higher rates and with less favorable lending terms than typically available to non‐ minority borrowers.
Disinvestment in areas of segregation by race or other protected classes and in concentrated areas of poverty are both cause and effect, often comprising a vicious cycle of decline that is difficult to halt or reverse.
Gentrification is often spoken as an epithet because of its reputation for displacing and evicting poorer and minority residents and shopkeepers, increasing segregation as real estate prices rise. However, it is possible, and therefore necessary, to manage this process to be beneficial for existing residents by increasing access to opportunity.
Housing discrimination on the basis of disability is a violation of the civil rights of the disabled. However, the extent to which housing must be designed and built to accommodate people with disabilities is highly variable, and while most changes are low in cost, the total costs per housing unit may be highly variable and uncertain.
Chapter 6: Communities of Concern – EJ and Other Disadvantaged Populations identifies the location of affected populations, a prerequisite step toward establishing planning processes that are inclusive, informative in addressing transportation needs of various population segments to avoid and minimize social exclusion impacts, and to ensure more broadly that the impacts of decisions can be comprehensively assessed as to their benefits and burdens with respect to environmental justice considerations.
“Communities of Concern” are places in the TNJ region that are home to high concentrations of minority, low‐income and other disadvantaged populations, including:

TOGETHER North Jersey Fair Housing & Equity in Northern New Jersey
ES-5
Minority concentration equal to or exceeding the regional threshold;
Low‐income concentration equal to or exceeding the regional threshold; or
Two or more Non‐EJ Disadvantaged populations (Female head of household with children, Carless households, Persons with limited English proficiency, or Elderly over 75 years of age) equal to or exceed the regional threshold.
The threshold identification and mapping of Communities of Concern rely upon block group and census tract data of the above demographic indicators of EJ populations and traditionally disadvantaged populations.
Minority Populations. Hudson, Essex, Passaic, Union, and Middlesex counties represent roughly 50 percent of the region’s total population but close to 70 percent of all minorities. Warren, Ocean, Hunterdon, and Sussex counties make up roughly 15 percent of the region’s total population but contain less than 5 percent of all minorities.
Households in Poverty. Hudson, Essex, Passaic, and Union counties contain roughly one‐third of the region’s households (36.4%) but over half of all households in poverty (55.6%). By contrast, Morris, Hunterdon, and Somerset counties contain nearly 15 percent of the region’s households, but only 6 percent of all households in poverty. Evidence of the suburbanization of poverty can be seen with households in poverty and pockets of high poverty areas in each county.
Female‐Headed Households in Poverty. Essex, Passaic, Hudson, and Union counties contain roughly a third of the region’s total households (36.9%) but over half of all female‐headed households with children (FHWC) households (53.3%). By contrast, counties such as Ocean, Morris, and Hunterdon comprise 18.7 percent of total households, but only 11.9 percent of all FHWC in the TNJ region. Areas that exceed the regional average of 6.4% percent of all households are concentrated in the urban core cities, but such households are located in all Northern New Jersey counties with exceptionally larger numbers in Bergen, Middlesex and Monmouth Counties.
Carless Households. Hudson, Essex, and Passaic counties contain a disproportionate share of the carless households in the TNJ region; Union County also contains a larger relative percentage of such households. These four counties represent roughly one third of the region’s households (36.4%) but almost two‐thirds of its carless households (64.8%). By comparison, counties outside this inner ring such as Warren, Somerset, Morris, Sussex, and Hunterdon, contain about a fifth of all households (18.5%) but only 7 percent of all carless households. The relative lack of transit options in these outer counties may indeed make it difficult for transit‐dependent populations (e.g., carless households, low‐income populations, persons with disabilities, etc.) to reside in this portion of the region. The regional threshold is 12.5% of all households.
Limited English Proficiency. Hudson, Passaic, Union, Middlesex, and Essex counties are primary settlement destinations for the foreign‐born, and account for close to 70 percent of all Limited English Proficiency (LEP) persons but just under half of the region’s total population. Most notably, Hudson County represents 17.5 percent of all LEP persons, but 9.5 percent of the region’s total population over the age of 5.
Elderly Persons 75 years of Age and Over are included in this analysis due to the physical, mental, and/or financial barriers to mobility and accessibility encountered by this population.

TOGETHER North Jersey Fair Housing & Equity in Northern New Jersey
ES-6
Elderly populations are more evenly distributed in the TNJ region than many of the other indicators; however, a disproportionate share of the region’s elderly live in Ocean and Bergen counties where they comprise 22.5 percent of the region’s total population but roughly 30 percent of all elderly persons. Proportionately more of the region’s elderly population also lives in the outer ring counties, including Warren, Monmouth, and Morris counties. The regional threshold average is 6.6% of the population.
Persons with Disabilities. Hudson, Essex, Passaic, and Ocean counties contain a disproportionate share of persons with disabilities in the TNJ region. These counties represent 38 percent of the total population but 47 percent of all persons with a disability. The same counties, plus Warren, are also home to a disproportionate share of region’s population with a physical disability.
As the populations of people of color and low‐income households have increased in the TNJ region since 1990, so have the number of Communities of Concern. The label “Communities of Concern” are meant to signal places with higher concentrations of minority and low‐income populations as well as other proxies for household vulnerability. It is important to understand that there are communities of concern in each of the 13 counties that make up the TNJ region. While the challenges may be greater in some counties and places, there are vulnerable populations living throughout the region.
Chapter 7: Access to Opportunities defines selected Opportunity Indicators for which data are available and can be mapped, and explores the geographies of opportunity. Several indicators are examined that define what a place of opportunity might possess, including high‐performing schools, job growth, fiscal capacity, educated workforce, higher incomes, fewer persons in poverty, affordable housing, lower crime, higher voter turnout, among other issues.
People do not have equal access to the resources available in our “high opportunity” places. People’s health and well‐being are affected by their access to places of opportunity or by the exposure to the chronic stresses and limited resources of a “low‐opportunity” environment. These inequalities are rooted in our attachments to place as well as shaped by our past and current laws, policies and habitual practices that have shaped and continue to influence residency dynamics. Maps illustrating places of high and low opportunity in northern New Jersey are presented throughout the chapter across a range of indicators; they reveal that the areas of racial concentration tend toward concentration in “places of low opportunity”.
Drawing upon the communities of concern mapping, disparities in access to places of opportunity are evaluated by overlaying the opportunity indicators against the indicators of communities of concern. Thus, each opportunity indicator is mapped in terms of places that perform at or above the regional threshold – for example, a block group in which persons over 25 years have higher than the regional average of educational attainment. Then, a comparative analysis is performed of the percent of persons living in such desired places within the TNJ region, examining differences between Non‐High and High Minority Communities, Non‐Low and Low Income Communities, and Non‐ Communities of Concern and Communities of Concern (as defined in Chapter 6).
In all, the FHEA report examines more than 25 opportunity indicators that shape the geography of opportunity across various spheres of living, including:
Education. Elementary School Reading Proficiency; High School Graduation Rate; and Learning Environment Offenses (weapons, vandalism).

TOGETHER North Jersey Fair Housing & Equity in Northern New Jersey
ES-7
Poverty. Percent of Students Receiving Free and Reduced Price Meals; and Percent of
Households Receiving Public Assistance Income.
Economic Health. Change in Private Sector Jobs, 1990‐2010; and Percent of Persons with
Bachelor’s or Higher Degrees. Municipal Fiscal Health. Median Family Income; and Tax Base per Capita
Housing and Housing Affordability. o Occupied Housing Units: Percent Owner‐Occupied Housing Units; and Percent Renter
Occupied Housing Units o Multifamily Units: Percent of All Units; Percent of Owner‐Occupied Units; and Percent of
Renter‐Occupied Units. o Housing Affordability: Owner Units Affordable to Households Earning 80% or Less of
HAMFI (HUD Area Median Family Income) per Square Mile; Rental Units Affordable to Households Earning 80% or Less of HAMFI per Square Mile; Cost‐Burdened Owner‐Occupied Households per Square Mile; and Cost‐Burdened Renter‐Occupied Households per Square Mile.
o Location of HUD Units: HUD Low‐Income Tax Credits; HUD Public Housing Units; and HUD Multifamily Units.
Health and the Environment. Foreclosures per Square Mile; Cancer Risk; Access to Healthy Food; and Access to Open Space.
Transportation, Access & Mobility. Population per Square Mile Served by Transit; Jobs within 45 Minutes by Transit; and Jobs within 45 Minutes by Auto.
Chapter 8: Physical Infrastructure and Public Investments examines where major public investments are being made within the TNJ region that hold the potential to connect people ‐‐ especially residents of concentrated areas of poverty and segregation ‐‐ to jobs, schools, and places of opportunity. The chapter examines public investment spending for several major topics of the TNJ Regional Plan, generally programs that have land use implications, where the investment can be linked to the location of the investment. Program spending is mapped and analyzed in comparison with the region’s environmental justice populations and, more broadly, communities of concern.
In preparing this mapping analysis, the relative transparency of various New Jersey programs for tracking project investments is revealed. The research process confirmed that additional technical capacity and coordination is needed – among private, public and quasi‐public entities – to effectively improve the region’s ability to monitor program performance and coordinate investment across resource topics to address issues relevant to establishing sustainable communities.
Economic Development. The New Jersey Economic Development Authority manages several programs that offer different kinds of incentives to create opportunities for job creation, real estate development, and economic revitalization. These programs are aimed at overcoming different financial barriers that prevent investment in New Jersey by both for profit and non‐profit entities. These program include Grow NJ Assistance Program, the Economic Redevelopment and Growth Program (ERG), and the Hazardous Discharge Site Remediation Fund.
o Grow NJ is a new program that combined several existing economic incentive programs, this analysis examined where NJEDA has made investments with the programs that

TOGETHER North Jersey Fair Housing & Equity in Northern New Jersey
ES-8
have been reorganized into Grow NJ. Between 2008‐2013, NJEDA made 213 investments in the BEIP, BRRAG, and Grow NJ programs, equaling $997.6 million in economic incentives for job retention and creation. Of this investment, 55%, or $545.8 million occurred in high minority places and 64% or $633.9 million in incentives were made in communities of concern, but only 33% or $329.8 million were invested in low‐income communities.
o NJEDA invested $531.8 million in 17 projects that were financed by the ERG program between 2008 and 2013, including one project financed under the expanded ERG program of The Economic Opportunity Act of 2013. A majority of NJEDA’s ERG investment was made in high minority places, with 90%, or $481.1 million in incentives, but only 17% of ERG incentives, or $89 million, went to low‐income areas. A large proportion of ERG investment went to Communities of Concern, with 94% of incentives, or $497.8 million of investment made in these areas. The pre‐determined geographic area established by NJEDA for ERG investment may have helped direct ERG incentives to these areas.
o NJEDA invested $84.2 million in the remediation of 260 sites between 2008 and 2013. Of the sites receiving funding for cleanup, 57% were in high minority areas and got $47.7 million in incentives, 48% were in low‐income places and received $40.3 million. Meanwhile, 88% of the funded sites were located in Communities of Concern and received $73.8 million in funding. This indicates that contaminated sites that were eligible to receive funding and were capable of applying for funding were in places characterized not only by high minority rates and low‐income households.
Transportation. Select categories of transportation program funding that could be mapped that were administered by the North Jersey Transportation Planning Authority (NJTPA) or New Jersey Department of Transportation (NJDOT) were examined, including the mass transit asset investments, multimodal programs, and safety management projects. While this is an important avenue of inquiry, the data resides in formats that do not always lend themselves to evaluation. For example, NJTPA maintains a digital catalogue of its Transportation Improvement Program (TIP) projects in several databases that represent different information about completed and planned transportation investments. There is a database of TIP projects and their funding sources, a database for TIP projects with their description and CIS category, and a database with TIP projects that is geo‐referenced. Each of these datasets has an uneven amount of information that does not correspond to the other datasets. This limits the NJTPA projects that can be analyzed in order to see where transportation investments are being made because a lot of data is lost when it is connected to geographic layers.
Below are some examples of transportation funding programs that were mapped and examined:
o NJTPA’s TIP program planned for 19 Mass Transit Asset investments in the TNJ region from 2004‐2012. Due to the physical nature of these investments, mass transit improvements were made in 151 census blocks. Of the census blocks receiving these infrastructure investments, 2% were in high minority communities, 50% were in low‐income communities, and 72% were in Communities of Concern
o There were 56 Multimodal Programs planned by NJTPA in the TNJ region between 2004 and 2012. These investments occurred in 274 census blocks. The majority of

TOGETHER North Jersey Fair Housing & Equity in Northern New Jersey
ES-9
these investments did not occur in census blocks with high rates of high minority households and low‐income households, as only 42% of those census blocks received Multimodal Program investment. Of the census blocks receiving multimodal infrastructure improvement projects, 60% were in Communities of Concern.
o NJTPA planned for 29 Safety Management projects between 2004 and 2012 in the TNJ region. These 29 projects produced safety improvements in 76 census block groups. Of the census block groups receiving these Safety Management improvements, 43% were high minority communities, 17% were low‐income communities, and 54% were Communities of Concern. This indicates that many of the Safety Management improvements were made in communities not characterized by these factors.
o Of the schools receiving Safe Routes to School grants, 46 were in places with high levels of carless households. This equals forty percent of all the schools receiving aid through this program. All of these schools were also in Communities of Concern. This shows that the distribution of Safe Routes to School grants is working towards improving access to schools and opportunities, especially in places where alternate transportation programs are useful.
Energy Efficiency. The New Jersey Board of Public Utilities has made 122 investments in Pay for Performance upgrades equaling $14.9 million. Of the energy performance upgrade investments made, 66%, or $9.8 million occurred in high‐minority communities, 44% or $6.6 million went to low‐income communities, and 86% or $12.9 million was allocated to Communities of Concern which also include places with high rates of LEP persons, carless households, and female head of households.
Arts and Culture. The majority of New Jersey State Council on the Arts (NJSCA) investment was distributed in places that have a high minority population, a majority low‐income population, or a community of concern. Spending on the arts totaling $23.2 million, or 63% of arts investment was awarded to high minority areas and $22.8 million, or 62% of arts investment was awarded to low‐income areas. Meanwhile, $27.4 million, or 75% of arts investment was directed towards communities of concern. The high proportion of investment that is directed at high minority areas, low‐income areas, and communities of concern aligns with the intention of the NJSCA to promote economic opportunities through arts and culture investment. The NJSCA helps promote arts development and economic revitalization, land use redevelopment, job opportunities, and access to education in places that have low access to these opportunities.
Many of the public investment programs in the TNJ region provide complementary benefits. Site remediation, job retention incentives, mass transit and safety enhancements, Safe Routes to School, and arts investment all work together to create better economic, educational, and quality of life opportunities for the region. However, the prioritization and funding of these exemplar programs are invariably made in isolation. It would help public investment decision making to align public investment data between the different programs and funding sources so that there is a big picture view of where public investment is being made and how the different investments interact. For this to work, the investments should be geo‐referenced and mapped so the geographical relationship between investments can be identified.
Chapter 9: Assessment of Fair Housing Issues describes Federal and State laws addressing barriers to fair housing through nondiscrimination laws, executive orders and guidance. The chapter highlights a

TOGETHER North Jersey Fair Housing & Equity in Northern New Jersey
ES-10
range of enforcement activities and programs used to identify and address housing discrimination and affirmatively further fair housing in accordance with the nation’s civil rights and fair housing laws.
Enforcement. The chapter describes the programs in place to monitor fair housing discrimination complaints, highlighting recent patterns and trends in the type of complaints made and their resolution. The Fair Housing Council of Northern New Jersey is the only designated enforcement agency in the State of New Jersey. The FHC conducts investigations into fair housing violations. When necessary, the FHC helps its clients through the process of filing a complaint with HUD or filing a lawsuit in state or federal court. The FHC recruits volunteers to serve as “mystery shoppers” to document instances of unlawful discrimination, using techniques approved by the United States Supreme Court.
Testing. Testing is a valuable tool to investigate housing market practices and to document illegal housing discrimination practices that persist in the rental and sale of housing. Fair Housing Testing approaches are used by HUD for program analyses, and by the United States Department of Justice for fair housing enforcement. In its 2012 study, the fourth such nationwide study since 1977, HUD found that the most blatant forms of housing discrimination have declined, but minorities receive less information about available units, raising the costs of their housing search and range of housing choice options.
o Nationwide, minority homeseekers whose ethnicity is more readily identifiable experience more discrimination than those who may be mistaken for whites. The study did not find substantial differences in the incidence or severity of discrimination across metropolitan areas or regions of the country, suggesting that housing discrimination remains a national problem. It was neither more nor less severe in housing markets hit hardest by the Great Recession.
o Since 1992, the U.S. Department of Justice has filed 98 pattern and practice testing cases nationally with evidence directly generated from the Fair Housing Testing Program, the vast majority of which involved allegations of agents misrepresenting the availability of rental units or offering different terms and conditions based on race, and/or national origin, and/or familial status. Of the 96 resolved cases to date, the Department of Justice has recovered over $2.3 million in civil penalties and over $10.5 million in other damages.
Voucher Programs. The federal Housing Choice Voucher program dates back to the mid‐1970s. This program provides vouchers to low‐income households that cover the difference between the 30 percent of household income target household expenditure for housing and the maximum allowable rent (Fair Market Rent), adjusted by location, determined by HUD. This program, designed to help low‐income households rent existing housing in the private sector as an alternative to building more designated low‐income housing units, became the dominant form of low‐income housing assistance within a decade and remains today one of the leading federal housing investments nationally.
Affirmatively Furthering Fair Housing. The Consolidated Housing Plan is a five‐year comprehensive planning document prepared by HUD grantees intended to define priorities and serve as a guide in coordinating the delivery of limited housing, community and economic development resources to meet the needs of various program clienteles. These plans are used to identify needs and adopt strategies to address those needs, focused primarily on low and moderate income (LMI) individuals

TOGETHER North Jersey Fair Housing & Equity in Northern New Jersey
ES-11
and households, but also on the needs of persons with “special needs” such as the elderly, persons with disabilities, large families, single parents, homeless individuals and families, and public housing residents. The HUD Consolidated Plan regulations required each state and local government to submit a certification that it is affirmatively furthering fair housing. This means that it will conduct an analysis of impediments to fair housing choice (“AI”); take appropriate actions to overcome the effects of impediments identified through that analysis; and maintain records reflecting the analysis and actions.
o The United States v. Westchester County litigation illustrates the extent to which a HUD‐ funded entity could diverge from the long‐established national goal of ensuring access and choice in housing for racial and ethnic minorities. It underlines the challenges of addressing historic patterns of housing segregation and locally‐established regulatory barriers to affordable housing with a locally‐administered program. Ineffective federal oversight and inadequate guidance had created an environment where a HUD grantee could largely ignore the fair housing requirements and continue to receive federal funding.
o On July 19, 2013 HUD published and invited comments on a proposed rule to “refine and improve the process currently known as the Analysis of Impediments to Fair Housing Choice (AI), which HUD grant recipients must undertake in keeping with their obligation to ‘affirmatively further fair housing (AFFH).’”
NJ Civil Rights Law. The civil rights provisions of the Constitution of the State of New Jersey are implemented through the New Jersey Law against Discrimination and the Mount Laurel doctrine, the latter of which was established by the New Jersey Supreme Court and implemented through legislation and administrative authorities. Legislation enacted in 2008 to prepare, adopt, and maintain a New Jersey Strategic Housing Plan is yet to be implemented.
Fair Housing Implications of Housing Market Collapse. The nationwide collapse of housing markets in 2006 and 2007 heralded not only an economic recession but increased difficulties in gaining fair housing choice or equitable access to opportunity due to foreclosures, neighborhood impacts, and loss of mortgage credit.
o Foreclosures on existing home mortgages resulted in thousands of households and families in the TNJ Region losing their homes, typically their primary economic asset, forcing them to re‐enter the housing market as renters at a time when their financial capacity was weakest. While housing mortgage foreclosures within the TNJ region have tended toward concentration in urban centers and inner suburbs, they were not limited to these areas. The resulting dislocations of households often had adverse secondary effects of reducing access to places of opportunity such as high quality schools and healthier environments. The flood of new entries into the lowest levels of the housing market also created a “seller’s market”. Home sellers and landlords could deny homeseekers in protected classes without economic or other consequences unless individuals took the initiative to report fair housing violations.
o In many parts of the region, particularly urban areas, concentrations of housing mortgage foreclosures have destabilized neighborhoods and even entire municipal budgets and services. In areas of foreclosed properties, or even in areas of financial stress, occupied properties may also suffer from reduced maintenance or blight as property values decline,

TOGETHER North Jersey Fair Housing & Equity in Northern New Jersey
ES-12
in turn exacerbating already reduced access to capital for investments in property improvement and enhancement. While federal Neighborhood Stabilization Program funds help to address these issues, they are increasingly limited if not fully expended, resulting in only a modest role in stabilizing the areas where they have been applied.
o In 2006‐2007, the mortgage finance system throughout the United States collapsed as a result of the emerging subprime mortgage industry and the growth of private label mortgage securitization. As a result, access to mortgage financing for homeownership became increasingly limited. While this has eased slightly in recent quarters, first‐time buyers, low and moderate income households, and buyers in urban neighborhoods that have experienced high foreclosures and significant value loss still experience great difficulties in obtaining mortgage approvals.
Fair Housing Impacts of Hurricane Sandy. In response to complaints from civil rights organizations including the NAACP, Latino Action Network, and Fair Share Housing Center, HUD announced a settlement agreement with the State of New Jersey to make more funds available to assist with the recovery from Hurricane Sandy.
Zoning and Age Restriction Effects on Fair Housing. Finding the zoning requirements that satisfy price, rent, costs, space, accessibility, and other requirements for fair and equitable housing units while minimizing government or project based (such as COAH affordable unit set‐asides) subsidies remains a work in progress. Age‐restricted communities, in which 80% or more of the occupied homes have 55 and older adults living in them, are exempt from the prohibition against familial status discrimination. This exemption protects these communities from having a discrimination complaint filed against them by families with children under 18 years of age. There are many age‐restricted communities in the TNJ planning region, particularly in central and coastal counties.
Housing Mobility Counseling. Mobility counseling for voucher holders will result in higher utilization of housing vouchers. Mobility counseling consists of search assistance; listings of available units; van tours and transportation to see units, if necessary; community information; a resource room; assistance with voucher paperwork and inspections; and follow up. Orientation and workshops may provide information on high opportunity areas, tenant/landlord rights and responsibilities, home maintenance, financial management, schools, and building community. One on one counseling is usually highly effective. Some counseling programs are teamed with financial assistance such as loans for security deposits, incentive payments for households to move to high opportunity areas, or paying holding fees for landlords.
Chapter 10: Conclusions and Recommendations summarizes the challenges and the potential for providing fair and equitable housing in the TNJ planning region. It outlines a vision and recommends strategies and actions for inclusion in the TNJ Regional Plan for Sustainable Development.
The region remains divided in ways that are likely to threaten the region’s economic future. Lower‐income and minority residents of the older urban and inner suburban rings of the region have far less favorable access to higher quality housing and neighborhoods, quality schools and employment opportunities than the generally more affluent, non‐Hispanic white residents of the outer suburban rings of the region. Despite decades of governmental efforts to address disparities, major challenges to fair and affordable housing in the region persist, including:
o Federal Fair Housing Act enforcement has been indirect and underfunded.

TOGETHER North Jersey Fair Housing & Equity in Northern New Jersey
ES-13
o Affordable housing programs have not resulted in fair housing outcomes. o Municipal land use zoning remains exclusionary and counterproductive. o Housing policy is education policy. o Tax policy is housing policy. o Transportation policy and investments shape access to opportunities.
A vision for a fair and equitable housing policy is described, including:
o The Region Affirmatively Furthers Fair Housing; o Housing Supply is Diversified to Meet Current and Future Demand for Housing; o Access to Opportunity Is Increased through Housing Mobility; o Public Investment Creates, Connects and Strengthens Places of Opportunity; o Fair Housing Activities Are Substantially Increased through CDBG Funding; and o More Housing Opportunities are Available for People with Disabilities
In light of this vision, the FHEA identifies 15 key strategies and associated actions to address the challenges to fair, equitable, and affordable housing and improved access to places of opportunity.
Relevant descriptive information, including but not limited to priority, current examples of the vision in practice, and responsibility for implementation, is provided for each strategy and action. Expected time frames for implementation are short term (less than 18 months), medium term (18‐48 months)
and long term (more than 48 months).
Table ES‐1 presents a summary of vision, strategies and actions toward Fair Equitable and Affordable Housing in the TNJ Region.

TOGETHER North Jersey Fair Housing & Equity in Northern New Jersey
ES-14
Table E‐1: Summary of Vision, Strategies, and Actions toward Fair Equitable and Affordable Housing in the TNJ Region
Vision 1: The Region Affirmatively Furthers Fair Housing Strategy 1. Maintain Fair Housing Assessments (Section 10.3.1)
1.1 Review and approve, as appropriate, fair housing assessments and housing programs that comply with the Affirmatively Furthering Fair Housing Requirements of the Fair Housing Act which ensure transparency, increase the role of the public planning process, and create a stronger link to planned public investments.
1.2 Prepare and adopt for HUD review and approval fair housing assessments and housing programs that comply with the Affirmatively Furthering Fair Housing Requirements of the Fair Housing Act which ensure transparency, increase the role of the public planning process, and create a stronger link to planned public investments.
2. Require fair housing assessments for municipalities that are not recipients of HUD aid as part of the COAH certification process.
Strategy 2. Improve Regional Oversight to Affirmatively Further Fair Housing (Section 10.3.2)
1. Increase funding for non‐profit and state agencies to investigate individual claims of discrimination.
2. Investigate individual claims of discrimination
3. Establish a North Jersey Fair Housing Council of Governments with members from Federal, State, County, municipal, and public housing agencies and authorities.
Strategy 3. Use the FHEA in Decision Making (Section 10.3.3)
1. Incorporate findings, strategies, and actions of the FHEA into the RPSD and its implementation.
Strategy 4. Improve Data for Decision Making (Section 10.3.4)
1.1. Collect and distribute data required to Affirmatively Further Fair Housing.
1.2 Provide to HUD, and use data to be distributed by HUD, pursuant to the new HUD AFFH rules.
2. Collect and aggregate geographic and financial data on public infrastructure investment in New Jersey and the TNJ
region.
3. Integrate data on recent and planned public investments and indicators on the population with project prioritization
criteria
4. Improve the transparency, comprehensiveness, accuracy, and transferability of State and local data sets collected in
association with Affirmatively Furthering Fair Housing requirements of the Federal and State Fair Housing Acts.
5. Troubleshoot and translate HUD data, with particular emphasis on placing data on State GIS data web sites.
6. Prepare and post online an issue brief regarding Opportunity mapping. Prepare and post online an issue brief
regarding Opportunity mapping. Develop an online portal for delivery of FHEA data sets in customized formats.

TOGETHER North Jersey Fair Housing & Equity in Northern New Jersey
ES-15
Table E‐1: Summary of Vision, Strategies, and Actions (cont.) Vision 2: Housing Supply is Diversified to Meet Current and Future Demand for Housing
Strategy 1. Mandate and Enforce Inclusionary Housing Policies (Section 10.4.1)
1. Establish NJ Fair Housing Act rules to require elimination of exclusionary zoning practices in areas appropriate for
development and redevelopment.
2. Target State Affordable Housing Trust Funds for housing production and preservation.
3. Increase the percent of realty transfer fees dedicated to the State Affordable Housing Trust Fund.
4. Revise the affordable housing minimum requirement for transit oriented development to 20% affordable regardless
of a town’s COAH requirement.
5. Amend municipal zoning ordinances to require or codes to allow for increased density, mixed‐use development,
new and innovative housing types (e.g. micro‐units), manufactured housing, and accessory housing (e.g. basement,
attic apartments).
6. Require employers getting tax credits under Economic Redevelopment and Growth Grant Program or Grow NJ to
establish employer‐assisted housing opportunities.
7. Require market housing developers to provide 20% of their units as affordable in exchange for incentive‐based
policies such as density bonuses, reduced‐cost and free land, and expedited approvals.
8.1 Comply with state law requiring towns to commit Municipal Housing Trust Funds to affordable housing initiatives
within 4 years of receipt of development funds, but allow exceptions for housing market conditions.
8.2 Require that all Municipal Housing Trust Funds that revert to the State be assigned to NJDCA and NJHMFA to be
used to provide affordable housing or to assist households in obtaining housing within the municipality from which
the funds were obtained.
9. Work with nonprofits and redevelopment agencies to create land trusts as a way to keep housing permanently
affordable.
10. Identify and establish funding streams for ongoing maintenance of land trusts.
11. Appoint a housing commission to have all state housing programs work together to be more effective.
12. Authorize a new Department of Housing to serve as the lead agency for all state housing initiatives.
13. Update and expand housing studies, fair share housing plans, and appropriate master plan elements to determine
needs for low‐, moderate‐, middle‐, and other income housing and housing types.
14. Use municipal enforcement data on illegal housing conversions and overcrowding to inform changes in zoning to
permit conversions of single family to multifamily dwellings, and to promote adaptive re‐use/redevelopment of
non‐residential buildings for residential and mixed‐uses to legally respond to over‐crowding. Strategy 2. Provide Incentives and Financial Support for Development of Housing Types Not Being Produced
by the Market (Section 10.4.2)
1. Amend the Abbott educational funding formula to provide additional financial aid to suburban school districts that
include affordable housing development for special needs populations.
2. Replenish the currently depleted Special Needs Housing Trust Fund.
3. Target HOME dollars and municipal and state housing trust funds toward low income and special needs
populations
4. Expand supportive services under Medicaid as a potential alternative to Use Medicaid savings that will result from
providing Special Needs housing to fund that housing where feasible and appropriate.
5. Establish and maintain County Homeless Trust Funds to fund programs to end homelessness.
6. Expand funding for the State Rental Assistance Program (SRAP) or similar program through a new dedicated fund or
appropriation sufficient to offset reductions in Federal funding support.
7. Employ incentive‐based policies for housing production such as density bonuses, reduced‐cost and free land, and
expedited approvals.

TOGETHER North Jersey Fair Housing & Equity in Northern New Jersey
ES-16
Table E‐1: Summary of Vision, Strategies, and Actions (cont.) Strategy 3. Locate Affordable Housing in Places with High Access to Opportunities (Section 10.4.3)
1. Allocate federal Low Income Tax Credits (LIHTC) to emphasize the location of family‐oriented and mixed income
affordable housing in higher opportunity suburban communities.
2. Expand eligibility and priority for federal Low Income Tax Credit (LIHTC) and other relevant federal programs to
create and maintain affordable and special needs housing units in areas of higher opportunity.
3. Expand eligibility and priority for New Jersey Council on Affordable Housing (COAH) and other relevant State
programs to create and maintain affordable and special needs housing units in areas of higher opportunity.
4. Ensure that public and publicly subsidized housing units are not more vulnerable to flooding and other natural
hazards or to sources of environmental contamination than neighboring housing units.
5.1 Through zoning or redevelopment plans, encourage mixed‐use developments or mixtures of land uses that provide
opportunities for supportive housing within 1/8 mile of a transit station or stop.
5.2 Through zoning or redevelopment plans, encourage mixed‐use developments or mixtures of land uses that provide
opportunities for affordable housing within ¼ mile of a transit station or stop.
5.3 Through zoning or redevelopment plans, encourage mixed‐use developments or mixtures of land uses that provide
opportunities for employment for a range of incomes within ½ mile of a transit station or stop that includes and
improves access to fresh food, health care services, and neighborhood retail.
6. Through zoning or redevelopment plans, require mixed‐income housing and space for jobs of a wide range of types
and incomes within walking distance of transit.
7. Establish reasonable design guidelines to ensure that affordable housing units are visually compatible with market
price units.
8. Educate the public with data describing the average population of affordable housing units with regard to age,
employment, occupation, and disabilities relative to the population at large to counter the prejudice associated
with the planning and construction of affordable housing units.
9. Through zoning or redevelopment plans, and through financial, rent control and property tax relief programs,
protect or provide equal or better opportunities for housing for existing low‐income and special needs households
within neighborhoods that are gentrifying or at high risk of gentrifying.
10. Prioritize funding for magnet schools that focus on community needs and reduce racial and economic isolation for
children living in areas in Communities of Concern slated for major redevelopment to increase educational
opportunity.
11. Remove LIHTC program incentives for Qualified Census Tracts, or extend the incentive to Areas of High Opportunity
12. Expand the use of mandatory set‐asides to require 20% of any new housing development or redevelopment
assisted by any form of federal or state aid to be affordable units, half for low income and half for moderate‐income
households, provided the projects are not located in Communities of Concern.
13. Locate public housing projects near places of high opportunity.
14. Apply Choice Neighborhood program concepts to work with institutions and businesses near housing projects to
increase local employment and provide neighborhood services and amenities.
15. Offset educational expense with PILOT contributions from subsidized housing developments and residential
redevelopment.
16. Increase Fair Market Rents for Housing Choice Voucher holders, so that they may have more opportunities to find
housing in places with high Access to Opportunities within the payment standards limits.
Strategy 4. Create Employer Assisted Housing Accessible to Employment Centers (Section 10.4.4)
1.1 Provide incentives to businesses to provide for employer‐assisted housing that is accessible to employment centers
by walking, bicycle, or public transit.
1.2 All government jurisdictions should provide financial incentives to their low and moderate income employees to
enable them to live near their place of employment, accessible by walking, bicycle, or public transit.
2. Make employment centers more accessible by walking, bicycle, or public transit to support and encourage
employer‐assisted housing.
3. Re‐institute the commercial developer fee for affordable housing, with a new provision enabling a portion of the
fee to go to affordable housing for the employees of the commercial enterprise that is paying the fee.

TOGETHER North Jersey Fair Housing & Equity in Northern New Jersey
ES-17
Table E‐1: Summary of Vision, Strategies, and Actions (cont.) Vision 3: Access to Opportunity Is Increased through Housing Mobility
Strategy 1. Regionalize Housing Choice Voucher Programs (Section 10.5.1)
1. Increase the transferability of Housing Choice Vouchers among public housing authorities to provide more housing
options closer to better job and education opportunities.
2.1 Provide incentives or mandates to consolidate and centralize the administration of Housing Choice Vouchers
through consortia of public housing authorities within regions.
2.2 Consolidate and centralize the administration of Housing Choice Vouchers through consortia of public housing
authorities within regions.
3. Provide Housing Choice Vouchers and low cost loan opportunities to residents facing displacement from
gentrification.
4. Increase “urban county” CDBG program funding to cover costs of housing mobility counseling.
5.1 Place families using Housing Choice Vouchers into high and maximum Areas of Opportunity.
5.2 Increase administrative fees to local Public Housing Authorities (PHAs) for Housing Choice Vouchers assisting
families to locate in high Areas of Opportunity.
5.3 Reduce administrative fees to PHAs for Housing Choice Vouchers that over‐concentrate families in low and medium
Areas of Opportunity.
6. Update and increase, as appropriate, Fair Market Rent calculations, particularly in areas of High Opportunity, to
ensure that HCVs cover monthly rents without need of supplemental rent assistance programs.
1. Link Regional HCV Programs to COAH Housing (Section 10.5.2)
1. Link Housing Choice Voucher programs (public subsidies) with privately subsidized mixed‐income inclusionary
housing programs (e.g. COAH and LIHTC) to make housing options in the suburbs more affordable.
2. Link Regional HCV Programs with School Funding Programs (Section 10.5.3)
1. Link regional Housing Choice Voucher programs with Federal and State public education funding to provide
affordable housing in communities with high quality schools.
Vision 4: Public Investment Creates, Connects, and Strengthens Access to Opportunity Strategy 1. Ensure Public Investment Programs Connect and Strengthen Communities of Concern (Section
10.6.1)
1. Prepare demographic profile at county level that identifies the location of high‐minority, low‐income and
disadvantaged populations and Communities of Concern on a regular basis to support public involvement, planning
and project development, program evaluation, and investment prioritization.
2. Publish online and in centralized data web sites clear and transparent information about the investment programs
available in many formats and multiple languages.
3. Develop leadership capacity of representatives from communities of color and low‐income communities where
needed to influence infrastructure investments targeted to advancing sustainable communities and
recommendations of the FHEA and RPSD.
4. Develop pilot program focused on community safety and ladders of opportunity that provide project‐related
resources for studies and technical assistance to directly engage with NGOs who work with traditionally
disadvantaged populations in communities of concern in association with local and county jurisdiction partners.

TOGETHER North Jersey Fair Housing & Equity in Northern New Jersey
ES-18
Table E‐1: Summary of Vision, Strategies, and Actions (cont.) Strategy 2. Adopt Program and Prioritization Criteria to Better Connect Communities of Concern to Places of
Opportunity and In‐Place Solutions (Section 10.6.2)
1.1 Prepare an Infrastructure Needs Assessment identifying capital projects required to implement the strategies and
actions of the FHEA.
1.2 Use the Infrastructure Needs Assessment to evaluate the equity of public infrastructure investments in the region,
provided that information is made available to determine whether the investments will increase Access to
Opportunity or decrease equal Access to Opportunity.
2. Review all capital budgets, programs, and project plans to determine their impact on FHEA strategies and actions,
and give greater priority to resource allocation and timing to programs and projects that Affirmatively Further Fair
Housing in the TNJ region.
3. Develop leadership capacity of representatives from communities of color and low‐income communities where
needed to influence infrastructure investments.
Vision 5: Fair Housing Activities Are Substantially Increased through CDBG Funding Strategy 1. Increase Fair Housing Activities through CDBG Funding (Section 10.7.1)
1. Provide additional funding for fair housing enforcement activities.
2. For every land use plan, land development project, and capital improvement plan or project, identify and give
priority to equitable outcomes related to jobs, environmental justice concerns, and displacement concerns.
3. Organize municipal working groups to ensure high engagement of community and equity groups.
4. Fund capacity building training provided by not‐for‐profit organizations for community groups and agencies, to
enable them to understand connections between FHEA and their work.
Vision 6: More Housing Opportunities are Available for People with Disabilities Strategy 1. Increase the Supply of Accessible Housing for Persons with Disabilities (Section 10.8.1)
1. Expand the applicability of fair housing requirements in the State of New Jersey to include all new residential and
mixed use structures including three (3) or more dwellings, with special consideration for the re‐use of existing
buildings.
2. Revise zoning to require Universal Design and other appropriate design requirements for accessibility of buildings in
all commercial and institutional zones, in all residential zones within ¼ mile of transit stops, and in all age‐restricted
(55+) housing developments.
3. Design all capital improvements for public facilities to Increase the ability of people with disabilities and special
needs to access jobs, housing, and services.
4. Incorporate appropriate changes to NJ's Uniform Construction Code affecting new construction and renovation of
residential properties to Increase the supply and accessibility of housing for people with disabilities and special
needs.
5. Research the other federal, state, regional, and local standards and actions that impede Increasing the supply and
accessibility to housing for people with disabilities and special needs, and identify appropriate changes and
priorities.

TOGETHER North Jersey Fair Housing & Equity in Northern New Jersey
1-1
1 Introduction
Equitable access to opportunities is a critical underpinning of building sustainable communities and an integral consideration for TOGETHER North Jersey’s Regional Plan for Sustainable Development. Therefore, the planning process includes a comprehensive exploration of Fair Housing and Equity issues in the Northern New Jersey region.
1.1 About TOGETHER North Jersey
TOGETHER North Jersey (TNJ) is a voluntary partnership of jurisdictions, organizations, educational institutions, and businesses working together to create a Regional Plan for Sustainable Development for its 13‐county planning region in North Jersey, based on the North Jersey Transportation Planning Authority region.
For this unprecedented planning initiative, the U.S. Department of Housing and Urban Development (HUD) awarded TOGETHER North Jersey (aka, North Jersey Sustainable Communities Consortium) a $5 million Sustainable Communities Regional Planning Grant in November 2011. The grant is matched with an additional $5 million in leveraged funds from project partners. Grant funds are intended to:
1. Develop a Regional Plan for Sustainable Development (RPSD) for the 13‐county planning region; 2. Implement up to 40 local planning initiatives; 3. Provide technical assistance and education opportunities that build the capacity of jurisdictions,
organizations and the public to advance the development of sustainable communities through programs, projects and initiatives.
The final RPSD will be “place‐based” and “issue‐based” and will use sustainability, transit system connectivity and Transit‐Oriented Development (TOD) as the central framework for integrating plans, regulations, investments, and incentive programs at all levels of government to improve economic and environmental conditions, while promoting regional equity and resource efficiency.
As envisioned, the RPSD will establish a regional framework for sustainable community development. The RPSD will seek to harmonize existing plans within the State and North Jersey region and will foster an integrated regional vision for where future housing development (including housing affordable to a range of income levels), jobs and education centers, transportation infrastructure, water and wastewater infrastructure, green infrastructure and other investments should be made to achieve RPSD goals and program outcomes.
1.2 About the Project
The outcome of plan implementation will be a more sustainable future for the region that invests in existing communities, making housing, jobs, education, cultural, and recreational opportunities more accessible to most residents of the region without having to drive to them. At the end of its 3‐year grant period, TOGETHER North Jersey hopes to have carried out an ambitious program of research and planning activities with the following products and strategic outcomes for Northern New Jersey:
1. A Regional Plan for Sustainable Development (RPSD), consistent with the State Strategic Plan that has been prepared with significant input from the region’s residents, businesses, local officials and others. Recommended strategies and action steps that public (state, regional and local), private and

TOGETHER North Jersey Fair Housing & Equity in Northern New Jersey
1-2
non‐governmental decision‐makers should take to implement the plan are articulated. Action steps may include changes to laws, regulations, policies, programs and capital investments, consistent with the county investment maps, to help achieve the plan’s vision. Examples include:
Changes in how government agencies prioritize investments in transportation and other infrastructure,
New laws to give towns tools to fund infrastructure, attract development and/or preserve land.
Municipal zoning changes that will allow desired projects to be built.
2. Up to 40 local planning projects that foster livable communities and serve as models for the region are completed.
Up to 18 “local demonstration projects” that bring local leaders together to improve conditions in areas near existing/planned transit service. Each includes an implementation plan with commitments from key players.
Nine counties and five cities have used local planning grants to support and advance the regional plan, such as through detailed strategies to ready priority growth areas for investment and upgrade roads to serve walkers, cyclists and drivers.
Hundreds of residents in seven communities have worked with local nonprofits to conceive and advance projects aimed at improving neighborhood safety, promoting economic development and enhancing connections to transit.
3. Key decision‐makers, local leaders and citizens commit to advancing the work outlined in the plan.
Dozens of focused conferences and workshops provide information, tools and networking opportunities
Hundreds of local and regional groups such as Green Teams, Business Improvement Districts, Main Street Districts and business associations endorse the RPSD and align their local efforts accordingly.
Elected and appointed state, regional and local officials and entities, including the North Jersey Transportation Planning Authority (NJTPA), pass formal resolutions and/or align their planning documents and investment priorities with the RPSD
4. An organization or organizations have committed to shepherding the plan forward after the grant period ends.
1.3 What is the FHEA
As part of the process to develop a Regional Plan for Sustainable Development (RPSD) for the TOGETHER North Jersey planning region, the TNJ Project Team worked with the TOGETHER North Jersey Steering Committee and Standing Committees to conduct a Fair Housing and Equity Assessment (FHEA) for the region, resulting in this report.
The Fair Housing and Equity Assessment (FHEA) provides a framework for considering what it may mean to live in places of “high” or “low opportunity” in Northern New Jersey. The FHEA identifies how the benefits or burdens of residential settlement location may be experienced differently by various groups across the region and provides a platform for addressing these disparities. Among other issues, the FHEA includes an assessment of:
Patterns of segregation, diversity, and racial and ethnic integration;

TOGETHER North Jersey Fair Housing & Equity in Northern New Jersey
1-3
Concentrations of poverty; and
Accessibility to areas of high “opportunity”
The FHEA also examines how patterns of planned and recent infrastructure investments; fair housing issues, services, and activities; and regulatory and private market barriers to fair housing choice have helped to shape the region’s existing socioeconomic patterns.
In preparing the FHEA, TNJ has conducted extensive data analysis, held an array of deliberative processes that considered the methods and findings of the analysis, and invited participating stakeholders to explore and recommend strategies and actions to address regional disparities in fair housing and access to opportunity to inform the development of the TOGETHER North Jersey RPSD.
Neighborhood organizations, community development corporations, social service organizations, business associations and groups representing the interests of racial and ethnic minorities have provided invaluable insights in defining “opportunity” in Northern New Jersey throughout this study. Some of these organizations received funding through micro‐grants to help encourage continuing participation in the TOGETHER North Jersey initiative. Fostering meaningful engagement processes with a diverse set of stakeholders has proven to be an essential step in understanding the path forward for the RPSD.
Identifying where places of opportunity exist and who has access to them has been an important lens through which to examine and formulate strategies and actions for the RPSD. Removing barriers to fair housing choice in places of high opportunity holds promise for improving our region’s economic competitiveness and resilience in the face of inevitable change. Greater recognition of what it means to have access to places of high opportunity also advances greater appreciation of our shared values and goals ‐‐‐ for ourselves, our families, our region ‐‐ in the spheres of housing, education, workforce development, access and mobility, safe and healthy communities, and the environment.
1.4 Why is TNJ Preparing an FHEA?
Building from the shared values exercises conducted in the discovery phase of the regional planning process, the RPSD seeks to advance a vision that will:
Grow a strong regional economy;
Build great places to live, work and visit;
Increase access to opportunity for everyone;
Protect the environment; and
Work together to ensure a prosperous future for its residents and workers.
However, regional patterns of disparity may be affecting the economic competitiveness of the North Jersey region, weakening the sustainability of many communities and their residents and families. There is a growing body of research that recognizes that regional patterns of racial exclusion and widening economic inequality matter for regional growth. Gaps between city and suburbs have been associated with stagnation in regional income and jobs. Per capita growth has been found to be faster where poverty gaps and segregation are lower. Places with strong human capital foster innovation and thrive

TOGETHER North Jersey Fair Housing & Equity in Northern New Jersey
1-4
while places of persistent patterns of poverty and social and economic isolation do more poorly Figure1‐1RegionalPlanDevelopmentProcess
With the FHEA, TOGETHER North Jersey has sought to consider how the promise of fair housing and more equitable access to opportunities can improve the region’s sustainability and competitiveness. These considerations have been integral to each step in the regional planning process and have provided an important opportunity to strengthen potential equitable outcomes of the plan (see Figure 1‐1).
TOGETHER North Jersey formed an advisory group to promote and explore thoughtful integration of fair housing and equity considerations throughout the planning process. The advisory group was created expressly to advise on the FHEA technical analysis, provide feedback on its findings to its preparers, and ensure that the deliberations of the Steering and Standing Committees appropriately considered the implications and findings of the FHEA in formulation of strategies and actions for the RPSD.

TOGETHER North Jersey Fair Housing & Equity in Northern New Jersey
1-5
Table2‐1:SummaryoftheFHEAApproach
Data Deliberation Decisionmaking
Data, Mapping and Indicators
Demographic Profile
Segregation
Isolation
Concentrated Poverty
Access to Opportunities
FHEA Advisory Group Discovery Workshops
NGO Organized Event(s) Regional FHEA Workshops
Experts
State Partners
Housing and Community Development Partnership (housing authority and entitlement communities)
Environmental Justice Partnership Group
Regional Meeting
Local District Councils Standing Committees
Standing Committee Agenda
Steering Committee
Executive Committee
Standing Committees
General Membership
Fair Housing Activities
Services
Investments
Complaints
Housing and Community Development Partnership Groups
Industry and Business Partnership Groups
Recent and Planned Public Investment
Transportation
Open Space
Economic Development
Community Development
Housing
State Agencies
MPOs
County & Local Governments
1.5 How the FHEA Informs the RPSD
Data Analysis & Tools 1.5.1
The FHEA examines existing conditions and trends through a fair housing and regional equity lens, utilizing regional level and geospatial demographic and economic datasets. Patterns of segregation/integration, concentrations of poverty and disparities in access to “opportunity” are presented. In addition to geospatial data analysis, the Project Team collected and analyzed data and information related to Fair Housing Act compliance in the region, and examined how non‐housing investments in regional infrastructure may have in the past, or could in the future, impact equity and access to opportunity. The data and analysis results are designed to be accessible and informative to

TOGETHER North Jersey Fair Housing & Equity in Northern New Jersey
1-6
support and provoke meaningful discussions about how the region can address fair housing and equity issues highlighted in the analysis. To facilitate understanding of regional patterns and trends, data and analysis are be presented in multiple formats, including: narrative, data tables, graphics, photographs and maps, both in this report and on the www.togethernorthjersey.com website.
Deliberations 1.5.2
With its application to HUD, TOGETHER North Jersey set a goal of integrating equity considerations into each stage of the planning and implementation process, embracing the importance of focusing on access to opportunities for all of the region’s residents and assessing the benefits and burdens that accrue to each area from the region’s policies, investments and endorsed strategies and actions. The FHEA is not meant as a “desktop” exercise, but rather a means to frame and advance public discussions about equity throughout the development of the RPSD. Fostering a better understanding of the issues raised by the FHEA and developing strategies to address them are a key component of TNJ’s planning and implementation process. Appendix G describes the stakeholder and public engagement processes that have been undertaken to inform the FHEA’s development.
Decision Making 1.5.3
The TNJ Steering Committee and its Executive Committee are the primary decision‐making bodies of the Consortium. TNJ’s three standing committees played a central role in the regional visioning and strategy identification processes. The scope of the FHEA analyses – its attention to traditionally disadvantaged populations, its focus on access to opportunity dimensions, its involvement processes ‐‐ touched upon each of the core topics of the RPSD and, as such, have been the responsibility of each of the standing committees to consider and address the challenges illustrated through its benefits and burdens framework. The FHEA is a fully integrated element of the RPSD.

TOGETHER North Jersey Fair Housing & Equity in Northern New Jersey
2-1
Key Definitions and Criteria
Minority refers to persons other than Non‐Hispanic White residents.
Low‐Minority municipalities have less than 20% minority.
High‐Minority municipalities have over 60% minority populations.
Racially Diverse municipalities have no less than a 20% minority and no more than 60% minority population in their jurisdiction.
Inclusive municipalities have a rental housing supply that comprises at least 20% of the total housing stock and multi‐family housing supply with three or more units per structure that comprises at least of 20% of the supply. Municipalities must meet both criteria to be deemed inclusive.
Fair Housing is the opportunity for every person to buy, rent or obtain a mortgage for housing without being unlawfully discriminated against because of their background.
Title VIII of the Civil Rights Act of 1968, commonly referred to as the United States Fair Housing Act, seeks to eliminate discrimination in the provision of housing in communities that receive federal funds. This law prohibits discrimination in the sale, rental, and financing of dwellings, and in other housing‐related transactions, based on race, color, national origin, religion, sex, familial status, and disability.
2 Background
2.1 Municipality Types of the TOGETHER North Jersey Region
Consistent with the goals of advancing the provision of fair housing in Northern New Jersey, this chapter of the FHEA closely examines the spatial patterns of housing tenure and the demographic composition of the 384 Minor Civil Divisions (MCDs), also known as municipalities, located in the 13‐county TOGETHER North Jersey (TNJ) region. In this chapter, TNJ examines the racial diversity and relative inclusiveness of TNJ municipalities in supplying multi‐family and rental housing. Several key definitions and criteria used throughout this chapter are provided in the accompanying text box.
The region’s municipalities are segmented by their relative racial diversity and housing stock inclusivity, leading to five distinct municipality types (see Figure 2‐1 and the Appendix A). How these various groups of municipalities differ on select demographic and economic indicators are then presented.
2.2 Population Trends
Post WWII‐Decentralization and the 2.2.1
Steady Growth in Suburbia
In 1945, at the end of the WWII, there were 140 million Americans. By the year 2000 there were 280 million Americans.1 The nation’s population had doubled in only fifty‐five years. The post‐war baby boom and the creation of the national highway system were catalytic factors, among many, in reshaping the physical, economic and social landscape of the U.S. and in Northern New Jersey.
1 U.S. Census Bureau, Population Division, Population Estimates Program, “Historical National Population Estimates: July 1, 1900 to July 1, 1999,” United States Census Bureau, June 28, 2000, http://www.census.gov/population/estimates/nation/popclockest.txt.

TOGETHER North Jersey Fair Housing & Equity in Northern New Jersey
2-2
Figure 2‐1: Geographic Distribution of TNJ Municipality Types

TOGETHER North Jersey Fair Housing & Equity in Northern New Jersey
2-3
After the war, U.S. suburbs drew working class Americans, particularly White Americans, away from the cities with the promise of better housing. Over time with regional highway improvements in place and the automobile within financial reach, the original ring of “First Suburbs”, like Levittown, gave way to newer suburbs farther removed from the urban core. Developers built malls and office complexes that appealed to employers and eased the commutes of workers.2 Edge cities developed and the process of suburban growth reached farther into the hinterlands. Today, suburbs have grown so large that their land use patterns, development, and way of life are easily distinguished from their cities of origin.
According to the U.S. Census, suburban population growth consistently outpaced urban areas through the year 2010, when, for the first time in decades, the urban areas grew at rates slightly greater than the suburbs.3 Decades of suburban growth have brought unprecedented opportunities, but also new challenges for the region’s long‐term growth and sustainability. New tensions have arisen over the regional distribution of economic opportunity, decentralization away from the urban core, and efforts to reverse urban decline. Plans and policies aimed at addressing these issues have had major implications for all Americans but differing effects upon various populations depending upon the communities in which they lived, worked, or to which they had access.
In New Jersey, the core cities of small metropolitan areas like Newark or Trenton, have not thrived in competition with New York and Philadelphia, and growth has fanned out to their suburban peripheries along the state’s major highway corridors. The state’s overall population growth has been fueled by this suburbanization, but by 2010 in the aftermath of the financial meltdown and economic recession, the permanence of these patterns is in question.4 With greater volatility in labor markets and fuel prices, the trade‐off of a longer commute to purchase more affordable housing appears both more risky for a cost‐burdened, two‐worker family and less of a bargain. It was also estimated that there was less undeveloped land remaining in the state then developed.5
The growth of metropolitan areas has also been linked with regional geography as jobs and people have moved south and west away from older industrial cities. The new geography of service economies has generally placed cities on the East Coast at a relative disadvantage, both to their own suburbs and to entire regions, such as the Sun Belt and Bible Belt, where lower costs of living, climate and right‐to‐work laws have proven to be highly valued attributes.
2 Susan Hanson and Genevieve Giuliano, eds., The Geography of Urban Transportation, 3rd ed (New York: The Guilford Press, 2004).
3 William H. Frey, “A Big City Growth Revival?,” The Brookings Institution, May 28, 2013, http://www.brookings.edu/research/opinions/2013/05/28‐city‐growth‐frey.
4 James Hughes and Joseph Seneca, “The Receding Metropolitan Perimeter: A New Post‐Suburban Demographic Normal?, Rutgers Regional Report, Issue Paper Number 37. September 2014.
5 John Hasse and Richard Lathrop, “Changing Landscapes in the Garden State,” Rowan University’s Geospatial Research Lab, 2010, http://gis.rowan.edu/projects/luc/index.html.

TOGETHER North Jersey Fair Housing & Equity in Northern New Jersey
2-4
For the predominantly minority populations residing in declining urban areas, these shifting patterns have contributed to inequality and diminishment of opportunities. This inequality is of staggering significance to the daily lives and prospects of their families and children.
In response to the search for better opportunities, minority communities are increasingly participating in the process of suburbanization. Their movement within individual metropolitan areas and between national metropolitan regions adds further complexity to the dynamics of urban growth. Barriers to fair housing, in this context, and persistent limited access to the places of high opportunity can be understood as an important attribute detracting from the region’s ability to effectively compete for investment and the resources to adapt to changing economic and demographic patterns of growth.
Post 2000 – Shifting Dynamics 2.2.2
Since 1990, one of the primary demographic trends in the United States has been the movement of the country’s metropolitan populations towards becoming “majority‐minority”.6 These are communities where over 50% of the population is made up of Non‐White minorities. As minority communities have grown, there have also been consistent reductions in the number of White urban residents, many of whom have continued moving to the suburbs. The TNJ region has not been insulated from these intertwined trends. Between 1990 and 2010 the minority (non‐White) population of the TNJ grew by at least 50% while TNJ’s White population shrank from 90% to approximately 70% of the region’s population. While the TNJ region is not majority‐minority, it too is subject to this overarching growth pattern.
Minority populations in Northern New Jersey, particularly Black and Hispanic populations, are generally located in urban cities and the older, inner‐ring suburbs in places highly concentrated with non‐White populations. In 2010, more than 70% of the region’s Black population lived in high‐minority areas (i.e., places with greater than 60% minority population). Similarly, 68% of those self‐identifying as “Some Other Race”, the racial classification predominantly utilized by non‐White Hispanic Americans, such as Mexican Americans, also lived in high minority areas. Asian Americans, albeit to a lesser extent than Blacks or Hispanics, were also concentrated in high minority areas. Tables 2‐1 and 2‐2 indicate the distribution of each racial segment of the population in terms of their concentration living with minority populations (i.e., racial diversity) and in terms of their likelihood to live in a municipality inclusive of rental and multi‐family options (i.e., housing diversity) in 1990 and 2010. These tables show that minorities were much more likely to reside in municipalities providing rental and multi‐family housing options.
White residents, like Asian residents, were more evenly distributed across the region, but also tended to live apart from minority populations. By 2010, 40% of the White population lived in places with less than 20% minority populations, leading to fewer opportunities to interact with other races within their residential community. Similarly, more than 48% of the White population lived in places that are not inclusive with respect to providing rental and multi‐family housing options.
6 William H. Frey, “The New Metropolitan Minority Map: Regional Shifts in Hispanics, Asians, and Blacks from Census 2010,” The Brookings Institution, accessed July 25, 2014, http://www.brookings.edu/research/papers/2011/08/31‐census‐race‐frey.

TOGETHER North Jersey Fair Housing & Equity in Northern New Jersey
2-5
Ultimately, the tables reveal that most residents of the TNJ resided in communities that were not racially diverse (i.e., 20 to 60% minority) and that pattern did not change between 1990 and 2010. Aside from Asian Americans, all other racial groups were mostly residing in places that were not racially diverse municipalities of the TNJ.
Table 3‐1: Racial Distribution of TNJ Population by Community Type, 1990
Source: U.S. Census Bureau, 1990 Census Redistricting Data (Public Law 94‐171) Summary File: 1990
Table 2‐2: Racial Distribution of TNJ Population by Community Type, 2010
Source: U.S. Census Bureau, 2010 Census Redistricting Data (Public Law 94‐171) Summary File: 2010
2.3 Employment Trends7
Metropolitan Spillover and the Suburban Growth Corridor 2.3.1
From 1990 to 2010, the TNJ region generated a net increase of 37,704 private sector jobs. However, growth in the 13 counties of the TNJ region was unevenly distributed. Growing municipalities were located outside the urban core in suburban communities without rental housing options, heavily oriented towards private sector services employment. Job‐declining communities in the TNJ region
7 Analysis of private sector job patterns has excluded 13 small municipalities where 2010 employment data was not readily
available. These municipalities were Bloomsbury Borough, Holland Township, Tewksbury Township, Lebanon Township, and Union Township in Hunterdon County; Branchville Borough and Walpack Township in Sussex County; Interlaken Borough and Loch Arbor Village in Monmouth County; Victory Gardens Borough and Mendham Township in Morris County; and Rahway City and Winfield Township in Union County.
Housing
DiversityRacial Diversity Total White Black Am. Indian Asian
Some Other
RaceHispanic
<20% Minority 3% 4% 0% 2% 1% 0% 1%
20% to 60% Minority 30% 33% 17% 23% 32% 14% 19%
>60% Minority 31% 20% 78% 51% 38% 81% 73%
<20% Minority 26% 32% 3% 20% 14% 3% 6%
20% to 60% Minority 10% 11% 2% 5% 15% 1% 3%
100% 100% 100% 100% 100% 100% 100%
Distribution of TNJ Populations by Municipality Type, 1990
Inclusive
Non‐Inclusive
Total
Housing
DiversityRacial Diversity Total White Black Am. Indian Asian
Some Other
RaceHispanic
<20% Minority 3% 4% 0% 1% 1% 1% 1%
20% to 60% Minority 30% 31% 24% 25% 34% 27% 28%
>60% Minority 30% 17% 68% 60% 36% 66% 59%
<20% Minority 27% 36% 4% 11% 11% 5% 8%
20% to 60% Minority 10% 12% 3% 3% 17% 2% 4%
100% 100% 100% 100% 100% 100% 100%
Inclusive
Distribution of TNJ Populations by Municipality Type, 2010
Non‐Inclusive
Total

TOGETHER North Jersey Fair Housing & Equity in Northern New Jersey
2-6
were in the urban, inclusive, and high‐minority concentrated communities. In a troubling trend, these declining areas at the urban core were also where the largest number of TNJ residents worked and lived.
Tables 2‐3 and 2‐4 show the distribution of the region’s net job losses and gains across the various municipality types. All net job losses occurred in the inclusive municipalities of Northern New Jersey that were either racially diverse (‐34,833 jobs) or high minority (‐33,373 jobs) between 1990 and 2010. The overall share of the region’s jobs in these communities fell from 63% to 59% during the two decades. By comparison, the low‐minority housing inclusive municipalities experienced a net gain of 8,879 jobs, although these communities account for only a small percentage of the region’s total private sector employment base (3.9%).
Thus, most job growth occurred in municipalities offering limited rental or multi‐family housing options. In these areas, racially diverse municipalities added 29,024 jobs while low minority communities added 68,007 jobs. Consequently, 91.6% of all net job growth in the TNJ region over the last twenty years occurred in the non‐inclusive municipalities of the region, while 100% of net job losses occurred in the municipalities offering diverse housing options that were either racially diverse or high‐minority communities.
Table 2‐4: Private Sector Covered Employment, 1990 to 2010
Table 2‐5: Total Percentage Change in Private Sector Covered Employment, 1990 to 2010
Housing
DiversityRacial Diversity
Total Employment
1990
Total Employment
2010
Change in Total
Employment
Percentage Change
in Total
Employment
<20% Minority 80,624 89,503 8,879 11.0%
20% to 60% Minority 778,713 743,880 ‐34,833 ‐4.5%
>60% Minority 635,054 601,681 ‐33,373 ‐5.3%
<20% Minority 445,524 513,531 68,007 15.3%
20% to 60% Minority 299,614 328,638 29,024 9.7%
TNJ Total Private Sector Covered Employment by Municipality Type, 1990 ‐ 2010
Inclusive
Non‐Inclusive
Housing Diversity Racial Diversity Total Employment 1990 Total Employment 2010
<20% Minority 3.6% 3.9%
20% to 60% Minority 34.8% 32.7%
>60% Minority 28.4% 26.4%
<20% Minority 19.9% 22.6%
20% to 60% Minority 13.4% 14.4%
100.0% 100.0%
Inclusive
Non‐Inclusive
Total
TNJ Percentage Distribution of Total Employment by Municipality Type, 1990 ‐ 2010

TOGETHER North Jersey Fair Housing & Equity in Northern New Jersey
2-7
Shifting Dynamics and Slower Employment Growth 2.3.2
The New Jersey Department of Labor and Workforce Development (DLWD) forecasts that the service‐oriented industries will be the fastest growing in New Jersey from 2010 to 2020.8 According to the DLWD, the fastest growing industries will be Transportation and Warehousing (11%); Utilities (12%); Real Estate, Rental, and Leasing (11%); Professional, Scientific, and Technical (16%); Administrative Support, Waste Management, and Remediation (15%); and Health Care and Social Assistance (14%).9
Conversely, both public sector and manufacturing employment are projected to see consistent reductions over the decade. Government employment in New Jersey will shrink by almost 17,000 employees while manufacturing is projected to decline by 20,000 employees. These would amount to 3% and 8% reductions from 2010 employment levels.
Public sector and manufacturing industry jobs have tended to be concentrated in the urban core of the region where job losses have been greatest over the last two decades. If these places continue to bear the largest proportion of future job losses without replacement jobs, and if housing options in places of high opportunity remain constrained, the TNJ region will face labor market and transportation challenges in order to connect the region’s workers (and their families) to a productive and secure economic future.
2.4 Family Income Growth
Median Family Income, 1990‐2010 2.4.1
Three trends were revealed when examining median family incomes in the context of the various municipality types found across the TNJ (see Table 2‐5, below).
First, municipalities that were not inclusive of rental and multi‐family housing types consistently had higher median family incomes than their inclusive counterparts. Non‐inclusive municipalities had median family incomes that were at least $10,000‐$20,000 greater than any type of housing inclusive municipalities.
Second, the growth of median family incomes was generally strongest in non‐inclusive municipalities. Non‐inclusive median family incomes generally grew by at least 87% or more from 1990 to 2010. Only the low‐minority, housing inclusive municipalities had comparable income growth.
Third, racial diversity did not perfectly predict the median family incomes of municipalities but it did provide a very strong basis for understanding municipal incomes across the TNJ. For example, in municipalities providing diverse housing type options (i.e., housing inclusive), an increasing percentage of racial minorities was consistently associated with lower median family incomes for the municipality.
8 State of New Jersey Department Of Labor and Workforce Development, “New Jersey Industry Employment Projections by Major Industry Sector, 2010 ‐ 2020” (State of New Jersey Department of Labor and Workforce Development, October 2012), http://lwd.dol.state.nj.us/labor/lpa/employ/indoccpj/st_index.html.
9 Ibid.

TOGETHER North Jersey Fair Housing & Equity in Northern New Jersey
2-8
However, across the non‐inclusive municipalities, the racially diverse municipalities had higher median incomes than low‐minority communities. These places account for only about one‐tenth of the region’s population; Asians comprise a significantly higher than proportionate composition of minorities in such places than either Black or Hispanic populations.
Table 2‐6: Median Family Income (1990 ‐ 2010)
Source: U.S. Census Bureau, Selected Economic Characteristics 2006‐2010 ACS 5 Year Estimates: 2010
Growing Gap in Income 2.4.2
Over the last two decades there has been a persistent and widening income gap between those at the top and bottom of the income distribution in the TNJ region (see Tables 2‐6 through 2.8). Non‐inclusive municipalities had large income gaps due to the higher incomes found in this segment of the region’s families. At the 90th percentile, non‐inclusive municipalities reported family incomes in 2010 that were between $30,000 and $62,000 more than inclusive municipalities.
Income gaps were also very large in high‐minority, inclusive communities where families at the 10th percentile in 2010 were earning $23,000 less than any other types of inclusive communities. This differential was wider when compared with the non‐inclusive municipalities.
Growth in the income gap was considerably higher in the region’s inclusive municipalities, generally due to the fact that 90th percentile family incomes grew faster than their 10th percentile counterparts. In high minority, inclusive municipalities, higher incomes grew 34% faster from 1990 to 2010 than their low income neighbors, likely reflecting stagnant wages for these community members.
Inclusive municipality’s income gap growth rate ranged from 12.2% in racially diverse municipalities to 24.5% in high minority communities. However, in non‐inclusive municipalities with low‐minority populations, the lower percentile actually grew faster than the 90th percentile resulting in persistent gaps, but much smaller income gap growth rates.
While income gaps clearly persisted, income growth overall was more uniform in non‐inclusive communities than the housing inclusive communities. In the non‐inclusive municipalities, the lowest income families exhibited considerably higher incomes than those living at the 10th percentile in the inclusive municipalities (a difference that widened over the twenty period) as well as experienced nearly the same rates of income growth over the past twenty years as their neighbors in the 90th percentile.
Housing Diversity Racial DiversityMedian Family
Income 1990
Median Family
Income 2010
Change In
Median Family
Income
Percentage
Change in Median
Family Income
<20% Minority $50,849 $95,493 $44,644 87.8%
20% to 60% Minority $49,414 $85,827 $36,412 73.7%
>60% Minority $40,918 $63,114 $22,196 54.2%
<20% Minority $61,923 $117,208 $55,284 89.3%
20% to 60% Minority $67,091 $125,308 $58,217 86.8%
Median Family Income by Municipality Type, 1990‐2010
Inclusive
Non‐Inclusive

TOGETHER North Jersey Fair Housing & Equity in Northern New Jersey
2-9
Table 2‐7: Median Family Income Distributions by Municipality Type in 1990
Source: U.S. Census Bureau, Summary File 3, U.S. Decennial Census: 1990
Table 2.7: Median Family Income Distributions by Municipality Type in 2010
Source: U.S. Census Bureau, Selected Economic Characteristics 2006‐2010 ACS 5 Year Estimates:2010
Table 2‐8: Growth of Income Gap by Municipality Type from 1990 to 2010
Source: U.S. Census Bureau, Summary File 3, U.S. Decennial Census: 1990; Selected Economic Characteristics 2006‐2010 American Community Survey 5 Year Estimates: 2010
Persistent Poverty – Poverty Rate 2.4.3
From 2000 to 2010, the TNJ region experienced very little net employment growth and, like the nation overall, suffered the economic impacts of the 2008 housing crisis and the great recession that followed.
An examination of the poverty rate by the type of municipality reveals that no part of the TNJ region truly escaped these impacts (see Table 2‐8), including the non‐inclusive municipalities that have typically had the fewest percentage of households in poverty. For example, non‐inclusive municipalities experienced at least a 10% increase in their rates of household poverty in the last decade and this increase was markedly higher in diverse suburbs ‐‐ the highest percentage increase in household
Housing Diversity Racial Diversity90th Percentile
Family Income
Median Family
Income
10th Percentile
Family Income
<20% Minority $67,891 $50,849 $38,373
20% to 60% Minority $59,290 $49,414 $37,657
>60% Minority $56,446 $40,918 $28,725
<20% Minority $86,687 $61,923 $41,457
20% to 60% Minority $83,790 $67,091 $45,970
TNJ Median Family Income Distributions by Municipality Type, 1990
Inclusive
Non‐Inclusive
Housing Diversity Racial Diversity90th Percentile
Family Income
Median Family
Income
10th Percentile
Family Income
<20% Minority $132,525 $95,498 $65,712
20% to 60% Minority $111,617 $85,827 $63,185
>60% Minority $99,976 $63,114 $40,879
<20% Minority $162,606 $117,208 $79,834
20% to 60% Minority $164,986 $125,308 $83,423
TNJ Median Family Income Distributions by Municipality Type, 2010
Inclusive
Non‐Inclusive
Housing Diversity Racial DiversityIncome Gap,
1990
Income Gap,
2010
Growth Rate in
Income Gap
<20% Minority 1.77 2.02 14.0%
20% to 60% Minority 1.57 1.77 12.2%
>60% Minority 1.97 2.45 24.5%
<20% Minority 2.02 2.04 0.8%
20% to 60% Minority 1.89 1.98 4.9%
TNJ Income Gap (90th Percentile/10th Percentile) by Municipality Type, 1990‐2010
Inclusive
Non‐Inclusive

TOGETHER North Jersey Fair Housing & Equity in Northern New Jersey
2-10
poverty for the region, and a phenomenon noted in recent research on the rise in suburban poverty.10 Still, their overall poverty rates remained considerably lower the municipalities offering more diverse housing type choices, particularly municipalities with high minority concentrations.
Table 2‐9: Percentage of Households in Poverty by Municipality Type from 2000 to 2010
Source: U.S. Census Bureau, Summary File 3, U.S. Decennial Census: 2000 & 2010
2.5 Enduring Significance of Foreign Born Populations
Changing Origin of TNJ Foreign Born Populations, pre 1980 to 2010 2.5.1
The TNJ region continues to be an important gateway into the United States for immigrant populations. All races, ethnicities, nationalities, and religions have moved to and through the New York metropolitan area, including northern New Jersey. No less than in the past, understanding the needs and aspirations of immigrant populations and welcoming their capabilities and vitality is integral to the region’s economic competitiveness and long‐term sustainability.
Before 1980 the largest percentage of the TNJ’s foreign born residents came from Europe followed by Asia and the Caribbean countries. This changed over the 1980s and 1990s as Asians grew to become the largest proportion of foreign born residents in the TNJ region. Over the same period, South American origin grew to have the third largest proportion.
As European rates of entry and overall proportions have declined, Mexican foreign born entrants have outgrown the rate of entry for European residents of the TNJ. Similarly, Other Central Americans now provide an effectively equal proportion of new residents to the region as their European counterparts. When these Latin American regions of origin are looked at together, the combined proportion of entrants for South America, Other Central America, Mexico, and the Caribbean accounted for over half the foreign born entrants into the population of the TNJ from 2000 to 2010 at 51.4% (see Table 2‐10 and Figures 2‐2 and 2‐3).
10 Elizabeth Kneebone, “The Growth and Spread of Concentrated Poverty, 2000 to 2008‐2012,” The Brookings Institution, July 31, 2014, http://www.brookings.edu/research/interactives/2014/concentrated‐poverty.
Housing Diversity Racial Diversity
Percentage of
Households In
Poverty, 2000
Percentage of
Households In
Poverty, 2010
Increase in Rate
of Household
Poverty
<20% Minority 5.6% 5.8% 3.6%
20% to 60% Minority 6.7% 7.8% 16.8%
>60% Minority 12.8% 14.4% 11.9%
<20% Minority 3.4% 3.7% 10.3%
20% to 60% Minority 3.1% 4.0% 27.7%
TNJ Percentage of Households In Poverty by Municipality Type, 2000‐2010
Inclusive
Non‐Inclusive

TOGETHER North Jersey Fair Housing & Equity in Northern New Jersey
2-11
Table 2‐10: Changes in Origin of Foreign Born Populations in the TNJ Region, pre‐1980 to 2010
Source: U.S. Census Bureau, Place of Birth by Year of Entry by Citizenship Status for the Foreign Born Population, 2006‐2010 American Community Survey 5 Year Estimates, 2010.
Figure 2‐1: Origins of TNJ Foreign Born Population, Before 1980
Source: U.S. Census Bureau, Place of Birth by Year of Entry by Citizenship Status for the Foreign Born Population, 2006‐2010 American Community Survey 5 Year Estimates, 2010
Period Europe Asia Caribbean Mexico
Other
Cental
America
South
America Other Total
2000 to 2010 8.5% 34.2% 11.4% 11.1% 8.5% 20.3% 6.0% 100.0%
1990 to 1999 14.2% 31.7% 14.3% 7.6% 7.3% 19.2% 5.6% 100.0%
1980 to 1989 13.2% 34.6% 18.2% 3.6% 6.9% 19.1% 4.5% 100.0%
Before 1980 39.8% 21.2% 18.5% 0.9% 3.2% 12.1% 4.2% 100.0%
Total 17.9% 30.7% 15.1% 6.4% 6.7% 18.0% 5.2% 100.0%
Region of Origin of Foreign Born 1980 to 2010
Europe, 39.80%
Asia, 21.25%
Caribbean, 18.54%
Mexico, 0.92%
Other Cental America, 3.22%
South America, 12.08%
Other, 4.20%
Origin of TNJ Foreign Born Populations, Before 1980

TOGETHER North Jersey Fair Housing & Equity in Northern New Jersey
2-12
Figure 2‐2: Origin of TNJ Foreign Born Populations, 2010
Source: U.S. Census Bureau, Place of Birth by Year of Entry by Citizenship Status for the Foreign Born Population, 2006‐2010 American Community Survey 5 Year Estimates, 2010
Location of Foreign Born Populations by Municipality Type, 2000 to 2010 2.5.2
The settlement patterns of foreign born populations are an important component of growth and change influencing the race and ethnic composition of the region’s central cities and suburbs. Traditionally the region’s foreign born residents have settled in urban immigrant communities in larger numbers when they enter the U.S. In time, Asian Americans and Latin Americans have sought to settle in parts of suburbia, as the region’s European origin immigrants did in prior generations, bringing greater diversity to once nearly exclusively white communities.
In Table 2‐11, foreign born residents accounted for 40% of the population in high minority municipalities in 2010, but their proportions grew by more than 20% in every other municipality type.11 12 Foreign‐born residents, however, remain more likely to settle in places of diversity (i.e., 20 to 60% minority) than low‐minority communities – a pattern that has not changed over the 2000‐2010 period.13
11Xavier de Souza Briggs, The Geography of Opportunity: Race and Housing Choice in Metropolitan America, accessed July 26, 2014, http://www.brookings.edu/research/books/2005/geographyofopportunity.
12 John R. Logan and Charles Zhang, “Global Neighborhoods: New Pathways to Diversity and Separation,” AJS; American Journal of Sociology 115, no. 4 (January 1, 2010): 1069–1109, doi:10.1086/649498.
13 Foreign born residents themselves are a racially diverse group who may or may not always provide a diversifying impact on municipalities with respect to race. The tables in this section illustrate the existing racial and housing mix that foreign born residents have chosen to reside in or move into over the last decade.
Europe17.95%
Asia30.73%
Caribbean15.13%Mexico
6.36%
Other Cental America6.67%
South America17.95%
Other5.20%
Origin of TNJ Foreign Born Populations, 2010

TOGETHER North Jersey Fair Housing & Equity in Northern New Jersey
2-13
Table 2‐11: Foreign Born Population 2000 to 2010
Source: U.S. Census Bureau, Nativity in the United States, American Community Survey, 5 Year Estimates, 2000 & 2010
Origin and Location of Foreign Born Populations by Municipality Type, 2000 to 2010 2.5.3
Foreign born residents living in low‐minority municipalities tend to have originated from Europe and, while this has changed somewhat since 2000, the pattern continued to persist through 2010. The share of European originating foreign born residents, however, declined significantly with increases in the minority populations in both 2000 and 2010.
Asian populations consistently accounted for at least 21% to 29% of the foreign born population regardless of the municipality’s inclusivity or racial diversity. However, the largest proportion of Asian foreign born population, 40% or more, were found in the non‐inclusive but racially diverse municipalities. These were municipalities that were diverse but oriented towards single family homes.
Latin American foreign born residents were consistently a large proportion of the foreign born population across all municipality types in the TNJ, but especially in places with multi‐family and rental housing options (i.e., the inclusive areas). In high minority inclusive communities, these residents were consistently over 60% of the foreign born residents in both 2000 and 2010. In racially diverse and low‐minority inclusive municipalities, they were always over 30% and 20% of the foreign born population respectively.
The proportion of foreign born residents of Asian and Latin American origin grew across all municipality types between 2000 and 2010. For Asian Americans their growth was greatest in non‐inclusive areas of the TNJ region. For Latin Americans, their growth was greatest in low‐minority and racially diverse but inclusive communities. In both cases, Asian and Latin American residents were clearly moving to, and in some cases diversifying, formerly low minority municipalities of the region.
Foreign born residents from Africa, Oceania, and North America excluding Mexico were all consistently less than 4% of the foreign born population in any municipality type. African foreign born populations were evenly distributed across the TNJ, however, from 2000 to 2010 their largest increase occurred in low minority, but housing inclusive areas. Oceania residents only saw an increase in their proportion of the foreign born population in municipalities that were housing inclusive and racially diverse or high minority. North American foreign born residents excluding Mexico focuses on Canadians who followed a
Housing Diversity Racial DiversityForeign Born,
2000
Foreign Born,
2010
Percentage
Change in
Foreign Born,
2000‐2010
<20% Minority 7.4% 9.4% 26.3%
20% to 60% Minority 20.2% 24.9% 22.9%
>60% Minority 35.8% 40.2% 12.5%
<20% Minority 7.3% 8.8% 20.5%
20% to 60% Minority 16.2% 20.7% 27.8%
TNJ Distribution of Foreign Born by Municipality Type, 2000‐2010
Inclusive
Non‐Inclusive

TOGETHER North Jersey Fair Housing & Equity in Northern New Jersey
2-14
similar path to European origin foreign born residents, having their largest proportions in low minority areas with general declines in their proportions of the population across almost all municipality types.
The proportion of the origins of foreign populations living in each municipality type in the TNJ region is shown in Tables 2‐12 and 2‐13.
Table 2‐12: Origin of Foreign Born Populations by Municipality Type 2000
Note: Oceania refers to Australia, New Zealand, and the rest of the tropical pacific like Polynesia and all the other islands that are not counted as part of Asia. Source: U.S. Census Bureau, Place of Birth for Foreign Born Population of the United States, 2006‐2010 American Community Survey Selected Population Tables, 2010
Table 2‐13: Origins of Foreign Born Populations by Municipality Type 2010
Note: Oceania refers to Australia, New Zealand, and the rest of the tropical pacific like Polynesia and all the other islands that are not counted as part of Asia. Source: U.S. Census Bureau, Place of Birth for Foreign Born Population of the United States, 2006‐2010 American Community Survey Selected Population Tables
2.6 Changing Racial Composition of North Jersey
Race Distribution by Counties of TNJ Region Comparison, 1990‐2010 2.6.1
The change in the racial composition of the counties of the TNJ illustrates the national and regional trend of growing minority populations. In 1990, only Essex County, which includes Newark, had a minority population that was greater than 20%. The rest of the 12 counties in the TNJ region were low minority with White populations that exceeded 80%. (See Table 2‐14, below)
Housing Diversity Racial Diversity Europe Asia Africa Oceania
Latin America
including
Mexico
North America
<20% Minority 49.6% 22.3% 1.4% 0.8% 22.4% 3.6%
20% to 60% Minority 31.1% 29.6% 3.7% 0.1% 34.3% 1.2%
>60% Minority 12.5% 21.4% 3.9% 0.1% 61.8% 0.4%
<20% Minority 52.0% 22.6% 2.8% 0.7% 18.0% 3.9%
20% to 60% Minority 32.5% 45.5% 2.7% 0.4% 17.1% 1.8%
Origins of Foreign Born Populations by Municipality Type, 2000
Inclusive
Non‐Inclusive
Housing Diversity Racial Diversity Europe Asia Africa Oceania
Latin America
including
Mexico
North America
<20% Minority 35.6% 23.8% 4.6% 0.5% 33.2% 2.4%
20% to 60% Minority 23.7% 29.9% 3.4% 0.1% 41.9% 1.0%
>60% Minority 7.8% 22.9% 4.2% 0.1% 64.6% 0.4%
<20% Minority 43.9% 27.3% 3.0% 0.3% 22.9% 2.7%
20% to 60% Minority 25.7% 48.7% 2.9% 0.3% 20.5% 2.0%
Origins of Foreign Born Populations by Municipality Type 2010
Inclusive
Non‐Inclusive

TOGETHER North Jersey Fair Housing & Equity in Northern New Jersey
2-15
Table 2‐14: Racial Composition of TNJ Region by County, 1990
Source: U.S. Census Bureau, 1990 Census Redistricting Data (Public Law 94‐171) Summary File: 1990
Table 2‐15: Racial Composition of TNJ Region by County, 2010
Source: U.S. Census Bureau, 2010 Census Redistricting Data (Public Law 94‐171) Summary File: 2010
County Total White BlackAmer.
Indian
Asian &
Pac. Is.
Some Other
RaceHispanic
Bergen 825,380 89.4% 2.6% 0.1% 6.8% 1.0% 5.0%
Essex 778,206 76.9% 17.7% 0.1% 3.6% 1.7% 4.9%
Hudson 553,099 81.1% 5.3% 0.2% 4.5% 8.9% 35.6%
Hunterdon 103,264 97.1% 1.5% 0.1% 1.0% 0.3% 1.3%
Middlesex 671,780 86.3% 6.4% 0.1% 4.8% 2.5% 7.0%
Monmouth 553,124 90.7% 6.3% 0.1% 1.9% 1.0% 3.3%
Morris 421,353 93.0% 2.7% 0.1% 3.0% 1.2% 5.0%
Ocean 433,203 96.4% 2.1% 0.2% 0.6% 0.8% 2.4%
Passaic 453,060 88.7% 5.0% 0.2% 2.0% 4.0% 9.7%
Somerset 244,858 92.3% 3.3% 0.1% 3.1% 1.1% 3.6%
Sussex 130,876 97.7% 0.9% 0.2% 0.9% 0.3% 2.0%
Union 493,819 83.4% 12.1% 0.1% 2.8% 1.6% 6.8%
Warren 91,587 97.9% 1.0% 0.1% 0.7% 0.3% 1.6%
TNJ Racial and Ethnic Composition of County Populations, 1990
County Total White Black AsianSome
Other Race
Two or More
RacesHispanic
Bergen 905,116 75.7% 3.5% 14.1% 4.1% 2.4% 13.8%
Essex 783,969 66.4% 21.3% 5.9% 3.7% 2.5% 11.0%
Hudson 634,266 64.5% 6.3% 9.8% 14.6% 4.2% 47.4%
Hunterdon 123,786 92.6% 2.3% 2.5% 1.1% 1.3% 5.1%
Middlesex 809,858 67.0% 8.2% 15.9% 5.9% 2.7% 16.4%
Monmouth 630,380 86.4% 5.5% 3.4% 2.7% 1.8% 8.9%
Morris 492,276 85.3% 3.0% 6.3% 3.2% 2.1% 12.2%
Ocean 576,567 92.7% 2.5% 1.1% 2.2% 1.4% 6.6%
Passaic 501,226 77.3% 6.5% 4.5% 8.4% 2.8% 23.2%
Sommerset 328,023 79.7% 4.9% 9.1% 3.7% 2.6% 12.5%
Sussex 149,249 93.6% 1.6% 1.7% 1.2% 1.7% 6.0%
Union 536,499 72.6% 15.0% 5.1% 4.7% 2.4% 16.2%
Warren 108,692 92.7% 2.5% 2.0% 1.2% 1.5% 5.4%
TNJ Racial and Ethnic Composition of County Populations, 2010

TOGETHER North Jersey Fair Housing & Equity in Northern New Jersey
2-16
In 2010, the number of low minority counties had been reduced to 6 of the 13 counties in the TNJ region. The remaining 7 counties would all be considered diverse based on the metrics being used in this study. While there were no high minority counties, Essex, Hudson, and Middlesex counties all saw their White populations fall well below 70%. Hudson County had the largest proportion of minorities and its White Population fell to 64% of the county’s total population (See Table 2‐15). 14
Dot Density Maps, 2010 2.6.2
As shown on the dot density maps, Figures 2.4‐2.11, the TNJ has a limited number of municipalities that are “Urbanized Areas” with populations above 50,000 people and a large number of suburban municipalities with populations ranging from 5,000 to 50,000 people.
Beyond illustrating the prevailing suburban character of the TNJ region, the dot density maps exhibit the spatial patterns of residential settlement, highlighting the region’s relative segregation as well as dispersion and concentration of various populations by race. The racial patterns show the distribution of minorities into suburban areas with Asian American assimilating most completely into select traditionally low minority suburbs (see Figures 2‐4 and 2‐5).
While the presence of Hispanic Latino residents in suburban municipalities of the region can be seen, there is also evidence of racial stratification within the Hispanic Latino community. Figure 2‐6 shows the distribution of Hispanic Latino TNJ residents of any race. The suburban presence illustrated is predominantly a reflection of those residents self‐reporting as Hispanic Latino and White alone (see Figure 2‐7). Residents self‐reporting as “Some Other Race”, the classification more frequently used by Mexican Americans and non‐White residents originating from South and Central America, were closely associated with urban areas where larger numbers of African American residents were found (see Figures 2‐8 and 2‐9). Black Hispanics were found in even greater concentration in the urban core of the region with little or no presence in the suburbs.
Finally, as shown in Figure 2‐10, the map illustrating the geographic distribution of African American residents displays a much more concentrated distribution than that of both White residents and Asian residents. There is a strong presence in the high density urban segments of the region, and as noted above, a near perfect geographic correlation with the locations of Non‐White Hispanic Latino communities.
14 According to the 2010 Census, people who self‐identified into the category “Some Other Race (SOR)” were 90 to 95% Hispanic Latino.

TOGETHER North Jersey Fair Housing & Equity in Northern New Jersey
2-17
Figure 2‐4: Geographic Distribution of Populations by Race

TOGETHER North Jersey Fair Housing & Equity in Northern New Jersey
2-18
Figure 2‐5: Geographic Distribution of Asian Populations

TOGETHER North Jersey Fair Housing & Equity in Northern New Jersey
2-19
Figure 2‐6: Hispanic Latino, Any Race

TOGETHER North Jersey Fair Housing & Equity in Northern New Jersey
2-20
Figure 2‐7: Hispanic Latino: White, Some Other Race, & Black

TOGETHER North Jersey Fair Housing & Equity in Northern New Jersey
2-21
Figure 2‐8: Geographic Distribution of "Some Other Race" Populations

TOGETHER North Jersey Fair Housing & Equity in Northern New Jersey
2-22
Figure 2‐9: Geographic Distribution of Some Other Race (HL) by Race

TOGETHER North Jersey Fair Housing & Equity in Northern New Jersey
2-23
Figure 2‐10: Geographic Distribution of Black Populations

TOGETHER North Jersey Fair Housing & Equity in Northern New Jersey
2-24
2.7 Building an Adaptive Housing Stock
Housing Types ‐ Size and Number of Units in Structure 2.7.1
The prevailing suburban character of the TNJ region can be observed, in part, from examination of the distribution of housing types shown in Table 2‐15. For example, it can be seen that single family detached homes accounted for 52.2% and multifamily structures with at least two units provided for 40.3% of the region’s total housing stock (see Table 2‐15, section B).
Multifamily units provide a range of housing configurations for families and the diversity of households that form as populations move through various stages of their life cycle. It is an important indicator of the region’s capacity to recognize and adapt to the changing economic and personal circumstances experienced by our region’s residents. As expected, in non‐inclusive areas, both low minority and diverse municipalities had much lower percentages of multifamily units (11.8% and 14.8%, respectively) than the inclusive communities (32% to 70.4% of the stock). While more than one‐half of all units in the region are single‐family detached units, they account for more than 75% and 80% of the housing supply in the non‐inclusive jurisdictions (see Table 2‐15, section C).
Clearly, the non‐inclusive jurisdictions offer only a limited range of multi‐family housing options. The low percentages reflect long‐standing preference for single‐family dwellings to the exclusion of other housing choices. In contrast, inclusive jurisdictions with racially diverse or high‐minority populations are much more likely to offer a mix of multi‐family housing type.
The largest supply of housing in the TNJ region will be found in three municipality types (see section B).
1. Inclusive, Racially Diverse jurisdictions accounted for 30.9% of all housing in the TNJ.
2. Inclusive, High Minority municipalities included 29% of the housing in the region.
3. Non‐Inclusive, Low Minority municipalities had 27.3% of all TNJ housing units, with the vast majority comprised of single‐family detached (22.1%) units.
Together, these three municipality types accounted for fully 87% of the region’s housing, with housing inclusive and racially diverse communities accounting for the largest percentage. As shown earlier in this chapter, these municipality types had vastly different median incomes. With limited financial capacity, families are greatly constrained in their choice of communities to places that offer affordably priced housing.
Table 2‐15 (Section D) essentially shows where a family was likely to find housing after they decided upon a preferred structure. For example, having decided on a single‐family home, TNJ residents were most likely to find these housing types in areas that are non‐inclusive and low minority (42.3%), or inclusive and racially diverse (27.8%). Families unable to afford a single‐family home were more likely to find themselves settled into inclusive jurisdictions that were either racially diverse or high minority. These two municipality types had significantly higher proportions of rental housing, as will be shown below, and accounted for 88% percent of all three to four unit structures, 80.5% of all five to nine unit structures, 80.6% of all 10‐19 unit structures, and 86.8% of structures with 20 or more units multifamily units available in the TNJ.

TOGETHER North Jersey Fair Housing & Equity in Northern New Jersey
2-25
Table 2‐16: TNJ Total Housing Stock per Municipality Type by Number of Units in Structure
Source: U.S. Census Bureau, Units In Structure, 2006‐2010 American Community Survey, 2010
These patterns suggest a broader mix of housing choices is warranted in non‐inclusive communities to ensure that more persons – and a greater diversity of person in terms of race and income ‐‐ have an opportunity to live closer to the places of high opportunity in the TNJ region.
Alternatively, having decided on a municipality for settlement, what distribution of housing options was likely to be available? For example, as shown in Table 2‐16 (Section C), single‐family homes were comprised fully 80.8% of the housing stock in non‐inclusive low minority communities. By comparison, in High Minority and Inclusive municipalities, only 22.6% of the housing stock was single family detached homes. This pattern suggests that its residents, predominantly minority families, are unlikely to find and live in a single family detached home in these predominantly urban areas of the TNJ. Thus, it reflects a limited range of traditional homeownership options affordable for families living in these places. Even when single family attached town homes and row houses are added, single family homes still only accounted for less than 30% of the housing stock available in this municipality type.
Housing Diversity Racial Diversity
Single
Family
Detached
Single Family
AttachedTwo Units
Three to Four
Units
Five to Nine
Units10‐19 Units 20+ Units Total
<20% Minority 51,264 7,192 7,577 5,212 3,962 3,927 6,836 85,970
20% to 60% Minority 373,426 55,911 110,647 59,481 42,257 52,020 100,536 794,278
>60% Minority 168,840 52,118 144,929 111,629 66,370 56,367 145,770 746,023
<20% Minority 568,460 52,274 17,566 13,323 16,016 14,759 21,061 703,459
20% to 60% Minority 182,127 25,965 7,922 4,888 6377 7,349 9,664 244,292
1,344,117 193,460 288,641 194,533 134,982 134,422 283,867 2,574,022
Housing Diversity Racial Diversity
Single
Family
Detached
Single Family
AttachedTwo Units
Three to Four
Units
Five to Nine
Units10‐19 Units 20+ Units Total
<20% Minority 2.0% 0.3% 0.3% 0.2% 0.2% 0.2% 0.3% 3.3%
20% to 60% Minority 14.5% 2.2% 4.3% 2.3% 1.6% 2.0% 3.9% 30.9%
>60% Minority 6.6% 2.0% 5.6% 4.3% 2.6% 2.2% 5.7% 29.0%
<20% Minority 22.1% 2.0% 0.7% 0.5% 0.6% 0.6% 0.8% 27.3%
20% to 60% Minority 7.1% 1.0% 0.3% 0.2% 0.2% 0.3% 0.4% 9.5%
52.2% 7.5% 11.2% 7.6% 5.2% 5.2% 11.0% 100.0%
Housing Diversity Racial Diversity
Single
Family
Detached
Single Family
AttachedTwo Units
Three to Four
Units
Five to Nine
Units10‐19 Units 20+ Units Total
<20% Minority 59.6% 8.4% 8.8% 6.1% 4.6% 4.6% 8.0% 100.0%
20% to 60% Minority 47.0% 7.0% 13.9% 7.5% 5.3% 6.5% 12.7% 100.0%
>60% Minority 22.6% 7.0% 19.4% 15.0% 8.9% 7.6% 19.5% 100.0%
<20% Minority 80.8% 7.4% 2.5% 1.9% 2.3% 2.1% 3.0% 100.0%
20% to 60% Minority 74.6% 10.6% 3.2% 2.0% 2.6% 3.0% 4.0% 100.0%
52.2% 7.5% 11.2% 7.6% 5.2% 5.2% 11.0% 100.0%
Housing Diversity Racial Diversity
Single
Family
Detached
Single Family
AttachedTwo Units
Three to Four
Units
Five to Nine
Units10‐19 Units 20+ Units Total
<20% Minority 3.8% 3.7% 2.6% 2.7% 2.9% 2.9% 2.4% 3.3%
20% to 60% Minority 27.8% 28.9% 38.3% 30.6% 31.3% 38.7% 35.4% 30.9%
>60% Minority 12.6% 26.9% 50.2% 57.4% 49.2% 41.9% 51.4% 29.0%
<20% Minority 42.3% 27.0% 6.1% 6.8% 11.9% 11.0% 7.4% 27.3%
20% to 60% Minority 13.5% 13.4% 2.7% 2.5% 4.7% 5.5% 3.4% 9.5%
100.0% 100.0% 100.0% 100.0% 100.0% 100.0% 100.0% 100.0%
Inclusive
Non‐Inclusive
Total
TNJ Total Housing Stock, Number of Units in Structure, by Municipality Type 2010 (A)
Inclusive
Non‐Inclusive
Total
Housing Types as a Share of Each Municipality Type, 2010 (C )
Inclusive
Non‐Inclusive
Total
Distribution of Each Housing Type by Municipality Type, 2010 (D)
Inclusive
Non‐Inclusive
Total
Housing Types as a Share of All Housing Units in Region, 2010 (B)

TOGETHER North Jersey Fair Housing & Equity in Northern New Jersey
2-26
Renter vs. Owner 2.7.1
Table 2‐16 shows the percentage of rental units that were found in each municipality type across the TNJ region. As expected, inclusive municipalities had a higher percentage of rental units than their non‐inclusive counterparts, ranging from 27% to 46% of all housing units. Diverse and high minority communities had consistently higher percentages of rental units than their low‐minority counterparts.
Low‐minority or predominantly White jurisdictions that were non‐inclusive, as expected, had the lowest proportion of rental housing in their total housing stock with only 17.6% of their stock. Non‐inclusive jurisdictions that were racially diverse had a slightly higher rental percentage (20.4%).
Table 2‐16: TNJ Housing Stock Percentage of Rental Units by Municipality Type
Source: U.S. Census Bureau, Selected Housing Characteristics, 2006‐2010 American Community Survey, 2010
Age of Structures 2.7.2
Three important relationships can be observed through close review of the median age of structure data shown in Table 2‐17. First, rental structures were generally newer than owner‐occupied structures across all municipalities in the region. This was consistent regardless of racial diversity or the municipalities housing diversity. Second, structures in non‐inclusive municipalities with respect to housing were consistently at least a decade newer than their counterparts in inclusive municipalities. Third, housing inclusive jurisdictions with greater racial diversity or high‐minority concentrations were occupying a somewhat older housing stock than their counterparts in the predominantly White municipalities. In non‐inclusive municipalities, however, the rental stock was newer in racially diverse jurisdictions than in predominantly White municipalities ‐ perhaps reflecting the relatively small amount of rental dwellings built in such places.
Housing Diversity Racial Diversity Percentage Renter
<20% Minority 27.3%
20% to 60% Minority 33.5%
>60% Minority 45.9%
<20% Minority 17.6%
20% to 60% Minority 20.4%
Percentage of Renter Dwelling by Municipality Type in TNJ Region
Inclusive
Non‐Inclusive

TOGETHER North Jersey Fair Housing & Equity in Northern New Jersey
2-27
Table 2‐17: Median Age of Structure by Tenure and Municipality Type
Source: U.S. Census Bureau, Median Age of Structures by Tenure, 2008‐2012 American Community Survey 5 Year Estimates, 2012
2.8 Diversity’s Role in Building Stable and Sustainable Communities
This chapter has provided a regional overview of select demographic and economic trends and patterns: population and employment growth, racial composition, foreign‐born, income and poverty and housing. The chapter lays a foundation for recognizing that stable integration and inclusive housing policies will be integral to meeting the challenges in the 21st century to adapt and prove resilient in the face of emerging demographic trends. The chapter has examined regional growth and change in relationship to five municipality types, highlighting the socio‐economic differences found in municipalities segmented by their differing levels of racial diversity and inclusivity with respect to offering multi‐family and rental housing options.
Subsequent chapters will look more closely at themes of isolation, segregation and concentration of communities of color and low‐income communities to examine what it means to be near (or far from) places of opportunity within the TNJ region and, further, to consider the role that fair and affordable housing may play to ensure equality of opportunities and equitable access to such places.
Most of the subsequent chapters will examine these patterns using data at a sub‐municipal level (e.g., block group or census tract) to explore differences within and between communities. Here, in the remainder of this chapter, two variables for which data is most readily found at the municipal level are presented within the frame of racial diversity and housing inclusion central to this chapter.
Public Safety Personnel and Community Diversity 2.8.1
As the region’s demography changes, places that were traditionally concentrated by predominantly white populations have been, and will continue to change into places with greater racial diversity. Thus, leadership, management and hired personnel should anticipate new challenges and responsibilities amidst such change; effective decisionmaking will depend upon identifying and respectfully addressing the needs, cultural perspectives and financial limitations of different socioeconomic groups who have arrived and will be affected by their decisions. This entails a commitment to cultural competency in training of personnel, a greater commitment to workforce diversity in recruitment, retention and career advancement in workforce development, and attention to whether regional and municipal boards and commissions are representative of the populations that are residing in our jurisdictions.
Housing Diversity Racial DiversityMedian Age of
Structures
Median Age of
Owner Occupied
Structures
Median Age of
Renter Occupied
Structures
<20% Minority 1960 1958 1962
>60% Minority 1958 1955 1961
<20% Minority 1968 1968 1964
20% to 60% Minority 1969 1968 1970Non‐Inclusive
TNJ Median Age of Structures by Tenure and Municipality Type
Inclusive 20% to 60% Minority 1957 1955 1961
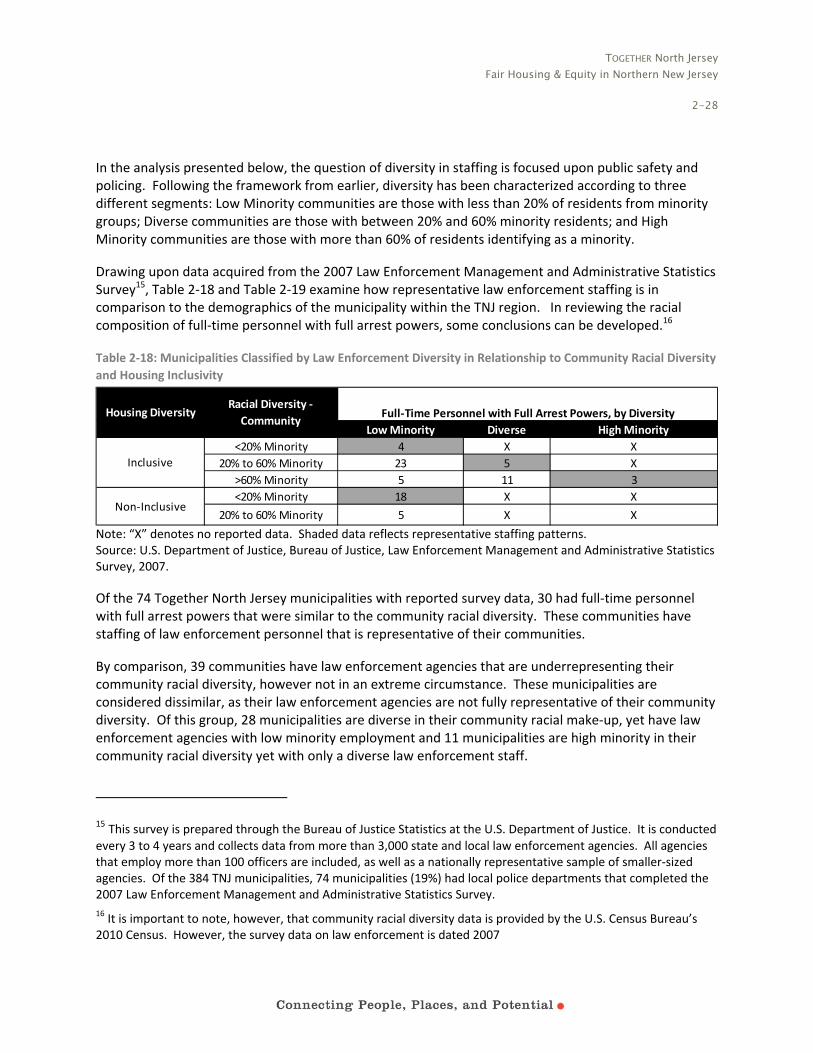
TOGETHER North Jersey Fair Housing & Equity in Northern New Jersey
2-28
In the analysis presented below, the question of diversity in staffing is focused upon public safety and policing. Following the framework from earlier, diversity has been characterized according to three different segments: Low Minority communities are those with less than 20% of residents from minority groups; Diverse communities are those with between 20% and 60% minority residents; and High Minority communities are those with more than 60% of residents identifying as a minority.
Drawing upon data acquired from the 2007 Law Enforcement Management and Administrative Statistics Survey15, Table 2‐18 and Table 2‐19 examine how representative law enforcement staffing is in comparison to the demographics of the municipality within the TNJ region. In reviewing the racial composition of full‐time personnel with full arrest powers, some conclusions can be developed.16
Table 2‐18: Municipalities Classified by Law Enforcement Diversity in Relationship to Community Racial Diversity
and Housing Inclusivity
Note: “X” denotes no reported data. Shaded data reflects representative staffing patterns. Source: U.S. Department of Justice, Bureau of Justice, Law Enforcement Management and Administrative Statistics Survey, 2007.
Of the 74 Together North Jersey municipalities with reported survey data, 30 had full‐time personnel with full arrest powers that were similar to the community racial diversity. These communities have staffing of law enforcement personnel that is representative of their communities.
By comparison, 39 communities have law enforcement agencies that are underrepresenting their community racial diversity, however not in an extreme circumstance. These municipalities are considered dissimilar, as their law enforcement agencies are not fully representative of their community diversity. Of this group, 28 municipalities are diverse in their community racial make‐up, yet have law enforcement agencies with low minority employment and 11 municipalities are high minority in their community racial diversity yet with only a diverse law enforcement staff.
15 This survey is prepared through the Bureau of Justice Statistics at the U.S. Department of Justice. It is conducted every 3 to 4 years and collects data from more than 3,000 state and local law enforcement agencies. All agencies that employ more than 100 officers are included, as well as a nationally representative sample of smaller‐sized agencies. Of the 384 TNJ municipalities, 74 municipalities (19%) had local police departments that completed the 2007 Law Enforcement Management and Administrative Statistics Survey.
16 It is important to note, however, that community racial diversity data is provided by the U.S. Census Bureau’s 2010 Census. However, the survey data on law enforcement is dated 2007
Low Minority Diverse High Minority
<20% Minority 4 X X
20% to 60% Minority 23 5 X
>60% Minority 5 11 3
<20% Minority 18 X X
20% to 60% Minority 5 X X
Full‐Time Personnel with Full Arrest Powers, by Diversity
Inclusive
Non‐Inclusive
Housing DiversityRacial Diversity ‐
Community

TOGETHER North Jersey Fair Housing & Equity in Northern New Jersey
2-29
Five communities have law enforcement agencies that are significantly underrepresenting their community racial diversity. These municipalities have high minority populations, with more than 60% of residents identifying as minority, yet with low minority (less than 20%) law enforcement personnel.
Table 2‐19: Percentage Minority Full‐Time Personnel by Municipality Type ‐ Average and Range within Category
Note: “X” denotes no reported data. Shaded data reflects representative staffing patterns. Average percentage and range of percentages of minority personnel within each category by reporting jurisdictions are shown. Source: U.S. Department of Justice, Bureau of Justice, Law Enforcement Management and Administrative Statistics Survey, 2007.
Table 2‐20 presents the results of a rank ordering of the surveyed jurisdictions by the size of their
differences between their percentage of minority personnel and the community’s minority population
share. The table highlights the 17 jurisdictions with a more than 40 percentage point difference in their
staffing.
Low Minority Diverse High Minority
2.9%
(0 to 7.7%)
8.6% 26.1%
(0% to 16.1%) (20.0% to 32.2%)
7.1% 45.0% 75.3%
(4.4% to 13.7%) (21.7% to 60.0%) (72.7% to 82.7%)
3.6%
(0.0% to 15.4%)
6.9%
(0.0% to 13.8%)
Non‐Inclusive
<20% Minority X X
20% to 60% Minority X X
Full‐Time Personnel with Full Arrest Powers, by Diversity
Inclusive
<20% Minority X X
20% to 60% Minority X
>60% Minority
Housing DiversityRacial Diversity ‐
Community

TOGETHER North Jersey Fair Housing & Equity in Northern New Jersey
2-30
Table 2‐20: Surveyed TNJ Jurisdictions with Greater than 40 Percentage Point Difference between Staffing
Representation and the Community’s Minority Composition
Source: U.S. Department of Justice, Bureau of Justice, Law Enforcement Management and Administrative Statistics Survey, 2007.
Crime Per Capita by Municipality Type 2.8.2
As cautioned by the Federal Bureau of Investigation in its publication of the Uniform Crime Data Report,
the causes and origins of crime have been the subjects of investigation by many disciplines.17 Some
factors that are known to affect the volume and type of crime occurring from place to place are:
Population density and degree of urbanization.
Variations in composition of the population, particularly youth concentration.
Stability of the population with respect to residents' mobility, commuting patterns, and
transient factors.
Modes of transportation and highway system.
Economic conditions, including median income, poverty level, and job availability.
Cultural factors and educational, recreational, and religious characteristics.
Family conditions with respect to divorce and family cohesiveness.
Climate.
Effective strength of law enforcement agencies.
Administrative and investigative emphases of law enforcement.
17 U.S Department of Justice, Federal Bureau of Investigation, 2011, Crime in the United States.
Municipality Local Police Department Agency
Full‐Time Personnel
with Sworn Arrest
Powers, Diversity
% Full‐Time
Personnel with
Sworn Arrest
Powers,
Minority
Racial Diversity % Minority Housing
InclusiveDifference
Plainsboro Plainsboro Township Police Department Low Minority 6.1% High Minority 62.5% Inclusive 56.4%
Edison Edison Police Department Low Minority 4.4% High Minority 60.4% Inclusive 56.0%
North Bergen North Bergen Police Department Diverse 22.5% High Minority 78.0% Inclusive 55.5%
Dover Dover Police Department Diverse 22.2% High Minority 77.6% Inclusive 55.4%
Guttenberg Guttenberg Police Department Diverse 21.7% High Minority 76.5% Inclusive 54.8%
Belleville Belleville Police Department Low Minority 6.7% High Minority 61.4% Inclusive 54.7%
Harrison Harrison Police Department Low Minority 13.7% High Minority 64.6% Inclusive 50.9%
Ridgefield Park Ridgefield Park Police Department Low Minority 3.3% Diverse 53.8% Inclusive 50.5%
North Brunswick North Brunswick Police Department Low Minority 10.6% High Minority 60.9% Inclusive 50.3%
Elizabeth Elizabeth Police Department Diverse 31.8% High Minority 81.8% Inclusive 50.0%
Kearny Kearny Police Department Low Minority 1.8% Diverse 51.3% Inclusive 49.5%
South Bound Brook South Bound Brook Police Department Low Minority 0.0% Diverse 45.8% Inclusive 45.8%
Union Union Township Police Department Low Minority 10.8% Diverse 55.9% Inclusive 45.1%
Linden Linden Police Department Low Minority 10.8% Diverse 55.3% Inclusive 44.5%
Morristown Morris Township Police Department Low Minority 9.1% Diverse 53.5% Inclusive 44.4%
Perth Amboy Perth Amboy Police Department Diverse 43.9% High Minority 88.0% Inclusive 44.1%
New Brunswick New Brunswick Police Department Diverse 31.3% High Minority 73.2% Inclusive 41.9%
Police Jursidictions with Larger Differences in Policing Personnel Representation with Minority Composition, 2007

TOGETHER North Jersey Fair Housing & Equity in Northern New Jersey
2-31
Policies of other components of the criminal justice system (i.e., prosecutorial, judicial,
correctional, and probational).
Citizens' attitudes toward crime
Crime reporting practices of the citizenry.
Table 2‐21 compares the average crime rate as well as the violent and the non‐violent crime rates per
capita segmented by municipality type for the jurisdictions of the TNJ region. While various
jurisdictions have to a greater or lesser extent the capacity to enforce and report crime incidence, the
table shows a marked difference in the crime rate and violent crime rate in high‐minority concentrated
municipalities. As seen in this chapter and in subsequent chapters, these are generally places removed
from areas of high opportunity with fewer resources (e.g., jobs, education attainment, good schools,
income and tax base) to address the conditions that tend to lead to crime incidence.
Table 2‐21: Average Crime Rates per Capita by Municipality Type
Note: Violent crime includes murder, rape, robbery, non‐negligent manslaughter.
Source: U.S. Department of Justice, Bureau of Justice, Law Enforcement Management and Administrative Statistics Survey, 2007.
Housing Diversity Racial Diversity
Average Crime
Rate Rate Per
Capita
Violent Crime
per Capita
Non‐Violent
Crime Rate
per Capita
Count of
MCDs
<20% Minority 17.2 1.0 16.2 41
20% to 60% Minority 21.2 1.7 19.5 96
>60% Minority 28.0 4.9 23.0 36
<20% Minority 16.8 0.7 16.2 167
20% to 60% Minority 16.4 0.7 15.7 44
19.0 1.4 17.6 384
Average Crime Rates per Capita, 2011
Inclusive
Non‐Inclusive
Total

TOGETHER North Jersey Fair Housing & Equity in Northern New Jersey
3-1
What is a Dissimilarity Index? What Does it Measure?
The extent of racial segregation in an area can be measured using a dissimilarity index. The dissimilarity index measures “the evenness with which two mutually exclusive groups are distributed across the geographic units that make up a larger geographic unit.”
For example, it can be used to compare the distribution of blacks and whites across block groups in a municipality, county or metropolitan region. The value range for the index is zero, which represents complete integration, to 1, which represents complete segregation.
The index can be loosely interpreted as the percentage of one group that would need to move in order for each block group to match the composition of the area. According to HUD, a dissimilarity index value greater than 0.55 indicates high levels of segregation and values below 0.40 indicate low levels of segregation. Moderate levels of segregation correspond to values between these thresholds.
3 Segregation and Integration
3.1 Dissimilarity Index
Overall, Non‐Whites and Whites live apart in segregated areas throughout the North Jersey region. The dissimilarity index indicates significant levels of segregation for Black, Hispanic, and Pacific Islander populations. The Black‐White and Hispanic‐White segregation in our region is particularly notable given that these two minority groups comprise almost one‐third of the region’s total population. Table 3‐1 displays the dissimilarity index for the TOGETHER North Jersey region (TNJ) using block group data from the 2010 Census.
The TNJ region is ranked sixth worst in terms of the dissimilarity index among the HUD grantees in receipt of their Sustainable Communities Grants. Benchmarking the TNJ region with other major metropolitan areas, the dissimilarity index makes clear the “lack of evenness” in the distribution of our non‐white and white populations. Specifically, our nonwhite to white ratio is considered “high,” our Hispanic to white rate is among the highest in the nation, and our black‐white ratio is also remarkably high. Table 3‐2 compares the TNJ region to other HUD Grantees in terms of this measure of segregation.
Table 3‐1: Dissimilarity Index for TNJ Region, 2010
Group vs. White Share of Population Dissimilarity Index
Non‐White 42.6% 0.55
Black 11.8% 0.73
Hispanic 19.5% 0.60
Asian 9.3% 0.51
Native American 0.1% 0.61
Pacific Islander 0.0% 0.85
Other* 1.8% 0.38
*Native Hawaiian and Other Pacific Islander; Some Other Race; and Two or More Races
Source: U.S. Census Bureau, 2010 Census

TOGETHER North Jersey Fair Housing & Equity in Northern New Jersey
3-2
What is an Isolation Index? What Does it Measure?
The isolation index compares a group’s share of the overall population in a jurisdiction to the average neighborhood share for members of that group.
For example, a region could have a 20 percent Hispanic composition overall, but the average Hispanic resident of that region lives in a neighborhood that is 60 percent Hispanic– therefore, the isolation index for Hispanics in the region would have a value of 0.4 (0.6‐0.2) . Similar to the dissimilarity index, the higher the value, the more segregated is the community.
Table 3‐2: Dissimilarity Index Comparisons
HUD Grantee Non‐White/White Black /White Hispanic/White NY‐CT Sustainable Communities 0.64 0.81 0.65
East‐West Gateway Council of Governments 0.60 0.74 0.34
Southeast Michigan Council of Governments 0.60 0.76 0.44
Baltimore Metropolitan Council 0.56 0.68 0.42
Chicago Metropolitan Agency for Planning 0.56 0.78 0.59
TOGETHER North Jersey 0.55 0.73 0.60
Houston‐Galveston Area Council 0.52 0.63 0.54
Atlantic Regional Commission 0.50 0.58 0.52
Metropolitan Area Planning Council 0.48 0.65 0.58
North Central Texas Council of Governments 0.48 0.60 0.53
Hampton Roads Planning District Commission 0.44 0.51 0.36
Denver Regional Council of Governments 0.43 0.65 0.49
Metropolitan Transportation Commission 0.43 0.62 0.49
Sacramento Area Council of Governments 0.40 0.58 0.40
Puget Sound Regional Council 0.33 0.52 0.36
Mid‐Ohio Regional Planning Commission 0.21 0.27 0.19
Source: HUD, PD&R
3.2 Isolation Index
Isolation index values for the TNJ region are displayed in Table 3‐3. The index reveals that Blacks, Hispanics and, to a lesser extent, Asians, are the most isolated minority groups in Northern New Jersey. Blacks are the most isolated according to this metric. The isolation index indicates that 47.8% of the average Black individual’s neighbors are Black, even though only 11.8% of residents of the region are Black (47.8 ‐11.8 = 36).
The story of racial concentration, separation, and exclusion is also told in the TNJ region’s relatively high rates of racial and ethnic isolation. Hispanics are more isolated in Northern New Jersey than in nearly any other metropolitan area that was benchmarked except Chicago. Similarly, Blacks are more isolated in Northern New Jersey than in any other region except Chicago, Detroit and St. Louis.

TOGETHER North Jersey Fair Housing & Equity in Northern New Jersey
3-3
Table 3‐3: Isolation Index for TNJ Region (2010)
Group Neighbors of Same Race Share of Population Isolation IndexNon‐White 64.6% 42.6% 0.22
Black 47.8% 11.8% 0.36
Hispanic 43.5% 19.5% 0.24
Asian 25.3% 9.3% 0.16
Native American 0.1% 0.1% 0.00
Pacific Islander 0.0% 0.0% 0.00
Other* 2.8% 1.8% 0.01
*Native Hawaiian and Other Pacific Islander; Some Other Race; and Two or More Races
Source: U.S. Census Bureau, 2010 Census
Table 3.4: Isolation Index Comparisons
HUD Grantee Non‐White Black Hispanic East‐West Gateway Council of Governments 0.33 0.45 0.04
Southeast Michigan Council of Governments 0.32 0.48 0.16
Baltimore Metropolitan Council 0.24 0.35 0.06
NY‐CT Sustainable Communities 0.22 0.35 0.21
Chicago Metropolitan Agency for Planning 0.22 0.5 0.28
TOGETHER North Jersey 0.22 0.36 0.24
Metropolitan Area Planning Council 0.22 0.27 0.18
North Central Texas Council of Governments 0.16 0.22 0.19
Hampton Roads Planning District Com. 0.16 0.21 0.03
Denver Regional Council of Governments 0.16 0.14 0.18
Atlantic Regional Commission 0.15 0.24 0.15
Houston‐Galveston Area Council 0.13 0.23 0.17
Sacramento Area Council of Governments 0.12 0.08 0.08
Metropolitan Transportation Commission 0.1 0.15 0.15
Puget Sound Regional Council 0.1 0.08 0.07
Mid‐Ohio Regional Planning Commission ‐0.04 0.05 0.01
Source: HUD, PD&R

TOGETHER North Jersey Fair Housing & Equity in Northern New Jersey
3-4
What is the Predicted Racial/Ethnic Composition Index? What Does it Measure?
The Predicted Racial/Ethnic Composition Index incorporates income into the analysis of racial/ethnic segregation. The index addresses the question: “given the current household income characteristics for each area, what would we expect the racial/ethnic composition to look like?”
The predicted values for each municipality are based on the TNJ region’s income distribution by race and ethnicity. Values near 1.0 indicate that the municipality is close to its predicted level of minority composition. Values far less than 1.0 indicate that the municipality has many fewer minorities than one might expect given income levels, suggesting the presence of race‐based segregation. Indeed, low index values indicate that minorities are either electing not to live in these places or that they are excluded from doing so for non‐financial reasons.
The municipality’s share of a particular racial/ethnic group can be classified into the following categories based on the index value:
< 0.5 Extremely Below Predicted 0.5 ‐ 0.7 Moderately Below Predicted 0.7 ‐ 0.9 Slightly Below Predicted 0.9 ‐ 1.1 Approximates Predicted >1.1 Above Predicted
3.3 Predicted Racial and Ethnic Composition
Income is not an adequate predictor of spatial patterns by race in Northern New Jersey. In Figures 3‐1 through 3‐5, the Predicted Racial/Ethnic Composition Ratios are mapped for Non‐Whites, Black or African Americans, Hispanics, and Asians.
Holding income constant, Blacks and Hispanics should be spread among a great many more communities than they are. As will be seen in Chapter 7, Access to Opportunities, that explores the geography of opportunity, these maps indicate that areas of racial concentration among minorities also tend toward places of low opportunity compared to others. This suggests that one cause of growing household and municipal resource inequality is a lack of spatial balance in the jobs, schools, infrastructure and housing options available to North Jersey residents by race and income.
Pursuant to the index categories, Tables 3.5 through 3.8 identify example municipalities falling into each category of the index. The tables and maps confirm that income is not a good predictor, or is insufficient for explaining the patterns of racial segregation evident in Northern New Jersey.

TOGETHER North Jersey Fair Housing & Equity in Northern New Jersey
3-5
Table 3‐5: Predicted Racial/Ethnic Composition Index for Non‐White Population
Municipality County Non‐WhiteActual %
Non‐WhitePredicted %
Index Index Category
East Orange City Essex 97.8% 41.1% 2.38 Above Predicted
Tenafly Borough Bergen 30.2% 30.6% 0.99 Approximates Predicted
Highland Park Borough Middlesex 29.0% 35.3% 0.82 Slightly Below Predicted
Hillsborough Township Somerset 19.7% 32.2% 0.61 Moderately Below Predicted
Lavallette Borough Ocean 0.0% 37.0% 0.00 Extremely Below Predicted
Source: HUD, PD&R; U.S. Census Bureau, 2010 Census
Table 3‐6: Predicted Racial/Ethnic Composition Index for Black Population
Municipality County BlackActual %
BlackPredicted %
Index Index Category
East Orange City Essex 89.9% 15.7% 5.72 Above Predicted
Long Branch City Monmouth 13.8% 13.6% 1.01 Approximates Predicted
Somerville Borough Somerset 9.6% 12.7% 0.76 Slightly Below Predicted
Bogota Borough Bergen 7.5% 12.1% 0.62 Moderately Below Predicted
West Milford Township Passaic 0.0% 10.9% 0.00 Extremely Below Predicted
Source: HUD, PD&R; U.S. Census Bureau, 2010 Census
Table 3‐7: Predicted Racial/Ethnic Composition Index for Hispanic Population
Municipality County Total Pop.
HispanicActual %
HispanicPredicted
%
Index Index Category
Union City Hudson 66,455 78.6% 18.7% 4.21 Above Predicted
Ridgefield Borough Bergen 11,032 16.3% 16.3% 1.00 Approximates Predicted
City of Orange Twp. Essex 30,134 15.3% 18.8% 0.81 Slightly Below Predicted
Ogdensburg Borough Sussex 2,410 8.9% 15.3% 0.58 Moderately Below Predicted
Lavallette Borough Ocean 1,875 0.0% 15.9% 0.00 Extremely Below Predicted
Source: HUD, PD&R; U.S. Census Bureau, 2010 Census
Table 3‐8: Predicted Racial/Ethnic Composition Index for Asian Population
Municipality County Total Pop.
AsianActual %
AsianPredicted
%
Index Index Category
Palisades Park Borough Bergen 19,622 52.8% 7.2% 7.38 Above Predicted
Union Township Union 56,642 7.7% 7.7% 1.00 Approximates Predicted
Shrewsbury Township Monmouth 1,141 5.1% 6.4% 0.79 Slightly Below Predicted
Rockaway Borough Morris 6,438 4.5% 8.1% 0.56 Moderately Below Predicted
Highlands Borough Monmouth 5,005 0.0% 7.5% 0.00 Extremely Below Predicted
Source: HUD, PD&R; U.S. Census Bureau, 2010 Census

TOGETHER North Jersey Fair Housing & Equity in Northern New Jersey
3-6
Figure 3‐1: Predicted Racial/Ethnic Composition Index for Non‐White Population

TOGETHER North Jersey Fair Housing & Equity in Northern New Jersey
3-7
Figure 3‐2: Predicted Racial/Ethnic Composition Index for Black Population

TOGETHER North Jersey Fair Housing & Equity in Northern New Jersey
3-8
Figure 3‐3: Predicted Racial/Ethnic Composition Index for Hispanic Population

TOGETHER North Jersey Fair Housing & Equity in Northern New Jersey
3-9
Figure 3‐4: Predicted Racial/Ethnic Composition Index for Asian Population

TOGETHER North Jersey Fair Housing & Equity in Northern New Jersey
4-1
What is a Racially or Ethnically Concentrated Area of Poverty? What Does it Measure?
Racially or Ethnically Concentrated Areas of Poverty (RCAP/ECAP) are defined as census tracts with a majority non‐white population and a family poverty rate that is greater than or equal to 23.7% in the Northern New Jersey region.
The U.S. Census Bureau determines poverty status using a set of income thresholds that vary by family size and composition. A family is considered to be in poverty if the family’s total income is less than the threshold. For example, the poverty threshold for a family of four with two related children was $22,811 in 2011.
4 Racially & Ethnically Concentrated Areas of Poverty
Families and persons living in Racially or Ethnically Concentrated Areas of Poverty (RCAP/ECAPs) experience extraordinary challenges in their daily lives. Research has highlighted the link between concentrated areas of poverty and a variety of societal stressors such as crime, underperforming schools, poor housing and health conditions, and inadequate access to jobs and opportunities. There are more than one‐half million persons in the Northern New Jersey region living in places of racially or ethnically concentrated areas of poverty (see Table 4‐1). More than one‐quarter of all Blacks and 20 percent of all Hispanics in the TNJ region live in these concentrated areas of poverty.
Table 4‐1: RCAP/ECAPs in the TNJ Region, 2010
Population RCAP/ECAP Region Percent
Black 209,520 776,666 27.0%
Hispanic* 265,270 1,284,900 20.6%
Asian 22,240 610,873 3.6%
Native American 1,070 7,896 13.6%
Other 10,765 120,027 9.0%
White 56,051 3,779,545 1.5%
TOTAL
Minority 508,865 2,800,362 18.2%
All 564,916 6,579,907 8.6%
*all races other than White
Source: U.S. Census Bureau, 2010 Census
The TNJ Region has 155 RCAP/ECAP tracts located in 25 municipalities. However, over 50% of all people in RCAP/ECAPs are concentrated in three cities: Newark, Paterson, and Jersey City (see Table 4‐2). Figure 4‐1 illustrates that these troubled places, however, are dispersed throughout Northern New Jersey in pockets of Bergen, Monmouth, Middlesex and Morris Counties, but are most concentrated in Essex, Union, Passaic and Hudson Counties.

TOGETHER North Jersey Fair Housing & Equity in Northern New Jersey
4-2
Table 4‐2: RCAP/ECAPs in the TNJ Region
Municipality County RCAP/ECAPs Population
in RCAP/ECAPs
Percent of Total RCAP/ECAP Population
Newark City Essex 48 137,668 24.4%
Paterson City Passaic 22 88,959 15.7%
Jersey City Hudson 19 66,673 11.8%
Passaic City Passaic 10 53,424 9.5%
Elizabeth City Union 10 43,130 7.6%
East Orange City Essex 8 26,354 4.7%
New Brunswick City Middlesex 4 18,825 3.3%
Union City Hudson 5 17,017 3.0%
Perth Amboy City Middlesex 3 16,381 2.9%
Asbury Park City Monmouth 5 16,116 2.9%
West New York Town Hudson 3 13,050 2.3%
Plainfield City Union 2 11,495 2.0%
City of Orange Township Essex 2 8,151 1.4%
Irvington Township Essex 3 7,385 1.3%
Guttenberg Town Hudson 1 5,977 1.1%
Red Bank Borough Monmouth 1 5,246 0.9%
Hoboken City Hudson 1 4,614 0.8%
West Orange Township Essex 1 3,719 0.7%
Morristown Town Morris 1 3,672 0.7%
Hackensack City Bergen 1 3,646 0.6%
Freehold Borough Monmouth 1 3,524 0.6%
Neptune Township Monmouth 1 3,225 0.6%
Long Branch City Monmouth 1 2,310 0.4%
Montclair Township Essex 1 2,211 0.4%
Harrison Town Hudson 1 2,144 0.4%
TNJ REGION 155 564,916 100%
Source: U.S. Census Bureau, 2010 Census

TOGETHER North Jersey Fair Housing & Equity in Northern New Jersey
4-3
Figure 4‐1: Racially or Ethnically Concentrated Areas of Poverty (RCAP/ECAP)

TOGETHER North Jersey Fair Housing & Equity in Northern New Jersey
5-1
5 Factors Driving Segregation and Concentrated Areas of Poverty
The patterns of segregation and concentration of race and poverty are not new. They are the result of past decisions and expressed in the prevailing values of the society. They have been expressed in governance – for example, in executive actions, legislative initiatives, judicial decisions, funding priorities – and permeate our economic, cultural, and political spheres. This section highlights several of these major driving forces in New Jersey.
5.1 Persistence of Patterns of Exclusionary Zoning
It is a basic principle of land use and zoning to exclude specific land uses. This principle was supported by the United States Supreme Court since the 1920s, when a property owner challenged the ability of a local zoning ordinance to restrict their opportunity to develop land for industrial use.18 More recently, “exclusionary zoning” has referred to zoning that restricts housing choices, limiting the availability of affordable housing in a community. In the Mount Laurel I decision, a 1970 study that was cited defined exclusionary land use controls as those “which appear to interfere seriously with the availability of low‐ and moderate‐cost housing where it is needed,” including:
Minimum building size requirements;
Single‐family restrictions;
Restrictions on the numbers of bedrooms;
Prohibition of mobile homes;
Frontage requirements; and
Lot size requirements.19
Finding that zoning to increase lot sizes and prohibit or severely limit the construction of garden apartments and other multiple dwellings were forms of exclusionary zoning, the New Jersey Supreme Court stated that such practices by developing municipalities have rendered it “impossible for lower paid employees of industries that they have eagerly sought and with open arms (and in Mt. Laurel’s case some of its lower paid municipal employees) to live in the communities where they work.”20
A 2010 nationwide study found that exclusionary zoning indeed caused higher levels of income segregation including concentrations of poverty.21 An earlier study had associated exclusionary zoning with patterns of racial segregation.22
18 Village of Euclid, Ohio v. Ambler Realty Co., 272 U.S. 365 (1926). The Court held that the zoning ordinance was not an unreasonable extension of the village's police power and did not have the character of arbitrary fiat, and thus it was not unconstitutional. 19 Norman Williams, Jr. and Thomas Norman, “Exclusionary Land Use Controls: The Case for North‐Eastern New Jersey,” 22 Syr. L. Rev. 475 (1970). 20 67 N.J. at 172. 21 Jonathan Rothwell and Douglas S. Massey, “Density Zoning and Class Segregation in U.S. Metropolitan Areas.” Social Science Quarterly 91(5):1123‐1143 (2010). 22 Jonathan Rothwell and Douglas S. Massey, “The Effect of Density Zoning on Racial Segregation in U.S. Urban Areas.” Urban Affairs Review 44: 799‐806 (2009).

TOGETHER North Jersey Fair Housing & Equity in Northern New Jersey
5-2
A 2011 study analyzing residential and non‐residential land use development patterns in Somerset and Monmouth Counties over two decades (1986‐2007) together with a build‐out analysis of future development trends based on existing zoning found that the effects of exclusionary zoning are persistent:
The case study counties are over‐zoned for commercial and industrial development, anticipating far more jobs than likely to result from future housing development expected under current zoning laws.
The predominant pattern of large lot subdivisions are locking in a residential land use pattern that will exclude, for many New Jersey households that cannot afford a large‐lot single‐family home, the ability to live near their jobs.23
By over‐zoning land use classifications relative to markets for that development type, this form of “land banking” by municipalities slows or prevents new development today in preference for an ideal future development condition. This fiscal zoning practice is not authorized by statute and it is not an explicitly stated goal of zoning by municipalities adopting this practice. However, when opportunities for affordable residential development are substantially restricted or prohibited while non‐residential development is encouraged, the effect of such zoning is exclusionary and subject to challenge.
5.2 Cultural Barriers
In northern New Jersey and elsewhere, there are both “internal” and “external” cultural barriers that tend to reinforce segregation patterns and concentrated areas of poverty. External cultural barriers tend to wall‐in, or steer, cultural groups into concentrations through exclusion. Internal cultural barriers tend to retain people within their cultural concentrations through extensive family, social, and economic networks.
While the example is outside of the TOGETHER North Jersey region, external cultural barriers driving segregation and concentrated areas of poverty are well articulated in the recent book, Climbing Mount Laurel:24
“I would like to stay…and continue to live in my present address without the fear that my property
values are going to deteriorate.”
“My concern is the impact this will have on the community as a whole. Have we talked with anyone
from the police department?”
I don’t feel we should pay taxes that they will not pay, nor do we have to pay their sewer and water
and all the streets. I think that’s a big consideration the township has to take into account.”
23 John Hasse, John Reiser, and Alexander Pichacz, Evidence of Persistent Exclusionary Effects of Land Use Policy within Historic and Projected Development Patterns in New Jersey: A Case Study of Monmouth and Somerset Counties. Rowan University. (2011)
24 Climbing Mount Laurel: The Struggle for Affordable Housing and Social Mobility in an American Suburb. Douglas S. Massey, Len Albright, Rebecca Casciano, Elizabeth Derickson, and David N. Kinsey. July 2013.

TOGETHER North Jersey Fair Housing & Equity in Northern New Jersey
5-3
Property values, crime, and taxes are persistently cited as the reasons to justify racial, ethnic, and economic segregation through exclusionary land use and zoning practices. Tracking the “after”‐effects of siting the Ethel Lawrence Homes in Mount Laurel, New Jersey, researchers in Climbing Mount Laurel, did not find evidence to substantiate the expressed reasons for exclusionary barriers. Instead, the researchers found: 1. There were no adverse effects on taxes, property
values, or crime rates from the siting and permanent operations of the affordable housing project upon the host community.
2. For adult residents, access to affordable housing in an affluent suburb:
reduced their exposure to disorder and violence;
lowered frequency of negative life events;
improved mental health;
increased economic independence; and
did not reduce access to social support.
3. For children, access to affordable housing in an affluent suburb improved education:
improved learning conditions at home;
increased hours of study;
improved access to higher quality school;
reduced exposure to disorder and violence within schools; and
did not reduce grade achievement.
4. Affordable housing (developed under the Low Income Tax Credit program) proved to be a cost‐effective way to promote racial and class integration and promote social mobility for disadvantaged populations.
The authors of the study caution, however, that the findings from the Ethel Lawrence Homes research may not apply for all poor and disadvantaged families in the region, or for other places, unless certain conditions are met:
[Individuals and households]…mired in substance abuse, criminality, family violence, and household instability are not good candidates for affordable housing developments. Their problems are likely to be complex, interconnected, manifold, and thus to require a more comprehensive intervention than simply providing a decent home in a peaceful neighborhood with good schools. Affordable housing developments do constitute an appropriate intervention, however, for the millions of low and moderate‐income families who are currently trapped in distressed urban neighborhoods for lack of anywhere else to go, but who nonetheless plug away to do the best they can at school and work, hoping for a chance to advance. For such people, affordable housing developments such as the Ethel Lawrence Homes can dramatically divert life trajectories toward socioeconomic success, educational achievement, and real integration into the American middle class.25
25 Douglas Massey, “Lessons from Suburbia”, Pathways. Spring 2013, pp.22‐23.
“…when we carefully assessed trends…in the township and surrounding neighborhoods, we found no evidence whatsoever that the project’s opening had any direct effect on crime rates, tax burdens, or property values. Moreover, the indirect effect on school expenditures was small…Given that the per pupil cost was likely lower in Mount Laurel than in the school districts they came from, one could argue that the new arrangement represented a more efficient use of taxpayer money to achieve better educational outcomes.”— Massey et al., Climbing Mount Laurel

TOGETHER North Jersey Fair Housing & Equity in Northern New Jersey
5-4
Conditions for the Ethel Lawrence Homes that contributed toward these results included:
Residents were both self‐selected and filtered; all of the tenants were required to apply in person in writing, and all applicants were screened to be "good tenants" who pay rent, get along with others, and maintain their units.
A range of affordability was built into the project. Units in the Ethel Lawrence Homes were designed to go to households earning a range of incomes, from 10% of the county's median income for one person ($5,630) to 80% of the median income for a five‐person family ($69,440). In contrast, public housing projects during the 1950s and 1960s were reserved for the neediest families, virtually by definition engendering places of concentrated poverty and creating an untenable social and economic environment.
Project design and aesthetics were similar in physical layout, architecture, and landscaping prevalent in the surrounding, higher‐income subdivisions.
Physical layout and building structures were designed to influence patterns of social interaction and increase the possibilities for informal territorial control, including clear fields of vision that provide what Jane Jacobs once called "eyes on the street": people observing public spaces from individual units and stoops. The physical environment was complemented by property management that intervened actively to build social cohesion among project tenants, providing space and programs for tenants to meet for formal discussions and informal activities, a Community Watch Group, and a Homework Club for children.
Therefore, while external cultural barriers persist, they may be overcome with attention to physical and social details.
Examples of internal cultural barriers are well defined by Patrick Sharkey in his book, Stuck in Place: Urban Neighborhoods and the End of Progress toward Racial Equality.26 The most recent among a number of studies of poverty at the neighborhood level, it shows how economic disinvestment from black neighborhoods, declining economic opportunities, and a growing link between African American communities and the criminal justice system, have resulted in multigenerational poverty that has increased the persistence of segregation by race. “The effect of living within severely disadvantaged communities accumulates over generations.”27 In particular, women raised in stressful, violent, and insecure environments find it more difficult to instill in their own children the confidence and trust to explore the knowledge and experience necessary for healthy development, for breaking through internal cultural barriers.
5.3 Market/Shadow Market Forces
Housing is often cited as an example of classic market forces, with price and availability reflecting a balance of supply and demand. However, both supply and demand factors are heavily manipulated in ways that affect the availability of fair and equitable housing.
26 Patrick Sharkey. Stuck in Place: Urban Neighborhoods and the End of Progress toward Racial Equality. 2013. Chicago: University of Chicago Press.
27 Ibid. Chapter 1.

TOGETHER North Jersey Fair Housing & Equity in Northern New Jersey
5-5
The demand for housing is most affected by the affordability of monthly payments, whether for rent or mortgage payments, including associated costs such as utilities and property taxes amidst several other recurring cost considerations related to transportation, food, child care, education, apparel and personal debt. While every household needs housing, changes in rent levels and mortgage interest rates strongly affect housing demand. Mortgage cost subsidies that have been used to stimulate demand for housing (and increases in housing prices) for nearly a century are declining or expiring.28 Higher payments for rent, mortgage interest, and mortgage insurance have had the effect of reducing housing mobility as costs of relocation added to higher costs for new housing tend to “trap” households in place (and reducing the supply of housing units on the market for sale or rent). 29 In recent years, those aspiring to form households have found it difficult to afford their own housing, as a result of their inability to qualify for mortgages or to pay down payments or rent/security deposits. This has resulted in a cohort of potential households remaining in their childhood homes or combining households by moving in with peers.
Supply‐side factors also contribute to the availability and price range for housing. High costs for building supplies, labor, regulation, and interest on carrying costs affect the ability to profitably add to the supply of housing through new construction, expansion, or rehabilitation of units. If housing prices are too low, units will not be added to the supply as they would be financially unprofitable to build, draining the financial capacity of nonprofit and for‐profit developers.
A “shadow market” has been created by banks flooding the housing supply with lower cost housing resulting from “distressed sales” of housing units held by banks from foreclosures and short sales. Nationally, on average, about 3.5 million homes are listed for sale at any given time. However, millions of additional homes which would normally be for sale are being kept off the market because housing prices are too low.
Housing prices are low due to weak conditions for households seeking financing for housing, as well as due to distressed sales by banks holding units in foreclosure. Banks are willing to sell their inventory of housing gained through foreclosures and short sales at a loss to remove them from their responsibility. By adding low cost housing to the supply, and by claiming a significant portion of the supply of housing units for sale, these “distressed sales” are keeping housing prices low and making the sale of other new and existing houses often unprofitable. Prices are not likely to rise until nearly all of this surplus supply from “distressed inventory” and “shadow inventory” is moved through the market. However, as the size of this shadow market cannot be estimated accurately, this creates uncertainty that keeps market forces from working as they normally would.
28 Reduced mortgage cost subsidies include increased yearly mortgage insurance costs and upfront charges. Combined with the recent expiration of mortgage insurance tax deductions, this made home buying more expensive than at any time since 2008. More expensive mortgage costs tend to lower home sale prices.
29 A similar effect occurs where rents are controlled or rent increases are capped during a renter’s tenure, such that over time the market price for another rental unit far exceeds the rent controlled price of the existing unit.

TOGETHER North Jersey Fair Housing & Equity in Northern New Jersey
5-6
5.4 Realtor Steering
Steering occurs when a real estate salesperson, through his or her actions, words or behaviors, encourages or directs clients toward particular neighborhoods and/or away from others based upon the “protected classes” of race, color, ethnicity, sex, familial status, handicap, or religion. Funneling of home buyers to a particular area based on the desire to keep the makeup of that neighborhood the same or intentionally change it is steering. Racial steering receives the most consumer complaints, but the practice is not acceptable for any reason, and it violates fair housing laws. Steering practices that are specifically prohibited by the Federal Fair Housing Act, and by regulations adopted by HUD to implement that Act, include:
directing people to (or away from) a particular community or neighborhood because of their race or other factor protected under federal law;
failing to inform prospective buyers, based on their race or other prohibited factor, of desirable features of a dwelling or community in order to discourage them from buying in that area; and
conveying to prospective buyers that they would "not fit in" or "not be comfortable" in a community because of such prohibited factors.
Steering is avoided when the salesperson does not share or act on opinions. Facts can be shared, such as absorption rates for a particular neighborhood, homeowner association rules and fees, and the location of train tracks and airport flight paths. Questions about the schools are best answered by identifying school district boundaries, pointing clients to the school district’s web site and encouraging clients to make an appointment to speak directly with school officials. When clients ask for crime statistics or whether sex offenders are residing in the neighborhoods they are considering, they should be directed to crime web sites and encouraged to contact the local and state police departments. Similarly, if a client needs to know the demographics of a neighborhood, they should be referred to the U.S. Census Bureau Web site because it is considered illegal steering for a real estate salesperson to answer questions about the ethnic make‐up of a neighborhood.
If a client says he or she would like to live within five miles of a particular intersection, the salesperson should circle the entire five‐mile area on the map so that everyone has a frame of reference for where the search will be focused. For example, if the client is specifically looking for a resale brick ranch‐style home in the $300,000 ‐ $350,000 price range, the salesperson must provide the client with information about all homes within the target area meeting those needs, and let the client decide which ones to see.
Steering can occur when a real estate salesperson reviews an offer with a client and says, “This paragraph means...” instead of, “This paragraph says...” because “means” infers an opinion. A client should be referred to legal counsel for questions about interpretation.
Steering Words and Phrases While real estate salespersons may intend to be helpful and accommodating, they have been known to employ assumptions about buyers’ needs that could be construed as “steering” or “discriminatory.”
In advertising, agents must refrain from using words deemed to represent any protected classes. For example, none of these words are appropriate and many of them could violate Fair Housing laws:
Sports‐minded Seniors
Bachelor apartment Gentleman’s Farm
Professional Golden Agers
Couples Section 8
Singles Only Integrated
Mature Handicapped
Married Children Welcome

TOGETHER North Jersey Fair Housing & Equity in Northern New Jersey
5-7
Questions that narrow the field of houses which may suit a client’s needs must not be based upon factors involving race, religion, sex, national origin, familial status or handicap. More appropriate questions that avoid consideration of factors related to a protected class of persons include:
Are there specific places you would like to be near (i.e., work, schools, medical facilities, religious institutions, recreational opportunities, shopping, etc.)? If so, what are they, and where are they located? How close would you like to be?
What price range are you considering?
Would you prefer new construction, or a resale?
How much land would you prefer? What sort of terrain?
Do you have a preference for housing style or construction type?
If the search produces a list that is unrealistically long, the salesperson should try to get the client to further focus on their priorities, such as a specific number of bedrooms or other physical features. The client must be the one to narrow the search further; if the salesperson makes the selection of which of the possible neighborhoods to show to the client, he or she is steering the client.
Whenever anyone is asked to steer a client, the correct response of the salesperson is, “I’m sorry, but fair housing laws prevent me from steering certain groups of people away from or toward a certain neighborhood.”
5.5 Covenants
Racially restrictive covenants enforcing segregation are long gone, but neighborhoods of exclusion created by these covenants persist. These covenants established a norm that dates back to prior eras of legally enforced racial segregation.
Racially restrictive covenants were used nationwide during the 1920s through 1940s to prevent people of color from purchasing homes in white communities. The Federal Housing Administration’s Underwriting Manual recommended the use of restrictive covenants as they “provide the surest protection against undesirable encroachment and inharmonious use.” The use of racially restrictive covenants severely limited access of minority households for buying homes.
A covenant is a legally enforceable “contract” imposed in a deed upon the buyer of property. Owners who violate the terms of the covenant risk forfeiting the property. Most covenants “run with the land” and are legally enforceable on future buyers of the property.
Racially restrictive covenants refer to contractual agreements that prohibit the purchase, lease, or occupation of a piece of property by a particular group of people, usually African Americans. Racially restrictive covenants were not only mutual agreements between property owners in a neighborhood not to sell to certain people, but were also agreements enforced through the cooperation of real estate boards and neighborhood associations. Racially restrictive covenants became common after 1926 after the 1917 U.S. Supreme Court decision, Corrigan v. Buckley, which validated their use.
A typical covenant included the following:
…hereafter no part of said property or any portion thereof shall be…occupied by any person not of the Caucasian race, it being intended hereby to restrict the use of said property…against occupancy

TOGETHER North Jersey Fair Housing & Equity in Northern New Jersey
5-8
as owners or tenants of any portion of said property for resident or other purposes by people of the Negro or Mongolian race.
The practice of using racial covenants became so socially acceptable that in 1937 a leading magazine of nationwide circulation awarded 10 communities a “shield of honor” for an umbrella of restrictions against the “wrong kind of people.” The practice was so widespread that by 1940, 80% of property in Chicago and Los Angeles carried restrictive covenants barring black families.30
In 1948, the Supreme Court ruled in Shelly v. Kraemer that “private agreements to exclude persons of designated race or color from the use or occupancy of real estate for residential purposes do not violate the Fourteenth Amendment; but it is violative of the equal protection clause of the Fourteenth Amendment for state courts to enforce them.” Essentially, the Court found that racially‐based restrictive covenants were not themselves unconstitutional because private parties may voluntarily adhere to them but state enforcement of such covenants (including judicial enforcement) would be discriminatory. The widespread practice of racial covenants continued, although it was now legally unenforceable. It was not until the passage of the Fair Housing Act in 1968 that racially restrictive covenants were ruled illegal, although patterns of segregation created by these covenants persist.
5.6 FHA Redlining
Like racially restrictive covenants, the effects of 30 years of federally approved redlining linger to this day. The Federal Housing Administration (FHA) was established by the Roosevelt administration and Congress as part of the National Housing Act of 1934. This law was intended to reduce unemployment by stimulating housing construction through the housing finance system. Through the FHA, the federal government insured mortgages issued by qualified lenders. With mortgage lenders protected from defaults, lenders made more mortgages at lower interest rates. The program made homeownership widely available nationwide, but program requirements also perpetuated racial discrimination and contributed to the decline of many urban communities through “redlining.”
The FHA published a series of underwriting handbooks specifying criteria used in assessing individual properties to ensure that property values would be maintained and that mortgages would not exceed the value of the properties they financed. The 1935 Underwriting Handbook stated that the second most important among eight criteria was “protection from adverse influences” described as infiltration of inharmonious racial or nationality groups.”
Maps made for the Homeowners Loan Corporation (HOLC) established by the Home Owner’s Loan Act of 1933 were color‐coded to rate the “desirability” of neighborhoods for issuing FHA‐insured mortgage loans, an example of which is provided in Figure 5‐1.31 Racial and ethnic composition requirements
30 “Understanding Fair Housing,” U.S. Commission on Civil Rights Clearinghouse Publication 42, February 1973. (PDF)
31 HOLC maps are part of the records of the Federal Home Loan Bank Board (RG195) at the National Archives II and can be found at: http://www.archives.gov

TOGETHER North Jersey Fair Housing & Equity in Northern New Jersey
5-9
resulted in all predominantly Black neighborhoods being deemed too risky for FHA to provide mortgage insurance.
Figure 5‐1 Redlining Map of Philadelphia
A HOLC 1936 security map of Philadelphia showing redlining of lower income neighborhoods. Households and businesses in the red zones could not get mortgages or business loans. http://cml.upenn.edu/redlining/HOLC_1936.html
Further, loans for new homes were larger and longer term than loans for renovating existing homes, making it easier and more affordable to purchase a new home instead of modernizing and existing home.
When it became much more difficult to buy or sell homes in “redlined” neighborhoods, middle class householders moved into the suburbs where FHA mortgage insurance was available. With financing withdrawn from redlined neighborhoods, vacant units would remain empty for months, declining steeply in value with a growing need for repairs. The impacts of redlining have been difficult to reverse, exacerbating racial, ethnic, and economic segregation. By 1966, nearly 30 years after the program’s creation, not a single home in Paterson, New Jersey received mortgage insurance, as the nation’s first industrial city became a declining industrial city.

TOGETHER North Jersey Fair Housing & Equity in Northern New Jersey
5-10
With the passage of the federal Fair Housing Act in 1968, overt redlining became illegal. By the 1990s, all communities of people became able to receive mortgage loans from financial institutions, however, the locations and terms of these loans to this day tend to be less favorable to minority populations as patterns of segregation established by redlining persist.
5.7 Predatory Lending
Predatory lending, also known as “reverse redlining,” is a more subtle form of racial, ethnic, and economic discrimination than the mortgage lending practice of “redlining” that had severely limited access to mortgage financing in areas of minority concentration. Predatory lending practices actually expanded access to mortgage credit in areas of racial and minority concentrations. However, the expansion of mortgage credit in minority areas was typically in the form of subprime mortgage refinancing or home equity loans – at higher interest higher rates and with less favorable lending terms than typically available to non‐minority borrowers. All too‐often these higher cost loans – often variable‐rate loans with low initial “teaser rates” — were made without regard to the ability of the minority borrower to repay the loan and with little risk to the mortgage originator, who typically sold the loans to be packaged into mortgage‐backed securities market.
The housing abandonment and home foreclosures in neighborhoods of minority concentration in the TNJ region are the legacy of the economic crisis that was precipitated, in large part, by predatory lending practices.
5.8 Disinvestment
Disinvestment in areas of segregation by race or other protected classes and in concentrated areas of poverty are both cause and effect, often comprising a vicious cycle of decline that is difficult to halt or reverse. Lack of access to jobs, especially at the low wage or entry level, results in lack of markets for banks, who abandon these neighborhoods to predatory lenders. Without resources, housing is less well maintained, particularly on the exterior, and government agencies and public utilities begin to reduce investments in maintaining and repairing public infrastructure ranging from potholes, to sidewalks, to street lights, to schools. Disinvestment results in lost equity both in housing and community resources.
5.9 Gentrification
Gentrification tends to be driven by young, middle class individuals that are not wealthy, but have a high income potential and recognize value in older, often historic, structures. Retail establishments and neighborhood amenities change to satisfy the needs of the newest residents. Gentrification tends to be associated with wealthier, more economically advantaged metropolitan areas such as the TNJ region, correlated with both higher per capita income and wage levels and with higher levels of college graduates.
Gentrification is often spoken as an epithet because of its reputation for displacing and evicting poorer and minority residents and shopkeepers, increasing segregation as real estate prices rise. However, it is possible, and therefore necessary, to manage this process to be beneficial for existing residents by increasing access to opportunity. A 2013 report for the Federal Reserve Bank of Cleveland reported:
Gentrification First used in 1964, gentrification is defined as: “the process of renewal and rebuilding accompanying the influx of middle‐class or affluent people into deteriorating areas that often displaces poorer residents”—Merriam‐Webster Online Dictionary

TOGETHER North Jersey Fair Housing & Equity in Northern New Jersey
5-11
A look at the data suggests that gentrification is actually beneficial to the financial health of the original residents. From a financial perspective, it is better to be a resident of a low‐price neighborhood that is gentrifying than one that is not. This is true whether residents of the gentrifying neighborhood own homes or do not and whether or not they move out of the neighborhood…Gentrifying tracts saw bigger increases in home values, rents, incomes, education levels, and owner occupancy rates than low‐price tracts that did not gentrify.
[The study examined, for individuals,] differences in changes in Equifax Risk Score from 2001 to 2007 between residents of gentrifying and nongentrifying neighborhoods, controlling for the individuals’ ages and credit scores in 2001…Living in a neighborhood that gentrified between 2000 and 2007 is associated with about an 8 point higher increase in credit score compared to living in a low‐price neighborhood that did not gentrify...The share of people with an account 90 or more days past due fell by 2 percentage points in gentrifying neighborhoods relative to other low‐price neighborhoods during this period (again controlling for age and initial credit score)… Mortgage‐holding residents are associated with about the same increase in credit scores in gentrifying neighborhoods as non‐mortgage‐holding residents…this result suggests that renters in gentrifying neighborhoods benefit by about the same degree as homeowners…to compare movers and nonmovers across gentrifying and nongentrifying neighborhoods...there is a slightly larger increase in credit score (1.5 points more) associated with residents of the gentrifying neighborhoods who moved to a different neighborhood relative to those who lived in a gentrifying neighborhood but did not move. So it appears that, on average, movers are even slightly more positively affected by gentrification than nonmovers.32
A 2013 study by the same author found that regional employment changes were accelerated in gentrifying neighborhoods:
…a detailed analysis is presented on the long‐term employment changes in neighborhoods that have experienced gentrification during the 1990s across a sample of 20 large central cities. This analysis shows that employment grew slightly faster in gentrifying neighborhoods than other portions of the central city. However, jobs in restaurants and retail services tended to replace those lost in goods‐producing industries. This process of industrial restructuring occurred at a faster rate in gentrifying areas. Thus gentrification can be considered a contributory and catalytic factor in accelerating the shift away from manufacturing with urban labor markets.33
Several other major studies support these findings. For example, a 2009 study analyzing a nationwide sample of 1990 and 2010 Census data found that neighborhood changes in predominantly black neighborhoods generally made these areas more attractive for middle‐class black households.34
Recognizing the potentially transformative effects of gentrification, researchers have argued that HUD should promote strategies for affirmatively furthering fair housing by providing housing vouchers or low
32 http://www.clevelandfed.org/research/trends/2013/1113/01regeco.cfm
33 http://www.clevelandfed.org/research/workpaper/2013/wp1307.pdf
34 http://spot.colorado.edu/~mckinnis/migrants072209.pdf

TOGETHER North Jersey Fair Housing & Equity in Northern New Jersey
5-12
cost, minimal down payment loans to current residents of gentrifying neighborhoods enabling them to stay in place or to choose to leave, instead of being involuntarily displaced.35 The policy could be triggered by threshold price increases (e.g., a 25 percent rent increase within two years) and for long term renters faced with displacement.
The rental voucher or low‐cost loan would directly address the displacement concerns.…When long‐term residents or business owners and their children have choice and autonomy, the anger over any change to the culture of the neighborhood would seem to be quelled. Once current residents have a choice of whether to stay or move, there is the potential for residents to organize and to persuade other residents and business owners to stay. If many current residents and business owners were to remain, the retail offerings and street life would likely not change in any meaningful way. Or if they did, the change would occur on the residents’ own terms. If too few people stayed, those who remained might feel a sense of loss but not, presumably, a sense that outsiders pushed out their neighbors.36
Gentrification is not only an issue in cities. In rural areas of the TNJ region and in many outer suburbs and exurbs throughout the nation, rural residents in farm areas have faced pressures limiting their operations and livelihood due to land use conflicts as new wealthy residents moved into new homes nearby. In response, “right to farm” laws (often coupled with farmland preservation investments) balanced the economic power that would otherwise displace existing residents.37
5.10 Costs of Accessibility Compliance
Housing discrimination on the basis of disability is a violation of the civil rights of the disabled. However, the extent to which housing must be designed and built to accommodate people with disabilities is highly variable, and while most changes are low in cost, the total costs per housing unit may be highly variable and uncertain.
Disability Discrimination under the Fair Housing Act 5.10.1
Under the Fair Housing Act, it is illegal to discriminate because of disability. Disability discrimination includes refusing requests for “reasonable modifications” of existing premises (e.g., installing a ramp or grab bar) or for “reasonable accommodations” (e.g., securing an accessible parking space). It is also illegal to charge additional rent or fees for having an assistance animal, to refuse to allow an assistance animal, or to ask about the nature or severity of a person’s disability, except in limited circumstances allowed by law.
35 Rachel D. Godsil, “Autonomy, Mobility, and Affirmatively Furthering Fair Housing in Gentrifying Neighborhoods.” Poverty & Race 23:1 (January/February 2014). http://prrac.org/newsletters/janfeb2014.pdf
36 Ibid., p. 10.
37 Miriam Axel‐Lute, “Finally! A Concrete Proposal to Address Gentrification‐Driven Displacement.” Rooflines: The Shelterforce Blog. January 17, 2014. http://www.rooflines.org/3569/finally_a_concrete_proposal_to_address_gentrification‐driven_displacement/

TOGETHER North Jersey Fair Housing & Equity in Northern New Jersey
5-13
Disability Discrimination under the Americans with Disabilities Act 5.10.2
The Americans with Disabilities Act (ADA) of 1990 is a civil rights law that prohibits discrimination against individuals with disabilities in all areas of public life, including jobs, schools, transportation, and all public and private places that are open to the general public. The ADA recognizes that altering existing structures is more costly than making new construction accessible. With regard to public accommodations such as stores, banks, hotels, and restaurants, the ADA only requires that architectural barriers be removed in existing facilities when it is "readily achievable" (i.e., it can be done "without much difficulty or expense") such as:
ramping one step;
installing a bathroom grab bar;
lowering a paper towel dispenser;
rearranging furniture;
installing offset hinges to widen a doorway; or
painting new lines to create an accessible parking space.
Accessibility Requirements under the Fair Housing Act 5.10.3
The Fair Housing Act requires all “covered multifamily dwellings” designed and constructed for first occupancy after March 13, 1991, to be readily accessible to and usable by persons with disabilities. In buildings with four or more dwelling units and at least one elevator, all dwelling units and all public and common use areas are subject to the Act’s design and construction requirements. In buildings with four or more dwelling units and no elevator, all ground floor units and public and common use areas are subject to the Act’s design and construction requirements. 38 The term “covered multifamily dwelling” is defined by the Act and its implementing regulations and covers many different types of residential buildings and facilities such as those listed in the accompanying sidebar.
These multifamily dwellings must be designed and constructed with the following accessible features:39
• The public and common use areas must be readily accessible to and usable by persons with disabilities;
• All doors designed to allow passage into and within all premises of covered dwellings must be sufficiently wide to allow passage by persons with disabilities, including persons who use wheelchairs;
• All premises within covered dwellings must contain the following features:
An accessible route into and through the dwelling unit;
Light switches, electrical outlets, thermostats, and other environmental controls in accessible locations;
38 http://www.ada.gov/doj_hud_statement.pdf
39 42 U.S.C. § 3604(f)(3)(C).
Reasonable Accommodation Defined “Reasonable accommodation” is a change in the rules, policies, practices and/or services of a housing unit or program to ensure that people with disabilities are not excluded nor have their rights unfairly compromised.
A requested accommodation is unreasonable if it poses an undue financial or administrative burden or a fundamental alteration in the housing program.
Reasonable modification policies allow a person with a disability to alter their rental housing to meet his/her unique needs.

TOGETHER North Jersey Fair Housing & Equity in Northern New Jersey
5-14
Reinforcements in bathroom walls to allow the later installation of grab bars;
Usable kitchens and bathrooms such that an individual using a wheelchair can maneuver about and use the space.
Further, any housing (including single family detached homes) constructed by federal, state, or local government entities or constructed using any federal, state, or local funds may be subject to accessibility requirements under laws other than the Fair Housing Act. These laws ‐‐ particularly Section 504 of the Rehabilitation Act of 1973, Title II of the Americans with Disabilities Act, and the Architectural Barriers Act ‐‐ have requirements for accessibility that exceed those contained in the Fair Housing Act. In addition, state and local building codes may contain accessibility requirements for detached single family homes and/or other housing.
A HUD‐commissioned study in 2003 found that 65% of the multifamily housing stock built after March of 1991 has some degree of violation of the handicap design requirements.40 People with disabilities have the right to modify their housing, but often, unless the housing is subsidized with federal funds, the tenant must assume the cost of these modifications. Although some alterations, such as installing a grab bar, can be inexpensive and easy to complete, many modifications require substantial and costly labor and materials. Adding to the expense is the cost and time involved in finding a contractor with the experience and knowledge to make a unit accessible.
An owner must make a “reasonable accommodation” when necessary to afford a person with a disability an equal opportunity to use and enjoy a rental unit, including public and common areas. For example, a person with a disability might require a reasonable accommodation so that a designated handicapped parking space is in close proximity to their housing unit.
Section 6(a) of the Fair Housing Act makes it illegal for landlords to refuse to permit tenants to make reasonable modifications to their house or apartment, if the tenant is willing to pay for the changes. Under “reasonable modification,” an owner must allow a person with a disability to make certain physical modifications to a unit if needed to fully use and enjoy the housing unit. Owners may require that the modifications be completed in a professional manner and are in compliance with all applicable building codes. In addition, when reasonable, owners may require the tenant to restore the unit to its
40 http://www.huduser.org/portal/publications/fairhsg/multifamily.html
"Covered Multifamily Dwellings" Required to be Accessible under the Fair Housing Act
Condominiums
Cooperatives
Apartment buildings
Vacation and time share units Assisted living facilities
Continuing care facilities
Nursing homes
Public housing developments
HOPE VI projects
Projects funded with HOME or other federal funds
Transitional housing
Single room occupancy units (SROs)
Shelters designed as a residence for homeless persons
Dormitories
Hospices
Extended stay or residential hotels

TOGETHER North Jersey Fair Housing & Equity in Northern New Jersey
5-15
original condition before vacating. Examples of modifications include installing a ramp or a roll‐in shower. 41
Universal Design 5.10.4
One modification concept involves “universal design,” also referred to as "design for all," "inclusive design" or "barrier‐free design." Universal design incorporates the characteristics necessary for people with physical limitations into the design of common products and building spaces, so that that are comfortably usable by all people, not just people with disabilities. This method of design also makes products and homes more widely marketable and profitable, especially for the increasing elderly and disabled populations.
Universal design features for housing include, but are not limited to:
Lowered light switches
Levered door knobs
Stair‐less building entries
Wider doorways
Universal design originates from the belief that the broad range of human ability is ordinary, not special. Designing for a broad range of users from the beginning of the process can increase usability without significantly increasing its cost, and reduces the need and costs for design modifications when abilities or circumstances change. Further, integrating accessible features into the overall design results in better design and avoids the stigmatizing quality of accessible features added on later in the design process or after completion, as in a modification.
Visitability 5.10.5
Recent HUD policies have introduced the concept of "visitable" housing. "Visitability" is an international effort to design all homes to be visitable, to allow people with disabilities to independently access the homes of their nondisabled peers. Visitable design also allows the nondisabled to continue residing in their homes, should they develop a disability.
Basic features of visitability include:
at least one level
no‐step entrance
accessible doorways on the entry‐level floor with a clear width of at least 32 inches (34 inches preferred)
a washroom on the entry‐level floor
hallways at least 36 inches wide on entry‐level floor
bathroom walls reinforced for the future installation of grab bars
accessible climate controls (between 15 and 48 inches above the floor)
lever handles on doorways.
41 The law does not require a landlord to make accommodations or allow modifications that are "unreasonable." An unreasonable modification would be one that is not related to the person's disability, such as installation of a dishwasher. Requests for reasonable accommodation and modification must be evaluated case by case based on existing case law.

TOGETHER North Jersey Fair Housing & Equity in Northern New Jersey
5-16
Visitability differs from universal design in that it does not ensure complete residence accessibility. Instead, it ensures that the principal spaces in a building, such as the entrance, entry‐level floor and washroom facilities, are accessible to a person in a wheelchair. Other accessible features, such as a roll‐in shower or accessible kitchen features, are not requirements for visitability. However, homes with basic access features are also marketable to homebuyers with disabilities, who can then modify the home accordingly, rather than face the costly expense of retrofitting a non‐accessible home or custom‐building an accessible home. People undergoing physical rehabilitation from injury or illness can return home earlier, continuing their rehabilitation on an outpatient basis.
Designing for visitability is also convenient for nondisabled people who use strollers or carriages, or move furniture in and out of a home. Smaller people and children benefit from accessible light switches and climate controls. Housing units with visitability features are usually indistinguishable from those without such features.
Resistance to Accessibility 5.10.6
Despite the benefits and relatively low costs for accessible housing, many real estate developers and real estate agents have not been supportive of changes that increase accessibility by changes to the state building code, fearing that these standards will make housing development more expensive due to greater net square footage, and that not all tenants or owners want or prefer accessible features such as larger kitchens and bathrooms that may result in smaller living rooms and bedrooms.
Many HUD set‐aside units for people with disabilities have a minimum required household income that is greater than many people with disabilities or seniors have available. Developers of Federally assisted housing have expressed concerns that they sometimes cannot find eligible residents for "set‐aside" accessible/adaptable apartments. However, if housing developers or managers make a good‐faith effort to rent a set‐aside unit to an eligible applicant and are unable to do so, HUD will allow rental to a tenant without a disability.
Enforcement of accessibility/adaptability standards by local building inspectors is another challenge, as there is often no designated local construction official charged with enforcing the housing accessibility provisions of Section 504 of the Rehabilitation Act.
Financial Assistance 5.10.7
There are a limited number of programs providing financial assistance to people with disabilities to make their homes accessible. Of these, only a few are targeted to people with disabilities. The majority of programs provide assistance on a first‐come, first‐served basis, and therefore the funding may be quickly distributed. Before making any modifications, landlords and disabled tenants should make sure to explore all available funding options and learn what the requirements are for each.
In some cases, tenants may be able to negotiate with an owner to share the expense of making modifications. For example, a cooperative owner may be willing to pay for part of the cost if the tenant agrees to a longer lease. Owners who decide to pay for some or part of the cost associated with making a unit accessible may be able to receive a federal tax credit. People with disabilities and their housing advocates should educate owners about these opportunities to help finance any needed modifications to their rental housing.

TOGETHER North Jersey Fair Housing & Equity in Northern New Jersey
6-1
6 Communities of Concern: EJ and Other Disadvantaged Populations
6.1 Definitions of Community of Concern
Governing agencies must understand the need of their “customers” – the various populations for whom they serve – and how they are likely to be affected by policy decisions and investments within their jurisdiction whether it is for regional or metropolitan planning, project development and environmental assessments of corridor or facility specific projects, or other operational‐related or policy research related activities. Identifying the location of affected populations, including communities of concern, is a prerequisite step for the development of public participation plans to ensure that planning processes are inclusive and to ensure that the impacts of decisions can be comprehensively assessed. Periodic evaluation of the effectiveness of the public involvement plan—an important means by which agencies and practitioners can assess whether outreach activities have been successful in creating opportunities for meaningful involvement for citizens and stakeholders—requires consideration of the location and diverse characteristics of the affected populations.
Accordingly, the FHEA has identified “Communities of Concern”—places in the TNJ region that are home to high concentrations of minority, low‐income and other disadvantaged populations. For this analysis, Communities of Concern are identified using neighborhood‐level data (i.e., Census block groups or tracts). For each indicator, the neighborhood‐level composition is compared to a TNJ regional threshold and places that equal or exceed that threshold are flagged for further review.42 Ultimately, places with the following characteristics are considered a Community of Concern:
1) Minority concentration equal to or exceeding the regional threshold; or 2) Low‐income concentration equal to or exceeding the regional threshold; or 3) Two or more Non‐EJ Disadvantaged populations43 equal to or exceed the regional threshold.
o Female head of household with children o Carless households o Persons with limited English proficiency o Elderly over 75 years of age
Minority Populations – Definition, Regional Threshold, Table, Map 6.1.1
MPOs must demonstrate, during their planning certification review process with Federal Highway Administration (FHWA) and Federal Transit Administration (FTA), that they have prepared a demographic profile of their metropolitan areas that includes the identification of minority populations (as well as low‐income populations). For purposes of complying with Title VI and environmental justice requirements, it is a first step in demonstrating that their agency has taken steps to identify the needs of minority populations, put tools in place to assess the distribution of benefits and burdens of their program decisions and investments on specific populations, and are prepared to take actions or remedies, as appropriate, to address imbalances in program priorities that may be identified. Over
42 The regional threshold is calculated by dividing the number of persons, households, or families that meet the indicated
condition by the relevant universe (i.e., total population, households, or families in the region). The composition of each block group is compared to the regional threshold. In instances where block group data is unavailable, block‐group compositions are based on census tract‐level characteristics. 43 Persons with disabilities and persons with a physical disability are profiled and mapped, but excluded from the communities
of concern mapping due to data currency and geospatial issues.

TOGETHER North Jersey Fair Housing & Equity in Northern New Jersey
6-2
time, the cumulative effect of such imbalances has the potential to create significant barriers to socio‐economic advancement and opportunity.
Minorities are defined as all persons other than non‐Hispanic Whites, including persons who are: Black or African American; Hispanic or Latino; Asian; American Indian and Alaskan Native; Native Hawaiian and other Pacific Islander; Some Other Race; or More than One Race.
Hudson, Essex, Passaic, Union, and Middlesex counties contain a disproportionate share of the minority population living in the TNJ region. As indicated in Table 6‐1, these four counties represent roughly 50 percent of the region’s total population but close to 70 percent of all minorities. At the same time, Warren, Ocean, Hunterdon, and Sussex counties make up roughly 15 percent of the region’s total population but contain less than 5 percent of all minorities. Figure 6‐1 presents this spatial concentration of minority populations in the TNJ region as well as compares each county’s average minority population share vis‐à‐vis the regional threshold (i.e., average) of 42.6%
Table 6‐1: Distribution of Total Minority Populations in the TNJ Region, 2010
County Total Population
RegionalShare
MinorityPopulation
RegionalShare
Index
Hudson 634,266 9.6% 438,756 15.7% 1.63
Essex 783,969 11.9% 523,792 18.7% 1.57
Passaic 501,226 7.6% 274,082 9.8% 1.28
Union 536,499 8.2% 293,187 10.5% 1.28
Middlesex 809,858 12.3% 411,134 14.7% 1.19
Somerset 323,444 4.9% 121,595 4.3% 0.88
Bergen 905,116 13.8% 339,063 12.1% 0.88
Morris 492,276 7.5% 122,725 4.4% 0.59
Monmouth 630,380 9.6% 146,945 5.2% 0.55
Warren 108,692 1.7% 15,527 0.6% 0.34
Ocean 576,567 8.8% 81,033 2.9% 0.33
Hunterdon 128,349 2.0% 15,742 0.6% 0.29
Sussex 149,265 2.3% 16,781 0.6% 0.26
TOTAL 6,579,907 100.0% 2,800,362 100.0% 1.00
Source: U.S. Census Bureau, 2010 Census (Summary File 1, Table QT‐P4) by block group

TOGETHER North Jersey Fair Housing & Equity in Northern New Jersey
6-3
Figure 6‐1: Minority Populations

TOGETHER North Jersey Fair Housing & Equity in Northern New Jersey
6-4
Households in Poverty 6.1.2
The U.S. Census Bureau defines poverty at the family level rather than the household level. Accordingly, households are classified as poor when the total income of the householder’s family is below the appropriate poverty threshold,44 which vary based on the size of the family, number of related children, and, for 1‐ and 2‐person families, age of householder.45 For example, the poverty threshold for a family of four with two related children in 2010 was $22,113.46 Hudson, Essex, Passaic, and Union counties contain a disproportionate share of households in poverty in the TNJ region. As indicated in Table 6‐2, these counties represent roughly one‐third of the region’s households (36.4%) but over half of all households in poverty (55.6%). By contrast, Morris, Hunterdon, and Somerset counties contain nearly 15 percent of the region’s households, but only 6 percent of all households in poverty. Figure 6.2 provides further graphical evidence of the high concentration of low‐income households in the four urban core counties – each exceeding the regional threshold rate of 8.9%. Households in poverty, however, are not confined to these counties and evidence of the suburbanization of poverty can also be seen with households in poverty and pockets of high poverty areas in each county.
Table 6‐2: Distribution of Households in Poverty in the TNJ Region, 2010
County Total Households
RegionalShare
Households inPoverty
Regional Share
Index
Hudson 237,726 10.1% 35,467 16.9% 1.68
Essex 277,426 11.7% 40,663 19.4% 1.65
Passaic 161,428 6.8% 23,106 11.0% 1.62
Union 184,808 7.8% 17,264 8.2% 1.05
Ocean 222,396 9.4% 17,456 8.3% 0.89
Middlesex 277,398 11.7% 19,081 9.1% 0.78
Monmouth 232,513 9.8% 15,739 7.5% 0.76
Warren 41,601 1.8% 2,766 1.3% 0.75
Bergen 333,874 14.1% 22,108 10.6% 0.75
Sussex 55,842 2.4% 2,816 1.3% 0.57
Morris 178,638 7.6% 7,189 3.4% 0.45
Hunterdon 47,182 2.0% 1,750 0.8% 0.42
Somerset 114,431 4.8% 4,083 1.9% 0.40
TOTAL 2,365,263 100.0% 209,488 100.0% 1.00
Source: U.S. Census Bureau, 2006‐2010 American Community Survey (Table B17017) by census tract
44 Poverty statistics in the American Community Survey follow standards specified by the Office of Management and Budget
Policy Directive 14 45 American Community Survey, 2010 Subject Definitions: pg. 27
46 http://www.census.gov/hhes/www/poverty/data/threshld/

TOGETHER North Jersey Fair Housing & Equity in Northern New Jersey
6-5
Figure 6‐2: Households in Poverty

TOGETHER North Jersey Fair Housing & Equity in Northern New Jersey
6-6
Female Head of Households with Children 6.1.3
Single parents with children often experience greater rates of poverty than the general population, have exceptional challenges successfully balancing work and home‐maintaining activities, and tend to place unique burdens on the transportation network, likely due to the need to work multiple jobs and/or work during unconventional hours.47 This socioeconomic variable adds the dimensions of gender and children to the Communities of Concern analysis. Data for this variable is based on the Census category “Female household, no husband present families with related children under 18 years.”48
Essex, Passaic, Hudson, and Union counties contain a disproportionate share of female‐headed households with children (FHWC) that live in the TNJ region. As indicated in Table 6‐3, these counties represent roughly a third of the region’s total households (36.9%) but over half of all FHWC households (53.3%). By contrast, counties such as Ocean, Morris, and Hunterdon contain a comparatively small share of FHWC. In fact, these counties comprise 18.7 percent of total households, but only 11.9 percent of all FHWC in the TNJ region.
Figure 6‐3 illustrates areas with higher concentrations of FHWC that exceed the regional average of 6.4% percent of all households. While concentrated in the urban core cities, such households are located in all Northern New Jersey counties with exceptionally larger numbers in Bergen, Middlesex and Monmouth Counties.
Table 6‐3: Distribution of Female Head of Household with a Child Households in the TNJ Region, 2010
County TotalHouseholds
RegionalShare
FHWCHouseholds
Regional Share
Index
Essex 283,712 11.8% 31,392 20.5% 1.73
Passaic 166,785 7.0% 15,192 9.9% 1.43
Hudson 246,437 10.3% 20,713 13.5% 1.32
Union 188,118 7.8% 14,378 9.4% 1.20
Middlesex 281,186 11.7% 15,614 10.2% 0.87
Warren 41,480 1.7% 2,232 1.5% 0.84
Monmouth 233,983 9.8% 11,771 7.7% 0.79
Somerset 117,759 4.9% 5,515 3.6% 0.73
Bergen 335,730 14.0% 15,708 10.3% 0.73
Sussex 54,752 2.3% 2,527 1.6% 0.72
Ocean 221,111 9.2% 9,360 6.1% 0.66
Morris 180,534 7.5% 7,112 4.6% 0.62
Hunterdon 47,169 2.0% 1,710 1.1% 0.57
TOTAL 2,398,756 100.0% 153,224 100.0% 1.00
Source: U.S. Census Bureau, 2010 Census (Summary File 1, Table QT‐P11) by block group
47 Environmental Justice at DVRPC, Fiscal Year 2010
48 The 2010 Census defines “female household, no husband present families” as a family with a female householder and no
husband present. Related children are defined as any child under 18 years old who is related to the householder by birth, marriage, or adoption. (2010 Census Summary File 1, Technical Documentation, September 2012: pg. B‐5 and B‐6)

TOGETHER North Jersey Fair Housing & Equity in Northern New Jersey
6-7
Figure 6‐3: Female Head of Household with Children

TOGETHER North Jersey Fair Housing & Equity in Northern New Jersey
6-8
Carless Households 6.1.4
Carless households are defined by the U.S. Census Bureau as occupied housing units where zero cars are kept at home and are available for the use of the household members.49 Carless households are often referred to as a “transit dependent” population since they must rely on public transit for daily travel needs and therefore have limited mobility.50 Although some households may choose not to own a car (perhaps due to an abundance of nearby transit options or personal preference) others lack access to cars due to limited financial resources, disabilities, or other factors.
Hudson, Essex, and Passaic counties contain a disproportionate share of the carless households in the TNJ region and Union County also contains a larger relative percentage of such households. As indicated in Table 6‐4, these four counties represent roughly one third of the region’s households (36.4%) but almost two‐thirds of its carless households (64.8%). By comparison, counties outside this inner ring such as Warren, Somerset, Morris, Sussex, and Hunterdon, contain about a fifth of all households (18.5%) but only 7 percent of all carless households. The relative lack of transit options in these outer counties may indeed make it difficult for transit‐dependent populations (e.g., carless households, low‐income populations, persons with disabilities, etc.) to reside in this portion of the region. Figure 6‐4 exhibits the spatial distribution of carless households, illustrating in particular places that exceed the regional threshold of 12.5% of all households.
Table 6‐4: Distribution of Carless Households in the TNJ Region, 2010
County Total Households
RegionalShare
CarlessHouseholds
Regional Share
Index
Hudson 237,726 10.1% 80,464 27.3% 2.71
Essex 277,426 11.7% 62,902 21.3% 1.82
Passaic 161,428 6.8% 26,729 9.1% 1.33
Union 184,808 7.8% 21,371 7.2% 0.93
Middlesex 277,398 11.7% 23,040 7.8% 0.67
Bergen 333,874 14.1% 26,836 9.1% 0.64
Monmouth 232,513 9.8% 18,298 6.2% 0.63
Ocean 222,396 9.4% 15,080 5.1% 0.54
Warren 41,601 1.8% 2,161 0.7% 0.42
Somerset 114,431 4.8% 5,906 2.0% 0.41
Morris 178,638 7.6% 9,084 3.1% 0.41
Sussex 55,842 2.4% 1,990 0.7% 0.29
Hunterdon 47,182 2.0% 1,410 0.5% 0.24
TOTAL 2,365,263 100.0% 295,271 100.0% 1.00
Source: U.S. Census Bureau, 2006‐2010 American Community Survey (Table B25044) by block group
49 More specifically, the variable refers to the number of passenger cars, vans, and pickup or panel trucks of one‐ton capacity or
less. (American Community Survey, 2010 Subject Definitions: pg. 42). 50 Environmental Justice at DVRPC, Fiscal Year 2010

TOGETHER North Jersey Fair Housing & Equity in Northern New Jersey
6-9
Figure 6‐4: Carless Households

TOGETHER North Jersey Fair Housing & Equity in Northern New Jersey
6-10
Persons with Limited English Proficiency 6.1.5
Individuals who do not speak English as their primary language and who have a limited ability to read, speak, write, or understand English can be limited English proficiency, or “LEP.”51 Executive Order 13166, “Improving Access to Services for Persons with Limited English Proficiency,” requires federal agencies to examine the services they provide, identify any need for services to those with limited English proficiency, and to develop and implement a system to provide those services so LEP persons can have meaningful access to them.52 The U.S. Census Bureau collects data on the language spoken at home and the ability to speak English for the population five years and over. Persons are classified as LEP if they speak a language other than English at home and they speak English less than “very well.”53 Persons with Limited English Proficiency are a disadvantaged population since a limited ability to read, speak, write, or understand English may create barriers to accessing goods, services, and opportunities (e.g., jobs, education, health care, transportation, etc.).
Hudson, Passaic, Union, Middlesex, and Essex counties contain a disproportionate share of LEP persons in the TNJ region. As primary settlement destinations for the foreign‐born, these counties account for close to 70 percent of all LEP persons, but just under half of the region’s total population (see Table 6.5). Most notably, Hudson County represents 17.5 percent of all LEP persons, but 9.5 percent of the region’s total population over the age of 5. By comparison, the counties of Ocean, Warren, Hunterdon, and Sussex contain just over 4 percent of the total LEP population, but almost 15 percent of all persons. Figure 6‐5 exhibits the spatial distribution of LEP persons, illustrating in particular those places that exceed the regional threshold average of 13.7% of all persons.
Table 6‐5: Distribution of Persons with Limited English Proficiency in the TNJ Region, 2010
County Total Population (over 5 yrs.)
RegionalShare
LEPPopulation
Regional Share
Index
Hudson 580,675 9.5% 146,864 17.5% 1.84
Passaic 461,484 7.6% 100,842 12.0% 1.59
Union 493,633 8.1% 101,215 12.1% 1.50
Middlesex 748,180 12.3% 116,630 13.9% 1.14
Essex 726,450 11.9% 105,304 12.6% 1.06
Bergen 845,484 13.8% 116,315 13.9% 1.00
Somerset 299,319 4.9% 30,161 3.6% 0.74
Morris 461,072 7.6% 42,311 5.1% 0.67
Monmouth 592,007 9.7% 42,051 5.0% 0.52
Ocean 531,110 8.7% 23,839 2.8% 0.33
Warren 102,498 1.7% 3,627 0.4% 0.26
Hunterdon 121,848 2.0% 4,183 0.5% 0.25
Sussex 141,701 2.3% 3,677 0.4% 0.19
TOTAL 6,105,461 100.0% 837,019 100.0% 1.00
Source: U.S. Census Bureau, 2006‐2010 American Community Survey (Table B16001) by census tract
51 http://www.lep.gov/faqs/faqs.html#OneQ1
52 http://www.lep.gov/faqs/faqs.html#OneQ3
53 The American Community Survey has five categories for English‐speaking ability: “Very‐well,” “Well,” “Not well,” and “Not at
all.” However, respondents that answer “Well,” “Not well,” or “Not at all” are sometimes referred to as “Less than ‘very well’” (American Community Survey, 2010 Subject Definitions: pg. 45).

TOGETHER North Jersey Fair Housing & Equity in Northern New Jersey
6-11
Figure 6‐5: Persons with Limited English Proficiency

TOGETHER North Jersey Fair Housing & Equity in Northern New Jersey
6-12
Elderly Over 75 Years of Age 6.1.6
Elderly is defined here as all persons 75 years of age and over.54 Elderly persons are included in this analysis due to the physical, mental, and/or financial barriers to mobility and accessibility encountered by this population.
Elderly populations are more evenly distributed in the TNJ region than many of the other indicators; however, a disproportionate share of the region’s elderly live in Ocean and Bergen counties. As indicated in Table 6.6, these two counties comprise 22.5 percent of the region’s total population but roughly 30 percent of all elderly persons. Proportionately more of the region’s elderly population also lives in the outer ring counties, including Warren, Monmouth, and Morris counties.
Figure 6‐6 depicts the distribution of elderly persons in the TNJ region, highlighting in particular those places where the elderly account for more than the regional threshold average of 6.6% of the population.
Table 6‐6: Distribution of Elderly Populations in the TNJ Region, 2010
County Total Population
RegionalShare
ElderlyPopulation
Regional Share
Index
Ocean 576,567 8.8% 62,890 14.6% 1.66
Bergen 905,116 13.8% 69,243 16.0% 1.17
Warren 108,692 1.7% 7,367 1.7% 1.03
Monmouth 630,380 9.6% 42,349 9.8% 1.02
Morris 492,276 7.5% 32,566 7.5% 1.01
Union 536,499 8.2% 33,916 7.9% 0.96
Middlesex 809,858 12.3% 48,730 11.3% 0.92
Somerset 323,444 4.9% 19,281 4.5% 0.91
Passaic 501,226 7.6% 28,474 6.6% 0.87
Essex 783,969 11.9% 42,721 9.9% 0.83
Hunterdon 128,349 2.0% 6,961 1.6% 0.83
Hudson 634,266 9.6% 29,972 6.9% 0.72
Sussex 149,265 2.3% 7,300 1.7% 0.75
TOTAL 6,579,907 100.0% 431,770 100.0% 1.00
Source: U.S. Census Bureau, 2010 Census (Summary File 1, Table P12) by block group
54 DVRPC users this definition of elderly since persons over 75‐years old and over qualify for most, if not all, mobility programs
with an age requirement.
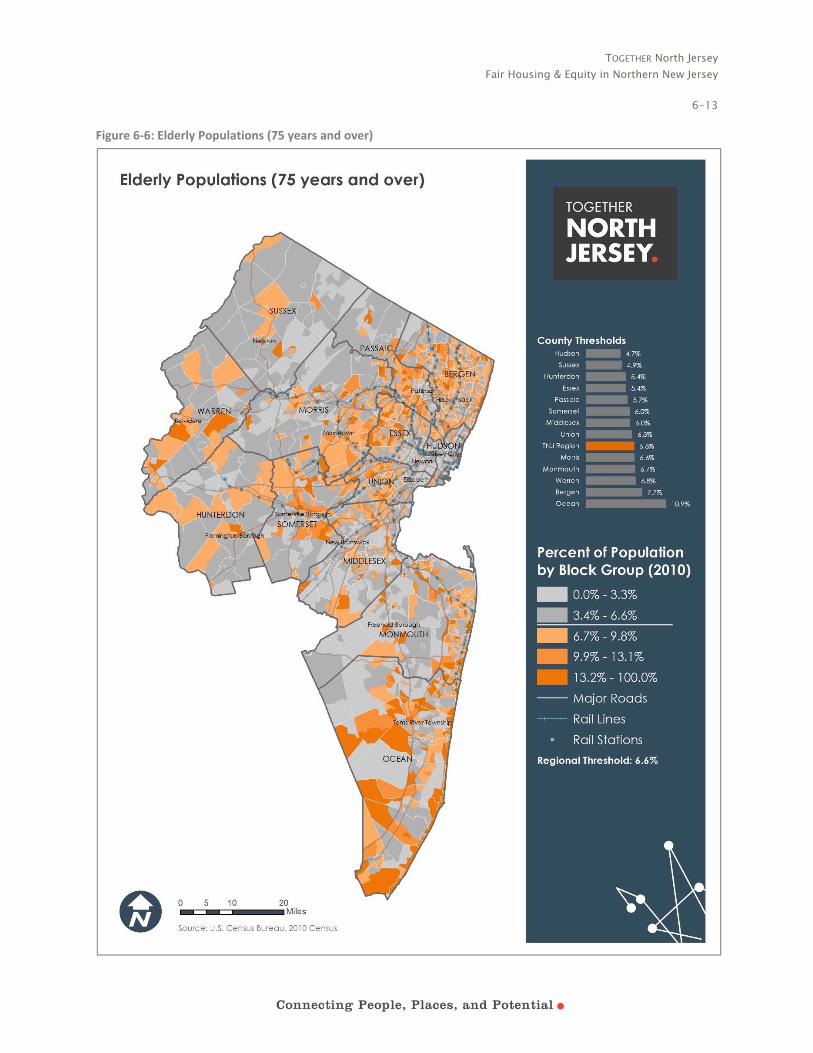
TOGETHER North Jersey Fair Housing & Equity in Northern New Jersey
6-13
Figure 6‐6: Elderly Populations (75 years and over)

TOGETHER North Jersey Fair Housing & Equity in Northern New Jersey
6-14
Persons with Disabilities 6.1.7
The Americans with Disabilities Act (ADA) prohibits discrimination on the basis of disability in employment, State and local government, public accommodations, commercial facilities, transportation, and telecommunications. Under the ADA, disability is defined as “a person who has physical or mental impairment that substantially limits one or more major life activities, a person who has a history or record of such impairment, or a person who is perceived by others as having such an impairment.”55
Identifying concentrations of persons with disabilities is important since these individuals may require specific accommodations with respect to housing, transportation, education, and other aspects of life. Indeed, the Fair Housing Act, as amended, requires owners of housing facilities to make reasonable accommodation in their policies and operations to afford people with disabilities equal housing opportunities (e.g., allowing guide dogs in buildings where pets are otherwise prohibited; allowing tenants to make access‐related modifications to private and common use spaces; etc.).56
In the 2010 American Community Survey, disability status is based on six types of disability: hearing, vision, cognitive, ambulatory, self‐care, and independent living. Due to data limitations,57 however, the following section presents data from the 2000 Census, which defined disability status based on physical, sensory, mental, self‐care, go‐outside home, and employment disabilities. Under this framework, a physical disability is defined as “conditions that substantially limit one or more basic physical activities such as walking, climbing stair, reaching, lifting, or carrying.”58 Importantly, disability questions in the 2000 Census pertain only to the civilian non‐institutionalized population 5 years of age and over. Although all disability subtypes present unique challenges, in the following sections data is presented for overall disability status as well as persons with a physical disability.
Hudson, Essex, Passaic, and Ocean counties contain a disproportionate share of persons with disabilities in the TNJ region. As indicated in Table 6‐7, these counties represent 38 percent of the total population but 47 percent of all persons with a disability. The same counties, plus Warren, are also home to a disproportionate share of region’s population with a physical disability. Figures 6‐7 and 6‐8 illustrate the distribution of persons with disabilities and persons with physical disabilities.
55 http://www.ada.gov/cguide.htm#anchor62335
56 http://www.ada.gov/cguide.htm#anchor62335
57 Current ACS estimates were only available for geographies with populations of 65,000 or more (1‐year estimates) or 20,000
or more (3‐year estimates) at the time of preparation. 5‐year estimates for all geographies including Census tracts and block groups were not yet released at the time of preparation. 58 http://www.census.gov/people/disability/methodology/acs.html

TOGETHER North Jersey Fair Housing & Equity in Northern New Jersey
6-15
Table 6‐7: Distribution of Persons with Disabilities in the TNJ Region, 2000
County
Total Population (over 5 yrs.)
Regional Share Disability
RegionalShare Index
Phys. Disability
Regional Share Index
Hudson 565,210 9.7% 134,428 13.0% 1.33 43,125 11.1% 1.15
Essex 723,764 12.4% 158,244 15.3% 1.23 54,168 14.0% 1.12
Passaic 448,131 7.7% 97,455 9.4% 1.22 32,202 8.3% 1.08
Ocean 472,366 8.1% 95,010 9.2% 1.13 45,544 11.8% 1.45
Union 481,132 8.3% 87,207 8.4% 1.02 31,997 8.3% 1.00
Warren 94,459 1.6% 15,508 1.5% 0.92 7,096 1.8% 1.13
Middlesex 693,770 11.9% 112,382 10.8% 0.91 43,020 11.1% 0.93
Bergen 823,298 14.2% 129,516 12.5% 0.88 47,454 12.3% 0.87
Monmouth 565,821 9.7% 84,529 8.1% 0.84 35,645 9.2% 0.95
Morris 433,118 7.4% 58,875 5.7% 0.76 21,282 5.5% 0.74
Sussex 133,074 2.3% 17,976 1.7% 0.76 8,084 2.1% 0.91
Somerset 272,228 4.7% 34,432 3.3% 0.71 12,750 3.3% 0.70
Hunterdon 109,954 1.9% 11,945 1.2% 0.61 4,727 1.2% 0.65
TOTAL 5,816,325 100.0% 1,037,507 100.0% 1.00 387,094 100.0% 1.00
Source: U.S. Census Bureau, 2000 Census (Summary File 3, DP‐2) by census tract

TOGETHER North Jersey Fair Housing & Equity in Northern New Jersey
6-16
Figure 6‐7: Persons with Disabilities

TOGETHER North Jersey Fair Housing & Equity in Northern New Jersey
6-17
Figure 6‐8: Persons with a Physical Disability

TOGETHER North Jersey Fair Housing & Equity in Northern New Jersey
6-18
Communities of Concern 6.1.8
Communities of Concern are block groups that exceed the regional threshold for one or both EJ populations (i.e., minority and low‐income households) and/or exceed the regional threshold for two or more other indicators of disadvantage.59
Hudson, Essex, Middlesex, Union, and Passaic counties are home to a disproportionate share of the region’s population living in Communities of Concern. As indicated in Table 6‐8, these counties are home to just under half of the region’s population but two‐thirds of all persons living in Communities of Concern. By comparison, less than 5 percent of the region’s persons living in Communities of Concern reside in sub‐region comprising Warren, Morris, Sussex, or Hunterdon counties, yet these counties comprise 13.4 percent of the region’s total population. Figure 6‐9 presents a map of the communities of concern in the TNJ region.
Table 6‐8: Communities of Concern as a Share of the Regional Population, 2010
TNJ REGION MEETS EJ CRITERIA (ONLY) MEETS NON‐EJ DISAD. (ONLY) COMMUNITIES OF
CONCERN
County Total Pop. Regional Share Population
Regional Share Index Population
Regional Share Index Population
Regional Share Index
Hudson 634,266 9.6% 573,372 17.9% 1.86 25,190 5.9% 0.62 598,562 16.5% 1.71
Essex 783,969 11.9% 561,500 17.6% 1.47 27,203 6.4% 0.54 588,703 16.3% 1.36
Middlesex 809,858 12.3% 515,142 16.1% 1.31 43,083 10.2% 0.83 558,225 15.4% 1.25
Union 536,499 8.2% 322,186 10.1% 1.24 44,944 10.6% 1.30 367,130 10.1% 1.24
Passaic 501,226 7.6% 284,671 8.9% 1.17 42,238 10.0% 1.31 326,909 9.0% 1.18
Bergen 905,116 13.8% 375,893 11.8% 0.85 102,466 24.2% 1.76 478,359 13.2% 0.96
Somerset 323,444 4.9% 116,872 3.7% 0.74 15,620 3.7% 0.75 132,492 3.7% 0.74
Ocean 576,567 8.8% 166,344 5.2% 0.59 37,746 8.9% 1.02 204,090 5.6% 0.64
Monmouth 630,380 9.6% 152,399 4.8% 0.50 43,827 10.3% 1.08 196,226 5.4% 0.57
Warren 108,692 1.7% 26,001 0.8% 0.49 3,611 0.9% 0.52 29,612 0.8% 0.49
Morris 492,276 7.5% 80,031 2.5% 0.33 35,277 8.3% 1.11 115,308 3.2% 0.43
Sussex 149,265 2.3% 19,120 0.6% 0.26 2,510 0.6% 0.26 21,630 0.6% 0.26
Hunterdon 128,349 2.0% 4,581 0.1% 0.07 0 0.0% 0.00 4,581 0.1% 0.06
TOTAL 6,579,907 100.0% 3,198,112 100.0% 1.00 423,715 100.0% 1.00 3,621,827 100.0% 1.00
Source: U.S. Census Bureau
59 Female head of household with a child; carless households; persons with limited English proficiency; and elderly over 75
years of age.

TOGETHER North Jersey Fair Housing & Equity in Northern New Jersey
6-19
Figure 6‐9: Communities of Concern

TOGETHER North Jersey Fair Housing & Equity in Northern New Jersey
6-20
Growth in Communities of Concern 6.1.9
The North Jersey region continues to grow and change. As the populations of people of color and low‐income households have increased in the TNJ region since 1990, so have the number of Communities of Concern. Table 6‐9 provides a regional‐level snapshot comparison of how regional thresholds have changed for identifying communities of concern.60 Table 6.10 compares the total percentage of the North Jersey population that reside in communities that are designated as “low‐income”, “high‐minority” or “communities of concern” between 1990 and 2010.
Table 6‐9: Thresholds for Indicators of Communities of Concern, 1990 & 2010
Indicator Threshold
1990 Threshold
2010
Percent Point Change
(1990‐2010) Minority Population 27.3% 42.6% 15.3%
Households in Poverty 7.6% 8.9% 1.3%
Female Head of HH with Children 5.2% 6.4% 1.1%
Limited English Proficiency 9.9% 13.7% 3.8%
Carless Households 13.6% 12.5% ‐1.1%
Elderly Population 5.6% 6.6% 1.0%
Table 6‐10 Percent of the North Jersey Population Residing in Communities of Concern, 1990 & 2010
Indicator Threshold
1990 Threshold
2010
Percent Point Change
(1990‐2010) High Minority Communities 31.5% 41.7% 10.2%
Low‐Income Communities 31.8% 34.3% 2.6%
Communities of Concern 50.1% 55.0% 4.9%
60 As persons with disabilities data was unavailable for 1990 at the appropriate geographic scale, it is excluded from this comparative analysis.

TOGETHER North Jersey Fair Housing & Equity in Northern New Jersey
7-1
7 Access to Opportunities
7.1 Geographies of Opportunity
In previous chapters, it was shown that people in the region do not have equal access to the places of opportunity that are so essential for improving the health, safety and economic well‐being of themselves and their family. This chapter further explores the socioeconomic characteristics of places of opportunity in the TNJ region. Several indicators are examined that define what a place of opportunity might possess, including high‐performing schools, job growth, fiscal capacity, educated workforce, higher incomes, fewer persons in poverty, affordable housing, lower crime, higher voter turnout, among other issues. The regional spatial patterns of places of “high” and “low” opportunity are presented. Drawing upon the previous chapter on communities of concern, the chapter evaluates whether there are significant disparities in access to opportunities on the basis of race, income and other measures of disadvantage.
7.2 Education
Elementary School Reading Proficiency 7.2.1
Elementary School Reading Proficiency refers to students who read at the “Proficient” or “Advanced Proficient” levels for their grade based on the New Jersey Assessment of Skills and Knowledge (NJASK).61 Proficient is the state’s minimum acceptable reading level. The New Jersey Department of Education suggests that students whose reading level is only “Partially Proficient” require either additional individual support or direct program interventions.62 NJASK tests student’s reading proficiency according to the Common Core State Standards (CCSS).63
The Common Core State Standards (CCSS) provide a state‐oriented framework for national educational reform. For all member states, the standards require that educational curricula are: “Aligned with college and work expectations; are clear, understandable and consistent; include rigorous content and application of knowledge through high‐order skills; build upon strengths and lessons of current state standards; are informed by other top performing countries, so that all students are prepared to succeed in our global economy and society; and are evidence‐based.”64 The CCSS were developed by the National Governors Association Center for Best Practices and the Council of Chief State School Officers and adopted on June 2, 2010.65 New Jersey adopted the Common Core State Standards in 2010 along with forty‐three states and the District of Columbia.66
61 State of New Jersey Department of Education, “New Jersey Assessment of Skills and Knowledge (NJ ASK),” accessed May 30, 2014, http://www.nj.gov/education/assessment/es/njask/. 62State of New Jersey Board of Education, “New Jersey Assessment of Skills and Knowledge 2013 Score Interpretation Manual Grades 3‐8” (State of new Jersey Department of Education, July 2010), http://www.nj.gov/education/assessment/ms/5‐8/ref/SIM13.pdf. 63 Ibid. 64 State of New Jersey Department of Education, “Common Core State Standards (CCSS),” accessed May 30, 2014, http://www.state.nj.us/education/sca/ccss/. 65 Common Core State Standards Initiative, “Development Process | Common Core State Standards Initiative,” accessed May 30, 2014, http://www.corestandards.org/about‐the‐standards/development‐process/. 66 Common Core State Standards Initiative, “Development Process | Common Core State Standards Initiative.”

TOGETHER North Jersey Fair Housing & Equity in Northern New Jersey
7-2
Education is critical for state competitiveness as well as for personal growth and workforce readiness. It has been argued that job shortages and skilled labor shortages are attributable, in part, to shortcomings in education and training.67 Employers and school administrators disagree significantly on the quality of an American education.68 Reading proficiency and STEM (Science Technology Engineering and Math) skills are the basis of educational competitiveness.69
The NJASK examinations are a measure of student achievement in English language proficiency, mathematics, and science. The test is given to students from the 3rd through 8th grades. In the North Jersey TNJ region, 63.5% of all 5th Grade students tested at the proficient or advance proficient levels for school reading proficiency. Figure 7‐1 illustrates the spatial distribution of School Reading Proficiency measured as the percentage of all students that tested at the proficient or advanced proficient level in reading in the 5th Grade by school district. Using this threshold level of 63.5%, and then assessing this spatial distribution, it can be seen that only 45 percent of the TNJ region’s population lived in places where students performed at grade level for reading proficiency.
Reading proficiency is an important determinant of future success, but there are significant disparities in how various school districts perform in achieving this all important standard. As illustrated in Exhibit 7‐2, only 22 percent of the residents living in the region’s communities of concern also lived in places where students read at grade level. In contrast, 72 percent of the TNJ region’s population who did not live in communities of concern also lived in communities that met or exceeded the threshold for reading proficiency or advanced proficiency. These significant disparities are even more pronounced when we consider the places with high‐concentrations of low‐income and minority populations.
Underperforming school districts reflect, in part, the spatial segregation of minority and low‐income children from more affluent communities and school districts.70 While much of the concentrated underperformance within the TNJ has already been addressed in the Abbott decisions by the New Jersey Supreme Court, New Jersey’s legal obligation to provide for a greater racial balance in its schools has not been effectively enforced or implemented. The majority of minority students attend highly segregated schools as noted by Trachtenberg, Orfield, and Flaxman’s research. These schools are heavily urban, high‐minority and low‐income ‐‐ disproportionately concentrated within the TNJ region ‐‐ and chronically underperform within the state. The communities of concern evaluation shown here confirm the extraordinary disparities of this highly segregated arrangement.
67 McKinsey & Company, “Tackling Youth Unemployment,” McKinsey on Society, accessed May 30, 2014, http://mckinseyonsociety.com/education‐to‐employment/. 68Ibid. 69 “2011 Skills Gap Report ‐ The Manufacturing Institute,” accessed May 30, 2014, http://www.themanufacturinginstitute.org/Research/Skills‐Gap‐in‐Manufacturing/2011‐Skills‐Gap‐Report/2011‐Skills‐Gap‐Report.aspx.
70 New Jersey’s Apartheid and Intensely Segregated Urban Schools: Powerful Evidence of an Inefficient and Unconstitutional State Education System, October 2013. Retrieved from: http://ielp.rutgers.edu/docs/IELP%20final%20report%20on%20apartheid%20schools%20101013.pdf

TOGETHER North Jersey Fair Housing & Equity in Northern New Jersey
7-3
Figure 7‐1: School Reading Proficiency (Grade 5)

TOGETHER North Jersey Fair Housing & Equity in Northern New Jersey
7-4
Figure 7‐2: Evaluation: School Reading Proficiency
High School Graduation Rate 7.2.2
High School Graduation Rates are an important metric because they define students’ opportunities to attend college. Communities with low high school graduation rates have also generally lagged behind in rates of college attendance and graduation. Nonetheless, it is well‐documented that college degrees are increasingly required for employment in well‐paying sectors of the economy and in most of the faster growing industries. These jobs tend to have higher median wages.
High School Graduation Rates are derived by dividing the number of graduating high school seniors by the number of incoming freshmen four years prior:71 72
71 The final count of graduating seniors automatically reflects student transfers into and out of school along with any adjustments for students excluded from the count for special circumstances. Special circumstances include deaths and migration out of the state or country. The original count of incoming freshmen must also be updated to account for these student movements. Further information can be found at: http://www.state.nj.us/education/data/grate/info.htm.
72 This methodology for high school graduation rates was adopted by the NJ Department of Education in 2011. The rate was developed by the National Governor’s Association and is supported by the U.S. Department of Education. Earlier methods inflated graduation rates by failing to account for the cohort impacts of student’s movements into and out of the school system.

TOGETHER North Jersey Fair Housing & Equity in Northern New Jersey
7-5
Figure 7‐3: High School Graduation Rate

TOGETHER North Jersey Fair Housing & Equity in Northern New Jersey
7-6
The TNJ region’s average graduation rate for school districts across the TNJ region was 90.8% in 2011. More than one‐half (54%) of TNJ residents live in places whose school districts fell below this threshold graduation rate for the region.
As shown in Figure 7‐3, high school graduation rates differ significantly across the TNJ region. People living in communities of concern have only a 22% chance of living in a place that meets or exceeds the threshold rate for high school graduation, compared to a 46% chance for the region’s population overall. Those who do not live in communities of concern are on the opposite end of this achievement gap. Fully three‐quarters of the population that do not live in communities of concern reside where the graduation rate met or exceeded the threshold rate of 90.8 percent (see Figure 7‐4).
Figure 7‐4: Evaluation: High School Graduation Rate
Learning Environment Offenses 7.2.3
Violence, vandalism, illegal substances, and harassment deeply affect the overall quality of the learning environment for students and teachers. School climate evaluations, as noted by the National Center for Safe Supportive Learning Environments, assess three key components of the academic experience: 1) engagement through relationships with teachers, students, and families; 2) safety in the schools, where students are emotionally safe from harassment, physically safe from violence, and where access to controlled substances has been removed from the learning environment; and 3) facilities and support services are sufficiently comprehensive to meet the needs of students, teachers, and administrators. It has been shown that safe and supportive school climates reduce student dropout rates. The school environment also affects the quality of student’s performance on standardized tests.
The Electronic Violence and Vandalism Reporting System (EVVRS) is a self‐reporting system of incidents by the state of New Jersey’s School Districts. Under EVVRS, school districts report violence and

TOGETHER North Jersey Fair Housing & Equity in Northern New Jersey
7-7
vandalism incidents, as defined by the Public School Safety Law, and, more recently, Harassment, Intimidation, and Bullying (HIB) incidents as defined by the Anti‐Bullying Bill of Rights (ABR).73
Figure 7‐5 shows the map for Weapons Offenses per 1000 students across the TNJ region. Higher rates of offenses are generally found in the urban core around Newark, Jersey City, Elizabeth, and Paterson. However, the highest rates of student weapons offenses were found in the northwest section of Warren County. Low reading proficiency and low graduation rates were commonly associated with the schools and school districts with very high weapons offenses. Outside of these two heavily urban and more rural areas, there was no distinct pattern of student weapons offenses.
Vandalism Offenses per 1000 students are shown on the regional map in Figure 7‐6. While vandalism is found in the urban core of the region, municipalities with high rates of student vandalism are widely and fairly evenly distributed across the region. Every county in the TNJ has a significant number of above average municipalities for student vandalism.
The disparity analysis of learning environment weapons offenses, as depicted in Figure 7‐7, shows that 75% of low income residents also live in communities where student weapons offenses are above average for the region. By comparison, for residents who do not live in communities of concern, 35% of the population lived in places with high numbers of weapons offenses by students. Generally, 48% of the TNJ’s residents lived in places where students experience above average weapons offenses at school.
Vandalism disparity exhibits generally similar patterns, although less pronounced than the data for weapons (see Figure 7‐8). Persons living in low‐income communities have the highest likelihood of attending schools with higher rates of vandalism.
While not shown here, Substance Abuse and Harassment Intimidation and Bullying (HIB) indicators were spatially dispersed. These indicators tended to impact a larger percentage of non‐COC areas on average but were also present in close to a third of areas populated with COC residents.74
73 New Jersey State Board of Education, Commissioner’s Annual Report to the Education Committees of the Senate and General Assembly on Violence, Vandalism and Substance Abuse in New Jersey Public Schools, December 2013, http://www.state.nj.us/education/schools/vandv/1213/vandv.pdf.
74 It is important to exercise caution in the interpretation of the learning environment offenses data set and consider the methods and quality of data collection for this indicator. The data is based on self‐reporting and there may be an absence of precision in the reportable categories. For example, the grouping of firearms with airguns and imitation guns means that a district with large numbers of firearms offenses can be equated to areas with large numbers of air gun or imitation gun offenses. HIB and other learning environment definitions are more uniform but are also susceptible to differences in administration and interpretation as well.

TOGETHER North Jersey Fair Housing & Equity in Northern New Jersey
7-8
Figure 7‐5: Weapons Offenses per 1000 Students

TOGETHER North Jersey Fair Housing & Equity in Northern New Jersey
7-9
Figure 7‐6: Vandalism Offenses per 1000 Students

TOGETHER North Jersey Fair Housing & Equity in Northern New Jersey
7-10
Figure 7‐7: Evaluation: Weapons Offenses per 1000 Students
Figure 7‐8: Evaluation: Vandalism Offenses per 1000 Students
35%
67%
34%
75%
30%
63%
TNJ Region = 48%TNJ Region = 48%
0%
10%
20%
30%
40%
50%
60%
70%
80%
90%
100%
Non-High MinorityCommunities
High MinorityCommunities
Non-Low IncomeCommunities
Low IncomeCommunities
Non-Communitiesof Concern
Communities ofConcern
Population of Communities Where the Rate of Learning Environment Weapons Offenses Was Above the Regional Threshold, 2010
28% 37% 27%41%
26% 36%TNJ Region = 32%
0%10%20%30%40%50%60%70%80%90%
100%
Non-High MinorityCommunities
High MinorityCommunities
Non-Low IncomeCommunities
Low IncomeCommunities
Non-Communitiesof Concern
Communities ofConcern
Population of Communities Where the Rate of Learning Environment Vandalism Offenses Was Above the Regional Threshold, 2010

TOGETHER North Jersey Fair Housing & Equity in Northern New Jersey
7-11
7.3 Poverty
Percent of Students Receiving Free & Reduced Price Meals 7.3.1
The National School Lunch Act was passed in 1946 to use surplus agricultural commodities as a source of nutrition for American students.75 The current National School Lunch Program is administered by the U.S. Department of Agriculture’s Food and Nutrition Service at the federal level while State Departments of Education and or Agriculture usually administer the programs locally.76 In New Jersey, the Department of Agriculture administers the School Nutrition Program (SNP).77
Every school lunch provided by the states is subsidized by the federal government. States must meet federal nutritional guidelines to receive subsidies and eligible students must be provided with free and reduced price lunches. Students from families earning over 185% of the poverty level must pay full price for their school lunches. Students from families earning less than 130% of the federal poverty level (i.e., $30,615 for a family of four in 2013) are given free lunches.78 The Percent of Pupils Receiving Free and Reduced Price Lunch is an indicator of poverty in a community and, particularly, its prevalence among children attending schools. It also serves as a reminder of the additional burden hunger can present for children from impoverished families as they strive for favorable educational outcomes.
There are clear pockets of poverty around the TNJ region where anywhere from 58% to 87% of students in the community are receiving free or reduced priced lunches. Figure 7.9 shows areas of Newark, Jersey City, Paterson, Hackensack, and New Brunswick where students receiving their lunch for free comprise significantly greater than one‐half the student populace. There are also pockets of school lunch assistance in Freetown’s Borough in Monmouth, Morris Township in Morris County, and in parts of Ocean County. In addition to the areas where the majority of students are not paying full price, the areas where over 30% of students area receiving lunch assistance accounts for most of the urban core of the TNJ including large sections of Union, Essex, Passaic, Bergen counties and the regions of Middlesex and Somerset counties near New Brunswick.
Outside the urban core and the more densely populated areas of the region, a large segment of the suburban communities have less than 30% of their students on lunch assistance with a large proportion having less than 7% of their students on lunch assistance (see Figure 7.9).
75 Gordon Gunderson, “National School Lunch Program: Background and Development,” USDA Food and Nutrition Service (FNS), January 24, 2014, http://www.fns.usda.gov/nslp/history.
76 US Department of Agriculture, Food Nutrition Service, “National School Lunch Program” (US Department of Agriculture, Food Nutrition Service, September 2013), http://www.fns.usda.gov/sites/default/files/NSLPFactSheet.pdf.
77State of New Jersey Department of Agriculture, “Department of Agriculture | National School Lunch Program,” accessed June 2, 2014, http://www.nj.gov/agriculture/divisions/fn/childadult/school_lunch.html.
78 Ibid.

TOGETHER North Jersey Fair Housing & Equity in Northern New Jersey
7-12
Figure 7‐9: Percent of Pupils Receiving Free and Reduced Price Meals

TOGETHER North Jersey Fair Housing & Equity in Northern New Jersey
7-13
Places with high concentrations of minority populations, low‐income populations or that meet the other disadvantaged criteria – that is, communities of concern, were consistently the same areas where there was a higher than average percentage of students receiving free and reduced price school lunches (FARM). Thus, people living in low‐income communities have a 86% chance of living in a place with an above‐average percent of students receiving FARM, compared to a 41% chance for the region’s population overall. Outside the at‐risk communities in the region there were far fewer communities where students received FARM assistance. For example, only 15% of the population living in a non‐high minority community, lived in a place with higher than average percentages of FARM (see Figure 7.10).
Figure 7‐10: Evaluation: Free and Reduced Price Lunches (FARM)
Percent of Households Receiving Public Assistance Income 7.3.2
According to the U.S. Census Bureau, “Public Welfare” is “Government assistance to needy persons contingent upon their need.”79 Public Welfare addresses all aspects of public assistance including direct cash payments such as Temporary Assistance for Needy Families (TANF) and General Assistance (GA) such as disability benefits for community members who are not employable.80 Public Welfare also includes vendor payments such as the Supplemental Nutritional Assistance Program (SNAP) also known as “food stamps” along with all additional services provided by governments in support of those in need.81
79 United States Census Bureau, “Census Glossary ‘Public Welfare,’” Census Glossary, accessed June 4, 2014, http://www.census.gov/glossary/#term_Publicwelfare.
80 Liz Schott and Clare Cho, General Assistance Programs: Safety Net Weakening Despite Increased Need, December 19, 2011, http://www.cbpp.org/cms/?fa=view&id=3603.
81 United States Census Bureau, “Census Glossary ‘Public Welfare.’”

TOGETHER North Jersey Fair Housing & Equity in Northern New Jersey
7-14
Public Welfare as described above and Public Assistance Income differ significantly. Public Assistance Income excludes SNAP payments for the public and also excludes several other types of cash and non‐cash assistance such as Supplemental Security Income (SSI) for the elderly.82 The New Jersey Department of Human Services administers the provision of public assistance income to needy families and individuals in New Jersey. Work First New Jersey is the state’s TANF program. Supportive Assistance to Individuals and Families (SAIF) is the state’s General Assistance program. New Jersey is one of a decreasing number of states that provides General Assistance.83 Not surprisingly, Public Assistance Income is widely distributed across the region.
Public assistance income recipients are often among the most vulnerable populations within the region. TANF and other public assistance income recipients may be among the most “Hard to Employ”.84 In addition to the traditional challenges facing job seekers, they must also confront other issues such as the lack of a high school diploma, the debilitating effects of long‐duration unemployment, children in need of special assistance, poor physical or mental health, and prior incarceration. In each case, in addition to state’s general efforts to assist residents in need of TANF support, special programs and funding are needed to address the needs of the harder to employ. If unattended, other social costs are likely to be borne by the region and particularly in the places of low opportunity.
Newark, Paterson and Phillipsburg of Warren County were among the places with the highest Percent of Households Receiving Public Assistance Income – that is, places with over 5.6% of households receiving public assistance income. In contrast to the FARM maps, however, the spatial patterns of public assistance income in Northern New Jersey are more dispersed as shown in Figure 7.5. Several communities have between 2.0% and 5.5% of their households in receipt of public assistance income. Hunterdon and Somerset showed very few or nearly no communities where the number of households receiving public assistance exceeded 2.0%.
Just under one‐third of the region’s population lives in places that exceed the regional threshold of 2 percent of all households in receipt of public assistance income. The effects of the dispersion of public assistance income, to some extent, can be seen in the disparity analysis presented in Figure 7.12. “Only” 65% of the population living in “low‐income communities” also lived in places that were above threshold for public assistance. Thus, some 35% the people living in low‐income communities did not live in areas with above average public assistance income. Similarly, some 48% of persons living in high minority population communities did not live in areas with higher than average public assistance levels. Across all non‐at risk communities, on average, 15% of their population was also living in an area that was above average for the receipt of public assistance.
82 US Census Bureau, “Public Assistance Receipt in the Past 12 Months for Households: 2008 and 2009,” United States Census Bureau Library Publications, accessed June 4, 2014, http://www.census.gov/library/publications/2010/acs/acsbr09‐13.html.
83 Ibid.
84 Dan Bloom, “TANF Recipients with Barriers to Employment,” Text, (May 14, 2012), http://www.urban.org/publications/412567.html.

TOGETHER North Jersey Fair Housing & Equity in Northern New Jersey
7-15
Figure 7‐11: Percent of Households receiving Public Assistance Income

TOGETHER North Jersey Fair Housing & Equity in Northern New Jersey
7-16
Figure 7‐12: Evaluation: Public Assistance Income
7.4 Economic Health
Change in Private Sector Jobs, 1990‐2010 7.4.1
Private Sector Jobs or Non‐Farm Employment is a measure of employment that excludes government employees, agricultural workers, private household employees, and non‐profit workers.85 From 1990 to 2010, the TNJ region generated a small net increase of 37,704 private sector jobs. This increase masks widely different patterns experienced in net job growth and loss of individual counties across the TNJ region. The region’s net job growth was small because there was an almost perfect balance between the total number of jobs lost and gained in the best and worst performing counties of Northern New Jersey (see Figure 7‐13).
85 Bureau of Labor Statistics, “CES Frequently Asked Questions: Employment Concepts,” Current Employment Statistics Frequently Asked Questions ‐ CES (National), February 11, 2014, http://www.bls.gov/ces/cesfaq.htm#qc2.

TOGETHER North Jersey Fair Housing & Equity in Northern New Jersey
7-17
Figure 7‐13: Private Sector Job Growth by County, 1990 ‐ 2010
The three worst job‐performing counties ‐‐ Essex, Union, and Passaic ‐‐ have lost almost 100,000 private sector jobs over the last twenty years. While relatively close to New York City, these counties each contain one of New Jersey’s older industrial cities (Newark, Elizabeth and Paterson). Conversely, the counties on the TNJ region’s periphery have experienced significant job growth. The top three counties for private sector job growth are more suburban and include Somerset, Ocean, and Monmouth counties. They have an average increase of 32,000 private sector jobs over the past twenty years with a total gain of approximately 106,000 jobs for the three counties.
Population growth for the best and worst performing counties shows that the three lowest performers had an average population increase of 7% while the top performers had a population increase of 27%. In spite of the difference in population growth the difference in private sector job creation meant that the ratio of new jobs to new residents was still much lower in the job creating counties.
Beginning with the TNJ’s best performers, Monmouth County’s private sector job growth was 35,201. Its population growth was 77,254. This meant that for each new private sector job, Monmouth County added only 2.1 people to its population over the last 20 years. Ocean and Somerset counties added 4.3 and 2.9 people to their populations respectively for each new private sector job. 86
The region’s worst performers had the opposite experience. Essex County was by far the worst performer with respect to private sector job growth. It lost 51,523 jobs while its population grew by only 11,359 residents. Essex County lost 4.5 jobs for each new resident of the county. Union and Passaic Counties, also among the worst performers for job growth, lost 1.8 and 2.1 jobs for each new resident in the county from 1990 to 2010.
86 “Local Area Unemployment Statistics Home Page,” accessed June 11, 2014, http://www.bls.gov/lau/.
37,704
35,201
33,044
28,576
28,449
23,389
7,361
6,083
1,153
(7,586)
(19,125)
(23,370)
(23,948)
(51,523)
REGION
Monmouth
Ocean
Somerset
Morris
Middlesex
Hunterdon
Sussex
Warren
Hudson
Bergen
Passaic
Union
Essex

TOGETHER North Jersey Fair Housing & Equity in Northern New Jersey
7-18
Private sector job growth is important because it has a direct bearing on the rate of unemployment when viewed in the context of population growth. Private sector job growth in the periphery of the TNJ region is important because it influences the accessibility to employment.87 As noted by David Troutt, “Place is where opportunity in principle happens in practice.”88 Suburban employment means less access for both urban and suburban residents.89 Job growth dispersed to the periphery of the TNJ region is also important because it has significant implications for infrastructure requirements and the sustainability of critical public services.90
The better job‐growth performing counties also tend to exhibit lower unemployment rates. In fact, in February of 2010, just before the official date of the Census data being used, the top three counties for private sector job growth had an average unemployment rate of 9.8% while lower performers had unemployment rates of 11.43%. This was a 1.63% difference in the rate of unemployment. The gap has widened to 2.37% based on the most recent BLS data for 2013.91
The TNJ region’s Communities of Concern are found in every county. However, they are most heavily concentrated in the worst performing counties for private sector job growth. These include Essex, Union, and Passaic counties, along with Hudson and Bergen Counties. Figure 7‐14 illustrates the uneven pattern of job growth in the TNJ region and illustrates places with a net loss or net gain in Private Sector Jobs. As noted earlier, net job loss can be found across the region, but is concentrated in urban communities.
Figure 7‐15 specifically examines the disparity in places of job growth. Fifty‐one percent of the region’s population lived in communities that experienced a net gain of jobs. Forty‐nine percent of the region’s population lived in communities that experienced a net loss of jobs. This reflects the general balance between regions that are creating and those that are losing private sector jobs.
Between 1990 and 2010, job growth concentrated in areas generally low in minorities and low‐income populations. In fact, only about 40 percent of the people living in the region’s Communities of Concern were also living in places with above average job growth; this also means that 60% of people in communities of concern were also living in areas that experienced a net loss of jobs from 1990 to 2010. Similarly, only one‐third of persons living in low‐income communities were living in places with private sector job growth during the last 20 years; some two‐thirds of the TNJ’s low‐income residents did not live where jobs were being created. By contrast, close to two‐thirds of non‐community of concern residents lived in communities with job growth.
87 William J. Wilson, When Work Disappears: The World of the New Urban Poor, 1st ed (New York: Knopf : Distributed by Random House, Inc, 1996). 88 David Dante Troutt, The Price Of Paradise: The Costs Of Inequality And A Vision For A More Equitable America (New York: New York University Press, 2013)., P. 15 89 Susan Hanson and Genevieve Giuliano, eds., The Geography Of Urban Transportation, 3rd ed (New York: The Guilford Press, 2004). 90 Ibid. 91 Bureau of Labor Statistics, “Map: Local Area Unemployment Statistics,” accessed May 30, 2014, http://data.bls.gov/map/MapToolServlet?survey=la&map=county&seasonal=u.

TOGETHER North Jersey Fair Housing & Equity in Northern New Jersey
7-19
Figure 7‐14: Change in Private Sector Jobs by Municipality, 1990‐2010

TOGETHER North Jersey Fair Housing & Equity in Northern New Jersey
7-20
Figure 7‐15: Evaluation: Private Sector Job Growth
For those living in “carless households”, the implications of these job growth patterns are particularly challenging. Research by Berube, Deacon and Raphael make clear that carless households are disproportionately low income and minority in most communities.92 The segregation of minorities into distinct neighborhoods has compounded the impacts of being carless as these residents and their neighbors are without access to a vehicle. 93
Percent of Persons with Bachelor’s or Higher 7.4.2
The Percent of Person’s with a Bachelor’s Degree or Higher for all TNJ residents Age 25 and up measures post‐secondary educational attainment in the region’s working age population. Holders of Bachelor’s degrees are estimated to have one million dollars more in earnings over the course of their lives.94 College‐educated Americans also have better rates of employment.95 The employment rate (i.e., employment to population ratio) for people with a Bachelor’s degree was 70.1% in 2010 and was 79.5% for holders of an advanced degree,96 but only 55% for high school graduates. The lack of college
92 Alan Berube, Elizabeth Deakin, and Steven Raphael, “Socioeconomic Differences in Household Automobile Ownership Rates: Implications for Evacuation Policy,” in Risking House and Home: Disasters, Cities, Public Policy (Berkeley Public Policy Press), accessed May 30, 2014, http://urbanpolicy.berkeley.edu/pdf/Ch10_Berube_Deakin_Raphael.pdf.
93 Ibid.
94 Tiffany Julian, Work‐Life Earnings by Field of Degree and Occupation for People With a Bachelor’s Degree: 2011, American Community Survey Briefs (United States Census Bureau, October 2012), http://www.census.gov/prod/2012pubs/acsbr11‐04.pdf. 95 Thomas Luke Spreen, “Recent College Graduates in the US Labor Force: Data from the Current Population Survey,” Monthly Labor Review, no. February 2013 (February 2013), http://www.bls.gov/opub/mlr/2013/02/art1full.pdf. 96 Ibid.

TOGETHER North Jersey Fair Housing & Equity in Northern New Jersey
7-21
educated employees with skills in science technology, engineering, and math has been listed by CEOs as one of their primary hiring concerns.97
Thirty‐six percent of all adults 25 years and older have at least a Bachelor’s degree in Northern New Jersey, but there are significant differences in their residential locations. Within the TNJ region, 45% of all TNJ residents live in areas where the overall population has met this level of educational attainment. For residents who do not live in communities of concern, two‐thirds of residents live in places with meet or exceed the regional average of those with Bachelor’s Degrees. Persons living in these areas, therefore, live mostly amongst persons with the formal levels of education to meet the demands of the current labor market. The same cannot be said for those living in communities of concern. Only 28% of residents who live in communities of concern also live in places with a higher prevalence of persons with Bachelor’s Degrees. Ultimately, 72% of the residents of communities of concern live in areas where 64% or more of their neighbors have less than a college education (see Figures 7.16 and 7.17).
This isolation is even worse for those living in “low‐income” communities. About nine out of ten low income community residents lived where the percentage of educated neighbors was below average for the TNJ region or, stated alternatively, where close to two‐thirds of adults do not have a college education.
97 “2011 Skills Gap Report ‐ The Manufacturing Institute.”

TOGETHER North Jersey Fair Housing & Equity in Northern New Jersey
7-22
Figure 7‐16: Percent of Persons with a Bachelor's or Higher

TOGETHER North Jersey Fair Housing & Equity in Northern New Jersey
7-23
Figure 7‐17: Evaluation: Percent of Population with Bachelor's or Higher
7.5 Municipal Fiscal Health
Median Family Income, 2010 7.5.1
The Householder of a family is the person, or one of the people, in whose name a home is owned and who is also listed on the census survey. Family Earnings are a sum of the income earned by all members in the house that are at least 15 years old and also related to the householder. Within a community the family income level that splits the range of income levels in half is referred to as the Median Family Income. A family earning the median family income should understand that fifty percent of the family income levels in the community are above their own and also that fifty percent of the community has incomes below their family’s income.9899
98 United States Census Bureau, “American Community Survey and Puerto Rico Community Survey 2010 Subject Definitions” (United States Census Bureau, 2010), http://www.census.gov/acs/www/Downloads/data_documentation/SubjectDefinitions/2010_ACSSubjectDefinitions.pdf. 99 Family income and household income are not the same. Family income is higher and excludes all single and living alone households, known as non‐family households. New Jersey and other East Coast Median Household and Family Incomes tend to be among the highest in the country.

TOGETHER North Jersey Fair Housing & Equity in Northern New Jersey
7-24
Table 7‐1: Percentile Rankings of Municipalities on Median Family Income, 2010
Percentile Rank
Municipality County Median FamilyIncome
Ratio to Median
Pct. of Population living in Communities of Concern
95% Chatham Borough Morris $ 164,805 1.65 0.0%
80% Bethlehem Township Hunterdon $ 130,580 1.31 0.0%
50% Monroe Township Middlesex $ 99,727 1.00 11.5%
20% Neptune Township Monmouth $ 74,422 0.75 77.3%
5% Fairview Borough Bergen $ 53,285 0.53 100.0%
Source: U.S. Census Bureau, 2006‐2010 American Community Survey Ratio 95% to 5% = 3.1 Ratio 80% to 20% = 1.8
Median family income is important because it provides a snapshot of the relative prosperity of a community in comparison to other communities. It is one of the more consistently used measures of the relative wellbeing of a community. The difference in median family incomes between the richest municipalities (Chatham, 95th percentile) and poorest municipalities (Fairview, 5th percentile) is 3.1, indicating three times as much disposable income (at the median) – the gap between the richest and poorest households within these jurisdictions would be significantly greater (see Table 7‐1).
Median family income is somewhat correlated with the strength of the tax base of a community. High median family incomes tend to be located in places with larger tax bases on which public service costs and debt service costs can be spread. Finally, a high median family income often means that there are a smaller percentage of families in the community at lower income.
Figures 7‐18 illustrates the spatial patterns of median family income within the 13 counties in the TNJ region. As shown in Figure 7‐19, only 18% of people living in Communities of Concern also live in places that meet or exceed the regional threshold for Median Family Income ($99,631) compared to 40% of people region‐wide. Not surprisingly, with respect to low income communities, only 7% of the residents in low‐income communities also found themselves in areas that were above threshold for median income. Sixteen percent of high minority residents lived where the median income was above the threshold level of $99,631.
By comparison, in places that were not communities of concern, 67% of the residents also lived in places where median incomes were above the regional average. Only 33% of non‐community of concern residents lived where median incomes were below the threshold.
New Jersey’s incomes were among the highest in the nation. In 2010, New Jersey’s median household income was $71,637 while the U.S. median household income was $53,046. Therefore, the most important point about the character of the income gap in the TNJ region is that even with state median incomes that were ranked second in the nation, almost 70% of non‐community of concern residents lived in communities where the median income equaled or exceeded the regional median income of $99,631.

TOGETHER North Jersey Fair Housing & Equity in Northern New Jersey
7-25
Figure 7‐18: Median Family Income

TOGETHER North Jersey Fair Housing & Equity in Northern New Jersey
7-26
Figure 7‐19: Evaluation: Median Family Income
Tax Base per Capita 7.5.2
While income taxes are paid to the state and federal governments, the local government taxing power in New Jersey primarily resides in the ability to tax real property. These taxes are used by cities to pay for public services such as police, fire, public works and code enforcement, as well as debt service and pension expenses. The aggregate assessed value of all the properties in a community or city is its municipal tax base. Dividing the tax base by the population of a municipality such as a city or town provides the Municipal Tax Base Per Capita.
Table 7‐2 examines the variation in tax base per capita for select municipalities across the TNJ region by percentile rankings of tax base capita at the 90th, 80th, 50th, 20th and 5th percentile levels. The Table suggests the inverse relationship of the tax base per capita to the percentage of the population living in communities of concern. As shown in the table, Harding Township and Sussex Borough were located in the top and bottom 5% of municipalities in the TNJ using tax base per capita as a measure. The tax base per capita in Harding Township was $661,184 and the tax base per capita in Sussex Borough was $67,791. Harding Township had 0% of its population living in communities of concern while Sussex Borough had 100% of its population living in communities of concern.

TOGETHER North Jersey Fair Housing & Equity in Northern New Jersey
7-27
Table 7‐2: Tax Base per Capita, Select Municipalities 2011
Percentile Rank
Municipality County Tax Base per Capita
Ratio to Median
Pct. of Population living in Communities of Concern
95% Harding Township Morris $ 661,184 4.21 0.0%
80% Bernards Township Somerset $ 256,688 1.64 14.5%
50% Brick Township Ocean $ 157,386 1.00 22.9%
20% South Amboy City Middlesex $ 106,823 0.68 100.0%
5% Sussex Borough Sussex $ 67,791 0.43 100.0%
Source: New Jersey Department of Community Affairs Ratio 95% to 5% = 9.8 Ratio 80% to 20% = 2.4
At the median, Brick Township, which is located in Ocean County, had a tax base per capita of $157,386, but only 22.9% of its population resided in communities of concern. The geographic distribution of municipalities based on their threshold median tax base per capita is shown in Figure 7‐20.100 The spatial patterns look remarkably similar ‐‐ and suggest the strong linkages with ‐‐ educational attainment and higher median family income previously shown.
Figure 7‐21 illustrates that the TNJ region’s population was more heavily concentrated in municipalities with a lower tax base per capita (i.e., below the median of $157,386). This analysis shows that only 16% of people in Communities of Concern live in places that meet or exceed the regional threshold for Tax Base per Capita ($157,069) compared to 36% of people region‐wide. Thus, overall, 64% of the TNJ region’s population lived in communities below this median level with less of a tax base to address community services.
100 The disproportionately large tax base per capita figure on the map of $6,179,606 is Teterboro, New Jersey which is the location of Teterboro Airport, but where less than 100 families reside.

TOGETHER North Jersey Fair Housing & Equity in Northern New Jersey
7-28
Figure 7‐20: Spatial Distribution of Tax Base per Capita, TNJ Region, 2011

TOGETHER North Jersey Fair Housing & Equity in Northern New Jersey
7-29
Figure 7‐21: Evaluation: Tax Base per Capita
7.6 Housing & Housing Affordability
Occupied Housing Units 7.6.1
According to the U.S. Census Bureau, a housing unit is counted as an occupied housing unit if it is the usual place of residence of the person or group of people living in that housing unit at the time of their being counted by the decennial census or other census survey. Occupancy estimates provide information on where people reside and also provides data on vacancy in a community and where it is located.101
In the TNJ region, higher percentages of owner‐occupied 102 housing units were generally found outside the urban core while renter‐occupied housing units were located closer to the urban core and nearer to transportation infrastructure, specifically, major roads and NJ TRANSIT rail stations.
Percent Owner‐Occupied Housing Units 7.6.1.1
Homeownership provides community members with financial gains, tax benefits, borrowing power, and wealth creation. Home ownership rates help policymakers understand both the economic and social well‐being of a community. As an indicator, home ownership is used at all levels of government and
101 United States Census Bureau, “Census Glossary ‘Occupied Housing Unit,’” Census Glossary, accessed June 2, 2014, http://www.census.gov/glossary/#term_Occupiedhousingunit.
102 When the owner or co‐owner of a housing unit lives in that housing unit, even if it is mortgaged and not fully paid for, the unit is counted as an Owner Occupied Housing Unit by the U.S. Census.

TOGETHER North Jersey Fair Housing & Equity in Northern New Jersey
7-30
across financial markets to understand individual’s expectations about the future. The Joint Center for Housing Studies explained this relationship by stating that,
“The choice to own or rent at any point in time should be influenced by people’s expectations about the future of home prices, rents, and returns on potential other investments. In addition, changes in underwriting standards matter because credit constraints can thwart people’s ability to act on their interest in owning.”103
Research by the National Association of Realtors has found that there are positive social effects associated with higher rates of home ownership. For example, children’s educational achievement, civic participation, health outcomes, crime, public assistance, and willingness to engage in property maintenance all show strong correlations with home ownership.104
The rate of home ownership in the TNJ region averaged 63.3% across all community areas as reflected in Figure 7‐22. As noted above, areas with low occupancy rates have higher vacancy rates. There were pockets of high vacancy across the TNJ but the primary concentration of vacant housing units were found in the communities that include and surround Newark, Jersey City and Paterson. There was also a pocket of vacancy that extended across New Brunswick in Middlesex County.
Percent Renter‐Occupied Housing Units 7.6.1.1
All occupied units which are not owner occupied, whether they are rented for cash rent or occupied without payment of cash rent, are classified as Renter‐Occupied Housing Units by the U.S. Census
Bureau.105
High rental occupancy has resulted in low vacancies for rental across the country. At the end of 2010, the rental vacancy rate for northern New Jersey and the New York MSA was approximately
5.5%.106
This meant that 95% of the rental stock was in use. The highest rental occupancy rates were found in Newark and Paterson and in pockets around the region including Middlesex, Monmouth, and Ocean counties. There was also an apparent correlation between NJ TRANSIT rail stations and regions of high occupancy that was consistent across the TNJ. (see Figure 7‐23).
103 Eric Belsky, The Dream Lives On: The Future of Homeownership in America (Harvard University, Joint Center for Housing Studies, January 2013), http://jchs.harvard.edu/sites/jchs.harvard.edu/files/w13‐1_belsky_0.pdf.
104 National Association of Realtors’ Research Division, Social Benefits of Homeownership and Stable Housing, accessed May 30, 2014, http://www.realtor.org/sites/default/files/social‐benefits‐of‐stable‐housing‐2012‐04.pdf.
105 United States Census Bureau, “Census Glossary ‘Renter Occupied Housing Units,’” Census Glossary, accessed June 2, 2014, http://www.census.gov/glossary/#term_Renter‐occupiedhousingunit.
106US Department of Housing and Urban Development, “Glossary of HUD Terms | HUD USER ‘Affordable Housing,’” HUDUSER Glossary, accessed June 2, 2014, http://www.huduser.org/portal/glossary/glossary_a.html.

TOGETHER North Jersey Fair Housing & Equity in Northern New Jersey
7-31
Figure 7‐22: Percent Owner‐Occupied Housing Units

TOGETHER North Jersey Fair Housing & Equity in Northern New Jersey
7-32
Figure 7‐23: Percent Renter‐Occupied Housing Units

TOGETHER North Jersey Fair Housing & Equity in Northern New Jersey
7-33
Multifamily Units 7.6.2
Multifamily housing units are residential units that were constructed one on top of the other or side by side without common facilities.107
Percent of all Units 7.6.2.1
Figure 7‐24 depicts the percentage of all housing units that were multifamily units. Many single family units are rental units and not all multifamily units are rental apartments. Condominiums and homes with rental units are examples of multifamily units which may or may not be included in the count of rental units in a community. A large percentage of the multifamily unit housing stock is found in the higher density, central city communities such as Newark, Jersey City, Paterson, Elizabeth, and New Brunswick. There are also pockets with higher percentages of multifamily units located around the TNJ region, and in Ocean and Monmouth counties.
Percent of Owner‐Occupied Units 7.6.2.2
Owner‐occupied multifamily housing units include condominiums, attached homes and detached homes with additional residential units (See Figure 7‐25). There are very few communities in the TNJ region where owner‐occupied multifamily units make up over 60% of the total housing stock of the community. There was, however, a concentration of communities where multifamily ownership units made up from 30% to 60% of the housing stock. These communities were primarily located in Newark, Jersey City, Paterson, Elizabeth and Hackensack. However, in most of communities in the TNJ region, owner‐occupied multifamily units made up less than 14% of the total housing stock. In many communities it was simply nonexistent.
Percent of Renter‐Occupied Units 7.6.2.3
Renter‐occupied multifamily housing units constitute the core of the traditional rental stock of a community. These are rental units with several families residing within a single connected building.
Figure 7‐26 shows the distribution of these types of residences across the TNJ region. As shown on the map, in most of the region, rental multifamily housing units accounted for 22% or more of the housing stock. The distribution of these units was not purely concentrated in the urban core of the TNJ. Places with higher concentrations of renter‐occupied units were found both urban areas and communities adjacent to major roads and NJ TRANSIT Rail stations. Places with higher proportions of rental units near transportation infrastructure can be seen in Monmouth and Morris Counties and the outer periphery of Bergen County.
107 United States Census Bureau, “Census Glossary ‘Multifamily Housing,’” Census Glossary, accessed June 2, 2014, http://www.census.gov/glossary/#term_MultifamilyHousing.

TOGETHER North Jersey Fair Housing & Equity in Northern New Jersey
7-34
Figure 7‐24: Percent Multifamily Units

TOGETHER North Jersey Fair Housing & Equity in Northern New Jersey
7-35
Figure 7‐25: Percent Multifamily Owner‐Occupied Units

TOGETHER North Jersey Fair Housing & Equity in Northern New Jersey
7-36
Figure 7‐26: Percent Multifamily Renter‐Occupied Units

TOGETHER North Jersey Fair Housing & Equity in Northern New Jersey
7-37
Housing Affordability 7.6.3
The U.S. Department of Housing and Urban Development defines Affordable Housing as any housing unit where the homeowner or renter is paying no more than 30% of their income for all gross housing costs including utilities.108 Households paying more than 30% of their income for all gross housing costs are Cost Burdened.109 Households that pay more than 50% of their income in gross housing costs are referred to as Severely Cost Burdened.110
Owner Units Affordable to Households Earnings 80% or less of HAMFI per square mile 7.6.3.1
Affordability is based on individual and family incomes. HAMFI is the HUD Area Median Family Income used by the Department of Housing and Urban Development to administer its programs. This is the median income calculated for each HUD jurisdiction in the country and is used to determine both Fair Market Rents (FMR) and the eligibility income levels for HUD programs.111 Households earning 80% or less of their jurisdiction’s HAMFI are usually eligible for HUD assistance. The assistance assists families within the lower half of the income distribution secure affordable housing.
Figure 7‐27 shows the availability of affordable ownership units per square mile for a family that earned no more than 80% of the HAMFI. Across the TNJ region, there were 38.8 affordable housing ownership units available per square mile. However, the map shows that affordable homes were not commonly available throughout the region. Outside of the urban corridor running from Paterson and Hackensack south through Newark and ending in New Brunswick, there were few communities in the surrounding suburbs whose affordable housing provision was above the threshold level of availability.
Other than Ocean County, the counties with more affordable housing per square mile did not include the counties with significant private sector job growth. This personifies the possibility for spatial mismatch between housing affordability and employment opportunities across the TNJ.112 Whether due to housing prices, land use controls, housing discrimination, the targeted provision of public assistance, or the over‐concentration of communities that receive housing support, there are several reasons which all provide the basis for explaining the mismatch that is presently observed across the TNJ for various communities of concern.
108 US Department of Housing and Urban Development, “Glossary of HUD Terms | HUD USER ‘Affordable Housing,’” HUDUSER Glossary, accessed June 2, 2014, http://www.huduser.org/portal/glossary/glossary_a.html.
109 “Affordable Housing ‐ CPD ‐ HUD ‘Cost Burdened,’” U.S. Department of Planning and Urban Development, Community Planning and Development, accessed May 30, 2014, http://portal.hud.gov/hudportal/HUD?src=/program_offices/comm_planning/affordablehousing/.
110 Barry L. Steffen et al., Worst Case Housing Needs 2011: A Report to Congress, August 2013, http://www.huduser.org/portal/Publications/pdf/HUD‐506_WorstCase2011_reportv3.pdf.
111 “CHAS: Background | HUD USER ‐‐ Data and Definitions ‘HAMFI,’” Comprehensive Housing Affordability Strategy Background, accessed June 9, 2014, http://www.huduser.org/portal/datasets/cp/CHAS/bg_chas.html.
112 Keith Ihlanfeldt, “The Spatial Mismatch Between Jobs and Residential Locations Within Urban Areas,” Cityscapes 1, no. 1 (November 1993): 219–44, http://www.huduser.org/periodicals/cityscpe/vol1num1/ch11.pdf.

TOGETHER North Jersey Fair Housing & Equity in Northern New Jersey
7-38
Figure 7‐27: Ownership Units per Square Mile Affordable to Households Earning 80% or less of HAMFI

TOGETHER North Jersey Fair Housing & Equity in Northern New Jersey
7-39
Figure 7‐28 shows that affordable housing was found where communities of concern resided. As shown, 60% of the TNJ population lived in communities with an above threshold provision of affordable housing. Nearly 70% of the TNJ’s population lived in Essex, Hudson, Passaic, Bergen, and Union counties where affordable housing units were consistently located. Outside of these counties, affordable housing was consistently below the threshold. The spatial mismatch associated with the geographically targeted provision of all affordable units will be of critical importance to the future planning and public policies of the TNJ region.
People living in Communities of Concern have a 79% chance of living in a place with an above‐average density of affordable ownership units (38.8 housing units per square mile) compared to a 60% chance for the region’s population overall. The chances are even higher that a person will live in an area with higher densities of affordable housing if they live in high‐minority communities (82%) or in low‐income communities (85%)
Figure 7‐28: Evaluation: Affordable Ownership Units
Renter Units Affordable to Households Earnings 80% or less of HAMFI per square mile 7.6.3.2
Following the housing market downturn in 2008, a growing percentage of Americans decided to rent rather than own housing.113 The Survey of Market Absorption (SOMA) looks at the rental of new multi‐family housing units. According to SOMA, in 2010 90% of all new multifamily units in the U.S. were fully rented within a year of their completion114, and had risen to 94% of all new units by 2013. An increasing
113 Harvard University, Joint Center for Housing Studies, “America’s Rental Housing: Evolving Markets and Needs,” Joint Center for Housing Studies of Harvard University, December 9, 2013, http://www.jchs.harvard.edu/research/publications/americas‐rental‐housing‐evolving‐markets‐and‐needs, P. 1‐5.
114 United States Census Bureau, “Survey of Market Absorption: Third Quarter 2010,” Survey of Market Absorption of Apartments, Market Absorption of Apartments: Annual 2010 ‐ Absorptions, accessed June 2, 2014, https://www.census.gov/hhes/www/housing/soma/annual10/ann10txt.html.

TOGETHER North Jersey Fair Housing & Equity in Northern New Jersey
7-40
percentage of Americans have found it nearly impossible to secure rental housing.115 HUD provides assistance for renters whose low incomes make market rental difficult in such a competitive environment.
As shown in Figure 7‐28, the regional threshold for affordable rental units across the TNJ was 148.5 rental units per square mile. This average, however, masks significant distributional disparities across the region; an extensive proportion of the TNJ region provided less than 10.8 affordable rental units per square mile in 2010.116 Conversely, the communities with considerable provision of affordable rentals were primarily found in Newark, Jersey City, Paterson, and in small pockets throughout the urban corridor of the TNJ.
In the respective counties of Essex, Hudson, and Passaic which include Newark, Jersey City, and Paterson, 10 of the 31 Abbott v. Burke school districts can be found.117 A joint study by Rutgers and UCLA has concluded that New Jersey schools are more heavily segregated than their southern counterparts with New Jersey having one of the most segregated school systems in the country.118 The skewed distribution of affordable housing limits access to educational opportunity and hinders the readiness of the future workforce – certainly one of the most profound challenges affecting the region’s long‐term economic outlook.
The availability of affordable rental units strongly distinguishes city and suburbs as well as places with high concentrations of communities of concern populations from their non‐community of concern counterparts. As shown in Figure 7‐30, anywhere from 84% to 95% of persons living in these communities – that is communities of concern, high‐minority, or low‐income communities ‐‐ also lived where there was an above average provision of affordable rental units.
This is due, certainly, to the inadequate provision of affordable housing units in the neighboring periphery of the TNJ. However, it is also important to consider whether there is adequate provision of affordable housing even where it is already concentrated. Both aspects, the potential unmet need in already concentrated areas and the absence of any significant supply outside these urban areas, must be appreciated.
115 Shaila Dewan, “In Many Cities, Rent Is Rising Out of Reach of Middle Class,” The New York Times, April 14, 2014, http://www.nytimes.com/2014/04/15/business/more‐renters‐find‐30‐affordability‐ratio‐unattainable.html.
116 Southern Burlington County NAACP v. The Township of Mount Laurel, 67 N.J. 151 (The Supreme Court of New Jersey 1975).
117 Abbott v. Burke II, 119 N.J. 287 (The Supreme Court of New Jersey 1990).
118 Trachtenberg, Orfield, and Flaxman, New Jersey’s Apartheid and Intensely Segregated Urban Schools.

TOGETHER North Jersey Fair Housing & Equity in Northern New Jersey
7-41
Figure 7‐29: Rental Units per Square Mile Affordable to Households Earning 80% or less of HAMFI

TOGETHER North Jersey Fair Housing & Equity in Northern New Jersey
7-42
Figure 7‐30: Evaluation: Affordable Rental Units
Cost‐Burdened Owner‐Occupied Households per Square Mile 7.6.3.3
Cost‐burdened homeowners spend over 30% of their monthly income on housing expenses. This measure, Cost‐Burdened Owner‐Occupied Households per Square Mile, relates the community’s median income to the housing costs that residents experience. Many lower income families reside where housing is most affordable and often subsidized or supported with government‐backed mortgages and assistance. In spite of this, low‐income homeowners in subsidized and low‐cost affordable housing often remain cost burdened.119 After the 2008 housing crisis and recession, reduced incomes, heavily mortgaged families, and undervalued housing stock resulted in higher than usual percentages of cost burdened households.120 Cost Burden provides an important metric for the well‐being of a community that can be used by local, state, and federal policy makers in planning the development of the region.
The availability of affordable housing is a critical determinant of the distribution of the low‐income residents of the TNJ. More importantly, affordable housing determines not only where these families can live, but also the social, economic, cultural, educational, and even political opportunities for which they have access.121 The limited distribution of affordable housing also determines the cost of
119 Anne R. Williamson, “Can They Afford the Rent? Resident Cost Burden in Low Income Housing Tax Credit Developments,” Urban Affairs Review 47, no. 6 (November 1, 2011): 775–99, doi:10.1177/1078087411417078.
120 Harvard University, Joint Center for Housing Studies, “America’s Rental Housing: Evolving Markets and Needs,” Joint Center for Housing Studies of Harvard University, December 9, 2013, http://www.jchs.harvard.edu/research/publications/americas‐rental‐housing‐evolving‐markets‐and‐needs.
121 Rolf Pendall, “Driving to Opportunity: Understanding the Links among Transportation Access, Residential Outcomes, and Economic Opportunity for Housing Voucher Recipients,” Text, (March 31, 2014), http://www.urban.org/publications/413078.html.

TOGETHER North Jersey Fair Housing & Equity in Northern New Jersey
7-43
transportation experienced by low‐income families. In fact, many lower income families spend well over 50% of their income on housing and transportation. 122
Figure 7‐31 shows how cost‐burdened households were dispersed within the TNJ region. Ultimately nearly 50% of the TNJ region’s population was cost‐burdened.123 For renters, the rate of cost burden exceeded 50%.
Being cost burdened affected all parts of the TNJ region after the 2008 housing crisis. However, living in an area that was not high‐minority or low‐income meant that at least 30% or more of these people were living in places that were not cost‐burdened communities. In fact, for persons who do not live in low‐income communities, some 53% were living in places that were also not cost burdened areas of the TNJ region.
Conversely, the various community of concern populations almost always resided in areas that were cost burdened. For those living in high‐minority communities, only 8% of the population lived in areas that were not cost‐burdened. For those living in low‐income communities, the results were starker: only 2.93% also lived in areas that were not cost burdened. This meant that 97% of people living in a low‐income community were also living in a cost‐burdened community. Figure 7‐32 below examines where the non‐cost burdened households were likely located within the TNJ region.
122 Ibid.
123 The Corporation For Enterprise Development (CFED), “Housing Cost Burden ‐ Homeowners,” CFED Assets and Opportunity Scorecard, 2013, http://scorecard.assetsandopportunity.org/2013/measure/housing‐cost‐burden‐homeowners.

TOGETHER North Jersey Fair Housing & Equity in Northern New Jersey
7-44
Figure 7‐31: Cost‐Burdened Owner‐Occupied Households per square mile

TOGETHER North Jersey Fair Housing & Equity in Northern New Jersey
7-45
Figure 7‐32: Evaluation: Non ‐ Cost Burdened Owner ‐ Occupied Households
The geographic distribution of families is always a combination of personal choices along with personal restrictions experienced by those families. One of the primary characteristics of the TNJ was that large proportions of the population had little choice in where they lived. For these families, like all families, “affordability” is a key determinant of housing choice and deeply influences their access to opportunities. While the limits of housing and educational opportunities have been debated in cases such as Mount Laurel and Abbott, there appears to be a real need for a better understanding of how northern New Jersey has defined its sense of place and what that means for the region’s policies and populations.
Given the importance of cost burden on family quality of life, access and mobility, an evaluation was also provided on the distribution of cost burdened families that were residing in the presence of affordable home ownership options.
Figure 7‐41 examines the location of cost‐burdened communities which simultaneously had affordable housing available. As shown below, the majority of people who resided in an area characterized by one of the communities of concern also found themselves in places where the provision of affordable housing units was above average for the region. This reflected the density and restriction of affordable housing options to the urban core of the region. Fifty‐eight percent of the TNJ’s population lived in areas that were both cost burdened and also above average in the provision of affordable housing units. On average 80% of all people living in places that were not communities of concern areas were also located where the provision of affordable housing was above average. While remaining focused on cost burdened communities, moving to areas that were cost burdened but were communities of concern areas meant that on average only 41% of the population had above average access to affordable housing.
29.0%
8.2%
53.6%
2.9%
34.6%
8.7%
TNJ Region = 20%
0.00%10.00%20.00%30.00%40.00%50.00%60.00%70.00%80.00%90.00%
100.00%
Non-High MinorityCommunities
High MinorityCommunities
Non-Low IncomeCommunities
Low IncomeCommunities
Non-Communitiesof Concern
Communities ofConcern
Population Residing Where the Share of Non‐Cost Burdened Owner Households Equals or Exceeds the Regional Threshold, 2010
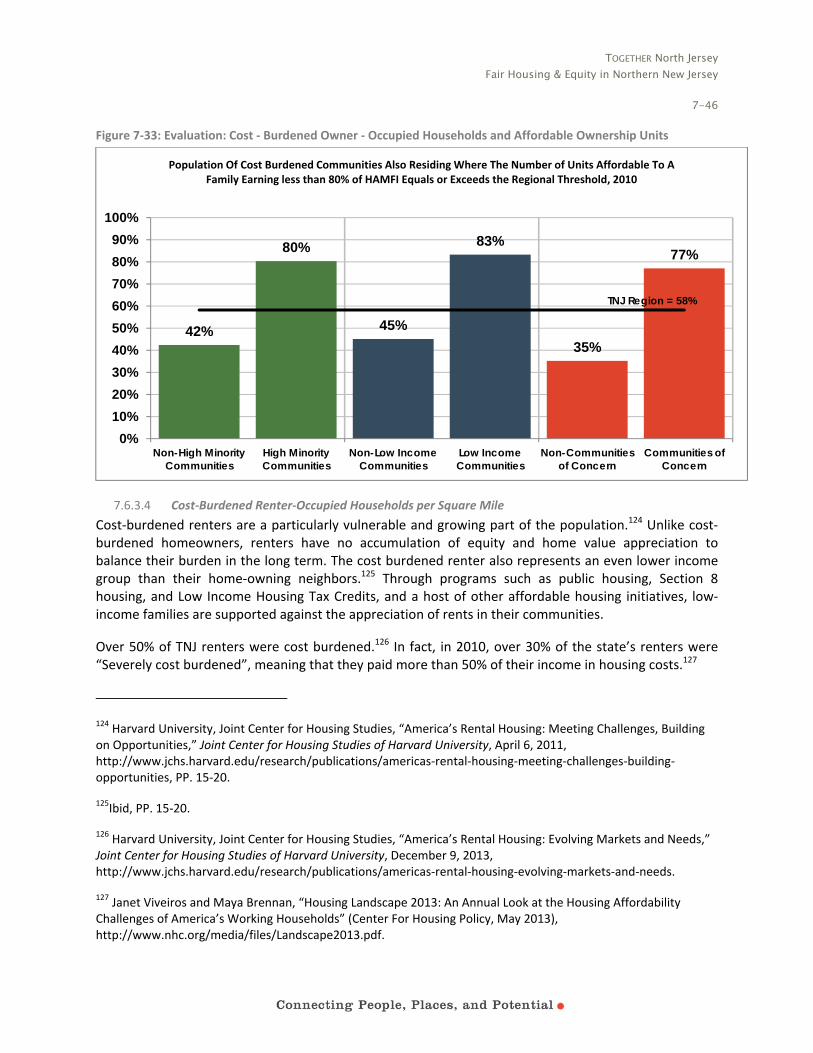
TOGETHER North Jersey Fair Housing & Equity in Northern New Jersey
7-46
Figure 7‐33: Evaluation: Cost ‐ Burdened Owner ‐ Occupied Households and Affordable Ownership Units
Cost‐Burdened Renter‐Occupied Households per Square Mile 7.6.3.4
Cost‐burdened renters are a particularly vulnerable and growing part of the population.124 Unlike cost‐burdened homeowners, renters have no accumulation of equity and home value appreciation to balance their burden in the long term. The cost burdened renter also represents an even lower income group than their home‐owning neighbors.125 Through programs such as public housing, Section 8 housing, and Low Income Housing Tax Credits, and a host of other affordable housing initiatives, low‐income families are supported against the appreciation of rents in their communities.
Over 50% of TNJ renters were cost burdened.126 In fact, in 2010, over 30% of the state’s renters were “Severely cost burdened”, meaning that they paid more than 50% of their income in housing costs.127
124 Harvard University, Joint Center for Housing Studies, “America’s Rental Housing: Meeting Challenges, Building on Opportunities,” Joint Center for Housing Studies of Harvard University, April 6, 2011, http://www.jchs.harvard.edu/research/publications/americas‐rental‐housing‐meeting‐challenges‐building‐opportunities, PP. 15‐20.
125Ibid, PP. 15‐20.
126 Harvard University, Joint Center for Housing Studies, “America’s Rental Housing: Evolving Markets and Needs,” Joint Center for Housing Studies of Harvard University, December 9, 2013, http://www.jchs.harvard.edu/research/publications/americas‐rental‐housing‐evolving‐markets‐and‐needs.
127 Janet Viveiros and Maya Brennan, “Housing Landscape 2013: An Annual Look at the Housing Affordability Challenges of America’s Working Households” (Center For Housing Policy, May 2013), http://www.nhc.org/media/files/Landscape2013.pdf.
42%
80%
45%
83%
35%
77%
TNJ Region = 58%
0%10%20%30%40%50%60%70%80%90%
100%
Non-High MinorityCommunities
High MinorityCommunities
Non-Low IncomeCommunities
Low IncomeCommunities
Non-Communitiesof Concern
Communities ofConcern
Population Of Cost Burdened Communities Also Residing Where The Number of Units Affordable To A Family Earning less than 80% of HAMFI Equals or Exceeds the Regional Threshold, 2010

TOGETHER North Jersey Fair Housing & Equity in Northern New Jersey
7-47
As shown earlier in Figure 7‐23, the highest percentages of renter occupied housing units were found in the urban core of the TNJ near Newark. Cost‐burdened renter households were also concentrated in this area. Cost‐burdened renters were not as widely distributed as cost‐burdened home owners were. In some areas of Newark, Paterson, Jersey City, and Elizabeth the number of cost‐burdened renter households alone ranged from 1,753 households up to 13,885 cost‐burdened renter households per square mile. These areas within the TNJ region have the largest total number of cost‐burdened renters but there remain other areas, less densely populated, where renter households are cost‐burdened.
In comparison, for those residents who do not live in communities of concern, there is a much lower probability that they lived in cost‐burdened renter communities. Not living in these areas meant that at least 61% of the population also lived in places where renters were not cost burdened. Low‐income community renters rarely lived in non‐cost burdened communities‐‐only 4% of the population in low income communities lived in places where renters were not cost burdened (see Figure 7‐34).

TOGETHER North Jersey Fair Housing & Equity in Northern New Jersey
7-48
Figure 7‐34: Cost‐Burdened Renter‐Occupied Households per square mile

TOGETHER North Jersey Fair Housing & Equity in Northern New Jersey
7-49
Figure 7‐35: Evaluation: Non‐Cost Burdened Renter‐Occupied Households
Figure 7‐36 below clearly shows the distinction in housing options experienced by TNJ renters. Fifty‐three percent of the region’s population lived in communities that were cost burdened with an above average provision of affordable housing. These were areas where cost‐burdened renters resided given the disproportionate availability of affordable housing.
In low‐income communities that were cost burdened, 95% of all residents resided where there was an above average provision of affordable housing units. Much of this co‐location reflects the density of these characteristics. As illustrated earlier in Figure 7.32, only 4.0% of people living in low income communities were also residing in non‐cost burdened communities. The segregated distribution of cost‐burden, affordable housing, and community of concern populations underline again the need for policy responses to counteract the pernicious effects of these uneven distributions of the population which also breed a lack of social exposure, a lack of connection to opportunities, and a lack of familiarity with the recurrent challenges faced by these isolated, disadvantaged communities.128
Figure 7‐36 also shows that on average only 31% of persons living in non‐minority and non‐low income communities that were dealing with the challenge of being renter cost burdened also resided where there was considerable provision of affordable housing units. This may imply that non‐minority and non‐low income communities had both lower densities and also lower available affordable housing.
128 John Iceland, Daniel Weinberg, and Erika Steinmetz, Racial and Ethnic Residential Segregation in the United States: 1980 ‐ 2000, Census 2000 Special Reports, August 2002, http://www.census.gov/prod/2002pubs/censr‐3.pdf.
64%
11%
61%
4%
76%
14%
TNJ Region = 42%
0%10%20%30%40%50%60%70%80%90%
100%
Non-High MinorityCommunities
High MinorityCommunities
Non-Low IncomeCommunities
Low IncomeCommunities
Non-Communitiesof Concern
Communities ofConcern
Population Residing Where the Share of Non‐Cost Burdened Renter Households Equals or Exceeds the Regional Threshold, 2010

TOGETHER North Jersey Fair Housing & Equity in Northern New Jersey
7-50
Figure 7‐36: Evaluation: Cost‐Burdened Renter‐Occupied and Affordable Ownership Units
Location of HUD Units (Units/1,000 persons) 7.6.4
The location of HUD units per 1,000 people is a measure of the density and mere presence of various affordable housing options for low income families across the TNJ.
HUD Low‐Income Housing Tax Credits 7.6.4.1
The Low Income Housing Tax Credit (LIHTC) is a corporate tax credit provided to developers to spur the construction of low income housing. LIHTC tax credits are provided by the IRS to state housing finance agencies and then administered by HUD. By selling the IRS tax credits, residential developers gain additional equity for their development projects.129 This is just the initial construction subsidy for these projects and does not limit additional assistance such as Section 8 subsidies.
To qualify for the LIHTC program the project must:
1. Be a residential rental housing project 2. Commit to low income occupancy thresholds using either the 20‐50 rule or 40‐60 rule. 20‐50
projects have rent restrictions on 20% of their units that are low enough to be affordable to households earning less than 50% of HAMFI. 40‐60 projects require 40% of their units be affordable to households earning less than 60% of HAMFI.
129 US Department of Housing and Urban Development, “How Do Housing Tax Credits Work? ‐ Affordable Housing ‐ CPD ‐ HUD,” How Do Housing Tax Credits Work?, accessed June 2, 2014, http://portal.hud.gov/hudportal/HUD?src=/program_offices/comm_planning/affordablehousing/training/web/lihtc/basics/work.
29%
87%
32%
95%
18%
82%
TNJ Region = 53%
0%10%20%30%40%50%60%70%80%90%
100%
Non-High MinorityCommunities
High MinorityCommunities
Non-Low IncomeCommunities
Low IncomeCommunities
Non-Communitiesof Concern
Communities ofConcern
Population Of Cost Burdened Renter Households Also Residing Where Affordable Rental Units for Families Earning Less Than 80% of HAMFI Equals or Exceeds the Regional Threshold, 2010

TOGETHER North Jersey Fair Housing & Equity in Northern New Jersey
7-51
3. Operate under rent and income restrictions for 30 years or longer as stipulated in a written agreement.130
LIHTC rent restrictions only apply to the portion of the rent that the tenant pays and may allow for higher rents where there is additional subsidization.
LIHTC is the primary method for the construction of affordable rental housing in the United States.131 Figure 7‐37 shows the allocation of HUD LIHTC units per 1,000 people across the TNJ region. There were greater concentrations of affordable units in Newark and Jersey City, as well as near Paterson and Elizabeth. There were also several counties with considerably fewer LIHTC projects, but also less proximity to major roads or NJT Rail lines or stations. These counties included Warren, Sussex, Hunterdon, and Somerset.
HUD Public Housing Units 7.6.4.2
HUD Public Housing programs have sought to provide, “Decent and safe rental housing for eligible low‐income families, the elderly, and persons with disabilities.”132 HUD eligibility for Public Housing is based on a household’s:
1. Annual Gross Income; 2. Status as Elderly, Disabled, or a Family; 3. US citizenship; and 4. Credit references
HUD also uses HUD Area Median Family Income (HAMFI) in their Public Housing eligibility assessments. They define households earning less than 80% of HAMFI as Lower Income and those earning less than 50% of HAMFI as Very Low Income.133 The rent that a public housing family must pay is referred to as the Total Tenant Payment (TTP). It is based on the highest of four possible criteria which include:
1. 30% of monthly income after approved deductions 2. 10% of monthly income 3. Welfare rent, which occurs in jurisdictions that provide separate welfare housing assistance. 4. A $25 ‐ $50 minimum rent set by the local Housing Authority.
130 “Eligibility ‐ Affordable Housing ‐ CPD ‐ HUD,” Eligibility for Low Income Housing Tax Credits, accessed May 30, 2014, http://portal.hud.gov/hudportal/HUD?src=/program_offices/comm_planning/affordablehousing/training/web/lihtc/basics/eligibility.
131 Alex F. Schwartz, Housing Policy in the United States, 2 edition (New York: Routledge, 2010), P. 103.
132 US Department of Housing and Urban Development, “HUD’s Public Housing Program/U.S. Department of Housing and Urban Development (HUD),” accessed May 30, 2014, http://portal.hud.gov/hudportal/HUD?src=/topics/rental_assistance/phprog.
133 Ibid.

TOGETHER North Jersey Fair Housing & Equity in Northern New Jersey
7-52
Figure 7‐37: HUD Low Income Housing Tax Credit Units per 1,000 Persons

TOGETHER North Jersey Fair Housing & Equity in Northern New Jersey
7-53
Public Housing provides residences for 1.2 million American households which accounts for approximately 2.2 million people. There are 3,200 housing authorities across the country administering these units. There are 100 housing authorities in New Jersey providing public housing.134 They administer 31,069 public housing units located specifically within the TNJ.
Figure 7‐38 illustrates the distribution of public housing units per 1,000 persons across the TNJ. Here, once again, public housing units were predominantly found in Newark and Jersey City with groupings in other parts of the region such as Paterson and Hackensack. There were additional, but smaller, groupings of public housing units in Middlesex, Monmouth, and Morris counties. In Sussex, Warren, Hunterdon, and Ocean counties there were few if any public housing units. It is also important to note that while public housing units appeared to be proximate to major roads, they showed no proximity to rail lines across the TNJ, which was a clear characteristic of private rental developments.
HUD Multifamily Units 7.6.4.3
HUD supports the construction of multifamily housing through mortgage finance, insurance programs, and federal construction subsidies such as the LIHTC. Figure 7‐39 shows the locations of all HUD Multifamily projects around northern New Jersey. As shown on other maps in this section, the majority of multifamily projects were concentrated in Newark, Jersey City, and Paterson.
HUD multifamily financed construction projects can be used to support many of its subsidized residential housing initiatives. This map shows both where HUD investments were being made and, just as importantly, where they were not being made across the region. The ongoing pattern in the provision of housing continued as well as the spatial mismatch between affordable housing and private sector job growth.
The mismatch reflected the lack of access to employment opportunities that can be expected for both communities of concern and their component populations around the TNJ.
134 State of New Jersey Department of Community Affairs, “NJ Department of Community Affairs,” Guide to Affordable Housing in New Jersey Revised October 23, 2013, October 23, 2013, http://www.state.nj.us/dca/divisions/codes/publications/guide.html.

TOGETHER North Jersey Fair Housing & Equity in Northern New Jersey
7-54
Figure 7‐38: HUD Public Housing Units per 1,000 Persons

TOGETHER North Jersey Fair Housing & Equity in Northern New Jersey
7-55
Figure 7‐39: HUD Multifamily Units per 1,000 Persons

TOGETHER North Jersey Fair Housing & Equity in Northern New Jersey
7-56
Communities of Concern Evaluation 7.6.4.4
In Figure 7‐40, the provision of Low Income Housing Tax Credit units was approximately four times higher in high minority and low income communities and in designated communities of concern. In these communities – places like Newark, Paterson and Jersey City ‐‐ there were approximately 4.21 LIHTC units for every 1,000 people135, while the regional average was 2.3 LIHTC units per 1,000 persons. In places that were not Communities of Concern, the use and availability of LIHTC units was much lower. There was often less than one LIHTC unit per 1,000.
The prevalence of HUD Public housing units in minority, low income, and communities of concern continued to reflect the clear geographic distinction in the provision of affordable housing across the TNJ. In minority communities there were 89.4 public housing units for every 1,000 people. In low income and in communities of concerns, there were 12.5 public housing units and 8.3 public housing units respectively per 1,000 people.
By contrast, little provision of public housing units occurred outside the communities of concern. The stark geographic disparity in the distribution of units is shown in Figure 7‐41. In communities that did not have large numbers of minorities, low income families, disabled, elderly, or carless households, there were only 0.3 public housing units per 1,000 persons
This disparity is also evident in the distribution of all HUD Multifamily units. There were anywhere from 9.7 to 12.8 Multifamily units available from HUD to various populations within the communities of concern (See Figure 7‐42). In Non‐Community of Concern areas there were 1.2 to 2.7 multifamily units available per 1,000 persons. Again, the provision of units was heavily concentrated in Newark, Jersey City, Paterson and Elizabeth, while the majority of the region outside these areas had little or no provision of multifamily units. This consistent pattern of disparity meant that there was the potential for spatial mismatch between housing and job opportunities.
This cumulative context is discussed further in Chapter 9; it should be considered that Regional Contribution Agreements (RCAs), a feature of the implementation of NJ’s Fair Housing Act in response to Mt. Laurel that enabled growing municipalities to “send” a portion of their obligation to “receiving” municipalities, tended to exacerbate this disparity in the distribution of affordable housing within the TNJ region.136
135 Average for the metrics for High‐Minority, Low‐Income and Communities of Concern.
136 Troutt, The Price of Paradise, P. 70.

TOGETHER North Jersey Fair Housing & Equity in Northern New Jersey
7-57
Figure 7‐40: Evaluation: Low Income Housing Tax Credit Units
.
Figure 7‐41: Evaluation: HUD Public Housing Units

TOGETHER North Jersey Fair Housing & Equity in Northern New Jersey
7-58
Figure 7‐42: Evaluation: HUD Multifamily Units
7.7 Health and the Environment
Foreclosures per Square Mile 7.7.1
The Mortgage Bankers Association reported that New Jersey ranks among the nation’s highest for rates of mortgage delinquency and foreclosure starts. Moreover, as a judicial foreclosure state, foreclosures take longer in New Jersey than most other parts of the country. The growth in the inventory of New Jersey foreclosed properties was one of the three highest in the country along with Nevada and Florida.137 138 In New Jersey the average foreclosure took 964 days.139 Hurricane Sandy also impacted the rates of foreclosure requests in the state and in the TNJ region.
Foreclosures per Square Mile are a critical metric, portending a higher possibility for declining property values, increasing vacancies, property abandonment and vandalism. Large numbers of foreclosures and vacancies often result in additional administrative costs for municipalities with respect to fire, policing, and demolition. Foreclosures also lead to an increasing need for rental housing from families with poor credit.
137 Mortgage Banker’s Association (MBA), “National Delinquency Results Map 4th Quarter 2010” (Mortgage Banker’s Association, February 2011), http://www.mortgagebankers.org/files/Research/NDS_Maps.pdf.
138 Prashant Gopal, “Foreclosures Surging in New York‐New Jersey Market,” Bloomberg, February 26, 2014, http://www.bloomberg.com/news/2014‐02‐26/foreclosures‐climaxing‐in‐new‐york‐new‐jersey‐market‐mortgages.html.
139 “How Fast Does Your State Foreclose?,” NPR.org, accessed June 2, 2014, http://www.npr.org/2012/03/15/148696260/how‐fast‐does‐your‐state‐foreclose.

TOGETHER North Jersey Fair Housing & Equity in Northern New Jersey
7-59
As shown in Figure 7‐43, high rates of foreclosures were concentrated in Newark, Elizabeth, Jersey City, Paterson, and Hackensack with smaller pockets in New Brunswick, Newton, Morristown, Somerset Borough, Sam’s River Township, Belvidere, and Freehold’s Borough. Regions of the TNJ that surrounded the high foreclosure areas had a lower total number of foreclosures per square mile. However, this distribution may have been heavily related to the overall density of housing across the region.
Persons living in low‐income, high‐minority, and community of concern areas were much more likely to be living in places with foreclosure rates per square mile above the threshold. This analysis shows that 89% of people in Communities of Concern live in places that meet or exceed the regional threshold for Foreclosure per Square Mile (11.9) compared to 68% of people region‐wide. In other words, those living in the region’s Communities of Concern (as well as high minority or low‐income areas) are more than twice as likely to live in places with above‐average foreclosure rates
While populations not included in communities of concern were far less likely to be located in places with high foreclosure rates, anywhere from 42‐53% of the people still found themselves in communities enduring higher levels of foreclosure. This is not surprising as New Jersey had one of the highest foreclosure rates in the nation and, like all states, is still dealing with the aftermath of the 2008 housing crisis.
Figure 7‐43: Evaluation: Foreclosures per Square Mile

TOGETHER North Jersey Fair Housing & Equity in Northern New Jersey
7-60
Figure 7‐44: Foreclosures per Square Mile by Municipality, Q3 2009 ‐ Q1 2013

TOGETHER North Jersey Fair Housing & Equity in Northern New Jersey
7-61
Cancer Risk 7.7.1
The Clean Air Act establishes the guidelines for measuring air quality across the country through the National Ambient Air Quality Standards (NAAQS).140 NAAQS measure the rates of Carbon Monoxide, Lead, Nitrogen Dioxide, Particulate Matter, Sulfur Dioxide and other air toxins that are found in the atmosphere or produced by different activities and locations.141 These are referred to as the “Criteria Pollutants” of Clean Air Act. They are used to measure the air quality in a community or the potential impacts from certain activities.
The TNJ region’s air quality affects the Cancer Risks experienced by its residents. The NAAQS standards target pollutants that are either detrimental to healthy ecosystems or are known carcinogens among other concerns. This is especially the case for particulate matter produced by sources such as factories or engines. Air quality is important not because of its implications for the health of community residents and various ecosystems, but for its relationship to patterns of community development.142
Figure 7.45 shows the clear pattern of decreasing cancer risk based on air quality moving away from the urban core of the TNJ. Newark, Elizabeth, and Jersey City were at the heart of the high risk zone which gradually and consistently decreased as one moved out to the periphery of the region. Four clearly visible concentric rings surrounded the urban core and showed that geography and proximity to urban areas determined the air quality and cancer risks faced by TNJ residents daily.
Figure 7‐46 illustrates how closely the high minority and low income areas of the TNJ were correlated with the region’s higher cancer risk areas. This analysis shows that 68% of people in Communities of Concern live in places that meet or exceed the regional threshold for Cancer Risk (341 in a million) compared to 45% of people region‐wide. The percentage of persons living in places with higher cancer risk rises still higher for persons who are living in places with high‐minority and low‐income communities.
140 US EPA, “Clean Air Act Requirements and History | Air Pollution and the Clean Air Act | US Environmental Protection Agency,” accessed June 2, 2014, http://www.epa.gov/air/caa/requirements.html.
141 Ibid.
142 U.S. Environmental Protection Agency Transportation and Regional Programs Division, Office of Transportation and Air Quality, EPA Guidance: Improving Air Quality Through Land Use Activities (Environmental Protection Agency, January 2001), http://www.epa.gov/oms/stateresources/policy/transp/landuse/r01001.pdf, PP. 33‐39.

TOGETHER North Jersey Fair Housing & Equity in Northern New Jersey
7-62
Figure 7‐45: Total Cancer Risk, 2005

TOGETHER North Jersey Fair Housing & Equity in Northern New Jersey
7-63
Figure 7‐46: Evaluation: Cancer Risk
Access to Healthy Food 7.7.2
Food Deserts are defined by the USDA as parts of the Country that are without access to fresh fruits, vegetables, and other healthful whole foods in impoverished areas that is due to the lack of grocery stores, farmer’s markets and health food producers. Also, according to USDA, these areas without access are often flush with sources of unhealthy packaged foods provided by fast food restaurants and convenience stores.143
Research on access to affordable and nutritious food found low income residents shop where food prices are low. They do not change where they shop but rather travel longer and farther to get to shopping centers.144
Figure 7‐47 shows the location of census tracts across the TNJ that were had both Low Income and Low Access to Healthy Foods. These tracts were specifically defined as areas that were low income but where either:
A. 100 households were over ½ mile from the nearest grocery store and there was not access to a vehicle, or
B. At least 500 people or 33% of the census tracts population lived over twenty miles from the nearest supermarket regardless of whether or not they had access to a vehicle.
143 American Nutritional Association, “USDA Defines Food Deserts | American Nutrition Association,” accessed June 2, 2014, http://americannutritionassociation.org/newsletter/usda‐defines‐food‐deserts.
144 Michele Ver Ploeg et al., “USDA Economic Research Service ‐ AP‐036, Access to Affordable Nutritious Food,” March 26, 2012, http://www.ers.usda.gov/publications/ap‐administrative‐publication/ap‐036.aspx#.U4zF1igvBe5.

TOGETHER North Jersey Fair Housing & Equity in Northern New Jersey
7-64
Figure 7‐47: Access to Healthy Food: Low Income and Low Access using Vehicle Access

TOGETHER North Jersey Fair Housing & Equity in Northern New Jersey
7-65
The map indicates that low access to healthy foods is evident in select pockets of communities near Newark and in Ocean County. Figure 7‐48 shows that low access to healthy food is something that about 10% of the region’s residents experience. These rates rise for persons living in communities to 16% and are higher for persons living in places with high concentrations of low‐income persons.145
Figure 7‐48: Evaluation: Access to Healthy Food
Access to Open Space 7.7.3
Access to Open Space is a metric of relative proximity to parks and open space. As shown in Figure 7‐49, there are places that run from the north section of Bergen County down through Newark and heading on to New Brunswick that are relatively farther from open space (i.e., more than ½ mile in an urban area; 1 mile in a suburban area).
Generally as shown in Figure 7‐50, access to open space was fairly uniform across the TNJ without regard to communities of concern. On average 79% of the TNJs residents had access to open space meaning that 21% of persons lived in places with below average for access to open space. Ultimately, the majority of TNJ residents had access to open spaces.
145 The data source and metrics is a “flagship” indicator provided by HUD. The definition of food deserts is very broad; other criteria and further study of pockets of low access to healthy food are probably warranted.

TOGETHER North Jersey Fair Housing & Equity in Northern New Jersey
7-66
Figure 7‐48: Access to Open Space

TOGETHER North Jersey Fair Housing & Equity in Northern New Jersey
7-67
Figure 7‐49: Evaluation: Access to Open Space
7.8 Transportation, Access & Mobility
Population per Square Mile Served by Transit 7.8.1
Figure 7.51 shows the total Population per Square mile Served by Transit. The majority of the residents with transit access146 are located in the denser urban areas of the region. The majority of residents in the near suburbs relative to Newark and the TNJ’s urban core were located around NJPTA rail stations.147
The majority of the TNJ’s residents lived in close proximity to its urban core and, not surprisingly, large proportions of TNJ residents had access to public transit. Some 86% of persons living in communities of concern had access to public transit as measured here (i.e., within one mile for rail and .25 mile for bus/shuttle routes). By comparison, only 44% of people living outside the Communities of Concern live in places that meet or exceed the regional threshold for population per square mile served by transit compared to 67% of people region‐wide.
146 “Access” was measured as both a large total number of people combined with the presence of transit access in the same location. Areas with large total square miles may not be reflected on this map even if they have large populations with transit access.
147 Areas near Newark with little population served by transit included landfill areas and marshes with little population in general

TOGETHER North Jersey Fair Housing & Equity in Northern New Jersey
7-68
Figure 7‐51: Population per Square Mile Served by Transit

TOGETHER North Jersey Fair Housing & Equity in Northern New Jersey
7-69
Figure 7‐52: Evaluation: Population per Square Mile Served by Transit
Jobs within 45 Minutes by Transit 7.8.2
Jobs with 45 minutes of Transit is a measure of the job‐rich places reachable by transit by a commuting workforce. In the TNJ region, the largest total number of transit‐accessible jobs can be found in the urban core of the TNJ and at select NJ Transit station nodes. These job‐accessible places ‐‐ to be above the regional threshold ‐‐ had to have both transit access and a relatively large pool of jobs.
Comparing job growth data (e.g. Figure 7‐14) with the map shown here in Figure 7‐53, it can be seen that several job‐rich areas by transit are in places in the region where there has been little job growth and declines in employment of the last 20 years. So while getting to work by public transit is most effectively implemented in the urban rail corridors of the TNJ, these commuters have access to a shrinking pool of employment opportunities.
Regionally, there was an average of 95,475 jobs available by transit and approximately one‐quarter of persons in the region lived in places that met or exceed this average. However, as shown below in Figure 7‐55, the percentage of persons living in these job‐rich transit areas rises for persons who live in predominantly low‐income (51% of such persons) or high‐minority communities (48% of such persons). By comparison, persons living in non‐low income and non‐high minority communities were far less likely to have this level of access to jobs via transit with no more than 11% of such residents having above‐average job access by transit.

TOGETHER North Jersey Fair Housing & Equity in Northern New Jersey
7-70
Figure 7‐50: Jobs within 45 Minutes by Transit

TOGETHER North Jersey Fair Housing & Equity in Northern New Jersey
7-71
Figure 7‐51: Evaluation: Jobs within 45 Minutes by Transit
Jobs within 45 Minutes by Auto 7.8.3
Nationally, transit has been considered an inferior method of access to job markets in recent decades. Transit riders have longer periods of unemployment than their car‐owning neighbors. As noted by the Urban Institute’s report “Driving to Opportunity”, car ownership has become a critical component of the job search process and successfully making the transition from unemployment to employment. The length of unemployment when it does occur, and the earnings relative to transit riders are better for car owners even when controlling for the neighborhood of origin and population type.
The number of Jobs within 45 minutes by Auto increases in four distinct rings heading eastward toward the urban core areas of Newark and Jersey City. In select parts of the urban core, between 2.5 and 3.6 million jobs can be accessed via car; this amount falls to less than 28,909 jobs in some exurban and suburban areas. By comparison, areas in the TNJ with the best transit access are in proximity to 2,045,702 million. There are also regions of the TNJ with absolutely no transit access to jobs in the outer ring of the region. For car owners the worst area for job access is in proximity to 30,202 jobs.
Living in proximity to these employment centers, nearly 60 percent of persons that live in communities of concern (and higher for persons living in high‐minority and low‐income communities) also live in places that meet or exceed the regional threshold for jobs within 45 minutes by auto. This compares favorably to persons living outside the communities of concern.
This implies larger labor market sheds for those living in these urban core areas with access to an automobile; however, as shown elsewhere in this chapter, this metric does not address the educational attainment or preparedness of persons to secure these jobs. It should be noted that the areas with the greatest density of employment such as Newark and Jersey City have large total numbers of jobs but also higher unemployment and lower job growth than their more suburban counterparts.

TOGETHER North Jersey Fair Housing & Equity in Northern New Jersey
7-72
Figure 7‐52: Jobs within 45 Minutes by Auto

TOGETHER North Jersey Fair Housing & Equity in Northern New Jersey
7-73
Figure 7‐53: Evaluation: Jobs within 45 Minutes by Auto
Percent of Commuters who Walk, Bike, Carpool or Use Transit to Work 7.8.4
Several transportation choice maps are shown below, illustrating the spatial patterns and relative significance of alternative modes to the auto for work commuting in Figures 7‐59 through 7‐62. The figures illustrate that the percent using Transit (12.4%) and Carpooling (8.8%) is significantly greater than Walking (3.8%) or Bicycling (.3%).
The relative dependency upon alternative transportation modes that persons living in communities of concern have in comparison to the region overall is shown in a series of evaluation tables (see Figures 7‐63 through 7‐67). Reflecting their locational and economic circumstances, persons living in communities of concern exhibited greater reliance upon transit, carpooling and walking than persons living outside such communities. These disparities widen further for persons living in low‐income and high‐minority communities.

TOGETHER North Jersey Fair Housing & Equity in Northern New Jersey
7-74
Figure 7‐54: Percent of Commuters using Transit to Work

TOGETHER North Jersey Fair Housing & Equity in Northern New Jersey
7-75
Figure 7‐60: Percent of Commuters who Carpool to Work

TOGETHER North Jersey Fair Housing & Equity in Northern New Jersey
7-76
Figure 7‐61: Percent of Commuters who Walk to Work

TOGETHER North Jersey Fair Housing & Equity in Northern New Jersey
7-77
Figure 7‐62: Percent of Commuters who Bike to Work

TOGETHER North Jersey Fair Housing & Equity in Northern New Jersey
7-78
Figures 7‐63: Evaluation: Transit to Work
Figures 7‐64: Evaluation: Percent Carpool to Work

TOGETHER North Jersey Fair Housing & Equity in Northern New Jersey
7-79
Figures 7‐65: Evaluation: Percent Walk to Work
Figures 7‐66: Evaluation: Percent Bike to Work

TOGETHER North Jersey Fair Housing & Equity in Northern New Jersey
7-80
7.9 Social Engagement
In the TNJ region, there are many challenges to face in building sustainable communities that are economically competitive, resilient and inclusive. Confronting the region’s challenges suggests the importance of building collaborative processes, strengthening institutional and community capacity as well as our individual capabilities to address growth and change. Vibrant civic institutions and vigorous political discourse are integral to understanding and taking on our challenges. Voter turnout is one proxy indicator for measuring the region’s “social glue” or willingness to come together to address imminent problems facing the region that are beyond the capacity of the marketplace, faith‐based and civic associations, families and individuals to address.
Voter turnout is the percentage of eligible voters who cast a ballot in an election. In a representative or popular democracy, low turnout is often perceived as a sign of societal indifference, disengagement, disenchantment, or distrust in our governing institutions The legitimacy of governing institutions can be called into question where turnout is persistently poor.
There are many possible causes, or barriers that affect voter turnout in a society, including economic, demographic, cultural, institutional, technological and legal factors. In some cases, low turnout may be attributed to a contented electorate. But, if this is the case, then higher voter turnout can be seen as the means by which an electorate exercises its rights and its will, holding its elected leaders and representatives accountable for their expressed values and positions, priorities and votes.
Figures 7‐67 and 7‐68 present a map and a comparative evaluation of voter turnout in a 2010 general election. It can be seen that there was very uneven pattern of voter turnout for an election year that did not involve a Presidential race. For those living in a community of concern, there was only a 31% chance that the person lived in a place that equals or exceeds the regional threshold for voter turnout. The chances were even lower if living in a high‐minority (25%) or low‐income community (21%). By comparison, if a person lived outside the communities of concern, there was 71% chance that person also lived in a place that exceeded the regional threshold for voter turnout.

TOGETHER North Jersey Fair Housing & Equity in Northern New Jersey
7-81
Figure 7‐67: Voter Turnout for 2010 General

TOGETHER North Jersey Fair Housing & Equity in Northern New Jersey
7-82
Figure 7‐68: Voter Turnout for 2010 General Election

TOGETHER North Jersey Fair Housing & Equity in Northern New Jersey
8-1
8 Physical Infrastructure and Public Investments
8.1 Introduction
Major public investments in transportation, economic development, and infrastructure have the potential to impact the housing affordability, economic opportunities, and overall quality of life of people who live in the places where these investments are made. This chapter will examine where major public investments are being made in the TNJ region and how they are connecting people ‐‐ especially residents of concentrated areas of poverty and segregation ‐‐ to jobs, schools, and places of opportunity.
In accordance with the regional perspective of the FHEA, this analysis of public investment concentrates on investment programs that are made throughout the region. The analysis examines public investment programs that reflect the concerns several of the major topics of the TNJ Regional Plan for Sustainable Development which have local land use implications and where the investment can be geographically linked to the location of the investment. The analysis is organized based on the agency managing the public infrastructure investments.
8.2 Economic Development
New Jersey has a diverse economy that experienced the same economic downturn as the rest of the United States with the 2008 recession. Even though New Jersey’s economy has strong assets, like proximity to New York City and international ports, New Jersey’s economic recovery is lagging behind that of the rest of the country, with less access to jobs and economic opportunities for New Jersey’s residents.
Since the New Jersey Economic Development Authority (NJEDA) was established in 1974, it has been tasked with maintaining and expanding job opportunities and increasing tax ratables by providing financing to the private sector, local governments, and non‐profits within the State of New Jersey. NJEDA has a variety of programs geared towards enhancing job creation, aiding real estate development, and increasing economic development opportunities for New Jersey’s residents. NJEDA provides financing options through direct loans, participating in loans, loan guarantees, and line of credit guarantees for both for profit and non‐profit entities. NJEDA also offers convertible debt, warrant options, tax credits, reimbursement grants, bond financing, and invests its own resources.
NJEDA is able to generate capital because it is the financing arm of the State, and it has the ability to issue bonds for specific purposes. NJEDA has an agreement with the State Treasurer to enable bond repayment. NJEDA also distributes funds on behalf of other agencies that are allocated for specific programs, such as disaster relief funding from the Federal Emergency Management Agency (FEMA) and the New Jersey Department of Community Affairs (NJDCA) for the Stronger NJ program, State Small Business Credit Initiative for Main Street Investment programs, and from the New Jersey Department of Environmental Protection (NJDEP) for site remediation programs funded by the Hazardous Discharge Site Remediation Fund.
NJEDA manages several programs that offer different kinds of incentives to create opportunities for job creation, real estate development, and economic revitalization. These programs are aimed at overcoming different financial barriers that prevent investment in New Jersey by both for profit and non‐profit entities.

TOGETHER North Jersey Fair Housing & Equity in Northern New Jersey
8-2
NJEDA also collects demographic and financial data for each applicant to determine where businesses are interested in locating, how much money is needed to bridge financial barriers, and the effect of an applicant relocating or remaining in New Jersey’s economy. The demographic information includes the name of the applicant, the physical address of the location being funded, and the square footage of the facility. The financial information consists of the requested incentive amount, the full project costs, and the number of permanent and construction jobs created. NJEDA manages the financial incentives of many programs on behalf of other state agencies, so it does not collect all of this information only for the programs for which it provides incentives.
Grow NJ Assistance Program 8.2.1
In 2013, NJEDA passed The Economic Opportunity Act of 2013 to help streamline the financial investments offered and to increase opportunities for job creation and economic development. NJEDA offered three financial incentive programs to spur job creation and real estate investment that were reorganized into two programs, the Grow NJ Assistance Program (Grow NJ) and the Economic Redevelopment and Growth Program (ERG) in The Economic Opportunity Act of 2013.
In this reorganization, the existing Grow NJ program absorbed and combined the former Business Employment Incentive Program (BEIP), the Business Retention and Relocation Assistance Grant (BRRAG), and the Urban Transit Hub Tax Credit Program. The goal of merging these incentive programs was to enhance the incentives available for attracting businesses to New Jersey. The new Grow NJ program increased the geographic area in which businesses can qualify for tax credits and decreased capital investment and employment eligibility requirements, making it easier for businesses to participate in the Grow NJ program.
By encouraging companies to do business in New Jersey with the Grow NJ program, NJEDA creates opportunities for the state’s workforce through the creation of permanent jobs and temporary construction jobs. The retention of existing businesses and the siting of new businesses in New Jersey, especially in designated areas where there is an existing urban infrastructure, maintains economic vitality in New Jersey’s commercial areas, creates opportunities for residential development in mixed‐use areas, and contributes revenue from the local municipal tax base.
By awarding extra incentives to areas in designated districts, NJEDA seeks to stimulate redevelopment and the sustainable reuse of land. While the economic growth that results from these incentives is positive, there can be negative externalities to the environment from construction and operations of facilities that are sited or assisted through the program. It is also possible that the created jobs will be filled by people who do not live in the places where the investments are made.
Since Grow NJ is a new program that combined several existing economic incentive programs, this analysis will examine where NJEDA has made investments with the programs that have been reorganized into Grow NJ. Between 2008‐2013, NJEDA made 213 investments in the BEIP, BRRAG, and Grow NJ programs, equaling $997.6 million in economic incentives for job retention and creation. Of this investment, 55%, or $545.8 million occurred in high minority places and 64% or $633.9 million in incentives were made in communities of concern, but only 33% or $329.8 million were invested in low‐income communities (see Figures 8‐1 and 8‐2 and Table 8‐1)

TOGETHER North Jersey Fair Housing & Equity in Northern New Jersey
8-3
Figure 8‐1: NJEDA Investment in Job Retention and Creation, 2008‐2013

TOGETHER North Jersey Fair Housing & Equity in Northern New Jersey
8-4
Figure 8‐2: NJEDA Investment in Job Retention and Creation 2008 ‐ 2013

TOGETHER North Jersey Fair Housing & Equity in Northern New Jersey
8-5
Table 8‐1: NJEDA Investment in Job Retention and Creation by County, 2008‐2013
County
Total EDA Investment in Job Retention and Growth
Number of EDA Investments
Investment in High Minority Communities
Percent of Total EDA Investment in High‐Minority Communities
Investment in Low Income Communities
Percent of Total EDA Investment in Low‐Income Communities
Investment in Communities of Concern
Percent of Total EDA Investment in Communities of Concern
Bergen 89,387,831 31 7,472,250 8% 8,259,750 9% 16,238,872 18%
Essex 34,328,797 10 32,978,798 96% 32,978,798 96% 32,978,798 96%
Hudson 302,678,718 36 273,219,246 90% 187,127,694 62% 274,843,726 91%
Hunterdon 1,434,379 2 ‐ 0% ‐ 0% ‐ 0%
Middlesex 111,917,688 52 100,722,851 90% 36,009,818 32% 106,665,682 95%
Monmouth 21,214,763 7 3,781,000 18% 8,556,000 40% 12,337,000 58%
Morris 296,048,703 34 53,472,550 18% ‐ 0% 105,020,313 35%
Ocean 3,047,065 6 691,000 23% 2,957,365 97% 2,957,365 97%
Passaic 5,171,068 4 763,193 15% 763,193 15% 1,269,443 25%
Somerset 75,485,976 17 43,641,090 58% 47,891,090 63% 47,891,090 63%
Sussex ‐ 0 ‐ 0% ‐ 0% ‐ 0%
Union 55,768,005 13 29,095,271 52% 5,283,564 9% 33,653,277 60%
Warren 1,139,175 1 ‐ 0% ‐ 0% ‐ 0%
TNJ Region 997,622,168 213 545,837,249 55% 329,827,272 33% 633,855,566 64%
Source: New Jersey Economic Development Authority.

TOGETHER North Jersey Fair Housing & Equity in Northern New Jersey
8-6
Economic Redevelopment and Growth Program 8.2.2
The second component of The Economic Opportunity Act of 2013 was the expansion of the Economic Redevelopment and Growth Program (ERG) so it could provide incentives for capital projects. As with the expanded Grow NJ program, the area in which ERG incentives can be awarded was expanded. The purpose of ERG is to provide incentives for real estate development projects that bridge financing gaps and overcoming shortfalls in cash flow to cover debt service.
The goal of the ERG program is to create economic development opportunities through real estate investment rather than directly through job creation, but ERG shares many of the same benefits as the Grow NJ program. By overcoming financial barriers to real estate development, ERG seeks to assist commercial businesses and residential developments operate in New Jersey, anticipating that permanent and construction jobs will result. The financial incentives seek to induce developers to enter the New Jersey market that may not have been able to beforehand. By only offering investments in targeted zones that have preexisting infrastructure and are in need of investment, NJEDA seeks to promote responsible land use while stimulating capital projects to revitalize cities.
NJEDA invested $531.8 million in 17 projects that were financed by the ERG program between 2008 and 2013, including one project financed under the expanded ERG program of The Economic Opportunity Act of 2013. A majority of NJEDA’s ERG investment was made in high minority places, with 90%, or $481.1 million in incentives, but only 17% of ERG incentives, or $89 million, went to low‐income areas. A large proportion of ERG investment went to Communities of Concern, with 94% of incentives, or $497.8 million of investment made in these areas. The pre‐determined geographic area established by NJEDA for ERG investment may have helped direct ERG incentives to these areas (see Figures 8‐3 and 8‐4, and Table 8‐2).
Figure 8‐3: NJEDA Investment in the Economic Redevelopment and Growth Program, 2008‐2013

TOGETHER North Jersey Fair Housing & Equity in Northern New Jersey
8-7
Figure 8‐4: NJEDA Investment in the Economic Redevelopment and Growth Program 2008 – 2013

TOGETHER North Jersey Fair Housing & Equity in Northern New Jersey
8-8
Table 8‐2: NJEDA Investment in Job Retention and Creation by County, 2008‐2013
County
Total NJEDA ERG Investment
Number of NJEDA ERG Investments
Investment in High Minority Communities
Percent of Total NJEDA ERG Investment in High‐Minority Communities
Investment in Low Income Communities
Percent of Total NJEDA ERG Investment in Low‐Income Communities
Investment in Communities of Concern
Percent of Total NJEDA ERG Investment in Communities of Concern
Bergen 408,771,345 2 408,771,345 100% ‐ 0% 408,771,345 100%
Essex 45,831,269 5 37,472,380 82% 45,831,269 100% 45,831,269 100%
Hudson 30,744,036 3 21,850,987 71% 21,850,987 71% 21,850,987 71%
Hunterdon ‐ ‐ ‐ ‐ ‐ ‐ ‐ ‐
Middlesex ‐ ‐ ‐ ‐ ‐ ‐ ‐ ‐
Monmouth 12,510,631 2 ‐ 0% 8,401,459 67% 8,401,459 67%
Morris 4,109,734 1 ‐ 0% ‐ 0% ‐ 0%
Ocean 3,365,004 1 ‐ 0% ‐ 0% ‐ 0%
Passaic 13,513,000 1 ‐ 0% ‐ 0% ‐ 0%
Somerset 5,000,000 1 5,000,000 100% 5,000,000 100% 5,000,000 100%
Sussex ‐ ‐ ‐ 0% ‐ 0% ‐ 0%
Union 7,961,200 1 7,961,200 100% 7,961,200 100% 7,961,200 100%
Warren ‐ ‐ ‐ ‐ ‐ ‐ ‐ ‐
TNJ Region 531,806,219 17 481,055,912 90% 89,044,915 17% 497,816,260 94%
Source: New Jersey Economic Development Authority.

TOGETHER North Jersey Fair Housing & Equity in Northern New Jersey
8-9
Hazardous Discharge Site Remediation Fund 8.2.3
NJEDA administers the Hazardous Discharge Site Remediation Fund (HDSRF) as part of a partnership between NJEDA and the New Jersey Department of Environmental Protection (NJDEP). The purpose of this program is to provide loans or grants to companies, municipalities, or individuals in New Jersey to incentivize the remediation of contaminated or underutilized sites. NJDEP reviews the applicants pursuing financial incentives to see if the site qualifies for grants based on NJDEP’s list of Known Contaminated Sites and suspected contaminated sites. The financial incentives offered through this program are intended to fund preliminary assessments, investigations about the extent of site contamination, and site remediation and cleanup so that economic potential will return to the sites.
Benefits of NJEDA’s Hazardous Discharge Site Remediation Fund include cleaning up contaminated land and eliminating pollutants that could seep into soil and water supplies. Cleaning up hazardous sites reclaims land that is underutilized and provides opportunities for redevelopment. This provides new economic opportunities for communities with increased economic activity, job opportunities for site cleanup and the redeveloped use of the site, and increased municipal revenue generated by taxes. This renewed economic vitality can help revitalize areas. Externalities of site remediation include environmental pollution from the activities of site cleanup, but the risks of not remediating hazardous sites can outweigh this temporary consequence.
NJEDA reports data on approved HDSRF Investment in the same way that it reports investments for other economic incentive programs, but data on job creation and retention is not collected. HDSRF investments create jobs during site assessment and remediation, but these are not permanent jobs at those sites. There is also no indication of how the site will be used after it had been cleaned up, unless the project has also received other NJEDA investments.
NJEDA invested $84.2 million in the remediation of 260 sites between 2008 and 2013. Of the sites receiving funding for cleanup, 57% were in high minority areas and got $47.7 million in incentives, 48% were in low‐income places and received $40.3 million. Meanwhile, 88% of the funded sites were located in Communities of Concern and received $73.8 million in funding. This indicates that contaminated sites that were eligible to receive funding and were capable of applying for funding were in places characterized not only by high minority rates and low‐income households (see Figures 8‐5 and 8‐6, and Table 8‐3).

TOGETHER North Jersey Fair Housing & Equity in Northern New Jersey
8-10
Figure 8‐5: NJEDA Investment in Site Remediation, 2008‐2013

TOGETHER North Jersey Fair Housing & Equity in Northern New Jersey
8-11
Figure 8‐6: NJEDA Investment in Site Remediation, 2008‐2013

TOGETHER North Jersey Fair Housing & Equity in Northern New Jersey
8-12
Table 8‐3: NJEDA Investment in Site Remediation by County, 2008‐2013
County
Total NJEDA Site Remediation Investment
Number of NJEDA Site Remediation Investments
Investment in High Minority Communities
Percent of Total NJEDA Site Remediation Investment in High‐Minority Communities
Investment in Low Income Communities
Percent of Total NJEDA Site Remediation Investment in Low‐Income Communities
Investment in Communities of Concern
Percent of Total NJEDA Site Remediation Investment in Communities of Concern
Bergen $2,880,988 22 $1,091,383 38% $988,295 34% $1,783,941 62%
Essex $7,395,373 50 $7,070,168 96% $6,958,556 94% $7,070,168 96%
Hudson $14,858,777 19 $13,765,317 93% $7,881,875 53% $14,304,687 96%
Hunterdon $97,771 2 $0 0% $0 0% $0 0%
Middlesex $32,162,307 58 $8,300,648 26% $7,424,427 23% $29,534,777 92%
Monmouth $5,346,293 37 $1,228,609 23% $3,000,970 56% $3,091,945 58%
Morris $754,493 11 $296,466 39% $0 0% $298,522 40%
Ocean $116,579 6 $41,951 36% $79,074 68% $79,074 68%
Passaic $4,850,854 19 $4,169,917 86% $4,169,917 86% $4,487,190 93%
Somerset $10,310,079 11 $8,552,344 83% $8,552,344 83% $8,679,695 84%
Sussex $66,003 2 $0 0% $0 0% $0 0%
Union $4,571,909 21 $3,167,984 69% $1,219,542 27% $4,476,099 98%
Warren $758,583 2 $0 0% $0 0% $0 0%
TNJ Region $84,170,009 260 $47,684,787 57% $40,275,000 48% $73,806,098 88%

TOGETHER North Jersey Fair Housing & Equity in Northern New Jersey
8-13
8.3 Transportation
The North Jersey Transportation Planning Authority (NJTPA) is the federally mandated Metropolitan Planning Organization in the TNJ region that oversees the performance of the region’s transportation system. NJTPA invests in transportation improvement projects every year in order to implement its goals of protecting and improving the natural ecosystems and the human environment, providing affordable, accessible, and safe transportation options that meet current and future demands, retain and increase economic competitiveness, enhance intermodal connectivity, and coordinate land use with transportation systems that are in a state of good repair.
NJTPA transportation projects are funded through a variety of Federal and State funding streams that are designated for specific uses. NJTPA prepares a Transportation Improvement Program (TIP) that allocates State and Federal investment into capital transportation projects that must align with NJTPA’s long range Regional Transportation Plan (RTP), Plan 2040.
NJTPA projects are organized into Capital Investment Strategy (CIS) categories that address specific needs. CIS categories include Airport Assets, Bridge Assets, Capital Program Delivery, Congestion Relief, Local System Support, Mass Transit Assets, Multimodal Programs, Road Assets, Safety Management, and Transportation Support Facilities. It is difficult to directly connect a benefit to certain types of transportation improvements because the location of improvements, such as congestion relief or bridge renovation, can provide benefits to people who use the improved infrastructure but live in other places while neighboring residents may have to bear the consequences (e.g., air pollution, noise, traffic, etc.) that can come with some transportation improvements. However, there are CIS categories where the benefit of the transportation improvement can be traced to the location where the improvement is being made. These categories are Mass Transit Assets, Multimodal Programs, and Safety Management.
NJTPA maintains a digital catalogue of its TIP projects in several databases that represent different information about completed and planned transportation investments. There is a database of TIP projects and their funding sources, a database for TIP projects with their description and CIS category, and a database with TIP projects that is geo‐referenced. Each of these datasets has an uneven amount of information that does not correspond to the other datasets. This limits the NJTPA projects that can be analyzed in order to see where transportation investments are being made because a lot of data is lost when it is connected to geographic layers.
Mass Transit Assets 8.3.1
NJTPA projects classified under the Mass Transit Assets CIS category consist of funding for a variety of public transit initiatives, including building new mass transit infrastructure, the expansion of existing mass transit infrastructure, and the construction of intermodal facilities to support public transit systems. Investment in mass transit infrastructure provides benefits for the TNJ region as a whole, by building new connections between places where people work and places where people live. Investing in mass transit improves the region’s transportation infrastructure, providing alternate transportation options to automobile traffic with the purpose of attracting more riders, taking cars off roads, reducing automobile congestions, and improving air quality with pollution reduction. These region‐wide benefits are felt at the local level, where residents that live near mass transit improvements have the best connectivity to improved infrastructure and affordable transportation that can connect them to work, education, and cultural opportunities. However, the construction of transportation facilities is

TOGETHER North Jersey Fair Housing & Equity in Northern New Jersey
8-14
accompanied by pollution from construction and increased traffic from new transit users, so the installation of upgraded transportation facilities is not without near‐term drawbacks.
NJTPA’s TIP program planned for 19 Mass Transit Asset investments in the TNJ region from 2004‐2012. Due to the physical nature of these investments, mass transit improvements were made in 151 census blocks. Of the census blocks receiving these infrastructure investments, 62% were high minority communities, 50% were low‐income communities, and 72% were Communities of Concern (see Figures 8‐7 and 8‐8 and Table 8‐4).
Figure 8‐7: NJTPA Investment in Mass Transit Assets, 2004‐2012

TOGETHER North Jersey Fair Housing & Equity in Northern New Jersey
8-15
Figure 8‐8: NJTPA Investment in Mass Transit Assets, 2004‐2012

TOGETHER North Jersey Fair Housing & Equity in Northern New Jersey
8-16
Table 8‐4: NJTPA Investment in Mass Transit Assets by County, 2004‐2012
County
Census Blocks Receiving Investment
High Minority Communities Receiving Investment
Percent of High‐Minority Census Blocks Receiving Investment
Low Income Communities Receiving Investment
Percent of Low‐Income Census Blocks Receiving Investment
Communities of Concern Receiving Investment
Percent of Communities of Concern Census Blocks Receiving Investment
Bergen 2 2 100% 1 50% 2 100%
Essex 24 24 100% 24 100% 24 100%
Hudson 86 62 72% 47 55% 71 83%
Hunterdon 0 0 0% 0 0% 0 0%
Middlesex 7 5 71% 3 43% 7 100%
Monmouth 5 0 0% 1 20% 4 80%
Morris 3 1 33% 0 0% 1 33%
Ocean 0 0 0% 0 0% 0 0%
Passaic 0 0 0% 0 0% 0 0%
Somerset 0 0 0% 0 0% 0 0%
Sussex 17 0 0% 0 0% 0 0%
Union 0 0 0% 0 0% 0 0%
Warren 7 0 0% 0 0% 0 0%
TNJ Region 151 94 62% 76 50% 109 72%

TOGETHER North Jersey Fair Housing & Equity in Northern New Jersey
8-17
Multimodal Programs 8.3.2
NJTPA’s Multimodal programs are geared towards providing improvements for alternate modes of transportation, such as pedestrian, bicycle, and light rail, along with enhancing the connections between modes. The benefits of NJTPA’s Multimodal Program investments primarily occur at the local level, where infrastructure for parks, sidewalks, pedestrian bridges, and bicycle lanes are made. The primary users of these active transportation amenities are the people who live in the neighborhoods where the investments are made.
Through its multimodal transportation programs, NJTPA supports alternate transportation modes to connect workers and residents to places of work, education, and other destinations. This provides people with affordable options to the single‐occupancy vehicle which address traffic congestion and air quality and foster community quality‐of‐life and more active transport modes. The negative externalities of these options differ by mode, but can include construction disturbances and, depending on design and traffic controls, potentially greater risk as a pedestrian or cyclist to auto traffic,
There were 56 Multimodal Programs planned by NJTPA in the TNJ region between 2004 and 2012. These investments occurred in 274 census blocks. The majority of these investments did not occur in census blocks with high rates of high minority households and low‐income households, as only 42% of those census blocks received Multimodal Program investment. Of the census block groups receiving multimodal infrastructure improvement projects, 60% were in Communities of Concern (see Figures 8‐9 and 8‐10, and Table 8‐5).
Figure 8‐9: NJTPA Investment in Multimodal Programs, 2004‐2012

TOGETHER North Jersey Fair Housing & Equity in Northern New Jersey
8-18
Figure 8‐10: NJTPA Investment in Multimodal Programs, 2004‐2012

TOGETHER North Jersey Fair Housing & Equity in Northern New Jersey
19
Table 8‐4: NJTPA Investment in Multimodal Programs by County, 2004‐2012
County
Census Blocks Receiving Investment
High Minority Communities Receiving Investment
Percent ofHigh‐Minority Census Blocks Receiving Investment
Low Income Communities Receiving Investment
Percent of Low‐Income Census Blocks Receiving Investment
Communities of Concern Receiving Investment
Percent of Communities of Concern Census Blocks Receiving Investment
Bergen 30 18 60% 18 60% 22 73%
Essex 21 11 52% 11 52% 13 62%
Hudson 56 30 54% 30 54% 35 63%
Hunterdon 15 0 0% 0 0% 2 0%
Middlesex 15 12 80% 12 80% 15 100%
Monmouth 23 0 0% 0 0% 13 57%
Morris 31 12 39% 12 39% 13 42%
Ocean 16 1 0% 1 0% 3 0%
Passaic 9 0 0% 0 0% 3 0%
Somerset 29 17 0% 17 0% 23 0%
Sussex 0 0 0% 0 0% 0 0%
Union 29 14 0% 14 0% 22 0%
Warren 0 0 0% 0 0% 0 0%
TNJ Region 274 115 42% 115 42% 164 60%

TOGETHER North Jersey Fair Housing & Equity in Northern New Jersey
8-20
Safety 8.3.3
The Safety Management CIS category includes planned projects that improve the safety of travelers in locations where there are safety concerns or a high occurrence of accidents. The projects in this category include intersection improvements, ramp improvements, median crossover protection, sidewalk enhancements, and rock fall mitigation. The benefits of safety improvements primarily affect the communities where they are being made and the persons who most often use the transportation infrastructure. These improved safety measures can prevent injury and loss of life, reduce the cost of physical damage, and improve the overall quality of life of the places where the improvements are made. These safety improvements may cause temporary construction impact to affected communities, but the long‐term benefits tend to outweigh any short‐term inconveniences.
NJTPA planned for 29 Safety Management projects between 2004 and 2012 in the TNJ region. These 29 projects produced safety improvements in 76 census blocks. Of the census blocks receiving these Safety Management improvements, 43% were high minority communities, 17% were low‐income communities, and 54% were Communities of Concern. This indicates that many of the Safety Management improvements were made in communities not characterized by these factors (see Figures 8‐11 and 8‐12, and Table 8‐6).
Figure 8‐11: NJTPA Investment in Safety Management, 2004‐2012

TOGETHER North Jersey Fair Housing & Equity in Northern New Jersey
8-21
Figure 8‐12: NJTPA Investment in Safety Management, 2004‐2012

TOGETHER North Jersey Fair Housing & Equity in Northern New Jersey
8-22
Table 8‐5: NJTPA Investment in Safety Management by County, 2004‐2012
County
Census Blocks Receiving Investment
High Minority Communities Receiving Investment
Percent of High‐MinorityCensus Blocks Receiving Investment
Low Income Communities Receiving Investment
Percent of Low‐Income Census Blocks Receiving Investment
Communities of Concern Receiving Investment
Percent of Communities of Concern Census Blocks Receiving Investment
Bergen 9 7 78% 3 33% 9 100%
Essex 7 4 57% 2 29% 5 71%
Hudson 1 0 0% 1 100% 1 100%
Hunterdon 1 0 0% 0 0% 0 0%
Middlesex 0 0 0% 0 0% 0 0%
Monmouth 9 1 11% 0 0% 1 11%
Morris 11 4 36% 1 9% 5 45%
Ocean 3 0 0% 0 0% 0 0%
Passaic 0 0 0% 0 0% 0 0%
Somerset 12 6 0% 1 0% 6 0%
Sussex 3 0 0% 0 0% 0 0%
Union 18 11 0% 5 0% 14 0%
Warren 2 0 0% 0 0% 0 0%
TNJ Region 76 33 43% 13 17% 41 54%

TOGETHER North Jersey Fair Housing & Equity in Northern New Jersey
8-23
8.4 Safe Routes to School
Safe Routes to Schools programs and projects are designed to encourage children to walk and ride their bicycles to schools. Providing safe options for children to get to school safely by means other than the automobile and the school bus is an important strategy for protecting the health and safety of communities as well as safeguarding our children. The National Safe Routes to School program provides funding for infrastructure, education, and law enforcement, community engagement and program evaluation projects that improve the safety of students travelling to school.
Safe Routes to School projects can upgrade walking and biking infrastructure, educate students, parents, and communities on safe walking and biking practices, encourage walking and biking, and enforce safety for pedestrians and cyclists. Capital improvement projects that improve sidewalks and street crossings or add streetlights and bike lanes also help improve the overall quality and safety of neighborhoods. By providing these amenities, Safe Routes to School programs give access to entire communities for the use of safer neighborhood infrastructure. This is especially important in places that have limited access to open space or have high rates of obesity and related health concerns because these amenities give residents, especially school‐aged children the opportunity to be active and instill active habits at an early age. These infrastructure improvements help raise property values with improved safety and enhanced neighborhood amenities. Safe Routes to School infrastructure projects give the option for students to travel to school by walking or biking, thus reducing the amount of car travel and congestion around schools and neighborhoods and improving air quality in these places. Safe Routes to School Infrastructure can provide the foundation for further investment in neighborhood improvements outside the immediate school area radius.
The National Safe Routes to School program is funded through The Safe, Accountable, Flexible, Efficient Transportation Equity Act – A Legacy for Users (SAFETEA‐LU) for infrastructure, education, and law enforcement projects that improve the safety of students travelling to school. The Federal Highway Administration allocated Federal‐aid highway funds to each state Department of Transportation based on a formula in the SAFETEA‐LU legislation. This formula allocates funding based on each state’s proportion of enrolled students. The program is funded at $978 million from fiscal years 2005 to 2011. The New Jersey Department of Transportation (NJDOT) received $31,294,169 million in Safe Routes To School funding during this time period.
After fiscal year 2011, when The Moving Ahead for Progress in the 21st Century Act (MAP‐21) was passed, there was no more dedicated funding for Safe Routes to School. Funding is still available through the Transportation Alternatives Program and NJDOT still solicits Safe Routes to School applications and provides grants.
NJDOT administered the Safe Routes to School program by soliciting applications for both infrastructure and non‐infrastructure projects. Applicants could be schools, school districts, municipal governments, county governments, local public agencies, or the state. A prerequisite for receiving funding is that applicants must be able to advance the funds for the Safe Routes to School project. The money awarded by NJDOT is reimbursed to the applicant. However, there is no requirement that applicants provide matching funding to the Safe Routes to School grant.
Between 2008 to 2011, fifty‐five local Safe Routes to School grants were awarded to schools in the TNJ region for both infrastructure and non‐infrastructure projects. These grants equaled $6,802,100 distributed among 115 schools. Some schools were awarded multiple grants, which were directed

TOGETHER North Jersey Fair Housing & Equity in Northern New Jersey
8-24
towards infrastructure improvement, education, and safety enforcement to fully integrate Safe Routes to School projects into school communities and neighborhood fabrics by providing education and enforcement to support infrastructure improvements. 148
Safe Routes to School Grants were not evenly distributed between high minority and non‐high minority communities. A lower proportion of schools in high minority communities received Safe Routes to School grants. Of the 115 schools receiving grants, 37 were in high‐minority communities, representing 32 percent of grant recipients.
The distribution of Safe Routes to School Grants was more proportional between low income and non‐low income communities. Of the 115 schools receiving grants, 47 were in low‐income communities, representing 41 percent of grant recipients.
In contrast, more schools receiving grants were located in Communities of Concern than non‐communities of concern. Of the 115 grant recipient schools, 68 were in communities of concern. This is equal to 59 percent of the grant recipients. 149
The distribution of Safe Routes to School investment among these different places is working towards removing impediments to school access and ameliorating neighborhood safety conditions in many communities with different characteristics. Although the requirement to put together a financial plan for Safe Routes to School projects and have the ability to advance the funds is a good way to advance planning, safety programs, and implementation, some communities and school districts do not have much capacity to apply for funding and receive grants for projects.
Of the schools receiving Safe Routes to School grants, 46 were in places with high levels of carless households. This equals forty percent of all the schools receiving aid through this program. All of these schools were also in Communities of Concern. This shows that the distribution of Safe Routes to School grants is working towards improving access to schools and opportunities, especially in places where alternate transportation programs are useful (see Figures 8‐13 and 8‐14, and Table 8‐7).
148 Data on Safe Routes to School grants does not break down how much money was awarded to each school for multi‐school award recipients. This analysis examines the geographic distribution of schools that received local Safe Routes to Schools grants. Statewide grants are not included because their spatial benefit is shared by New Jersey as a whole and not directed to a defined geographic area. Based on availability, Safe Routes to School grants for the 2008‐2011 period were examined.
149 This difference can occur because a Community of Concern can be a place that has two or more of the following characteristics: high minority, low income, female head of household, carless household, low English proficiency household, and elderly household. Schools that received funding in Communities of Concern were in places that had characteristics that were not only high minority and low income households.

TOGETHER North Jersey Fair Housing & Equity in Northern New Jersey
8-25
Figure 8‐13: NJDOT Investment in Safe Routes to School, 2008‐2011

TOGETHER North Jersey Fair Housing & Equity in Northern New Jersey
8-26
Figure 8‐14: NJDOT Investment in Safe Routes to School, 2008‐2011

TOGETHER North Jersey Fair Housing & Equity in Northern New Jersey
8-27
Table 8‐6: NJDOT Investment in Safe Routes to School by County, 2008‐2011
County
Total Schools Receiving Grants
Schools in High Minority Communities
Percent of Schools Receiving Grants in High‐Minority Communities
Schools in Low Income Communities
Percent of Schools Receiving Grants in Low‐Income Communities
Schools in Communities of Concern
Percent of Schools Receiving Grants in Communities of Concern
Bergen 22 7 32% 4 18% 9 41%
Essex 29 19 66% 20 69% 25 86%
Hudson 13 4 31% 12 92% 13 100%
Hunterdon 10 1 10% 1 10% 2 20%
Middlesex 10 5 50% 5 50% 9 90%
Monmouth 5 0 0% 0 0% 2 40%
Morris 4 1 25% 1 25% 2 50%
Ocean 3 0 0% 1 33% 1 33%
Passaic 5 0 0% 0 0% 0 0%
Somerset 2 0 0% 0 0% 0 0%
Sussex 1 0 0% 1 100% 1 100%
Union 5 0 0% 2 40% 3 60%
Warren 6 0 0% 0 0% 1 17%
TNJ Region 115 37 32% 47 41% 68 59%

TOGETHER North Jersey Fair Housing & Equity in Northern New Jersey
8-28
8.5 Utilities
Pay for Performance 8.5.1
The New Jersey Board of Public Utilities (NJBPU) is a state agency charged with overseeing the safe, adequate, and proper use of New Jersey’s utility services such as natural gas, electricity, water, and telecommunications. As part of its oversight, NJBPU is responsible for implementing the goals and objectives of New Jersey’s Energy Master Plan. The primary goals of the New Jersey Energy Master Plan include reducing energy costs, promoting a diverse portfolio of clean energy sources, rewarding energy efficiency and energy conservation, capitalizing on new technologies for energy production, and supporting a renewable energy portfolio.
NJBPU is working to achieve these goals through financial incentive programs like the Pay for Performance program. This program offers financial incentives for making upgrades to existing and new construction buildings that promote energy efficiency and reduce peak electricity demand. The program offers three financial incentives per approved project; the first incentive is based on the size of the facility and the other two incentives are dependent on energy savings.
NJ BPU’s Pay for Performance program seeks to increase the energy efficiency and sustainability of buildings in New Jersey. By providing financing incentives for upgrading energy systems, buildings become more suited to handling the high‐energy demands of New Jersey’s changing economy. Supporting the implementation of cleaner energy systems helps preserve New Jersey’s resources and reduces pollution. It also fosters innovation in energy efficiency and creates jobs for people who build and install more energy efficient systems. Pollution can result from upgrading building facilities, but the longer‐term benefits of this program outweigh the short term construction inconveniences.
NJBPU has made 122 investments in Pay for Performance upgrades equaling $14.9 million. Of the energy performance upgrade investments made, 66%, or $9.8 million occurred in high‐minority communities, 44% or $6.6 million went to low‐income communities, and 86% or $12.9 million was allocated to Communities of Concern which also include places with high rates of low English proficiency, carless households, and female head of households (see Figures 8‐15 and 8‐16, and Table 8‐8).

TOGETHER North Jersey Fair Housing & Equity in Northern New Jersey
8-29
Figure 8‐15: NJBPU Investment in Pay for Performance

TOGETHER North Jersey Fair Housing & Equity in Northern New Jersey
8-30
Figure 8‐16: NJBPU Investment in Pay for Performance, 2010‐2013

TOGETHER North Jersey Fair Housing & Equity in Northern New Jersey
8-31
Table 8‐7: NJBPU Investment in Pay for Performance by County
County
Total BPU Investment in Pay For Performance
Number of BPU Investments
Investment in High Minority Communities
Percent of Total BPU Investment
Investment in Low Income Communities
Percent of Total BPU Investment
Investment in Communities of Concern
Percent of Total BPU Investment
Bergen $1,137,919 16 $688,366 60% $276,266 24% $781,236 69%
Essex $1,866,313 17 $1,603,219 86% $1,603,219 86% $1,657,182 89%
Hudson $1,554,363 13 $1,513,445 97% $1,462,049 94% $1,513,445 97%
Hunterdon $28,027 2 $0 0% $0 0% $0 0%
Middlesex $3,861,805 21 $2,688,942 70% $1,148,043 30% $3,757,108 97%
Monmouth $204,916 6 $83,261 41% $0 0% $157,402 77%
Morris $2,391,532 10 $1,020,267 43% $0 0% $1,990,599 83%
Ocean $757,963 8 $0 0% $619,823 82% $619,823 82%
Passaic $165,619 6 $110,599 67% $110,599 67% $110,599 67%
Somerset $422,525 6 $0 0% $0 0% $45,959 11%
Sussex $186,079 2 $0 0% $0 0% $0 0%
Union $2,301,161 11 $2,114,864 92% $1,328,778 58% $2,197,200 95%
Warren $24,912 4 $0 0% $24,912 100% $24,912 100%
TNJ Region $14,903,135 122 $9,822,961 66% $6,573,689 44% $12,855,464 86%

TOGETHER North Jersey Fair Housing & Equity in Northern New Jersey
8-32
8.6 Arts
The New Jersey State Council on the Arts (NJSCA), a state agency that provides financial support to artists, arts organizations, and art‐related projects in New Jersey, was established in 1966. The NJSCA is funded by direct annual appropriations from the State of New Jersey – through dedicated revenues generated from the state’s Hotel/Motel Occupancy Fee ‐‐ and by grants from the National Endowment for the Arts. Currently, the agency receives a minimum of $16 million, appropriated annually, with 22.68% of revenue from the occupancy fee reserved for the NJSCA.
The purpose of the NJSCA is to improve the quality of life of New Jersey residents by creating opportunities to advance the arts. Arts investment from the NJSCA is intended to help establish financially successful and accessible arts organizations, support a community of artists, promote public participation in the arts, maintain a network of people and businesses that supports the arts, create high quality arts education, and incorporate arts and culture into economic development strategies for New Jersey.
Investing in arts and culture provides many benefits to New Jersey beyond cultivating a strong cultural heritage in the State. In addition to creating jobs for artists and people working in art establishments, arts investment also promotes economic investment and jobs in other sectors by attracting people to cities and arts events. Arts projects can be used to generate revitalization in struggling areas and promote sustainability through creative approaches to redevelopment. Access to the arts provides educational opportunities for residents, especially the school‐aged population, to develop new skills, think innovatively, and prepare residents for a changing workforce. Arts and culture investment helps bring together communities while preserving a community’s legacy and promoting the physical, mental, and emotional wellbeing of residents.
The NJSCA distributes investment in the arts and arts related projects through an annual competitive grant process. Each year the NJSCA accepts applications from arts organizations, artists, arts education programs, and community arts programs for funding. All applications are evaluated and ranked by peer panels that specialize in the focus area of the applicant before being assessed by the NJSCA. Then, the NJSCA awards grants to projects whose goals align with the mission of the NJSCA. For each awards cycle, the NJSCA provides a list of grantees and the amount of financial aid that they received. The NJSCA does not provide a list of all applicants, so there is no data to determine where investment is allocated among the pool of projects seeking arts investment.
Between 2011 and 2014, the NJSCA awarded over $36.7 million in arts investment to 132 unique projects in the thirteen‐county Together North Jersey region. This funding accounts for investment in arts organizations, arts education programs, and community arts programs. Many of the grantees received awards in multiple years. It does not include investment in folk artists, which is a relatively minor proportion of the total investment. Grants awarded to individual artists cannot be mapped because there is no way to ensure that the impact of investment in those artists will go to their communities (see Figures 8‐17 and 8‐18, and Table 8‐9).
The majority of NJSCA investment was distributed in places that have a high minority population, a majority low‐income population, or a community of concern. $23.2 million, or 63% of total arts investment was awarded to high minority areas and $22.8 million, or 62% of arts investment was awarded to low‐income areas. Meanwhile, $27.4 million, or 75% of arts investment was directed towards communities of concern. Of the money distributed in communities of concern, only 57% were

TOGETHER North Jersey Fair Housing & Equity in Northern New Jersey
8-33
high minority, low‐income, and communities of concern. This means that other factors that determine communities of concern, like places with high levels of female head of households, carless household, or low English proficiency are being awarded arts investment. The high proportion of investment that is directed at high minority areas, low‐income areas, and communities of concern aligns with the intention of the NJSCA to promote economic opportunities through arts and culture investment. The NJSCA helps promote arts development and economic revitalization, land use redevelopment, job opportunities, and access to education in places that have low access to these opportunities.
Figure 8‐17: NJSCA Investment in Arts, 2011 ‐ 2014

TOGETHER North Jersey Fair Housing & Equity in Northern New Jersey
8-34
Figure 8‐18: NJSCA Investment in Arts, 2011 ‐ 2014

TOGETHER North Jersey Fair Housing & Equity in Northern New Jersey
8-35
Table 8‐8: NJSCA Investment in Arts by County, 2011 – 2014
County Total NJCA Investment
Number of NJCA Investments
Investment in High Minority Communities
Percent of Total NJCA Investment
Investment in Low Income Communities
Percent of Total NJCA Investment
Investment in Communities of Concern
Percent of Total NJCA Investment
Bergen 2,558,183 15 1,600,052 63% 1,790,448 70% 1,977,128 77%
Essex 19,628,403 36 13,877,677 71% 13,893,351 71% 15,100,377 77%
Hudson 844,162 7 844,162 100% 615,298 73% 844,162 100%
Hunterdon 731,481 6 ‐ 0% 292,357 40% 292,357 40%
Middlesex 4,159,374 11 3,606,492 87% 4,159,374 100% 4,159,374 100%
Monmouth 2,048,134 10 1,663,903 81% 245,361 12% 1,794,192 88%
Morris 2,496,031 8 455,642 18% ‐ 0% 1,078,037 43%
Ocean 1,080,861 7 ‐ 0% 583,742 54% 583,742 54%
Passaic 516,430 4 352,650 68% 352,650 68% 352,650 68%
Somerset 520,417 8 ‐ 0% ‐ 0% ‐ 0%
Sussex 428,461 3 ‐ 0% 189,239 0% 189,239 0%
Union 1,482,839 15 816,871 55% 636,608 43% 1,037,730 70%
Warren 240,153 2 ‐ 0% ‐ 0% ‐ 0%
TNJ Region 36,734,929 132 23,217,449 63% 22,758,428 62% 27,408,988 75%

TOGETHER North Jersey Fair Housing & Equity in Northern New Jersey
8-36
8.7 Recommendations
There are many programs within the TNJ region that provide public investment for the region’s residents and businesses that can be targeted to improve access to economic, educational, and quality of life opportunities. As the demographic and economic dynamics of the region change, with increases in disparity, limited connections to economic opportunities, and growing concern about resiliency and quality of life, it is vital to track where public infrastructure investments are being made. By knowing where public funds are being spent and for what physical infrastructure improvements, the TNJ region can plan for a strong regional economy with great places, a protected environment, and equitable access to opportunity for all.
Good information and data are the key to creating a strong foundation of knowledge about where public investment is being made in physical infrastructure. To foster greater transparency, it is imperative that agencies keep good and complete records of the projects being financed. The record keeping system should be continuously maintained so that there are no gaps in the data and there should be seamless integration of different dimensions of project information, like project description, funding source, and geographic location so data is not lost or underrepresented. In this day and age, there is no good reason why data should not be stored in a digital format that can be mapped and easily analyzed. These good practices should be integral to all of the public investment programs in the TNJ region.
In addition to maintaining quality data on capital improvements and investments, it is also important to identify what other performance metrics can and should be collected alongside program dollars and project totals. For example, collecting information on job creation may not be relevant to transportation or Safe Routes to Schools programs, but it is important to have a better breakdown of where public funds are spent and on what types of projects.
There is also more information that could be collected to identify if public investments are creating the connections between people and infrastructure improvements. For programs dealing with job creation, more detailed data could be collected on the types of jobs being created and the educational requirements and skills development required in these occupations. Comparing this with the educational attainment of TNJ communities would show where people live for the job opportunities being created. For site remediation programs, a connection could be made between NJEDA’s records on the sites being remediated with NJDEP’s catalogue of known and suspected contaminated sites. By integrating this data, it would be possible to see what places are receiving potential economic opportunities and an improved quality of life from site cleanup.
Another element that should be incorporated into the records of these public investment programs is time‐series data that monitors public investments for a set time period after they are made. This may not be applicable for all public investment programs, but it is information that would help show the long‐term effect of public investments, in light of the short‐term negative externalities of infrastructure investment. This could show how long certain transportation operations are in effect, how long a business that received financial incentives remains open, or whether a polluted site is fully remediated.
Many of the public investment programs in the TNJ region provide complementary benefits. Site remediation, job retention incentives, mass transit and safety enhancements, Safe Routes to School, and arts investment all work together to create better economic, educational, and quality of life opportunities for the region. However, the prioritization and funding of these exemplar programs are

TOGETHER North Jersey Fair Housing & Equity in Northern New Jersey
8-37
invariably made in isolation. It would help public investment decision making to align public investment data between the different programs and funding sources so that there is a big picture view of where public investment is being made and how the different investments interact. For this to work, the investments should be geo‐referenced and mapped so the geographical relationship between investments can be identified.

TOGETHER North Jersey Fair Housing & Equity in Northern New Jersey
9-1
What is Fair Housing? The Federal Fair Housing Act of 1968 (as amended) prohibits discrimination in the sale, rental, and financing of dwellings, and in other housing‐related transactions, based on race, color, national origin, religion, sex, familial status, and disability.
“Fair housing” is not directly defined in Federal or New Jersey law, but inferentially is described in Federal law as the opportunity for every person to buy, rent or obtain a mortgage for housing without being unlawfully discriminated against because of their background. In New Jersey, fair housing comprises enforcement of Federal law, programs supporting the construction of fair housing, and a requirement that municipalities provide opportunities for the construction and rehabilitation of housing for households of low and moderate income.
9 Assessment of Fair Housing Issues
9.1 Introduction
This chapter of the FHEA describes Federal and State laws addressing barriers to fair housing, and assesses how the TNJ region may be faring in complying with these laws.
This chapter is based on primary (e.g., interviews, focus groups, workshops) and secondary data sources (e.g., literature review, volume and kind of complaints). Collection of available data and evidence, and interviews and discussions with public and private institutions, organizations, and advocacy networks were part of this process for benchmarking fair housing compliance within the region and for assessing the capacity of the region to deliver fair housing solutions.
9.2 Federal Efforts to Address Barriers to Fair
Housing
Congress and the Executive branch have established a number of statutory provisions, Executive Orders, and programs, and regulations to ensure fair housing opportunities nationwide.
Federal Statutes 9.2.1
There is a long history of Federal statutes addressing fair housing issues are primarily, but not exclusively, based on civil rights principles. This section describes these statutes in chronological order.
Section 1978 of the Revised Statutes (1871) 9.2.1.1
This Federal law (42 U.S.C. 1982) enacted on April 20, 1871 as part of the Civil Rights Act of 1871, gives all citizens of the United States, regardless of race, the same rights in every state and territory to inherit, purchase, lease, sell, hold, and convey real and personal property. One of the original primary purposes of this law was to provide a civil remedy against abuses that were being committed in southern states, especially by the Ku Klux Klan. While existing law protected all citizens in theory, its protection in practice was unavailable to some because those persons charged with the enforcement of the laws were unable or unwilling to do so. The Act was therefore intended to provide a private remedy for such violations of federal law, and has subsequently been interpreted to create a species of tort liability.
National Housing Act of 1934 9.2.1.2
The National Housing Act of 1934 was part of the New Deal passed during the Great Depression to make housing and home mortgages more affordable and to stop the prevalence of bank foreclosures on family homes. It created the Federal Housing Administration (FHA), the Federal Savings and Loan Insurance Corporation, and the United States Housing Authority, the latter to make low‐interest, long‐term loans to local public agencies for slum clearance and construction of low‐income dwellings. Section

TOGETHER North Jersey Fair Housing & Equity in Northern New Jersey
9-2
527 of this Federal law150 prohibits discrimination on the basis of sex in any federally related mortgage loan, or federal insurance, guaranty, or other assistance in connection therewith.
Housing Act of 1949 9.2.1.3
Part of President Truman's “Fair Deal” program of domestic legislation, the Housing Act of 1949151 expanded the federal role in mortgage insurance and issuance and the construction of public housing. Title II authorized federal funds to build more than 800,000 public housing units through new local public housing authorities, in response to a U.S. Supreme Court decision requiring the federal government to relinquish its direct role in providing public housing. Section 515 established the Rural Rental Housing program in the United States Department of Agriculture, authorized to make loans to provide rental housing for low‐ and moderate‐income families in rural areas. Section 515 loans may also be used for congregate housing for the elderly and handicapped. Loans under the Section 515 program are made to projects and tenants, to individuals, corporations, associations, trusts, partnerships, or public agencies for housing within designated rural municipalities in New Jersey.
Small Business Act of 1953 9.2.1.4
Section 8(a) of this Federal law152 established and authorized the Small Business Administration (SBA) to enter into contracts with other federal agencies. The SBA then subcontracts the actual performance of the work to small businesses owned and controlled by socially and economically disadvantaged individuals. Through a memorandum of understanding, SBA delegated the authority to HUD to contract directly with 8(a) firms.153
Civil Rights Act of 1964 9.2.1.5
Title VI of this landmark Federal law prohibits discrimination on the basis of race, color, or national origin in programs and activities receiving federal financial assistance.154
U.S. Fair Housing Act of 1968 9.2.1.6
The Fair Housing Act, also known as Title VIII of the Civil Rights Act of 1968, is a Federal law that prohibits discrimination on the basis of race, color, national origin, religion, sex, familial status, or disability in the sale, rental, and financing of dwellings and in certain other housing‐related transactions. The Fair Housing Act also makes it unlawful to coerce, threaten, intimidate, or interfere with any person for exercising or enjoying their fair housing rights or encouraging or aiding others in the exercise or enjoyment of their fair housing rights.155
150 48 Stat. 1246
151 Title V of P.L. 81‐171
152 Section 8(a) of this 1953 Federal law (PL 85‐536 as amended in 2013 by 112‐239)
153 http://www.sba.gov/sites/default/files/files/Small%20Business%20Act.pdf
154 http://www.usdoj.gov/crt/grants_statutes/titlevi.txt
155 http://www.justice.gov/crt//about/hce/title8.php

TOGETHER North Jersey Fair Housing & Equity in Northern New Jersey
9-3
Housing and Urban Development Act of 1968 9.2.1.1
Section 3 of this Federal law (P.L. 90‐448, 82 Stat. 476) enacted August 1, 1968 requires that employment and other economic opportunities generated by certain HUD financial assistance shall, to the greatest extent feasible, be directed to low‐ and very low‐income persons, particularly those who are recipients of government assistance for housing, and to business concerns that provide economic opportunities to low‐ and very low‐income persons.156
Architectural Barriers Act of 1968 9.2.1.2
This Federal law requires that buildings and facilities designed, constructed, altered, or leased with certain federal funds after September 1969 be accessible to and usable by persons with disabilities.157
Education Amendments Act of 1972 9.2.1.3
While Title IX of this Federal law is far better known as it prohibits discrimination on the basis of sex in education programs or activities that receive federal financial assistance, a far more controversial provision, Section 803, placed a temporary moratorium on court‐ordered busing programs promoting desegregation of schools, a provision that was invalidated within three months of passage.158
Rehabilitation Act of 1973 9.2.1.4
Section 504 of this Federal law prohibits discrimination on the basis of disability in any program or activity receiving federal financial assistance.159 It does not apply to private housing stock that may be rehabilitated.
Equal Credit Opportunity Act of 1974 9.2.1.5
This Federal law prohibits any creditor from discriminating against any applicant with respect to any aspect of a credit transaction on the following bases: race, color, religion, national origin, sex, marital status, or age (provided that the applicant has the capacity to contract); because all or part of the applicant’s income derives from any public assistance program; or because the applicant has exercised any right under the Consumer Credit Protection Act.160
Housing and Community Development Act of 1974 9.2.1.6
The Housing and Community Development Act of 1974, (12 U.S.C. 1706e), among other provisions, amended the Housing Act of 1937 to create Section 8 housing, authorized "Entitlement Communities Grants" to be awarded by the U.S. HUD, created the National Institute of Building Sciences, and created (under Section 810) the first federal Urban Homesteading program. Section 109 prohibits discrimination on the basis of race, color, national origin, sex, or religion in programs and activities receiving financial assistance under Title I of the Act, including the Community Development Block Grant program, Urban
156 http://portal.hud.gov/hudportal/documents/huddoc?id=11secfaqs.pdf
157 http://www.access‐board.gov/the‐board/laws/architectural‐barriers‐act‐aba
158 http://title‐ix.blogspot.com/2012/06/look‐back‐at‐education‐amendments‐act.html
159 http://portal.hud.gov/hudportal/HUD?src=/program_offices/fair_housing_equal_opp/disabilities/504keys
160 http://www.fdic.gov/regulations/compliance/manual/pdf/V‐7.1.pdf

TOGETHER North Jersey Fair Housing & Equity in Northern New Jersey
9-4
Development Action Grants, Economic Development Initiative Grants, Special Purpose Grants, and the Section 108 Loan Guarantee program.
While Section 109 does not include discrimination based on age or disability on the list of prohibited bases, the statute makes applicable to these programs the prohibitions against discrimination on the basis of age found in the Age Discrimination Act of 1975 and the prohibitions against discrimination on the basis of disability found in Section 504 of the Rehabilitation Act of 1973. On December 30, 2005, Section 109 was amended by the Support our Scouts Act. The Support our Scouts Act prohibits states or units of general local government that receive assistance under Title I of the Housing and Community Development Act and have designated open forums, limited public forums, or nonpublic forums, from discriminating against or denying equal access to any youth organization, including the Boy Scouts of America, that wishes to conduct a meeting or otherwise participate in any of the aforementioned forums.161
Home Mortgage Disclosure Act of 1975 9.2.1.7
The Home Mortgage Disclosure Act (HMDA)162 was enacted by Congress in 1975 and was originally implemented by the Federal Reserve Board's Regulation C. On July 21, 2011, rule writing authority for HMDA transferred from the Federal Reserve Board to the Consumer Financial Protection Bureau (CFPB). The CFPB's Regulation C which now implements HMDA, requires lending institutions to report public loan data.163
The housing‐loan data that lenders must disclose under HMDA:
show whether financial institutions are serving the housing needs of their communities;
assist public officials in distributing public‐sector investment to attract private investment to areas where it is needed; and
assist in identifying possible discriminatory lending patterns and enforcing antidiscrimination statutes.
There are three categories of loans that must be reported: home purchase, home improvement, and refinancing. Every loan application, origination, and purchase that falls into one or more of the three categories must be reported. With some exceptions, for each transaction the lender reports data about:
the loan, such as its type and amount;
the property, such as its location and type;
the disposition of the application, such as whether it was denied or resulted in an origination; and
the applicant (namely, ethnicity, race, sex, and income).
161 http://portal.hud.gov/hudportal/HUD?src=/program_offices/fair_housing_equal_opp/FHLaws/109
162 http://www.ffiec.gov/hmda/
163 http://www.consumerfinance.gov/hmda/.

TOGETHER North Jersey Fair Housing & Equity in Northern New Jersey
9-5
Detailed information regarding HMDA reporting practices and criteria are published for each data collection round; the current version is A Guide to HMDA Reporting Getting It Right! 164 HMDA does not prohibit any lending activity, nor is it intended to encourage unsound lending practices or the allocation of credit. Each year, HMDA data are analyzed by Federal agencies and many other organizations to identify trends in mortgage lending such as trends in mortgage originations and use of FHA loans.
Age Discrimination Act of 1975 9.2.1.8
This Federal law prohibits discrimination on the basis of age in programs or activities receiving federal financial assistance.165
Community Reinvestment Act (1977) 9.2.1.9
The Community Reinvestment Act (CRA) is Title VIII of the Housing and Community Development Act of 1977.166 The CRA is intended to encourage depository institutions such as commercial banks and savings associations above a minimum size to help meet the credit needs of the communities in which they operate, including low‐ and moderate‐income neighborhoods, consistent with safe and sound operations and to reduce discriminatory credit practices, such as redlining, against low‐income neighborhoods. Regulations were substantially revised in May 1995 and updated in August 2005.
The CRA mandates that all banking institutions that receive Federal Deposit Insurance Corporation (FDIC) insurance be evaluated by the four Federal banking regulatory agencies167 to determine if the bank offers credit in all communities in which they are chartered to do business. The law emphasizes that an institution's CRA activities should be undertaken in a safe and sound manner, and does not require institutions to make high‐risk or “subprime” loans that may bring losses to the institution.
The CRA regulation contains an option for banks called the "strategic plan." This option allows an institution to develop a plan with community input, detailing how the institution proposes to meet its CRA obligation. The bank must publish notice of the plan once it developed and solicit written public comment for at least 30 days. After the comment period, the institution submits the plan to its regulator for review and approval. To date, only three banks, two in California and one in Utah, have approved CRA plans in place.
The CRA does not list specific criteria for evaluating the performance of financial institutions, instead directing that the evaluation process should accommodate the situation and context of each individual institution. Federal regulations dictate agency conduct in evaluating a bank's compliance in five performance areas, comprising twelve assessment factors. This examination culminates in a rating and a written report that becomes part of the supervisory record for that bank that is taken into consideration
164 A Guide to HMDA Reporting: Getting It Right! Federal Financial Institutions Examination Council. http://www.ffiec.gov/hmda/pdf/2013guide.pdf
165 http://www.dol.gov/oasam/regs/statutes/age_act.htm
166 12 U.S.C. 2901; implemented by Regulation BB (12 CFR 228).
167 Federal Deposit Insurance Corporation (FDIC), Office of the Comptroller of the Currency, Office of Thrift Supervision, and the Federal Reserve Bank.

TOGETHER North Jersey Fair Housing & Equity in Northern New Jersey
9-6
by Federal regulatory agencies when approving applications for new bank branches or for mergers or acquisitions. The law does not mandate any other penalties for non‐compliance.
A key provision of the CRA gives standing to community groups and other organizations to challenge proposed mergers, acquisitions, and other actions of banks to claim that banks did not meet their requirements for community reinvestment. To avoid such challenges and their associated delays, many banks, including in the TNJ region, have initiated specific, significant community reinvestment projects negotiated with community groups outside of the strategic plan framework. For example, New Jersey Citizen Action reports that it has negotiated CRA Agreements totaling over $8 billion in commitments for:
below market rate mortgages;
grants for down payment and closing costs assistance to low and moderate income first time homebuyers;
discounted home improvement loans for tenants and homeowners;
construction and permanent financing for non‐profit affordable housing developers;
grants to community and economic development organizations; and
small business loans for women and minority owned businesses.168
CRA funding has also been used to finance mixed‐use, inclusionary housing developments.169
Americans with Disabilities Act of 1990 9.2.1.10
Title II of this Federal law prohibits discrimination on the basis of disability in programs, services, and activities provided or made available by public entities. The U.S. Department of Justice has primary enforcement responsibility for Title II of the ADA. HUD enforces Title II of the ADA when it relates to state and local public housing, housing assistance, and housing referrals.170
Cranston‐Gonzalez National Affordable Housing Act 9.2.1.11
Section 282 of this Federal law prohibits discrimination on the basis of race, color, religion, sex, or national origin under any program or activity receiving assistance from the HOME Investment Partnerships program. While Section 282 does not directly prohibit discrimination based on age or disability, the statute states that the prohibitions against discrimination on the basis of age found in the Age Discrimination Act of 1975 and the prohibitions against discrimination on the basis of disability found in Section 504 of the Rehabilitation Act of 1973 apply to HOME programs or activities.171
168 http://www.njcitizenaction.org/cra.html, June 17, 2014.
169 http://www.governing.com/topics/urban/gov‐community‐reinvestment‐act.html
170 http://www.ada.gov/pubs/ada.htm
171 http://portal.hud.gov/hudportal/documents/huddoc?id=19576_homelaws.pdf

TOGETHER North Jersey Fair Housing & Equity in Northern New Jersey
9-7
Federal (Presidential) Executive Orders 9.2.2
A number of Presidential Executive Orders relate to fair housing and are listed below.
Executive Order 11063, Equal opportunity in housing (November 20, 1962), prohibits discrimination on the basis of race, color, religion, national origin, sex, disability, or familial status in the sale, leasing, rental, or other disposition of properties and facilities owned or operated by the Federal Government or provided with federal funds.172
Executive Order 11246, Equal employment opportunity (September 24, 1965), prohibits federal contractors and federally assisted construction contractors and subcontractors, who do more than $10,000 in Federal Government business in one year, from discriminating in employment decisions on the basis of race, color, religion, sex, or national origin. This Executive Order also requires Federal Government contractors to take affirmative action to ensure that equal opportunity is provided in all aspects of their employment.173
Executive Order 11625, Prescribing additional arrangements for developing and coordinating a national program for minority business enterprise (October 13, 1971), requires each federal agency to develop comprehensive plans and specific program goals for a national Minority Business Enterprise (MBE) contracting program.174
Executive Order 12250, Leadership and coordination of nondiscrimination laws (November 2, 1980), requires consistent and effective implementation of various laws prohibiting discriminatory practices in programs receiving federal financial assistance.175
Executive Order 12259, Leadership and coordination of Fair Housing in Federal Programs (December 31, 1980), gave the Secretary of HUD the responsibility of ensuring that all federal programs and activities related to housing and urban development are administered in a manner to affirmatively further fair housing. Executive Order 12259 also amended Executive Order 11063 to prohibit discrimination based on sex. On January 17, 1994, Executive Order 12259 was revoked and replaced by Executive Order 12892.176
Executive Order 12432, Minority business enterprise development (July 14, 1983), requires each federal agency with substantial procurement or grant‐making authority to develop a Minority Business Enterprise (MBE) development plan.
172 http://portal.hud.gov/hudportal/HUD?src=/program_offices/fair_housing_equal_opp/FHLaws/EXO11063
173 http://portal.hud.gov/hudportal/HUD?src=/program_offices/fair_housing_equal_opp/FHLaws/EXO11246
174 http://www.archives.gov/federal‐register/codification/executive‐order/11625.html
175 http://www.archives.gov/federal‐register/codification/executive‐order/12250.html
176 http://www.archives.gov/federal‐register/codification/executive‐order/12259.html

TOGETHER North Jersey Fair Housing & Equity in Northern New Jersey
9-8
Executive Order 12892, Leadership and coordination of fair housing in federal programs: affirmatively furthering fair housing (January 17, 1994), as amended, requires federal agencies to affirmatively further fair housing in their programs and activities, and provides that the Secretary of HUD will be responsible for coordinating the effort. The Order also establishes the President's Fair Housing Council, which will be chaired by the Secretary of HUD.177
Executive Order 12898, Federal actions to address environmental justice in minority populations and low‐income populations (February 16, 1994), requires that each federal agency conduct its programs, policies, and activities that substantially affect human health or the environment in a manner that does not exclude persons on the basis of race, color, or national origin.178
Executive Order 13166, Improving access to services for persons with limited English proficiency (August 11, 2000), directs federal agencies to provide meaningful access to federally conducted and federally assisted programs and activities for persons who, as a result of national origin, are limited English proficient.179
Executive Order 13217, Community‐based alternatives for individuals with disabilities (June 18, 2001), requires federal agencies to evaluate their policies and programs to determine if any can be revised or modified to improve the availability of community‐based living arrangements for persons with disabilities.180
Fair Housing Initiatives Program 9.2.3
The Fair Housing Initiatives Program (FHIP) of HUD is a relatively small grant program that provides funds to nonprofit organizations to conduct fair housing education, outreach, and enforcement, including fair housing audits. Approximately 75% of these funds are directed to fair housing enforcement.181
Fair Housing Assistance Program 9.2.4
The Fair Housing Assistance Program (FHAP) of HUD is a small grant program that provides funds to state and local fair housing enforcement agencies.182
Housing Discrimination Complaints in New Jersey 9.2.5
HUD has provided data on housing discrimination complaints in New Jersey by municipality by filing status and by cases closed.
177 http://portal.hud.gov/hudportal/HUD?src=/program_offices/fair_housing_equal_opp/FHLaws/EXO12892
178 http://portal.hud.gov/hudportal/HUD?src=/program_offices/fair_housing_equal_opp/FHLaws/EXO12898
179 http://portal.hud.gov/hudportal/HUD?src=/program_offices/fair_housing_equal_opp/FHLaws/EXO13166
180 http://www.gpo.gov/fdsys/pkg/CFR‐2002‐title3‐vol1/pdf/CFR‐2002‐title3‐vol1‐eo13217.pdf
181 http://portal.hud.gov/hudportal/HUD?src=/program_offices/fair_housing_equal_opp/partners/FHIP/fhip
182 http://portal.hud.gov/hudportal/HUD?src=/program_offices/fair_housing_equal_opp/partners/FHAP

TOGETHER North Jersey Fair Housing & Equity in Northern New Jersey
9-9
Housing Discrimination Complaints Filing Status 9.2.5.1
The filing status of housing discrimination complaints is presented in Table 9‐1 for cases filed during the period 2004 through February 2010. The largest number of complaints within the TNJ region alleged housing discrimination based on disability (350) and race/color (326), a similar pattern to the state as a whole. The counties in New Jersey with the highest number of housing discrimination complaint filings, Bergen (156) and Essex (155) were both within the TNJ region.
The largest number of disability complaints in the state by county was filed in Essex (59), Ocean (45), and Bergen (43) counties, all within the Together North Jersey region. The largest number of race/color complaints in the state by county was filed in Bergen (66), Essex (48), and Middlesex (43) Counties, all within the TNJ region.
The municipalities with the highest number of housing discrimination complaints filed during this period were Newark (67), Jersey City (43), Lakewood (41), and Flemington (33). Disability‐related complaints accounted for the highest number of complaints in Newark (30) and Flemington (30). In Jersey City, race/color (15) and disability (13) represented the highest number of filed complaints. In Lakewood, it was for religion (26).
Table 9‐1: Discrimination Complaints Filed 2004‐February 2010
Cases Closed 9.2.5.2
Data on cases closed is provided for the period 2004 through 2009 as shown in Table 9‐2. The counties with the highest number of housing discrimination cases closed during this period were Essex (146) and Bergen (135), both within the TNJ region. Newark had the highest number of cases closed (63) within the state, most with findings of no cause (36), administrative (10), or withdrawal with relief (10).
Just less than one‐half of the cases closed, both statewide and in the TNJ region, were for findings of no cause for the alleged housing discrimination. Most of the remaining cases were closed by administrative
County Race/ColorNational
Origin
Familial
statusDisability Sex Religion Retaliation
Sexual
HarassmentTotal
Bergen 66 21 16 43 7 0 1 2 156
Essex 48 20 15 59 10 1 1 1 155
Hudson 36 15 11 33 10 0 0 1 106
Hunterdon 4 0 1 32 0 0 1 0 38
Middlesex 43 13 9 27 2 2 3 0 99
Monmouth 20 6 8 33 2 1 1 0 71
Morris 19 9 11 24 1 0 0 0 63
Ocean 17 6 9 45 5 26 1 0 109
Passaic 21 13 7 18 6 4 0 1 70
Somerset 11 1 2 7 0 0 0 0 21
Sussex 0 1 1 4 1 0 0 0 7
Union 34 9 9 15 3 0 1 0 71
Warren 7 0 1 10 2 0 0 0 20
TNJ REGION 326 114 100 350 49 34 9 5 986
NEW JERSEY 464 147 125 472 58 37 13 5 1,320

TOGETHER North Jersey Fair Housing & Equity in Northern New Jersey
9-10
action, conciliation or withdrawal with relief. The largest number of cases that were not dismissed for no cause were in Bergen (73), Essex (63), and Hudson (60) counties. 183
Table 9‐2: Discrimination Cases Closed 2004‐2009
Enforcement 9.2.6
The Fair Housing Council of Northern New Jersey is the only designated enforcement agency in the State of New Jersey.184 The FHC conducts investigations into fair housing violations. When necessary, the FHC helps its clients through the process of filing a complaint with HUD or filing a lawsuit in state or federal court. The FHC recruits volunteers to serve as “mystery shoppers” to document instances of unlawful discrimination, using techniques approved by the United States Supreme Court. 185
Fair Housing Testing Program 9.2.7
Testing is a valuable tool to investigate housing market practices and to document illegal housing discrimination practices that persist in the rental and sale of housing. Fair Housing Testing approaches are used by HUD for program analyses, and by the United States Department of Justice for fair housing enforcement.
U.S. Department of Housing and Urban Development 9.2.7.1
In its 2012 study, the fourth such nationwide study since 1977 using a fair housing testing approach, HUD found that:
183 For more information on the disposition categories for discrimination complaints see the Appendix.
184 http://fairhousingnj.org/enforcement.htm
185
County AdministrativeWithdrawal
w/reliefConciliation No Cause Cause Total
# of Cases
Not
Dismissed
for No Cause
% of Cases
Not
Dismissed
for No Cause
Bergen 21 10 38 62 4 135 73 54.1%
Essex 25 18 19 83 1 146 63 43.2%
Hudson 28 14 15 42 3 102 60 58.8%
Hunterdon 13 1 0 24 1 39 15 38.5%
Middlesex 12 10 12 68 3 105 37 35.2%
Monmouth 12 7 11 36 5 71 35 49.3%
Morris 11 11 12 26 2 62 36 58.1%
Ocean 14 14 9 59 9 105 46 43.8%
Passaic 11 4 13 35 4 67 32 47.8%
Somerset 0 3 5 13 0 21 8 38.1%
Sussex 0 0 1 3 0 4 1 25.0%
Union 6 11 10 43 2 72 29 40.3%
Warren 3 4 8 4 0 19 15 78.9%
TNJ REGION 156 107 153 498 34 948 450 47.5%
NEW JERSEY 208 144 204 673 40 1269 596 47.0%

TOGETHER North Jersey Fair Housing & Equity in Northern New Jersey
9-11
While, nationally, the most blatant forms of housing discrimination – for example, refusing to meet with a minority homeseeker or provide information about any available units – have declined since the first study in 1977. The forms of discrimination that persist, such as providing information about fewer units, raise the costs of housing search for minorities and restrict their housing options.
Nationwide, minority homeseekers whose ethnicity is more readily identifiable experience more discrimination than those who may be mistaken for whites.
The study did not find substantial differences in the incidence or severity of discrimination across metropolitan areas or regions of the country, suggesting that housing discrimination remains a national problem. It was neither more nor less severe in housing markets hit hardest by the Great Recession.
A summary of findings for the New York metropolitan area, one of 28 metropolitan areas examined using 8,000 test visits nationwide, can be found in the Appendix F.
U.S. Department of Justice 9.2.7.2
The United States Department of Justice (DOJ) is authorized to enforce the Fair Housing Act, which prohibits discrimination on the basis of race, color, religion, national origin, sex, disability, and familial status. The Housing and Civil Enforcement Section of the Civil Rights Division brings suit on behalf of the United States where investigations yield evidence of a pattern or practice of illegal housing discrimination.
The Fair Housing Testing Program was established within the Housing and Civil Enforcement Section in 1991 and testing commenced in 1992. This program used individuals who, without any bona fide intent to rent or purchase a home, apartment, or other dwelling, posed as prospective buyers or renters of real estate for the purpose of gathering information that may indicate whether a housing provider is complying with fair housing laws. The primary focus of the Section's Fair Housing Testing Program has been to identify unlawful housing discrimination based on race, national origin, disability, or familial status, but also has tested places of public accommodation to enforce Title II of the Civil Rights Act of 1964, the nation's public accommodations law.
Various arrangements are made to implement the testing program in local communities, including contracts with private fair housing organizations, contracts with individuals, and deployment of trained non‐attorney DOJ employees to participate as testers. Since 1992, the DOJ has filed 98 pattern and practice testing cases nationally, relying upon evidence generated from the Fair Housing Testing Program. The vast majority have involved allegations of agents misrepresenting the availability of rental units or offering different terms and conditions based on race, and/or national origin, and/or familial status. Of the 96 resolved cases to date, the DOJ has recovered over $2.3 million in civil penalties and over $10.5 million in other damages.
Vouchers/Mixed Income 9.2.8
The federal Housing Choice Voucher program186 dates back to the mid‐1970s. This program provides vouchers to low‐income households that cover the difference between the 30 percent of household income target household expenditure for housing and the maximum allowable rent (Fair Market Rent),
186 http://portal.hud.gov/hudportal/HUD?src=/states/new_jersey/renting

TOGETHER North Jersey Fair Housing & Equity in Northern New Jersey
9-12
adjusted by location, determined by HUD. This program, designed to help low‐income households rent existing housing in the private sector as an alternative to building more designated low‐income housing units, became the dominant form of low‐income housing assistance within a decade and remains today one of the leading federal housing investments nationally.
Consolidated Housing Plans/Annual Action Plan for Housing 9.2.9
The Consolidated Housing Plan is a five‐year comprehensive planning document intended to define priorities and serve as a guide in coordinating the delivery of limited housing, community and economic development resources to meet the needs of various program clienteles. These plans are used to identify needs and adopt strategies to address those needs, focused primarily on low and moderate income (LMI) individuals and households, but also on the needs of persons with “special needs” such as the elderly, persons with disabilities, large families, single parents, homeless individuals and families, and public housing residents. Several examples of current Consolidated Housing Plans (CHP) within the TNJ region are listed in Table 9‐3.
Six federal HUD grants are covered by the consolidated plan:
Community Development Block Grant Program (CDBG);
Emergency Shelter Grant Program (ESG);
HOME Investment Partnerships Program;
Homelessness Prevention and Rapid Re‐Housing Program;
Housing for Persons with AIDs (HOPWA); and
Neighborhood Stabilization Program.
The CHP must identify potential sources of funding and evaluate past performance of HUD programs currently in place in the jurisdiction, including identifying any obstacles to meeting underserved needs.
For jurisdictions receiving annual entitlements of formula grants from HUD, an Annual Action Plan is required that is consistent with the applicable Consolidated Housing Plan. These plans are similar in structure to the 5‐year Consolidated Housing Plans but for a one‐year time period. Current “entitlement” municipalities and counties in the TNJ region are identified in Table 9‐4. Examples of current Annual Action Plans in the TNJ region are listed in Table 9‐5.

TOGETHER North Jersey Fair Housing & Equity in Northern New Jersey
9-13
Table 9‐3: Examples of Current Consolidated Housing Plans, TNJ Region
Essex County 5 Year Consolidated Plan (2010)http://togethernorthjersey.com/wp‐content/uploads/2014/02/2013ActionPlanFinalCopy.pdf
Hudson County 5 Year Consolidated Plan http://togethernorthjersey.com/wp‐content/uploads/2014/04/Hudson‐consolidated‐plan.pdf
Jersey City 5 Year Consolidated Plan (2010) http://togethernorthjersey.com/wp‐content/uploads/2014/03/JC‐Strategic‐Plan‐FY2010‐14‐FINAL‐04‐22‐10.pdf
Morris County 5 Year Consolidated Plan (2010) http://www.scribd.com/doc/29542906/2010‐Strategic‐Plan‐Narratives
New Brunswick 5 Year Consolidated Plan (2010) http://togethernorthjersey.com/wp‐content/uploads/2014/02/2010‐2014‐C‐Plan‐New‐Brunswick‐NJ.pdf
Newark 5 Year Consolidated Plan (2010) http://togethernorthjersey.com/wp‐content/uploads/2014/02/public_Newark‐2010‐15‐HUD‐Consolidated‐Plan‐FINAL‐DRAFT.pdf
Ocean County 5 Year Consolidated Plan http://togethernorthjersey.com/wp‐content/uploads/2014/02/01_consolidated_plan.pdf
Passaic County 5 Year Consolidated Plan (2013) http://togethernorthjersey.com/wp‐content/uploads/2014/02/Passaic‐County‐Consolidated‐Plan‐2013‐to‐2017‐For‐Display‐1.pdf
Paterson 5 Year Strategic Plan (2010) http://togethernorthjersey.com/wp‐content/uploads/2014/02/1286150956_193634.pdf
Somerset County 5 Year Strategic Plan (2010) http://togethernorthjersey.com/wp‐content/uploads/2014/02/2010‐Con‐Plan.pdf
State of New Jersey 5 Year Consolidated Plan (2010) http://togethernorthjersey.com/wp‐content/uploads/2014/02/conplan2010_2014.pdf
Union County 5 Year Consolidated Plan (2010) http://togethernorthjersey.com/wp‐content/uploads/2014/02/Fiscal‐Year‐2013.pdf

TOGETHER North Jersey Fair Housing & Equity in Northern New Jersey
9-14
Table 9‐4: HUD "Entitlement" Municipalities and Counties, Together North Jersey Region
Cities Boroughs and Townships Counties
City of Asbury Park City of Bayonne City of Clifton City of East Orange City of Elizabeth City of Jersey City City of Long Branch City of New Brunswick City of Newark City of Passaic City of Paterson City of Perth Amboy City of Union City
Borough of SayrevilleTownship of Bloomfield Township of Brick Township of Edison Township of Franklin Township of Irvington Township of Lakewood Township of Middletown Township of North Bergen Township of Old Bridge Township of Parsippany‐Troy Hills Township of Toms River Township of Union Township of Wayne Township of Woodbridge
County of Bergen County of Essex County of Hudson County of Middlesex County of Monmouth County of Morris County of Ocean County of Passaic County of Somerset County of Union
Table 9‐5: Examples of Current Annual Action Plans, TNJ Region
Essex County 5 Year Consolidated Plan (2010‐2014) and 2013 One Year Action Planhttp://togethernorthjersey.com/wp‐content/uploads/2014/02/2013ActionPlanFinalCopy.pdf
Hudson County 5 Year Consolidated Plan (2010‐2014) and 2010 One Year Action Plan http://togethernorthjersey.com/wp‐content/uploads/2014/04/Hudson‐consolidated‐plan.pdf
2014‐2015 City of New Brunswick Consolidated Annual Action Plan http://thecityofnewbrunswick.org/planninganddevelopment/wp‐content/uploads/sites/8/2014/04/Year‐5‐Action‐Plan‐PubHear‐Draft1.pdf
City of Newark Draft 2013‐2014 Annual Action Plan http://www.ci.newark.nj.us/userimages/downloads/2013%20Con%20Plan%20DRAFT.pdf
Analysis of Impediments/Affirmatively Furthering Fair Housing 9.2.10
Since 1968, HUD has had the obligation to affirmatively further fair housing in the programs it administers. In 2000, HUD “devolved” its system of national regulation of fair housing to a system where communities have the authority and the responsibility to decide the nature and extent of impediments to fair housing, and determine what they believe can and should be done to address those impediments. Specifically, the Consolidated Plan regulations (24 CFR 91) required each state and local government to submit a certification that it is affirmatively furthering fair housing. This means that it will:
1) conduct an analysis of impediments to fair housing choice (“AI”); 2) take appropriate actions to overcome the effects of impediments identified through that analysis;
and 3) maintain records reflecting the analysis and actions.

TOGETHER North Jersey Fair Housing & Equity in Northern New Jersey
9-15
HUD published its Fair Housing Planning Guide187 and instituted a training program to assist state and local governments in fulfilling the fair housing requirements of the Consolidated Plan and Community Development Block Grant regulations. The Guide defines the AI as a comprehensive review of a state’s or entitlement jurisdiction’s laws, regulations and administrative policies, procedures and practices. The AI involves an assessment of how these laws, regulations, policies and procedures affect the location, availability, and accessibility of housing, and how conditions, both private and public, affect fair housing choice. A listing of AIs completed in the Together North Jersey region is included in Appendix F.
Following the AI’s completion, the jurisdiction must report on its implementation by describing the actions taken to overcome the effects of the impediments identified through the analysis in its Consolidated Annual Performance and Evaluation Report (CAPER) or it Annual Action Plan within its 5‐year Consolidated Housing Plan. Although AIs were not submitted to or approved by HUD, HUD could require an AI’s submission in the event of a complaint or as part of routine monitoring, and could revoke the certification of the state or local jurisdiction for HUD funding or require remedial actions.
As described below, this process is changing in response to a 2006 complaint and a subsequent 2009 settlement that has in turn led to proposed new regulations by HUD in 2013 to guide the process of Affirmatively Furthering Fair Housing.
United States v Westchester County Litigation & Settlement Agreement 9.2.10.1
In United States v. Westchester County, national attention focused upon the size of the settlement agreement imposed on Westchester County ‐‐ $52 million ‐‐ for its failure to comply with the Fair Housing Act of 1968 and HUD requirements to address the housing needs of racial and ethnic minorities as a condition of receipt of federal Community Development Funds. But, the case also brought national attention to the difficulties that HUD has enforcing its program requirement that grantees affirmatively further fair housing (AFFH) in an era when the administration of housing and community development programs have devolved from the federal level to the local level.
The United States v. Westchester County litigation illustrates the extent to which a HUD‐funded entity could diverge from the long‐established national goal of ensuring access and choice in housing for racial and ethnic minorities. It underlines the challenges of addressing historic patterns of housing segregation and locally‐established regulatory barriers to affordable housing with a locally‐administered program. Ineffective federal oversight had created an environment where a HUD grantee could largely ignore the fair housing requirements and continue to receive federal funding.
9.2.10.1.1 Background to the Westchester Litigation
Since the passage of the 1968 Fair Housing Act, discrimination in the sale, rental and financing of housing has been illegal in the United States, and HUD has had a mandate to affirmatively further fair housing (AFFH) choice in the administration of its various housing and community development programs. However, with the passage of the Housing and Community Development Act of 1974, HUD’s role and responsibilities for the implementation of national housing and community development were delimited. HUD’s administrative role devolved to one of programmatic oversight of locally developed analyses of impediments (AIs) and reliance upon local assurances – in the form of a certification of compliance with the AFFH requirements.
187 http://www.hud.gov/offices/fheo/images/fhpg.pdf

TOGETHER North Jersey Fair Housing & Equity in Northern New Jersey
9-16
By certifying that they had prepared an AI, these jurisdictions agreed to “assume the responsibility of fair housing planning by conducting an analysis of fair housing choice within its jurisdiction, taking appropriate actions to overcome the effects of any impediments identified through that analysis, and maintain records reflecting the analysis and actions in that regard.”
9.2.10.1.2 United States ex rel. Anti‐Discrimination Center of Metro New York v. Westchester County
In the American system of division of powers, the redress of the denial of civil rights of minority groups can be pursued in the federal court system. The lawsuit that exposed the failure of Westchester County and its municipalities to comply with its contractual obligations was initiated by a not‐for‐profit fair housing group, the Anti‐Discrimination Center of Metro New York, Inc., (ADC) ‐‐ that is, not by the federal agency charged with enforcement.
In 2006, the ADC filed a False Claims Act complaint in the federal district court charging that Westchester County had falsely claimed that it was affirmatively furthering fair housing and had thereby received in excess of $50 million in Community Development Block Grant (CDBG) funding. Among the substantial penalties for knowingly submitting a false claim to the United States government is payment of triple damages to the government and additional penalties for each and every false claim for payment.
The success of this ADC False Claims complaint against Westchester County suggests that other HUD grant recipients should not take lightly their responsibilities to affirmatively further fair housing as they may be as vulnerable as Westchester County to the arguments presented below:
County officials knew the county to be “strongly residentially segregated by race and national origin”. Some 40% of Westchester’s forty‐five municipalities have populations that are 1% Black or less; and 60% less than 3% Black, while communities such as Mt. Vernon, Peekskill, New Rochelle and Yonkers have concentrated minority populations of 68%, 56%, 39% and 41%, respectively.
The County had failed to conduct a meaningful analysis of impediments to identify barriers to fair housing choice. Their AI identified “the lack of affordable housing” as the key impediment to housing choice by racial and ethnic minorities and ignored the existence of racial segregation or racial discrimination.
The County had failed to affirmatively further fair housing by taking steps to overcome the impediments identified. The county’s AI identified the “lack of affordable housing” as an impediment to housing choice, but failed to acknowledge that the unavailability of affordable housing contributed to the continued pattern of racial segregation in the county. The county proposed no action plan to address municipal zoning ordinances that restricted the development of rental housing – a widely recognized marker of exclusionary zoning – or address the absence of affordable housing developments in many municipalities.
The County’s certifications of compliance with its fair housing obligations were false claims for federal funding. These certifications – submitted with the Consolidated Plans and CDBG fund draw‐downs over a number of years – were false claims that should subject the county to the financial penalties provided for in the False Claims Act.
9.2.10.1.3 Westchester County’s Settlement Agreement with the United States Government
In 2009 the Southern District Court of NY decided the case in favor of the ADC and sustained its complaint that Westchester County had filed false claims for CDBG funding. Facing the severe financial penalties of the False Claims Act, Westchester County opted not to appeal the decision of the federal

TOGETHER North Jersey Fair Housing & Equity in Northern New Jersey
9-17
court and entered into a settlement agreement with the United States government and the ADC that required the payment of more than $12 million to the ADC and $8 million to the United States in settlement of their False Claims Act violations.
The County agreed to commit to expend $51 Million to construct 750 rental and ownership housing units principally targeted to low and moderate‐income non‐elderly households – over a period of seven years – and with annual housing development benchmarks. Significantly, the County agreed to ensure the development of these 750 affordable housing units in municipalities and neighborhoods with few Black and Hispanic residents.
The County agreed to complete an Analysis of Impediments (AI) to fair housing choice that met HUD’s approval. Their AI would include a study of “the impediments to fair housing within its jurisdiction including impediments based on race or municipal resistance to the development of affordable housing,” and a description of “the appropriate actions the County will take to address and overcome the effects of those impediments.”
To address a significant regulatory barrier to housing choice, the County agreed to create a model ordinance “that requires new development projects to include a certain percentage of affordable units,” places bans on “local residency requirements and preferences” for affordable housing, establishes standards for affirmatively marketing new housing developments to ensure “outreach to racially and ethnically diverse households,” and ensures “expedited review” of affordable housing proposals that affirmatively furthered the cause of fair housing. The County also agreed to condition the distribution of CDBG funding to its consortium municipalities based upon their adoption of the model inclusionary ordinance.
Westchester County also agreed to promote legislation to ban so‐called “source‐of‐income” discrimination in housing – that is, to ban the practice of private landlords refusing to accept housing choice vouchers.
The settlement agreement required the County to use all available tools at its disposal to enforce the terms of the settlement on any local governments that did not assist with, or that actively worked to frustrate the agreement.
Finally, the settlement provided for the appointment by the U.S. District Court of a Monitor to oversee the implementation of the settlement, with broad powers to resolve any disputes that might arise between the County and the government. The Monitor is required to file quarterly reports on the progress of implementing the settlement and is empowered to review county programs to ensure compliance with the settlement, identify and recommend additional actions the county should take to comply with the settlement and rule, in regards to particular proposals for housing units, whether the units would be allowed to count towards the County’s 750 unit goal. 188,189
188 The Anti‐Discrimination Committee (ADC) litigant has expressed concern about progress on implementation of the settlement agreement persist. See: http://www.antibiaslaw.com/sites/default/files/Cheating_On_Every_Level.pdf)

TOGETHER North Jersey Fair Housing & Equity in Northern New Jersey
9-18
9.2.10.1.4 Reactions to the Settlement Agreement
Reactions to the settlement of the Westchester litigation included pledges from HUD officials to improve their commitment to fair housing and sustainable development and a Congressional request for a GAO review of HUD’s requirements and oversight of jurisdictions’ fair housing plans. Written guidance to New Jersey HUD grantees from the NJ Public Advocate was also distributed. These reactions included:
Then HUD Deputy Secretary, Ronald Sims, announced that, “This settlement reflects an approach to equitable development in suburban areas that can serve as a model for building inclusive, diverse and sustainable communities across the country.”190
Then HUD Assistant Secretary for Fair Housing and Equal Opportunity, John D. Trasvina, in a written statement to the U.S. House Committee acknowledged that the Department had not always fulfilled its obligation to assist grantees in meeting their AFFH requirements, but was in the process of developing a rule that would provide the guidance that grantees needed. 191
Ronald Chen, then NJ Public Advocate, wrote to advise NJ HUD grantees that “Westchester County’s AI had identified the ‘lack of affordable housing’ as the ‘greatest impediment to fair housing’ and sought to remedy the problem by ‘increasing the supply of affordable rental homeownership for moderate and middle income families.’” He noted that the court decision rejected Westchester’s approach because it was “conducted through the lens of affordable housing, rather than fair housing.” Chen went on to point out that the court had quoted from HUD’s own Guide:
“When a jurisdiction undertakes to build or rehabilitate housing for low‐ and moderate‐income families … this action is not in and of itself sufficient to affirmatively further fair housing… When steps are taken to assure that the housing is fully available to all residents of the community, regardless of race, color, national origin, gender, handicap, or familial status, those are the actions that affirmatively further fair housing.”192
189 The Westchester Housing Monitor hosts the settlement agreement, monitoring reports and other relevant information at http://www.westchesterhousingmonitor.org/home
190 http://portal.hud.gov/hudportal/HUD?src=/press/press_releases_media_advisories/2009/HUDNo.09‐149
191 http://portal.hud.gov/hudportal/documents/huddoc?id=DOC_7752.pdf
192 HUD Fair Housing Planning Guide, Volume 1. (Undated), p. 5‐4. http://www.hud.gov/offices/fheo/images/fhpg.pdf

TOGETHER North Jersey Fair Housing & Equity in Northern New Jersey
9-19
The Government Accountability Office (GAO) issued a “Report to Congressional Requestors, “Housing and Community Grants: HUD Needs to Enhance Its Requirements and Oversight of Jurisdictions’ Fair Housing Plans.”193 On the basis of their review of 441 AIs, the report concluded:
“While HUD regulations have required the preparation of AIs for many years, whether they serve as an effective tool for grantees that receive federal funds through the CDBG and other programs to identify and address impediments to fair housing within their jurisdictions is unclear.”
“Given that many AIs are outdated, they do not likely serve as effective planning documents to identify and address current potential impediments to fair housing choice.
“The vast majority of AIs lack time frames for implementing identified recommendations or the signatures of top elected officials, both of which are necessary to establish clear accountability to carry out the AFFH intent.
“HUD’s limited approach to establishing AI regulatory requirements, and its limited oversight and enforcement approaches may help explain the various weaknesses in the documents…
“Beyond requiring grantees to prepare AIs, and certify annually that they have done so and are addressing identified impediments, HUD requirements with respect to AIs are minimal.”194
HUD Notice of Proposed Rulemaking on Affirmatively Furthering Fair Housing 9.2.10.2
On July 19, 2013 HUD published and invited comments on a proposed rule to “refine and improve the process currently known as the Analysis of Impediments to Fair Housing Choice (AI), which HUD grant recipients must undertake in keeping with their obligation to ‘affirmatively further fair housing (AFFH).’”
In proposing a new assessment process to AFFH, it candidly stated that “HUD is specifically looking to address shortcomings under the current regulatory scheme for AFFH that it recognized, along with the GAO, grantees, and outside advocacy groups,” including the:
Need for Clear Guidance, Standards, and Oversight; and
Lack of Integration of the AFFH and the AI into the Consolidated Planning Process.
The proposed approach sets out four clear fair housing goals for HUD‐funded communities to ensure greater opportunities for all Americans:
1. Reduce segregation, and build on the nation’s increasing racial, geographic and economic diversity. 2. Eliminate racially and ethnically concentrated areas of poverty.
193 Report to Congressional Requestors, Housing and Community Grants: HUD Needs to Enhance Its Requirements and Oversight of Jurisdictions’ Fair Housing Plans. U.S. General Accounting Office, September 2010.
194 Ibid., pp. 31‐32.

TOGETHER North Jersey Fair Housing & Equity in Northern New Jersey
9-20
3. Reduce disparities in access to important community assets such as quality schools, job centers, and transit.
4. Narrow gaps that leave families with children, people with disabilities, and people of different races, colors, and national origins with more severe housing problems, aka, disproportionate housing needs.
Under the proposed rule, the AI would be replaced by a new Assessment of Fair Housing (AFH) with four basic steps:
1. HUD would provide jurisdictions with data to assess fair housing issues in its community, including data on disproportionate housing needs and outstanding discrimination findings.
2. Using this HUD data and a HUD‐provided template, the jurisdiction would analyze its fair housing issues in order to submit its complete AFH that includes its fair housing goals to HUD.
3. HUD would have 60 days to review and accept the AFH or return the AFH as incomplete and explain what the HUD participant must do to have it accepted.
4. The jurisdiction would incorporate the AFFH goals identified in the AFH into the strategies and actions of its Consolidated Plan and Annual Action Plans.
The AFH that would result from this process would contain three parts:
1. An Executive Summary: an overview of the jurisdiction’s fair housing issues, the fair housing infrastructure and capacity of the community plus any findings; and the fair housing goals and priorities.
2. The AFH Analysis: a discussion of the local demographic profile; the state of neighborhood segregation and integration; the prevalence of racially/ethnically concentrated areas of poverty; neighborhood disparities in access to community assets by protected classes; and housing needs across protected classes.
3. Fair Housing Priorities and Goals: a summary of the leading fair housing challenges and opportunities in the community and the priorities goals for progress.
9.3 New Jersey Efforts to Address Barriers to Fair Housing
The civil rights provisions of the Constitution of the State of New Jersey are implemented through the New Jersey Law against Discrimination and the Mount Laurel doctrine, the latter of which was established by the New Jersey Supreme Court and implemented through legislation and administrative authorities.
New Jersey Law against Discrimination 9.3.1
The New Jersey Law Against Discrimination195 (LAD), initially passed in 1945 and frequently amended, declared that its enactment should be viewed as “an exercise of the police power of the State for the protection of the public safety, health and morals and to promote the general welfare and in fulfillment of the provisions of the Constitution of this State guaranteeing civil rights.”196 New Jersey’s LAD
195 N.J.S.A. 10:5 et seq.; L.1945, c. 169 as amended.
196 N.J.S.A. 10:5‐2.

TOGETHER North Jersey Fair Housing & Equity in Northern New Jersey
9-21
provides a broader definition of discrimination than the “protected classes” of the Federal Fair Housing Act. However, other than reporting requirements for multifamily housing, it does not require affirmative measures to reverse discrimination.
The LAD prohibits unlawful discrimination in employment, housing, places of public accommodation, credit and business contracts. Not all of the foregoing prohibited bases for discrimination are protected in all of these areas of activity. For example, familial status is only protected with respect to housing. Further information on LAD is presented in the Appendix D.
New Jersey Law against Discrimination (LAD) It is unlawful to subject people to differential treatment based on:
race
creed
color
national origin
nationality
ancestry
age
sex (including pregnancy)
familial status
marital status
domestic partnership or civil union status
affectional or sexual orientation
gender identity or expression
atypical hereditary cellular or blood trait
genetic information
liability for military service, and
mental or physical disability, perceived disability and AID and HIV status.
Mt. Laurel Doctrine 9.3.2
What is known as the “Mount Laurel Doctrine” was pronounced by the New Jersey Supreme Court in its “Mount Laurel I” landmark decision in 1975.197 This doctrine states that local authority to enact zoning legislation, as established in the New Jersey Constitution,198 must be exercised in favor of the “general welfare,” and that such general welfare is harmed by low‐density, exclusionary zoning regulations that have the effect of preventing the construction of affordable housing. It has been interpreted to mean that the general welfare is disserved by racial segregation in communities.
The Mount Laurel doctrine counteracts the effects of exclusionary zoning on the availability of affordable housing, and on the degree of racial segregation in New Jersey, by requiring municipalities to refrain from such practices, “at least to the extent of the municipality’s fair share” of the present and prospective need for affordable housing in the region.199
197 Southern Burlington NAACP v. Township of Mount Laurel, 67 N.J. 151 (1975)
198 New Jersey State Constitution, Article I, Section 6, Paragraph 2. (1947)
199 Brief of Proposed Amici Curiae, New Jersey State Conference of the National Association for the Advancement of Colored People and Latino Action Network, Supreme Court of New Jersey, In the Matter of the Adoption of N.J.A.C. 5:96 and 5:97 by the New Jersey Council on Affordable Housing, June 15, 2011, p. 6, citing Mount Laurel I, 67 N.J. at 174.

TOGETHER North Jersey Fair Housing & Equity in Northern New Jersey
9-22
The Mount Laurel Doctrine is significant, but limited to New Jersey as it is based on provisions of the New Jersey Constitution. The U.S. Supreme Court has upheld exclusionary zoning practices in decisions since the 1970s.200,201
New Jersey Fair Housing Act of 1985 9.3.2.1
Under New Jersey’s Fair Housing Act of 1985, the NJ State Legislature described the statute as “in the public interest in that it comprehends a low and moderate income housing planning and financing mechanism in accordance with regional considerations and sound planning concepts which satisfies the constitutional obligation enunciated by the Supreme Court. The Legislature declares that the State's preference for the resolution of existing and future disputes involving exclusionary zoning is the mediation and review process set forth in this act and not litigation, and that it is the intention of this act to provide various alternatives to the use of the builder's remedy as a method of achieving fair share housing.”202
This Act established the Council on Affordable Housing; a Registry of Housing Projects; Regional Contribution Agreements; requirements for municipal Housing Elements, Fair Share Housing Plans, and Fair Share Housing Ordinances; an Urban Housing Assistance Fund (through an amendment in 2008); a New Jersey Affordable Housing Trust Fund, and the authority for municipalities to collect fees on residential development to support affordable housing. The Act also authorized housing assistance programs by the New Jersey Housing and Mortgage Finance Agency that may take the form of grants or awards to municipalities, prospective home purchasers, housing sponsors, or as contributions to the issuance of mortgage revenue bonds or multifamily housing development bonds which have the effect of achieving the goal of producing affordable housing. 203
The Neighborhood Preservation Balanced Housing Program funded by the New Jersey Realty Transfer Tax was also established to provide municipalities and developers (for‐profit and non‐profit) with a Balanced Housing subsidy to provide gap financing for affordable housing projects whose other sources of public subsidy and private financing were not sufficient to be viable. 204 The program supports housing repairs and renovations, as well as new construction and conversions, for permanent, high quality, location efficient affordable housing that meets the demand for units affordable to low and moderate income families and individuals residing in New Jersey.
The New Jersey law defines “fair housing” in terms of financial affordability, not in the terms of civil rights for “protected classes” of individuals and households established in Federal law. As the New
200 Ritzdorf, Marsha (1997). Locked Out of Paradise: Contemporary Exclusionary Zoning, the Supreme Court, and African Americans, 1970 to the Present. Thousand Oaks: Sage Publications.
201 Levine, Jonathan (2006). Zoned Out: Regulation, Markets, and Choices in Transportation and Metropolitan Land‐Use. Washington, DC: Resources for the Future. p. 71.
202 See N.J.S.A. 52:27D‐303.
203 The New Jersey Housing and Mortgage Finance Agency was established pursuant to the New Jersey Housing and Mortgage Finance Agency Law of 1983 (P.L.1983, c.530, N.J.S.A. 55:14K‐1 et seq.).
204 http://nj.gov/dca/divisions/dhcr/offices/bh.html

TOGETHER North Jersey Fair Housing & Equity in Northern New Jersey
9-23
Jersey Law against Discrimination205 and both Federal and State courts have long outlawed overt racial discrimination in housing under contract law and other principles,206 the Mount Laurel doctrine addresses only economic segregation, with the inference that if opportunities for affordable housing are provided in all municipalities, that in itself will reduce other forms of segregation.
Council on Affordable Housing 9.3.2.2
The Council on Affordable Housing (COAH) is an agency within the New Jersey Department of Community Affairs (DCA) that is responsible for ensuring that all New Jersey municipalities provide their fair share of low and moderate income housing. COAH was created by the New Jersey Legislature in response to the series of New Jersey Supreme Court “Mount Laurel” decisions. The council is made up of 12 members appointed by the Governor of New Jersey and approved by the New Jersey Senate. COAH defines housing regions, estimates the needs for low/moderate income housing, allocates fair share numbers by municipality and reviews plans to fulfill these obligations.
In February 2010 the actions of COAH were suspended while COAH’s “third round rules” were in litigation. Despite six vacancies within the Council membership, COAH met in April 2014 to propose revised rules in response to the holdings of the 2013 New Jersey Supreme Court decision and subsequent rulings.
Zoning Regulations 9.3.2.3
Any New Jersey municipality under the jurisdiction of COAH (currently 300 municipalities statewide) must prepare a Housing Element and Fair Share Plan and submit it for COAH review and approval through a “petition for substantive certification.” The Housing Element is part of the municipality’s master plan as required by New Jersey’s Municipal Land Use Law,207 and it establishes the municipality’s “fair share” obligation. The Fair Share Plan describes mechanisms and funding sources by which the municipality proposes to address the affordable housing obligation in its Housing Element, including draft ordinances such as zoning ordinance amendments, as specified in COAH regulations.208
Sixty‐eight municipalities within the TNJ region have received substantive certification as of June 2014 (see Table 9‐6). While COAH certification provides some protection from litigation, the status of some certifications may be unclear given the proposal of new third round rules published in the New Jersey Register on June 2, 2014 (proposed to be effective November 17, 2014) governing COAH certification, Housing Elements, and Fair Share Plans.209
205 N.J.S.A. 5‐1, et seq.
206 Buchanan v. Warley, 245 U.S. 60 (1917), the U.S. Supreme Court held that a Louisville, Kentucky, city ordinance prohibiting the sale of real property to African Americans violated the Fourteenth Amendment, which protected freedom of contract. Levitt & Sons, 31 N.J. 514 (1960) and David v. Vesta, 45 N.J. 301 (1965) upheld New Jersey’s statues prohibiting racial discrimination.
207 N.J.S.A. 40:55D‐28b(3), implementing regulations at N.J.A.C. 5:99‐2
208 N.J.A.C. 5:99‐4.
209 Proposed Procedural Rules at http://www.nj.gov/dca/services/lps/hss/statsandregs/598_for_web.pdf. Proposed Substantive Rules at http://www.nj.gov/dca/services/lps/hss/statsandregs/599_for_web.pdf

TOGETHER North Jersey Fair Housing & Equity in Northern New Jersey
9-24
Table 9‐6: TNJ Region Municipalities Certified by COAH, 2010
Municipality ^=Highlands Municipality
Certification Date Municipality^=Highlands Municipality
Certification Date
Bergen County Monmouth County
Allendale Borough 10/14/09 Englishtown Borough 12/09/09
Cresskill Borough 09/08/10 Manalapan Township 07/15/10
Demarest Borough 03/10/10 Middletown Township 10/14/09
River Vale Township 03/10/10 Morris County
Rockleigh Borough 11/12/09 Boonton Town ^ 10/26/09
South Hackensack Township 08/12/09 Harding Township ^ 05/14/09
Essex County Netcong Borough ^ 10/14/09
Maplewood Township 06/10/09 Roxbury Township ^ 08/12/09
Montclair Township 08/12/09 Ocean County
Orange City 08/12/09 Pine Beach Borough 03/10/10
South Orange Village Township 01/13/10 Stafford Township 12/09/09
West Orange Township 12/09/09 Somerset County
Hunterdon County Bedminster Township ^ 12/09/09
Delaware Township 08/12/09 Bernards Township ^ 05/13/10
East Amwell Township 12/09/09 Franklin Township 07/15/10
Flemington Borough 07/08/09 Millstone Borough 12/09/09
Frenchtown Borough 05/14/09 Peapack‐Gladstone Borough ^ 09/09/09
Milford Borough ^ 07/08/09 Rocky Hill Borough 05/14/09
Raritan Township 07/15/10 Sussex County
Readington Township 10/14/09 Andover Township 10/26/09
Stockton Borough 09/09/09 Hardyston Township ^ 05/14/09
West Amwell Township 05/14/09 Sandyston Township 10/26/09
Middlesex County Union County
Cranbury Township 04/21/10 Union Township 09/08/10
East Brunswick Township 08/12/09 Warren County
Old Bridge Township 07/08/09 Blairstown Township 07/08/09
Piscataway Township 08/12/09 Freylinghuysen Township ^ 06/10/09
Plainsboro Township 06/10/09 Knowlton Township 10/14/09
South Plainfield Borough 10/14/09

TOGETHER North Jersey Fair Housing & Equity in Northern New Jersey
9-25
Analysis of its Implementation 9.3.2.4
Approximately 3.6 million housing units existed in New Jersey in 2010. As a baseline for evaluating the effectiveness of the Mount Laurel doctrine in New Jersey, estimates of affordable housing need vary substantially locally, regionally, and statewide, by source as well as over time. Further, different estimates are developed for needs for: • new affordable units for new low and moderate income households, • housing in need of rehabilitation, and • housing for severely cost‐burdened households. Despite its significance in fair housing, the New Jersey Supreme Court has rejected consideration of household cost burdens in determinations of need used to establish regional and municipal affordable housing obligations. Most housing advocates consider this omission to be a major shortcoming in the law. With every unit being extremely important for low‐ and moderate‐income households, and in the face of constant delays from litigation and housing market problems, the fact that over 60,000 “Mount Laurel” housing units have been developed throughout New Jersey since 1980 is an important benchmark measure of the program’s relative success (see Figures 9‐1 and Table 9‐7). Moreover, since 1983, nearly $1 billion was also generated through fees on market rate development to municipal and State affordable housing trust funds and regional contribution agreements while they were in effect (Table 9‐8). Nonetheless, municipal resistance to rezoning for inclusionary development can be seen in Table 9‐7 which indicates that only 28% of affordable housing is attributable to inclusionary developments, less than half of the supply of units from 100% affordable municipally sponsored units. More widespread use of smaller lots or other techniques can produce more inclusionary housing projects. The supportive housing share is overstated ‐‐ perhaps by 300 percent, in that supportive housing data is reported as bedrooms and such housing typically includes three or more supportive housing bedrooms per dwelling unit.
While there is disagreement regarding the total estimate of need for “Mount Laurel” affordable housing units, there is little doubt that the need is far from being satisfied. As the Mount Laurel doctrine “has been inconsistently and only incompletely implemented…it has not yet been able to overcome the continuing widespread use of exclusionary zoning, and housing segregation remains a critical issue in New Jersey today…In line with research linking exclusionary zoning and racial segregation, New Jersey today is more segregated, and has desegregated less quickly, than the nation as a whole.”210
210 Brief of Proposed Amici Curiae, New Jersey State Conference of the National Association for the Advancement of Colored People and Latino Action Network, Supreme Court of New Jersey, In the Matter of the Adoption of N.J.A.C. 5:96 and 5:97 by the New Jersey Council on Affordable Housing, June 15, 2011, p. 6

TOGETHER North Jersey Fair Housing & Equity in Northern New Jersey
9-26
Figure 9‐1: Total Affordable Housing Units Produced Under the Fair Housing Act

TOGETHER North Jersey Fair Housing & Equity in Northern New Jersey
9-27
Table 9‐7: Total New Affordable Housing Units Built in New Jersey by Type, 1980‐2012
HousingType Units %
100% Affordable‐Municipally Sponsored Units 34,408 56.6%
Affordable Units in Inclusionary Developments 17,080 28.1%
Supported and Special Needs Housing (bedrooms) 7,285 12.0%
Accessory Apartments 111 0.2%
Assisted Living Facil ities 1,146 1.9%
Other 716 1.2%
Total 60,746 100.0%
Source: Data recorded by municipal i ties in an electronic tracking and monitoring
system and reported to NJDCa, by emai l from NJDCA, Loca l Planning Services ,
March 29, 2012. Prepared by David N. Kinsey, FAICP, Apri l 23, 2012
Note:
1) NJDCA reports an additional 3,806 new affordable hous ing units were bui l t
with funding under regiona l contribution agreements ;
2) Low Income Hous ing Tax Credit production of 27,000 affordable renta l units ,
most 100% affordable, in 500+ projects s ince 1986 with some overlap with 34,408
affordable units in 100% affordable developments counted by COAH;
3) Total hous ing bui l t 1983‐2013 = 766,553 (est.)

TOGETHER North Jersey Fair Housing & Equity in Northern New Jersey
9-28
Table 9‐8: Funds Generated for Affordable Housing in New Jersey under Mount Laurel, 1983‐2013
Unresolved 3rd Round Regulations (Judicial & Legislative) 9.3.2.5
On June 2, 2014, new regulations211 were proposed by the New Jersey Council on Affordable Housing (COAH) to be effective November 17, 2014. These regulations were in response to the New Jersey Supreme Court decision212 of September 26, 2013 and subsequent rulings that invalidated the prior COAH Third Round rules as being inconsistent with the methodology set forth in the New Jersey Fair Housing Act, and required new regulations to be adopted. The COAH Third Round rules were initially promulgated in December 2004, to apply a “growth share” methodology to affordable housing calculations from 1987 through 2013; these rules were repeatedly challenged and rendered ineffective through their invalidation in 2013.
The new proposed rules call for a total of approximately 110,000 additional units of affordable housing throughout the state by 2024, comprising more than 40,000 new dwellings and more than 60,000 dwellings to be rehabilitated. The proposed rules would retroactively reduce the 1987‐1999 Second Round obligations by over 18,000 homes, and patterns of need among municipalities are changed substantially from those of 15 years ago. As new municipal fair share housing plans will be required, and as continued litigation is likely, enforcement of the Mount Laurel doctrine through the New Jersey Fair Housing Act and the Council on Affordable Housing will not be available as a tool for ensuring the availability of affordable, fair housing in the near future.
NJ Strategic Housing Plan (2008) 9.3.3
New Jersey’s Strategic Housing Plan Act of 2008213 called for the formation of a 15‐member State Housing Commission to prepare and maintain an Annual Strategic Housing Plan that would:
provide guidance and direction with respect to the policies and strategies to be pursued by State agencies with respect to housing which are incorporated into the plan.
prepare and adopt the Annual Strategic Housing Plan;
211 Proposed N.J.A.C. 5:99 Substantive Rules and proposed N.J.A.C. 5:98 Procedural Rules.
212 Supreme Court of New Jersey, In re Adoption of N.J.A.C. 5:96 and 5:97, 215 N.J. 578 (2013)
213 P.L. 2008, c.26, s.21 et seq.; N.J.S.A. 52:27D‐329.10 et seq.
Source $ Millions
Development Fees and In Lieu Payments to Municipal Housing Trust Funds 389$
216$
325$
930$
Source: NJ Counci l on Affordable Hous ing (COAH); Prepared by David N. Kinsey, FAICP.
Regional Contribution Agreements
Supported and Special Needs Housing (bedrooms)
Total

TOGETHER North Jersey Fair Housing & Equity in Northern New Jersey
9-29
hold public hearings and other activities as may be desirable to ensure adequate public input into the preparation of the plan and increase public awareness of the strategies and activities contained in the plan; and
gather and disseminate such information on housing needs and strategies as may be useful for the work of the commission and informative to the public.
The legislation was subsequently revoked but several activities of importance for advancing fair and affordable housing in New Jersey were enumerated. Further information about this law, including the contents and considerations of an Annual Strategic Housing Plan, are included in Appendix E.
9.4 Fair Housing Observations from TNJ Housing Baseline Topic Report
The March 2013 Housing Baseline Topic Report214 for TNJ, prepared by Alan Mallach of the Housing and Community Development Network of New Jersey, characterizes existing conditions, regional needs, patterns, trends, challenges and opportunities for housing in the thirteen‐county TNJ region. The report presents a substantial amount of information at the regional and county scale, supplemented by illustrative local data highlighting information for urban centers or to demonstrate differences among communities. Key findings of the report are summarized in Table 9‐9.
The report recommends four desired long‐term outcomes for TNJ’s Regional Plan for Sustainable Development, including a series of measurable indicators (identifying data sources but not specific targets) for each:
A healthy and sustainable housing stock and housing market;
Strong neighborhood and community quality;
Equitable geographic distribution of housing; and
Sustainable and equitable patterns of new development.
The housing report examines forces for both concentration and deconcentration of opportunities for fair housing and equity in the Together North Jersey region.
214 The final report is posted on www.togethernorthjersey.com .

TOGETHER North Jersey Fair Housing & Equity in Northern New Jersey
9-30
Table9.9:KeyFindingsofTNJHousingBaselineTopicReport Housing problems continue to be pervasive throughout northern New Jersey, with the greatest problem being
one of housing affordability, followed – at some remove – by overcrowding. Although nearly all homes and apartments contain adequate heating, plumbing and kitchen facilities, a significant percentage of northern New Jersey households still suffer from inadequate housing and neighborhood conditions, with renters much more likely to experience such conditions than homeowners.
Over half of all renters spend more than 30% of their income for shelter, with 2 out of 9 spending over 50% of their income for shelter. These cost‐burdened renters are overwhelmingly low and very low income households.
While Housing Choice Vouchers are somewhat more widely distributed around the region, 30 years after the Mt. Laurel II decision, subsidized affordable housing is still overwhelmingly concentrated in the region’s older central cities.
While housing prices rose throughout the region during the boom years prior to 2006‐2007, and have fallen since, both the rise and in particular the fall have been more pronounced in the region’s older central cities. While the region as a whole appears to be recovering strongly from the housing bust, many older cities – particularly in the Newark area – are still suffering from seriously impaired market conditions. Jersey City and New Brunswick, however, are recovering better than other older cities.
Foreclosures have had a powerful destabilizing effect in the region, particularly in the region’s older cities and inner ring suburbs. The Newark area has been hardest hit overall, with the two hardest hit municipalities being Irvington and Plainfield, both of which have seen foreclosure filings on over 30% of their 1 to 4 family properties.
Geographic disparities in terms of the distribution of the region’s population by race, ethnicity and economic condition are severe; low income households and people of color continue to be heavily concentrated in the region’s central cities and select inner ring suburbs such as Irvington or Roselle.
The federal role in housing in the region has diminished sharply in recent years; although in dollar terms, federal funding for housing still represents the greatest share of all public funds, almost all of these funds are in the form of block grants or allocations that are administered at the state or local level.
While the state role in housing has grown in recent decades, in recent years the amount of state resources going to affordable housing – particularly construction and rehabilitation of affordable housing – has dropped dramatically.
While many individual state and regional activities and policies affect housing, from the regional policies in the Highlands and Pinelands to the regulations of the Department of Environmental Protection, the state lacks any overall housing plan or strategy; moreover, such plans and policies that exist tend to focus on where housing should not be developed, rather than encouraging appropriate housing in appropriate locations.
Provision of affordable housing in the region faces severe challenges in the coming years, including limited public resources, political opposition, a tax system that discourages affordable housing, and an uncertain economic and housing market climate.
Demographic and cultural change represent both challenges and opportunities; key changes affecting the region include the aging of the Baby Boom generation, changes in the distribution of households by type, continued immigration into the region, and potential shifts in consumer preferences toward more walkable and mixed‐use communities.

TOGETHER North Jersey Fair Housing & Equity in Northern New Jersey
9-31
Concentration 9.4.1
The report identifies several existing patterns and policies that tend to concentrate communities of poverty or segregation:
The lack of housing affordability represents a strong force limiting the ability of any income‐constrained population to relocate or to deconcentrate.
Median house values in most parts of the region are more than double the national median house values. Median rental prices tend to be 12% to 50% above the national median gross rent. When the relatively high property taxes and utility costs are taken into account, the disparity in homeownership costs is much greater than the disparity in house values. These factors in combination concentrate lower income households into available lower cost rental housing.
Latino renter households are significantly more likely to be cost burdened (housing costs over 30% of gross income) than other renters in the region, which may be a concentrating factor leading to economic and ethnic segregation to areas of lower cost rental housing.
Housing mortgage foreclosures, while present throughout the region, are concentrated in the region’s older cities and inner ring suburbs, particularly in the Newark area. Foreclosures represent a loss of assets for households, diminishing their economic resilience and exacerbating concentrations of poverty.
Existing patterns of race, ethnicity, and economic status demonstrate persistent patterns of racial and economic segregation and concentrations of race and poverty.
At the time of the writing of the report, the Council on Affordable Housing third round rules was pending review by the New Jersey Supreme Court, undermining the very enforcement regime seeking to counteract historic patterns of concentration and economic segregation.
Overall, New Jersey’s land use and regulatory system, particularly when taken in context with municipal dependence on property taxes, discourages higher density and lower cost development by favoring presumed fiscal benefits over housing and human needs. Most land continues to be zoned for higher cost single family homes and for non‐residential development at levels exceeding the economic demand for such uses.
The report examines patterns that suggest only delimited areas of high opportunity:
Subsidized affordable housing remains an opportunity that is concentrated in the region’s existing areas of high concentrations of poverty, particularly the larger urban centers.
An analysis of recent housing sales price data in the region shows a clear pattern of irregular concentric rings in which concentrated low value cores are surrounded by areas of medium value, in turn surrounded by high value (housing prices over $400,000) areas before tapering off to medium value exurban areas beyond the efficient commuting perimeter.
Deconcentration 9.4.2
The report identifies policies that can deconcentrate communities of poverty or segregation:
The incidence of cost burden (housing costs more than 30% of gross income) is relatively lower for extremely low income households than for the next higher income categories, suggesting that housing vouchers and other programs are benefiting these communities.

TOGETHER North Jersey Fair Housing & Equity in Northern New Jersey
9-32
The report also examines patterns and policies that tend to deconcentrate areas of high opportunity:
Subsidized affordable housing opportunities established in suburban areas through the Mount Laurel II process have helped to provide greater access to areas of higher opportunity, though marginally.
Developer fees collected by municipalities for the construction of affordable housing under the New Jersey Fair Housing Act were greatest in the suburban areas with strong housing markets, which should increase deconcentration of affordable housing opportunities when these funds are invested in the construction of new affordable housing units.
Several factors appear to be supporting a greater consumer preference for walkable communities. The region’s walkable older suburban towns have remained in high demand, and redevelopment in cities and inner suburbs can strengthen development in traditionally walkable communities including an affordable housing stock, thereby deconcentrating areas of high opportunity.
9.5 Fair Housing Implications of Housing Market Collapse
The nationwide collapse of housing markets in 2006 and 2007 heralded not only an economic recession but increased difficulties in gaining fair housing choice or equitable access to opportunity due to foreclosures, neighborhood impacts, and loss of mortgage credit.
Foreclosure 9.5.1
Foreclosures on existing home mortgages resulted in thousands of households and families in the TNJ Region losing their homes, typically their primary economic asset, forcing them to re‐enter the housing market as renters at a time when their financial capacity was weakest. While housing mortgage foreclosures within the TNJ region have tended toward concentration in urban centers and inner suburbs, they were not limited to these areas. The resulting dislocations of households often had adverse secondary effects of reducing access to places of opportunity such as high quality schools and healthier environments.
The flood of new entries into the lowest levels of the housing market also created a “seller’s market”. Home sellers and landlords could deny homeseekers in protected classes without economic or other consequences unless individuals took the initiative to report fair housing violations.
Neighborhood Impacts 9.5.2
In many parts of the region, particularly urban areas, concentrations of housing mortgage foreclosures have destabilized neighborhoods and even entire municipal budgets and services. In areas of foreclosed properties, or even in areas of financial stress, occupied properties may also suffer from reduced maintenance or blight as property values decline, in turn exacerbating already reduced access to capital for investments in property improvement and enhancement. While federal Neighborhood Stabilization Program funds help to address these issues, they are increasingly limited if not fully expended, resulting in only a modest role in stabilizing the areas where they have been applied.
Availability of Mortgage Credit 9.5.3
In 2006‐2007, the mortgage finance system throughout the United States collapsed as a result of the emerging subprime mortgage industry and the growth of private label mortgage securitization. As a result, access to mortgage financing for homeownership became increasingly limited. While this has eased slightly in recent quarters, first‐time buyers, low and moderate income households, and buyers in

TOGETHER North Jersey Fair Housing & Equity in Northern New Jersey
9-33
urban neighborhoods that have experienced high foreclosures and significant value loss are now experiencing great difficulties in obtaining mortgage approvals.
9.6 Fair Housing Impacts of Hurricane Sandy in New Jersey
A 2013 report by Enterprise Community Partners, a large nonprofit advocate for Affordable Housing, provided extensive data by county on Hurricane Sandy Impacts on fair housing in nine New Jersey counties, including two counties (Atlantic and Cape May) outside of the TNJ Region. 215 In summary, their report found:
About 180,000 low‐income households and 75,000 senior households resided directly in the storm surge area in the nine New Jersey counties studied. Because these households often lacked substantial savings and depended more heavily on public transportation and other services, they were particularly vulnerable to economic stresses and service disruptions.
Almost 11,000 public and affordable housing units (LIHTC, Section 8 and Section 202) were located within the storm surge area across New Jersey counties. This represented 14 percent of the total public and affordable units and 18 percent of all public housing units across these counties.
Sandy‐impacted areas had slightly lower median incomes than exhibited for New Jersey counties with the weighted median household income for the surge area being $71,371 compared to $75,303 for the study area counties in New Jersey.
Of the households residing in the storm surge area across the nine counties, 47 percent were renters, while 53 percent were homeowners. For seniors, 26 percent were renters and 74 percent were homeowners.
On average, the affected areas contained a larger portion of the region's newer housing stock (22 percent of units built after 2005) than its older housing stock (17 percent of units built before 1939). This may be a positive characteristic, since newer buildings are built to more recent building codes and thus may sustain less damage from flood waters. On the other hand, it may also be a negative characteristic if many buildings need to be substantially rehabbed.
Select statistics on housing occupancy rates and percentage of low‐income households for the seven affected TNJ counties are presented in Table 9‐10. Low‐income households accounted for 37% of households exposed to storm surges.
In response to complaints from civil rights organizations including the NAACP, Latino Action Network, and Fair Share Housing Center, HUD announced a settlement agreement with the State of New Jersey to make more funds available to assist with the recovery from Hurricane Sandy.216 Among a long list of provisions, the State of New Jersey agreed to:
Provide $215 million of Community Development Block Grant Disaster Recovery funds (CDBG‐DR) in addition to the $379 million previously allocated to replace and develop multifamily housing in the nine counties most impacted by Sandy, giving priority to three counties with the most damage. At least 60% of the units must serve families with children.
215 https://s3.amazonaws.com/KSPProd/cache/documents/678/67892.pdf
216 http://portal.hud.gov/hudportal/documents/huddoc?id=NewJerseyAgreementsigned.pdf

TOGETHER North Jersey Fair Housing & Equity in Northern New Jersey
9-34
Table 9‐10: Hurricane Sandy Impacts on TNJ Counties, Selected Statistics
County Households Exposed to Storm Surge
Low‐income Households (<45K) Occupied Housing Units
Total County
Affected#
Affected %
Total County
Affected #
Affected %
Bergen 12,640 90,460 10,506 11.6% 333,073 33,156 10.0%
Essex 7,253 115,530 5,909 5.1% 276,441 10,635 3.8%
Hudson 46,062 97,399 15,252 15.7% 240,526 58,923 25.0%
Middlesex 12,837 76,058 7,064 9.3% 278,513 19,964 7.2%
Monmouth 27,538 63,384 10,697 16.9% 233,120 33,127 14.2%
Ocean 64,682 84,020 13,033 15.5% 222,863 43,259 19.4%
Union 4,651 62,229 3,259 5.2% 184,584 6,668 3.6
TOTALS: 175,663 589,080 65,720 11.2% 1,769,120 205,732 11.6%Source: Enterprise Community Partners, 2013.
Establish a $15 million pool to help renters displaced by Sandy while they wait for replacement homes to be built.
Reconsider rejected applications for a program that provides up to $150,000 to homeowners to restore Sandy‐damaged homes. Nearly 80% of the rejected applications were incorrectly rejected.
Provide a comprehensive approach to serving people with Limited English Proficiency who would benefit from the state’s HUD‐funded recovery activities, including providing interpreters at housing recovery centers, language phone lines, and translation of key documents.
Provide enhanced outreach to lower income communities that have been underserved.
Provide an additional $10 million to help people with special needs impacted by Sandy.
Provide $10 million to help people in manufactured homes rebuild or replace their homes.
9.7 Zoning Effects on Fair Housing
Zoning and other land use ordinances have significant impacts on the availability of fair and equitable housing. Exclusionary zoning, with the purpose of excluding lower income households, was discussed in Chapter 5 of this FHEA, as was housing provisions for the disabled. Alex Schwartz writes:
The private market has never provided affordable and decent housing for very low‐income households. The cost of maintaining housing simply exceeds what these households can afford. The reductions in housing cost made possible by loosening building codes and zoning regulations will not go nearly far enough. Left to their devices, poor families are often forced to accept levels of overcrowding and physical deficiency that other families would shun.217
Low‐income housing was a profitable enterprise in the 19th century only by maximizing density and minimizing amenities to the degree that public health and safety was threatened, leading to the establishment of minimum standards through zoning ordinances and building codes. These minimum standards have the effect of maintaining housing of acceptable quality but increasing cost and reducing the availability of housing for lower income households, including those employed at low wages or on fixed income such as the elderly and disabled.
217 Alex F. Schwartz, Housing Policy in the United States. Second Edition. 2010. New York: Routledge, p. 317.

TOGETHER North Jersey Fair Housing & Equity in Northern New Jersey
9-35
Finding the zoning requirements that satisfy price, rent, costs, space, accessibility, and other requirements for fair and equitable housing units while minimizing government or project based subsidies (such as COAH affordable unit set‐asides) remains a work in progress.
9.8 Loopholes of Age Restricted Households, Family Exclusion
Age restricted communities are authorized under the Federal Fair Housing Act, as amended by the Housing for Older Persons Act of 1995, and in New Jersey enabling law.218 Age‐restricted housing developments in New Jersey require at least one member of each household to be age 55 or older. Other members of the household may be younger, but all residents must be at least 18. The 55+ communities are designed for the active, independent retiree and offer no medical services or personal care assistance. However, many communities handle most of the chores of home ownership, such as yard work, allowing retirees to maximize the time they spend pursuing leisure activities.
Age‐restricted communities, in which 80% or more of the occupied homes have 55 and older adults living in them, are exempt from the prohibition against familial status discrimination. This exemption protects these communities from having a discrimination complaint filed against them by families with children under 18 years of age. There are many age‐restricted communities in the TNJ planning region, particularly in central and coastal counties.
Hurricane Sandy Exemption 9.8.1
As a result of Hurricane Sandy, HUD is excluding evacuee households from the 80% threshold so that 55 and older communities can help storm‐ravaged families of all ages and still retain their familial status exemption. HUD took similar action in Louisiana, Mississippi, and Alabama following the devastation of Hurricane Katrina in 2005.219 Under HUD's new guidance, a private provider of housing for older persons anywhere in the country may make units available to evacuees under the age of 55 and continue to qualify for the Fair Housing Act's familial status exemption, as long as the vacant units are made available to evacuees without restriction on the basis of familial status.
Evacuees are considered anyone who lived in a county declared to be a disaster area and who has been designated for individual assistance from the Federal Emergency Management Agency (FEMA). HUD does not require that someone show proof of being an evacuee. In the event of an investigation of a complaint of discrimination under the Fair Housing Act, HUD will accept a self‐certification or other evidence from housing for older persons that the evacuees formerly resided in one of the affected counties. Any time limit on admitting and housing younger evacuees is at the discretion of the age‐restricted communities.
Age‐restricted communities are not required to provide housing to evacuees younger than 55 years of age under the HUD guidelines. The decision to accept younger evacuees is completely voluntary. However, communities that decide to open their doors to younger evacuees must have a consistent, nondiscriminatory admittance process in place. Also, like all housing providers, 55 and older
218 N.J.S.A. 45:22A‐46.1 et seq.
219 http://portal.hud.gov/hudportal/documents/huddoc?id=sandyguidance.pdf

TOGETHER North Jersey Fair Housing & Equity in Northern New Jersey
9-36
communities must not discriminate on the basis of race, color, religion, sex, national origin and disability.
Age‐restricted communities are not required to impose different terms and conditions on families with children. Housing for older persons may restrict families with children from benefits of the facility or otherwise treat family households differently than senior households, including use of a swimming pool or clubhouse, as long as those actions do not violate state or local law.
Where age‐restricted housing admits evacuees without regard to age and familial status, HUD will consider the units where younger evacuees reside to be unoccupied units, and will exclude them from the count of occupied units, 80% of which must be occupied by at least one person 55 or older. 220
Conversion of Age‐Restricted Developments 9.8.2
The oversupply of age‐restricted housing in New Jersey together with a deteriorating economy made it very difficult for developers to market approved age‐restricted units, resulting in the complete abandonment of some projects. To stimulate the building industry while at the same time providing for affordable workforce housing, legislation, known as S‐2577, was enacted in 2009 to permit conversion of certain age‐restricted housing developments to housing without age restrictions, subject to approval by a municipal planning board or zoning board.
For a project to be eligible for conversion, it must meet all of the following requirements:
Preliminary or final approval for construction was granted prior to July 2, 2009.
The developer must not be holding a deposit for any unit in the development, or have conveyed any unit within the development.
The developer must agree to set aside 20 percent of the units as affordable housing in accordance with the Council on Affordable Housing rules.
A conversion application had to be submitted before July 31, 2011; however, the approving board was permitted to extend the deadline by an additional 24 months if it found that poor economic conditions continued to adversely affect the real estate market in New Jersey. It is not known how many developments applied for and received approval to convert age‐restricted developments to conventional developments.
220 Treating units occupied by evacuees as unoccupied units and excluding them from the 80% calculation is consistent with how other types of units are treated under the Housing for Older Persons Act (HOPA). Other units similarly excluded from the 80% calculation include: (1) unoccupied units; (2) units occupied by employees of the housing for older persons who are under the age of 55, and who provide substantial management and maintenance services to the housing for older persons; and (3) units occupied solely by persons who are necessary or essential to provide medical and/or health and nursing care services as a reasonable accommodation to residents.

TOGETHER North Jersey Fair Housing & Equity in Northern New Jersey
9-37
9.9 Housing Mobility Counseling
Housing counseling for voucher holders will always result in higher utilization of housing vouchers. Mobility counseling consists of all or most of search assistance, listings of available units, van tours and transportation to see units if necessary, community information, a resource room, assistance with voucher paperwork and inspections, and follow up. Orientation and workshops may provide information on high opportunity areas, tenant/landlord rights and responsibilities, home maintenance, financial management, schools, and building community. One on one counseling is usually highly effective. Some counseling programs are teamed with financial assistance such as loans for security deposits, incentive payments for households to move to high opportunity areas, or paying holding fees for landlords.221
A recent study222 analyzed the Baltimore Mobility Program, an assisted mobility voucher program that has helped over 2,000 low‐income African American families move from high‐poverty, highly segregated neighborhoods in Baltimore City, Maryland to low‐poverty, racially mixed neighborhoods throughout the Baltimore region since 2003. To be eligible for a housing voucher, families had to agree to move to a middle‐class suburban neighborhood (less than 10 percent poor, less than 30 percent black, less than 5 percent of families living in subsidized housing). Parents who participated in the intensive mobility counseling of this program raised their expectations for what neighborhoods, homes, and schools can provide for their children and themselves. Social structure, experience, and policy opportunities influenced preferences and outcomes, resulting in approximately two‐thirds of the 2,000 families remaining in their new low poverty communities.
Counseling and training on the use of vouchers is also necessary for landlords supplying housing. Intensive recruiting of landlords with units in target neighborhoods is needed, as these target neighborhoods are in high opportunity areas where landlords do not typically participate in the voucher program. This work requires:
ongoing relationship building;
tenant and landlord mediation;
special services (e.g., expedited inspections, direct deposit, payment guarantee, etc.); and
financial assistance (e.g., tax credits or lease bonuses) to landlords.
Some NGOs that provide mobility counseling also provide low‐interest, low‐down payment loans for landlords who buy properties and accept vouchers for these properties in high opportunity areas.
221 Portions of this description based on Christine Klepper, Housing Choice Partners of Illinois, Inc., presentation at Moving to Higher Opportunity: Exploring Options and Opportunities for Housing Mobility, January 9, 2014. (HUD Summit).
222 “Living Here has Changed My Whole Perspective”: How Escaping Inner‐City Poverty Shapes Neighborhood and Housing Choice. Jennifer Darrah and Stefanie DeLuca. Journal of Policy Analysis and Management. Volume 33, Issue 2, pages 350–384, Spring 2014

TOGETHER North Jersey Fair Housing & Equity in Northern New Jersey
10-1
10 Conclusions and Recommendations
The previous chapters presented the purposes for this report, background data and maps of factors defining Communities of Concern and Areas of Opportunity, the impacts of physical infrastructure and public investments on these areas, and an assessment of fair housing issues. This final chapter summarizes the challenges and the potential for providing fair and equitable housing in the TNJ planning region. It outlines a vision and recommends strategies and actions for inclusion in the TNJ Regional Plan for Sustainable Development.
10.1 Challenges to Fair & Affordable Housing in the Region
Fair housing protections are a relatively recent function of government in the United States—and one that has proven to be challenging for our federal and State systems of government where the regulation of land use and housing development are largely controlled at the local level of government, as is the case in the jurisdictionally fragmented TNJ Region.
While “fair housing” is by law considered a civil right, it is defined differently by the Federal and New Jersey State law. As discussed in earlier chapters, Federal law focuses on the ability of individuals and households in “protected classes” defined by factors such as race, ethnicity, family status, and disability to access housing opportunities while New Jersey law primarily addresses discrimination by race and household income. Despite decades of governmental efforts to subsidize affordable housing and to address disparities in housing opportunities open to households of different races, ethnicities, and incomes, earlier chapters have documented that the region is divided: the lower‐income and minority residents of the older urban areas and inner suburban rings of the region have far less favorable access to higher quality housing and neighborhoods, quality schools and employment opportunities than the generally more affluent, non‐Hispanic white residents of the outer suburban rings of the region. Further, longer commutes consume more capacity of transportation systems, on average, per commuter, creating less favorable access for everyone in the region.
Federal Fair Housing Act Enforcement Has Been Indirect and Underfunded 10.1.1
The Federal government has limited powers to control land use, construct affordable housing or initiate legal action to address overt acts of racial discrimination by enforcing the provisions of the Fair Housing Act. The U.S. Department of Housing & Urban Development (HUD), the agency mandated to enforce the Fair Housing Act, has modestly funded non‐profit and state agencies to investigate individual claims of discrimination and has relied upon these local governments and nonprofits receiving federal housing and community development funds to conduct analyses of barriers to fair housing choice and otherwise enforce the Fair Housing Act.
Affordable Housing Programs Have Not Resulted in Fair Housing Outcomes 10.1.2
This FHEA concludes that federally funded, project‐based affordable housing construction programs have, in many situations, actually reinforced the patterns of residential segregation and isolation and the concentration of lower‐income racial and ethnic minorities in the neighborhoods of older urban communities in the TNJ Region.

TOGETHER North Jersey Fair Housing & Equity in Northern New Jersey
10-2
Additionally, federal and state‐funded tenant‐based housing voucher programs have failed to achieve their housing mobility potential for a variety of reasons:223
Program Limitations. Rent levels and the standards for occupancy are often unattainable for low‐ and moderate‐income households moving into new neighborhoods. Housing vouchers have proven to be insufficiently portable, as the number and value have failed to support moves to areas of higher opportunity within a larger region (e.g. county or multi‐county). Public Housing Authorities (PHAs) vary widely in their performance, procedures and business practices. HUD regulations provide few incentives for helping families move to less segregated, higher opportunity areas. For example, no credit is currently given to PHAs that relocate families to lower poverty communities outside the PHA jurisdiction, and the PHA may lose 80 percent or more of its administrative fee despite its greater effort.224 HUD payments based on “fair market rent” are substantially lower than current market rents in most suburbs.
Fair Housing and Discrimination. Gaining timely relief from a complaint of housing discrimination is difficult, limiting the effective enforcement of fair housing laws. Enforcing a standard based on “protection of sources of income” may be unattainable as aspects of housing policy have been found to create instability and rapid turnover in jobs and housing tenancy. Reasonable accommodation and modification are not provided for most tenants with special needs. Overall, counseling resources have proven insufficient to effectively inform PHA staff, tenants, and landlords about fair housing (brochures are less expensive but not cost‐effective).
Family Needs. Households that may qualify for government benefits may be unable to satisfy the selection criteria that landlords require for credit, rental history, and criminal background. Young children may behave poorly during a site visit, resulting in disqualification. For lower income families, the costs of moving and a security deposit may make relocation unaffordable. Transportation and child care to support the family may not be readily available. Families, particularly those with teenage children, may have logistical or emotional difficulties staying in high opportunity areas if they are unable to adjust to separation from their existing support networks or to obtain transportation or employment. Long‐term exposure to high poverty and high crime areas can foster sub‐optimal coping strategies, leading persons to retreat into their homes instead of aspiring to wider horizons.
Institutional / Other. Overall, the landlord may lack necessary information which may function as a barrier to housing mobility. Landlords are also often unwilling to assume the administrative burden of navigating the PHA process to accept housing vouchers. PHAs may not be willing or able to absorb the costs of efforts to encourage housing mobility through counseling or outreach to landlords to accept Housing Choice Vouchers.
223 Based on Jennifer Lee O’Neil presentation to HUD Moving to Higher Opportunity Summit, Blue Bell, PA, January 9, 2014.
224 Poverty & Race Research Action Council, “Affirmatively Furthering Fair Housing at HUD: A First Term Report Card.” Washington, D.C.: Poverty & Race Research Action Council. (January 2013)

TOGETHER North Jersey Fair Housing & Equity in Northern New Jersey
10-3
Municipal Land Use Zoning Remains Exclusionary and Counterproductive 10.1.3
Resistance has limited the effectiveness of the largest federally‐funded housing mobility program in the State, the Housing Choice Voucher (HCV) Program.
The New Jersey Council on Affordable Housing (COAH) has encouraged incentives for communities to zone land to permit developers to construct mixed‐income inclusionary housing developments that have yielded affordable housing units, but also encountered strong resistance in a number of municipalities. Inclusionary housing programs and projects are faulted for many reasons ‐‐ dependence on private market rate housing permits too much development density to subsidize affordable housing; communities hosting lower value ratables are burdened with adverse fiscal impacts; existing residents should not be forced to bear the expense of educating lower‐income children; inclusionary projects consume developable land and open space; lower income households will not abide by community standards. These objections have fueled opposition to the program and limited its full potential to supply and disperse modest‐cost housing in the suburbs. In recent years, the elimination of Regional Contribution Agreements (RCAs) under COAH has removed a reliable funding source to rehabilitate dilapidated properties and create affordable housing units on a regional basis. Moreover, internal subsidies within inclusionary development are sometimes insufficient to effectively finance affordable housing; there are very limited financial incentives available to municipalities to encourage affordable housing.
Exclusionary zoning limits opportunities to convert foreclosed and abandoned single family housing into denser, multi‐family affordable housing that is occupied, safe, and well maintained. Exclusionary zoning also limits the potential and profitability for redevelopment or adaptive reuse of vacant houses, office and retail space for lower cost or inclusionary housing. In the absence of affordable units at or near Fair Market Rent, the HCV program has limited potential to be effective at dispersing persons to places of higher opportunity.
The preceding chapters of this FHEA have shown that exclusionary zoning has proven counterproductive to the region’s economic health as well as for local economic development. The region’s oversupply of nonresidential development has become unsustainable and underused, in part, due to the lack of a diverse and affordable housing supply for the region’s workforce. There is a vicious cycle of challenges that arise from this policy: a lack of housing opportunity raises wage costs to attract a locally scarce workforce; fewer households have sufficient disposable income to sustain retail and service businesses; and property taxes rise and service delivery falls as the ratable base declines from underutilized and vacant properties.
Housing Policy is Education Policy 10.1.4
This FHEA has documented the effects of segregation and isolation on the achievement levels of students residing in and attending schools in both high minority/low income neighborhoods and in so‐called “communities of concern”, including inner‐ring older suburbs that are increasingly exhibiting signs of fiscal and social distress.

TOGETHER North Jersey Fair Housing & Equity in Northern New Jersey
10-4
A recent civil rights study, conducted by the Poverty and Race Research Action Council and the Furman Center at NYU,225 ranked neighborhood schools serving subsidized families and found that several schools analyzed in Northern New Jersey were among the worst performing in the nation. The rankings were uniformly dismal regardless of the assisted housing program (public housing, LIHTC, project‐based Section 8, or for households using housing choice vouchers). These grim findings should be a wake‐up call for the citizens of the TNJ region as well as for the families and children attending these schools.
Tax Policy is Housing Policy 10.1.5
Resistance to locating assisted housing in suburban areas has often been couched in terms of the presumed tax burden of educating poor children. A recent study conducted by Rowan University geographers226 has found that, despite the Mt. Laurel Doctrine’s imperative that towns zone suitable locations for inclusionary housing, suburban towns in Monmouth and Somerset counties that were examined continue to employ fiscal zoning practices, such as over‐zoning for nonresidential uses and for lower‐density large lot housing, to maximize real estate ratables and minimize presumed educational expenses associated with smaller lot and multi‐family housing developments.
Incentivizing communities to reconsider exclusionary practices may be one effective means for addressing fiscal objections to housing lower‐income families. In New Jersey, payment in lieu of tax (PILOT) formulas, extended to redevelopment projects and tax exempt land uses, typically fund general units of government but deny PILOT payments to school districts. Options to this abatement approach have been explored in New Jersey and other states.227 Funding educational expenses from the existing municipal government share of PILOT contributions from subsidized housing developments, as has already been done in several communities, could address this objection to permitting affordable housing in communities with quality schools.
New Jersey’s school funding formula228 defines an annual per pupil amount necessary to support the core curriculum program (“base” cost) for every pre‐K to grade 12 student in local public and county vocational school districts, as well as supplemental funding needs to support programs, including pre‐K programs, for poor (at‐risk) students, limited English proficiency (LEP) students, and students with disabilities, regardless of where those students live. Thus, the supplemental funding provisions address the additional costs of educating students with special needs, including lower income students. However, despite court orders, the State government’s tax policy and budget priorities have failed to
225 Do Federally Assisted Households Have Access to High Performing Public Schools? Ingrid Gould Ellen and Keren Mertens Horn. Washington, D.C.: Poverty and Race Research Action Council, November 2012.
226 Evidence of Persistent Exclusionary Effects of Land Use Policy within Historic and Projected Development Patterns in New Jersey: A Case Study of Monmouth and Somerset Counties. John Hasse, Ph.D., AICP, John Reiser, and Alexander Pichacz. Glassboro, New Jersey: Rowan University. 2011. http://gis.rowan.edu/projects/exclusionary/exclusionary_zoning_final_draft_20110610.pdf
227 A Programmatic Examination of Municipal Tax Abatements. State of New Jersey, Office of the State Comptroller. Trenton, New Jersey. August 18, 2010, p. 19. http://www.nj.gov/comptroller/news/docs/tax_abatement_report.pdf
228 New Jersey School Finance Reform Act of 2008, P.L. 2007, c. 260.

TOGETHER North Jersey Fair Housing & Equity in Northern New Jersey
10-5
fully fund the State aid portion of school budgets under this formula since FY2011. By placing a greater tax burden on local school districts to fund these costs while also enacting statutory limits on school tax increases, New Jersey’s State government has sustained incentives for municipal governments to engage in fiscal zoning to exclude lower cost housing.
With over 70 percent of households in the TNJ region without children of school age (persons less than 18 years), it is not difficult to see how fiscal zoning can undermine the region’s overall economic competitiveness through excessive deference to local self‐interest. Today, the large majority of households are single persons, senior citizens, empty nesters, or other nonfamily households. A critical challenge for this region, particularly as the region’s population ages, is to extend the ladder of opportunity to a new generation entering the labor market, a generation that will be increasingly diverse both racially and economically.
Transportation Policy & Investments Affect Access to Opportunities 10.1.6
Transportation services and infrastructure are the link between residential locations and centers of employment, healthcare, education, retail, parks and community facilities. Major employment centers (e.g., shopping centers, universities, hospitals and office parks) are scattered throughout the TNJ Region in places that are often only accessible to lower‐income urban residents by automobile or by long and time‐consuming bus service. New Jersey residents – almost regardless of household income – bear the burden of inconvenient, long, expensive, and unproductive daily commutes to work because of the spatial segregation of races and classes in the region. Transit fare structures that do not provide low wage and part‐time workers – who often commute off‐hours – with affordable fare options, including free transfers, add to the burden of isolation. In locations like Newark Liberty Airport that employ large numbers of low‐wage workers as baggage handlers and food service workers, it is apparent that affordable high capacity mass transit, including frequent and off‐peak bus service and the extension of the PATH system, is needed to serve these low‐wage workers.
10.2 A Vision for a Regional Fair & Equitable Housing Policy
Addressing the segregated housing patterns of the large and jurisdictionally fragmented Together North Jersey region will be a long‐term undertaking, but it is possible. This FHEA defines a vision to simultaneously implement long‐term residential mobility strategies and actions, and to also address the legitimate needs of lower‐income and minority households who will –by choice or circumstance – continue to reside in distressed or deteriorating neighborhoods.
In response to the challenges discussed, this vision is based on three principles:
Sustainable Communities Require Housing Equity. Facing significant changes in demographic and economic forces, the future of northern New Jersey as an economically, environmentally, and socially sustainable region requires a much greater community commitment to ensure that housing is fair, equitable, and affordable throughout the TNJ region.
Economic Development Follows the Work Force. “Innovation economies” succeed when they can not only draw people to employers, but when employers are interested in being located where people want to live, and where the quality of life and cost of living are desirable. For the TNJ region to evolve toward an economy based on creativity and innovation, diverse housing types must be available to meet the needs of the entire workforce, including those who support the businesses in the key economic sectors and innovation clusters. Municipal land use planning and zoning must be

TOGETHER North Jersey Fair Housing & Equity in Northern New Jersey
10-6
prepared to accommodate a full range of housing types and supporting infrastructure to adapt to this changing regional economy.
Sustainable Communities Require both Concentrated Investments and Deconcentration. Improving access to opportunity requires deconcentrating households that contribute to Communities of Concern and connecting these households to places of high opportunity. New places of opportunity for commercial and neighborhood life must also be created where new residents and businesses are welcomed, and existing residents achieve a sense of belonging and ownership that is impossible to duplicate when the population becomes dispersed. These vital centers ‐‐ both within and outside of Communities of Concern can foster innovation clusters, which increase access to opportunity if provided with the right mix of housing, education, transportation, and amenity resources.
This vision looks beyond programs of the present, to imagine a future that is possible and desirable. Six key components of this vision are set forth in this chapter:
1. The Region Affirmatively Furthers Fair Housing 2. Housing Supply is Diversified to Meet Current and Future Demand for Housing 3. Access to Opportunity Is Increased through Housing Mobility 4. Public Investment Creates, Connects, and Strengthens Access to Opportunity 5. Fair Housing Activities Are Substantially Increased through CDBG Funding 6. More Housing Opportunities are Available for People with Disabilities
This vision may be realized through 15 recommended strategies and actions associated with each strategy to address the challenges to fair, equitable, and affordable housing and improved access to places of opportunity (see). Relevant descriptive information, including responsibilities and time frames for implementation, are provided for each strategy and action.229 Expected time frames for implementation are short term (less than 18 months), medium term (18‐48 months) and long term (more than 48 months).230
229 Responsibilities and time frames for implementation are recommendations and do not represent commitments at the time of the FHEA’s preparation.
230Strategies and actions are based on analyses of the TNJ region, but some involve programs that are or may be applied statewide.

TOGETHER North Jersey Fair Housing & Equity in Northern New Jersey
10-7
Table 10‐1: Summary of Vision, Strategies, and Actions toward Fair Equitable and Affordable Housing in the TNJ Region Vision 1: The Region Affirmatively Furthers Fair Housing
Strategy 5. Maintain Fair Housing Assessments (Section 10.3.1)
1.1 Review and approve, as appropriate, fair housing assessments and housing programs that comply with the Affirmatively Furthering Fair Housing Requirements of the Fair Housing Act which ensure transparency, increase the role of the public planning process, and create a stronger link to planned public investments.
1.2 Prepare and adopt for HUD review and approval fair housing assessments and housing programs that comply with the Affirmatively Furthering Fair Housing Requirements of the Fair Housing Act which ensure transparency, increase the role of the public planning process, and create a stronger link to planned public investments.
2. Require fair housing assessments for municipalities that are not recipients of HUD aid as part of the COAH certification process.
Strategy 6. Improve Regional Oversight to Affirmatively Further Fair Housing (Section 10.3.2)
1. Increase funding for non‐profit and state agencies to investigate individual claims of discrimination.
2. Investigate individual claims of discrimination
3. Establish a North Jersey Fair Housing Council of Governments with members from Federal, State, County, municipal, and public housing agencies and authorities.
Strategy 7. Use the FHEA in Decision Making (Section 10.3.3)
1. Incorporate findings, strategies, and actions of the FHEA into the RPSD and its implementation.
Strategy 8. Improve Data for Decision Making (Section 10.3.4)
1.1. Collect and distribute data required to Affirmatively Further Fair Housing.
1.2 Provide to HUD, and use data to be distributed by HUD, pursuant to the new HUD AFFH rules.
2. Collect and aggregate geographic and financial data on public infrastructure investment in New Jersey and the TNJ
region.
3. Integrate data on recent and planned public investments and indicators on the population with project prioritization
criteria
4. Improve the transparency, comprehensiveness, accuracy, and transferability of State and local data sets collected in
association with Affirmatively Furthering Fair Housing requirements of the Federal and State Fair Housing Acts.
5. Troubleshoot and translate HUD data, with particular emphasis on placing data on State GIS data web sites.
6. Prepare and post online an issue brief regarding Opportunity mapping. Prepare and post online an issue brief
regarding Opportunity mapping. Develop an online portal for delivery of FHEA data sets in customized formats.

TOGETHER North Jersey Fair Housing & Equity in Northern New Jersey
10-8
Table 10‐1: Summary of Vision, Strategies, and Actions (cont.) Vision 2: Housing Supply is Diversified to Meet Current and Future Demand for Housing Strategy 1. Mandate and Enforce Inclusionary Housing Policies (Section 10.4.1)
1. Establish NJ Fair Housing Act rules to require elimination of exclusionary zoning practices in areas appropriate for
development and redevelopment.
2. Target State Affordable Housing Trust Funds for housing production and preservation.
3. Increase the percent of realty transfer fees dedicated to the State Affordable Housing Trust Fund.
4. Revise the affordable housing minimum requirement for transit oriented development to 20% affordable regardless
of a town’s COAH requirement.
5. Amend municipal zoning ordinances to require or codes to allow for increased density, mixed‐use development,
new and innovative housing types (e.g. micro‐units), manufactured housing, and accessory housing (e.g. basement,
attic apartments).
6. Require employers getting tax credits under Economic Redevelopment and Growth Grant Program or Grow NJ to
establish employer‐assisted housing opportunities.
7. Require market housing developers to provide 20% of their units as affordable in exchange for incentive‐based
policies such as density bonuses, reduced‐cost and free land, and expedited approvals.
8.1 Comply with state law requiring towns to commit Municipal Housing Trust Funds to affordable housing initiatives
within 4 years of receipt of development funds, but allow exceptions for housing market conditions.
8.2 Require that all Municipal Housing Trust Funds that revert to the State be assigned to NJDCA and NJHMFA to be
used to provide affordable housing or to assist households in obtaining housing within the municipality from which
the funds were obtained.
9. Work with nonprofits and redevelopment agencies to create land trusts as a way to keep housing permanently
affordable.
10. Identify and establish funding streams for ongoing maintenance of land trusts.
11. Appoint a housing commission to have all state housing programs work together to be more effective.
12. Authorize a new Department of Housing to serve as the lead agency for all state housing initiatives.
13. Update and expand housing studies, fair share housing plans, and appropriate master plan elements to determine
needs for low‐, moderate‐, middle‐, and other income housing and housing types.
14. Use municipal enforcement data on illegal housing conversions and overcrowding to inform changes in zoning to
permit conversions of single family to multifamily dwellings, and to promote adaptive re‐use/redevelopment of
non‐residential buildings for residential and mixed‐uses to legally respond to over‐crowding. Strategy 2. Provide Incentives and Financial Support for Development of Housing Types Not Being Produced
by the Market (Section 10.4.2)
1. Amend the Abbott educational funding formula to provide additional financial aid to suburban school districts that
include affordable housing development for special needs populations.
2. Replenish the currently depleted Special Needs Housing Trust Fund.
3. Target HOME dollars and municipal and state housing trust funds toward low income and special needs
populations
4. Expand supportive services under Medicaid as a potential alternative to Use Medicaid savings that will result from
providing Special Needs housing to fund that housing where feasible and appropriate.
5. Establish and maintain County Homeless Trust Funds to fund programs to end homelessness.
6. Expand funding for the State Rental Assistance Program (SRAP) or similar program through a new dedicated fund or
appropriation sufficient to offset reductions in Federal funding support.
7. Employ incentive‐based policies for housing production such as density bonuses, reduced‐cost and free land, and
expedited approvals.

TOGETHER North Jersey Fair Housing & Equity in Northern New Jersey
10-9
Table 10‐1: Summary of Vision, Strategies, and Actions (cont.) Strategy 3. Locate Affordable Housing in Places with High Access to Opportunities (Section 10.4.3)
1. Allocate federal Low Income Tax Credits (LIHTC) to emphasize the location of family‐oriented and mixed income
affordable housing in higher opportunity suburban communities.
2. Expand eligibility and priority for federal Low Income Tax Credit (LIHTC) and other relevant federal programs to
create and maintain affordable and special needs housing units in areas of higher opportunity.
3. Expand eligibility and priority for New Jersey Council on Affordable Housing (COAH) and other relevant State
programs to create and maintain affordable and special needs housing units in areas of higher opportunity.
4. Ensure that public and publicly subsidized housing units are not more vulnerable to flooding and other natural
hazards or to sources of environmental contamination than neighboring housing units.
5.1 Through zoning or redevelopment plans, encourage mixed‐use developments or mixtures of land uses that provide
opportunities for supportive housing within 1/8 mile of a transit station or stop.
5.2 Through zoning or redevelopment plans, encourage mixed‐use developments or mixtures of land uses that provide
opportunities for affordable housing within ¼ mile of a transit station or stop.
5.3 Through zoning or redevelopment plans, encourage mixed‐use developments or mixtures of land uses that provide
opportunities for employment for a range of incomes within ½ mile of a transit station or stop that includes and
improves access to fresh food, health care services, and neighborhood retail.
6. Through zoning or redevelopment plans, require mixed‐income housing and space for jobs of a wide range of types
and incomes within walking distance of transit.
7. Establish reasonable design guidelines to ensure that affordable housing units are visually compatible with market
price units.
8. Educate the public with data describing the average population of affordable housing units with regard to age,
employment, occupation, and disabilities relative to the population at large to counter the prejudice associated
with the planning and construction of affordable housing units.
9. Through zoning or redevelopment plans, and through financial, rent control and property tax relief programs,
protect or provide equal or better opportunities for housing for existing low‐income and special needs households
within neighborhoods that are gentrifying or at high risk of gentrifying.
10. Prioritize funding for magnet schools that focus on community needs and reduce racial and economic isolation for
children living in areas in Communities of Concern slated for major redevelopment to increase educational
opportunity.
11. Remove LIHTC program incentives for Qualified Census Tracts, or extend the incentive to Areas of High Opportunity
12. Expand the use of mandatory set‐asides to require 20% of any new housing development or redevelopment
assisted by any form of federal or state aid to be affordable units, half for low income and half for moderate‐income
households, provided the projects are not located in Communities of Concern.
13. Locate public housing projects near places of high opportunity.
14. Apply Choice Neighborhood program concepts to work with institutions and businesses near housing projects to
increase local employment and provide neighborhood services and amenities.
15. Offset educational expense with PILOT contributions from subsidized housing developments and residential
redevelopment.
16. Increase Fair Market Rents for Housing Choice Voucher holders, so that they may have more opportunities to find
housing in places with high Access to Opportunities within the payment standards limits.
Strategy 4. Create Employer Assisted Housing Accessible to Employment Centers (Section 10.4.4)
1.1 Provide incentives to businesses to provide for employer‐assisted housing that is accessible to employment centers
by walking, bicycle, or public transit.
1.2 All government jurisdictions should provide financial incentives to their low and moderate income employees to
enable them to live near their place of employment, accessible by walking, bicycle, or public transit.
2. Make employment centers more accessible by walking, bicycle, or public transit to support and encourage
employer‐assisted housing.
3. Re‐institute the commercial developer fee for affordable housing, with a new provision enabling a portion of the
fee to go to affordable housing for the employees of the commercial enterprise that is paying the fee.

TOGETHER North Jersey Fair Housing & Equity in Northern New Jersey
10-10
Table 10‐1: Summary of Vision, Strategies, and Actions (cont.) Vision 3: Access to Opportunity Is Increased through Housing Mobility Strategy 1. Regionalize Housing Choice Voucher Programs (Section 10.5.1)
1. Increase the transferability of Housing Choice Vouchers among public housing authorities to provide more housing
options closer to better job and education opportunities.
2.1 Provide incentives or mandates to consolidate and centralize the administration of Housing Choice Vouchers
through consortia of public housing authorities within regions.
2.2 Consolidate and centralize the administration of Housing Choice Vouchers through consortia of public housing
authorities within regions.
3. Provide Housing Choice Vouchers and low cost loan opportunities to residents facing displacement from
gentrification.
4. Increase “urban county” CDBG program funding to cover costs of housing mobility counseling.
5.1 Place families using Housing Choice Vouchers into high and maximum Areas of Opportunity.
5.2 Increase administrative fees to local Public Housing Authorities (PHAs) for Housing Choice Vouchers assisting
families to locate in high Areas of Opportunity.
5.3 Reduce administrative fees to PHAs for Housing Choice Vouchers that over‐concentrate families in low and medium
Areas of Opportunity.
6. Update and increase, as appropriate, Fair Market Rent calculations, particularly in areas of High Opportunity, to
ensure that HCVs cover monthly rents without need of supplemental rent assistance programs.
Strategy 2. Link Regional HCV Programs to COAH Housing (Section 10.5.2)
1. Link Housing Choice Voucher programs (public subsidies) with privately subsidized mixed‐income inclusionary
housing programs (e.g. COAH and LIHTC) to make housing options in the suburbs more affordable.
Strategy 3. Link Regional HCV Programs with School Funding Programs (Section 10.5.3)
1. Link regional Housing Choice Voucher programs with Federal and State public education funding to provide
affordable housing in communities with high quality schools.
Vision 4: Public Investment Creates, Connects, and Strengthens Access to Opportunity
Strategy 1. Ensure Public Investment Programs Connect and Strengthen Communities of Concern (Section
10.6.1)
1. Prepare demographic profile at county level that identifies the location of high‐minority, low‐income and
disadvantaged populations and Communities of Concern on a regular basis to support public involvement, planning
and project development, program evaluation, and investment prioritization.
2. Publish online and in centralized data web sites clear and transparent information about the investment programs
available in many formats and multiple languages.
3. Develop leadership capacity of representatives from communities of color and low‐income communities where
needed to influence infrastructure investments targeted to advancing sustainable communities and
recommendations of the FHEA and RPSD.
4. Develop pilot program focused on community safety and ladders of opportunity that provide project‐related
resources for studies and technical assistance to directly engage with NGOs who work with traditionally
disadvantaged populations in communities of concern in association with local and county jurisdiction partners.
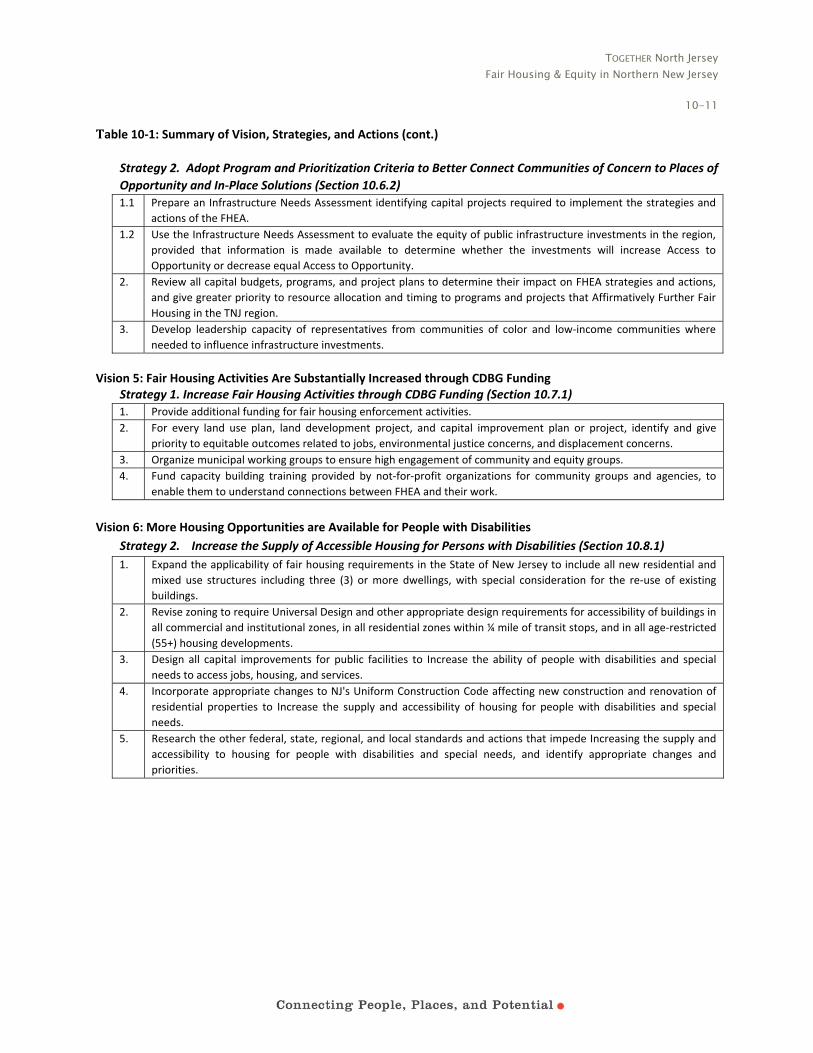
TOGETHER North Jersey Fair Housing & Equity in Northern New Jersey
10-11
Table 10‐1: Summary of Vision, Strategies, and Actions (cont.)
Strategy 2. Adopt Program and Prioritization Criteria to Better Connect Communities of Concern to Places of
Opportunity and In‐Place Solutions (Section 10.6.2)
1.1 Prepare an Infrastructure Needs Assessment identifying capital projects required to implement the strategies and
actions of the FHEA.
1.2 Use the Infrastructure Needs Assessment to evaluate the equity of public infrastructure investments in the region,
provided that information is made available to determine whether the investments will increase Access to
Opportunity or decrease equal Access to Opportunity.
2. Review all capital budgets, programs, and project plans to determine their impact on FHEA strategies and actions,
and give greater priority to resource allocation and timing to programs and projects that Affirmatively Further Fair
Housing in the TNJ region.
3. Develop leadership capacity of representatives from communities of color and low‐income communities where
needed to influence infrastructure investments.
Vision 5: Fair Housing Activities Are Substantially Increased through CDBG Funding
Strategy 1. Increase Fair Housing Activities through CDBG Funding (Section 10.7.1)
1. Provide additional funding for fair housing enforcement activities.
2. For every land use plan, land development project, and capital improvement plan or project, identify and give
priority to equitable outcomes related to jobs, environmental justice concerns, and displacement concerns.
3. Organize municipal working groups to ensure high engagement of community and equity groups.
4. Fund capacity building training provided by not‐for‐profit organizations for community groups and agencies, to
enable them to understand connections between FHEA and their work.
Vision 6: More Housing Opportunities are Available for People with Disabilities
Strategy 2. Increase the Supply of Accessible Housing for Persons with Disabilities (Section 10.8.1)
1. Expand the applicability of fair housing requirements in the State of New Jersey to include all new residential and
mixed use structures including three (3) or more dwellings, with special consideration for the re‐use of existing
buildings.
2. Revise zoning to require Universal Design and other appropriate design requirements for accessibility of buildings in
all commercial and institutional zones, in all residential zones within ¼ mile of transit stops, and in all age‐restricted
(55+) housing developments.
3. Design all capital improvements for public facilities to Increase the ability of people with disabilities and special
needs to access jobs, housing, and services.
4. Incorporate appropriate changes to NJ's Uniform Construction Code affecting new construction and renovation of
residential properties to Increase the supply and accessibility of housing for people with disabilities and special
needs.
5. Research the other federal, state, regional, and local standards and actions that impede Increasing the supply and
accessibility to housing for people with disabilities and special needs, and identify appropriate changes and
priorities.

TOGETHER North Jersey Fair Housing & Equity in Northern New Jersey
10-12
10.3 Vision 1: The Region Affirmatively Furthers Fair Housing
Both HUD guidance and court decisions increasingly advance a vision for Affirmatively Furthering Fair Housing (AFFH). AFFH requires the establishment of a comprehensive assessment process that is routinely monitored to ensure that actions are taken to meet fair housing requirements. AFFH is advanced through substantive actions — not just plans — including assessments, statutes, resolutions, and ordinances.
In July 2013 HUD, as the federal government’s primary enforcer of the federal Fair Housing Act of 1968, proposed to undertake a more active oversight and enforcement role with its HUD‐funded housing and community development entities (i.e., state and local governments) and their housing agencies as they develop plans, which will utilize the types of powerful data sources that have informed this FHEA and the TNJ Regional Plan for Sustainable Development. The impending publication of the final AFFH rule by the Obama Administration offers a promising means for increasing access to fair, equitable, and affordable housing throughout the TNJ region.
Increased oversight of fair housing efforts will be perhaps the most significant consequence of rule adoption. The State of New Jersey, the largest single administrator of federal housing and community development funding in the Region, will be required to submit its AFFH assessment and action plans to HUD, prior to the release of funds, for its large regionally‐administered housing and community development programs. These programs include, but are not limited to, the Housing Choice Voucher Program (already successfully administered at the county level), the “Small Cities” CDBG program, and a number of federally funded matching grant programs (such as the Housing Partnership “HOME” Program) that support project‐based affordable housing development.
Upon publication of the Final AFFH Rule, HUD will finally review “consolidated plans” that are developed locally with extensive opportunities for public input. As proposed, they will include assessments of barriers to fair, equitable and sustainable development and the identification of goals, strategies and actions that these HUD‐funded entities will undertake to comply with the requirements of the AFFH rule. This will be done before HUD releases federal housing and community development funds to communities. This long overdue reform to ensure compliance with the Fair Housing Act of 1968 will have particular significance in the TNJ Region, where a majority of the region’s counties have entered into cooperation agreements with hundreds of small and suburban municipalities to administer federal Community Development Block Grant (CDBG) programs and funding.
In addition, many public housing agencies in the TNJ Region will likely choose to coordinate their HUD‐required “PHA Plans” with the “Consolidated Plans” of their local government and/or with their “urban county” CDBG‐entitlement partners to coordinate their required AFFH compliance strategies. Greater
What Does it Mean to Affirmatively Further Fair Housing? Affirmatively furthering fair housing means taking proactive steps beyond simply combating discrimination to foster more inclusive communities and access to community assets for all persons protected by the Fair Housing Act. More specifically, it means taking steps proactively to address significant disparities in access to community assets, to overcome segregated living patterns and support and promote integrated communities, to end racially and ethnically concentrated areas of poverty, and to foster and maintain compliance with civil rights and fair housing laws. For participants subject to this subpart, these ends will be accomplished primarily by making investments with federal and other resources, instituting strategies, or taking other actions that address or mitigate fair housing issues identified in an assessment of fair housing (AFH) and promoting fair housing choice for all consistent with the policies of the Fair Housing Act. —24 CFR 5.152, July 19, 2013

TOGETHER North Jersey Fair Housing & Equity in Northern New Jersey
10-13
regional cooperation between PHAs and CDBG consortiums, particularly at the county level, holds promise as a means for fostering fair housing outcomes.
Strategy: Maintain Fair Housing Assessments 10.3.1
Assessments of Fair Housing (AFH) will need to be prepared and routinely updated pursuant to the new HUD AFFH rules and guidelines. The proposed AFFH Rule requires that HUD will review and approve the assessments of barriers to fair housing and equitable and sustainable development as well as the goals, strategies and actions that HUD‐funded entities proposed to undertake to comply with the AFFH requirement of the Fair Housing Act. This compliance review is in advance of releasing federal housing and community development funds to these communities.
As a planning exercise, the preparation of fair housing assessments and housing programs have an indirect impact on affirmatively furthering fair housing, but a very important one. These plans focus public officials and private citizens on defining the local issues and prioritizing potential responses and solutions. If the new HUD rules are approved, this change will have particular significance in the TNJ region, where a majority of counties have entered into cooperation agreements with hundreds of small and suburban municipalities to administer federal Community Development Block Grant (CDBG) programs and funding. In addition, public housing agencies in the region that choose to coordinate their HUD‐required “PHA Plans” with the “Consolidated Plans” of their local government and/or with their “urban county” CDBG‐entitlement partners to coordinate their required AFFH compliance strategies will improve the likelihood of fair and equitable housing outcomes.
As of this writing, the new rules proposed by HUD in July 2013 have not yet been approved or adopted for implementation. However, many provisions of the proposed rules are consistent with the rules for Analysis of Impediments to Fair Housing and could guide the current data collection and analysis efforts.
Table 10‐2: Actions to Maintain Fair Housing Assessments
# Actions Responsibility Timeframe
1.1 Review and approve, as appropriate, fair housing assessments and housing programs that comply with the Affirmatively Furthering Fair Housing Requirements of the Fair Housing Act which ensure transparency, increase the role of the public planning process, and create a stronger link to planned public investments.
Lead: HUDSupport: NJDCA
Medium term
1.2 Prepare and adopt for HUD review and approval fair housing assessments and housing programs that comply with the Affirmatively Furthering Fair Housing Requirements of the Fair Housing Act which ensure transparency, increase the role of the public planning process, and create a stronger link to planned public investments.
Lead: NJDCA, CDBG recipients, PHAs Support: HUD, NJHMFA
Medium term (Minimum of every 5 years)
2. Require fair housing assessments for municipalities that are not recipients of HUD aid as part of the COAH certification process.
Lead: COAHSupport: HUD, NJDCA
Long term

TOGETHER North Jersey Fair Housing & Equity in Northern New Jersey
10-14
Strategy: Improve Regional Oversight to Affirmatively Further Fair Housing 10.3.2
Improving regional oversight of initiatives to affirmatively further fair housing could be advanced through greater coordination of fair housing assessment, planning, and administration among HUD, State, and local governments. This strategy recommends establishing an independent regional oversight organization consisting of representatives of HUD, the Governor’s Office, the New Jersey Department of Community Affairs, the New Jersey Council on Affordable Housing, the New Jersey Office for Planning Advocacy, CDBG “entitlement” counties and municipalities, and public housing authorities within the TNJ region. Housing industry, practitioners, and advocates could also be represented on such a Council.
The existing TNJ Consortium could function as a Council of Governments or Regional Council with additional authority granted by state statute or federal regulation. Sufficient resources would be required to conduct or review analyses of barriers to fair housing choice, support investigations of housing discrimination complaints, examine how effectively the Fair Housing Act is being enforced, and facilitate the coordination of regional initiatives such as mobility counseling or regional vouchers.
HUD already relies on, and leverages, the work of many local governments and NGOs. While Fair Housing Councils (private, non‐profit, non‐governmental organizations) and Councils of Government (Regional Councils) have been established throughout the nation, there may be merit in bringing to the table the public housing authorities, in addition to the normal roster of general‐purpose governments, as a means for further strengthening regional planning coordination.
Such a regional entity might include review of grants for their consistency with the regional plan. The agencies operating in a metropolitan area should coordinate their activities, with fair housing as a central consideration. Implementation of major investments in transportation, employment, education, commercial development, and other infrastructure enhancements should be aligned with fair housing goals, to support and develop diverse, sustainable communities with access to opportunity for all residents of the region. Metropolitan Planning Organizations, such as NJTPA, provide an instructive model for convening stakeholders and promoting regional coordination in the area of transportation to break down “silos” and, in turn, achieve greater efficiencies in the use of available resources to better align federal, state and local policies, programs, investments and projects.
Table 10‐3: Actions to Improve Regional Oversight to Affirmatively Further Fair Housing
# Actions Responsibility Timeframe
1. Increase funding for non‐profit and state agencies to investigate individual claims of discrimination.
Lead: HUDSupport: NJDCA
Medium term
2. Investigate individual claims of discrimination Lead: NGOsSupport: US Department of Justice, NJ Department of Justice, NJDCA
Short term
3. Establish a North Jersey Fair Housing Council of Governments with members from Federal, State, County, municipal, and public housing agencies and authorities.
Lead: TNJ ConsortiumSupport: HUD, NJDCA, NJHMFA, COAH, NJTPA, NJ Transit, Counties, Municipalities, PHAs, NGOs, Developers
Long term

TOGETHER North Jersey Fair Housing & Equity in Northern New Jersey
10-15
Strategy: Use the FHEA in Decision Making 10.3.3
HUD requires the FHEA to show the “bridge” from “analysis to engagement to decision making.”231 To maximize the effect of the FHEA, its implications must be integrated into decision making, prioritization, and investment.
This FHEA calls for a paradigm shift for most agencies and organizations in their understanding of fair housing and civil rights obligations. Efforts of regional consortia such as TNJ, in coordination with Metropolitan Planning Organizations (MPOs) such as the North Jersey Transportation Planning Authority and its constituent members, can play a strong role in building shared understandings and fostering multi‐jurisdictional agreements to improve housing choices and connect people to places of opportunity. In all cases, elected officials and community leaders will need to be educated and cultivated as champions for a strong regional equity network, including a strong regional planning framework that advances fair and equitable housing.
The primary goal of TNJ is the preparation of a Regional Plan for Sustainable Development (RPSD). This plan, both “place‐based” and “issue‐based”, recognizes the importance of fostering sustainable communities, transit system connectivity and Transit‐Oriented Development (TOD) as the central framework for integrating policies, programs, plans, regulations and investments at all levels of government to improve economic and environmental conditions, while promoting regional equity and resource efficiency. The RPSD is both the representation of a common vision for a more sustainable region, and a blueprint on how to make that vision a reality.
Ensuring fair housing and equitable access to opportunities are central to fostering sustainable communities in the TNJ region. The RPSD is informed by, and advances, the strategies and actions of the FHEA. The RPSD advances implementation through a series of strategies organized by “Focus Area.” Each strategy is proposed to be implemented through one or more actions.
Table 10‐4: Actions to Use the FHEA in Decision Making
# Actions Responsibility Timeframe
1. Incorporate findings, strategies, and actions of the FHEA into the RPSD and its implementation.
Lead: TNJ ConsortiumSupport: NJTPA, NJ Transit, Counties
Short term
Strategy: Improve Data for Decision Making 10.3.4
With technological improvement in data collection and analysis, and the increasing integration of technology with public services, there needs to be a region‐wide effort to improve the collection and use of data for planning and decision making to efficiently and equitably manage the Region’s resources and infrastructure while satisfying the need to provide fair, equitable, and affordable housing. Developing meaningful indicators that reflect existing conditions and maintaining accurate data about public investment in transportation, housing, education, and job creation is vital to improving access to opportunity for the Region’s residents.
231 HUD Memorandum to Sustainable Communities Regional Planning Grantees, January 2012.

TOGETHER North Jersey Fair Housing & Equity in Northern New Jersey
10-16
HUD requires the analysis of some indicators that reveal access to opportunity and quality of life, but data collection for these topics, such as access to fresh foods and open space, is limited. 233 There should be focused improvement in data collection of these and similar topics in formats that can be linked to geographic data and used in conjunction with geographic information systems. 234
Quality information about public investment and where it is being made through physical infrastructure is needed for all the Region’s public investment programs. It is imperative that agencies keep thorough, timely, and accurate records of the projects being financed. As the TNJ region evolves, data on public investments should be maintained and kept up to date in order to adequately respond to changing equity needs. For this to occur, the government agency that is responsible for public investment programs at a regional level must be responsible for collecting, maintaining, and verifying the distribution of public funds. It does not improve efforts to increase housing affordability by having out‐of‐date data that over or underrepresents the true state of conditions because of mistakes in data reporting, especially by agencies like the Council on Affordable Housing.
All the data that is collected about the region, access to opportunity indicators, and public investment should be easily accessible and transparent in order to eliminate informational barriers for decision makers, planners, researchers, businesses interested in investing in New Jersey, and the public. Moreover, the data should be compliant with open data standards and available in electronic formats. In the course of researching public investment for the FHEA, it was evident that there are several administrative data sets that are not sufficiently maintained, did not provide enough information to be mapped, and not available in an accessible electronic format. The investment programs that did not have adequate information included programs on inclusionary housing development, CDBG funding, parks and open space, water infrastructure improvement, and disaster recovery. Among the investment programs examined in Chapter 8, the New Jersey Economic Development Authority maintained the most complete records because NJEDA’s approach was that of a financial institution.
232 Federal Register 79:187 pp 57949‐57955. Friday, September 26, 2014
233 Chapter 8 of this FHEA identifies types of public investments that are key to the FHEA and for which data are available.
234 A great deal of data collected in association with preparing this FHEA has been placed online, as well as presentations mapping the data using geographic information systems (GIS). See http://togethernorthjersey.com/?page_id=16936 and http://togethernorthjersey.com/wp‐content/uploads/2013/07/FHEA_Maps_Intro_fixed.pdf
How Improving Data Relates to Affirmatively Furthering Fair Housing (AFFH) The proposed HUD AFFH Rule outlined a process in which program participants use HUD‐provided data, along with supplemental local data, to assess fair housing conditions, identify determinants perpetuating fair housing barriers, and establish fair housing goals in the assessment of fair housing (AFH) that will inform future investment plans.
As of this writing, new rules proposed by HUD in July 2013 have not yet been approved or adopted for implementation. However, many provisions of the proposed rules are consistent with the rules for Analysis of Impediments to Fair Housing and should guide current data collection and analysis efforts.
In September 2014, HUD published a prototype geospatial tool to complement and potentially help to implement AFFH.232

TOGETHER North Jersey Fair Housing & Equity in Northern New Jersey
10-17
There are additional considerations that should be monitored to identify if public investments are creating the connections between people and access to opportunity. For programs dealing with job creation, more detailed data should be collected on the types of jobs being created and the education and skills required in these occupations. Comparing demanded workforce skills with the educational attainment of TNJ communities would show where people live in relation to the job opportunities being created and can consequently help link the workforce with training programs and job opportunities. Data from NJDEP on needed site remediation should be integrated with NJEDA’s records on real estate redevelopment so it will be possible to see what progress is being done to improve the environmental conditions through site cleanup and what places have potential economic opportunities and what progress is being made in cleaning up sites.
Public investment programs should be monitored for a set time period after the investment is made to examine the effectiveness of connecting people to access to opportunity through investment. Adding a time‐series element may not be applicable for all public investment programs, but it is information that shows the long‐term effect of public investments, in light of the short‐term negative externalities of infrastructure investment. This could show how long certain transportation operations are in effect, how long a business that received financial incentives remains open, or whether a polluted site is fully remediated.
Many of the public investment programs in the TNJ region provide complementary benefits. Site remediation, job retention incentives, mass transit and safety enhancements, Safe Routes to School, and arts investment all work together to create better economic, educational, and quality of life opportunities for the region. However, decisions on the prioritization and funding of these programs are made in isolation.
Improving the quality of data should inform the prioritization and the region’s ability to evaluate the effectiveness of program investments and policies. Aligning data about public investment programs and funding sources can identify more opportunities for investment and place‐making. By using accurate and detailed spatial data to analyze where there is a clustering of public investments, there could be opportunities for expanding the geographic reach of public investments and providing more incentives in places that need them but have not received investment.

TOGETHER North Jersey Fair Housing & Equity in Northern New Jersey
10-18
Table 10‐5: Actions to Improve Data for Decision Making
# Actions Responsibility Timeframe
1.1. Collect and distribute data required to Affirmatively Further Fair Housing.
Lead: HUDSupport: NJDCA
Short term
1.2 Provide to HUD, and use data to be distributed by HUD, pursuant to the new HUD AFFH rules.
Lead: NJDCASupport: Counties, Municipalities, PHAs
Short term
2. Collect and aggregate geographic and financial data on public infrastructure investment in New Jersey and the TNJ region.
Lead: Office for Planning Advocacy Support: NJ Office of Information Technology
Short term
3. Integrate data on recent and planned public investments and indicators on the population with project prioritization criteria
Lead: NJ Office for Planning Advocacy Support: Agencies responsible for investment
Short term
4. Improve the transparency, comprehensiveness, accuracy, and transferability of State and local data sets collected in association with Affirmatively Furthering Fair Housing requirements of the Federal and State Fair Housing Acts.
Lead: HUDSupport: NJDCA,COAH, NJHMFA, NJTPA, Counties, Municipalities, PHAs, Rutgers University
Short term
5. Troubleshoot and translate HUD data, with particular emphasis on placing data on State GIS data web sites.
Lead: NJ Office for Planning Advocacy Support: NJDCA, Rutgers University
Medium term
6. Prepare and post online an issue brief regarding Opportunity mapping. Develop an online portal for delivery of FHEA data sets in customized formats.
Lead: TNJConsortium/Rutgers University
Short term
10.4 Vision 2: Housing Supply Is Diversified to Meet Current and Future Demand
Longstanding exclusionary zoning practices, shrinking supply of vacant developable land, property taxes and fees, and the region’s proximity to the New York City make the cost of housing prohibitively expensive for many households. Over 50 percent of New Jersey renters are cost burdened, and regional economic disparities are commonplace. New Jersey must adopt Fair Housing Act reforms and commit to the full implementation of the Mt. Laurel doctrine to combat regional inequality, foster greater opportunity for lower‐income families, and provide for a more diverse housing base throughout the state.
Declining federal funding for affordable homes, restrictive local land use policies, the longstanding overreliance of municipalities on the property tax, as well as cultural and demographic shifts continue if not exacerbate existing affordability problems. Effective inclusionary housing policies will be necessary to advance an equitable distribution of housing types both now and in the long term. The State must be involved in ensuring a sufficient funding stream for the construction of affordable homes, as well as to ensure long‐term affordability. Demographic changes will require that the State and its municipalities

TOGETHER North Jersey Fair Housing & Equity in Northern New Jersey
10-19
adjust zoning and building policies to allow for different types of homes to adequately serve diverse populations at all stages of their lives.
Strategy: Mandate and Enforce Inclusionary Housing Policies 10.4.1
New Jersey’s Fair Housing Act addresses the affordability of housing, based on the Mount Laurel Doctrine, which requires every municipality to provide opportunities for its fair share of affordable housing based on employment and population growth in its region. Mandatory inclusionary housing policies have become commonplace through the United States, and New Jersey has a significant history of progressive inclusionary housing legislation via the Mount Laurel Doctrine. The state must mandate that every municipality adopt inclusionary zoning designed to ensure that an adequate and diverse housing supply exists sufficient to provide housing opportunities that are affordable to low, moderate, and middle‐income employees, local municipal and school district employees, small business owners, and special needs individuals in the area. As municipalities experience growth and redevelopment, it becomes increasingly difficult for public and private sector employees to live in the communities in which they work.
The future viability of the region’s economy depends on inclusionary zoning. The COAH framework in itself is not sufficient to meet all of the present and future needs for low‐ and moderate‐income households, and does not address the substantial needs for housing for middle‐income households – for example, households earning between 80 and 120 percent of median family income that are an integral part of the region’s work force.
Montgomery County, MD; Mandating Inclusionary Zoning Practices
In 1974, Montgomery County, Maryland pioneered inclusionary zoning practices when its County Council enacted a law establishing the Moderately Priced Dwelling Unit (MPDU) program. The MPDU law required any developer applying for subdivision approval, site plan approval, or building permits for construction of 50 or more dwelling units at one location to ensure that 15% of the units were MPDUs. In exchange, developers were offered density bonuses of up to 20%, allowing them to develop a greater number of units than zoning ordinances permitted.
The MPDU law has been in effect in Montgomery County since its enactment in 1974, and has never been challenged in court. It has been amended several times; it currently requires that between 12.5% and 15% of homes in new developments of 20 units or more be MPDUs. When the program was established, affordability of both rental and homeownership MPDUs was controlled for five years. Today, the control period is 30 years for homeownership MPDUs and 99 years for rental MPDUs. In 2014, a household must earn between a minimum of $30,000 and a maximum of $81,000 to rent an MPDU (the maximum income limit is based on household size and unit type). To purchase an MPDU, household income must be between $35,000 and $81,000. Income limits for the program are updated annually.
As it currently stands, the program also requires that 40% of newly developed MPDUs first be offered for sale to the Housing Opportunities Commission, Montgomery County’s public housing agency, and to non‐profit housing providers.
The MPDU program has produced approximately 12,500 units of housing affordable to moderate and low‐income families since its inception. However, as Montgomery County becomes more urban and nears its capacity for new development, MPDU production has decreased, and cannot compensate for units lost due to initially short periods of affordability restriction. While the program remains an important source of housing affordable to low‐ and moderate‐income people in the county, these factors make clear that inclusionary zoning programs are but one tool for affordable housing development.
The MPDU law was the first of its kind. Today, more than 400 cities, towns, and counties implement inclusionary zoning programs. When the Montgomery County Council enacted the program, Councilmember Sidney Kramer said, “We realize that we are testing a new approach to an ancient problem and, as many people resist change, some may be dubious about our MPDU legislation; however, they are a small minority as comments on this legislation have been generally optimistic. The entire State and, indeed, many communities across the country are watching our actions this morning.”

TOGETHER North Jersey Fair Housing & Equity in Northern New Jersey
10-20
Inclusionary housing efforts in New Jersey, while highly productive during the 1990s, have stagnated as a result of uncertainty introduced with the “growth share” methodology, lack of executive action, and most recently, through the delay and controversy surrounding the latest proposed COAH Third Round Rules. Efforts at advancing a cohesive Mt. Laurel policy today are unclear, although there remains a compelling, and continued need for affordable, inclusionary housing throughout the state. The prospects for ongoing funding are uncertain, largely depending on political will at both the state and federal levels. There is opportunity, however, at the local level.
While some mandatory inclusionary housing development is currently in place, especially where state funds are used, expanding this practice has proven difficult. Individual municipalities can adopt such ordinances, which themselves can include provisions for such additional incentives as density bonuses, but they are reluctant to do so in the absence of strong COAH requirements or other binding regional agreements. Voluntary programs such as “Smart Housing Incentives Act” bills would establish financial and regulatory incentives for inclusionary housing development.235
Efforts to attract new investment to urban centers have largely focused on the redevelopment of downtowns, both urban and suburban. Municipalities have the ability to zone for new, affordable housing types that can accommodate such residents interested in places that offer transit and walking as options to the automobile. This should also include equitable TOD and multi‐family housing that is badly needed in many areas, as low income households are most dependent on public transit services.
New Jersey’s Realty Transfer Fee of 1 percent on sales of most new and existing commercial and residential properties provides one stream of revenue for New Jersey’s Affordable Housing Trust Fund. Partial exemptions include qualifying senior citizens aged 62 or older, blind persons, disabled persons, and on property that is low and moderate income housing.
Table 10‐2: Actions to Mandate and Enforce Inclusionary Housing Policies
# Actions Responsibility Timeframe
1. Establish NJ Fair Housing Act rules to require elimination of exclusionary zoning practices in areas appropriate for development and redevelopment.
Lead: NJDCA, COAH Medium term
2. Target State Affordable Housing Trust Funds for housing production and preservation.
Lead: NJDCA Medium term
3. Increase the percent of realty transfer fees dedicated to the State Affordable Housing Trust Fund.
Lead: State LegislatureSupport: NJDCA
Medium term
4. Establish an affordable housing minimum requirement for transit oriented development of 20% affordable regardless of a town’s COAH requirement.
Lead: NJDCASupport: COAH, NJHMFA
Medium term
235 See, for example, ftp://www.njleg.state.nj.us/20082009/S3000/2505_S1.PDF and https://www.govtrack.us/states/nj/bills/2012‐2013/a1430

TOGETHER North Jersey Fair Housing & Equity in Northern New Jersey
10-21
# Actions Responsibility Timeframe
5. Amend municipal zoning ordinances to require or allow increased density, mixed‐use development, new and innovative housing types (e.g. micro‐units), manufactured housing, and accessory housing (e.g. basement, attic apartments).
Lead: MunicipalitiesSupport: NJ Office for Planning Advocacy, NJDCA, COAH
Long term
6. Require employers getting tax credits under Economic Redevelopment and Growth Grant Program or Grow NJ to establish employer‐assisted housing opportunities.
Lead: NJ State LegislatureSupport: NJEDA, NJHMFA
Medium term
7. Require market housing developers to provide 20% of their units as affordable in exchange for incentive‐based policies such as density bonuses, reduced‐cost and free land, and expedited approvals.
Lead: MunicipalitiesSupport: NJDCA, COAH, NJHMFA
Short term
8.1 Comply with state law requiring towns to commit Municipal Housing Trust Funds to affordable housing initiatives within 4 years of receipt of development funds, but allow exceptions for housing market conditions.
Lead: MunicipalitiesSupport: NJDCA, COAH, NJHMFA
Short term
8.2 Require that all Municipal Housing Trust Funds that revert to the State be assigned to NJDCA and NJHMFA to be used to provide affordable housing or to assist households in obtaining housing within the municipality from which the funds were obtained.
Lead: LegislatureSupport: NJDCA, NJHMFA
Short term
9. Work with nonprofits and redevelopment agencies to create land trusts as a way to keep housing permanently affordable.
Lead: Municipalities Short term
10. Identify and establish funding streams for ongoing maintenance of land trusts.
Lead: NJDCASupport: Municipalities, NGOs
Long term
11. Appoint a housing commission to have all state housing programs work together to be more effective.
Lead: Governor and Legislature NJ Office for Planning Advocacy
Medium term
12. Authorize a new Department of Housing to serve as the lead agency for all state housing initiatives.
Lead: Governor and Legislature Support: NJ Office for Planning Advocacy
Long term
13. Update and expand housing studies, fair share housing plans, and appropriate master plan elements to determine needs for low‐, moderate‐, middle‐, and other income housing and housing types.
Lead: MunicipalitiesSupport: NJDCA, COAH
Long term

TOGETHER North Jersey Fair Housing & Equity in Northern New Jersey
10-22
# Actions Responsibility Timeframe
14. Use municipal enforcement data on illegal housing conversions and overcrowding to inform changes in zoning to permit conversions of single family to multifamily dwellings, and to promote adaptive re‐use/redevelopment of non‐residential buildings for residential and mixed‐uses to legally respond to over‐crowding.
Lead: MunicipalitiesSupport: NJDCA, Counties, PHAs, NGOs, Developers
Medium term
Strategy: Provide Incentives and Financial Support for Development of Housing Types Not Being 10.4.2
Produced by the Market
Northern New Jersey’s housing market is so expensive that, absent government intervention, it simply does not provide housing for households classified as extremely low income. An individual living solely on monthly Supplemental Security Income (SSI) payments in New Jersey (roughly 14% of state’s area median income) would need to pay 129 percent of their monthly income to afford an efficiency apartment. 236 Such extreme poverty requires a variety of incentive‐based solutions to provide quality affordable homes for very low income households.
State policies are greatly needed to offset the cost of housing – and provide housing – for very low and extremely low‐income households. State and local government incentives are needed to provide for the production of homes affordable to such households. While state programs such as State Rental Assistance Program vouchers (SRAPs) are designed to give direct support to low‐income individuals, additional state funds are needed to offset reductions in Federal funding and more action is need to incentivize production of affordable dwellings on a larger and more diverse scale.
As described above, mandated inclusionary housing requirements should be employed, coupled with creative use of density bonuses, reduced‐cost and free land, and expedited zoning review processes as a benefit for addressing a locality’s need to provide affordable units. Policies to provide reduced‐cost or free land for developers prepared to produce affordable homes may be adopted at the state, local or even county level where applicable. Such policies can lower the overall cost of housing production and incentivize production of below‐market units.
Similarly, expedited planning and zoning approvals can easily be adopted by local planning boards, zoning boards of adjustment, and planning departments. Offering such streamlining is appropriate as a condition of the production of larger
236 See Technical Assistance Collaborative, Price Out in 2012 report.
Special Needs Housing Trust Fund to Address Housing Market Gaps
The Special Needs Housing Trust Fund (SNHTF) was signed into law in 2005. It authorized the issuance of $200 million of bonds to create housing for people with special needs and the homeless.
The SNHTF under the auspices of the New Jersey Housing and Mortgage Finance Agency has helped create quality housing people can afford with needed supportive services for over 2,000 families and individuals with special needs throughout New Jersey. Without this funding many of these individuals and families would still be living with aging parents or institutionalized. Others would be homeless or returning to prison because they could not find a home they could afford.
For New Jersey, this $200 million investment from the state’s Special Needs Housing Trust Fund has leveraged at least an additional $200 million in total housing investment, the majority of which was private investment in New Jersey’s economy.

TOGETHER North Jersey Fair Housing & Equity in Northern New Jersey
10-23
percentages of affordable homes for special needs populations, provided they do not create new areas of concentrated poverty.
Targeting federally‐allocated HOME dollars towards special needs housing is a practice which some NJ municipalities already engage in, and can be easily expanded via local government mandates. However, these dollars are shrinking with NJ losing half its HOME allocations over the past 10 years. State, county, and municipal HOME dollars should be increased and continue to be targeted towards very low income and special needs populations.
Finally, the state should consider a redesign of its public education aid formulas and state‐funded Medicaid, which would allow additional school aid and for expanding the use of Medicaid waivers for supportive services. Supportive services such as housekeeping and meal services are important and typically a cost‐effective alternative to special needs housing to enable people to remain in their existing subsidized (e.g. HCV) units.
Table 10‐3: Actions to Provide Incentives and Financial Support for Housing Types Not Being Produced by the Market
# Actions Responsibility Timeframe
1. Amend the Abbott educational funding formula to provide additional financial aid to suburban school districts that include affordable housing development for special needs populations.
Lead: Governor or NJ State Legislature Support: NJ Department of Education
Long term
2. Replenish the currently depleted Special Needs Housing Trust Fund.
Lead: NJDCA Medium term
3. Target HOME dollars and municipal and state housing trust funds toward low income and special needs populations
Lead: NJDCA, Counties and Municipalities
Short term to medium term
4. Expand supportive services under Medicaid as a potential alternative to providing Special Needs housing where feasible and appropriate.
Lead: Governor, Department of Health
Medium term
5. Establish and maintain County Homeless Trust Funds to fund programs to end homelessness.
Lead: CountiesSupport: NJDCA, NJ Department of Human Services
Medium term
6. Expand funding for the State Rental Assistance Program (SRAP) or similar program through a new dedicated fund or appropriation sufficient to offset reductions in Federal funding support.
Lead: NJ Legislature/Governor
Medium term
7. Employ incentive‐based policies for housing production such as density bonuses, reduced‐cost and free land, and expedited approvals.
Lead: Municipalities Short term
Strategy: Locate Affordable Housing in Places with High Access to Opportunities 10.4.3
Dedicated affordable housing and publicly subsidized special needs housing needs to be located in areas where good transportation, employment, education, parks, and other amenities (i.e., places with high opportunity) exist or may be provided, and away from environmental hazards or in places with already high concentrations of such subsidized housing.

TOGETHER North Jersey Fair Housing & Equity in Northern New Jersey
10-24
Municipal zoning ordinances and redevelopment plans must permit the creation of mixed‐income developments or mixtures of land uses that promote greater opportunity for low‐income and special needs households. Given appropriate incentives, as well as design guidelines, these units can be built by developers (for‐profit and non‐profits) and Public Housing Authorities that are compatible in design with existing community character. The siting of such opportunities must be respectful of environmental justice considerations, including exposure to flooding and other natural hazards, environmental contamination, and incompatible or noxious land uses.
The apparent failure of family‐supportive public housing projects in the larger cities of America, including several cities of the TNJ region, has caused the federal government to embark on other housing strategies – most particularly, the Housing Choice Voucher (HCV) program that has become far larger than the conventional public housing program. Nonetheless, thousands of lower income and minority families continue to reside in traditional public housing projects.
Well‐managed and creative housing authorities, like the Jersey City Housing Authority (JCHA), have demonstrated that these family housing developments can be effective delivery systems for social service and family self‐sufficiency training. The children in these housing developments are attending schools ranked among the more proficient by PRRAC.237
Working cooperatively with the city’s CDBG agency and neighborhood residents, the JCHA is demonstrating its ability to transform public housing and surrounding neighborhoods. Using federal HOPE VI funds and employing Choice Neighborhood concepts, the JCHA has successfully developed mixed‐income housing and is currently actively working with neighboring institutions and businesses to increase employment, develop a food market and provide other neighborhood amenities.
Where project‐based developments – public housing, Section 8 or LIHTC — enjoy access to good transportation, employment, and similar amenities, these strategic advantages must be capitalized upon, with public and private resources, to improve the lives of disadvantaged families and the neighboring communities. For example, the New Jersey Department of Transportation along with NJ TRANSIT has established a program that has designated a Transit Village in nearly 30 municipalities in the TNJ region for demonstrating their commitment to revitalizing and redeveloping the area around their transit facilities into compact, mixed‐use neighborhoods with a strong residential component. The Transit Village District is typically a half‐mile radius around the transit station with multiple transit‐oriented development (TOD) projects planned for the area within the district.238,239,240
237 Ingrid Gould Ellen and Keren Mertens Horn, “Do Federally Assisted Households Have Access to High Performing Public Schools?” Washington, D.C.: Poverty & Race Research Action Council. (November 2012)
238 http://www.nj.gov/transportation/refdata/research/reports/FHWA‐NJ‐2010‐002.pdf
239 http://www.state.nj.us/transportation/community/village/faq.shtm
Designing Compatible High‐Quality Affordable Housing To promote housing that is both affordable and compatible in design with surrounding housing, HUD has developed the www.designadvisor.org web site in cooperation with The American Institute of Architects, Enterprise Community Partners, Inc., the Federal Home Loan Bank of Boston, the Local Initiatives Support Corporation, the National Congress for Community Economic Development, and the Neighborhood Reinvestment Corporation. This site provides an extensive collection of information, tools, and best practices for developers, municipalities, and community members.

TOGETHER North Jersey Fair Housing & Equity in Northern New Jersey
10-25
Access to high quality public education is another important opportunity. In our existing Communities of Concern, magnet schools designed with specialized learning environments or other enhancements can attract a racially and economically diverse student body from inside and outside the neighborhood through voluntary incentives.241 While these schools, which are typically but not exclusively public or public charter, may also increase pressures for gentrification, efforts must be made to accommodate existing households within gentrifying neighborhoods to ensure that they benefit from these community improvements. 242
Affirmatively Furthering Fair Housing requires that housing affordable to lower income and special needs populations is available in places of high opportunity. These places are characterized by good transportation, employment, education, parks, and other amenities. HUD should work to align key housing and infrastructure programs, such as LIHTC, CDBG, HOME, and program funds from NJDOT and NJTPA, with FHEA strategies and actions in the TNJ region.
240 http://www.hud.gov/offices/cpd/about/conplan/tod.cfm
241 http://www.prrac.org/pdf/bringing_children_together.pdf
242 http://www.mapc.org/neighborhood‐change
Implementing Magnet Schools The John A. Johnson elementary school in St. Paul, MN, uses a charter school model to set a new curriculum, run an onsite, multilingual family services center, and offer meeting and recreational space to the public. The neighborhood development company, with school development partners, created a revolving loan fund to aid in the renovation or creation of housing for the families of children attending the school. Housing trust fund‐sponsored rental assistance vouchers are available to parents who use the family services center. As a result, residential stability for children at the elementary school has improved along with standardized test scores for children attending the school.

TOGETHER North Jersey Fair Housing & Equity in Northern New Jersey
10-26
The New Jersey Housing & Mortgage Finance Agency (NJHMFA) administers the project‐based housing program with the greatest potential to advance fair housing in the TNJ region. The State’s housing finance agency administers the federal Low‐Income Housing Tax Credits (LIHTC) program, a rental housing assistance program created under the Tax Reform Act of 1986 that has eclipsed the traditional public housing program as the largest affordable housing production program in the nation.
As the federal government has withdrawn support for the construction of HUD‐financed public housing, the IRS‐administered LIHTC program has continued to incentivize private investors to construct affordable rental housing throughout the nation. In the short span since Congress established the LIHTC program in 1986,
the NJHMFA has financed the construction of 51,000 lower‐income housing units in over 500 developments throughout the State of New Jersey.
To its credit, in 2013, the NJHMFA has increased its commitment to AFFH by altering its project selection criteria to encourage a greater percentage of its LIHTC‐supported multi‐family rental housing development in suburban locations with higher performing schools and access to employment centers (see text box). This is despite federal IRS regulations that allow up to 30 percent more LIHTC tax credits for affordable rental housing projects located in Qualified Census Tracts – that is, census tracts designated by HUD in which at least half of the households have incomes that are less than 60 percent of the area median income or have a poverty rate of at least 25 percent.243 This rule actually undercuts AFFH by concentrating LIHTC developments in highly segregated, poor neighborhoods throughout the United States244 except for designated Difficult to Develop Areas.245 Unlike public housing projects,
243 http://www.huduser.org/portal/pdredge/pdr_edge_research_042412.html
244 Michael B. de Leeuw, Megan K. Whyte, Dale Ho, Catherine Meza, and Alexis Karteron, Residential Segregation and Housing Discrimination in the United States. Washington, D.C.: Poverty & Race Research Action Council and National Fair Housing Alliance. January 2008. Pp. 8‐9.
245 Section 42 of the Internal Revenue Code provides the 30% boost for LIHTC for both Qualified Census Tracts as well as Difficult to Develop Areas (DDAs). Projects located within the HUD‐defined DDAs in the TNJ region, in Hudson County for 2015, are eligible for the boost, and need not be also located within a Qualified Census Tract. Additionally, the Housing and Economic Recovery Act of 2008 (HERA) authorizes the NJHMFA to declare a Difficult to Develop area and award the 30% boost for 9% projects at its discretion. Given the high cost of construction, land, etc in NJ, NJHMFA will award to boost to any 9% project with justification. To remove Qualified Census Tracts or extend boosts to places of high priority requires revision of Section 42 of the Internal Revenue Code, which requires that all Qualified Allocation Plans (QAP) give preference to projects located in qualified census tracts.
Avoiding and Minimizing Gentrification in Core Communities and Diverse Suburbs Efforts must be made by municipalities and developers to accommodate existing households within gentrifying neighborhoods to ensure that they benefit from community improvements. The Boston, MA area Metropolitan Area Planning Council (MAPC) has created a toolkit, “Managing Neighborhood Change: Selected Anti‐Displacement Strategies in Practice” that identifies anti‐displacement best practices and examples of local strategies to advance the interests of lower‐income individuals and families who are at risk of displacement from their neighborhoods due to new investment in housing, businesses, and infrastructure, including transit. This toolkit is based on a comprehensive literature review of academic and non‐academic reports released over the last 10 years. It uses data, case studies, and planning project work to understand indicators of displacement and create a responsive framework that integrates them into planning policies and programs.

TOGETHER North Jersey Fair Housing & Equity in Northern New Jersey
10-27
LIHTC developments are removed from HUD’s guidelines prohibiting new low‐income housing in racially and economically isolated neighborhoods. The IRS needs to remove this incentive for Qualified Census Tracts or at least extend this incentive to places of high opportunity.246
Over time, NJHMFA’s increased focus upon AFFH objectives will have a measurable impact upon the concentration of subsidized housing development in urban and inner ring suburbs – a pattern of investment that has characterized all of the project‐based programs in the TNJ Region. If the Qualified Census Tract incentive is removed, LIHTC allocation may be more effectively spread to all municipalities in the TNJ region and to the state as a whole.
246 Extending this IRS incentive to Transit Oriented Development may be considered, but access to transit is one of many factors (education, employment, safety are among some 20 factors) defining areas of high opportunity. Extending this incentive to TODs or any one factor in the absence of other factors increases opportunity but does not in itself define an area of high opportunity.
Using the Qualified Allocation Plan to Address Deconcentration of Poverty The Qualified Allocation Plan (QAP), which is the regulation that governs the administration of federal Low Income Housing Tax Credits (LIHTC) in NJ, has traditionally provided increased scoring opportunities for projects located close to public transportation (1/2 mile) as well as proximate to positive land uses (parks, recreation, retail, and local amenities) and has deducted points for being located near negative land uses (nuclear power plants, landfills, oil/chemical refinery, etc.). The LIHTC program is traditionally thought of one the most successful housing production programs ever created. The program encourages private investment and provides subsidy to encourage development of affordable housing that otherwise would not be able to be produced.
The current QAP for NJHMFA added a requirement to specifically address the objectives of deconcentrating poverty and increasing income diversity. In five census tracts throughout the State, “non‐preservation projects located in census tracts wherein 30 percent or more of the existing housing units are low income housing tax credit units shall not be eligible for funding unless the following criteria are met:
i. The project must be a redevelopment project; ii. The project does not add more low‐income units to the census tract; iii. The project plan includes relocation options to higher opportunity areas and mobility counseling assistance
for existing residents; and iv. The application includes a municipal resolution that references this paragraph (N.J.A.C. 5:80‐33.12(c)17) and
supports the allocation of housing tax credits for the development.”
NJHMFA has also instituted a policy to distribute allocations between the Targeted Urban Municipalities (“urban”) and areas located outside (“suburban”):
Forty percent (40%) of the credits (inclusive of all set‐asides) shall be made available to Targeted Urban Municipalities and the remaining credits shall be allocated to the remainder of the State, provided NJHMFA receives a sufficient number of eligible applications from areas outside of Targeted Urban Municipalities to result in these allocation percentages.
The credits allocated toward Targeted Urban Municipalities could exceed 40 percent if necessary to fully fund a project.
“Targeted Urban Municipalities” means those Urban Aid Municipalities designated pursuant to N.J.S.A. 52:27D‐178 plus Atlantic City, with a poverty rate greater than 8.1 percent.

TOGETHER North Jersey Fair Housing & Equity in Northern New Jersey
10-28
NJHMFA must also take the next step and seek to link its LIHTC allocations to other housing programs in the TNJ region such as with the NJ Council on Affordable Housing (COAH). With interlocking boards of governance, the NJHMFA and COAH are already administratively linked to the New Jersey Department of Community Affairs (NJDCA). It should not be difficult for the NJHMFA governing board to establish and implement a policy that would prioritize the allocation of LIHTC funding to suburban municipalities that have COAH‐certified Housing Elements and Fair Share Plans ( i.e., to towns with zoning and land use ordinances that are in compliance with the Mt. Laurel Doctrine).
In addition, NJHMFA and COAH have another significant opportunity to address a major limitation of the COAH program. As noted earlier, COAH units — particularly the deed‐restricted lower‐income rental units — often lack sufficient subsidy to be truly affordable to their intended beneficiaries. NJDCA’s regionally‐administered Housing Choice Voucher program should prioritize a portion of its voucher allocation – federal or the State‐funded SRAP voucher program – to ensure that low‐ and very‐low income units that are developed in mixed‐income inclusionary developments in the suburbs are truly affordable.247 The Jersey City Housing Authority used an option in the HCV (Section 8) program for Project‐Based Assistance, in which rental assistance is tied to the unit, to expand affordable housing at a number of multifamily buildings. Subsequently, new HUD regulations made Project‐Based Assistance more flexible and workable.
The HUD Choice Neighborhoods program supports locally driven strategies to address struggling neighborhoods through a comprehensive approach including neighborhood preparation of a Transformation Plan. The program is designed to catalyze critical improvements in neighborhood assets, including vacant property, housing, services and schools, to create and implement a plan that transforms distressed housing under existing HUD programs and addresses the challenges in the surrounding neighborhood. Examples of this program in the TNJ region include Montgomery Gardens in Jersey City248,249 and the Dayton Street neighborhood in Newark.250
Table 10‐4: Actions to Locate Affordable Housing in Areas of High Access to Opportunities
# Actions Responsibility Timeframe
1. Allocate federal Low Income Tax Credits (LIHTC) to emphasize the location of family‐oriented and mixed income affordable housing in higher opportunity suburban communities.
Lead: NJHMFASupport: HUD, NJDCA
Short term
247 In the past, when SRAP vouchers were available, NJHMFA worked jointly with NJDCA to fund and award concurrently with the LIHTC cycles. However, that subsidy source is not currently available. NJHMFA defers to NJDCA on priorities and opportunities for leverage of the Housing Choice Vouchers with LIHTC.
248 http://www.jcha‐gov.us/Hope‐VI‐Programs/Montgomery%20Choice%20Neighborhoods.aspx
249 This area was part of a TNJ Local Demonstration Project. See http://togethernorthjersey.com/?grid‐portfolio=montgomery‐gardens‐sustainable‐transportation‐plan‐jersey‐city
250 http://www.newarkha.org/cnidocs.php

TOGETHER North Jersey Fair Housing & Equity in Northern New Jersey
10-29
# Actions Responsibility Timeframe
2. Expand eligibility and priority for federal Low Income Tax Credit (LIHTC) and other relevant federal programs to create and maintain affordable and special needs housing units in areas of higher opportunity.
Lead: IRSSupport: HUD, NJHMFA, NJDCA, Developers
Medium term
3. Expand eligibility and priority for New Jersey Council on Affordable Housing (COAH) and other relevant State programs to create and maintain affordable and special needs housing units in areas of higher opportunity.
Lead: COAHSupport: NJDCA, NJHMFA, Municipalities, Developers
Medium term
4. Ensure that public and publicly subsidized housing units are not more vulnerable to flooding and other natural hazards or to sources of environmental contamination than neighboring housing units.
Lead: MunicipalitiesSupport: NJOEM, NJDEP, NJDCA, County Planning and Emergency Management Agencies, PHAs, Developers
Short term
5.1 Through zoning or redevelopment plans, encourage mixed‐use developments or mixtures of land uses that provide opportunities for supportive housing within 1/8 mile of a transit station or stop.
Lead: MunicipalitiesSupport: NJ Transit, NJ Redevelopment Authority, NJDCA, NJ Office For Planning Advocacy, Counties, NGOs, Developers
Short term
5.2 Through zoning or redevelopment plans, encourage mixed‐use developments or mixtures of land uses that provide opportunities for affordable housing within ¼ mile of a transit station or stop.
Lead: MunicipalitiesSupport: NJ Transit, NJ Redevelopment Authority, NJDCA, NJ Office For Planning Advocacy, Counties, NGOs, Developers
Short term
5.3 Through zoning or redevelopment plans, encourage mixed‐use developments or mixtures of land uses that provide opportunities for employment for a range of incomes within ½ mile of a transit station or stop that includes and improves access to fresh food, health care services, and neighborhood retail.
Lead: MunicipalitiesSupport: NJ Transit, NJ Redevelopment Authority, NJDCA, NJ Office For Planning Advocacy, Counties, NGOs, Developers
Short term
6. Through zoning or redevelopment plans, require mixed‐income housing and space for jobs of a wide range of types and incomes within walking distance of transit.
Lead: MunicipalitiesSupport: NJ Redevelopment Authority, NJDCA, NJ Office for Planning Advocacy, PHAs, Developers
Medium term
7. Establish reasonable design guidelines to ensure that affordable housing units are visually compatible with market price units.
Lead: MunicipalitiesSupport: COAH, Developers, NGOs
Short term
8. Educate the public with data describing the average population of affordable housing units with regard to age, employment, occupation, and disabilities relative to the population at large to counter the prejudice associated with the planning and construction of affordable housing units.
Lead: NJDCASupport: NJHMFA, COAH, Municipalities
Short term

TOGETHER North Jersey Fair Housing & Equity in Northern New Jersey
10-30
# Actions Responsibility Timeframe
9. Through zoning or redevelopment plans, and through financial, rent control and property tax relief programs, protect or provide equal or better opportunities for housing for existing low‐income and special needs households within neighborhoods that are gentrifying or at high risk of gentrifying.
Lead: MunicipalitiesSupport: NJ Redevelopment Authority, NJDCA, NJ Office For Planning Advocacy, Counties, Developers, NGOs
Short term
10. Prioritize funding for magnet schools that focus on community needs and reduce racial and economic isolation for children living in areas in Communities of Concern slated for major redevelopment to increase educational opportunity.
Lead: NJDOESupport: School districts
Medium term
11. Remove LIHTC program incentives for Qualified Census Tracts, or extend the incentive to Areas of High Opportunity
Lead: US CongressSupport: IRS, HUD
Medium term
12. Expand the use of mandatory set‐asides to require 20% of any new housing development or redevelopment assisted by any form of federal or state aid to be affordable units, half for low income and half for moderate‐income households, provided the projects are not located in Communities of Concern.
Lead: HUDSupport: NJDCA, COAH, Municipalities
Medium term
13. Locate public housing projects near places of high opportunity.
Lead: PHAsSupport: HUD, Municipalities
Medium term
14. Apply Choice Neighborhood program concepts to work with institutions and businesses near housing projects to increase local employment and provide neighborhood services and amenities.
Lead: MunicipalitiesSupport: HUD, NJEDA, PHAs
Medium term
15. Offset educational expense with PILOT contributions from subsidized housing developments and residential redevelopment.
Lead: MunicipalitiesSupport: Redevelopment agencies, School districts
Medium term
16. Increase Fair Market Rents for Housing Choice Voucher holders, so that they may have more opportunities to find housing in places with high Access to Opportunities within the payment standards limits.
Lead: HUD Medium term
Strategy: Create Employer Assisted Housing Accessible to Employment Centers 10.4.4
The American workplace is far more racially and ethnically integrated than the average American neighborhood – or neighborhood school. Major employers depend upon their racially, ethnically and economically diverse workforces to function. Yet, despite years of civil rights enforcement, segregation and isolation persist in the region’s housing market, often in the neighborhoods where federally‐assisted households reside.
Employers struggling with recruitment and retention find employer‐assisted housing to be an especially powerful tool for leveraging an employer benefit to revitalize the neighborhoods around their job sites while helping meet the housing needs of low‐ and moderate‐income working families. Programs and

TOGETHER North Jersey Fair Housing & Equity in Northern New Jersey
10-31
resources are in place nationally and are readily adapted for use within the region.251,252,253 Employer‐assisted housing programs must be strongly encouraged by public policy, using the resources and programs available to HUD‐financed entities, incentivized to undertake cooperative relationships with regionally‐administered housing programs that would bring workers nearer to their places of employment.
Employer‐assisted housing is a "double bottom line" business strategy:
Employees and their families secure affordable housing near their workplaces; this builds their equity and financial assets, especially if it helps them to purchase their first home.
Employers find and keep qualified workers, improve community relations, and revitalize neighborhoods.
Employer‐assisted housing programs are generally oriented toward households with incomes between 80 and 120 percent of the area median, and include rental assistance, homeownership education, credit repair and counseling. Economies of scale in providing housing may be achieved by extending benefits to lower income employee and non‐employee residents.
Employer‐assisted housing programs in suburban and rural locations might amplify the types of linkages between voucher and COAH programs that were discussed earlier. In urban and transit hub locations, partnerships with HUD‐funded Neighborhood Choice programs that seek to convert public housing into mixed‐income and mixed‐use neighborhoods, or that target locally‐administered CDBG funding to redevelopment efforts, will create valuable synergies.
New Jersey’s commercial developer fee for affordable housing should be re‐instituted with a new provision that permits a portion of the fee to be dedicated to affordable housing for the employees of the commercial enterprise that is paying the fee. This should reduce resistance to the fee, while providing a direct and tangible benefit to the company paying it and creating housing near jobs.
251 http://www.policylink.org/sites/default/files/employer‐assisted‐housing.pdf
252 http://www.bostonfed.org/commdev/necd/2006/q1/EmployerAssistedHousing.pdf
253 http://portal.hud.gov/hudportal/HUD?src=/states/illinois/news/eah
Employer Assisted Housing Programs Employees of the Aurora Health Care Employee Homeownership Program in Milwaukee, WI receive financial and homeownership guidance, forgivable loans, and access to affordable, low‐cost mortgage financing that support long term, successful homeownership. Data have shown that by making a modest investment to provide these benefits, Aurora also experiences a bottom‐line benefit. Program participants are proving to be better performing employees who choose to stay with the organization longer, and reduced turnover correlates to increased workplace stability, productivity, and morale.
Funded in part by the William Penn Foundation, the Camden Employer Assisted Housing Program provides financial incentives to employees of anchor institutions in the City of Camden who choose to purchase a home in the neighborhood adjacent to their employer. Participating institutions include Cooper University Hospital, Camden Redevelopment Agency, Virtua, Our Lady of Lourdes Hospital, Rutgers University, and Rowan University and three banks, Susquehanna Bank, TD Bank and PNC Bank. Policies, application procedures and incentives vary for each institution.

TOGETHER North Jersey Fair Housing & Equity in Northern New Jersey
10-32
By building relationships with local lenders with whom they have existing business relationships, employers could potentially guarantee mortgage loans, thus eliminating PMI costs to lower‐income employees. The overall impact of PMI elimination could have a long term impact that is even more significant than modest levels of down payment assistance. Elimination of PMI on a $150,000 mortgage saves the homeowner approximately $100 per month, and could be accomplished with no cash outlay from the employer. The triple part of the bottom line is that such an arrangement might also qualify participating lenders to obtain CRA credits.
Table 10‐5: Actions to Create Employer Assisted Housing Accessible to Employment Centers
# Actions Responsibility Timeframe
1.1 Provide incentives to businesses to provide for employer‐assisted housing that is accessible to employment centers by walking, bicycle, or public transit.
Lead: NJEDASupport: NJ Business Action Center
Medium term
1.2 All government jurisdictions should provide financial incentives to their low and moderate income employees to enable them to live near their place of employment, accessible by walking, bicycle, or public transit.
Lead: NJDCASupport: State agencies, regional agencies, Counties, Municipalities, School Districts
Medium term
2. Make employment centers more accessible by walking, bicycle, or public transit to support and encourage employer‐assisted housing.
Lead: MunicipalitiesSupport: NJDOT, NJDCA, COAH, Counties
Medium term
3. Re‐institute the commercial developer fee for affordable housing, with a new provision enabling a portion of the fee to go to affordable housing for the employees of the commercial enterprise that is paying the fee.
Lead: NJDCASupport: COAH
Short term
10.5 Vision 3: Access to Opportunity Is Increased through Housing Mobility
The tenant‐based Housing Choice Voucher (HCV) Program, among all of the programs that HUD funds in the TNJ region, has the greatest potential for improving access to the region’s places of high opportunity (i.e., communities with quality schools, affordable housing, and employment opportunities) for low‐ and moderate income households. However, the HCV program must be restructured to truly provide residential choices for the low and moderate income families concentrated in the urban areas and inner ring suburbs of the region.
Strategy: Regionalize Housing Choice Voucher Programs 10.5.1
The HUD‐funded Housing Choice Voucher (HCV) program should be restructured to foster greater use of HCVs in tandem with inclusionary housing in places of high opportunity. The HCV program is the largest rental housing program in the TNJ region. It is also the federal housing program best situated to achieve the AFFH goals of residential mobility and de‐concentration of racial and ethnic minority households. The HCV program issues Housing Choice Vouchers allowing lower‐income households to shop for modestly‐priced apartments in the private rental market as an alternative to residing in local low‐income public housing projects.

TOGETHER North Jersey Fair Housing & Equity in Northern New Jersey
10-33
The HCV program is inherently a housing mobility program with significant potential to achieve the de‐concentration of lower‐income and minority neighborhoods. However, several studies have demonstrated that the HCV program often fails to achieve this fair housing objective. Voucher holders, often minority households, are limited by the availability and accessibility of modestly priced apartments and often choose to rent apartments in their current predominately low‐income minority neighborhoods.
For example, a recent study of ten years of the Baltimore County, Maryland housing voucher counseling program found that two‐thirds of 2,000 families, nearly all with female heads of households, that relocated from urban neighborhoods of high segregation and poverty to suburban neighborhoods (of less than 10 percent poor and 30 percent black, and less than 5 percent of residents living in subsidized housing) remained in their new suburban neighborhoods one to eight years later. The one‐third that returned to their original neighborhoods cited reasons associated with uprooting of social and family networks, particularly for families with high school age children. 254
In evaluating why the HCV program has failed to promote household mobility outside of low‐income minority neighborhoods, it is useful to consider the HCV “utilization rates” in the TNJ region and to examine the relative effectiveness of various administrative agencies in successfully providing opportunities for voucher holders to obtain affordable units. New Jersey’s Department of Community Affairs (NJDCA) and the eight (8) counties in the TNJ North Jersey region that collectively administer Housing Choice Vouchers have demonstrated that a regional approach to HCV administration is significantly more successful – as measured by “vouchers in use” – than the 58 locally‐administered programs of individual Public Housing Authorities (see Table 10‐10).
Table 10‐10: Percent of Authorized Housing Choice Vouchers in Use and Utilization Rates, 2012
Agencies
Percent in Use
Authorized Vouchers Vouchers in Use
NJDCA 96% 21,138 20,318
8 County Agencies 94.6% 6,919 6,547
58 LHAs 88.4% 35,638 31,496
254 “Living Here has Changed My Whole Perspective”: How Escaping Inner‐City Poverty Shapes Neighborhood and Housing Choice. Jennifer Darrah and Stefanie DeLuca. Journal of Policy Analysis and Management. Volume 33, Issue 2, pages 350–384, Spring 2014

TOGETHER North Jersey Fair Housing & Equity in Northern New Jersey
10-34
The lower voucher utilization rates by the local public housing authorities likely reflects the difficulty the voucher holders experience in finding modest priced apartments within the limited jurisdictional areas of those PHAs. In light of this challenge, the fifty‐eight (58) local public housing agencies should be incentivized to join into regional public housing consortia – perhaps on a county‐wide basis – to provide voucher holders with greater opportunity to access the wider regional housing marketplace.
Consolidating and/or centralizing of voucher administration will achieve greater choice and access to educational and employment opportunities. However, local housing agencies must be provided significant incentives or mandates to surrender their current administrative autonomy. Housing authorities earn administrative fee income based upon their HCV utilization rates. PHAs with low utilization of vouchers are at risk of permanently losing vouchers and the attendant administrative fee income. Moreover, housing authorities lose administrative fee income when voucher holders utilize their vouchers outside the jurisdiction of the local agencies. In general, savings introduced through administrative efficiencies are likely to be offset by higher administrative fees awarded to PHAs achieving higher voucher utilization rates and placing more households in places of high opportunity, and the additional costs for administering housing mobility counseling programs.
Pooling PHA voucher allocations to achieve higher voucher utilization rates and “internalizing” voucher fee income that would otherwise be lost by vouchers used outside their jurisdictions, coupled with economies of scale from pooling, will expand housing options for voucher holders and thereby achieve greater regional mobility ‐‐ a primary AFFH goal.
Further, the HCV Program will be more effectively used if voucher households are better informed and prepared for relocation and the availability of support services in their new location, and if landlords are better informed and prepared to rent to households using vouchers to increase housing supply and choices for these households. Counseling needs to be provided during the moving and settling process to help families navigate unfamiliar apartment and school district regulations and transportation arrangements.
The Chicago Regional Housing Choice Initiative is an example of a collaboration of eight PHAs and housing organizations that have streamlined the voucher application process, including relocation counseling, for low income families across multiple PHA jurisdictions. This program has improved mobility of low‐income households to areas of higher opportunity while lowering net administrative costs.255
255 http://www.hcp‐chicago.org/2014/program/project‐opportunity/
Encouraging Consortia for Local PHAs
On July 11, 2014, HUD published a proposed rule in the Federal Register streamlining the formation of consortia of local public housing authorities to regionally administer HCV programs. The proposal summarized the intent of the rule, as follows:
The proposed rule has two primary goals: (1) Increase administrative efficiencies associated with forming a consortium; and (2) facilitate maximum resident choice in locating suitable housing within a region through consortia, without the administrative burden associated with the portability process and other policies.
A PHA Consortium, operating as a single entity, would adopt a PHA 5‐Year Plan that addresses regional housing needs and AFFH objectives.
— Federal Register 79:133, p. 40019 et seq., July 11, 2014.

TOGETHER North Jersey Fair Housing & Equity in Northern New Jersey
10-35
In gentrifying neighborhoods, HCVs may be used with low‐cost loans to cover housing price increases that would otherwise result in displacement. In this way, existing residents have the choice to remain in their neighborhoods to benefit from the increased access to opportunity associated with new investment in the gentrified neighborhood.256
Higher HCV utilization rates will also be achieved by more current Fair Market Rent calculations, particularly in high opportunity neighborhoods. In these areas, HCVs are significantly below monthly rent costs, resulting in unused vouchers if the balance cannot be supplemented by other programs.
Table 10‐11: Actions to Regionalize Housing Choice Voucher Programs
# Actions Responsibility Timeframe
1. Increase the transferability of Housing Choice Vouchers among public housing authorities to provide more housing options closer to better job and education opportunities.
Lead: HUDSupport: PHAs
Medium term
2.1 Provide incentives or mandates to consolidate and centralize the administration of Housing Choice Vouchers through consortia of public housing authorities within regions.
Lead: HUDSupport: PHAs
Long term
2.2 Consolidate and centralize the administration of Housing Choice Vouchers through consortia of public housing authorities within regions.
Lead: PHAsSupport: HUD
Long term
3. Provide Housing Choice Vouchers and low cost loan opportunities to residents facing displacement from gentrification.
Lead: PHAsSupport: HUD
Medium term
4. Increase “urban county” CDBG program funding to cover costs of housing mobility counseling to both households and landlords.
Lead: HUDSupport: CDBG Agencies
Medium term
5.1 Place families using Housing Choice Vouchers into high and maximum Areas of Opportunity.
Lead: PHAs Medium term
5.2 Increase administrative fees to local Public Housing Authorities (PHAs) for Housing Choice Vouchers assisting families to locate in high Areas of Opportunity.
Lead: HUDSupport: PHAs
Medium term
5.3 Reduce administrative fees to PHAs for Housing Choice Vouchers that over‐concentrate families in low and medium Areas of Opportunity.
Lead: HUDSupport: PHAs
Medium term
6. Update and increase, as appropriate, Fair Market Rent calculations, particularly in areas of High Opportunity, to ensure that HCVs cover monthly rents without need of supplemental rent assistance programs.
Lead: HUDSupport: NJDCA
Medium term
256 http://www.prrac.org/pdf/JanFeb2014PRRAC_Godsil.pdf

TOGETHER North Jersey Fair Housing & Equity in Northern New Jersey
10-36
Strategy: Link Regional HCV Programs to COAH Housing 10.5.2
The HUD‐funded Housing Choice Vouchers that are currently allocated to the TNJ region constitute a potentially powerful tool to assist lower income and minority families seeking access to the greater opportunities in the suburbs of the Region. The HCV program is a considerably larger housing assistance program than the 33,191 conventional public housing units that all‐to‐often concentrate poor and minority elderly and family households in distressed neighborhoods.
Linking the deeply‐subsidized and tenant‐based HCV program to the production of mixed‐income/ inclusionary housing in the suburbs – specifically, implementing regionally‐administered voucher programs with the mixed‐income/inclusionary housing programs at the core of the Council on Affordable Housing (COAH) regional housing strategy – would greatly advance AFFH progress in the TNJ Region.
It is not widely understood that the key New Jersey program designed to facilitate the construction of mixed‐income/inclusionary affordable housing in suburban communities, so‐called “COAH housing”, is neither publicly‐owned nor publicly subsidized housing. Rather it is privately‐constructed and privately‐owned housing. These ownership and rental units are “internally subsidized” by the builder and/or by their market‐rate neighbors. COAH regulations require that fifty percent (50%) of all such units be deed‐restricted for occupancy by low‐ and very low‐income occupancy, typically for 30 years.
The absence of any direct financial subsidy to the low‐ and very low‐income occupants of this housing often has the unintended consequence of yielding rent levels that are unaffordable or unavailable to the targeted segment of renters. Municipalities are understandably reluctant to commit local funds ‐‐ even their affordable housing trust funds ‐‐ to subsidize these lower‐income households.
Clearly, COAH’s efforts to encourage suburban communities and private developers to participate in the construction and operation of these privately‐owned mixed‐income housing developments would be more successful if the HCV program subsidies were available to households to guarantee the long‐term viability of these suburban developments. Of at least equal importance for lower‐income and minority families, linking HCVs to these “affordable” units would actually result in the rent being affordable.
Table 10‐12: Actions to Link Regional HCV Programs to COAH Housing
# Actions Responsibility Timeframe
1. Link Housing Choice Voucher programs (public subsidies) with privately subsidized mixed‐income inclusionary housing programs (e.g. COAH and LIHTC) to make housing options in the suburbs more affordable.
Lead: HUDSupport: IRS, COAH, NJHMFA
Medium term

TOGETHER North Jersey Fair Housing & Equity in Northern New Jersey
10-37
Strategy: Link Regional HCV Programs with School Funding Programs 10.5.3
Statutory and regulatory mechanisms linking HCVs with Federal and State public education funding should be established that account for housing stock, potential locations for businesses, opportunities for educational achievement, and similar factors. A share of public education funding should be allocated to housing programs that provide affordable housing for low‐income households employed in high opportunity areas to enable their children to be educated in higher achieving districts.
In a 2012 study, it was found that the Housing Choice Voucher Program had the effect of steering low‐income families into low opportunity areas. Nationally, the average family receiving HCVs lived near an elementary school at the 26th percentile of performance in its region, with an average of 74% of children receiving free and reduced price lunch, a standard measure of concentration of poverty. These numbers were worse for older metropolitan areas. By comparison, neighborhood elementary schools are at the 37th percentile of performance for average renters and at the 30th percentile of performance for average poor families (most of whom do not receive Federal housing subsidies).257
In another study, David Rusk examined 101 municipalities and 92 school districts in the Camden, New Jersey area. He found that were each school district required to equalize the socioeconomic profiles to all of its schools to the district‐wide average, and low‐income families from the City of Camden and 22 minimum opportunity towns were able to move into maximum, high, and medium opportunity towns in the region, an index of school segregation based upon income would fall 24 percent. 258
Rigid programmatic and funding silos that effectively reinforce historic patterns of racial and ethnic segregation and isolation in the TNJ region must be reformed, and such a reform agenda should be recognized as integral element of affirmatively furthering fair housing. Clearly, a rethinking of the major State of New Jersey funding for the education of poorer children ‐‐ in the so‐called “Abbott School Districts” – is one means for opening the door to the quality suburban school districts in the region.
Mandating that the State’s funding of education in the State’s poorest school district is to “follow the student” as the student’s family uses their Housing Choice Voucher to move to rental housing in the
257 Ingrid Gould Ellen and Keren Mertens Horn, “Do Federally Assisted Households Have Access to High Performing Public Schools?” Washington, D.C.: Poverty & Race Research Action Council. (November 2012)
258 David Rusk, “Housing Policy is School Policy”: A commentary. Finding Common Ground: Coordinating Housing and Education Policy to Promote Integration. Washington, D.C.: Poverty & Race Research Action Council and the National Coalition on School Diversity, pp. 21‐30 (October 2011)
“…suppose in its application for Race to the Top funds, a state — New Jersey, let’s say — had proposed that “we are going to take every action to create racially and economically inclusive communities that, in turn, will support racially and economically inclusive schools. To fully implement the Mt. Laurel doctrine, we will use federal Race to the Top funds to acquire housing units in high opportunity communities with high performance schools and establish regional housing mobility programs to help low‐income families with school age children move from low opportunity communities to high opportunity communities — places in which many of their parents are often already working (commuting at substantial cost in money and time). Our standard would be ‘Anybody good enough to work here is good enough to live here — and their children are good enough to be going to our local schools” — David Rusk, “Housing Policy is School Policy”: A
commentary.

TOGETHER North Jersey Fair Housing & Equity in Northern New Jersey
10-38
suburbs of the region would loosen the knot that ties the State’s educational funding to many of the poorest performing schools.
It is well understood that middle class families seek housing in the suburbs to secure for their children the high quality educational opportunities that many suburban schools provide. Linking regionally administered HCV mobility programs to State educational funding will provide these same educational advantages to the children of the poor currently trapped in education districts with the lowest performing schools in the region, some of which are directly managed by the State. David Rusk proposes a similar policy for Federal “Race to the Top” education funding (see inset), pointing out that the U.S. Department of Education made no provision in its funding guidelines for strategies to diminish racial and economic segregation despite it being a central issue confronting American education. 259
This strategy will improve educational opportunities for children in low income households and for children with special needs, which is a key to improving employment opportunity, household incomes, and housing opportunity over the long term.
Table 10‐6: Actions to Link the Housing Choice Voucher and School Funding Programs
# Actions Responsibility Timeframe
1. Link regional Housing Choice Voucher programs with Federal and State public education funding to provide affordable housing in communities with high quality schools.
Lead: HUDSupport: NJDOE, NJDCA
Medium term
10.6 Vision 4: Public Investment Creates, Connects, and Strengthens Access to Opportunity
Key public investment programs should be aligned with FHEA strategies and actions in the TNJ region. Investments in places of low opportunity can be, in some cases, transformative, particularly in Communities of Concern. In this context, investment includes social programs as well as physical infrastructure such as roads, public transit, water and sewer systems, existing public housing, parks, schools, community facilities, art and culture (including historic) sites and centers. Given the scale and importance of public investment, improved transparency in reporting holds the potential to enable the public to better examine the priorities embedded in patterns of investment. This information can be used to inform the prioritization of program investments and project proposals that improve safety and mobility in low‐opportunity neighborhoods and communities of concern, or better connect low opportunity neighborhoods and communities of concern to places of high opportunity.
Building greater transparency about the facility and system location of public investments is needed to better report, monitor and integrate equity considerations in spatial terms. Collection of detailed data across many Federal, State, regional and local infrastructure programs has proven to be extremely difficult, primarily because there is insufficient standardization and few statutory requirements to standardize, or political will to do so. There is room for improvement in the development and
259 “Housing Policy is School Policy”: A commentary. Finding Common Ground: Coordinating Housing and Education Policy to Promote Integration. Washington, D.C.: Poverty & Race Research Action Council and the National Coalition on School Diversity, pp. 21‐30 (October 2011). See http://www.prrac.org/pdf/HousingEducationReport‐October2011.pdf

TOGETHER North Jersey Fair Housing & Equity in Northern New Jersey
10-39
adherence to data protocols and compliance with data‐sharing requirements should become a condition for the receipt of program funds and capital expenditures. Programs already exist to develop capacity for local leadership at relatively low cost.260
Strategy: Ensure Public Investment Programs Connect and Strengthen Communities of Concern 10.6.1
Currently, public investment is unevenly distributed and persons living in high‐minority and low‐income communities are not well connected to the places of higher opportunity within the region, and live more often in places characterized by low‐opportunity. One means for addressing the inequitable distribution of public investment in the TNJ region and inequitable access to opportunity is to make application‐based public investment programs more accessible to applicants that want to attract investment in high minority areas, low‐income areas, and communities of concern. Many major public investment programs in the TNJ region for economic development, environmental remediation, energy efficiency, and safety investments are application based.
The geography of public investment decisions for these programs is influenced, in part, by the resource and capacity of the applicants to effectively respond to funding opportunities. To increase the number and amount of investments in high minority areas, low‐income areas, and communities of concern, the barriers to applying for these public investment programs should be decreased. Providing more information about available public investment programs in New Jersey through seminars and workshops in communities of concern, partnerships with community leaders to promote these investment programs, developing informative brochures in multiple languages, and fostering accessible information that is on the website of the government agency administering the program can help inform more people about the opportunities that exist for attracting investment and boosting the applicants from high‐minority and low‐income areas.
The application standards and procedures required by government agencies for making public investments may prevent some less well‐resourced applicants from applying for incentive or investment programs. To apply for these programs, applicants must expend funds to prepare their application. For some programs like Safe Routes to School, applicants must be able to outlay requested funds before being reimbursed by the public investment program at a later time. This financial burden can prevent some applicants from applying, especially in communities of concern where businesses, schools, community facilities, and municipal governments may have less money to risk on applying for money that they may not receive. Although government agencies may provide counseling to help with the application process, this is not available for all the application‐based public investment programs in the region and can be further expanded to help inform and attract more applicants.
260 http://www.sustainablecommunities.gov/sites/sustainablecommunities.gov/files/docs/team‐ej‐sustainability‐deskbook‐120110‐hires.pdf
FHEA Informs the RPSD’s Strategies and Actions Strategies and actions are needed to:
Address inequitable investment.
Develop equity criteria for allocating funding and for investing in public and private projects in consultation with community groups.
Prioritize infrastructure projects that will increase access, affordability, mobility, and employment opportunities for low‐income communities and communities of color.
Establish performance measures ensuring that infrastructure projects target areas with the poorest quality of infrastructure.

TOGETHER North Jersey Fair Housing & Equity in Northern New Jersey
10-40
Table 10‐14: Actions to Ensure Public Investments Connect and Strengthen Communities of Concern
# Actions Responsibility Timeframe
1 Prepare demographic profile at county level that identifies the location of high‐minority, low‐income and disadvantaged populations and “Communities of Concern” on a regular basis to support public involvement, planning and project development, program evaluation, and investment prioritization.
Lead: NJTPA and NJ Office For Planning Advocacy Support: All State agencies, Counties, Rutgers University/VTC
Medium term
2. Publish online and in centralized data web sites clear and transparent information about the investment programs available in many formats and multiple languages.
Lead: NJ Office for Planning Advocacy Support: All State agencies, Counties, Rutgers University/VTC
Long term
3. Develop leadership capacity of representatives from communities of color and low‐income communities where needed to influence infrastructure investments targeted to advancing sustainable communities and recommendations of the FHEA and RPSD.
Lead: NJTPA and NJ Office for Planning Advocacy Support: NGOs, Rutgers University/VTC
Short term
4. Develop pilot program focused on community safety and ladders of opportunity that provide project‐related resources for studies and technical assistance to directly engage with NGOs who work with traditionally disadvantaged populations in communities of concern in association with local and county jurisdiction partners.
Lead: NJTPA Support: NGOs, Rutgers University/VTC, NJ Office For Policy Advocacy, County and Local Governments
Short term
Strategy: Adopt Program and Project Prioritization Criteria to Better Connect Communities of 10.6.2
Concern to Places of Opportunity and In‐Place Solutions
Program investment and project prioritization criteria should address the unique needs and challenges of revitalizing the region’s central cities, diversifying its more affluent suburbs, and stabilizing the diverse, older suburbs. The FHEA has presented significant information about the socioeconomic patterns embedded in current policies, programs and project selection, illustrating inequalities and disparities in access to places of high opportunity. As suggested throughout the FHEA, these inequalities are an outward manifestation of complex policies and processes that contain inequities.
Addressing these inequities will require key policy changes and, perhaps, a better alignment of funding decisions with regional policy. It may involve directing an increasing share of funds to areas of concentrated poverty, to racially concentrated areas of poverty and, more broadly, to Communities of Concern. It may also involve shifting a greater share of funding to specific program and services for which low‐income residents and or minority populations disproportionately rely such as transit and bike/walk options, among others.

TOGETHER North Jersey Fair Housing & Equity in Northern New Jersey
10-41
The Infrastructure Needs Assessment261 of the New Jersey State Planning Commission provides an opportunity to evaluate the equity of public infrastructure investments in the region, provided that information is made available to determine whether the investments will increase Access to Opportunity or decrease equal Access to Opportunity. It is intended to serve as one of many sources of information—together with the Cross‐acceptance process, the monitoring and evaluation (State Plan indicators and targets) program, reports on plan implementation, and the deliberations of the State Planning Commission—contributing to the development of the New Jersey State Development and Redevelopment Plan and its attendant goals, objectives, policies and mapping.
Table 10‐15: Actions to Adopt Program and Project Prioritization Criteria to Better Connect Communities of Concern to Places of Opportunity and in Place Solutions
# Actions Responsibility Timeframe
1.1 Prepare an Infrastructure Needs Assessment identifying capital projects required to implement the strategies and actions of the FHEA.
Lead: NJ Office For Planning Advocacy Support: All State agencies, Rutgers University
Medium term
1.2 Use the Infrastructure Needs Assessment to evaluate the equity of public infrastructure investments in the region, provided that information is made available to determine whether the investments will increase Access to Opportunity or decrease equal Access to Opportunity.
Lead: NJ Office For Planning Advocacy Support: All State agencies, Rutgers University
Medium term
2. Review all capital budgets, programs, and project plans to determine their impact on FHEA strategies and actions, and give greater priority to resource allocation and timing to programs and projects that Affirmatively Further Fair Housing in the TNJ region.
Lead NJDCASupport: NJ Department of the Treasury, NJ Office for Planning Advocacy
Long term
3. Develop leadership capacity of representatives from communities of color and low‐income communities where needed to influence infrastructure investments.
Lead: NJ Office For Planning Advocacy Support: NGOs
Short term
10.7 Vision 5: CDBG Funding Substantially Increases Fair Housing Activities
Established in 1974, the Community Development Block Grant (CDBG) program is currently one of the longest continuously run programs at HUD. The CDBG program provides annual grants on a formula basis to more than 1,200 general units of local government and States. An analysis of HUD reports on expenditures by the TNJ region’s CDBG “urban counties” indicates that few expenditures have been made to support Fair Housing activities. The little CDBG funding that has been made has largely gone toward support of non‐profit HUD‐funded agencies that address individual housing discrimination complaints or provide individual housing and foreclosure counseling.
261 http://www.state.nj.us/state/planning/publications/154‐infrastructure‐needs‐assessment‐030101.pdf

TOGETHER North Jersey Fair Housing & Equity in Northern New Jersey
10-42
CDBG‐funded entities have great potential to Affirmatively Further Fair Housing (AFFH) bolstered by federal guidance, oversight and enforcement by HUD. With additional HUD funding or funding prioritization, these entities have the opportunity and the legal obligation to direct those federal resources to programs, projects and activities that will advance the goals of the Fair Housing Act and to promote the enactment of land use regulations that will permit private and non‐profit housing developers to bring their resources and expertise to the goal of AFFH.
The U.S. Congress annually appropriates far less than one percent of HUD’s budget to Fair Housing enforcement activities. HUD, the agency responsible for AFFH enforcement, has also permitted the local, county and state entities it funds to allocate an even smaller percentage of their funding on fair housing activities. This lack of emphasis on AFFH must be reversed if the TNJ Region is to make progress on addressing the unsustainable patterns of segregation and isolation that are keeping the region from achieving the promise of the Fair Housing Act of 1968.
Strategy: Increase Fair Housing Activities through CDBG Funding 10.7.1
The Westchester County settlement with the U.S. Department of Justice and the GAO Report to Congress issued in the aftermath of that settlement has revealed that CDBG‐funded entities can play a greater role in affirmatively furthering fair housing, provided there is active federal guidance, oversight and enforcement by HUD. These HUD‐funded entities have both a legal obligation and the opportunity to direct those federal resources to programs, projects and activities that will advance the goals of the Fair Housing Act; though the enactment of land regulations, private and non‐profit housing developers can bring their resources and expertise to the goal of furthering fair housing goals.
The CDBG program allows for the use of funds for “Planning and Capacity Building” activities to improve the grantee’s capacity (or that of its subrecipients) to plan and manage programs and activities for the grantee’s CBDG program. However, the amount of CDBG funds which may be used for activities under this category (whether by the grantee or its subrecipients) is subject to the 20% statutory limitation on planning and administrative cost. However, capacity building under the category of “Technical Assistance” does not have this limitation. This category enables CDBG funds to be used to increase the capacity of public or nonprofit entities to carry out eligible neighborhood revitalization or economic development activities, including those by the CDBG grantee. Several eligibility criteria must be met including consistency with national objectives, type of organization, type of activity and expected clientele that will be served, among other considerations.262
In communities affected by Superstorm Sandy in 2012, the State of New Jersey and all units of local government which receive CDBG‐DR funds must have a written and adopted Citizen Participation Plan that provides for technical assistance to groups representative of persons of low and moderate income who request assistance in developing proposals with the level and type of assistance to be determined by the grantee.
262 http://www.huduser.org/portal/oup/files/cdbgGuide.pdf
Using CDBG Funds for Technical Assistance The California Department of Housing and Community Development has provided grants of up to $70,000 for individual small cities and counties that are not CDBG entitlement communities for planning and evaluation studies related to any CDBG‐eligible activity, including studies and plans for housing, public works, community facilities, and economic development activities that meet CDBG national objectives, and provide principal benefit to low‐income persons.

TOGETHER North Jersey Fair Housing & Equity in Northern New Jersey
10-43
Table 10‐16: Actions to Increase Fair Housing Activities through CDBG Funding
# Actions Responsibility Timeframe
1. Provide additional funding for fair housing enforcement activities.
Lead: HUDSupport: CDBG agencies
Short term
2. For every land use plan, land development project, and capital improvement plan or project, identify and give priority to equitable outcomes related to jobs, environmental justice concerns, and displacement concerns.
Lead: MunicipalitiesSupport: Counties
Short term
3. Organize municipal working groups to ensure high engagement of community and equity groups.
Lead: MunicipalitiesSupport: NGOs
Short term
4. Fund capacity building training provided by not‐for‐profit organizations for community groups and agencies, to enable them to understand connections between FHEA and their work.
Lead: NJDCASupport: Counties, Regional agencies, NGOs
Medium term
10.8 Vision 6: More Housing Opportunities Are Available for People with Disabilities
The supply of housing for people with disabilities and special needs should be increased by incorporating appropriate changes to municipal zoning ordinances, capital improvement programs, NJ's Uniform Construction Code and other standards and actions affecting new construction and renovation of residential properties.
Persons with disabilities, a “protected class” under federal law, also comprise a large share of low‐ and moderate‐income individuals and households as disabilities limit opportunities to earn income and increase costs for health care, mobility, and other services. Demand for accessible housing is increasing as the population of seniors, including frail elderly increases, bringing a range of health care and safety needs due to physical and mental illness and injury.263 Similarly, veterans of military service of all ages are in need of accessible housing with universal design and complementary features both within residences and in commercial and institutional developments and in the infrastructure that serves these residents.
Strategy: Increase the Supply of Accessible Housing for Persons with Disabilities 10.8.1
Affirmatively furthering housing opportunities for disabled households in the TNJ region will be challenging. It will require changes in land use practices that have historically favored detached single family housing as well as amendments to the statewide construction and the rehabilitation sub code that provide little for handicapped accessibility in residential buildings of fewer than four (4) units. Housing agencies will also need to adjust their funding priorities and reconsider their housing occupancy policies.
As a result of New Jersey’s municipal zoning and land use regulations, more than 70% of households in the region are currently living in buildings with fewer than four dwellings. Unfortunately, the Fair Housing Act’s 1988 amendments that extended protections to disabled households (e.g., the right to request reasonable accommodations for a serious disability and to make dwelling alterations) only apply
263 http://lwd.state.nj.us/labor/lpa/pub/lmv/lmv19.pdf

TOGETHER North Jersey Fair Housing & Equity in Northern New Jersey
10-44
in residential buildings with four or more dwellings. Similarly, the NJ Uniform Construction Code and rehabilitation codes in New Jersey that effectively implement the 1990 Americans for Disability Act public accessibility features are only fully applicable in multi‐family buildings with elevators.
Expanding access for persons with disabilities to the existing privately‐owned and publicly assisted housing inventory will require amendments to the State of NJ’s Uniform Construction Code, municipal land use regulations and Public Housing Authority admission and occupancy policies. It would require mandating uniform standards for design and visitability in all new residential construction and in housing undergoing rehabilitation, renovation and expansion. For example, the State of New Jersey could expand the applicability of accessibility requirements to include all new residential structures of three or more dwellings.264
Appropriate modifications of construction codes, land use regulations and targeted public and private resources would, over time, substantially alter the built environment in ways that remove barriers to residential opportunities for persons with disabilities. For example, the many successful efforts that the State of New Jersey, municipal governments and private, nonprofit and public developers have made in recent years to implement green building techniques have demonstrated that such change in codes and regulations is possible. Transit oriented development (TOD) zoning regulations and targeted funding to construct transit oriented affordable housing can maximize the substantial positive benefits that accessibility improvements under the Americans with Disabilities Act have already made in the area of public transportation.
HUD’s most recent “Worst Case Housing Needs” report265 has documented the extent to which low‐income non‐elderly disabled households are disproportionately the most disadvantaged households. Addressing this underserved population will require New Jersey governmental agencies to respond by altering their funding formulas and housing regulations. It is encouraging that the NJHMFA has recently amended its LIHTC program formula to encourage the development of special needs housing.
Housing providers, particularly public housing agencies, need to reconsider their senior citizen housing occupancy and supportive service policies to afford non‐elderly low‐income disabled households more access to their substantial inventory of accessible and barrier‐free senior citizen housing. CDBG agencies also need to partner with public housing agencies to increase funding for supportive services to assist low‐income frail elderly and disabled non‐elderly residing in affordable housing.
264 Amendment to current NJ statute and Federal law may be required: “ A failure to design and construct any multi‐family dwelling of four units or more in accordance with barrier free standards promulgated by the Commissioner of Community Affairs pursuant to section 5 of P.L.1975, c.217 (C.52:27D‐123) shall be an unlawful discrimination.” The Federal Fair Housing Amendments of 1988 establish four‐units in a single structure as the threshold for requiring accessible dwelling units.
265 http://www.huduser.org/portal//Publications/pdf/HUD‐506_WorstCase2011_reportv3.pdf
Recognizing Universal Design Practical universal design features should be incorporated into new construction and home remodeling and renovation projects. The New Jersey Casino Reinvestment Development Authority (CRDA) funded the design and construction of a Universal Design Demonstration Home in Atlantic City. CRDA’s Universal Design Home Project, in partnership with AARP and the Center for Universal Design at NC State University demonstrated the importance of Universal Design in both new construction and remodeling.

TOGETHER North Jersey Fair Housing & Equity in Northern New Jersey
10-45
This strategy helps to meet needs of a protected class of individuals under the federal Fair Housing Act, but may make housing less affordable under the New Jersey Fair Housing Act unless the costs of providing accessibility are reduced by making these costs a more routine, normal part of design and construction. Products with accessibility and universal design features are not more expensive, as a general rule, although early adopters often pay higher prices for appliances with such features until the products become mainstream (the variability in price is less than that introduced by style and fashion). While initial construction costs may be slightly higher, accessible homes will have more value to their occupants in the long term as they will be more usable for a lifetime.266
Table 10‐17: Actions to Increase the Supply of Accessible Housing to Persons with Disabilities
# Actions Responsibility Timeframe
1. Expand the applicability of fair housing requirements in the State of New Jersey to include all new residential and mixed use structures including three (3) or more dwellings, with special consideration for the re‐use of existing buildings.
Lead: COAHSupport: HUD, NJDCA, NJHMFA, NJ Department of Human Services
Medium term
2. Revise zoning to require Universal Design and other appropriate design requirements for accessibility of buildings in all commercial and institutional zones, in all residential zones within ¼ mile of transit stops, and in all age‐restricted (55+) housing developments.
Lead: MunicipalitiesSupport: NJDCA, NJ Office For Planning Advocacy, NJ Department of Human Services, PHAs, NGOs
Medium term
3. Design all capital improvements for public facilities to Increase the ability of people with disabilities and special needs to access jobs, housing, and services.
Lead: NJDCA and NJDOTSupport: NJ Department of Human Services, Counties, Municipalities, PHAs, NGOs
Medium term
4. Incorporate appropriate changes to NJ's Uniform Construction Code affecting new construction and renovation of residential properties to Increase the supply and accessibility of housing for people with disabilities and special needs.
Lead: NJDCASupport: NJ Department of Human Services, Municipalities, Developers, NGOs
Long term
5. Research the other federal, state, regional, and local standards and actions that impede Increasing the supply and accessibility to housing for people with disabilities and special needs, and identify appropriate changes and priorities.
Lead: NJ Department of Human Services Support: NJDCA, NJHMFA, Municipalities, CDBG Recipients, PHAs, Developers, NGOs
Long term
266 http://www.destatehousing.com/NewsAndEvents/gov_conf_presentation/supply_1_b.pdf

TOGETHER North Jersey Fair Housing & Equity in Northern New Jersey
11-1
11 REFERENCES
Abbott v. Burke II, 119 N.J. 287 (The Supreme Court of New Jersey 1990).
Afshar, Anna. “New Arguments for Employer‐Assisted Housing.” New England Community
Developments. Boston: Federal Reserve Bank of Boston. 2006 Issue 1.
http://www.bostonfed.org/commdev/necd/2006/q1/EmployerAssistedHousing.pdf
American Nutritional Association. “USDA Defines Food Deserts, American Nutrition Association.”
Accessed June 2, 2014. http://americannutritionassociation.org/newsletter/usda‐defines‐food‐deserts.
Axel‐Lute, Miriam. “Finally! A Concrete Proposal to Address Gentrification‐Driven Displacement.”
Rooflines: The Shelterforce Blog. January 17, 2014.
http://www.rooflines.org/3569/finally_a_concrete_proposal_to_address_gentrification‐
driven_displacement/
Chatman, Daniel G. and Stephanie E. DiPetrillo. Eliminating Barriers to Transit‐Oriented Development.
Rutgers University: Alan M. Voorhees Transportation Center. March 2010.
http://www.nj.gov/transportation/refdata/research/reports/FHWA‐NJ‐2010‐002.pdf
Belsky, Eric. The Dream Lives On: The Future of Homeownership in America. Harvard University, Joint
Center for Housing Studies, January 2013. http://jchs.harvard.edu/sites/jchs.harvard.edu/files/w13‐
1_belsky_0.pdf.
Berube, Alan, Elizabeth Deakin, and Steven Raphael. “Socioeconomic Differences in Household
Automobile Ownership Rates: Implications for Evacuation Policy.” In Risking House and Home: Disasters,
Cities, Public Policy. Berkeley Public Policy Press. Accessed May 30, 2014.
http://urbanpolicy.berkeley.edu/pdf/Ch10_Berube_Deakin_Raphael.pdf
Bloom, Dan. “TANF Recipients with Barriers to Employment.” Text, May 14, 2012.
http://www.urban.org/publications/412567.html.
Bravve, Elina, Megan Bolton, Linda Couch, and Sheila Crowley. Out of Reach, 2012. Washington, D.C.:
National Low Income Housing Coalition. March 2012. www.nlihc.org/oor/2012
Brief of Proposed Amici Curiae, New Jersey State Conference of the National Association for the
Advancement of Colored People and Latino Action Network, Supreme Court of New Jersey, In the
Matter of the Adoption of N.J.A.C. 5:96 and 5:97 by the New Jersey Council on Affordable Housing. June
15, 2011
Buchanan v. Warley, 245 U.S. 60 (The United States Supreme Court, 1917)
Common Core State Standards Initiative. “Development Process | Common Core State Standards
Initiative.” Accessed May 30, 2014. http://www.corestandards.org/about‐the‐standards/development‐
process/.

TOGETHER North Jersey Fair Housing & Equity in Northern New Jersey
11-2
Corporation For Enterprise Development (CFED). “Housing Cost Burden ‐ Homeowners.” CFED Assets
and Opportunity Scorecard, 2013. http://scorecard.assetsandopportunity.org/2013/measure/housing‐
cost‐burden‐homeowners.
Darrah, Jennifer and Stefanie DeLuca. “Living Here Has Changed My Whole Perspective”: How Escaping
Inner‐City Poverty Shapes Neighborhood and Housing Choice.” Journal of Policy Analysis and
Management 33:2, pp. 350–384. Spring 2014. http://www.baltimoreregionalhousing.org/wp‐
content/uploads/2014/03/JPAM‐2014.pdf
David v. Vesta, 45 N.J. 301 (The Supreme Court of New Jersey, 1965)
de Leeuw, Michael B., Megan K. Whyte, Dale Ho, Catherine Meza, and Alexis Karteron. Residential
Segregation and Housing Discrimination in the United States. Washington, D.C.: Poverty & Race
Research Action Council and National Fair Housing Alliance. January 2008.
http://www.prrac.org/pdf/FinalCERDHousingDiscriminationReport.pdf
Dewan, Shaila. “In Many Cities, Rent Is Rising Out of Reach of Middle Class.” The New York Times, April
14, 2014. http://www.nytimes.com/2014/04/15/business/more‐renters‐find‐30‐affordability‐ratio‐
unattainable.html.
Ellen, Ingrid Gould and Keren Mertens Horn. “Do Federally Assisted Households Have Access to High
Performing Public Schools?” Washington, D.C.: Poverty and Race Research Action Council. November
2012.
http://www.prrac.org/full_text.php?item_id=12623&newsletter_id=0&header=Current%20Projects
Federal Deposit Insurance Corporation. FDIC Compliance Manual: Equal Credit Opportunity Act (ECOA).
January 2014. http://www.fdic.gov/regulations/compliance/manual/pdf/V‐7.1.pdf
Federal Financial Institutions Examination Council. A Guide to HMDA Reporting: Getting It Right! 2013.
http://www.ffiec.gov/hmda/pdf/2013guide.pdf
Godsil, Rachel D. “Autonomy, Mobility, and Affirmatively Furthering Fair Housing in Gentrifying
Neighborhoods.” Poverty & Race 23:1. January/February 2014.
http://prrac.org/newsletters/janfeb2014.pdf and
http://www.prrac.org/pdf/JanFeb2014PRRAC_Godsil.pdf
EPA, US. “Clean Air Act Requirements and History | Air Pollution and the Clean Air Act | US
Environmental Protection Agency.” Accessed June 2, 2014.
http://www.epa.gov/air/caa/requirements.html.
“Glossary of Terms: What Works Clearinghouse.” Accessed May 30, 2014.
http://ies.ed.gov/ncee/wwc/glossary.aspx.
Gopal, Prashant. “Foreclosures Surging in New York‐New Jersey Market.” Bloomberg, February 26, 2014.
http://www.bloomberg.com/news/2014‐02‐26/foreclosures‐climaxing‐in‐new‐york‐new‐jersey‐market‐
mortgages.html.

TOGETHER North Jersey Fair Housing & Equity in Northern New Jersey
11-3
Gunderson, Gordon. “National School Lunch Program: Background and Development.” USDA Food and
Nutrition Service (FNS), January 24, 2014. http://www.fns.usda.gov/nslp/history.
Hanson, Susan, and Genevieve Giuliano, eds. The Geography Of Urban Transportation. 3rd ed. New
York: The Guilford Press, 2004.
Hartley, Daniel. Gentrification and Financial Health. Cleveland: Federal Reserve Bank of Cleveland.
November 6, 2013. http://www.clevelandfed.org/research/trends/2013/1113/01regeco.cfm
Harvard University, Joint Center for Housing Studies. “America’s Rental Housing: Evolving Markets and
Needs.” Joint Center for Housing Studies of Harvard University, December 9, 2013.
http://www.jchs.harvard.edu/research/publications/americas‐rental‐housing‐evolving‐markets‐and‐
needs.
Hasse, John, John Reiser, and Alexander Pichacz, Evidence of Persistent Exclusionary Effects of Land Use
Policy within Historic and Projected Development Patterns in New Jersey: A Case Study of Monmouth and
Somerset Counties. Glassboro: Rowan University. 2011.
http://gis.rowan.edu/projects/exclusionary/exclusionary_zoning_final_draft_20110610.pdf
“How Fast Does Your State Foreclose?” NPR.org. Accessed June 2, 2014.
http://www.npr.org/2012/03/15/148696260/how‐fast‐does‐your‐state‐foreclose.
Iceland, John, Daniel Weinberg, and Erika Steinmetz. Racial and Ethnic Residential Segregation in the
United States: 1980 ‐ 2000. Census 2000 Special Reports, August 2002.
http://www.census.gov/prod/2002pubs/censr‐3.pdf.
Ihlanfeldt, Keith. “The Spatial Mismatch Between Jobs and Residential Locations Within Urban Areas.”
Cityscapes 1, no. 1 (November 1993): 219–44.
http://www.huduser.org/periodicals/cityscpe/vol1num1/ch11.pdf.
Julian, Tiffany. Work‐Life Earnings by Field of Degree and Occupation for People With a Bachelor’s
Degree: 2011. American Community Survey Briefs. United States Census Bureau, October 2012.
http://www.census.gov/prod/2012pubs/acsbr11‐04.pdf.
Legal Service of New Jersey, Poverty Research Institute. Poverty Benchmarks 2013: Assessing New
Jersey’s Progress in Combatting Poverty. Edison, NJ: Legal Services of New Jersey. September 2013.
http://www.lsnj.org/Benchmarks2013.aspx
Lester, T. William and Daniel A. Hartley. The Long‐Term Employment Impacts of Gentrification in the
1990s. Working Paper 13‐07. Cleveland: Federal Reserve Bank of Cleveland. May 2013.
http://www.clevelandfed.org/research/workpaper/2013/wp1307.pdf
Levine, Jonathan. Zoned Out: Regulation, Markets, and Choices in Transportation and Metropolitan
Land‐Use. Washington, DC: Resources for the Future. 2006.
Levitt & Sons, 31 N.J. 514 (The Supreme Court of New Jersey, 1960)

TOGETHER North Jersey Fair Housing & Equity in Northern New Jersey
11-4
Manufacturing Institute, The. “2011 Skills Gap Report ‐ The Manufacturing Institute.” Accessed May 30,
2014. http://www.themanufacturinginstitute.org/Research/Skills‐Gap‐in‐Manufacturing/2011‐Skills‐
Gap‐Report/2011‐Skills‐Gap‐Report.aspx.
Massey, Douglas S., Len Albright, Rebecca Casciano, Elizabeth Derickson, and David N. Kinsey. Climbing
Mount Laurel: The Struggle for Affordable Housing and Social Mobility in an American Suburb. Princeton:
Princeton University Press. July 2013.
Massey, Douglas. “Solving Urban Poverty: Lessons from Suburbia”, Pathways. Spring 2013, pp.22‐23.
http://web.stanford.edu/group/scspi/_media/pdf/pathways/spring_2013/Pathways_Spring_2013_Mass
ey.pdf
McKinsey & Company. “Tackling Youth Unemployment.” McKinsey on Society. Accessed May 30, 2014.
http://mckinseyonsociety.com/education‐to‐employment/.
McKinnish, Terra, Randall Walsh, and T. Kirk White. Who Gentrifies Low‐Income Neighborhoods? July
2009. http://spot.colorado.edu/~mckinnis/migrants072209.pdf
Mortgage Banker’s Association (MBA). “National Delinquency Results Map 4th Quarter 2010.” Mortgage
Banker’s Association, February 2011. http://www.mortgagebankers.org/files/Research/NDS_Maps.pdf.
National Association of Realtors’ Research Division. Social Benefits of Homeownership and Stable
Housing. Accessed May 30, 2014. http://www.realtor.org/sites/default/files/social‐benefits‐of‐stable‐
housing‐2012‐04.pdf.
New Jersey Council on Affordable Housing. Proposed Procedural Rules. June 2, 2014.
http://www.nj.gov/dca/services/lps/hss/statsandregs/598_for_web.pdf.
New Jersey Council on Affordable Housing. Proposed Substantive Rules. June 2, 2014
http://www.nj.gov/dca/services/lps/hss/statsandregs/599_for_web.pdf
New Jersey State Planning Commission. The New Jersey State Development and Redevelopment Plan:
Infrastructure Needs Assessment. March 2001. http://www.state.nj.us/state/planning/publications/154‐
infrastructure‐needs‐assessment‐030101.pdf
Olaytoye, Shola and Keith Fairey. Hurricane Sandy Impacts at a Glance. Enterprise Community. 2013.
https://s3.amazonaws.com/KSPProd/cache/documents/678/67892.pdf
Pendall, Rolf. “Driving to Opportunity: Understanding the Links among Transportation Access,
Residential Outcomes, and Economic Opportunity for Housing Voucher Recipients.” Text, March 31,
2014. http://www.urban.org/publications/413078.html.
Philadelphia Coalition for Affordable Communities. “Advocates Launch Philadelphia Affordable
Communities Campaign: More than 30 organizations join together to call for “Development without
Displacement.” September 4, 2014. http://planphilly.com/uploads/media_items/pcac‐new‐coalition‐
for‐affordable‐communities‐release‐09‐04‐2014.original.pdf
PolicyLink. Equitable Development Toolkit: Employer Assisted Housing. October 2007.
http://www.policylink.org/sites/default/files/employer‐assisted‐housing.pdf

TOGETHER North Jersey Fair Housing & Equity in Northern New Jersey
11-5
Poverty & Race Research Action Council, “Affirmatively Furthering Fair Housing at HUD: A First Term
Report Card.” Washington, D.C.: Poverty & Race Research Action Council. January 2013.
http://www.prrac.org/pdf/HUDFirstTermReportCard.pdf
Rebuild by Design. Sandy Regional Assembly: Recovery Agenda. April 2013.
http://www.rebuildbydesign.org/research/component/k2/39‐community‐social/86/86
Ritzdorf, Marsha. Locked Out of Paradise: Contemporary Exclusionary Zoning, the Supreme Court, and
African Americans, 1970 to the Present. Thousand Oaks: Sage Publications. 1977
Ross, Lynn M. Quantifying the Value Proposition of Employer‐Assisted Housing: A Case Study of Aurora
Health Care. Washington, D.C.: National Housing Conference, Center for Housing Policy. May 2008.
http://www.nhc.org/media/documents/Quantifying_EAH.pdf
Rothwell, Jonathan and Douglas S. Massey. “Density Zoning and Class Segregation in U.S. Metropolitan
Areas.” Social Science Quarterly 91(5):1123‐1143. 2010.
Rothwell, Jonathan and Douglas S. Massey, “The Effect of Density Zoning on Racial Segregation in U.S.
Urban Areas.” Urban Affairs Review 44: 799‐806. 2009.
Rusk, David. “Housing Policy is School Policy”: A commentary. Finding Common Ground: Coordinating
Housing and Education Policy to Promote Integration. Washington, D.C.: Poverty & Race Research Action Council and the National Coalition on School Diversity, pp. 21‐30. October 2011.
http://www.prrac.org/pdf/HousingEducationReport‐October2011.pdf
Rusk, David. Education Baseline Topic Report. New Brunswick: Together North Jersey. October 2013.
http://togethernorthjersey.com/wp‐content/uploads/2013/11/Education‐report‐Word‐_DR‐edits‐10‐
15‐13_.pdf
Schott, Liz, and Clare Cho. General Assistance Programs: Safety Net Weakening Despite Increased Need,
December 19, 2011. http://www.cbpp.org/cms/?fa=view&id=3603.
Sharkey, Patrick. Stuck in Place: Urban Neighborhoods and the End of Progress toward Racial Equality.
Chicago: University of Chicago Press. 2013.
Schwartz, Alex F. Housing Policy in the United States. Second Edition. New York: Routledge. 2010.
Small Business Act (Public Law 85‐536, as amended)
http://www.sba.gov/sites/default/files/files/Small%20Business%20Act.pdf
Southern Burlington NAACP v. Township of Mount Laurel, 67 N.J. 151 (The Supreme Court of New
Jersey, 1975)
Steven Winter Associates, Inc. and Jennifer A. Stoloff. Multifamily Building Conformance with the Fair
Housing Accessibility Guidelines. Washington, D.C.: United States Department of Housing and Urban
Development. February 2003. http://www.huduser.org/portal/publications/fairhsg/multifamily.html

TOGETHER North Jersey Fair Housing & Equity in Northern New Jersey
11-6
Spreen, Thomas Luke. “Recent College Graduates in the US Labor Force: Data from the Current
Population Survey.” Monthly Labor Review, no. February 2013 (February 2013).
http://www.bls.gov/opub/mlr/2013/02/art1full.pdf.
State of New Jersey Board of Education. “New Jersey Assessment of Skills and Knowledge 2013 Score
Interpretation Manual Grades 3‐8.” State of new Jersey Department of Education, July 2010.
http://www.nj.gov/education/assessment/ms/5‐8/ref/SIM13.pdf.
State of New Jersey Department of Agriculture. “Department of Agriculture | National School Lunch
Program.” Accessed June 2, 2014.
http://www.nj.gov/agriculture/divisions/fn/childadult/school_lunch.html.
State of New Jersey Department of Community Affairs. “NJ Department of Community Affairs.” Guide to
Affordable Housing in New Jersey Revised October 23, 2013, October 23, 2013.
http://www.state.nj.us/dca/divisions/codes/publications/guide.html.
State of New Jersey Department of Education. “Adjusted Cohort Graduation Rate Information.”
Accessed May 30, 2014. http://www.state.nj.us/education/data/grate/info.htm.
———. “Common Core State Standards (CCSS).” Accessed May 30, 2014.
http://www.state.nj.us/education/sca/ccss/.
———. “New Jersey Assessment of Skills and Knowledge (NJ ASK).” Accessed May 30, 2014.
http://www.nj.gov/education/assessment/es/njask/.
Steffen, Barry L., Shawn Bucholtz, Marge Martin, David A. Vandenbroucke, and David Yao Yunn‐Gann.
Worst Case Housing Needs 2011: A Report to Congress, August 2013.
http://www.huduser.org/portal/Publications/pdf/HUD‐506_WorstCase2011_reportv3.pdf.
Supreme Court of New Jersey, In re Adoption of N.J.A.C. 5:96 and 5:97, 215 N.J. 578. (The Supreme
Court of New Jersey, 2013)
Tegeler, Philip, Susan Eaton, and Westra Miller. Bringing Children Together: Magnet Schools and Public
Housing Redevelopment. January 2009. http://www.prrac.org/pdf/bringing_children_together.pdf
Tegeler, Philip, Editor. Finding Common Ground: Coordinating Housing and Education Policy to Promote
Integration. Washington, D.C.: Poverty & Race Research Action Council and The National Coalition on
School Diversity. October, 2011. http://www.prrac.org/pdf/HousingEducationReport‐October2011.pdf
Trachtenberg, Paul, Gary Orfield, and Greg Flaxman. New Jersey’s Apartheid and Intensely Segregated
Urban Schools. Institute on Education and Law Policy, October 2013.
http://ielp.rutgers.edu/docs/IELP%20final%20report%20on%20apartheid%20schools%20101013.pdf.
Troutt, David Dante. The Price Of Paradise: The Costs Of Inequality And A Vision For A More Equitable
America. New York: New York University Press, 2013.
Tull, Steve. H.B. 227 Universal Design Features Cost Estimates. Undated.
http://www.destatehousing.com/NewsAndEvents/gov_conf_presentation/supply_1_b.pdf

TOGETHER North Jersey Fair Housing & Equity in Northern New Jersey
11-7
Turner, Margery Austin, Rob Santos, Diane K. Levy, Doug Wissoker, Claudia Aranda, and Rob Pitingolo.
Housing Discrimination Against Racial & Ethnic Minorities. 2012.
http://www.huduser.org/portal/publications/fairhsg/hsg_discrimination_2012.html
U.S. Bureau of Labor Statistics. “CES Frequently Asked Questions: Employment Concepts.” Current
Employment Statistics Frequently Asked Questions ‐ CES (National), February 11, 2014.
http://www.bls.gov/ces/cesfaq.htm#qc2.
U.S. Bureau of Labor Statistics. “Map: Local Area Unemployment Statistics.” Accessed May 30, 2014.
http://data.bls.gov/map/MapToolServlet?survey=la&map=county&seasonal=u.
U.S. Bureau of the Census. “Public Assistance Receipt in the Past 12 Months for Households: 2008 and
2009.” United States Census Bureau Library Publications. Accessed June 4, 2014.
http://www.census.gov/library/publications/2010/acs/acsbr09‐13.html.
———. “American Community Survey and Puerto Rico Community Survey 2010 Subject Definitions.”
United States Census Bureau, 2010.
http://www.census.gov/acs/www/Downloads/data_documentation/SubjectDefinitions/2010_ACSSubje
ctDefinitions.pdf.
———. “Census Glossary ‘Multifamily Housing.’” Census Glossary. Accessed June 2, 2014.
http://www.census.gov/glossary/#term_MultifamilyHousing.
———. “Census Glossary ‘Occupied Housing Unit.’” Census Glossary. Accessed June 2, 2014.
http://www.census.gov/glossary/#term_Occupiedhousingunit.
———. “Census Glossary ‘Owner Occupied Housing Unit.’” Census Glossary. Accessed June 2, 2014.
http://www.census.gov/glossary/#term_Owner‐occupiedhousingunit.
———. “Census Glossary ‘Public Welfare.’” Census Glossary. Accessed June 4, 2014.
http://www.census.gov/glossary/#term_Publicwelfare.
———. “Census Glossary ‘Renter Occupied Housing Units.’” Census Glossary. Accessed June 2, 2014.
http://www.census.gov/glossary/#term_Renter‐occupiedhousingunit.
———. “Survey of Market Absorption: Third Quarter 2010.” Survey of Market Absorption of
Apartments, Market Absorption of Apartments: Annual 2010 ‐ Absorptions. Accessed June 2, 2014.
https://www.census.gov/hhes/www/housing/soma/annual10/ann10txt.html.
United States Commission on Civil Rights. “Understanding Fair Housing.” Clearinghouse Publication 42.
February 1973. http://www.law.umaryland.edu/marshall/usccr/documents/cr11042.pdf
U.S. Department of Agriculture, Food Nutrition Service. “National School Lunch Program.” US
Department of Agriculture, Food Nutrition Service, September 2013.
http://www.fns.usda.gov/sites/default/files/NSLPFactSheet.pdf.
———. Rural Housing and Community Programs. “Rural Housing Options for Elderly People.” December
2004. http://www.rurdev.usda.gov/rd/pubs/pa1662.htm

TOGETHER North Jersey Fair Housing & Equity in Northern New Jersey
11-8
United States Environmental Protection Agency. Environmental Justice and Sustainability Reference
Deskbook. December 2010. http://www.sustainablecommunities.gov/pdf/team‐ej‐sustainability‐
deskbook‐120110‐hires.pdf
United States Department of Housing and Urban Development. “Affordable Housing ‐ CPD ‐ HUD ‘Cost
Burdened.’” Accessed May 30, 2014.
http://portal.hud.gov/hudportal/HUD?src=/program_offices/comm_planning/affordablehousing/
———. Annual Report on Fair Housing: Fiscal Year 2011. Undated.
http://portal.hud.gov/hudportal/documents/huddoc?id=FY2011_annual_rpt_final.pdf
———. “CHAS: Background, HUD USER ‐‐ Data and Definitions ‘HAMFI.’” Comprehensive Housing
Affordability Strategy Background. Accessed June 9, 2014.
http://www.huduser.org/portal/datasets/cp/CHAS/bg_chas.html.
———. “Glossary of HUD Terms, HUD USER ‘Affordable Housing.’” HUDUSER Glossary. Accessed June
2, 2014. http://www.huduser.org/portal/glossary/glossary_a.html.
———. “Eligibility ‐ Affordable Housing ‐ CPD ‐ HUD.” Eligibility for Low Income Housing Tax Credits.
Accessed May 30, 2014.
http://portal.hud.gov/hudportal/HUD?src=/program_offices/comm_planning/affordablehousing/trainin
g/web/lihtc/basics/eligibility.
———. Office of Community Planning and Development. Community Development Block Grant
Program: Guide to National Objectives & Eligible Activities for Entitlement Communities. Undated.
http://www.huduser.org/portal/oup/files/cdbgGuide.pdf
———. Office of Policy Development and Research. “Expanding Opportunity Through Fair Housing
Choice.” Evidence Matters. Spring/Summer 2014.
http://www.huduser.org/portal/periodicals/em/spring14/highlight1.html
———. Fair Housing Planning Guide. Volume 1. (Undated).
http://www.hud.gov/offices/fheo/images/fhpg.pdf
———. “How Do Housing Tax Credits Work? ‐ Affordable Housing ‐ CPD ‐ HUD.” How Do Housing Tax
Credits Work? Accessed June 2, 2014.
http://portal.hud.gov/hudportal/HUD?src=/program_offices/comm_planning/affordablehousing/trainin
g/web/lihtc/basics/work.
———.“Memorandum to Sustainable Communities Regional Planning Grantees.” January 2012.
http://www.sfrpc.com/Regional%20Partnership/2‐15‐16‐
2012Meetings/FHEA%20Program%20Guidance%20(final).pdf
———. “Questions and Answers on Hurricane Sandy Evacuees in Housing for Older Persons.” November
9, 2012. http://portal.hud.gov/hudportal/documents/huddoc?id=sandyguidance.pdf

TOGETHER North Jersey Fair Housing & Equity in Northern New Jersey
11-9
———. Sustainable Housing and Communities: Sustainable Housing and Communities Initiatives. “2012
Summary Statement and Initiatives.”
http://portal.hud.gov/hudportal/documents/huddoc?id=Sustainable_HaC_2012.pdf
———. Worst Case Housing Needs 2011: Report to Congress. August 2013.
http://www.huduser.org/portal/publications/affhsg/wc_HsgNeeds11_report.html
———. “HUD’s Public Housing Program/U.S. Department of Housing and Urban Development (HUD).”
Accessed May 30, 2014. http://portal.hud.gov/hudportal/HUD?src=/topics/rental_assistance/phprog.
——— and United States Department of Justice. Accessibility (Design and Construction) Requirements
for Covered Multifamily Dwellings under the Fair Housing Act. April 30, 2013.
http://www.ada.gov/doj_hud_statement.pdf
United States General Accounting Office. “Report to Congressional Requestors, Housing and Community
Grants: HUD Needs to Enhance Its Requirements and Oversight of Jurisdictions’ Fair Housing Plans.”
September 2010. http://www.gao.gov/new.items/d10905.pdf
Ver Ploeg, Michele, Vince Breneman, Tracey Farrigan, Karen Hamrick, David Hopkins, Phillip Kaufman,
Biing‐Hwan Lin, et al. “USDA Economic Research Service ‐ AP‐036, Access to Affordable Nutritious Food,”
March 26, 2012. http://www.ers.usda.gov/publications/ap‐administrative‐publication/ap‐
036.aspx#.U4zF1igvBe5.
Viveiros, Janet, and Maya Brennan. “Housing Landscape 2013: An Annual Look at the Housing
Affordability Challenges of America’s Working Households.” Center For Housing Policy, May 2013.
http://www.nhc.org/media/files/Landscape2013.pdf.
Williamson, Anne R. “Can They Afford the Rent? Resident Cost Burden in Low Income Housing Tax Credit
Developments.” Urban Affairs Review 47, no. 6 (November 1, 2011): 775–99.
doi:10.1177/1078087411417078.
Wilson, William J. When Work Disappears: The World of the New Urban Poor. 1st ed. New York: Knopf :
Distributed by Random House, Inc, 1996.
Wu, Sen‐Yuan. “Labor Force Participation In New Jersey.” New Jersey Department of Labor and
Workforce Development, September 3, 2013. http://lwd.state.nj.us/labor/lpa/pub/lmv/LMV_26.pdf.
Wu, Tao. “Federal Reserve Bank San Francisco, Two Measures of Employment: How Different Are
They?” Federal Reserve Bank of San Francisco Economic Letter, August 24, 2004.
http://www.frbsf.org/economic‐research/publications/economic‐letter/2004/August/two‐measures‐of‐
employment‐how‐different‐are‐they/.
Village of Euclid, Ohio v. Ambler Realty Co., 272 U.S. 365 (The United States Supreme Court, 1926).
Williams, Norman, Jr. and Thomas Norman, “Exclusionary Land Use Controls: The Case for North‐Eastern
New Jersey,” 22 Syr. L. Rev. 475. 1970.
http://heinonline.org/HOL/LandingPage?handle=hein.journals/syrlr22&div=32&id=&page=

TOGETHER North Jersey Fair Housing & Equity in Northern New Jersey
11-10
Wu, Sen‐Yuan, “New Jerseyans and Disabilities.” Labor Market Views 19. New Jersey Department of
Labor. April 19, 2012. http://lwd.state.nj.us/labor/lpa/pub/lmv/lmv19.pdf

TOGETHER North Jersey Fair Housing & Equity in Northern New Jersey
12-1
12 APPENDICES
The below Appendix items referenced in the FHEA can be found in a separate Appendices volume.
Appendix A: List of Municipalities by Municipality Type: Racially Diverse and Housing‐Related Inclusiveness
Appendix B: Glossary of Terms
Appendix C: Data Sources, Availability and Limitations of Data
Appendix D: New Jersey Laws against Discrimination
Appendix E: NJ Strategic Housing Plan Act of 2008
Appendix F. Summary of Prior Reports
Appendix G. Summary of Deliberation Activities