Embed Size (px)
Citation preview

Failure Sketching: A Technique for Automated
Root Cause Diagnosis of In-Production Failures
Baris Kasikci1 Benjamin Schubert1 Cristiano Pereira2 Gilles Pokam2 George Candea1
1{baris.kasikci,benjamin.schubert,george.candea}@epfl.ch 2{cristiano.l.pereira,gilles.a.pokam}@intel.com1 School of Computer and Communication Sciences, Ecole Polytechnique Fédérale de Lausanne (EPFL)
2 Intel Corporation
Abstract
Developers spend a lot of time searching for the root causesof software failures. For this, they traditionally try to re-produce those failures, but unfortunately many failures areso hard to reproduce in a test environment that developersspend days or weeks as ad-hoc detectives. The shortcomingsof many solutions proposed for this problem prevent theiruse in practice.
We propose failure sketching, an automated debuggingtechnique that provides developers with an explanation(“failure sketch”) of the root cause of a failure that occurredin production. A failure sketch only contains program state-ments that lead to the failure, and it clearly shows the differ-ences between failing and successful runs; these differencesguide developers to the root cause. Our approach combinesstatic program analysis with a cooperative and adaptive formof dynamic program analysis.
We built Gist, a prototype for failure sketching that relieson hardware watchpoints and a new hardware feature for ex-tracting control flow traces (Intel Processor Trace). We showthat Gist can build failure sketches with low overhead forfailures in systems like Apache, SQLite, and Memcached.
1. Introduction
Debugging—the process of finding and fixing bugs—istime-consuming (around 50% [44] of the development time).This is because debugging requires a deep understanding ofthe code and the bug. Misunderstanding the code or the bugcan lead to incorrect fixes, or worse, to fixes that introducenew bugs [39].
Permission to make digital or hard copies of all or part of this work for personal orclassroom use is granted without fee provided that copies are not made or distributedfor profit or commercial advantage and that copies bear this notice and the full citationon the first page. Copyrights for components of this work owned by others than theauthor(s) must be honored. Abstracting with credit is permitted. To copy otherwise, orrepublish, to post on servers or to redistribute to lists, requires prior specific permissionand/or a fee. Request permissions from [email protected].
SOSP’15, October 4–7, 2015, Monterey, CA.Copyright is held by the owner/author(s). Publication rights licensed to ACM.ACM 978-1-4503-3834-9/15/10. . . $15.00.http://dx.doi.org/10.1145/2815400.2815412
Traditionally, debugging is done in an iterative fashion:the developer runs the failing program over and over in adebugger, hoping to reproduce the failure, understand itsroot cause, and finally fix it. Fixing bugs generally requiresthe diagnosis of the root cause.
Intuitively, a root cause is the gist of the failure; it is acause, or a combination of causes, which when removedfrom the program, prevents the failure associated with theroot cause from recurring [74]. More precisely, a root causeof a failure is the negation of the predicate that needs to beenforced so that the execution is constrained to not encounterthe failure [80].
The ability to reproduce failures is essential to traditionaldebugging, because developers rely on reproducing bugs todiagnose root causes. A recent study at Google [57] revealedthat developers’ ability to reproduce bugs is essential tofixing them. However, in practice, it is not always possible toreproduce bugs, and practitioners report that it takes weeksto fix hard-to-reproduce concurrency bugs [18].
The greatest challenge though, is posed by bugs thatonly recur in production and cannot be reproduced in-house.Diagnosing the root cause and fixing such bugs is trulyhard. In [57], developers noted: “We don’t have tools for
the once every 24 hours bugs in a 100 machine cluster.” Aninformal poll on Quora [54] asked “What is a coder’s worst
nightmare,” and the answers were “The bug only occurs in
production and can’t be replicated locally,” and “The cause
of the bug is unknown.”
A promising method to cope with hard to reproduce bugsis using record/replay systems [2, 46]. Record/replay sys-tems record executions and allow developers to replay thefailing ones. Even though these systems are helpful, theyhave not seen widespread adoption in production systemsdue to the high overheads of software-only systems [14, 68],or due to lack of the hardware support that they rely on [20,46]. The recorded execution contains all statements presentin the original run. While this is very useful, the recordedexecution also contains statements that do not contribute tothe failure. Root cause diagnosis may be more time consum-

ing and thereby more difficult if the recorded execution con-tains elements that do not pertain to the failure [42] (e.g.,print statements that are not related to a failure). Ultimatelyrecord/replay systems merely aim to reproduce bugs, so rootcause diagnosis remains a time-consuming developer taskthat is done manually.
Other approaches to bug reproduction and root causediagnosis either assume knowledge of failing program in-puts [50, 58, 76] or rely on special runtime support forcheckpointing [67] or special hardware extensions [4, 52]that are not deployed. Some techniques sample the execu-tion for root cause diagnosis [5, 25, 38] and therefore, maymiss information present in the execution. This increases thelatency of root cause diagnosis, especially for elusive bugs.
In this paper, we present failure sketching, a techniquethat automatically produces a high level execution tracecalled the failure sketch that includes the statements thatlead to a failure and the differences between the propertiesof failing and successful program executions. Our evaluationshows that these differences, which are commonly acceptedas pointing to root causes [38, 58, 81], indeed point to theroot causes of the bugs we evaluated (§5).
Fig. 1 shows an example failure sketch for a bug inPbzip2, a multithreaded compression tool [16]. Time flowsdownward, and execution steps are enumerated along theflow of time. The failure sketch shows the statements (inthis case statements from two threads) that affect the failureand their order of execution with respect to the enumeratedsteps (i.e., the control flow). The arrow between the twostatements in dotted rectangles indicates the difference be-tween failing executions and successful ones. In particular,in failing executions, the statement f->mut from T1 is ex-ecuted before the statement mutex_unlock(f->mut) inT2. In non-failing executions, cons returns before main setsf->mut to NULL. The failure sketch also shows the value ofthe variable f->mut (i.e., the data flow) in a dotted rectan-gle in step 7, indicating that this value is 0 in step 7 only infailing runs. A developer can use the failure sketch to fix thebug by introducing proper synchronization that eliminatesthe offending thread schedule. This is exactly how pbzip2developers fixed this bug, albeit four months after it wasreported [16].
The insight behind the work presented here is that failuresketches can be built automatically, by using a combinationof static program analysis and cooperative dynamic analysis.The use of a brand new hardware feature in Intel CPUshelps keep runtime performance overhead low (3.74% in ourevaluation).
We built a prototype, Gist, that automatically generates afailure sketch for a given failure. Given a failure, Gist firststatically computes a program slice that contains programstatements that can potentially affect the program statementwhere the failure manifests itself. Then, Gist performs dataand control flow tracking in a cooperative setup by targeting
main(){
queue* f = init(size);
create_thread(cons, f);
...
free(f->mut);
f->mut = NULL;
...
}
Time Thread T1Thread T2
1
2
3
4
5
6
7
1
2
3
4
5
6
7
cons(queue* f){
...
mutex_unlock(f->mut);
}
1
2
3
4
5
6
7
Failure Sketch for Pbzip2 bug #1
Type: Concurrency bug, segmentation fault
f->mut
0
1
2
3
4
5
6
7
Failure (segfault)
{
Figure 1: The failure sketch of pbzip2 bug.
either multiple executions of the same program in a datacenter or users who execute the same program. Gist useshardware watchpoints to track the values of data items in theslice, and uses Intel Processor Trace [23] to trace the controlflow.
This paper makes the following contributions:
• A low overhead technique to automatically build failure
sketches by combining static analysis with cooperativeand adaptive dynamic analysis.
• A first and practical demonstration of how Intel Proces-sor Trace, a new technology that started shipping in early2015 Broadwell processors [23], can be used to performroot cause diagnosis.
Although Gist relies on Intel Processor Trace and hard-ware watchpoints for practical and low-overhead control anddata flow tracking, Gist’s novelty is in the combination ofstatic program analysis and dynamic runtime tracing to judi-ciously select how and when to trace program execution inorder to best extract the information for failure sketches.
We evaluated our Gist prototype using 11 failures from7 different programs including Apache, SQLite, and Mem-cached. The Gist prototype managed to automatically buildfailure sketches with an average accuracy of 96% for all thefailures while incurring an average performance overhead of3.74%. On average, Gist incurs 166× less runtime perfor-mance overhead than a state-of-the art record/replay system.
In the rest of the paper, we describe the challenges ofroot cause diagnosis (§2), Gist’s design (§3) and our pro-totype implementation (§4), an evaluation on real-world ap-plications (§5). We then discuss open questions and limita-tions (§6), related work (§7), and finally we conclude (§8).
2. Challenges
We now identify some of the key challenges of root causediagnosis.
(1) Non-reproducible and infrequent bugs: it is chal-lenging to diagnose root causes of failures that are hard toreproduce in house. When developers can’t reproduce fail-

ures, they have to “fill in the gaps” and potentially spend alot of time.
This is exacerbated if the failure recurs rarely in produc-tion, but not rarely enough to be ignored or if it is a catas-trophic bug [65]. This can slow down the process of gath-ering failure-related information from production runs (i.e.,executions in a data center or at user endpoints), and ulti-mately delay root cause diagnosis. Existing root cause diag-nosis techniques that rely on sampling program state duringthe execution increase the latency of root cause diagnosis.
(2) Accuracy: it is not enough to quickly bootstrap theroot cause diagnosis process, it is also necessary to eventu-ally diagnose the root cause accurately. This is hard for com-plex software with many modules and interactions. Devel-opers have limited time to do root cause diagnosis, thereforethey should not be misled by inaccurate root cause diagnosisinformation.
Two main factors determine the accuracy of root cause di-agnosis: the correct identification of relevant program state-ments that cause the failure and the correct identification ofprogram properties (execution order of statements, data val-ues, etc) that cause the failure.
(3) Overhead and intrusiveness: any practical root causediagnosis technique should incur low performance overheadin production and minimally perturb real-user executions.
To reduce overhead, existing root cause diagnosis tech-niques rely on special runtime and hardware support that isnot readily available. Solutions that perturb the actual behav-ior of production runs nondeterministically may mask thebug frequently but not always, and thus make it harder todiagnose the root cause and remove the potential for (evenoccasional) failure [47].
Gist addresses the key challenges of root cause diagno-sis using a hybrid static-dynamic analysis. To quickly boot-strap the root cause diagnosis process, Gist builds a first fail-ure sketch after a single manifestation of a failure. This firstfailure sketch is not perfect: it lacks elements that may beuseful for understanding the root cause of a bug, and it hassome elements that are not needed for root cause diagnosis.Therefore, for bugs that recur, Gist gathers more control anddata flow information from different production runs that en-counter the same failure1. This step improves the accuracy offailure sketches by eliminating most of the aforementionedimperfections.
3. Design
Gist, our system for building failure sketches has three maincomponents: the static analyzer, the failure sketch compu-tation engine, and the runtime that tracks production runs.The static analyzer and the failure sketch computation en-gine constitutes the server side of Gist, and they can be cen-tralized or distributed, as needed. The runtime constitutes the
1 Gist identifies the same failure across multiple executions by matching theprogram counters and stack traces of those executions.
Program P
(source) Static Analyzer
Gist-server
Runtime
Tracks
executions
of P with
watchpoints
and Intel PT
Backward slice
Failure
Report
(coredump,
stack trace,
etc...)Runtime traces
Failure
Sketch
Engine
1
Refinement
Instrumentation
3
2
4
Gist-client
Failure
sketch5
Figure 2: The architecture of Gist
client-side of Gist, and it runs in a cooperative setting suchas in a data center or in multiple users’ machines, similar toRaceMob [32].
The usage model of Gist is shown in Fig. 2. Gist takes asinput a program (source code and binary) and a failure report1 (e.g., stack trace, the statement where the failure mani-
fests itself, etc). Gist, being a developer tool has access to thesource code. Using these inputs, Gist computes a backwardslice [72] by computing the set of program statements thatpotentially affect the statement where the failure occurs. Gistuses an interprocedural, path-insensitive and flow-sensitivebackward slicing algorithm. Then, Gist instructs its runtime,running in a data center or at user endpoints, 2 to instru-ment the programs and gather more traces (e.g., branchestaken and values computed at runtime). Gist then uses thesetraces to refine the slice 3 : refinement removes from theslice the statements that don’t get executed during the exe-cutions that Gist monitors, and it adds to the slice statementsthat were not identified as being part of the slice initially.Refinement also determines the inter-thread execution orderof statements accessing shared variables and the values thatthe program computes. Refinement is done using hardwarewatchpoints for data flow and Intel Processor Trace (IntelPT) for control flow. Gist’s failure sketch engine gathersexecution information from failing and successful runs 4 .Then, Gist determines the differences between failing andsuccessful runs and builds a failure sketch 5 for the devel-oper to use.
Gist operates in a cooperative setting [32, 38] where mul-tiple instances of the same software execute in a data cen-ter or in multiple users’ machines. Gist’s server side (e.g.,a master node) performs offline analysis and distributes in-strumentation to its client side (e.g., a node in a data center).Gist incurs low overhead, so it can be kept always-on anddoes not need to resort to sampling an execution [38], thusavoiding missing information that can increase root causediagnosis latency.
Gist operates iteratively: the instrumentation and refine-ment continues as long as developers see fit, continuouslyimproving the accuracy of failure sketches. Gist generatesa failure sketch after a first failure using static slicing. Ourevaluation shows that, in some cases, this initial sketch is

sufficient for root cause diagnosis, whereas in other casesrefinement is necessary (§3.2).
We now describe how each component of Gist works andexplain how they solve the challenges presented in the pre-vious section (§2). We first describe how Gist computes thestatic slice followed by slice refinement via adaptive track-ing of control and data flow information. Then we describehow Gist identifies the root cause of a failure using multiplefailing and successful runs.
3.1 Static Slice Computation
Gist uses an interprocedural, path-insensitive and flow-sensitive backward slicing algorithm to identify the programstatements that may affect the statement where the failuremanifests itself at runtime. We chose to make Gist’s slic-ing algorithm interprocedural because failure sketches canspan the boundaries of functions. The algorithm is path-insensitive in order to avoid the cost of path-sensitive anal-yses that do not scale well [3, 55]. However, this is not ashortcoming, because Gist can recover precise path informa-tion at runtime using low-cost control flow tracking (§3.2.2).Finally, Gist’s slicing algorithm is flow-sensitive because ittraverses statements in a specific order (backwards) from thefailure location. Flow-sensitivity generates static slices withstatements in the order they appear in the program text (ex-cept some out-of-order statements due to path-insensitivity,which are fixed using runtime tracking), thereby helping thedeveloper to understand the flow of statements that lead to afailure.
Algorithm 1 describes Gist’s static backward slicing: ittakes as input a failure report (e.g., a coredump, a stack trace)and the program’s source code, and it outputs a static back-ward slice. For clarity, we define several terms we use in thealgorithm. CFG refers to the control flow graph of the pro-gram (Gist computes a whole-program CFG as we explainshortly). An item (line 7) is an arbitrary program element. Asource (line 8, 16) is an item that is either a global variable,a function argument, a call, or a memory access. Items thatare not sources are compiler intrinsics, debug information,and inline assembly. The definitions for a source and an itemare specific to LLVM [36], which is what we use for the pro-totype (§4). The function getItems (line 1) returns all theitems in a given statement (e.g., the operands of an arithmeticoperation). The function getRetValues (line 11) performsan intraprocedural analysis to compute and return the set ofitems that can be returned from a given function call. Thefunction getArgValues (line 14) computes and returns theset of arguments that can be used when calling a given func-tion. The function getReadOperand (line 20) returns theitem that is read, and the function getWrittenOperand
(line 23) returns the item that is written.Gist’s static slicing algorithm differs from classic static
slicing [72] in two key ways:First, Gist addresses a challenge that arises for multi-
threaded programs because of the implicit control flow edges
Algorithm 1: Backward slice computation (Simplified)
Input: Failure report report, program source code program
Output: Static backward slice slice
workSet ← getItems(failingStmt)1
function init ()2
failingStmt← extractFailingStatement(report)3
function computeBackwardSlice (failingStmt,program)4
c f g← extractCFG(program)5
while !workSet.empty() do6
item← workSet.pop()7
if isSource(item) then8
slice.push(item)9
if isCall(item) then10
retValues← getRetValues(item,cfg)11
workSet← workSet ∪ retValues12
else if isArgument(item) then13
argValues← getArgValues(item,cfg)14
workSet← workSet ∪argValues15
function isSource (item)16
if item is (global||argument||call||memory access) then17
return true18
else if item is read then19
workSet← workSet ∪ item.getReadOperand()20
return true21
else if item is write then22
workSet← workSet ∪ item.getWrittenOperand()23
return true24
return f alse25
that get created due to thread creations and joins. For this,Gist uses a compiler pass to build the thread interprocedural
control flow graph (TICFG) of the program [75]. An inter-
procedural control flow graph (ICFG) of a program connectseach function’s CFG with function call and return edges.TICFG then augments ICFG to contain edges that representthread creation and join statements (e.g., a thread creationedge is akin to a callsite with the thread start routine as thetarget function). TICFG represents an overapproximation ofall the possible dynamic control flow behaviors that a pro-gram can exhibit at runtime. TICFG is useful for Gist to trackcontrol flow that is implicitly created via thread creation andjoin operations (§3.2.2).
Second, unlike other slicing algorithms [59], Gist doesnot use static alias analysis. Alias analysis could determinean overapproximate set of program statements that may af-fect the computation of a given value and augment the slicewith this information. Gist does not employ static alias anal-ysis because, in practice, it can be over 50% inaccurate [32],which would increase the static slice size that Gist wouldhave to monitor at runtime, thereby increasing its perfor-mance overhead. Gist compensates for the lack of alias anal-

ysis with runtime data flow tracking, which adds the state-ments that Gist misses to the static slice (§3.2.3).
The static slice that Gist computes has some extraneousitems that do not pertain to the failure, because the slicingalgorithm lacks actual execution information. Gist weedsout this information using accurate control flow tracking atruntime (§3.2.2).
3.2 Slice Refinement
Slice refinement removes the extraneous statements fromthe slice and adds to the slice the statements that could notbe statically identified. Together with root cause identifica-tion (§3.3), the goal of slice refinement is to build what wecall the ideal failure sketch.
We define an ideal failure sketch to be one that: 1) containsonly statements that have data and/or control dependenciesto the statement where the failure occurs; 2) shows the fail-ure predicting events that have the highest positive correla-tion with the occurrence of failures.
Different developers may have different standards as towhat is the “necessary” information for root cause diagnosis;nevertheless, we believe that including all the statements thatare related to a failure and identifying the failure predictingevents constitute a reasonable and practical set of require-ments for root cause diagnosis. Failure predictors are identi-fied by determining the difference of key properties betweenfailing and successful runs.
For example, failure sketches display the partial order ofstatements involved in data races and atomicity violations,however certain developers may want to know the total orderof all the statements in an ideal failure sketch. In our experi-ence, focusing on the partial order of statements that matterfrom the point of view of root cause diagnosis is more usefulthan having a total order of all statements. Moreover, obtain-ing the total order of all the statements in a failure sketchwould be difficult without undue runtime performance over-head using today’s technology.
We now describe Gist’s slice refinement strategy in de-tail. We first describe adaptive tracking of a static slice toreduce the overhead of refinement (§3.2.1), then we de-scribe how Gist tracks the control flow (§3.2.2) and the dataflow (§3.2.3) to 1) add to the slice statements that get exe-cuted in production but are missing from the slice, and 2)remove from the slice statements that don’t get executed inproduction.
3.2.1 Adaptive Slice Tracking
Gist employs Adaptive Slice-Tracking (AsT) to track in-creasingly larger portions of the static slice, until it buildsa failure sketch that contains the root cause of the failurethat it targets. Gist performs AsT by dynamically trackingcontrol and data flow while the software runs in production.AsT does not track all the control and data elements in thestatic slice at once in order to avoid introducing performanceoverhead.
Static
slice
AST
(1st iteration)
}σ1= 2
Root cause
AST
(2nd iteration)
}σ2= 4
failure(a) (b) (c)
AST
(3rd iteration)
}σ3= 8
(d)
Figure 3: Adaptive slice tracking in Gist
It is challenging to pick the size of the slice, σ , to monitorat runtime, because 1) a too large σ would cause Gist todo excessive runtime tracking and increase overhead; 2) atoo small σ may cause Gist to track too many runs beforeidentifying the root cause, and so increase the latency of rootcause diagnosis.
Based on previous observations that root causes of mostbugs are close to the failure locations [53, 71, 82], Gist ini-tially enables runtime tracking for a small number of state-ments (σ = 2 in our experiments) backward from the fail-ure point. We use this heuristic because even a simple con-currency bug is likely to be caused by two statements fromdifferent threads. This also allows Gist to avoid excessiveruntime tracking if the root cause is close to the failure (i.e.,the common case). Nonetheless, to reduce the latency of rootcause diagnosis, Gist employs a multiplicative increase strat-egy for further tracking the slice in other production runs.More specifically, Gist doubles σ for subsequent AsT iter-ations, until a developer decides that the failure sketch con-tains the root cause and instructs Gist to stop AsT.
Consider the static slice for a hypothetical program inFig. 3.(a), which displays the failure point (bottom-mostsolid line) and the root cause (dashed line). In the first itera-tion (Fig. 3.(b)), AsT starts tracking σ1 = 2 statements backfrom the failure location. Gist cannot build a failure sketchthat contains the root cause of this failure by tracking 2 state-ments, as the root cause lies further backwards in the slice.Therefore, in the second and third iterations (Fig. 3.(c-d)),AsT tracks σ2 = 4 and σ3 = 8 statements, respectively. Gistcan build a failure sketch by tracking 8 statements.
In summary, AsT is a heuristic to resolve the tension be-tween performance overhead, root cause diagnosis latency,and failure sketch accuracy. We elaborate on this tension inour evaluation (§5). AsT does not limit Gist’s ability to tracklarger slices and build failure sketches for bugs with greaterroot-cause-to-failure distances, although it may increase thelatency of root cause diagnosis.
3.2.2 Tracking Control Flow In Hardware
Gist tracks control flow to increase the accuracy of failuresketches by identifying which statements from the slice getexecuted during the monitored production runs. Static slic-ing lacks real execution information such as dynamicallycomputed call targets, therefore tracking the dynamic con-trol flow is necessary for high accuracy failure sketches.

Static slicing and control flow tracking jointly improvethe accuracy of failure sketches: control flow traces iden-tify statements that get executed during production runs thatGist monitors, whereas static slicing identifies statementsthat have a control or data dependency to the failure. The in-tersection of these statements represents the statements thatrelate to the failure and that actually get executed in produc-tion runs. Gist statically determines the locations where con-trol flow tracking should start and stop at runtime in order toidentify which statements from the slice get executed.
Although control flow can be tracked in a relativelystraightforward manner using software instrumentation [40],hardware facilities offer an opportunity for a design withlower overhead. Our design employs Intel PT, a set of newhardware monitoring features for debugging. In particular,Intel PT records the execution flow of a program and outputsa highly-compressed trace (~0.5 bits per retired assemblyinstruction) that describes the outcome of all branches ex-ecuted by a program. Intel PT can be programmed to traceonly user-level code and can be restricted to certain addressspaces. Additionally, with the appropriate software support,Intel PT can be turned on and off by writing to processor-specific registers. Intel PT is currently available in Broad-well processors, and we control it using our custom kerneldriver (§4). Future families of Intel processors are also ex-pected to provide Intel PT functionality.
We explain how Gist tracks the statements that get ex-ecuted via control flow tracking using the example shownin Fig. 4.(a). The example shows a static slice composed ofthree statements (stmt1, stmt2, stmt3). The failure point isstmt3. Let us assume that, as part of AsT, Gist tracks thesethree statements. At the high level, Gist identifies all en-try points and exit points to each statement and starts andstops control-flow tracking at each entry point and at eachexit point, respectively. Tracing is started to capture controlflow if the statements in the static slice get executed, and isstopped once those statements complete execution. We usepostdominator analysis to optimize out unnecessary track-ing.
In this example, Gist starts its analysis with stmt1. Gistconverts the branch decision information to statement exe-cution information using the technique shown in box I inFig. 4.(a). It first determines bb1, the basic block in whichstmt1 resides, and determines the predecessor basic blocksp11...p1n of bb1. The predecessor basic blocks of bb1 areblocks from which control can flow to bb1 via branches. Asa result, Gist starts control flow tracking in each predecessorbasic block p11...p1n (i.e., entry points). If Gist’s control flowtracking determines at runtime that any of the branches fromthese predecessor blocks to bb1 was taken, Gist deduces thatstmt1 was executed.
Gist uses an optimization when a statement it alreadyprocessed strictly dominates the next statement in the staticslice. A statement d strictly dominates a statement n (written
(a)
stmt1
p11
p1n
..........
bb1
stmt2
stmt2
Static Slice
stmt3
I
II
III
ipdom2
startstart
stop
sdom
stmt3
ipdom3
stop
stmt1
(b)
p31
p3n
..........
bb3
startstartI
stmt2
stmt3
Static Slice
read(x)
stmt2
idom2
insertWatchpoint(&x)
Figure 4: Example of control (a) and data (b) flow track-
ing in Gist. Solid horizontal lines are program state-
ments, circles are basic blocks.
d sdom n) if every path from the entry node of the controlflow graph to n goes through d, and d 6= n. In our example,stmt1 sdom stmt2, therefore, Gist will have already startedcontrol flow tracking for stmt1 when the execution reachesstmt2, and so it won’t need special handling to start controlflow tracking for stmt2.
However, if a statement that Gist processed does notstrictly dominate the next statement in the slice, Gist stopscontrol flow tracking. In our example, after executing stmt2,since the execution may never reach stmt3, Gist stops controlflow tracking after stmt2 gets executed. Otherwise trackingcould continue indefinitely and impose unnecessary over-head. Intuitively, Gist stops control flow tracking right after
stmt2 gets executed as shown in box II of Fig. 4.(a). Moreprecisely, Gist stops control flow tracking after stmt2 andbefore stmt2’s immediate postdominator. A node p is saidto strictly postdominate a node n if all the paths from n tothe exit node of the control flow graph pass through p, andn 6= p. The immediate postdominator of a node n (ipdom(n))is a unique node that strictly postdominates n and does notstrictly postdominate any other strict postdominators of n.
Finally, as shown in box III in Fig. 4.(a), Gist processesstmt3 using the combination of techniques it used for stmt1and stmt2. Because control flow tracking was stopped afterstmt2, Gist first restarts it at each predecessor basic blockp31...p3n of the basic block bb3 that contains stmt3, then Giststops it after the execution of stmt3.
3.2.3 Tracking Data Flow in Hardware
Similar to control flow, data flow can also be tracked insoftware, however this can be prohibitively expensive [67].Existing hardware support can be used for low overhead dataflow tracking. In this section, we describe why and how Gisttracks data flow.
Determining the data flow in a program increases theaccuracy of failure sketches in two ways:
First, Gist tracks the total order of memory accesses that itmonitors to increase the accuracy of the control flow shownin the failure sketch. Tracking the total order is important
mainly for shared memory accesses from different threads,for which Intel PT does not provide order information. Gistuses this order information in failure sketches to help devel-opers reason about concurrency bugs.
Second, while tracking data flow, Gist discovers state-ments that access the data items in the monitored portionof the slice that were missing from that portion of the slice.Such statements exist because Gist’s static slicing does notuse alias analysis (due to alias analysis’ inaccuracy) for de-termining all statements that can access a given data item.
Gist uses hardware watchpoints present in modern pro-cessors to track the data flow (e.g., x86 has 4 hardwarewatchpoints [22]). They enable tracking the values writtento and read from memory locations with low runtime over-head.
For a given memory access, Gist inserts a hardwarewatchpoint for the address of the accessed variable at apoint right before the access instruction. More precisely,the inserted hardware watchpoint must be located before theaccess and after the immediate dominator of that access.Fig. 4.(b) shows an example, where Gist places a hardwarewatchpoint for the address of variable x, just before stmt2(read(x)).
Gist employs several optimizations to economically useits budget of limited hardware watchpoints when trackingthe data flow. First, Gist only tracks accesses to shared vari-ables, it does not place a hardware watchpoint for the vari-ables allocated on the stack. Gist maintains a set of activehardware watchpoints to make sure to not place a secondhardware watchpoint at an address that it is already watch-ing.
If the statements in the slice portion that AsT monitorsaccess more memory locations than the available hardwarewatchpoints on a user machine, Gist uses a cooperative ap-proach to track the memory locations across multiple pro-duction runs. In a nutshell, Gist’s collaborative approach in-structs different production runs to monitor different sets ofmemory locations in order to monitor all the memory loca-tions that are in the slice portion that Gist monitors. How-ever, in practice, we did not encounter this situation (§5).
3.3 Identifying the Root Cause
In this section, we describe how Gist determines the differ-ences of key execution properties (i.e., control and data flow)between failing and successful executions in order to do rootcause diagnosis.
For root cause diagnosis, Gist follows a similar approachto cooperative bug isolation [4, 25, 38], which uses statisti-cal methods to correlate failure predictors to failures in pro-grams. A failure predictor is a predicate that, when true, pre-dicts that a failure will occur [37]. Carefully crafted failurepredictors point to failure root causes [38].
Gist-generated failure sketches contain a set of failurepredictors that are both informative and good indicatorsof failures. A failure predictor is informative if it contains
write x
R
W
R
read x
read x
Thread T1
Thread T2
write x
W
W
R
write x
read x
Thread T1
Thread T2
write x
R
W
W
read x
write x
Thread T1
Thread T2
read x
W
R
W
write x
write x
Thread T1
Thread T2
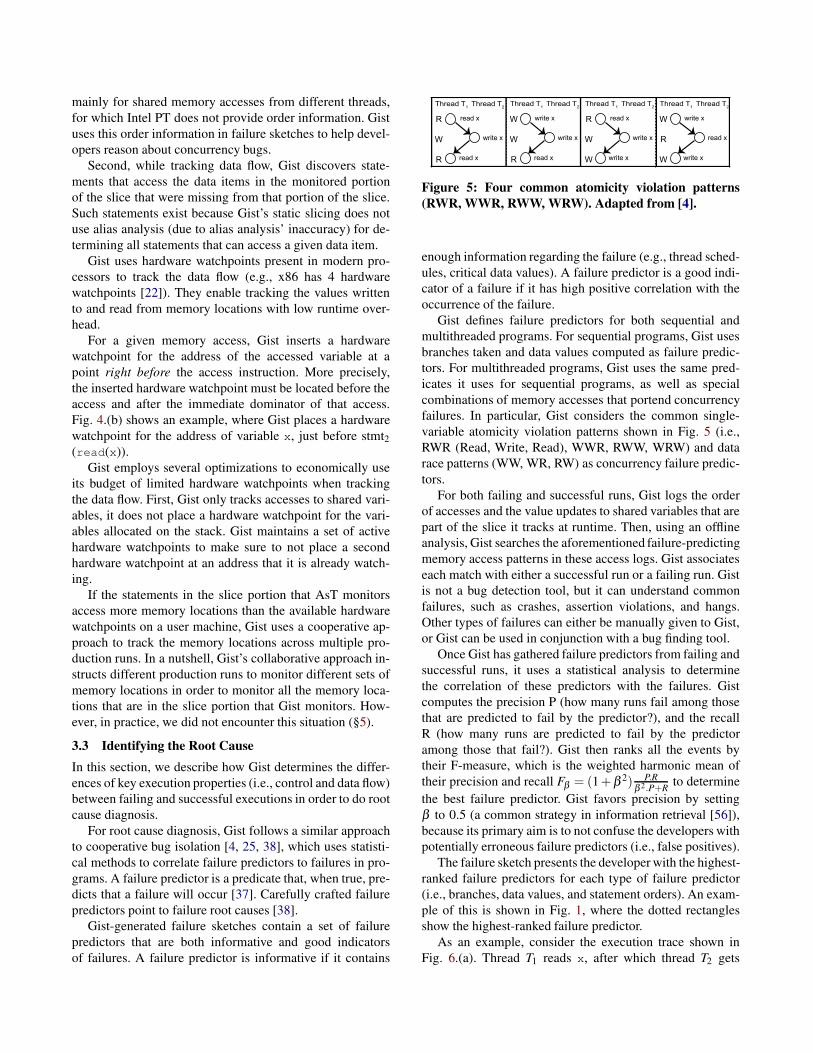
Figure 5: Four common atomicity violation patterns
(RWR, WWR, RWW, WRW). Adapted from [4].
enough information regarding the failure (e.g., thread sched-ules, critical data values). A failure predictor is a good indi-cator of a failure if it has high positive correlation with theoccurrence of the failure.
Gist defines failure predictors for both sequential andmultithreaded programs. For sequential programs, Gist usesbranches taken and data values computed as failure predic-tors. For multithreaded programs, Gist uses the same pred-icates it uses for sequential programs, as well as specialcombinations of memory accesses that portend concurrencyfailures. In particular, Gist considers the common single-variable atomicity violation patterns shown in Fig. 5 (i.e.,RWR (Read, Write, Read), WWR, RWW, WRW) and datarace patterns (WW, WR, RW) as concurrency failure predic-tors.
For both failing and successful runs, Gist logs the orderof accesses and the value updates to shared variables that arepart of the slice it tracks at runtime. Then, using an offlineanalysis, Gist searches the aforementioned failure-predictingmemory access patterns in these access logs. Gist associateseach match with either a successful run or a failing run. Gistis not a bug detection tool, but it can understand commonfailures, such as crashes, assertion violations, and hangs.Other types of failures can either be manually given to Gist,or Gist can be used in conjunction with a bug finding tool.
Once Gist has gathered failure predictors from failing andsuccessful runs, it uses a statistical analysis to determinethe correlation of these predictors with the failures. Gistcomputes the precision P (how many runs fail among thosethat are predicted to fail by the predictor?), and the recallR (how many runs are predicted to fail by the predictoramong those that fail?). Gist then ranks all the events bytheir F-measure, which is the weighted harmonic mean oftheir precision and recall Fβ = (1+β 2) P.R
β 2.P+R
to determinethe best failure predictor. Gist favors precision by settingβ to 0.5 (a common strategy in information retrieval [56]),because its primary aim is to not confuse the developers withpotentially erroneous failure predictors (i.e., false positives).
The failure sketch presents the developer with the highest-ranked failure predictors for each type of failure predictor(i.e., branches, data values, and statement orders). An exam-ple of this is shown in Fig. 1, where the dotted rectanglesshow the highest-ranked failure predictor.
As an example, consider the execution trace shown inFig. 6.(a). Thread T1 reads x, after which thread T2 gets

write x
R
W
R
R
read x
read x (1)
Thread T1
Thread T2
read x (2)
write x
R
W
R
read x
read x (2)
Thread T1
Thread T2
write xW
R read x (1)
Thread T1
Thread T2
(b)
(a)
(c)
write xW
R read x (2)
Thread T1
Thread T2
(d)
Failure
Figure 6: A sample execution failing at the second read
in T1 (a), and three potential concurrency errors: a RWR
atomicity violation (b), 2 WR data races (c-d).
scheduled and writes to x. Then T1 gets scheduled backand reads x twice in a row, and the program fails (e.g., thesecond read could be made as part of an assertion that causesthe failure). This execution trace has three memory accesspatterns that can potentially be involved in a concurrencybug: a RWR atomicity violation in Fig. 6.(b) and two dataraces (or order violations) in Fig. 6.(c) and 6.(d). For thisexecution, Gist logs these patterns and their outcome (i.e.,failure and success: 6.(b) and 6.(d) fail, whereas the patternin 6.c succeeds. Gist keeps track of the outcome of futureaccess patterns and computes their F-measure to identify thehighest ranked failure predictors.
There are two key differences between Gist and coopera-tive bug isolation (CBI). First, Gist tracks all data values thatare part of the slice that it monitors at runtime, allowing it todiagnose the root cause of failures caused by a certain input,as opposed to CBI, which tracks ranges of some variables.Second, Gist uses different failure predictors than CCI [25]and PBI [4], which allow developers to distinguish betweendifferent kinds of concurrency bugs, whereas PBI and CCIuse the same predictors for failures with different root causes(e.g., invalid MESI ([49] state for all of RWR, WWR, RWWatomicity violations)).
4. Implementation
In this section, we describe several implementation detailsof our Gist prototype.
We implemented Gist in 2,673 lines of C++ code forstatic analyses and instrumentation, 664 lines of C code forthe Intel PT kernel driver [34], and 3,165 lines of Pythoncode for the cooperative framework. We also built a 10,518-lines C++ simulator for Intel PT based on PIN [40], andused this simulator to evaluate the overhead of control flowtracking in software.
Gist’s static slicing algorithm is built on the LLVMframework [36]. As part of this algorithm, Gist first aug-ments the intraprocedural control flow graphs of each func-tion with function call and return edges to build the in-terprocedural control flow graph (ICFG) of the program.Then, Gist processes thread creation and join functions (e.g.,pthread_create, pthread_join) to determine whichstart routines the thread creation functions may call at run-
time and where those routines will join back to their callers,using data structure analysis [35]. Gist augments the edgesin the ICFGs of the programs using this information aboutthread creation/join in order to build the thread interproce-dural control flow graph (TICFG) of the program. Gist usesthe LLVM information flow tracker [27] as a starting pointfor its slicing algorithm.
Gist currently inserts a small amount of instrumentationinto the programs it runs, mainly to start/stop Intel PT track-ing and place a hardware watchpoint. To distribute the in-strumentation, Gist uses bsdiff to create a binary patch filethat it ships off to user endpoints or to a data center. We planto investigate more advanced live update systems such asPOLUS [11]. Another alternative is to use binary rewritingframeworks such as DynamoRio [9] or Paradyn [45].
Trace collection is implemented via a Linux kernel mod-ule which we refer to as the Intel PT kernel driver. Thekernel driver configures and controls the hardware usingthe documented MSR (Machine Specific Register) interface.The driver allows filtering of what code is traced using theprivilege level (i.e. kernel vs. user-space) and CR3 values,thus allowing tracing of individual processes. The driveruses a memory buffer sized at 2 MB, which is sufficient tohold traces for all the applications we have tested. Finally,Gist-instrumented programs use an ioctl interface that ourdriver provides to turn tracing on/off.
Gist’s hardware watchpoint use is based on the ptrace
system call. Once Gist sets the desired hardware watch-points, it detaches from the program (using the PTRACE_-DETACH), thereby not incurring any performance overhead.Gist’s instrumentation handles hardware watchpoint triggersatomically in order to maintain a total order of accessesamong memory operations. Gist logs the program counterwhen a hardware watchpoint is hit, which it later translatesinto source line information at developer site. Gist does notneed debug information to do this mapping: it uses the pro-gram counter and the offset at which the program binary isloaded to compute where in the actual program this addresscorresponds to.
5. Evaluation
In this section we aim to answer the following questionsabout Gist and failure sketching: Is Gist capable of automat-ically computing failure sketches (§5.1)? Are these sketchesaccurate (§5.2)? How efficient is the computation of failuresketches in Gist (§5.3)?
To answer these questions we benchmark Gist with sev-eral real world programs: Apache httpd [21] is a popular webserver. Cppcheck [43] is a C/C++ static analysis tool inte-grated with popular development tools such as Visual Stu-dio, Eclipse, and Jenkins. Curl [62] is a data transfer toolfor network protocols such as FTP and HTTP, and it is partof most Linux distributions and many programs, like Libre-Office and CMake. Transmission [66] is the default BitTor-
Bug name /
software
Software
version
Software
size
[LOC]
Bug ID
from
bug
DB
Static slice
size, in source
LOC (LLVM
instructions)
Ideal failure
sketch size, in
source LOC
(LLVM instrs)
Gist-computed
sketch size, in
source LOC
(LLVM instrs)
Duration of failure sketch
computation by Gist:
# failure recurrences
<time> (offline analysis time)
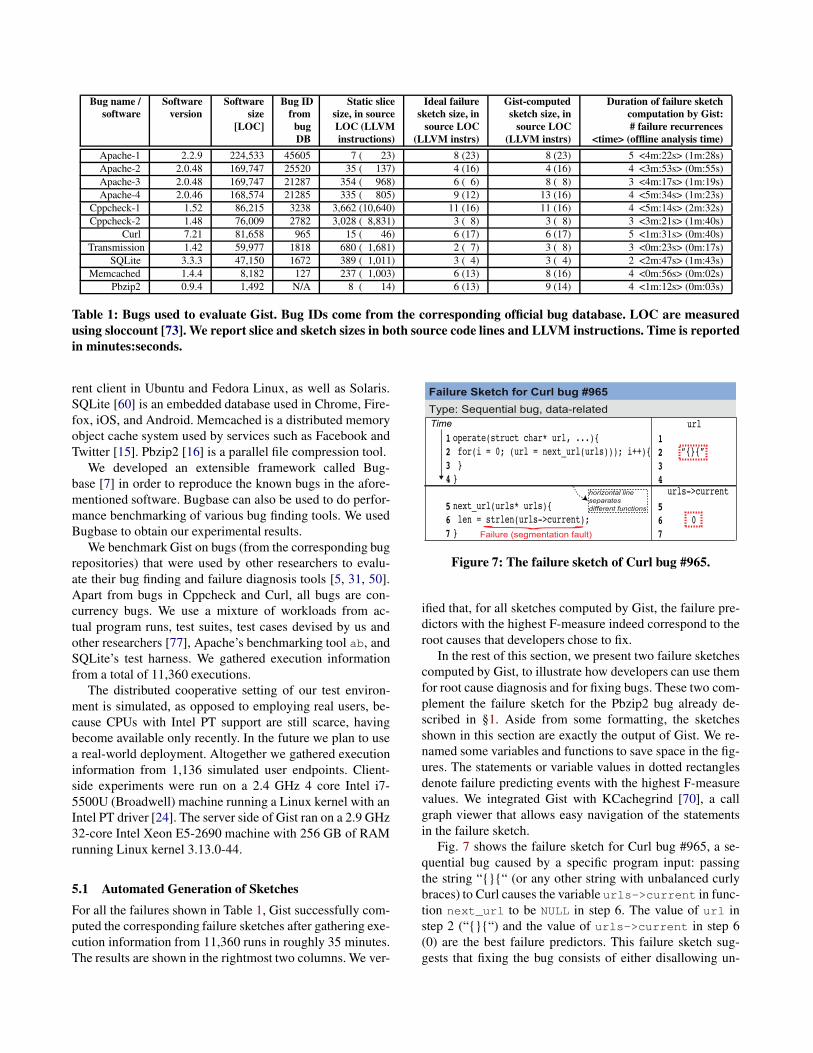
Apache-1 2.2.9 224,533 45605 7 ( 23) 8 (23) 8 (23) 5 <4m:22s> (1m:28s)Apache-2 2.0.48 169,747 25520 35 ( 137) 4 (16) 4 (16) 4 <3m:53s> (0m:55s)Apache-3 2.0.48 169,747 21287 354 ( 968) 6 ( 6) 8 ( 8) 3 <4m:17s> (1m:19s)Apache-4 2.0.46 168,574 21285 335 ( 805) 9 (12) 13 (16) 4 <5m:34s> (1m:23s)
Cppcheck-1 1.52 86,215 3238 3,662 (10,640) 11 (16) 11 (16) 4 <5m:14s> (2m:32s)Cppcheck-2 1.48 76,009 2782 3,028 ( 8,831) 3 ( 8) 3 ( 8) 3 <3m:21s> (1m:40s)
Curl 7.21 81,658 965 15 ( 46) 6 (17) 6 (17) 5 <1m:31s> (0m:40s)Transmission 1.42 59,977 1818 680 ( 1,681) 2 ( 7) 3 ( 8) 3 <0m:23s> (0m:17s)
SQLite 3.3.3 47,150 1672 389 ( 1,011) 3 ( 4) 3 ( 4) 2 <2m:47s> (1m:43s)Memcached 1.4.4 8,182 127 237 ( 1,003) 6 (13) 8 (16) 4 <0m:56s> (0m:02s)
Pbzip2 0.9.4 1,492 N/A 8 ( 14) 6 (13) 9 (14) 4 <1m:12s> (0m:03s)
Table 1: Bugs used to evaluate Gist. Bug IDs come from the corresponding official bug database. LOC are measured
using sloccount [73]. We report slice and sketch sizes in both source code lines and LLVM instructions. Time is reported
in minutes:seconds.
rent client in Ubuntu and Fedora Linux, as well as Solaris.SQLite [60] is an embedded database used in Chrome, Fire-fox, iOS, and Android. Memcached is a distributed memoryobject cache system used by services such as Facebook andTwitter [15]. Pbzip2 [16] is a parallel file compression tool.
We developed an extensible framework called Bug-base [7] in order to reproduce the known bugs in the afore-mentioned software. Bugbase can also be used to do perfor-mance benchmarking of various bug finding tools. We usedBugbase to obtain our experimental results.
We benchmark Gist on bugs (from the corresponding bugrepositories) that were used by other researchers to evalu-ate their bug finding and failure diagnosis tools [5, 31, 50].Apart from bugs in Cppcheck and Curl, all bugs are con-currency bugs. We use a mixture of workloads from ac-tual program runs, test suites, test cases devised by us andother researchers [77], Apache’s benchmarking tool ab, andSQLite’s test harness. We gathered execution informationfrom a total of 11,360 executions.
The distributed cooperative setting of our test environ-ment is simulated, as opposed to employing real users, be-cause CPUs with Intel PT support are still scarce, havingbecome available only recently. In the future we plan to usea real-world deployment. Altogether we gathered executioninformation from 1,136 simulated user endpoints. Client-side experiments were run on a 2.4 GHz 4 core Intel i7-5500U (Broadwell) machine running a Linux kernel with anIntel PT driver [24]. The server side of Gist ran on a 2.9 GHz32-core Intel Xeon E5-2690 machine with 256 GB of RAMrunning Linux kernel 3.13.0-44.
5.1 Automated Generation of Sketches
For all the failures shown in Table 1, Gist successfully com-puted the corresponding failure sketches after gathering exe-cution information from 11,360 runs in roughly 35 minutes.The results are shown in the rightmost two columns. We ver-
operate(struct char* url, ...){
for(i = 0; (url = next_url(urls))); i++){
}
}
next_url(urls* urls){
len = strlen(urls->current);
}
Time
1
2
3
4
5
6
7
Failure Sketch for Curl bug #965
Type: Sequential bug, data-related
url
1
2
3
4
5
6
7
horizontal line
separates
different functions
urls->current
Failure (segmentation fault)
0
“{}{”
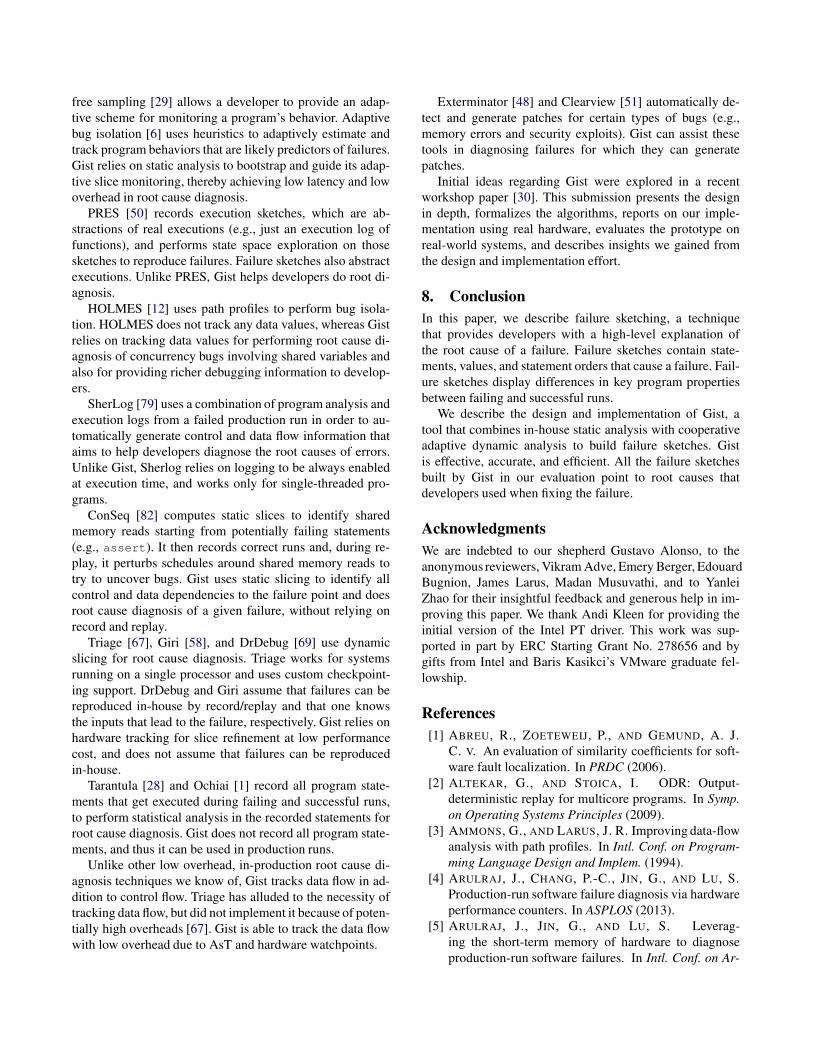
{Figure 7: The failure sketch of Curl bug #965.
ified that, for all sketches computed by Gist, the failure pre-dictors with the highest F-measure indeed correspond to theroot causes that developers chose to fix.
In the rest of this section, we present two failure sketchescomputed by Gist, to illustrate how developers can use themfor root cause diagnosis and for fixing bugs. These two com-plement the failure sketch for the Pbzip2 bug already de-scribed in §1. Aside from some formatting, the sketchesshown in this section are exactly the output of Gist. We re-named some variables and functions to save space in the fig-ures. The statements or variable values in dotted rectanglesdenote failure predicting events with the highest F-measurevalues. We integrated Gist with KCachegrind [70], a callgraph viewer that allows easy navigation of the statementsin the failure sketch.
Fig. 7 shows the failure sketch for Curl bug #965, a se-quential bug caused by a specific program input: passingthe string “{}{“ (or any other string with unbalanced curlybraces) to Curl causes the variable urls->current in func-tion next_url to be NULL in step 6. The value of url instep 2 (“{}{“) and the value of urls->current in step 6(0) are the best failure predictors. This failure sketch sug-gests that fixing the bug consists of either disallowing un-

decrement_refcount(obj){
if (!obj->complete) {
object_t *mobj = ...
dec(&obj->refcnt);
if (!obj->refcnt) {
free(obj);
}
Time Thread T1Thread T2
1
2
3
4
5
6
7
8
9
decrement_refcount(obj){
if (!obj->complete) {
object_t *mobj = ...
dec(&obj->refcnt);
if (!obj->refcnt) {
free(obj);
}
}
1
2
3
4
5
6
7
8
9{
Failure (double free)
Failure Sketch for Apache bug #21287
Type: Concurrency bug, double-free
obj->refcnt
1
0
1
2
3
4
5
6
7
8
9
Figure 8: The failure sketch of Apache bug #21287. The
grayed-out components are not part of the ideal failure
sketch, but they appear in the sketch that Gist automati-
cally computes.
balanced parentheses in the input url, or not calling strlen
when urls->current is NULL. Developers chose the for-mer solution to fix this bug [61].
Fig. 8 shows the failure sketch for Apache bug 21287, aconcurrency bug causing a double free. The failure sketchshows two threads executing the decrement_refcount
function with the same obj value. The dec function decre-ments obj->refcount. The call to dec, the if condi-tion checking, namely !obj->refcount, and the call tofree are not atomic, and this can cause a double free ifobj->refcount is 0 in step 6 in T2 and step 8 in T1. Thevalues of obj->refcount in steps 4 and 5 (1 and 0 respec-tively), and the double call to free(obj) are the best fail-ure predictors. Developers fixed this bug by ensuring that thedecrement-check-free triplet is executed atomically [63].
The grayed-out statements in the failure sketch in Fig. 8are not part of the ideal failure sketch. The adaptive slicetracking part of Gist tracks them during slice refinement, be-cause Gist does not know the statements in the ideal failuresketch a priori. For the Curl bug in Fig. 7, we do not showany grayed-out statements, because, adaptive slice trackinghappens to track only the statements that are in the ideal fail-ure sketch.
5.2 Failure Sketch Accuracy
In this section, we measure the accuracy (A) of failuresketches computed by Gist (ΦG), as compared to ideal fail-ure sketches that we computed by hand (ΦI), according toour ideal failure sketch definition (§3.2). We define two com-ponents of failure sketch accuracy:
1) Relevance measures the extent to which a failuresketch contains all the statements from the ideal sketch andno other statements. We define relevance as the ratio of thenumber of LLVM instructions in ΦG ∩ ΦI to the number ofstatements in ΦG ∪ ΦI . We compute relevance accuracy asa percentage, and define it as AR = 100 · |ΦG∩ΦI |
|ΦG∪ΦI |
Apache-1
Apache-2
Apache-3
Apache-4
Cppcheck-1
Cppcheck-2
Curl
Transmission
SQLite
Memcached
Pbzip20
20
40
60
80
100
Accuracy (%)
Relevance accuracy Ordering accuracy
Figure 9: Accuracy of Gist, broken down into relevance
accuracy and ordering accuracy.
2) Ordering measures the extent to which a failure sketchcorrectly represents the partial order of LLVM memory ac-cess instructions in the ideal sketch. To measure the similar-ity in ordering between the Gist-computed failure sketchesand their ideal counterparts, we use the normalized Kendalltau distance [33] τ , which measures the number of pairwisedisagreements between two ordered lists. For example, forordered lists <A, B, C> and <A, C, B>, the pairs (A, B) and(A, C) have the same ordering, whereas the pair (B, C) hasdifferent orderings in the two lists, hence τ = 1. We com-pute the ordering accuracy as a percentage defined by AO =
100 · (1− τ(ΦG,ΦI)# of pairs in ΦG∩ΦI
). Note that # of pairs in ΦG ∩ΦI
can’t be zero, because both failure sketches will at least con-tain the failing instruction as a common instruction.
We define overall accuracy as A = AR+AO2 , which equally
favors AO and AR. Of course, different developers may havedifferent subjective opinions on which one matters most.
We show Gist’s accuracy results in Fig. 9. Average rele-vance accuracy is 92%, average ordering accuracy is 100%,and average overall accuracy is 96%, which leads us to con-clude that Gist can compute failure sketches with high accu-racy. The accuracy results are deterministic from one run tothe next.
Note that, for all cases when relevance accuracy is below100%, it is because Gist’s failure sketches have (relativeto the ideal sketches) some excess statements in the formof a prefix to the ideal failure sketch, as shown in grayin Fig. 8. We believe that developers find it significantlyeasier to visually discard excess statements clustered as aprefix than excess statements that are sprinkled throughoutthe failure sketch, so this inaccuracy is actually not of greatconsequence.
We show in Fig. 10 the contribution of Gist’s three analy-sis and tracking techniques to overall sketch accuracy. To ob-tain these measurements, we first measured accuracy whenusing just static slicing, then enabled control flow trackingand re-measured, and finally enabled also data flow trackingand re-measured. While the accuracy results are consistentacross runs, the individual contributions may vary if, for ex-

Apache-1
Apache-2
Apache-3
Apache-4
Cppcheck-1
Cppcheck-2
Curl
Transmission
SQLite
Memcached
Pbzip20
20
40
60
80
100
Accuracy (%)
Data flow tracking Control flow tracking Static slicing
Figure 10: Contribution of various techniques to Gist’s
accuracy.
ample, workload non-determinism causes different paths tobe exercised through the program.
A small contribution of a particular technique does notnecessarily mean that it does not perform well for a givenprogram, but it means that the other techniques that Gisthad enabled prior to this technique “stole its thunder” bybeing sufficient to provide high accuracy. For example, inthe case of Apache-1, static analysis performs well enoughthat control flow tracking does not need to further refine theslice. However, in some cases (e.g., for SQLite), trackingthe inter-thread execution order of statements that accessshared variables using hardware watchpoints is crucial forachieving high accuracy.
We observe that the amount of individual contributionvaries substantially from one program to the next, whichmeans that neither of these techniques would achieve highaccuracy for all programs on its own, and so they are allnecessary if we want high accuracy across a broad spectrumof software.
5.3 Efficiency
Now we turn our attention to the efficiency of Gist: how longdoes it take to compute a failure sketch, how much runtimeperformance overhead does it impose on clients, and howlong does it take to perform its offline static analysis. We alsolook at how these measures vary with different parameters.
The last column of Table 1 shows Gist’s failure sketchcomputation latency broken down into three components.We show the number of failure recurrences required to reachthe best sketch that Gist can compute, and this number variesfrom 2 to 5 recurrences. We then show the total time it tookin our simulated environment to find this sketch; this timeis always less than 6 minutes, varying from <0m:23s> to<5m:34s>. Not surprisingly, this time is dominated by howlong it takes the target failure to recur, and in practice thisdepends on the number of deployed clients and the variabil-ity of execution circumstances. Nevertheless, we present thevalues for our simulated setup to give an idea as to how longit took to build a failure sketch for each bug in our evaluation.Finally, in parentheses we show Gist’s offline analysis time,
2 4 6 8 10 12 14 16 18 20 22
Slice size (in # of LLVM instructions)
2.02.53.03.54.04.55.0
Perform
ance
overh
ead (%
)
Figure 11: Gist’s average runtime performance overhead
across all runs as a function of tracked slice size.
which consists of computing the static slice plus generatinginstrumentation patches. This time is always less than 3 min-utes, varying between <0m:2s> and <2m:32s>. We thereforeconclude that, compared to the debugging latencies expe-rienced by developers today, Gist’s automated approach toroot cause diagnosis presents a significant advantage.
In the context of adaptive slice tracking, the overheadincurred on the client side increases monotonically with thesize of the tracked slice, which is not surprising. Fig. 11confirms this experimentally. The portion of the overheadcurve between the slice sizes 16 and 22 is relatively flatcompared to the rest of the curve. This is because, withinthat interval, Gist only tracks a few control flow events forApache-1 and Curl (these programs have no additional dataflow elements in that interval), which introduces negligibleoverhead.
The majority of the overhead incurred on the client sidestems from control flow tracking. In particular, the overheadof control flow tracking varies from a low of 2.01% to a highof 3.43%, whereas the overhead of data flow tracking variesfrom a low of 0.87% to a high of 1.04%.
1 3 5 7 9 11 13 15 17 19 21 23 25 27 29 31 33Initial slice size σ (# of LLVM instructions)
1.0
1.5
2.0
2.5
3.0
3.5
4.0
Avera
ge late
ncy
(in #
of fa
ilure
recu
rrence
s)
60
65
70
75
80
85
90
95
100
Avera
ge a
ccura
cy [%
]
Latency
Average accuracy
Figure 12: Tradeoff between slice size and the resulting
accuracy and latency. Accuracy is in percentage, latency
is in the number of failure recurrences.
What is perhaps not immediately obvious is the trade-off between initial slice size σ and the resulting accuracyand latency. In Fig. 12, we show the average failure sketchaccuracy across all programs we measured (right y-axis) andGist’s latency in # of recurrences (left y-axis) as a functionof σ that Gist starts with (x-axis). As long as the initialslice size is less than the one for the best sketch that Gistcan find, Gist’s adaptive approach is capable of guiding thedeveloper to the highest accuracy sketch. Of course, the timeit takes to find the sketch is longer the smaller the starting

Cppch
eck
-2
Cppch
eck
-1
Pbzi
p2
Apach
e-1
Apach
e-3
Apach
e-2
Apach
e-4
Mem
cach
ed
Curl
Transm
issi
on
SQ
Lite
0
100
200
300
400
500
600
Rela
tive p
erf
orm
ance
overh
ead
[% M
ozi
lla r
r /
% Inte
l PT]
1011
108
11158
1,440
17
1,002
8
1,061
8
8383
5,286
2
2,643
1,048
0.05
20,960
50.0
∞
110.0
∞
Figure 13: Comparison of the full tracing overheads of
Mozilla rr and Intel PT.
slice size is, because the necessary # of recurrences is higher.There is thus an incentive to start with a larger slice size.Unfortunately, if this size overshoots the size of the highestaccuracy sketch, then the accuracy of the outcome suffers,because the larger slice includes extraneous elements.
As we mentioned in §5.2, the extraneous statements thatcan lower Gist’s accuracy are clustered as a prefix to theideal failure sketch, allowing developers to easily ignorethem. Therefore, if lower root cause diagnosis latency isparamount to the developers, they are comfortable ignoringthe prefix of extraneous statements, and they can toleratethe slight increase in Gist’s overhead, it is reasonable toconfigure Gist to start with a large σ (e.g., σ = 23 achievesa latency of one failure recurrence for all our benchmarks).
For the benchmarks in our evaluation, starting AsT atσ = 4 would achieve the highest average accuracy at thelowest average latency of 3, with an average overhead of3.98%.
Finally, Fig. 13 compares Intel PT, the hardware-basedcontrol flow tracking mechanism we use in Gist, to Mozillarr, a software-based state-of-the-art record & replay sys-tem. In particular, we compare the performance overheadimposed by the two tracking mechanisms on the client ap-plication. The two extremes are Cppcheck, where Mozillarr is on par with Intel PT, and Transmission and SQLite,where Mozilla rr’s overhead is over many orders of magni-tude higher than Intel PT’s 2. For the benchmarks in our eval-uation, full tracing using Intel PT incurs an average overheadof 11%, whereas full program record & replay incurs an av-erage runtime overhead of 984%. Unlike Intel PT, Mozillarr also gathers data flow information, but with Gist we haveshown that full program tracing is not necessary for automat-ing root cause diagnosis.
In conclusion, our empirical evaluation shows that Gist,a failure sketching prototype, is capable of automaticallycomputing failure sketches for failures caused by real bugs
2 Full tracing overheads of Transmission and SQLite are too low to be reli-ably measured for Intel PT, thus they are shown as 0%, and the correspond-ing Mozilla rr/Intel PT overheads for these systems are shown as ∞.
in real systems (§5.1), these sketches have a high accuracyof 96% on average (§5.2), and the average performanceoverhead of failure sketching is 3.74% with σ = 2 (§5.3).We therefore believe failure sketching to be a promisingapproach for helping developers debug elusive bugs thatoccur only in production.
6. Discussion and Limitations
In this section, we discuss Gist’s limitations, some remainingopen questions and future work.
Intel PT is a mechanism we used in our failure sketch-ing prototype Gist. It is instrumental for achieving low over-head control flow tracking, and therefore is important forbuilding a practical tool. However, failure sketching is com-pletely independent from Intel PT; it can be entirely imple-mented using software instrumentation, although our experi-ments using our Intel PT software simulator yielded runtimeperformance overheads that range from 3× to 5,000×. Fur-thermore, failure sketching’s novelty is in combining heavystatic program analysis with lightweight runtime monitoringto help developers perform root cause diagnosis.
Intel PT has certain shortcomings that Gist compensatesusing a combination of other mechanisms. First, Intel PTtraces are partially ordered per CPU core, whereas diagnos-ing the root cause of most concurrency bugs requires havinga control flow trace that is totally ordered across the CPUcores. Second, Intel PT only traces control flow, and doesnot contain any data values. Gist addresses these first twochallenges using hardware watchpoints. The third challengeis that Intel PT may trace statements that do not necessarilypertain to the failure, which Gist mitigates by using staticanalysis. Finally, Intel PT’s tracing overhead can be pro-hibitive if it is left always on, which Gist manages using acombination of static analysis and adaptive slice tracking.
Full control flow tracking using Intel PT will have evenlower runtime overheads in future generations of Intel pro-cessors [8] after Broadwell. Therefore, in the near future, it isconceivable to have Intel PT tracing always on for some ap-plications. Regardless, Gist can be used to further reduce theoverhead to unnoticeable levels, and reducing the amount ofcollected information is especially useful for highly concur-rent software, where the trace volume will be larger. Further-more, the combination of static analysis and adaptive slicetracking is necessary to utilize the scarce number of hard-ware watchpoints judiciously. Regardless of performanceimprovements, Gist will remain useful for producing con-cise failure sketches.
We argue that additional hardware support would im-prove Gist’s performance even further. For example, if IntelProcessor Trace also captured a trace of the data addressesand values along with the control-flow, we could eliminatethe need for hardware watchpoints and the complexity of acooperative approach.

Unlike some other root cause diagnosis approaches [37,58], Gist does not track predicates on data values such asranges and inequalities, but it simply tracks data valuesthemselves. As future work, we plan to track range and in-equality predicates in Gist to provide richer information ondata values.
A cooperative framework like Gist can have privacy im-plications depending on its exact deployment setup. If Gisttargets a data center setting, there are fewer privacy con-cerns, as generally all the data that programs operate on isalready within the data center. We plan to investigate waysto quantify and anonymize [64] the amount of informationGist ships from production runs at user endpoints to Gist’sserver.
Using ptrace for placing hardware watchpoints has chal-lenges and limitations with respect to performance and us-ability. With regards to performance, using ptrace to placea hardware watchpoint incurs the overhead of the ptrace
system call. In the future, this overhead can be mitigated us-ing a user space instruction (similar to RDTSC [22]). Withregards to usability, if a program is already using ptrace, Gistcannot attach to it using ptrace to place the hardware watch-points necessary for data flow tracking. This situation can beremedied using several strategies. One option is to augmentthe existing ptrace functionality in the program to supportthe placement of hardware watchpoints. Another strategy isto use a third party interface (e.g., a new syscall or an ioctl)to place the hardware watchpoints.
Gist does not track variables that are allocated on thestack. It is technically possible for a thread to allocate mem-ory on the stack and communicate the address of this mem-ory to other threads, which can then use this address to sharedata. However, sharing stack addresses can make small pro-gramming errors catastrophic and difficult to isolate [10].
Debugging using failure sketches is strictly complemen-tary to existing debugging techniques. In particular, we ar-gue that failure sketches always help the debugging effort ofdevelopers. Failure sketches can also augment existing bugfixing techniques. For example, developers can use failuresketches to help tools like CFix [26] automatically synthe-size fixes for concurrency bugs.
Finally, as future work, we plan to evaluate the effective-ness and efficiency of Gist in a real-world scenario, either ina data center or at user endpoints.
7. Related Work
In this section, we review a variety of techniques that havebeen developed to date to understand the root causes offailures and to help developers with debugging.
Delta debugging [81] isolates program inputs and vari-able values that cause a failure by systematically narrowingthe state difference between a failing and a successful run.Delta debugging achieves this by repeatedly reproducing thefailing and successful run, and altering variable values. Delta
debugging has also been extended to isolate failure-inducingcontrol flow information [13]. As opposed to delta debug-ging, Gist targets bugs that are hard to reproduce and aimsto build a (potentially imperfect) sketch even with a singlefailing execution. If failures recur at the user endpoint, Gistcan build more accurate sketches.
Gist’s cooperative approach is inspired by work on coop-erative bug isolation techniques such as CBI [38], CCI [25],PBI [4], LBRA/LCRA [5]. Gist builds upon the statisticaltechniques introduced in this line of work. Gist uses dif-ferent failure predicting events for multithreaded code thanthese systems, to allow developers to differentiate betweendifferent types of concurrency bugs. Gist has low overhead,so it is always on and has low root cause diagnosis latency,because it does not rely on sampling like CBI, CCI, PBI. Un-like LCRA, Gist does not rely on a custom hardware exten-sion, but it uses Intel PT, a hardware feature present in com-modity processors. LBRA/LCRA works well for bugs withshort root cause to failure distances, whereas failure sketchsizes are only limited by persistent storage size. Gist usesa different F-measure for failure ranking that favors preci-sion over recall, because it aims to avoid false positives inroot cause diagnosis. LBRA/LCRA preserves the privacy ofusers to some extent, because it does not track the data flowof a program, whereas Gist does not have mechanisms toprotect privacy (although in theory it could), therefore mak-ing Gist more suitable to use cases where privacy is not amajor concern.
Gist is also inspired by Windows Error Reporting (WER)[17], a large-scale cooperative error reporting system oper-ating at Microsoft. After a failure, WER collects snapshotsof memory and processes them using a number of heuristics(e.g., classification based on call stacks and error codes) tocluster reports that likely point to the same bug. WER canuse failure sketches built by Gist to improve its clustering ofbugs, and help developers fix the bugs faster.
Symbiosis [41] uses a technique called differential sched-ule projections that displays the set of data flows andmemory operations that are responsible for a failure in amultithreaded program. Symbiosis profiles a failing pro-gram’s schedule and generates non-failing alternate sched-ules. Symbiosis then determines the data flow differencesbetween the failing schedule and the non-failing schedule inorder to help developers identify root causes of failures. Un-like Symbiosis, Gist does not assume that it has access to afailing program execution that can be reproduced in-house.Furthermore, the statistical analysis in Gist allows root causediagnosis of sequential bugs, whereas Symbiosis is targetedtowards concurrency bugs only.
Previous work explored adaptive monitoring for testingand debugging. SWAT [19] adaptively samples program seg-ments at a rate that is inversely proportional to their execu-tion frequency. RaceTrack [78] adaptively monitors parts ofa program that are more likely to harbor data races. Bias
free sampling [29] allows a developer to provide an adap-tive scheme for monitoring a program’s behavior. Adaptivebug isolation [6] uses heuristics to adaptively estimate andtrack program behaviors that are likely predictors of failures.Gist relies on static analysis to bootstrap and guide its adap-tive slice monitoring, thereby achieving low latency and lowoverhead in root cause diagnosis.
PRES [50] records execution sketches, which are ab-stractions of real executions (e.g., just an execution log offunctions), and performs state space exploration on thosesketches to reproduce failures. Failure sketches also abstractexecutions. Unlike PRES, Gist helps developers do root di-agnosis.
HOLMES [12] uses path profiles to perform bug isola-tion. HOLMES does not track any data values, whereas Gistrelies on tracking data values for performing root cause di-agnosis of concurrency bugs involving shared variables andalso for providing richer debugging information to develop-ers.
SherLog [79] uses a combination of program analysis andexecution logs from a failed production run in order to au-tomatically generate control and data flow information thataims to help developers diagnose the root causes of errors.Unlike Gist, Sherlog relies on logging to be always enabledat execution time, and works only for single-threaded pro-grams.
ConSeq [82] computes static slices to identify sharedmemory reads starting from potentially failing statements(e.g., assert). It then records correct runs and, during re-play, it perturbs schedules around shared memory reads totry to uncover bugs. Gist uses static slicing to identify allcontrol and data dependencies to the failure point and doesroot cause diagnosis of a given failure, without relying onrecord and replay.
Triage [67], Giri [58], and DrDebug [69] use dynamicslicing for root cause diagnosis. Triage works for systemsrunning on a single processor and uses custom checkpoint-ing support. DrDebug and Giri assume that failures can bereproduced in-house by record/replay and that one knowsthe inputs that lead to the failure, respectively. Gist relies onhardware tracking for slice refinement at low performancecost, and does not assume that failures can be reproducedin-house.
Tarantula [28] and Ochiai [1] record all program state-ments that get executed during failing and successful runs,to perform statistical analysis in the recorded statements forroot cause diagnosis. Gist does not record all program state-ments, and thus it can be used in production runs.
Unlike other low overhead, in-production root cause di-agnosis techniques we know of, Gist tracks data flow in ad-dition to control flow. Triage has alluded to the necessity oftracking data flow, but did not implement it because of poten-tially high overheads [67]. Gist is able to track the data flowwith low overhead due to AsT and hardware watchpoints.
Exterminator [48] and Clearview [51] automatically de-tect and generate patches for certain types of bugs (e.g.,memory errors and security exploits). Gist can assist thesetools in diagnosing failures for which they can generatepatches.
Initial ideas regarding Gist were explored in a recentworkshop paper [30]. This submission presents the designin depth, formalizes the algorithms, reports on our imple-mentation using real hardware, evaluates the prototype onreal-world systems, and describes insights we gained fromthe design and implementation effort.
8. Conclusion
In this paper, we describe failure sketching, a techniquethat provides developers with a high-level explanation ofthe root cause of a failure. Failure sketches contain state-ments, values, and statement orders that cause a failure. Fail-ure sketches display differences in key program propertiesbetween failing and successful runs.
We describe the design and implementation of Gist, atool that combines in-house static analysis with cooperativeadaptive dynamic analysis to build failure sketches. Gistis effective, accurate, and efficient. All the failure sketchesbuilt by Gist in our evaluation point to root causes thatdevelopers used when fixing the failure.
Acknowledgments
We are indebted to our shepherd Gustavo Alonso, to theanonymous reviewers, Vikram Adve, Emery Berger, EdouardBugnion, James Larus, Madan Musuvathi, and to YanleiZhao for their insightful feedback and generous help in im-proving this paper. We thank Andi Kleen for providing theinitial version of the Intel PT driver. This work was sup-ported in part by ERC Starting Grant No. 278656 and bygifts from Intel and Baris Kasikci’s VMware graduate fel-lowship.
References
[1] ABREU, R., ZOETEWEIJ, P., AND GEMUND, A. J.C. V. An evaluation of similarity coefficients for soft-ware fault localization. In PRDC (2006).
[2] ALTEKAR, G., AND STOICA, I. ODR: Output-deterministic replay for multicore programs. In Symp.
on Operating Systems Principles (2009).[3] AMMONS, G., AND LARUS, J. R. Improving data-flow
analysis with path profiles. In Intl. Conf. on Program-
ming Language Design and Implem. (1994).[4] ARULRAJ, J., CHANG, P.-C., JIN, G., AND LU, S.
Production-run software failure diagnosis via hardwareperformance counters. In ASPLOS (2013).
[5] ARULRAJ, J., JIN, G., AND LU, S. Leverag-ing the short-term memory of hardware to diagnoseproduction-run software failures. In Intl. Conf. on Ar-

chitectural Support for Programming Languages and
Operating Systems (2014).[6] ARUMUGA NAINAR, P., AND LIBLIT, B. Adaptive
bug isolation. In Intl. Conf. on Software Engineering
(2010).[7] BARIS KASIKCI, BENJAMIN SCHUBERT, G. C. Gist.
http://dslab.epfl.ch/proj/gist/, 2015.[8] BEEMAN STRONG. Debug and fine-grain profiling
with intel processor trace. http://bit.ly/1xMYbIC, 2014.[9] BRUENING, D., GARNETT, T., AND AMARASINGHE,
S. An infrastructure for adaptive dynamic optimization.In CGO (2003).
[10] BUTENHOF, D. R. Programming with POSIX
Threads. Addison-Wesley Longman Publishing Co.,Inc., Boston, MA, USA, 1997.
[11] CHEN, H., YU, J., CHEN, R., ZANG, B., AND YEW,P.-C. Polus: A powerful live updating system. In ICSE
(2007).[12] CHILIMBI, T. M., LIBLIT, B., MEHRA, K., NORI,
A. V., AND VASWANI, K. HOLMES: Effective sta-tistical debugging via efficient path profiling. In Intl.
Conf. on Software Engineering (2009).[13] CHOI, J.-D., AND ZELLER, A. Isolating failure-
inducing thread schedules. In ISSTA (2002).[14] DUNLAP, G. W., LUCCHETTI, D., CHEN, P. M., AND
FETTERMAN, M. Execution replay on multiprocessorvirtual machines. In Intl. Conf. on Virtual Execution
Environments (2008).[15] FITZPATRICK, B. Memcached. http://memcached.org,
2013.[16] GILCHRIST, J. Parallel BZIP2. http://compression.ca/
pbzip2, 2015.[17] GLERUM, K., KINSHUMANN, K., GREENBERG, S.,
AUL, G., ORGOVAN, V., NICHOLS, G., GRANT, D.,LOIHLE, G., AND HUNT, G. Debugging in the (very)large: ten years of implementation and experience. InSymp. on Operating Systems Principles (2009).
[18] GODEFROID, P., AND NAGAPPAN, N. Concurrency atMicrosoft – An exploratory survey. In Intl. Conf. on
Computer Aided Verification (2008).[19] HAUSWIRTH, M., AND CHILIMBI, T. M. Low-
overhead memory leak detection using adaptive statis-tical profiling. In ASPLOS (2004).
[20] HOWER, D. R., AND HILL, M. D. Rerun: Exploitingepisodes for lightweight memory race recording. ISCA.
[21] Apache httpd. http://httpd.apache.org, 2013.[22] INTEL. Intel 64 and IA-32 Architectures Software De-
veloper’s Manual, vol. 2. 2015.[23] INTEL CORPORATION. Intel processor trace.
https://software.intel.com/en-us/blogs/2013/09/18/processor-tracing, 2013.
[24] Linux branch with intel pt support. https://github.com/virtuoso/linux-perf/tree/intel_pt, 2015.
[25] JIN, G., THAKUR, A., LIBLIT, B., AND LU, S. In-strumentation and sampling strategies for cooperativeconcurrency bug isolation. SIGPLAN Not. (2010).
[26] JIN, G., ZHANG, W., DENG, D., LIBLIT, B., AND LU,S. Automated concurrency-bug fixing. In OSDI (2012).
[27] JOHN CRISWELL. The information flow compiler.https://llvm.org/svn/llvm-project/giri/, 2011.
[28] JONES, J. A., AND HARROLD, M. J. Empirical evalu-ation of the tarantula automatic fault-localization tech-nique. In ASE (2005).
[29] KASIKCI, B., BALL, T., CANDEA, G., ERICKSON, J.,AND MUSUVATHI, M. Efficient tracing of cold codevia bias-free sampling. In USENIX Annual Technical
Conf. (2014).[30] KASIKCI, B., PEREIRA, C., POKAM, G., SCHUBERT,
B., MUSUVATHI, M., AND CANDEA, G. Failuresketches: A better way to debug. In Workshop on Hot
Topics in Operating Systems (2015).[31] KASIKCI, B., ZAMFIR, C., AND CANDEA, G. Data
races vs. data race bugs: Telling the difference with Por-tend. In Intl. Conf. on Architectural Support for Pro-
gramming Languages and Operating Systems (2012).[32] KASIKCI, B., ZAMFIR, C., AND CANDEA, G. Race-
Mob: Crowdsourced data race detection. In Symp. on
Operating Systems Principles (2013).[33] KENDALL, M. G. A new measure of rank correlation.
Biometrika (1938).[34] KLEEN, A. simple-pt linux driver. https://github.com/
andikleen/simple-pt, 2015.[35] LATTNER, C. Macroscopic Data Structure Analysis
and Optimization. PhD thesis, University of Illinois atUrbana-Champaign, May 2005.
[36] LATTNER, C., AND ADVE, V. LLVM: A compilationframework for lifelong program analysis and transfor-mation. In Intl. Symp. on Code Generation and Opti-
mization (2004).[37] LIBLIT, B., NAIK, M., ZHENG, A. X., AIKEN, A.,
AND JORDAN, M. I. Scalable statistical bug isolation.In Intl. Conf. on Programming Language Design and
Implem. (2005).[38] LIBLIT, B. R. Cooperative Bug Isolation. PhD thesis,
University of California, Berkeley, Dec. 2004.[39] LU, S., PARK, S., SEO, E., AND ZHOU, Y. Learning
from mistakes – A comprehensive study on real worldconcurrency bug characteristics. In Intl. Conf. on Ar-
chitectural Support for Programming Languages and
Operating Systems (2008).[40] LUK, C.-K., COHN, R., MUTH, R., PATIL, H.,
KLAUSER, A., LOWNEY, G., WALLACE, S., REDDI,V. J., AND HAZELWOOD, K. PIN: building cus-tomized program analysis tools with dynamic instru-mentation. In Intl. Conf. on Programming Language
Design and Implem. (2005).

[41] MACHADO, N., LUCIA, B., AND RODRIGUES, L.Concurrency debugging with differential schedule pro-jections. In PLDI (2015).
[42] MANEVICH, R., SRIDHARAN, M., ADAMS, S., DAS,M., AND YANG, Z. PSE: explaining program failuresvia postmortem static analysis. In Symp. on the Foun-
dations of Software Eng. (2004).[43] MARJAMÃDKI, D. Cppcheck. http://cppcheck.
sourceforge.net/, 2015.[44] MCCONNELL, S. Code Complete. Microsoft Press,
2004.[45] MILLER, B. P., CALLAGHAN, M. D., CARGILLE,
J. M., HOLLINGSWORTH, J. K., IRVIN, R. B.,KARAVANIC, K. L., KUNCHITHAPADAM, K., AND
NEWHALL, T. The paradyn parallel performance mea-surement tool. Computer (1995).
[46] MONTESINOS, P., CEZE, L., AND TORRELLAS, J.Delorean: Recording and deterministically replayingshared-memory multiprocessor execution ef?ciently.ISCA (2008).
[47] MUSUVATHI, M., QADEER, S., BALL, T., BASLER,G., NAINAR, P. A., AND NEAMTIU, I. Finding andreproducing Heisenbugs in concurrent programs. InSymp. on Operating Sys. Design and Implem. (2008).
[48] NOVARK, G., BERGER, E. D., AND ZORN, B. G.Exterminator: Automatically correcting memory errorswith high probability. In Intl. Conf. on Programming
Language Design and Implem. (2007).[49] PAPAMARCOS, M. S., AND PATEL, J. H. A low-
overhead coherence solution for multiprocessors withprivate cache memories. In ISCA (1984).
[50] PARK, S., XIONG, W., YIN, Z., KAUSHIK, R., LEE,K. H., LU, S., AND ZHOU, Y. PRES: Probabilisticreplay with execution sketching on multiprocessors. InSymp. on Operating Systems Principles (2009).
[51] PERKINS, J. H., KIM, S., LARSEN, S., AMARAS-INGHE, S., BACHRACH, J., CARBIN, M., PACHECO,C., SHERWOOD, F., SIDIROGLOU, S., SULLIVAN, G.,WONG, W.-F., ZIBIN, Y., ERNST, M. D., AND RI-NARD, M. Automatically patching errors in deployedsoftware. In Symp. on Operating Sys. Design and Im-
plem. (2010).[52] POKAM, G., PEREIRA, C., HU, S., ADL-TABATABAI,
A.-R., GOTTSCHLICH, J., HA, J., AND WU, Y. Cor-eracer: A practical memory race recorder for multicorex86 tso processors. In Proceedings of the 44th An-
nual IEEE/ACM International Symposium on Microar-
chitecture (2011), MICRO-44, ACM, pp. 216–225.[53] QIN, F., TUCEK, J., ZHOU, Y., AND SUNDARESAN,
J. Rx: Treating bugs as allergies – a safe methodto survive software failures. ACM Transactions on
Computer Systems 25, 3 (2007).[54] QUORA. What is a coder’s worst nightmware? http://
www.quora.com/What-is-a-coders-worst-nightmare.
[55] RASTISLAV BODIK, S. A. Path-sensitive value-flowanalysis. In Symp. on Principles of Programming Lan-
guages (1998).[56] RIJSBERGEN, C. J. V. Information Retrieval.
Butterworth-Heinemann, 1979.[57] SADOWSKI, C., AND YI, J. How developers use data
race detection tools. In Proceedings of the 5th Work-
shop on Evaluation and Usability of Programming Lan-
guages and Tools (2014), PLATEAU.[58] SAHOO, S. K., CRISWELL, J., GEIGLE, C., AND
ADVE, V. Using likely invariants for automated soft-ware fault localization. In Intl. Conf. on Architectural
Support for Programming Languages and Operating
Systems (2013).[59] SLABY, J. Llvm slicer. https://github.com/jirislaby/
LLVMSlicer/, 2014.[60] SQLite. http://www.sqlite.org/, 2013.[61] STENBERG, D. Curl bug 965. http://sourceforge.net/p/
curl/bugs/965/, 2013.[62] STENBERG, D. Curl. http://curl.haxx.se/, 2015.[63] STODDARD, B. Apache bug 21287. https://bz.apache.
org/bugzilla/show_bug.cgi?id=21287, 2003.[64] SWEENEY, L. K-Anonymity: A model for protecting
privacy. In Intl. Journal on Uncertainty, Fuzziness and
Knowledge-based Systems (2002).[65] THE ASSOCIATED PRESS. Northeastern blackout bug.
http://www.securityfocus.com/news/8032, 2004.[66] Transmission. http://www.transmissionbt.com/, 2015.[67] TUCEK, J., LU, S., HUANG, C., XANTHOS, S., AND
ZHOU, Y. Triage: diagnosing production run failuresat the user’s site. In Symp. on Operating Systems Prin-
ciples (2007).[68] VEERARAGHAVAN, K., LEE, D., WESTER, B.,
OUYANG, J., CHEN, P. M., FLINN, J., AND
NARAYANASAMY, S. Doubleplay: Parallelizing se-quential logging and replay. TOCS 30, 1 (2012).
[69] WANG, Y., PATIL, H., PEREIRA, C., LUECK, G.,GUPTA, R., AND NEAMTIU, I. Drdebug: Determinis-tic replay based cyclic debugging with dynamic slicing.In CGO (2014).
[70] WEIDENDORFER, J. Kcachegrind. http://kcachegrind.sourceforge.net/html/Home.html, 2015.
[71] WEINING GU, ZBIGNIEW KALBARCZYK, RAVIS-HANKAR K. IYER, ZHEN-YU YANG. Characterizationof linux kernel behavior under errors, 2003.
[72] WEISER, M. Program slicing. In Intl. Conf. on Soft-
ware Engineering (1981).[73] WHEELER, D. SLOCCount. http://www.dwheeler.
com/sloccount/, 2010.[74] WILSON, P. F., DELL, L. D., AND ANDERSON, G. F.
Root Cause Analysis : A Tool for Total Quality Man-
agement. American Society for Quality, 1993.[75] WU, J., CUI, H., AND YANG, J. Bypassing races in
live applications with execution filters. In Symp. on

Operating Sys. Design and Implem. (2010).[76] XIN, B., SUMNER, W. N., AND ZHANG, X. Efficient
program execution indexing. In Intl. Conf. on Program-
ming Language Design and Implem. (2008).[77] YU, J., AND NARAYANASAMY, S. A case for an inter-
leaving constrained shared-memory multi-processor. InIntl. Symp. on Computer Architecture (2009).
[78] YU, Y., RODEHEFFER, T., AND CHEN, W. Racetrack:Efficient detection of data race conditions via adaptivetracking. In Symp. on Operating Systems Principles
(2005).[79] YUAN, D., MAI, H., XIONG, W., TAN, L., ZHOU,
Y., AND PASUPATHY, S. SherLog: error diagnosis byconnecting clues from run-time logs. In Intl. Conf. on
Architectural Support for Programming Languages and
Operating Systems (2010).[80] ZAMFIR, C., ALTEKAR, G., CANDEA, G., AND STO-
ICA, I. Debug determinism: The sweet spot for replay-based debugging. In Workshop on Hot Topics in Oper-
ating Systems (2011).[81] ZELLER, A., AND HILDEBRANDT, R. Simplifying and
isolating failure-inducing input. IEEE Transactions on
Software Engineering (2002).[82] ZHANG, W., LIM, J., OLICHANDRAN, R., SCHER-
PELZ, J., JIN, G., LU, S., AND REPS, T. ConSeq: De-tecting concurrency bugs through sequential errors. InIntl. Conf. on Architectural Support for Programming
Languages and Operating Systems (2011).