Embed Size (px)
Citation preview
Failure Mechanisms in Sand over a Deep Active TrapdoorYuri D. Costa1; Jorge G. Zornberg, M.ASCE2; Benedito S. Bueno3; and Carina L. Costa4
Abstract: An experimental testing program was undertaken to investigate failure mechanisms induced by the active movement of a deeprectangular trapdoor underlying a granular soil. Reduced-scale models were tested under normal gravity as well as under an increasedgravitational field using a centrifuge facility. Some models were used to evaluate the performance of both flexible and rigid pipesundergoing a localized loss of support. Failure mechanisms in the longitudinal direction of the models were characterized by a single,well-defined failure surface that developed within the limits of the trapdoor. However, failure mechanisms in the transverse direction ofthe models were characterized by multiple failure surfaces extending outside the limits of the trapdoor. Significant dilation of the soillocated immediately above the trapdoor was identified in the failure of the models. The pattern of the failure mechanisms was found tobe affected by the stress level and backfill density. Higher stress levels were found to lead to well-developed failure zones. The influenceof backfill density was found to be more relevant in models involving flexible pipes. Pipes embedded within loose backfill were severelydamaged after loss of support, while pipes embedded in dense backfill experienced negligible deformations. These results indicate thatdamage to pipelines caused by ground loss of support can be significantly minimized by controlling the compaction of the fill.
DOI: 10.1061/�ASCE�GT.1943-5606.0000134
CE Database subject headings: Failures; Arches; Buried pipes; Model tests; Sand, Soil type.
Introduction
The redistribution of stresses within the soil mass, often referredto as arching, has been analyzed using physical and analyticalmodeling of active and passive trapdoor systems �Terzaghi 1936;Koutsabeloulis and Griffiths 1989; Stone and Muir Wood 1992;Ono and Yamada 1993; Santichaianaint 2002�. The movement ofan active trapdoor causes a reduction of soil stresses immediatelyabove the trapdoor and an increase of stresses in the adjacent soilmass. The opposite trend has been observed in a passive trapdoor.The structure geometry, the soil properties, and the ratio betweenthe height of soil cover and the width of the trapdoor �H /B� arethe main variables that govern the trapdoor response.
Although good insight into the arching phenomenon has beenobtained so far, an assessment of previous studies on the activetrapdoor problem indicates that very limited information is avail-able on the three-dimensional aspect of the problem, as most in-vestigations have focused on plane strain and axis-symmetricconditions. While plane strain conditions can be assumed to as-
1Professor, Dept. Civil Engineering, Federal Univ. of Rio Grande doNorte, Campus Universitário, Natal-RN, Brazil 59072-970 �correspond-ing author�. E-mail: [email protected]
2Fluor Centennial Associate Professor, Dept. Civil Engineering, TheUniv. of Texas at Austin, 1 University Station, C1792, Austin, TX 78712-0280. E-mail: [email protected]
3Professor, Dept. of Geotechnical Engineering, Univ. of São Paulo atSão Carlos, Av. Trabalhador São-Carlense, 400, São Carlos-SP, Brazil13566-590. E-mail: [email protected]
4Professor, Federal Institute of Education, Science and Technology ofRio Grande do Norte, Av. Salgado Filho, 1559, Natal–RN, Brazil 59015-000. E-mail: [email protected]
Note. This manuscript was submitted on December 29, 2007; ap-proved on April 22, 2009; published online on April 27, 2009. Discussionperiod open until April 1, 2010; separate discussions must be submittedfor individual papers. This paper is part of the Journal of Geotechnicaland Geoenvironmental Engineering, Vol. 135, No. 11, November 1,
2009. ©ASCE, ISSN 1090-0241/2009/11-1741–1753/$25.00.JOURNAL OF GEOTECHNICAL AND GEOE
sess the performance of some geotechnical structures, this condi-tion is not suitable for many problems, such as buried pipes.
Different responses have been reported for systems under deepand shallow conditions, which are characterized by soil coverratios �H /B� over and below two, respectively �McNulty 1965;Koutsabeloulis and Griffiths 1989; Santichaianaint 2002�. How-ever, the information available on failure mechanisms of trapdoorsystems under deep conditions is very limited. The focus of pre-vious studies on deep active conditions has been mainly on thevariation of the loading over the trapdoor. Other aspects of theproblem, including the analysis of failure mechanisms, have beengenerally overlooked.
The evaluation of buried pipes subjected to ground loss ofsupport is an important application that can be analyzed by deepactive trapdoor modeling under three-dimensional conditions. Thedemand for installation of deep buried pipelines has increasedover the years, particularly in areas related to the oil industry andsolid waste landfills �Yimsiri et al. 2004�. Assessment of thethree-dimensional nature of this problem is required to understandaspects of this problem related to the interaction of buried pipe-lines with the surrounding soil. Mining-related excavations, soilerosion due to pipe leaks, inadequate backfill compaction, and thepresence of karstic soils are among the most usual causes that cantrigger the ground loss of support.
Ground loss under pipelines is a complex soil-structure inter-action problem that involves redistribution of stresses in the pipewall as well as in the surrounding soil. The pipe may experiencehigh circumferential and longitudinal bending moments in thevicinity of the void, which may eventually lead to structural fail-ure. If the pipe is located at relatively high depth, additional prob-lems may result from high thrust stresses that develop at the pipewall �Katona 1988�. In order to adequately address this problem,guidelines for the design of buried pipeline systems undergoinglocalized loss of ground support are needed.
This paper addresses perceived deficiencies by investigatingthe propagation and three-dimensional patterns of failure surfaces
induced by an active, deep trapdoor underlying a granular soilNVIRONMENTAL ENGINEERING © ASCE / NOVEMBER 2009 / 1741

mass. The experimental program involved reduced-scale modelsprepared using dry sand and tested under normal gravity as wellas under an increased gravitational field using a centrifuge facil-ity. Some models involved the use of an aluminum tube restingover the trapdoor in order to evaluate the failure mechanisms ofpipeline subjected to a localized loss of ground support. Emphasisof this study is placed on inspection of the kinematics of theproblem and the effect of governing parameters such as stresslevel, backfill density, and pipe stiffness.
Previous Studies on Failure Mechanisms of ActiveTrapdoor Models
Table 1 summarizes the results from previous studies involvingactive trapdoor model tests in granular material. Only studies thatincluded monitoring of the development of failure patterns withinthe backfill are summarized. Most of the available information isbased on models built with soil cover ratios �H /B� equal to orbelow 2, which is the limit ratio below which an installation canbe classified as shallow �Koutsabeloulis and Griffiths 1989; Sloanet al. 1990�.
Fig. 1 shows a schematic representation of the typical failuremechanism reported in studies involving shallow conditions. Afailure surface OA was typically reported to initiate from the cor-ners of the trapdoor �point O� and to propagate toward the centerof the trapdoor. The path followed by surface OA is defined bythe soil density and its confinement, which are valiables that gov-ern the soil dilatancy. The angle formed between the vertical andthe tangent at any point along surface OA equals the soil dilatancy
Table 1. Results from Previous Studies Involving Active Trapdoors in G
Soil cover ratio�H /B�
Backfill properties
� /Bmax �%� Target g-leveD50 �mm� Dr �%�
1–5 0.44 N.R. 21 1
1.65 0.33 N.R. 17 1
0.55 0.4, 0.85, 1.5 87 6 1, 100
2 0.16 86 2 1
2 0.1 40 17 1, 75
2 0.22 85 14 45
Notes: D50=mean particle size; Dr=relative density; � /Bmax=trapdoor m
Fig. 1. Schematic view of the propagation of failure surfaces due toan active trapdoor under shallow conditions �H /B�2�
1742 / JOURNAL OF GEOTECHNICAL AND GEOENVIRONMENTAL ENGIN
angle ��� that corresponds to that position at the time that thefailure surface developed �Stone and Muir Wood 1992; Santichai-anaint 2002�.
The inclination of surface OA in the vicinity of point O isrepresented by �i−OA, which equals the soil dilatancy angle ��� atO. The failure surface OA propagates until point A once the trap-door reaches a vertical displacement �1 �see Fig. 1�. The failuresurface has an inclination �i−A at this point, which corresponds tothe dilatancy of the soil at A. Since the stress level at A is lowerthan that at O, the dilatancy angle at A is larger than that at O, andthus �i−A��i−OA. The curved shape of the failure surface can beattributed to the effect on dilatancy of the varying overburdenstress with depth.
The shear displacements that take place during development ofthe failure surface bring the soil along the failure zone to criticalstate and, consequently, � decreases from its initial value �i−OA, atthe time of failure surface initiation, to zero for large trapdoordisplacements. Specifically, continued vertical movement of thetrapdoor has been reported to lead to the development of a newfailure surface, shown as surface OB in Fig. 1, which propagatesat an initial angle �i−OB. Since density of the soil in the vicinity ofpoint O has decreased after development of the initial failuresurface, the soil dilatancy decreased and surface OB forms anangle with the vertical that is smaller than that of surface OA �i.e.,�i−OB��i−OA�. The failure surface propagates until point B oncethe trapdoor reaches �2.
Radiographic data from physical models have shown that fail-ure surface propagation switches from one discontinuity to thenext in a relatively sudden manner, with the soil between the twofailure surfaces remaining essentially as a rigid body and playinglittle role on the deformation process �Stone and Muir Wood1992�. Although the soil mass between two failure surfaces can-not be rigorously defined as rigid, this term is adopted herein fordescriptive purposes.
The condition associated to a final trapdoor movement �3 canbe represented by an approximately vertical failure surface,shown as surface OC in Fig. 1. For the final stage involvingrelatively large trapdoor movements, the soil can be assumed tohave achieved critical state conditions, which is consistent with anegligible dilatancy and the development of a vertical failure sur-face.
The patterns of the failure surfaces develop within the soilmass due to an active trapdoor can be more complex than thoseillustrated in Fig. 1. Relevant factors that have been reported toaffect these patterns include the soil density and stress confine-ment, which control the soil volumetric changes during shearing,as well as the soil particle size. A significant depression has beenreported to occur on the ground surface directly above the trap-
r Soil
pdoor geometry Recording technique Reference
rectangular photographic Evans �1983�
rectangular photographic Vardoulakis et al. �1981�
rectangular X-ray Stone and Muir Wood �1992�
rectangular photographic Tanaka and Sakai �1993�
circular photographic Santichaianaint �2002�
rectangular photographic Present study
relative displacement; and N.R.=value not reported.
ranula
l Tra
aximum
door �Stone and Muir Wood 1992; Santichaianaint 2002�.
EERING © ASCE / NOVEMBER 2009

Results from reduced-scale model tests conducted under deepconditions �Evans 1983� revealed failure mechanisms somewhatdifferent from those found by other investigations for shallowconditions. Active trapdoor movements in models built withH /B�3 led to a single failure surface that propagated from thecorners of the trapdoor toward its center. Unlike the results re-ported in shallow model tests, which showed rigid zones of soil,the failure surfaces reported for deep conditions defined a soilzone above the trapdoor with significant dilation.
Active Trapdoor Model Tests
General Characteristics of the Models
Centrifuge modeling can be used to investigate specific phenom-ena, where the soil response is affected by the state of stresses,rather than to investigate the behavior of specific prototype struc-tures. In this case, qualitative and quantitative information is ob-tained experimentally to validate or enhance the theories relatedto the phenomena under evaluation. In this investigation, centri-fuge modeling was used to assess the role of the stress state,among other variables, on the behavior of systems where soilarching plays a significant role.
The models were constructed within a rigid aluminum strong-box with inside dimensions of 419�203 mm in plane and 300mm in height. The strongbox and treatment of side walls are thesame as those reported by Zornberg et al. �1998�. Specifically, thefront wall of the box consisted of a transparent Plexiglass plateused to enable visualization of the models during testing.
The elevation view of the model configuration and trapdoorsetup used in this experimental investigation is shown in Fig.2�a�. The model includes an aluminum false floor with the same
Fig. 2. Model configuration: �a� elevation view showing sand mark-ers; �b� plan view showing position of the transverse sections withinthe backfill
plane dimensions as the strongbox, where an aluminum trapdoor
JOURNAL OF GEOTECHNICAL AND GEOE
fits. Fig. 2�b� presents the plan view of the model configuration,showing an aluminum trapdoor that was located against the Plexi-glass wall and, consequently, it represents the half-section of ahypothetical rectangular trapdoor of length L=85 mm and widthB=35 mm.
The reduced-scale models were tested in the 15-g-ton centri-fuge at the University of Colorado at Boulder. This equipment isa Genisco 1230 rotary accelerator with a nominal radius of 1.36m, and with capability of accelerating a 135-kg payload to anacceleration equivalent to 100 g �Ko 1988�.
In order to achieve a homogeneous soil density, the modelswere prepared by pluviating air-dried sand into the strongbox. A159-mm thick soil layer was used in all reduced models, whichcorresponds to a soil cover ratio H /B of 4.5. Downward verticaldisplacement of the aluminum trapdoor was triggered during test-ing by turning off the power of an electromagnet below the falsefloor. This caused the trapdoor to plunge with a predeterminedvertical displacement �, and creating a void within the soil mass.
The failure mechanism in the longitudinal section of the back-fill against the Plexiglass wall was defined by monitoring thedisplacements of 12 thin layers of colored sand placed horizon-tally within the soil mass �Fig. 2�a��. The colored layers includedtriangular discrete sand markers placed against the Plexiglasswall. This provided information useful to calculate strains withinthe soil mass induced by the trapdoor movement. The modelswere carefully wetted and dissected after testing in order to in-vestigate the failure patterns in selected transverse sections withinthe backfill, identified as Sections S1–S4 in Fig. 2�b�.
The settlement �s� of the soil surface was monitored in-flightafter reaching the target g-level using a linear variable displace-ment transducer �LVDT� mounted on the top of the strongbox,immediately above the trapdoor. The rod of the LVDT was posi-tioned at the center of the model �transverse Section S1�, at adistance from the Plexiglass wall equal to 0.25 B. Some modelswere tested using a second LVDT, also positioned in Section S1,but mounted at a distance of 1.2 B from the Plexiglass wall.
Image Collection and Analysis
Consecutive in-flight images were used to monitor the position ofthe colored sand layers along the transparent wall �y-z plane ofthe models, Fig. 2�a��. After reaching the target g-level, images ofthe transparent wall were collected in flight before and after low-ering the aluminum trapdoor. The images were collected fromcontinuous videotape recording of the model tests.
The photographic method used in this study is based on thatdescribed by Zornberg and Arriaga �2003�. Specifically, the imageacquisition system consisted of a closed circuit camera and avideo recording device. This system provided continuous moni-toring of the models while testing was in progress. The resolutionof the digitized images was 2 ,100�2,800 pixels.
Strains within the soil mass on the plane corresponding to theelevation view of the models �longitudinal section� were calcu-lated from the collected images by tracking the coordinates of thecenter of mass of the sand markers. The sand markers defined thenodes of a mesh of 704 triangular elements that allowed calcula-tion of the soil strains assuming linear transition of displacementin the domain �Fig. 2�a��.
The position of the colored layers in the transverse direction ofthe models �x-z plane� was photographically recorded using im-ages of transverse sections that were collected after completion ofeach test. Four different sections �S1, S2, S3, and S4 in Fig. 2�b��
were used for this purpose.NVIRONMENTAL ENGINEERING © ASCE / NOVEMBER 2009 / 1743

Backfill Properties
All reduced-scale models were prepared using dry Ottawa F-75sand. This is a fine uniformly graded quartz �silica� sand thatclassifies as SP according to the Unified Soil Classification Sys-tem. The sand has an average particle size of 0.22 mm, a coeffi-
Table 2. Summary of Conventional Triaxial Test Results with Ottawa F
Dr �%� 3� �kPa� �p� �° �
87 68.9 42.4
87 34.5 44.8
88 11.2 44.6
84 1.3 48.0
Notes: 3�=effective confining stress; �p�=peak friction angle; �cr=critica
Fig. 3. Results of conventional triaxial tests on Ottawa F-75 sand�based on Batiste �1998��: �a� dilatancy ratio versus axial straincurves; �b� maximum dilatancy ratio versus confining stress curves
Table 3. Summary of Model Tests
Series A S
A1 A2 A3 B1 B2
Target g-level 45 45 45 1 1
Relative density, Dr �%� 85 85 85 85 85
Max. relativedisplacement, � /Bmax �%� 14 29 57 14 29aModel with rigid pipe.bModel with flexible pipe.cRepeated test.d
Model with H /B=2.1744 / JOURNAL OF GEOTECHNICAL AND GEOENVIRONMENTAL ENGIN
cient of uniformity of 1.28, and a coefficient of curvature of 1.03.Its specific gravity is 2.65 and maximum and minimum void ra-tios are 0.805 and 0.486, respectively.
The shear strength parameters of the Ottawa sand, obtainedfrom conventional triaxial compression tests, are presented inTable 2 �Batiste 1998�. The results are reported for a soil relativedensity of approximately 85% and varying values of confiningeffective stress �3��. Table 2 also includes the maximum dilatancyratio ��−dv /da�max� obtained at each confining effective stress.
Dilatancy ratio �−dv /da� versus a curves obtained from theconventional triaxial tests conducted on Ottawa F-75 sand areshown in Fig. 3�a�. These results show that the dilatancy ratiodecreases significantly beyond a of approximately 5% but it doesnot decrease to zero, at least for the range of strains used in thesetests. Larger strains may be needed in order to attain critical stateconditions.
Of particular importance is the effect of confining stress �3��on the sand volumetric behavior. Fig. 3�b� shows the variation ofmaximum dilatancy ratio with confining stress. The results show avery high maximum dilatancy for 3� below 25 kPa and a com-paratively smaller dilatancy for higher confining stresses. The soilvolumetric behavior becomes nearly independent of confinementfor 3� higher than 50 kPa.
Testing Program
The experimental component of this investigation included a totalof 14 reduced-scale models, grouped into four testing series �Se-ries A, B, C, and D�. The variables selected for investigation foreach test are shown in Table 3. The variables include the targetg-level, sand relative density �Dr� and trapdoor relative displace-ment �� /B�. The models were built to sand relative density valuesDr of 85 and 42%, and were tested under normal gravity �1 g�and under a centrifugal acceleration of 45 g. The maximum trap-door movement imposed to the models was 20 mm, which corre-sponded to a relative displacement �� /B� of 57%. This magnitudewas selected to allow the visualization of fully developed failurepatterns within the soil mass. In order to study the propagation of
d �after Batiste �1998��
�cr �° � � �° � �−dv /da�max
35.5 15.4 0.79
37.0 15.4 0.80
37.9 15.2 0.98
34.3 24.6 1.43
friction angle; and �=dilatancy angle.
B Series C Series D
BRc BSd C1 C2 D1a D2a D3b D4b
1 1 45 1 45 45 45 45
85 85 42 42 85 42 85 42
57 29 57 57 57 57 57 57
-75 San
l state
eries
B3
1
85
57
EERING © ASCE / NOVEMBER 2009
the failure surfaces, Series A and B also included tests with trap-door movements of 5 and 10 mm, which correspond to relativedisplacements of 14 and 29%, respectively.
Series B included one test to evaluate the repeatability of theresults �Test BR� performed with the same characteristics of TestsB1, B2, and B3. The displacement of the trapdoor in Model BRwas achieved in three continuous steps, corresponding to relativedisplacements of 14, 29, and 57%. The results obtained in therepeated test were essentially identical to those of Models B1, B2,and B3. Series B also included a “shallow” model, built withH /B=2 �Model BS�. The failure mechanism obtained in ModelBS was consistent with that reported in the literature for shallowconditions.
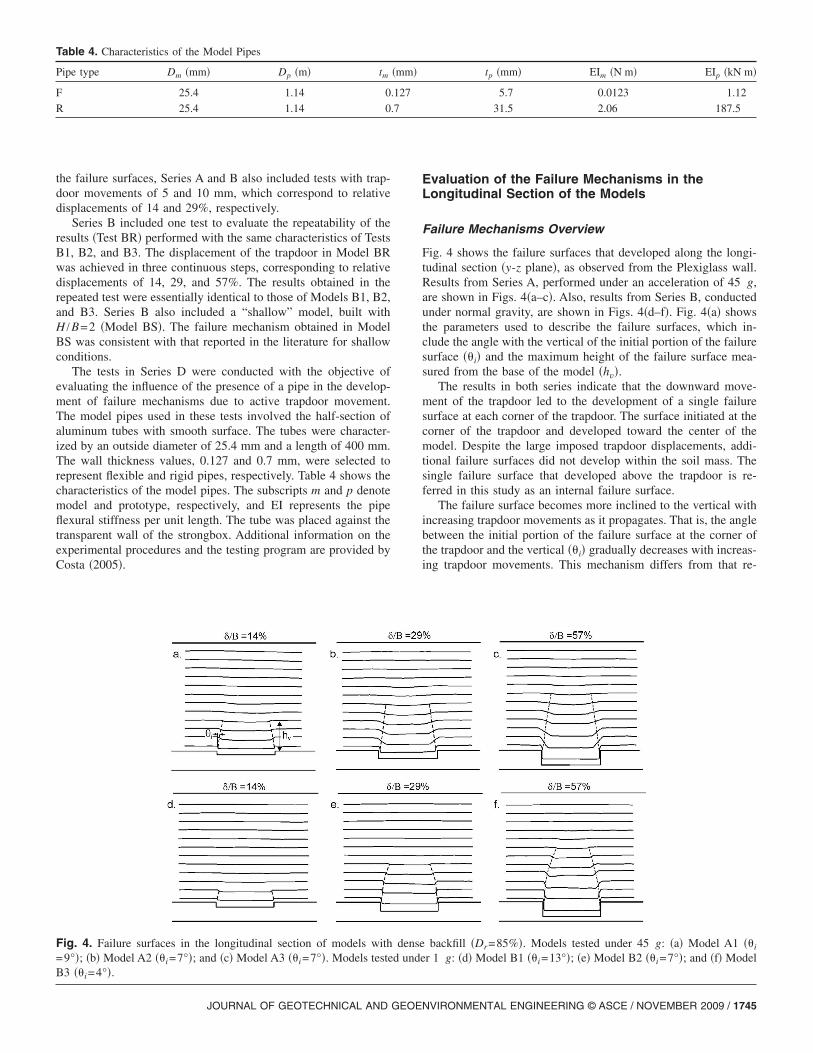
The tests in Series D were conducted with the objective ofevaluating the influence of the presence of a pipe in the develop-ment of failure mechanisms due to active trapdoor movement.The model pipes used in these tests involved the half-section ofaluminum tubes with smooth surface. The tubes were character-ized by an outside diameter of 25.4 mm and a length of 400 mm.The wall thickness values, 0.127 and 0.7 mm, were selected torepresent flexible and rigid pipes, respectively. Table 4 shows thecharacteristics of the model pipes. The subscripts m and p denotemodel and prototype, respectively, and EI represents the pipeflexural stiffness per unit length. The tube was placed against thetransparent wall of the strongbox. Additional information on theexperimental procedures and the testing program are provided byCosta �2005�.
Table 4. Characteristics of the Model Pipes
Pipe type Dm �mm� Dp �m� tm
F 25.4 1.14 0.
R 25.4 1.14 0.
Fig. 4. Failure surfaces in the longitudinal section of models with=9°�; �b� Model A2 ��i=7°�; and �c� Model A3 ��i=7°�. Models testeB3 ��i=4°�.
JOURNAL OF GEOTECHNICAL AND GEOE
Evaluation of the Failure Mechanisms in theLongitudinal Section of the Models
Failure Mechanisms Overview
Fig. 4 shows the failure surfaces that developed along the longi-tudinal section �y-z plane�, as observed from the Plexiglass wall.Results from Series A, performed under an acceleration of 45 g,are shown in Figs. 4�a–c�. Also, results from Series B, conductedunder normal gravity, are shown in Figs. 4�d–f�. Fig. 4�a� showsthe parameters used to describe the failure surfaces, which in-clude the angle with the vertical of the initial portion of the failuresurface ��i� and the maximum height of the failure surface mea-sured from the base of the model �hv�.
The results in both series indicate that the downward move-ment of the trapdoor led to the development of a single failuresurface at each corner of the trapdoor. The surface initiated at thecorner of the trapdoor and developed toward the center of themodel. Despite the large imposed trapdoor displacements, addi-tional failure surfaces did not develop within the soil mass. Thesingle failure surface that developed above the trapdoor is re-ferred in this study as an internal failure surface.
The failure surface becomes more inclined to the vertical withincreasing trapdoor movements as it propagates. That is, the anglebetween the initial portion of the failure surface at the corner ofthe trapdoor and the vertical ��i� gradually decreases with increas-ing trapdoor movements. This mechanism differs from that re-
tp �mm� EIm �N m� EIp �kN m�
5.7 0.0123 1.12
31.5 2.06 187.5
backfill �Dr=85%�. Models tested under 45 g: �a� Model A1 ��i
r 1 g: �d� Model B1 ��i=13°�; �e� Model B2 ��i=7°�; and �f� Model
�mm�
127
7
densed unde
NVIRONMENTAL ENGINEERING © ASCE / NOVEMBER 2009 / 1745
ported for shallow conditions, where successive failure surfaceswith constant �i are obtained. Shearing in this case was reportedto suddenly stop in the failure surface and to immediately con-tinue in the subsequent one �Stone and Muir Wood 1992�.
The angle ��i� was found to be lower for tests conducted under45 g than for tests conducted under 1 g. For example, an incli-nation ��i� of 9° was measured at the corner of the trapdoor in thetest conducted under 45 g for � /B=14% �Fig. 4�a��, but a com-paratively larger inclination ��i� of 13° was obtained in the testconducted under normal gravity for the same relative displace-ment �Fig. 4�d��.
Under 1 g, an angle �i of nearly 7° was measured for a rela-tive displacement � /B=29% and an even lower �i �4°� was mea-sured at the relative displacement � /B=57%. A similar trend wasobserved for increasing � /B values in the tests conducted under45 g, although the effect on �i is less significant at higher relativedisplacements.
The models tested under 45 g �Figs. 4�a–c�� resulted in com-paratively larger failure surfaces, as quantified by the maximumheight hv, than in the models tested under normal gravity. Themaximum height hv, measured under 45 g equals approximately1.2 B for a relative displacement of 14%. This height is aboutthree times larger than that recorded under normal gravity for thesame relative displacement. However, as the relative displace-ment increased, the failure surfaces under 1 and 45 g reachedsimilar heights. Specifically, for a relative displacement of 57%,the failure surfaces developed both under 45 and 1 g reached avertical height �hv� of approximately 2.4 B. Overall, the influenceof the applied g-level on the propagation of the failure surfaceswas found to be more significant under low � /B values.
The soil immediately above the trapdoor experienced dilation
Fig. 5. Contours of vertical strains in the longitudinal sections of themodels with dense backfill �Dr=85%�. Models tested under 45 g: �a�Model A1; �b� Model A2; and �c� Model A3. Models tested under1 g: �d� Model B1; �e� Model B2; and �f� Model B3.
1746 / JOURNAL OF GEOTECHNICAL AND GEOENVIRONMENTAL ENGIN
due to the movement of the trapdoor, which is in agreement withthe results reported by Evans �1983� for models with H /B�3. Inorder to quantify the soil dilation in the region over the trapdoor,linear vertical strains �z� were calculated for the tests conductedin Series A and B. The strains were calculated using data collectedfrom images captured in the tests. Fig. 5 shows the contours of z
obtained using the initial and final coordinates of the markersrecorded in the tests. The calculated lateral strains y were sig-nificantly smaller than z. Negative strains as shown in the con-tour labels correspond to volume increase. Since a reasonablysymmetric response was observed in all tests, only results fromone side of the models are shown in Fig. 5. The results show thatsoil dilation was more significant in tests conducted under 45 gthan for tests conducted under normal gravity for a relative dis-placement �� /B� of 14%. However, the effects of soil dilationbecome less significant for increasing values of � /B. Additionalcontours from the other models are presented by Costa �2005�.
Fig. 6 shows the failure surfaces recorded in the longitudinalsection of the models prepared using loose backfills �Dr=42%�and tested to a maximum relative displacement �� /B� of 57%�Series C�. The picture used to define the line art is also shown inFig. 6. Failure surfaces with similar patterns were observed fortests conducted under 45 g and under normal gravity �Figs. 6�aand b�, respectively�. The failure surfaces recorded in both mod-els with loose sand were characterized by a height �hv� equal to1.8 B and an inclination to the vertical ��i� of 4°. This is anexpected trend, since changes in dilatancy due to variations inconfining stress are comparatively less significant in loose soil.
Influence of Soil Dilatancy on the Development ofFailure Surfaces
The influence of soil dilatancy on the development of failure sur-faces can be evaluated with the results of triaxial tests performedwith the sand used as backfill in the centrifuge tests. The state ofstresses in the soil surrounding the active trapdoor is complex anddiffers from the stress conditions imposed in triaxial tests. Yet,results from conventional triaxial tests can provide good insightinto the data collected from the reduced scale models. Results ofconventional direct shear and triaxial laboratory tests have alsobeen used in previous studies of the trapdoor problem �Stone andMuir Wood 1992; Tanaka and Sakai 1993; Santichaianaint 2002;Muir Wood 2002�. Moreover, the dilatancy ratio has been re-ported to be independent of the testing mode �Bolton 1986�.
As observed for shallow conditions, the variations in the incli-nation of the failure surface in deep conditions are also associatedto changes in soil dilatancy with shearing due to trapdoor move-ment. Conventional triaxial tests conducted with the sand used in
Fig. 6. Failure surfaces in the longitudinal section of models withloose backfill �Dr=42%� for a relative displacement �� /B� of 57%:�a� model tested under 45 g, �b� model tested under 1 g
EERING © ASCE / NOVEMBER 2009

this study for confining effective stresses �3�� of 1.3 and 68.9 kPaled to maximum dilatancy angles ��� of 24.6 and 15.4°, respec-tively �Table 2�. These confining stresses are similar to the meaninitial stresses mobilized at the base of the models under 1 and45 g, respectively. The initial portion of the failure surfaces in themodel tests are expected to have developed with inclinations thatare consistent with these values of dilatancy angle. When thetrapdoor moves downwards, �i follows the decrease of � andreaches the values reported in Fig. 4.
The value reached by the dilatancy ratio �−dv /da�, of ap-proximately 0.2 at large strains �Fig. 3�a��, corresponds to a dila-tancy angle ��� of approximately 5°. This magnitude of dilatancyangle is consistent with the recorded angles ��i� of the initialportion of the failure surfaces, obtained at the relative displace-ment � /B of 57% �i.e., 4° under 1 g and 7° under 45 g�. Thislevel of relative displacements induces large strains in the soilmass above the trapdoor. The good comparison between theseresults provides good evidence that initial inclination of the fail-ure surface ��i� corresponds to the dilatancy angle ��� of the soil.
The dilatancy results obtained from the triaxial tests shown inFig. 3 can also be used to clarify aspects of the failure patternsrecorded in the longitudinal section of the models, related to thevariation of �i with � /B and the shape of the failure surfaces. Thelarger variations in �i with � /B observed under 1 g �Figs. 4�d–f��than under 45 g �Figs. 4�a–c�� can be explained by the largervariations in soil dilatancy from peak to residual values underlower stress levels than under higher stress levels. Moreover, un-like the curved failure surfaces obtained under 1 g �Figs. 4�d–f��,the nearly straight failure surfaces developed under 45 g �Figs.4�a–c�� can be explained by the smaller variations in dilatancyunder high confining stresses than under low confining stresses asshown in Fig. 3�b�. The initial vertical effective stresses �v�� inthe models tested under 45 g varied from zero at the surface to124 kPa at the base of the model, with the failure surfaces propa-gating in a region with v� ranging from approximately 50–124kPa. As shown in Fig. 3�b�, changes in soil dilatancy with con-fining stress are minor within this range of stresses, which isconsistent with the development of nearly straight failure sur-faces.
Thickness of Failure Surfaces
The thickness of the failure surface �t� has been generally ac-cepted to be on the order of 10 times the mean particle size of thesoil �D50� �Roscoe 1970�. Muir Wood �2002� compiled t /D50 ra-tios from different experimental conditions and reported t /D50
ratios ranging from 7.3 to 18.5. Experiments involving activetrapdoors with soil cover ratios H /B ranging from 0.5 to 2, haveled to t /D50 values ranging from 10 to 21 �Vardoulakis 1981;Santichaianaint 2002�.
Table 5 summarizes t /D50 ratios measured in the longitudinalsection of the models tested as part of this investigation. With theexception of the tests conducted using dense backfills �Dr
=85%� under 1 g �Series B�, the measured t /D50 ratios listed inTable 5 exceeded the value of 30, which is larger than typicalratios reported in the literature for shallow conditions.
The results also show that the thickness of the failure surfacesincreased with increasing trapdoor relative displacement �� /B� asshown in Table 5 for Series A and B �models with dense backfillunder 45 and 1 g, respectively�. This is consistent with findingsreported by Scarpelli �1981� and Hartley �1982� based on directshear test results. As the soil in the region of the failure surface is
sheared, dilatancy decreases and some of the surrounding soilJOURNAL OF GEOTECHNICAL AND GEOE
particles get involved in the deformation process. The failure sur-faces that developed in loose backfill were comparatively widerthan those developed in dense backfill.
Evaluation of the Failure Mechanisms in theTransverse Sections of the Models
Characteristics of the Failure Zones
Failure surfaces triggered by active trapdoors may also developbeyond the vertical failure surface OC shown in Fig. 1. As sche-matically illustrated in the transverse section shown in Fig. 7,larger trapdoor displacements would lead to the development ofsurfaces OD and OE, which propagate toward the mass of soilbeyond the trapdoor. These failure surfaces develop due to theinstability of the adjacent soil mass, which is mobilized by thecontinuous migration of soil into the underlying void. Since soildilatancy decreases with increasing trapdoor displacement ��� dueto the significant shearing of the soil in the vicinity of point O, theangle with the horizontal of the initial portion of surface OE��e−OE� is smaller than the angle of OD ��e−OD�. Continued trap-door movement is expected to cause the development of addi-tional failure surfaces until reaching the limit surface OF, which isinclined with an angle �e−OF to the horizontal. The inclination of
Table 5. Thickness Ratios �t /D50� of Failure Surfaces
Model Dr �%� g-level � /B �%� t /D50
A1 85 45 14 34
A2 85 45 29 62
A3 85 45 57 78
B1 85 1 14 16
B2 85 1 29 22
B3 85 1 57 29
C1 42 45 57 73a
C2 42 1 57 67b
amin.�t /D50�=47 and max.�t /D50�=100.bmin.�t /D50�=27 and max.�t /D50�=107.
Fig. 7. Transverse section showing schematic view of developmentof internal and external failure surfaces in a soil mass above an activetrapdoor
NVIRONMENTAL ENGINEERING © ASCE / NOVEMBER 2009 / 1747

OF equals the angle of repose of the soil, which corresponds tothe critical state friction angle ��cr�, that represents the angle ofshearing resistance of soil at its loosest state.
For the purposes of this study, failure surfaces developingwithin the limits of the trapdoor are defined as internal failuresurfaces, while surfaces developing outside the limits of the trap-door are defined as external failure surfaces. Thus, OA and OB inFig. 7 represent internal surfaces, while OD, OE, and OF repre-sent external surfaces. External failure surfaces correspond to theultimate state of the active arching process. The development ofexternal failure surfaces was originally envisioned by Terzaghi�1943�, who indicated that the failure planes that develop due toan active trapdoor should extend beyond the width of the struc-ture. This hypothesis was later confirmed experimentally by smallscale model tests conducted for H /B values ranging from 2 to 5.3�Ladanyi and Hoyaux 1969; Santichaianaint 2002�.
The failure surfaces that developed in the transverse sections�x-z plane� of the models tested in this study to low trapdoorrelative displacements �� /B� were similar to those recorded in thelongitudinal section �y-z plane�. That is, a single internal failuresurface developed from the corner of the trapdoor. The internalfailure surface was found to become gradually vertical �i.e., withlower �i� with increasing trapdoor movement. Ultimately, externalfailure surfaces developed for comparatively larger trapdoormovements.
Figs. 8�a–c� show the development of failure surfaces in trans-verse Section S1 �x-z plane� in tests conducted using dense back-
Fig. 8. Failure surfaces in transverse sections of models with dense�b� Model A2 �Section S1�; �c� Model A3 �Section S1�; �d� Model A3Model B1 �Section S1�; �g� Model B2 �Section S1�; �h� Model B3 �S
fill �Dr=85%� under an acceleration of 45 g �Series A�. Figs.
1748 / JOURNAL OF GEOTECHNICAL AND GEOENVIRONMENTAL ENGIN
8�f–h� show the failure surfaces obtained in transverse Section S1also in tests conducted using dense backfill but under normalgravity �Series B�. Different patterns of external failure surfaceswere observed in the models tested under different g-levels. Ascan be seen in Fig. 8�c�, conducted under 45 g, an internal andtwo external failure surfaces developed for a relative displace-ment �� /B� of 57%, with the outermost external failure surfacepropagating as a bifurcation of the previous one. On the otherhand, a single external failure surface was observed under normalgravity for the same relative displacement �Fig. 8�h��.
Table 6 summarizes the geometric characteristics of the failurezones recorded in transverse Section S1 of models tested usingdense backfills �Models A3 and B3� and loose backfills �ModelsC1 and C2� for a relative displacement �� /B� of 57%. The mag-nitude xi reported in Table 6 is the length of the horizontal pro-jection of the outermost failure surface measured from the cornerof the trapdoor �see Fig. 7�. As will be discussed in the nextsection, Table 6 also includes the results obtained with modelsthat included pipes �Series D�. The results in Table 6 indicate thatmodels with loose backfills resulted in comparatively wider fail-ure zones. Specifically, values of xi measured in models con-structed using loose backfill were nearly three times higher thanthose recorded in models with dense backfill. Since the ability ofthe soil to dilate decreases with increasing confinement, the ex-ternal failure surfaces follow a less steep path when propagatingin tests conducted under 45 g than those conducted under 1 g,resulting in comparatively wider failure zones.
l �Dr=85%�. Models tested under 45 g: �a� Model A1 �Section S1�;on S2�; and �e� Model A3 �Section S3�. Models tested under 1 g: �f�S1�; �i� Model B3 �Section S2�; and �j� Model B3 �Section S3�.
backfil�Sectiection
Figs. 8�d and e� show the patterns of failure surfaces obtained
EERING © ASCE / NOVEMBER 2009

in transverse Sections S2 and S3, respectively, in models of SeriesA �45 g�. Similarly, Figs. 8�i and j� show the patterns obtainedfrom the case of models of Series B �1 g� in the same transversesections. The locations of transverse Sections S1, S2, and S3 areindicated in Fig. 2�b�. The patterns of the failure surfaces ob-served in transverse Sections S1 and S2 are very similar. How-ever, the patterns in transverse Section S3 revealed less developedfailure surfaces, differing significantly from those recorded in theother two sections. A similar trend was observed in models con-structed using loose backfill. The less developed failure surfacesnear the corners of the trapdoor �transverse Section S3� is due to
Table 6. Characteristics of Failure Surface Patterns in the Transverse Se
Model Dr �%� g-l
Tests without pipe A3 85 4
B3 85
C1 42 4
C2 42
Tests with pipe D1 85 4
D2 42 4
D3 85 4
D4 42 4
Fig. 9. Maximum height of failure surface �hv� as a function of thetrapdoor displacement �, recorded in the longitudinal section and inthe transverse S1 section of models: �a� Models tested under 45 g�Series A�; �b� models tested under 1 g �Series B�
Table 7. Surficial Settlements on Transverse Section S1
Model Dr �%� g-level
Tests without pipe A1 85 45
A2 85 45
A3 85 45
B3 85 1
C1 42 45
C2 42 1
Tests with pipe D1 85 45
D2 42 45
D3 85 45
D4 42 45
JOURNAL OF GEOTECHNICAL AND GEOE
the friction mobilized between the soil moving into the trapdoorand the soil outside the trapdoor region that remains stable.
The differences between the failure patterns observed in thelongitudinal �y� and transverse �x� directions of the reduced-scalemodels can be explained by the difference in the trapdoor dimen-sions in these two directions with respect to the imposed trapdoordisplacement ���. For example, external failure surfaces did notdevelop in the longitudinal direction �y� of the models becausethe maximum trapdoor displacement ��� was comparatively smallin relation to the trapdoor length �L�. On the other hand, themagnitude of � was comparatively large in relation to the trap-door width B, and triggered the development of external failuresurfaces in the transverse direction �x� of the models.
Figs. 9�a and b� show the maximum height of the failure sur-faces �hv� as a function of the trapdoor displacement �, recordedin the longitudinal section as well as in the transverse S1 sectionof models of Series A �conducted under 45 g� and Series B �con-ducted under 1 g�, respectively. The values of hv and � werenormalized by the corresponding trapdoor dimension in the planeunder consideration �B or L�. The figures show that the maximumheight hv of the failure surfaces developed in both longitudinaland transverse sections tend to follow a single trend with increas-ing trapdoor displacement �. This result indicates that the differ-ences in the failure mechanisms observed in both transverse andlongitudinal directions are due to dimensional effects of the trap-door.
Surficial Settlements
Table 7 summarizes the surficial settlement values �s� obtained ontransverse Section S1. Settlements were recorded using LVDT’spositioned at horizontal distances of 0.25 B �settlement s0.25� and1.2 B �settlement s1.2� from the Plexiglass wall of the strongbox.
The soil relative density �Dr� significantly influenced the mag-
1 of the Models
Pipe type �e�° � xi /B hv /B
— 63 0.4 1.8
— 75 0.2 1.8
— 42 0.6 1.2
— 48 0.6 1.9
Rigid 54 0.8 2.0
Rigid 43 0.8 1.9
Flexible 63 0.6 2.0
Flexible 44 0.8 1.6
s0.25 /� �%� s1.2 /� �%� smax /� �%� w /B
6.7 4.0 6.9 5.9
5.1 3.0 5.2 5.9
4.8 3.0 4.9 6.1
0.0 0.0 0.0 0.0
13.6 — — —
6.4 — — —
5.5 — — —
16.0 — — —
5.5 — — —
18.0 — — —
ction S
evel
5
1
5
1
5
5
5
5
NVIRONMENTAL ENGINEERING © ASCE / NOVEMBER 2009 / 1749

nitude of the surficial settlements. In spite of the deep conditionsof the tests �H /B=4.5�, larger surficial settlements were recordedon models with loose backfills �Dr=42%� than on those withdense backfills �Dr=85%�. In general, surficial settlements wereapproximately three times larger in tests conducted using loosebackfill. The stress level also played a significant role on surficialsettlements, with models tested under an acceleration of 45 gexperiencing comparatively larger surficial settlements than mod-els tested under normal gravity.
Of particular importance for the assessment of potential dam-ages caused by underground openings in different subsoil condi-tions is the quantification of the maximum settlement �smax� andthe width �w� of the surficial depression. These parameters werequantified for the transverse section of those models where settle-ments in two positions �s0.25 and s1.2� were monitored during test-ing.
Consistent with empirical observations of surficial settlementsinduced by excavations of tunnels �Peck 1969�, the surficial de-pression developed after lowering the trapdoor was assumed to bedefined by a Gaussian distribution function, as follows:
sx = smax exp�− 0.5�x2/i2�� �1�
where smax=maximum settlement; i=horizontal distance mea-sured from smax to the inflection point P in the depression surface;x is the horizontal distance measured from the center of the de-pression to the point where settlement is measured; and w is thewidth of the depression �see Fig. 10�. The failure zone in Fig. 10is represented by straight external failure surfaces emerging fromthe corner of the trapdoor and intersecting the surface of the soilat point A. Based on the geometry shown in Fig. 10, the angle tothe horizontal ��e� of the external failure surface equals
�e = tan−1�2H/�w − B�� �2�
The width of the depression �w� is given by
w = 2i�2��1/2 �3�
The predicted smax and w values using Eqs. �1� and �3� areshown in Table 7 for those models where settlements in two po-sitions were measured on transverse Section S1. The measuredvalues s0.25 and s1.2 were used as input parameters to obtain smax
and i using Eq. �1�, and the width w was then obtained using Eq.�3�. The predicted width values for models of Series A were about
Fig. 10. Characteristics of surficial settlements
six times larger than the trapdoor width.
1750 / JOURNAL OF GEOTECHNICAL AND GEOENVIRONMENTAL ENGIN
The inclination of the initial portion of the external failuresurface in transverse Section S1 in Models A2 and A3 was pre-dicted using Eq. �2� considering the corresponding width w ob-tained from Eq. �3� and the cover ratio H /B=4.5. The predicted�e values equal 77° and 60.5° for Models A2 and A3, respec-tively. These results compare very well with the experimentallyobtained values, which equal 75° and 63° for Models A2 and A3,respectively.
Failure Mechanisms Involving Buried PipesSubjected to Ground Loss
The study of failure mechanisms induced by active trapdoors is ofparticular relevance in cases involving the presence of pipelineswithin the soil mass. Fig. 11 shows the failure patterns observedin transverse Sections S1 and S3 for Series D models, which wereconstructed as the models in the previous series, but including analuminum tube with outside diameter of 25.4 mm. All modelswere tested under 45 g. As shown in Figs. 11�a–d�, the recordedfailure patterns showed three distinct failure surfaces propagatedfrom the corner of the trapdoor. The innermost of the three sur-faces developed due to the sliding of the soil besides the pipe intothe underlying void. The other two failure surfaces are externalfailure surfaces and developed from subsequent instability of thesoil mass next to the trapdoor in an attempt to fill the void createdby the trapdoor movement. The outermost failure surface propa-gated into the soil mass at an initial angle �e and subsequentlybecame nearly vertical after reaching the elevation of the pipecrown. The characteristics of the models in the D Series and ofthe failure zones are provided in Table 6.
Figs. 11�e–h� show the failure patterns recorded in transverse
Fig. 11. Failure mechanisms recorded in models containing pipestested under 45 g to a relative displacement �� /B� of 57%. SectionS1: �a� rigid pipe in dense backfill �Model D1�; �b� rigid pipe in loosebackfill �Model D2�; �c� flexible pipe in dense backfill �Model D3�;and �d� flexible pipe in loose backfill �Model D4�. Section S3: �a�rigid pipe in dense backfill �Model D1�; �b� rigid pipe in loose back-fill �Model D2�; �c� flexible pipe in dense backfill �Model D3�; and�d� flexible pipe in loose backfill �Model D4�.
Section S3 of the Series D models. Consistent with results ob-
EERING © ASCE / NOVEMBER 2009
tained in models without pipes, the failure patterns in transverseSections S1 and S2 were very similar. However, the failure pat-terns observed in transverse Section S3 differed significantly fromthose recorded in the other two sections. hv /B values in transverseSection S3 are 15–30% smaller than those recorded in transverseSections S1 and S2. The only exception to that tendency wasobserved with Model D4 �flexible pipe in loose backfill�, whichshowed a pattern in S3 more similar to that of transverse SectionsS1 and S2. As previously discussed, less developed surfaces occurat the corners of the trapdoor due to the friction mobilized be-tween the sliding soil mass above the trapdoor and the surround-ing stable soil beyond the trapdoor. However, in the case ofModel D4, the combination of a low shear strength �loose soil�and a low pipe stiffness resulted in the development of morehomogeneous failure patterns across the entire pipe axis.
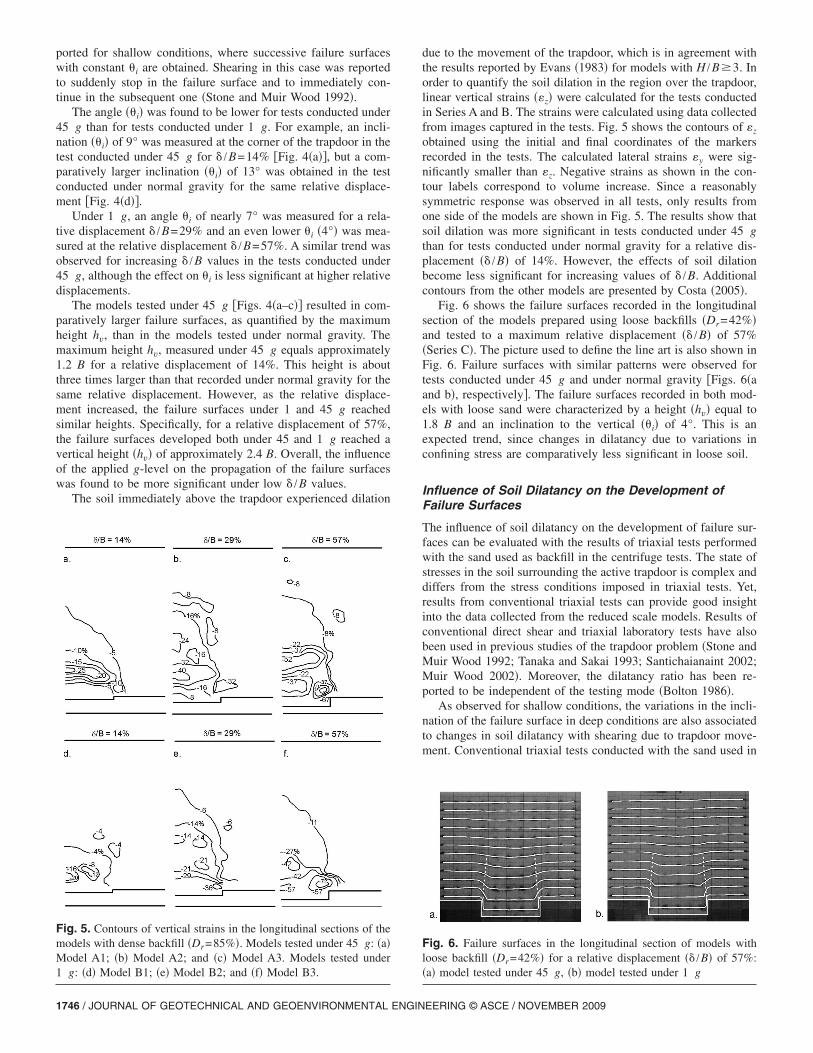
Inclusions have been reported to affect the development offailure surfaces within the soil mass. For example, biaxial com-pression tests reported by Vardoulakis and Graf �1985� involvingcylindrical inclusions in a granular soil showed that the inclusioninfluences the failure surfaces as they start propagating around it.In this study, the presence of the pipe was found to significantlyinfluence the pattern of the failure surfaces. Figs. 12�a and b�show values of hv /B and xi /B obtained in transverse Section S1for different backfill relative densities �Dr� in models involvingflexible �F� pipes, rigid �R� pipes, and no pipes �NP�. The pres-ence of the pipe led to better developed failure zones than in thecases without pipes, as shown in the figure by the values of hv /Band xi /B. The lateral spread of the failure zone �larger xi� is moresignificant in models with dense backfill. Since the soil columnover the pipe is prevented from sliding directly into the void, theunstable soil mass spreads laterally into the zone adjacent to thetrapdoor in order to fill the void. Without the pipe, the soil doesnot find obstacles and the unstable zone concentrates more overthe trapdoor.
The results in Fig. 12 also show that the presence of rigid �R�pipes resulted in larger failure zones than the presence of flexible�F� pipes, in both dense and loose backfills. While xi /B was moreinfluenced by pipe stiffness in dense backfills, hi /B was more
Fig. 12. Characteristics of failure surfaces developed in models con-taining rigid and flexible pipes and models without pipes: �a� heightof the failure surface �hv�; �b� lateral extent of the failure surface �xi�
influenced by pipe stiffness in loose backfills. The compatibility
JOURNAL OF GEOTECHNICAL AND GEOE
between the deformations of the pipe and the surrounding soil islarger for flexible pipes than for rigid pipes. As a result, smallerfailure zones are obtained with flexible pipes. Particularly, theinfluence of pipe stiffness was more significant on the develop-ment of the innermost failure surface.
Table 7 summarizes the surficial settlement values �s0.25 /��obtained on transverse Section S1 of the models containing pipes�Models D1 to D4�. It is noted that the presence of the pipeappears not to influence significantly the recorded surficial settle-ment. Consistent with the trend observed in series without pipes,surficial settlements were approximately three times larger inmodels with loose backfill than in models with dense backfill.
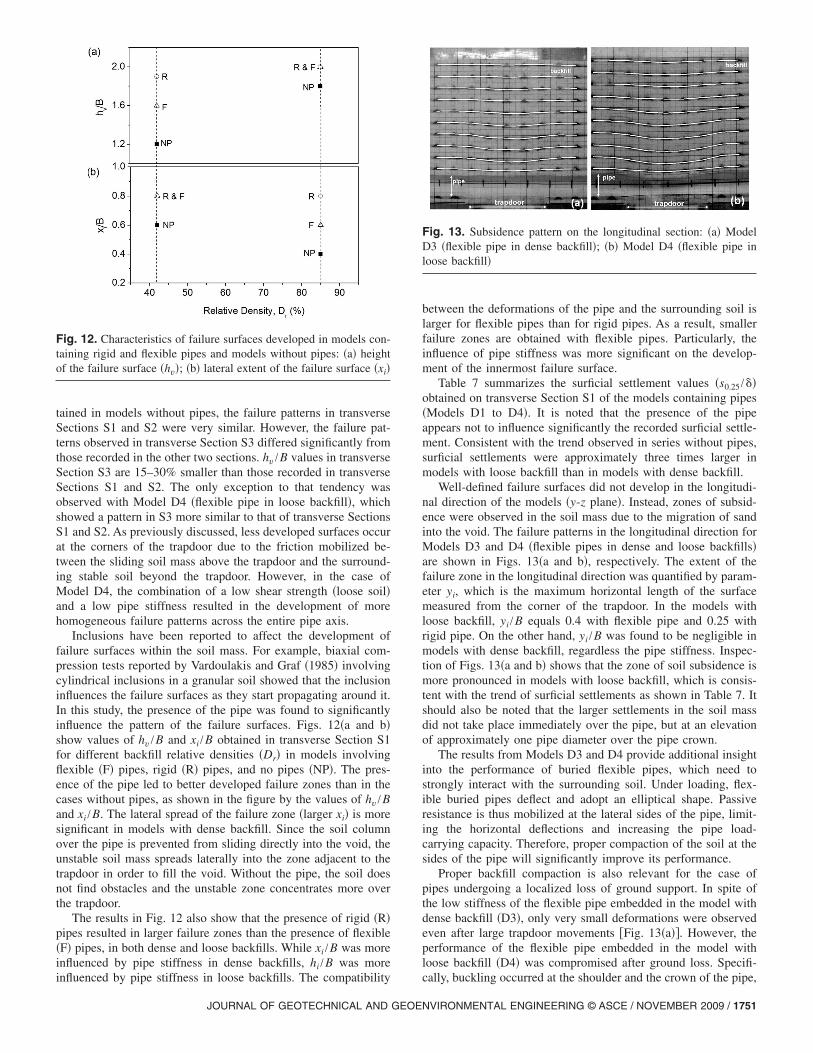
Well-defined failure surfaces did not develop in the longitudi-nal direction of the models �y-z plane�. Instead, zones of subsid-ence were observed in the soil mass due to the migration of sandinto the void. The failure patterns in the longitudinal direction forModels D3 and D4 �flexible pipes in dense and loose backfills�are shown in Figs. 13�a and b�, respectively. The extent of thefailure zone in the longitudinal direction was quantified by param-eter yi, which is the maximum horizontal length of the surfacemeasured from the corner of the trapdoor. In the models withloose backfill, yi /B equals 0.4 with flexible pipe and 0.25 withrigid pipe. On the other hand, yi /B was found to be negligible inmodels with dense backfill, regardless the pipe stiffness. Inspec-tion of Figs. 13�a and b� shows that the zone of soil subsidence ismore pronounced in models with loose backfill, which is consis-tent with the trend of surficial settlements as shown in Table 7. Itshould also be noted that the larger settlements in the soil massdid not take place immediately over the pipe, but at an elevationof approximately one pipe diameter over the pipe crown.
The results from Models D3 and D4 provide additional insightinto the performance of buried flexible pipes, which need tostrongly interact with the surrounding soil. Under loading, flex-ible buried pipes deflect and adopt an elliptical shape. Passiveresistance is thus mobilized at the lateral sides of the pipe, limit-ing the horizontal deflections and increasing the pipe load-carrying capacity. Therefore, proper compaction of the soil at thesides of the pipe will significantly improve its performance.
Proper backfill compaction is also relevant for the case ofpipes undergoing a localized loss of ground support. In spite ofthe low stiffness of the flexible pipe embedded in the model withdense backfill �D3�, only very small deformations were observedeven after large trapdoor movements �Fig. 13�a��. However, theperformance of the flexible pipe embedded in the model withloose backfill �D4� was compromised after ground loss. Specifi-
Fig. 13. Subsidence pattern on the longitudinal section: �a� ModelD3 �flexible pipe in dense backfill�; �b� Model D4 �flexible pipe inloose backfill�
cally, buckling occurred at the shoulder and the crown of the pipe,
NVIRONMENTAL ENGINEERING © ASCE / NOVEMBER 2009 / 1751

and a reversal of curvature was noted at the invert due to overde-flection �Fig. 13�b�� In this model, the damage to the pipe afterthe localized loss of ground support was more critical in trans-verse Section S1, but was less severe toward the edges of thetrapdoor. The damage to the shoulder of the pipe in transverseSection S1 of Model D4 is shown in Fig. 14.
The results obtained using the half sectioned pipes comparewell with the results obtained from tests conducted using fullsectioned pipes subjected to ground loss. Fig. 15 shows the resultsof a reduced-scale model test containing a whole sectioned pipe�with 75 mm in outside diameter and 2 mm in wall thickness�overlying a rectangular active trapdoor. The model represents aninstallation comprising a flexible pipe in loose backfill �Dr
=50%�. The general characteristics of the whole section model,including backfill soil conditions, model and trapdoor geometry,
Fig. 14. Damage observed in Section S1 of Model D4 �flexible pipein loose backfill�
Fig. 15. Deflections measured along a whole sectioned flexible pipein loose backfill �Dr=50%� overlying a rectangular active trapdoor�� /B=15%� �Costa 2005�
1752 / JOURNAL OF GEOTECHNICAL AND GEOENVIRONMENTAL ENGIN
and pipe stiffness are consistent with those of the half sectionedreduced-scale models �Costa 2005�. Although the stress field inthe whole sectioned model was controlled using a pressurizedbladder, the stress level in the trapdoor region was similar to thatobtained in the centrifuge for the half sectioned pipes.
Fig. 15 shows the variation of the deflections � � measuredalong pipe axis in four distinct positions �crown, invert, andspring-lines� for a relative displacement �� /B� of 15%. Pipe de-flection is presented in the figure as the measured displacement atthe selected pipe position normalized with the pipe diameter.Negative values of correspond to movements away from thepipe center. The deflections shown in Fig. 15 indicate that thewhole sectioned pipe experienced buckling at the crown and areversal of curvature at the invert due to overdeflection afterground loss. This trend was less severe toward the edge of thetrapdoor. This response is consistent with that observed for thehalf sectioned flexible pipe embedded in loose backfill �ModelD4�.
Conclusions
Failure mechanisms in a granular soil induced by the activemovement of a rigid trapdoor were evaluated in this study. Anexperimental program was conducted, which involved reduced-scale models tested under normal gravity as well as under 45 gusing a centrifuge facility. The models were constructed with asoil cover of 4.5 times the width of the trapdoor, which corre-spond to deep conditions. Failure mechanisms obtained after thedownward movement of the trapdoor were investigated in longi-tudinal and transverse sections of the models. Some models wereused to evaluate the performance of buried pipes undergoing alocalized loss of ground support.
The following conclusions can be drawn from the analysis ofthe data collected as part of this investigation:• The failure mechanisms for active trapdoors under deep con-
ditions differed significantly from those observed under shal-low conditions. The mechanisms reported for shallowconditions involve the development of multiple failure sur-faces in the region above the trapdoor �i.e., internal failuresurfaces�, with soil directly above the trapdoor remaining es-sentially rigid. Instead, the failure mechanism observed in thisstudy for deep conditions involved the development of asingle, well-defined internal failure surface which becomesgradually more inclined to the vertical for increasing down-ward trapdoor movement.
• As quantified by strain fields obtained from photographicmonitoring of the models, the soil directly above the trapdoorshowed significant dilation in the direction of the trapdoormovement.
• Assessment of the failure mechanisms in the transverse direc-tion of the models indicated the development of multiple fail-ure surfaces extending outside the limits of the trapdoor.Failure zones with heights ranging from 1.2 to nearly twice thetrapdoor width and lateral extensions ranging from 1.4 to overtwice the trapdoor width were obtained for large trapdoor dis-placements.
• The pattern of the failure surfaces induced by active trapdoormovements was significantly influenced by the stress level.High stress levels led to better defined failure zones.
• The soil relative density �Dr� influenced significantly the mag-nitude of the surficial settlements. Surficial settlements as large
as approximately 15% of the imposed trapdoor displacementEERING © ASCE / NOVEMBER 2009
were obtained in loose backfills. In general, surficial settle-ments were approximately three times larger in loose backfillsthan in dense backfills. These results provide insight into themagnitude of differential settlements that structures at theground surface may undergo due to the construction of deepunderground structures.
• The presence of inclusions, such as pipes, directly above theactive trapdoor affects significantly the development of failuresurfaces. Specifically, the presence of pipes resulted in largerfailure zones as compared to those obtained in models withoutpipes. Failure involved multiple failure surfaces extending out-side the trapdoor limits, to a maximum distance of 0.8 timesthe trapdoor width �B� and to a maximum height of twice thetrapdoor width. The extent of the failure zone was observed todecrease with increasing pipe stiffness.
• The soil density influences significantly the performance offlexible pipes undergoing localized loss of ground support.Pipes embedded in loose backfill experienced significant dam-age after ground loss, which was characterized by severebuckling in the region between the shoulder and the crown andby a reversal of curvature at the invert due to overdeflection.On the other hand, the pipes embedded in dense backfill suf-fered negligible deflections after ground loss of support. Theseresults indicate that damage to pipelines caused by ground losscan be significantly minimized by controlling the compactionof the fill.
Acknowledgments
The writers are grateful to the Brazilian research agency FAPESPfor the financial support provided to this research and to the CivilEngineering Department of the University of Colorado at Boulderfor the access to the centrifuge facilities.
References
Batiste, S. N. �1998�. “Mechanics of granular materials at low confiningstress.” MS thesis, Univ. of Colorado at Boulder.
Bolton, M. D. �1986�. “The strength and dilatancy of sands.” Geotech-nique, 36�1�, 65–78.
Costa, Y. D. J. �2005�. “Physical modeling of buried pipes subjected tolocalized loss of support or elevation.” Ph.D. thesis, School of Engi-neering of São Carlos, Univ. of São Paulo, Brazil �in Portuguese�.
Evans, C. H. �1983�. “An examination of arching in granular soils.” MSthesis, Department of Civil Engineering, MIT.
Hartley, S. �1982�. “Shear bands in sand. Part II.” Project Rep., Dept ofEngineering, Univ. of Cambridge, Cambridge, U.K.
Katona, M. G. �1988�. “Allowable fill height for corrugated polyethlene
JOURNAL OF GEOTECHNICAL AND GEOE
pipe.” TRB 1191, Transportation Research Board, National ResearchCouncil, Washington, D.C.
Ko, H. Y. �1988�. “The Colorado centrifuge facility.” Proc., Centrifuge’88, Balkema, Rotterdam, 73–75.
Koutsabeloulis, N. C., and Griffiths, D. V. �1989�. “Numerical modelingof the trap door problem.” Geotechnique, 39�1�, 77–89.
Ladanyi, B., and Hoyaux, B. �1969�. “A study of the trap-door problem ina granular mass.” Can. Geotech. J., 6�1�, 1–15.
McNulty, J. W. �1965�. “An experimental study of arching on sand.”Technical Rep. No. I-674, U.S. Waterways Experimental Station,Vicksburg.
Muir Wood, D. �2002�. “Some observations of volumetric instabilities insoils.” Int. J. Solids Struct., 39, 3429–3449.
Ono, K., and Yamada, M. �1993�. “Analysis of the arching action ingranular mass.” Geotechnique, 43�1�, 105–120.
Peck, R. B. �1969�. “State-of-the-art report: Deep excavations and tun-neling in soft ground.” Proc., 7th Int. Conf. in Soil Mechanics andFoundation Engineering, Mexico City, 225–290.
Roscoe, K. H. �1970�. “The influence of strains in soil mechanics.” Géo-technique, 20�2�, 129–170.
Santichaianaint, K. �2002�. “Centrifuge modeling and analysis of activetrapdoor in sand.” Ph.D. thesis. Dept. of Civil, Environmental andArchitectural Engineering, Univ. of Colorado at Boulder.
Scarpelli, G. �1981�. “Shear bands in sands.” MPhil thesis, Univ. of Cam-bridge, Cambridge, U.K.
Sloan, S. W., Assadi, A., and Purushothaman, N. �1990�. “Undrainedstability of a trapdoor.” Geotechnique, 40�1�, 45–62.
Stone, K. J. L., and Muir Wood, D. �1992�. “Effects of dilatancy andparticle size observed in model tests on sand.” Soils Found., 32�4�,43–57.
Tanaka, T., and Sakai, T. �1993�. “Progressive failure and scale effect oftrap-door problems with granular materials.” Soils Found., 33�1�, 11–22.
Terzaghi, K. �1936�. “Stress distribution in dry and saturated sand abovea yielding trap-door.” Proc., 1st International Conference on Soil Me-chanics and Foundation Engineering, Cambridge, Mass., 35–39.
Terzaghi, K. �1943�. Theoretical soil mechanics, Wiley, New York.Vardoulakis, I., and Graf, B. �1985�. “Calibration of constitutive models
for granular materials using data from biaxial experiments.” Geotech-nique, 35�3�, 299–317.
Vardoulakis, I., Graf, B., and Gudehus, G. �1981�. “Trap-door problemwith dry sand: A statical approach based upon model kinematics.” Int.J. for Numerical and Analytical Methods in Geomechanics, 5, 57–78.
Yimsiri, S., Soga, K., Yoshizaki, K., Dasari, G., and O’Rourke, T. �2004�.“Lateral and upward soil-pipeline interactions in sand for deep em-bedment conditions.” J. Geotech. Geoenviron. Eng., 130�8�, 830–842.
Zornberg, J. G., and Arriaga, F. �2003�. “Strain distribution withingeosynthetic-reinforced slopes.” J. Geotech. Geoenviron. Eng.,129�1�, 32–45.
Zornberg, J. G., Sitar, N., and Mitchell, J. �1998�. “Performance of geo-synthetic reinforced slopes at failure.” J. Geotech. Geoenviron. Eng.,124�8�, 670–683.
NVIRONMENTAL ENGINEERING © ASCE / NOVEMBER 2009 / 1753


