Embed Size (px)
Citation preview

Appendix H - Link Reliability Calculations
H. Link Reliability CalculationsH.1. IntroductionFading and rain can cause significant changes in the path loss experienced by a communications system. These factors are particularly important on high reliability point-to-point link systems where fading and severe rain attenuation that occurs only a small fraction of the time can be important. For this reason, the contents of this Appendix are only applicable to studies in the programs at microwave frequencies and where system predicted reliability or availability percentages above 99% are needed. In general, then, the analysis described in this Appendix applies to:
1. The link analysis that is only available to programs EDX SignalPro, SIGNAL, TPATH, and MCS.
2. The multipoint studies which are only available in EDX SignalPro, SIGNAL, MSITE, and MCS.
3. The percent service availability area studies that are available in all programs except TPATH and AMW.
The focus of this Appendix is to determine how link availability is degraded due to multipath fading and rain. Link availability is measured as a percentage of seconds in a year when the link is available; that is, when the signal level at the receiver is above an equipment-defined threshold where acceptable performance is achieved. Below this level the performance is unacceptable and the link is deemed to be unavailable. The approach to finding availability, or its inverse, link outage, is to assess the degradation in fade margin as a result of fading and rain. Fade margin will be discussed first.
H.2. Fade MarginFade margin is the amount of additional path loss over the median path loss that will cause the system performance to fall below an acceptable level. The relevant levels are usually determined using power levels calculated at the input to the receiver. Fade margin actually consists of two main parts - flat fade margin and dispersive or frequency-selective fade margin. The dispersive fade margin is only important in digital or wideband systems where frequency-selective channel response affects system performance.
H.2.1. Flat Fade MarginFlat fade margin is calculated based on a combination of the thermal noise fade margin, the adjacent channel fade margin, and the fade margin for any other external interference in the circuit.
Thermal fade margin, At , is the amount of additional path loss over the median path loss which will cause an outage due to thermal noise. It is considered independently of adjacent channel and other external interference. Thermal fade
Copyright 1996-1998, EDX Engineering, Inc. All rights reserved. Last revision: 1998/02/08
1

Appendix H - Link Reliability Calculations
margin is the difference in dB between the median signal level at the receiver and the threshold specification published by the equipment manufacturer.
Adjacent channel interference fade margin, Aac , is the additional path loss over the median path loss which will cause an outage due to adjacent channel interference. It is considered independently of thermal noise and other external interference. Adjacent channel interference fade margin is calculated as the difference between the median signal level and the total adjacent channel interference level, minus the required desired carrier-to-adjacent channel interference level to achieve acceptable performance.
External channel interference fade margin, Aex , is the additional path loss over the median path loss which will cause an outage due to other external channel interference. It is considered independently of thermal noise and adjacent channel interference. Other external interference usually consists of co-channel interference. Once again, this fade margin is calculated as the difference between the median signal level and the total external interference level, minus the required desired carrier-to-cochannel interference level to achieve acceptable performance.
The three fade margins can be combined to produce a single value for flat margin as follows:
dB (H1)
H.2.2. Frequency-Selective or Dispersive Fade Margin Frequency-selective or dispersive-fade margin applies to digital systems in which multipath signal reflections cause not only changes in the carrier amplitude at specific frequencies, but also intersymbol interference (ISI) from the delayed pulses in the multipath signals. Most digital radios are designed to contend with a certain amount of such pulse spreading, usually with an adaptive equalizer which is designed to "subtract out" the contributions from the multipath echoes which cause ISI.
Determining the performance of a wideband digital system in a multipath channel is a difficult task. This topic continues to be the subject of on-going research. A simple and commonly used approach is based on the recognition that most errors in such systems occur when the ISI becomes so great relative to the desired pulse sampling point that the equalizer cannot remove it. Such circumstances usually occur at the bottom of fades, although deep fades can occur in which the relative ISI does not increase enough to cause errors. It is also true that errors can occur with no fade and only a relative shift of the power distribution from the desired (sampled) pulse to the delayed ISI pulses. Nonetheless, the overall envelope power as determined for a narrowband (i.e., frequency non-selective or flat) fading channel is a useful channel signature that can indicate the probability of wideband system outages due to unacceptable error rates. From this, digital link equipment specifications usually include a "dispersive-fade margin" value which is interpreted as the additional path loss over the median path loss which will cause an outage
Copyright 1996-1998, EDX Engineering, Inc. All rights reserved. Last revision: 1998/02/08
2

Appendix H - Link Reliability Calculations
due to unacceptably high error rates in wideband digital systems. As with the flat-fade margin, such unacceptable performance is interpreted as an unavailable link. The dispersive-fade margin can be combined with the flat-fade margin to yield an overall fade margin, AFD as follows:
dB (H2)
The term RDF is the relative dispersive factor that indicates how dispersive the path is compared to a reference link measured by Rummler [4]. In EDX software the RDF term is internally set to 5, which corresponds to average propagation conditions.
Using the value AFD, the next step is to look at the probability of additional path loss equal to AFD due to fading and/or rain. The probability that a path loss increase (signal level decrease) of AFD dB will occur from fading or rain is the probability that an outage will occur and that the link will not be available.
Since path-loss changes due to changing atmospheric conditions (fades) and path-loss changes due to rain are essentially independent events, the probabilities of outages due to these mechanisms are assumed to be independent. The outage times resulting from each are therefore calculated separately and then added together to determine the overall link availability percentages.
H.3. Multipath Fading Path Loss (Outage)Multipath reflections arriving at the receive antenna add vectorially to the directly received signal. The resultant signal envelope is the sum of the vectors and depends upon their relative amplitude and phase relationships. For example, a reflection which is half the amplitude of the directly received signal and 180 degrees out of phase, will result in a net received envelope voltage amplitude which is 6 dB lower than the median signal voltage envelope with no reflection. The vector sum of the voltages at the receive antenna will depend upon the relative amplitudes and phases of all multiple reflections.
Because the amplitude and phase of the multipath reflections are usually not explicitly known, the net resulting signal envelope at the receiver can only be described in statistical terms. The traditional theoretical statistical description for the envelope voltage of a sum of random phasors is a Rayleigh distribution. However, more refined empirical descriptions of the statistics of the envelope amplitude, or fading probability, have been developed which approximately take into account climate conditions and underlying terrain. The multipath fade probability calculations in EDX software offer two such refined empirical methods - 1) the Vigants-Barnett method, and 2) the method in ITU-R Rec. 530-5. Each is discussed below.
Copyright 1996-1998, EDX Engineering, Inc. All rights reserved. Last revision: 1998/02/08
3

Appendix H - Link Reliability Calculations
H.3.1. Vigants-Barnett Multipath Fade Outage CalculationsThe Vigants-Barnett method is not an "official" method as such, but is based on the published work of two microwave system researchers at AT&T Bell Labs [1], [2].
The probability of a fade of depth A using this method is given by:
(H3)
where:
PF = probability of a fade as a fraction of timed = path length in kilometersf = frequency in GHzC = propagation conditions factorA = fade depth in dB. This equation is only valid for fade depths of 15 dB
or more.
The propagation conditions factor, or C, is selected by you on the Link Reliability Analysis dialog box (see Section 7.5.6 of the Reference Manual). The map in Figure 1 of this Appendix gives you an indication of the appropriate C factor for the area where the link will be used.
Note that in the original Barnett paper[1] the factor 10 is shown as L2 . The two factors are equivalent since the normalized envelope value is defined in Barnett as 20 log10 L.
To find the probability of an outage, the program first calculates the total fade margin AFD as described in section H2. Using this value in equation (H3) for A, the probability of the fade greater than the fade margin, and hence the probability of an outage, is found.
H.3.1.1. Annual Fade Outage
The fade outage probability, PF , calculated using (H3), is for the worst month. The worst month availability in percent then equals 100(1.0-PF). Assuming three "worst" fading months occur each year, usually during the summer months since fading is related to warm weather, the annual fade outage can be found as:
Annual fade outage (seconds) = (number of seconds in a year) (H4)
where PF is the probability that the signal will fall below the received level for acceptable link performance. Whether PF is found by Vigants-Barnett method or by the ITU-R Rec. 530-5 method, the corresponding annual link outage is still calculated from equation (H4). The result of this calculation is reported on the link screen as Annual fade outage.
Copyright 1996-1998, EDX Engineering, Inc. All rights reserved. Last revision: 1998/02/08
4

Appendix H - Link Reliability Calculations
H.3.2. ITU-R Rec. 530-5 Multipath Fade Outage CalculationsThe multipath fade outage probability formula found in ITU-R Rec. 530-5, equation (28) is:
(H5)
where:
PF = probability of a fade in percent. The resulting value is divided by 100 to yield fade probability as a fraction of time.
K = geoclimatic factor for worst fading monthd = path length in kilometersf = requency in GHz
= path inclination in milliradians= average grazing angle corresponding to 4/3 earth in milliradians
A = fade depth in dB. This equation is only valid for fades of 15 dB or more.
The geoclimatic factor K is defined in terms of pL , the percent of time the relative refractivity gradient is less than -100 N/km. This factor can be found from the maps in Figures 2 through 5. The month with the highest value of pL should be used.
K = 10-5.4 pL1.5 for overland paths not in mountainous areas
(H6)
K = 10-6.0 pL1.5 for overland paths in mountainous areas
(H7)
K = 10-4.9 pL1.5 for paths over large bodies of water
(H8)
The path inclination is computed using the transmit antenna elevation ht and receive antenna elevation hr and the path length as follows:
milliradians (H9)
where the path length is in kilometers and the antenna elevations are in meters above mean sea level.
The average grazing angle in ITU-R Rec. 530-5 is computed as follows:
milliradians (H10)
Copyright 1996-1998, EDX Engineering, Inc. All rights reserved. Last revision: 1998/02/08
5

Appendix H - Link Reliability Calculations
where: (H11)
(H12)
(H13)
In calculating the coefficients m and c, the variables ae , d , h1 and h2 must be in the same units. By ITU-R definition, the value of ae is set at 4/3 earth radius, or 8500 km. The grazing angle is in milliradians when h1 and h2 are in meters and the path length d is in kilometers in equation (H10).
In ITU-R Rec. 530-5 the antenna heights h1 and h2 are the transmit and receive antenna heights, respectively, above a linear "least squares" fit to the terrain profile. For the EDX software implementation, these heights are taken relative to the average terrain profile elevation rather than the linear "least squares" fit to the terrain profile. As with the Vigants-Barnett method, equation (H5) is used to find the probability that a fade of depth A = AFD fade margin will occur, thus resulting in an outage. This value is then used to find the annual fade outage time in seconds as described in Section H3.1.1.
H.4. Diversity Reception ImprovementThe probability of a multipath fade outage can be significantly reduced by using diversity techniques. Diversity uses two or more reception branches to take advantage of the fact that the reception branches can be relatively un-correlated. The lack of correlation means it is unlikely that deep fades will occur at the same time on both (or all) branches.
The diversity techniques most commonly employed in link systems are:
1. Space diversity with switching between two branches at baseband2. Space diversity with combining at IF3. Frequency diversity
Frequency diversity is no longer widely used because it is spectrally very inefficient, and spectrum-use efficiency is of paramount importance in most developed countries. For this reason, frequency diversity improvement analysis is not offered in EDX software.
The effects of diversity on the outage probability of a link system is usually calculated as a diversity "improvement factor." For space diversity with baseband
Copyright 1996-1998, EDX Engineering, Inc. All rights reserved. Last revision: 1998/02/08
6

Appendix H - Link Reliability Calculations
switching, the improvement factor can be calculated using the formulas in Vigants as follows [2]:
(H14)
where:
s = vertical spacing of the receive antennas (center to center) in metersf = frequency in GHzd = path length in kilometersv = ratio between the gain of the main and diversity receive antennas. The
gain of the diversity antenna can be entered on the Link Reliability Analysis dialog box.
The improvement factor modifies the outage probability PF from equation (H3) or (H5) to yield the reduced outage probability:
(H15)
This adjusted outage probability is used to find the total annual fade outage and annual link availability.
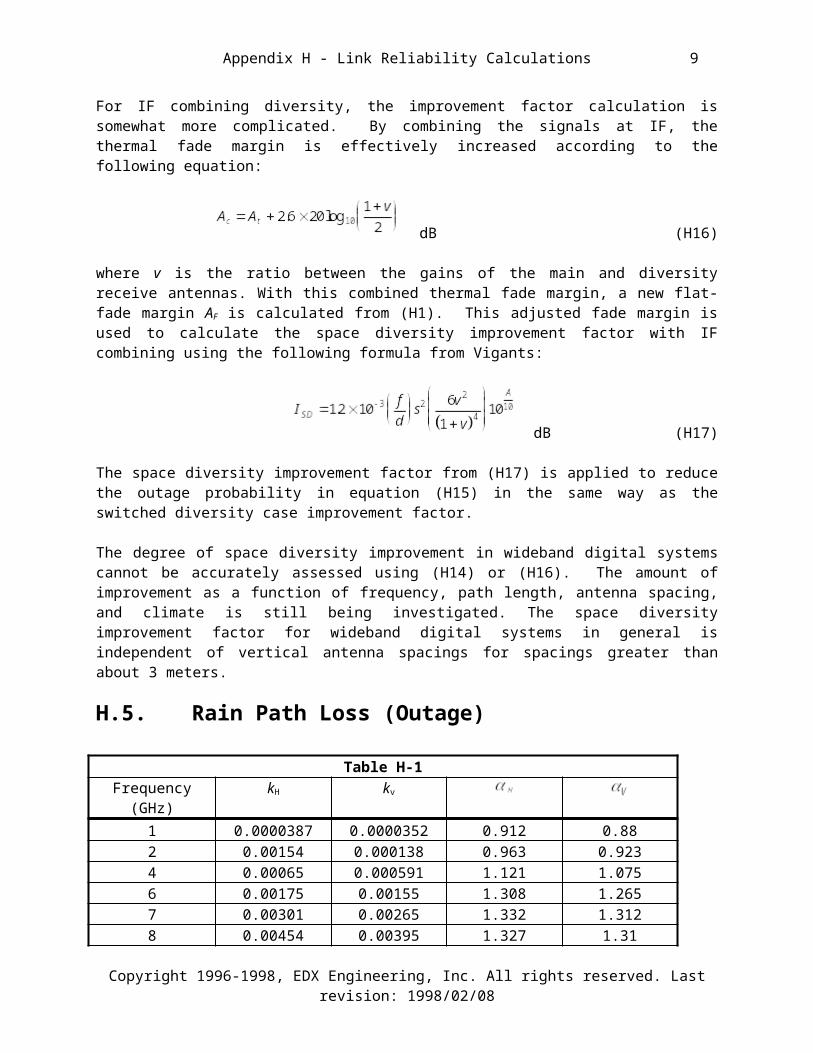
For IF combining diversity, the improvement factor calculation is somewhat more complicated. By combining the signals at IF, the thermal fade margin is effectively increased according to the following equation:
dB (H16)
where v is the ratio between the gains of the main and diversity receive antennas. With this combined thermal fade margin, a new flat-fade margin AF is calculated from (H1). This adjusted fade margin is used to calculate the space diversity improvement factor with IF combining using the following formula from Vigants:
dB (H17)
The space diversity improvement factor from (H17) is applied to reduce the outage probability in equation (H15) in the same way as the switched diversity case improvement factor.
The degree of space diversity improvement in wideband digital systems cannot be accurately assessed using (H14) or (H16). The amount of improvement as a function of frequency, path length, antenna spacing, and climate is still being
Copyright 1996-1998, EDX Engineering, Inc. All rights reserved. Last revision: 1998/02/08
7

Appendix H - Link Reliability Calculations
investigated. The space diversity improvement factor for wideband digital systems in general is independent of vertical antenna spacings for spacings greater than about 3 meters.
H.5. Rain Path Loss (Outage)
Table H-1Frequency
(GHz)kH kv
1 0.0000387 0.0000352 0.912 0.882 0.00154 0.000138 0.963 0.9234 0.00065 0.000591 1.121 1.0756 0.00175 0.00155 1.308 1.2657 0.00301 0.00265 1.332 1.3128 0.00454 0.00395 1.327 1.31
10 0.0101 0.00887 1.276 1.26412 0.0188 0.0168 1.217 1.215 0.0367 0.0335 1.154 1.12820 0.0751 0.0691 1.099 1.06525 0.124 0.113 1.061 1.0330 0.187 0.167 1.021 135 0.263 0.233 0.979 0.96340 0.35 0.31 0.939 0.92945 0.442 0.393 0.903 0.89750 0.536 0.479 0.873 0.86860 0.707 0.642 0.826 0.82470 0.851 0.784 0.793 0.79380 0.975 0.906 0.769 0.76990 1.06 0.999 0.753 0.754
100 1.12 1.06 0.743 0.744Path loss increase due to high intensity rain is a flat fading (non-frequency selective) phenomenon. It is not improved by diversity reception since both reception branches will experience the same degree of rain-caused fading at the same time. Rain outage is computed relative to the thermal fade margin.
Copyright 1996-1998, EDX Engineering, Inc. All rights reserved. Last revision: 1998/02/08
8
Appendix H - Link Reliability Calculations
Table H-2% of Year
Crane Rain Regions. Rainfall rate exceeded (mm/hr)
Exceeded
A B C D1 D2 D3 E F G H
0.001 28 54 80 90 102 127 164 66 129 2510.002 24 40 62 72 86 107 144 51 109 2200.005 19 26 41 50 64 81 117 34 85 178
0.01 15 19 28 37 49 63 98 23 67 1470.02 12 14 18 27 35 48 77 14 51 1150.05 8 9.5 11 16 22 31 52 8 33 77
0.1 5.5 6.8 7.2 11 15 22 35 5.5 22 510.2 4 4.8 4.8 7.5 9.5 14 21 3.2 14 310.5 2.5 2.7 2.8 4 5.2 9.7 8.5 1.2 7 13
1 1.7 1.8 1.9 2.2 3 4 4 0.8 3.7 6.42 1.1 1.2 1.2 1.3 1.8 2.5 2 0.4 1.6 2.8
Table H-3% of ITU-R Rain Regions. Rainfall rate exceeded (mm/hr)Year A B C D E F G H J K L M N P Q0.00
122 32 42 42 70 78 65 83 55 10
0150
120
180
250
170
0.003
14 21 26 29 41 54 45 55 45 70 105
95 140
200
142
0.01 8 12 15 19 22 28 30 32 35 42 60 63 95 145
115
0.03 5 6 9 13 12 15 20 18 28 23 33 40 65 105
96
0.1 2 3 5 8 6 8 12 10 20 12 15 22 35 65 720.3 0.8 2 2.8 4.5 2.4 4.5 7 4 13 4.2 7 11 15 34 49
1 <0.1
0.5 0.7 2.1 0.6 1.7 3 2 8 1.5 2 4 5 12 24
H.5.1. Crane Rain Outage CalculationsThe Crane method for predicting the outage due to high intensity rainfall is based on a publication which appeared some years ago [3]. The rain attenuation is calculated by the Crane method as follows:
(H18)
Copyright 1996-1998, EDX Engineering, Inc. All rights reserved. Last revision: 1998/02/08
9

Appendix H - Link Reliability Calculations
(H19)
where:
Rp= rain rate in millimeters per hourD = path length in kilometers
=regression coefficients from Table H-1 for the frequency of interest. Note that these values are taken from ITU-R Rec. 838 and are different from the coefficients Crane used in his original paper.
The rain rate values in millimeters per hour are directly related to the geographical area where the link will operate. The map in Figure 6 shows Crane rain regions throughout the world with letter designations A through H. The rain rates for each region as a percentage of time each year are given in Table H-2. These values are contained in file CRANE.RAI which is included on the program diskette. You must have this file in your directory to use the program.
The above rain fade probability is for path lengths of 22.5 km or shorter. For path lengths greater than 22.5 km, the calculation is done for 22.5 km and the final adjusted annual outage probability is calculated as:
(H20)
The annual outage probability is multiplied by the number of seconds in a year to yield the total number of seconds per year that the link is unavailable due to rain outages.
Equations (H18) or (H19) are solved iteratively for different rainfall rates in the region you designate on the Link Reliability Analysis dialog box. When (and if) a value of rainfall rate is found which produces rain attenuation AR equal to or greater than the thermal fade margin, At , then the corresponding percentage of time this rainfall rate occurs is taken as the rain outage probability, PR. This requires interpolation among the values in Table H-2.
H.5.2. ITU-R 530-5 Rain Outage CalculationsRain attenuation by the ITU-R method is done in a similar way to the Crane analysis. However, the basic equation and the rainfall region map are different.
Copyright 1996-1998, EDX Engineering, Inc. All rights reserved. Last revision: 1998/02/08
10

Appendix H - Link Reliability Calculations
The basic equation for rain attenuation is taken from ITU-R Rec. 530-5 (1994) and Rec. 838 (1994) as follows:
(H21)
where k and are coefficients found from values in Table H-1 for the relevant frequency, and R is the rain rate in mm/hr for a given percentage of time for a given rain region of the world. The values in Table H-1 are used to find k and using the following equations:
(H22)
(H23) where is the path elevation angle and is the polarization tilt angle relative to the horizontal. For linear horizontal or vertical polarization used here, the polarization tilt angle is either zero or 90 degrees, respectively. Likewise, for terrestrial radio paths, the path elevation angle is typically very small, especially for path distances where rain attenuation might be important. For use in EDX software, it is assumed that is zero.
To find the total attenuation on the path due to rain, the attenuation factor must be multiplied by the effective path length, deff, which is defined as:
(H24)
where d is the actual path length in km and for R0.01 100 mm/hr (the rain rate 0.01% of the time):
(H25)
The total path attenuation for 0.01% of the time is then given by:
(H26)
This loss for 0.01% of the time can be converted to some other percentages, p, ranging from 0.01% to 1% using the following formula from ITU-R Rec. 530-5, equation (44):
Copyright 1996-1998, EDX Engineering, Inc. All rights reserved. Last revision: 1998/02/08
11

Appendix H - Link Reliability Calculations
(H27)
As with the Crane method, equation (H27) is solved iteratively to find a rain-caused attenuation which is equal to or exceeds the thermal fade margin At. When this value is found, the corresponding probability is used as the rain outage probability, PR , for calculating link availability. This approach is only valid from 0.001% to 1% based on the restrictions stated in ITU-R Rec. 530-5.
The ITU-R rain regions are shown in Figure 7 as single letter designations. The appropriate designation for the region where the link will be operated is entered on the Link Reliability Analysis dialog box in the software. The rain rates for each rain region are shown in Table H-3.
H.6. Annual Link AvailabilityThe annual multipath fade and rain outage results for a link can be converted into annual link availability using the following equation:
Annual link availability (%) = 100 ( 1.0 - PF - PR) (H28)
This annual link availability value is reported on the link profile plot and in the link analysis results file.
H.7. ReferencesThe following documents may be useful for detailed background information on the link reliability analysis techniques discussed in this Appendix.
[1] W.T. Barnett, "Multipath Propagation at 4, 6 and 11 GHz," Bell System Technical Journal, Vol. 51, No. 2, February 1972, pp. 311-361.
[2] A. Vigants, "Space-Diversity Engineering," Bell System Technical Journal, Vol. 54, No. 1, January, 1975, pp. 103-142.
[3] R.K. Crane, "Prediction of Attenuation by Rain," IEEE Trans. on Comm.,Vol. COM-28, No. 9, September 1980, pp. 1717-1732.
[4] W. Rummler, "Characterizing the Effects of Multipath Dispersion on Digital Radios," IEEE Globecom Proceedings, pp. 1727-1732, 1988.
Copyright 1996-1998, EDX Engineering, Inc. All rights reserved. Last revision: 1998/02/08
12

Appendix H - Link Reliability Calculations
Copyright 1996-1998, EDX Engineering, Inc. All rights reserved. Last revision: 1998/02/08
13