Embed Size (px)
Citation preview

Faculty Use and Perceived Effectiveness of Web 2.0 Tools for Teaching and
Learning at Kansas Independent College Association Member Institutions
Andy Jett
A.A., Colby Community College, 1987
B.A., Wichita State University, 1989
MLA, Baker University, 2006
Submitted to the Graduate Department and Faculty of the School of Education of
Baker University in partial fulfillment of the requirements for the degree of
Doctor of Education in Educational Leadership
Date Defended: May 1, 2019
Copyright 2019 by Andy Jett

ii
Abstract
Web 2.0 tools are becoming a significant element in our lives and the impact on
higher education institutions is great. An institution’s ability to meet student expectations
related to the use of technology grows each year. The purpose of this study was to
examine faculty use and perceived effectiveness of Web 2.0 tools for teaching and
student learning. Faculty at the 19 Kansas Independent Colleges Association (KICA)
institutions completed a survey instrument providing ratings of use and perceived
effectiveness of four Web 2.0 tools. A quantitative descriptive survey research design
was chosen for the current research study. Dependent variables included faculty
members’ ratings of amount of use of four types of Web 2.0 tools (text-based, image-
based, audio, and video) and their perceptions of these tools as effective teaching and
learning tools on a survey designed for the study. The independent variables included in
the research study were the faculty member’s age, years of teaching experience, primary
teaching discipline, and employment status (full-time tenured, full-time tenure track, full-
time non-tenure track, and adjunct/part-time). Forty research questions and 40
hypotheses guided the study. One sample t tests, and one-factor ANOVAs were used to
test the hypotheses.
The results of the study indicated that faculty almost never or never use the four
types of Web 2.0 tools. In contrast, the results of the study showed that faculty agree the
tools are effective teaching and student learning tools. Results of the data analysis
indicated significant findings based upon primary teaching discipline and faculty
employment status. Education faculty use text-based tools more frequently than Arts &
Humanities, Biological Sciences, or Physical Sciences faculty. Business faculty use text-

iii
based tools more frequently than Biological Sciences and Physical Sciences faculty.
Education faculty use image-based tools more frequently than Arts & Humanities faculty.
Other Professions faculty use image based tools more frequently than faculty from Other
Disciplines. Education, Arts & Humanities, and Business faculty use audio tools more
frequently than Physical Sciences faculty. Education, Social Sciences, and Business
faculty use video tools more frequently than Physical Sciences faculty. Adjunct/part-time
faculty reported more frequent use of text-based tools than full-time non-tenure track,
full-time tenure track, and full-time tenured faculty. Marginally significant results were
found for specific variables related to number of years of teaching experience and
employment status and faculty ratings of use of Web 2.0 tools.. Faculty with 10-14 years
of teaching experience reported using image-based and video tools more frequently than
faculty with 20-24 years of teaching experience. More frequent use of image-based tools
by full-time non-tenured faculty than full-time tenured faculty was also a marginally
significant finding. Age of faculty produced no statistically significant results related to
frequency of use of any of the four Web 2.0 tools. Similar findings were noted for years
of teaching experience and use of text-based and audio tools. Employment status also
had no effect on faculty use of audio or video tools.
Significant findings were reported for number of years of teaching experience,
primary teaching discipline, and employment status, and faculty ratings of effectiveness
of the four Web 2.0 tools. Faculty members with 25-29 years of experience rated the
effectiveness of text-based tools higher than those with 30 or more years of experience.
Faculty with 10-14 years of experience rated video tools as more effective than faculty
with 15-19 or 20-24 years of experience. Education faculty had a significantly higher
iv
rating for effectiveness of text-based tools than Biological Sciences or Physical Sciences
faculty. Adjunct/part-time faculty rated the effectiveness of text-based tools significantly
higher than full-time tenure track and full-time tenured faculty. Ratings of effectiveness
of audio tools by Arts & Humanities faculty were marginally higher than ratings of
effectiveness by Physical Sciences faculty. No statistically significant findings were
observed for ratings of effectiveness for any of the Web 2.0 tools based upon age of
faculty members. Years of teaching experience did not impact ratings of effectiveness
for image-based or audio tools. Primary teaching discipline had no impact on faculty
ratings of effectiveness of image-based or video tools. No statistically significant results
were noted for faculty employment status and ratings of effectiveness of image-based,
audio, or video Web 2.0 tools.
The findings of this study may be used by higher education academic and
technology leaders to better understand faculty use and perceived effectiveness of four
Web 2.0 technology tools. The results could also be valuable to state legislators as they
consider the impact of the digital divide in higher education. Finally, donors interested in
funding technology innovation related to instruction in higher education classrooms may
be interested in the challenges related to faculty adoption and use of technology.

v
Dedication
To my husband, Brad, and our daughters Katie and Sami, thank you for your love
and support. You pushed me each day to achieve my goals. To my mother and father
(Kenneth and Fern Jett), for instilling in me a work ethic that has provided me with
enumerable opportunities and tremendous fulfillment in my life and work.

vi
Acknowledgements
The support of my fellow cohort classmates has been invaluable in this journey.
Always a phone call, a text, a friendly sign of support each day gave me the inspiration to
complete this work. The scope of my learning came so much from your voices and
examples.
I especially want to acknowledge my family as they allowed me time away from
home on class nights and evenings and weekends that I worked on my course work and
dissertation. Your desire to see me accomplish this milestone gave me the push to do this
not just for me but for all of us. I have to thank those who have inspired me to grow as a
leader – Dr. Pat Long, Dr. Susan Lindahl, Dr. Lynne Murray, Dr. Emily Ford, Dr. Cassy
Bailey, Dr. Theresa Clouch, Dr. Peg Waterman, and Dr. Marcus Childress. Most of all I
have to thank Dr. Tes Mehring for being my major advisor, my mentor, my colleague and
my friend. Her daily encouragements, especially when my procrastination was in full
force, helped me to eventually see the finish line. I also must acknowledge the entire
Baker University community as they have been continuously encouraging me to
complete my degree.
vii
Table of Contents
Abstract ............................................................................................................................... ii
Dedication ............................................................................................................................v
Acknowledgements ............................................................................................................ vi
Table of Contents .............................................................................................................. vii
List of Tables .......................................................................................................................x
Chapter 1: Introduction ........................................................................................................1
Background ..............................................................................................................2
Statement of the Problem .........................................................................................4
Purpose of the Study ................................................................................................5
Significance of the Study .........................................................................................6
Delimitations ............................................................................................................6
Assumptions .............................................................................................................7
Research Questions ..................................................................................................7
Definition of Terms................................................................................................11
Organization of the Study ......................................................................................13
Chapter 2: Review of the Literature ...................................................................................14
Overview of Technology Advances in Education .................................................14
Challenges with Integration and Implementation of Technology in the
Classroom ..............................................................................................................19
Growth and Current State of Educational Technologies .......................................22
Summary ................................................................................................................23
Chapter 3: Methods ............................................................................................................24

viii
Research Design.....................................................................................................24
Selection of Participants ........................................................................................24
Measurement ..........................................................................................................25
Data Collection Procedures ....................................................................................29
Data Analysis and Hypothesis Testing ..................................................................30
Limitations .............................................................................................................43
Summary ................................................................................................................44
Chapter 4: Results ..............................................................................................................45
Hypothesis Testing.................................................................................................45
Summary ................................................................................................................81
Chapter 5: Interpretation and Recommendations ..............................................................82
Study Summary ......................................................................................................82
Overview of the problem ...........................................................................82
Purpose statement and research questions .................................................83
Review of the methodology .......................................................................83
Major findings ............................................................................................83
Findings Related to the Literature..........................................................................85
Conclusions ............................................................................................................85
Implications for action ...............................................................................85
Recommendations for future research .......................................................87
Concluding remarks ...................................................................................87
References ..........................................................................................................................89
Appendices .........................................................................................................................99

ix
Appendix A. Survey Instrument ..........................................................................100
Appendix B. Baker University IRB Approval .....................................................105
Appendix C. Email to CIOs and Directors of Instructional Technology at
KICA Institutions ...........................................................................107
Appendix D. Initial Invitation to Participate in the Survey .................................109
Appendix E. Reminder Invitation to Participate in the Survey ...........................111

x
List of Tables
Table 1. Descriptive Statistics for the Test of H9 ..............................................................49
Table 2. Descriptive Statistics for the Test of H10 ............................................................50
Table 3. Descriptive Statistics for the Test of H11 ............................................................51
Table 4. Descriptive Statistics for the Test of H12 ............................................................52
Table 5. Descriptive Statistics for the Test of H13 ............................................................53
Table 6. Descriptive Statistics for the Test of H14 ............................................................54
Table 7. Descriptive Statistics for the Test of H15 ............................................................55
Table 8. Descriptive Statistics for the Test of H16 ............................................................56
Table 9. Descriptive Statistics for the Test of H17 ............................................................57
Table 10. Descriptive Statistics for the Test of H18 ..........................................................59
Table 11. Descriptive Statistics for the Test of H19 ..........................................................60
Table 12. Descriptive Statistics for the Test of H20 ..........................................................61
Table 13. Descriptive Statistics for the Test of H21 ..........................................................62
Table 14. Descriptive Statistics for the Test of H22 ..........................................................63
Table 15. Descriptive Statistics for the Test of H23 ..........................................................64
Table 16. Descriptive Statistics for the Test of H24 ..........................................................65
Table 17. Descriptive Statistics for the Test of H25 ..........................................................66
Table 18. Descriptive Statistics for the Test of H26 ..........................................................67
Table 19. Descriptive Statistics for the Test of H27 ..........................................................68
Table 20. Descriptive Statistics for the Test of H28 ..........................................................69
Table 21. Descriptive Statistics for the Test of H29 ..........................................................70
Table 22. Descriptive Statistics for the Test of H30 ..........................................................71

xi
Table 23. Descriptive Statistics for the Test of H31 ..........................................................72
Table 24. Descriptive Statistics for the Test of H32 ..........................................................73
Table 25. Descriptive Statistics for the Test of H33 ..........................................................74
Table 26. Descriptive Statistics for the Test of H34 ..........................................................75
Table 27. Descriptive Statistics for the Test of H35 ..........................................................76
Table 28. Descriptive Statistics for the Test of H36 ..........................................................77
Table 29. Descriptive Statistics for the Test of H37 ..........................................................78
Table 30. Descriptive Statistics for the Test of H38 ..........................................................79
Table 31. Descriptive Statistics for the Test of H39 ..........................................................80
Table 32. Descriptive Statistics for the Test of H40 ..........................................................81

1
Chapter 1
Introduction
Web 2.0 tools are now becoming a ubiquitous part of people’s everyday lives at
home, work, and school. The question higher education institutions must address is
whether the student experience in university classrooms matches the student’s digital
lifestyle.
Today’s learners are increasingly accustomed to living in a digital, globalized,
pluralistic world that is oriented around a vast array of information technologies,
the Web, and mobile communications. It is therefore important for higher
education institutions to learn to adapt to this postindustrial world in ways that
meet the needs and realities of today’s learners. (Blessinger & Wankel, 2012, p.
4)
Corey noted in 2012 that the gap between faculty use of technology in the classroom and
the student’s expected experience is often due to the difference between faculty coming
from an ‘analog age’ and students who are from the ‘digital age’.
Some universities have developed strategies to encourage the use of Web 2.0
tools, but they have been developed by personnel in the technology department and not
by faculty from academic areas within the higher education institution (Long, 2017). In
order for the tools to become integrated into the classroom, whether on-ground or online,
the faculty must see the value of the tool and the tool must be easy and convenient to use.
Faculty involvement in the planning, training, and implementation phases may
significantly improve the success of any academic technology plan (Hall, 2013). Brack,
Samarawickrema, and Benson (2005) defined effective teaching with technology as

2
understanding of the learning and teaching principles, application of those principles with
technologies available, and then the faculty themselves building the skills needed to use
those technologies. Wankel and Blessinger (2012) continued the focus by making it clear
that technology should be used in the classroom with a purpose or objective in mind, not
simply to use the technology. With those considerations in mind, this research study
evaluated how faculty perceived the effectiveness of Web 2.0 tools in supporting
teaching and learning in face-to-face classroom settings.
Background
In 1944 the first computer was used to create flight simulation for training of
pilots at Massachusetts Institute of Technology (MIT) (Everett, 1980). In 1965, the first
handheld calculator was invented by Texas Instruments (Hamrick, 1996). In 1977 the
first personal computers were introduced in P-12 schools (Anderson, 1984). Fabry and
Higgs (1997) noted that by 1981 18% of U.S. public schools had one or more computers
for instruction and just 10 years later there was one computer per every 18 students in P-
12 schools (p. 387). In 1997 the technology trend exploded into higher education as 78%
of public four-year higher education institutions offered distance learning programs
(Reiser, 2001). By 2007, nearly 1 in 5 college students enrolled in at least one online
course (Allen & Seaman, 2008, p. 3).
The concept of Web 2.0 was originally shared as a definition of how web pages
transitioned from being static and one-dimensional to being interactive and collaborative
(Constantinides & Fountain, 2008). In 2006, Alexander noted that the change that moved
the environment to Web 2.0 was not as important as what could now be done with this
improved technology. Grosseck (2009) noted how Web 2.0 was just one of many

3
advancements related to the internet and that the evolution of these web enabled
classroom tools has far outpaced the integration of the tools into teaching in higher
education classrooms. Ellis (2009) made that same point by noting that the traditional
lecture environment was transforming beyond the walls of the classroom and more
learning and sharing of knowledge was happening online. In 2009, Kim,Yue, Hall, and
Gates attempted to define and give examples of the then quickly expanding concept of
Web 2.0. In their study they gave examples of Web 2.0 applications from the areas of
business, education, and social life. The Kim et al. (2009) definition of Web 2.0
applications focused on the ideas of the real time participatory and social nature of the
technologies and how this interactivity brings the usage of computers, the internet, and
mobile devices into play in all areas of our lives. In 2010, Bower, Hedberg, and Kuswara
discussed a framework that leveraged current pedagogies and taxonomies with the
emerging technologies surrounding the Web 2.0 movement in the academic realm. The
framework highlighted how technology was simply a tool that helped bring pedagogy and
the content together to create better learning outcomes for students.
Like many new ideas, if the idea does not create significant value, it is difficult to
find the investment of time and money. Educational technology blends both accessibility
to information and interactivity with that information along with the ability to track the
effectiveness of that interactivity. With that value proposition it is not surprising that
investment into educational technologies has grown significantly. Ed Tech (2016)
summarized a CB Insights (2015) report that indicated global education technology
funding had grown from $144 million in 2011 to $1.3 billion in 2015. In 2018, Shulman
reported that educational technology investments had reached $9.5 billion dollars. That
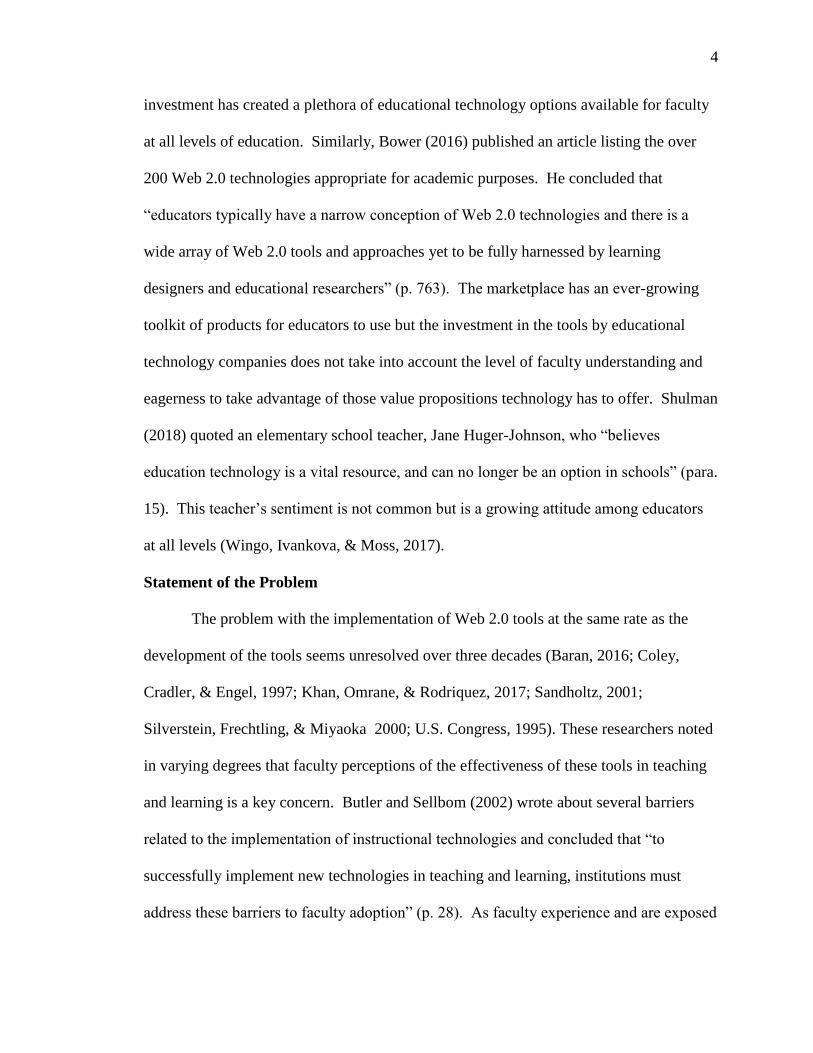
4
investment has created a plethora of educational technology options available for faculty
at all levels of education. Similarly, Bower (2016) published an article listing the over
200 Web 2.0 technologies appropriate for academic purposes. He concluded that
“educators typically have a narrow conception of Web 2.0 technologies and there is a
wide array of Web 2.0 tools and approaches yet to be fully harnessed by learning
designers and educational researchers” (p. 763). The marketplace has an ever-growing
toolkit of products for educators to use but the investment in the tools by educational
technology companies does not take into account the level of faculty understanding and
eagerness to take advantage of those value propositions technology has to offer. Shulman
(2018) quoted an elementary school teacher, Jane Huger-Johnson, who “believes
education technology is a vital resource, and can no longer be an option in schools” (para.
15). This teacher’s sentiment is not common but is a growing attitude among educators
at all levels (Wingo, Ivankova, & Moss, 2017).
Statement of the Problem
The problem with the implementation of Web 2.0 tools at the same rate as the
development of the tools seems unresolved over three decades (Baran, 2016; Coley,
Cradler, & Engel, 1997; Khan, Omrane, & Rodriquez, 2017; Sandholtz, 2001;
Silverstein, Frechtling, & Miyaoka 2000; U.S. Congress, 1995). These researchers noted
in varying degrees that faculty perceptions of the effectiveness of these tools in teaching
and learning is a key concern. Butler and Sellbom (2002) wrote about several barriers
related to the implementation of instructional technologies and concluded that “to
successfully implement new technologies in teaching and learning, institutions must
address these barriers to faculty adoption” (p. 28). As faculty experience and are exposed

5
to technology tools by peers and students, instructors must focus their training on
opportunities that provide for better learning environments that they control. It is a
combination of the faculty member, the technology team, the demand from the students,
and the university’s strategic goals that will create an opportunity for greater success with
the use of Web 2.0 tools.
With mounting expectations from digital era students and the value proposition as
seen in the investment by technology companies, research is needed to find the reasons
these technologies have not been implemented by higher education faculty. In order to
have a better understanding of faculty willingness to learn and implement technologies in
the classroom, there is a need to better understand faculty usage of Web 2.0 technologies.
Beyond usage it is also important to determine the perceptions of faculty about the
effectiveness of Web 2.0 technologies as teaching tools. The relationships between
faculty perceptions of the technology, age of faculty members, number of years teaching
in higher education, teaching discipline, faculty rank, and employment status may
provide pertinent information related to the use of technologies applied to instruction in
higher education settings.
Purpose of the Study
The first purpose of the current study was to determine faculty usage of text-
based, image-based, audio, and video technology applications as teaching tools. A
second purpose of the study was to investigate faculty perceptions about the effectiveness
of these technologies as teaching tools. A third purpose was to examine if there were
relationships between faculty demographics (age, years of teaching experience in higher
education, teaching discipline, and employment status) and faculty usage of Web 2.0

6
technologies. A final purpose was to examine if there were relationships between faculty
demographics (age, years of teaching experience in higher education, teaching discipline,
and employment status) and perceived effectiveness of Web 2.0 technologies.
Significance of the Study
The results of this study may be of interest to university academic leaders and
faculty as they consider how faculty demographics impact the implementation of
classroom technologies. Higher education technology professionals could use the results
from this study to better understand how training and change management efforts impact
classroom technology implementation. The results could also be valuable to state
legislators as they consider the impact of the digital divide in higher education. Finally,
donors interested in funding technology innovation related to instruction in higher
education classrooms may be interested in the challenges related to faculty adoption and
use of technology.
Delimitations
Lunenburg and Irby (2008) defined delimitations as “factors that may have an
effect on the interpretation of the findings or on the generalization of the results” (p. 133).
This study was completed by surveying full-time tenured, full-time tenure track, non-
tenure track, and adjunct/part-time faculty at 19 private 4-year colleges and universities
in the state of Kansas. Collecting the data from one state or region may influence the
generalization of findings to faculty at universities in other states or regions. The
researcher did not take into account the current level of knowledge or training in the use
of Web 2.0 technologies.

7
Assumptions
“Assumptions are postulates, premises, and propositions that are accepted as
operational for purposes of the research” (Lunenburg & Irby, 2008, p. 135). This study
included the following assumptions:
Faculty in the study had experience teaching in higher education
classrooms.
Faculty who completed the survey were aware of Web 2.0 classroom
technologies.
Faculty understood survey questions and provided honest responses.
All data used for this study were accurately collected and recorded into a
database.
Research Questions
The following research questions guided this study:
RQ1. To what extent do faculty use text-based tools?
RQ2. To what extent do faculty use image-based tools?
RQ3. To what extent do faculty use audio tools?
RQ4. To what extent do faculty use video tools?
RQ5. To what extent do faculty rate text-based tools as effective?
RQ6. To what extent do faculty rate image-based tools as effective?
RQ7. To what extent do faculty rate audio tools as effective?
RQ8. To what extent do faculty rate video tools as effective?
RQ9. To what extent is there a difference in faculty use of text-based tools
based on age (25-34, 35-44, 45-54, 55-64, 65-74, 75 and older)?

8
RQ10. To what extent is there a difference in faculty use of image-based
tools based on age (25-34, 35-44, 45-54, 55-64, 65-74, 75 or older)?
RQ11. To what extent is there a difference in faculty use of audio tools
based on age (25-34, 35-44, 45-54, 55-64, 65-74, 75 or older)?
RQ12. To what extent is there a difference in faculty use of video tools
based on age (25-34, 35-44, 45-54, 55-64, 65-74, 75 or older)?
RQ13. To what extent is there a difference in faculty use of text-based
tools based on number of years of teaching experience (0-5, 5- 9, 10-14, 15-19, 20-24,
25-29, or 30 or more)?
RQ14. To what extent is there a difference in faculty use of image-based
tools based on number of years of teaching experience (0-5, 5- 9, 10-14, 15-19, 20-24,
25-29, or 30 or more)?
RQ15. To what extent is there a difference in faculty use of audio tools
based on number of years of teaching experience (0-5, 5- 9, 10-14, 15-19, 20-24, 25-29,
or 30 or more)?
RQ16. To what extent is there a difference in faculty use of video tools
based on number of years of teaching experience (0-5, 5- 9, 10-14, 15-19, 20-24, 25-29,
or 30 or more)?
RQ17. To what extent is there a difference in faculty use of text-based
tools based on the primary teaching discipline (Arts & Humanities, Biological Sciences,
Business, Education, Engineering, Physical Sciences, Other Professions, Social Sciences,
or Other Disciplines)?

9
RQ18. To what extent is there a difference in faculty use of image-based
tools based on the primary teaching discipline (Arts & Humanities, Biological Sciences,
Business, Education, Engineering, Physical Sciences, Other Professions, Social Sciences,
or Other Disciplines)?
RQ19. To what extent is there a difference in faculty use of audio tools
based on the primary teaching discipline (Arts & Humanities, Biological Sciences,
Business, Education, Engineering, Physical Sciences, Other Professions, Social Sciences,
or Other disciplines)?
RQ20. To what extent is there a difference in faculty use of video tools
based on the primary teaching discipline (Arts & Humanities, Biological Sciences,
Business, Education, Engineering, Physical Sciences, Other Professions, Social Sciences,
or Other Disciplines)?
RQ21. To what extent is there a difference in faculty use of text-based
tools based on employment status (full-time tenured, full-time tenure track, full-time non-
tenure track, or adjunct/part-time)?
RQ22. To what extent is there a difference in faculty use of image-based
tools based on employment status (full-time tenured, full-time tenure track, full-time non-
tenure track, or adjunct/part-time)?
RQ23. To what extent is there a difference in faculty use of audio tools
based on employment status (full-time tenured, full-time tenure track, full-time non-
tenure track, or adjunct/part-time)?
RQ24. To what extent is there a difference in faculty use of video tools

10
based on employment status (full-time tenured, full-time tenure track, full-time non-
tenure track, or adjunct/part-time)?
RQ25. To what extent is there a difference in how the effectiveness of
text-based tools is rated based on age?
RQ26. To what extent is there a difference in how the effectiveness of
image-based tools is rated based on age?
RQ27. To what extent is there a difference in how the effectiveness of
audio tools is rated based on age?
RQ28. To what extent is there a difference in how the effectiveness of
video tools is rated based on age?
RQ29. To what extent is there a difference in how the effectiveness of
text-based tools is rated based on the number of years of teaching experience?
RQ30. To what extent is there a difference in how the effectiveness of
image-based tools is rated based on the number of years of teaching experience?
RQ31. To what extent is there a difference in how the effectiveness of
audio tools is rated based on the number of years of teaching experience?
RQ32. To what extent is there a difference in how the effectiveness of
video tools is rated based on the number of years of teaching experience?
RQ33. To what extent is there a difference in how effectiveness of text
based tools is rated based on the primary teaching discipline?
RQ34. To what extent is there a difference in how effectiveness of image-
based tools is rated based on the primary discipline?
RQ35. To what extent is there a difference in how the effectiveness of

11
audio tools is rated based on the primary discipline?
RQ36. To what extent is there a difference in how the effectiveness of
video tools is rated based on the primary discipline?
RQ37. To what extent is there a difference in how the effectiveness of
text-based tools is rated based on employment status?
RQ38. To what extent is there a difference in how the effectiveness of
image-based tools is rated based on employment status?
RQ39. To what extent is there a difference in how the effectiveness of
audio tools is rated based on employment status?
RQ40. To what extent is there a difference in how the effectiveness of
video tools is rated based on employment status?
Definition of Terms
Several terms used with this study may have different definitions in other
contexts. Definition of terms as utilized in this study is provided for clarity.
Employment status: After the faculty lists from the universities being surveyed
were reviewed, these common differentiations in faculty employment status were
identified for the current study: full-time tenured, full-time tenure track, full-time non-
tenure track, and adjunct/part-time.
Discipline categories. Academic discipline categories used in this study
replicated those used in the Faculty Survey of Student Engagement administered by
Indiana University (Indiana University, 2018.). The Indiana University study included
the following discipline categories: Arts & Humanities (Art, English, History,
Journalism, Language, Literature, Music, Philosophy, Speech, Theater, Theology ),

12
Biological Sciences (Biology, Biochemistry, Botany, Environmental Science, Life
Science), Business (Accounting, Business Administration, Finance, International
Business, Marketing, Management), Education (Business Education, Elementary
Education, Secondary Education, Music Education, Physical Education, Special
Education), Engineering (Aeronautical, Civil, Chemical, Electrical, Industrial, Materials,
Mechanical), Physical Sciences (Astronomy, Atmospheric, Chemistry, Earth Science,
Mathematics, Physics, Statistics), Other Professions (Architecture, Urban Planning,
Health Technology, Law, Library Science, Medicine, Dentistry, Veterinarian, Nursing,
Pharmacy, Allied Health, Therapy), Social Sciences (Anthropology, Economics, Ethic
Studies, Geography, Political Science, Psychology, Social Work, Sociology, Gender
Studies), Other Disciplines (Agriculture, Communications, Computer Science, Family
Studies, Conservation, Kinesiology, Criminal Justice, Military Science, Sports
Management, Public Administration, Technical/Vocational).
Kansas Independent Colleges Association (KICA). Membership in this
organization includes 19 private universities in the State of Kansas: Baker University,
Benedictine College, Bethany College, Bethel College, Central Christian College of
Kansas, Cleveland University- Kansas City, Donnelly College, Friends University,
Hesston College, Kansas Wesleyan University, Manhattan Christian College, McPherson
College, MidAmerica Nazarene University, Newman University, Ottawa University,
Southwestern College, Sterling College, Tabor College, and University of Saint Mary
(Lindsey, 2018).
Web 2.0 tools. In an effort to narrow the multiplicity of Web 2.0 tools to a
manageable number for the purpose of this study, the researcher relied on research

13
published by Bower (2016). Bower distilled over 200 examples of Web 2.0 tools
appropriate for use in academic settings into 14 categories. The current study focused on
the first four of those categories.
-Text-based tools: Synchronous text discussion, discussion forums, note-taking
and document creation
- Image-based tools: Image sharing, image creation and editing, drawing, online
white boarding, diagramming, mind mapping, word clouds
-Audio tools: Audio sharing, audio creation and editing
- Video tools: Video sharing, video creation and editing, video streaming
Organization of the Study
This research study is organized in five chapters. Chapter 1 included the
background, statement of the problem, purpose of the study, significance of the study,
delimitations, assumptions, research questions, and definitions of terms. Chapter 2
examines a review of literature related to technology tools in the academic setting,
challenges with integration and implementation of technology in the classroom, and the
current growth and state of the educational technology industry. Chapter 3 presents the
research design for this study, selection of participants, measurement, data collection
procedures, data analysis and hypotheses testing, and limitations. Chapter 4 includes the
results of the hypothesis testing. Chapter 5 presents a study summary, findings related to
literature, and conclusions.

14
Chapter 2
Review of Literature
This chapter is organized into three sections and presents a review of the literature
relevant to educational technology in education. The first section provides an overview
of the advances technology has made and how the changes have impacted the education
industry. The second section reviews the current challenges that organizations face with
the implementation of educational technologies. The third section discusses the growth
and current status of the educational technology industry.
Overview of Technology Advances in Education
When the first teachers moved from sharing knowledge via speeches and oratory
to writing the information down, this began a series of changes in how teaching and
learning occurred in classrooms across the ages. One of the first known changes was the
introduction of an item called a ‘hornbook’ sometime in the 1400’s. A hornbook was a
small wooden paddle with lessons attached and then passed around the room for students
to see, read, memorize and then perform lessons from each day (Plimpton, 1916). In
1870 came the ‘magic lantern’ that projected images from glass plates onto walls in dark
classrooms. These devices were made functional by using oil lamps or candles
(Akanegbu, 2013). In 1870, before the turn of the century, came the introduction of the
‘school slate’ which allowed sharing of lessons (Dunn, 2011). Students could provide
responses or practice the lesson and teachers could grade responses. At the same time the
small school slate was replicated in a much larger sense and chalkboards were hung up in
almost every classroom giving teachers yet another tool to change how they shared
information. Just a decade later the pencil was introduced and replaced the school slate.

15
Looking at these antiquated tools it may seem a stretch to call them technological
advancements in education but each of these presented the teaching professionals at the
time both an opportunity and challenge in how to utilize these tools to improve the
education process for the students.
Cuban (1986) provided a Thomas Edison quotation to illustrate another
technology that impacted student learning:
I believe that the motion picture is destined to revolutionize our educational
system and that in a few years it will supplant largely, if not entirely, the use of
textbooks. I should say that on the average we get about two percent efficiency
out of school books as they are written today. The education of the future, as I see
it, will be conducted through the medium of the motion picture…where it should
be possible to obtain one hundred percent efficiency. (p. 1)
Cuban noted that Edison’s statement was indicative of how technological advances were
seen as opportunities for improvements in teaching and learning. These changes have not
always been viewed as positive nor have they been fully embraced by the academic
communities involved. Edison was referring to motion pictures that then led to the film
projector and radios being adopted for instructional purposes in classrooms starting in
1925, the overhead projector in 1930, the ballpoint pen in 1940, the mimeograph machine
in 1940, headphones in 1950, and videotapes in 1951 (Dunn, 2011). In 1957 the Skinner
Teaching Machine came along to help students study at their own pace (Dunn, 2011). In
the October 1958 edition of Science, Skinner stated, “If our current knowledge of the
acquisition and maintenance of verbal behavior is to be applied to education, some sort of
teaching machine is needed” (p. 969). Innovation comes out of the necessity or curiosity

16
to do things better. The introduction of these technologies continued to happen at an
exponential pace. The 1970’s brought forward the handheld calculator and the Scantron
machine (Dunn, 2011). In 1980, the first computers were introduced in public schools
(Dunn 2011). In 1984 there was one computer per 92 students (Cuban, 1986). Singer
(2017) stated that by 2017, K-12 and higher education were rolling out one-to-one
programs that equipped every student with a laptop or tablet. As each of these
technological advances occurred, they continued to put pressure on the academy to find
appropriate applications in teaching and learning.
By 2018, classrooms had not changed much on college campuses even as
technology raced forward. Chalkboards have been replaced with whiteboards, and film
projectors and overhead projectors have been replaced with high-end monitors or
projection devices connected to laptops or tablets (Dunn, 2011). Haran (2015) noted that
students have moved from paper and pencil note taking to recording classroom sessions
on their phone or tablet. Some schools provide lecture capture so students can re-watch
or catch up on class sessions at a later time (Hall & Ivaldi, 2017). Conversations about
modality of teaching are as common as the development of the lessons themselves.
Faculty not only have to assure an effective learning pedagogy is in place but also have to
create multiple modifications to accommodate the growing number of ways learners are
engaging in learning on college campuses (Sankey & Hunt, 2017). Online, blended,
active learning, and project-based learning are examples of the teaching models used on
today’s college campuses. The list of teaching models in the current educational
landscape is driven more and more around the technology that is changing expectations
of effectiveness and efficiency (Keengwe & Kidd, 2010). As the cost of education

17
continues to increase at all levels, political and societal pressures continue to build to
deliver quality at lower and lower costs, in shorter time frames, and with direct
connections between curriculum and job skills (Morris, 2018; Ripley, 2018). The pace of
the change in technology has far outpaced faculty appreciation for and ability to use these
technologies (Becker et al., 2018; Collins & Halverson, 2018).
The challenge since the introduction of the hornbook in the 1400s seems to be a
struggle between the academy, teaching innovations, and eventually technology adoption.
Cuban (1986) described the historical perspective of how changes in technology have
impacted the academic experience,
The search for improving classroom productivity through technological
innovations has yielded very modest change in teacher practice without any clear
demonstration that instruction is any more effective or productive after the
introduction of radio, films, instructional television, or computers. Implicit in this
history is that policy makers determined to modify classroom practice need to be
well informed. They need to understand clearly that what gives stability to
teaching is a classroom universe tightly coupled to organizational settings.
Teacher repertories, both resilient and efficient, have been shaped by the crucible
of experience and the culture of teaching. Policy makers need to understand that
altering pedagogy requires a change in what teachers believe. (Epilogue, para. 15)
Cuban highlighted the struggle between academic theories on pedagogy and the desire to
insert technology as a tool in the delivery of education. He may not have known then just
how much change was about to occur. In 2004, Fahmy concluded,

18
Technology and technological applications are, indeed, a continuous process that
dates way back in our human history. Every time a new technology comes
around, a process of change accompanies its implementation. Higher education,
like any other sector of society, is affected by technology applications and always
races to institute the necessary changes to implement it. (p. 57)
Kim and Bonk (2006) shared that not only was there huge demand from students
for the use of online technologies for the delivery of education but there was growing
evidence that blended learning (use of face to face and technology) was becoming an
important part of the academic landscape. Venkatesh, Croteau, and Rabah (2014) studied
effective use of technology in higher education classrooms and stated,
Results from the review of 300 studies measuring the effect of blended learning
on students’ experience indicate that students tend to respond in an
overwhelmingly positive fashion to the integration of ICT (information and
communication technology) in higher education classrooms. (p. 112)
A shift in the use of technology happened and change continues to challenge the
pedagogy of faculty in all disciplines.
In a 2018 study on blended learning, Dziuban, Graham, Moskal, Norberg and
Sicilia discussed how the use of technologies to deliver education is no longer an
expectation but rather the new norm by which students now compare all other more
traditional demands include content relevance, communication of instructor, etc.
Students believe their success in the classroom is inextricably tied to the quality and use
of the technology provided.

19
Change is now the norm. Technology has had a transformational impact on all
aspects of teaching and learning. The challenges at each step in this evolution have
focused on the impact technology has had on the student and faculty. Whether or not
faculty have embraced these changes is directly correlated to the success of technology
use in the classroom.
Challenges with Integration and Implementation of Technology in the Classroom
One of the greatest obstacles to implementing new technologies in the classroom
is the faculty. This is exemplified in a statement from Lockwood (1996),
A university is founded on its faculty. In isolation, technology allows nothing
more than a shallow transfer of facts without the essential context of time, place,
and person….and so, I would sound a warning – given the downsizing of
American university budgets, we need to direct greater resources into faculty, not
gadgetry. (p. 73)
In contrast, Moseley (2010) concluded,
Technology is useful, and frequency of use is related to the degree of usefulness.
This study shows a strong perception among faculty and students that technology
is used for learning, and that the more frequently technology is used, the more
useful it becomes. (p. 121)
Georgina and Hosford (2009) noted, “Technology alone does nothing to enhance
pedagogy; successful integration is all about the ways in which technology tools are used
and integrated into teaching” (p. 695). Each of the above statements highlights the
importance of defining the value of both the art of teaching and the technology itself.

20
As with any change, the pace of that change is typically incremental rather than a
big bang transition. Research has provided evidence for evaluating both pros and cons of
technology in classroom settings. Keengwe (2007) investigated the integration of
technology to improve learning and drew the conclusion that students were not trained
well enough in the technologies they were expecting to use in the classroom. Ten years
later that sentiment is still strong among faculty. Pomerantz and Brooks (2017) found
faculty only believe that half of students are prepared for use of technology and similarly
only half the students found they were prepared for use of these same technologies. Ajjan
and Hartshorne (2008) investigated faculty choices in using technology and concluded
that if university leaders want to see increased use of technology in the classroom they
must “focus their attention, efforts, and investments on improving faculty attitude…more
specifically, these efforts should focus on improving the perceived usefulness, ease of
use, and compatibility” (p. 79). This finding was supported by Brooks (2015) who stated,
“faculty claim that they would adopt technology more if they had evidence of its impact
on student learning” (p. 5). Hickson (2017) found in the study of faculty integration of
technology that, “technology training may be better served to focus on providing
information as to how the technologies might impact the classroom, as opposed to
teaching basic use of the technologies” (p. 95). Sawyer (2017) concluded, “It is possible
that professional development efforts that consider underlying perceptions may be more
effective at implementing programs” (p. 75).
There is often concern that implementation of technology will not come with
appropriate investments in facilities, technology, and training. Buchanan, Sainter and
Sanders (2013) concluded that if higher education institutions want to see an increased

21
use of technology in classrooms, administrators must not only train and support faculty
but have proper levels of investments in technical infrastructure to support the use of
these tools. King (2017) recommended,
Institutions should develop a clear vision and strategic plan for the use of
technology to enable learning that encourages participation by instructors,
students, technology providers and external stakeholders…Presidents and senior
academic and technology decision makers should work together to set a clear
vision and goals that views technology as an opportunity to augment learning. (p.
67)
Still these challenges have not stopped the push to implement more and more
technological tools in the classroom. Right or wrong, the push by politicians, corporate
leaders, administrators, and of course educational technology companies to make more
and more investments in these areas has grown exponentially. Daher and Lazarevic
(2014) concluded in their study of the use of Web 2.0 tools at a Midwestern community
college found that faculty do believe that Web 2.0 tools can create positive learning
opportunities in the classroom (p.49). Ringstaff and Kelley (2002) noted,
Debates aside, there is a substantial body of research that suggests that technology
can have a positive effect on student achievement under certain circumstances and
when used for certain purposes. However, there is no magic formula that
educators and policymakers can use to determine if this “return” is actually worth
the investment. (p. 24)
Interestingly, research has indicated that students and faculty are quickly catching
up with that growth in educational technology applications. More and more courses and

22
academic programs have transitioned to instruction offered online and/or using a blended
or hybrid instructional format (Babson Survey Research Group, 2017). Bakia, Means,
and Murphy (2014) noted that the terminology of blended or hybrid learning has now
come to be defined as “encompasses all of the middle ground in the spectrum between
fully face-to-face and fully online instruction” (p. 7). With that understanding, the
research by Pomerantz, Brown, and Brooks (2018) showed the majority of students and
faculty prefer to teach and learn in a blended environment. With the growth of blended
learning environments, the job of addressing the issues of investment, training, and
pedagogical impact continues to be important for higher education academic and
administrative leaders.
Growth and Current State of Educational Technologies
Schaffhauser (2018) reported that global investments in educational technologies
had grown by 46% since 2015 and would reach over $9 billion dollars. This number was
for private investment in education technology companies and did not include all the
dollars spent on investment in the products. This growth in investments in educational
technologies is in the U.S. market and almost every industrialized country, with giant
leaps in investment from countries like China and India. In 2016, Boston Consulting
Group reported, “97% of investments (between 2011 and 2015) were concentrated in five
countries” (p. 2). Those countries were the United States with $10.1 billion dollars,
China with $1.2 billion dollars, India with $600 million dollars, Canada with $400
million dollars, and the United Kingdom with $200 million dollars. The Boston
Consulting Group also shared that the largest segment of that market was multimedia
content delivery and platforms with 343 companies. This type of investment, whether at

23
a global scale or locally, has implications related to access to all the infrastructure needed
including bandwidth, classroom design, facility planning, and training of not just faculty
but a whole plethora of staff to support these new tools. Georgina and Olson (2008) in a
study of higher education faculty perceptions on technology stated, “The new goal in
higher education now seems to be the creation of a university-wide professoriate in both
information literacy and technology literacy” (p. 8). In 2017, King noted,
For any technology solution to have a transformative impact on student learning
and success, it must have as its foundation the specific goals, needs, and interests
of the students themselves. While technology can be added to existing structures
with the goal of making them marginally more efficient and flexible, technology
also offers the opportunity to catalyze more significant reforms to educational
structures and practices. (p. 9)
Summary
Chapter 2 reviewed relevant literature related to technology in the classroom
including advances technology has made and how changes have impacted the education
industry. This chapter also summarized current challenges organizations face with the
implementation of education technologies, and the growth and current status of the
educational technology industry. Chapter 3 includes the research design, selection of
participants, measurement, data collection procedures, data analysis and hypothesis
testing, and limitations of the current study.

24
Chapter 3
Methods
This research study focused on the use of Web 2.0 technologies by Kansas private
four-year college and university faculty members. This study also investigated faculty
members’ perceptions about the effectiveness of Web 2.0 tools on teaching and learning.
This chapter includes a description of the research design, selection of participants,
measurement, data collection procedures, data analysis and hypothesis testing, and
limitations.
Research Design
A quantitative descriptive survey research design was chosen for the current
research study. The dependent variables included in the research study were whether the
faculty member used the Web 2.0 tools and faculty member perceptions of the Web 2.0
tools as effective teaching and learning tools. The independent variables included in the
research study were the faculty member’s age, years of teaching experience, primary
teaching discipline, and employment status.
Selection of Participants
The population for this research study was composed of private college and
university faculty within the United States. The sample for this research study consisted
of 1485 faculty at 19 member institutions within the Kansas Independent College
Association (KICA). Sampling was dependent upon the accessibility of the correct
contact information for the faculty members. Non-probability purposive sampling was
used for the current research study. The researcher specified the criteria used to locate
survey participants. The first established criterion for participation in the research study

25
was having a teaching role at the post-secondary level. The second established criterion
for participation in the research study was employment at one of the 19 member schools
within the KICA in 2019. The researcher obtained faculty emails by searching the online
employee directory from each institution. At the conclusion of the survey, 353 surveys
were completed which was 23.7% of the total eligible faculty respondents. Faculty from
18 of the 19 KICA institutions responded to the survey.
Measurement
The survey instrument used for this research study was developed by the
researcher. The survey questions included demographic data for the faculty member, a
list of Web 2.0 tool categories with examples of each (text-based, image-based, audio,
and video tools), questions asking the faculty member the extent to which specific Web
2.0 tools were used, and a rating of the faculty member’s perception of the effectiveness
of each Web 2.0 tool when used to teach students. The survey instrument is provided in
Appendix A.
The survey questions related to demographic data asked each participant to
provide the following: age (25-34, 35-44, 45-54, 55-64, 65-74, or 75 and older), years of
teaching experience (0-4, 5-9, 10-14, 15-19, 20-24, 25-29, or 30 or more years), teaching
discipline (Arts & Humanities, Biological Sciences, Business, Education, Engineering,
Physical Sciences, Other Professions, Social Sciences, Other Disciplines), and
employment status (full-time tenured, full-time tenure track, full-time non-tenure track,
and adjunct/part-time).
The list of Web 2.0 tool categories used in the survey was determined by the
researcher by reviewing current literature regarding educational technologies. From that

26
literature review the researcher utilized 4 of the set of 14 categories outlined in a study by
Bower (2015). The four categories used were listed on the survey with examples of Web
2.0 tools that fit into those categories. The first category included text-based tools that
allow for synchronous text discussion, discussion forums, note-taking, and document
creation. The second category listed image-based tools that allow for image sharing,
image creation and editing, drawing, online white boarding, diagramming, mind
mapping, and word clouds. The third category included audio tools that allow for audio
sharing, audio creation, and editing. The fourth category included video tools that allow
for video sharing, video creation, and editing or video streaming.
Survey items 1 through 5 were used to measure the independent variables regarding
the demographics of the participants.
Survey item 1 asked the participants to select the KICA institution where they
were currently employed. The list of KICA schools was summarized in Chapter
1.
Survey item 2 asked the participants to select the appropriate number range that
corresponded to their age. The choices were 25-34, 35-44, 45-54, 55-64, 65-74,
and 75 and older.
Survey item 3 asked the participants to select the appropriate range that
corresponded to the number of years of employment as a faculty member. The
choices were 0-4, 5-9, 10-14, 15-19, 20-24, 25-29, and 30 or more years.
Survey item 4 asked the participants to choose a primary discipline category for
teaching. The choices for each participant were Arts & Humanities, Biological
Sciences, Business, Education, Engineering, Physical Sciences, Other

27
Professions, Social Sciences, and Other Disciplines. Chapter 1 included detailed
descriptions of these discipline categories.
Survey item 5 asked the participants to select employment/faculty status. The
response options were full-time tenured, full-time tenure track, full-time non-
tenure track, and adjunct/part-time.
Survey items 7- 21 were used to measure the dependent variables regarding the
faculty use and perceived effectiveness of the Web 2.0 tool categories in teaching and
learning. The survey provided examples for each of the four Web 2.0 technology
categories and asked two separate questions. First the participants indicated responses on
a Likert-type scale by selecting extent of use of the particular technology as a teaching
tool in on-ground classes from 1 = never use, 2 = almost never,
3 = occasionally/sometimes, 4 = almost every time, or 5 = frequently use. Second the
participants indicated responses on a Likert-type scale by level of agreement to the
question of whether the tool was an effective teaching tool by answering, 1 = strongly
disagree, 2 = disagree, 3 = neither agree or disagree, 4 = agree, or 5 = strongly agree.
See Appendix A for the survey instrument used in the current research study.
Validity is the degree to which an instrument measures what it says it will
measure (Lunenburg & Irby, 2008). Evidence of content validity is commonly
determined by having an expert in the corresponding area judge the format and content of
the instrument (Fraenkel, Wallen, & Hyun, 2012). Five experienced higher education
Chief Information Officers served as members of an expert panel that evaluated the
format and content of the survey used for this research. This group reviewed the survey
instrument, and the categories and examples of Web 2.0 technologies. Panelists were

28
asked to review readability, word choice, and the comprehensiveness and appropriateness
of the survey questions. The dissertation major advisor and research analyst also
provided suggestions about the survey format and content. Those recommendations were
used to modify the survey tool. A more thorough explanation of the purpose of the
research study was added at the beginning of the survey. Explanations of each of the
categories and examples were made more explicit. Minor formatting changes were made
to make the survey more readable. Members of the expert panel found the survey to be
valid and appropriate.
A reliability analysis was not needed because a scale was not constructed from the
survey items. The researcher used single-item measurement of perceived effectiveness
and frequency of use.
Most commonly used single-item measures can be divided into two categories: (a)
those measuring self-reported facts... and (b) those measuring psychological
constructs, e.g., aspects of personality... measuring the former with single items is
common practice. However, using a single-item measure for the latter is
considered to be a “fatal error” in research. If the construct being measured is
sufficiently narrow or is unambiguous to the respondent, a single item may
suffice. (Sackett & Larson, 1990, p. 431)
The individual items used in this research were self-reported ratings that were sufficiently
narrow and unambiguous. Therefore, reliability was not an issue that needed to be
addressed.

29
Data Collection Procedures
Prior to data collection, an Institutional Review Board (IRB) request was
submitted to Baker University on December 11, 2018. The Baker University IRB
committee approved the research study on December 17, 2018 (see Appendix B).
The survey was created and managed through the use of an online survey tool
called FormStack, which is a survey service that assists in the development and
management of survey data. The survey items were typed into the FormStack tool and
the service provided a URL link to be sent out to each participant.
Before conducting research, the researcher obtained a list of faculty email
addresses at the 19 KICA schools by reviewing each university/college website directory.
The initial and subsequent emails regarding the survey were sent to the institution email
for each faculty member. Prior to the email blast to the faculty members, the researcher
reached out to the Chief Information Officer (CIO) or Director of Instructional
Technology at each of the schools to let them know that an email invitation to participate
in the study would be coming to the faculty (Appendix C). The email requested CIOs or
Directors to be aware that an email invitation would be forwarded to faculty in the near
future and to let faculty know the email was legitimate and not a spam effort. The initial
invitation to participate in the study was emailed to KICA faculty on January 30, 2019
(Appendix D). This email provided an overview of the study, informed consent, and
invited the recipient to participate by clicking on a link to the online survey instrument.
The informed consent information was provided in the email, but participants also
checked a box declaring understanding about participation, benefits, risks, and
confidentiality related to the study when they accessed the survey. Upon submission of

30
the survey participants were given a separate link to enter an email address for inclusion
in a drawing for a $100 Amazon Gift Card. The gift card was to be an incentive to
improve participation in the survey. Three reminder invitations to participate in the study
were sent within two weeks after the initial email to those who had not responded to the
initial invitation (Appendix E). The reminder emails shared similar information provided
in the initial email: a study overview, consent form, link to the survey instrument, and
reminder about the drawing. After the final deadline, data were retrieved from the
FormStack system for data analysis. Data from the FormStack survey were downloaded
and imported into IBM SPSS Statistics 25.0 for Windows.
Data Analysis and Hypothesis Testing
The following section includes the 40 research questions, the associated
hypotheses, and the analyses. A hypothesis was specified, and statistical analyses were
conducted to address each of the research questions.
RQ1. To what extent do faculty use text-based tools?
H1. Faculty are using text-based tools.
A one sample t test was conducted to test H1. The sample mean was compared
against a null value of 3. The level of significance was set at .05.
RQ2. To what extent do faculty use image-based tools?
H2. Faculty are using image-based tools.
A one sample t test was conducted to test H2. The sample mean was compared
against a null value of 3. The level of significance was set at .05.
RQ3. To what extent do faculty use audio tools?
H3. Faculty are using audio tools.

31
A one sample t test was conducted to test H3. The sample mean was compared
against a null value of 3. The level of significance was set at .05.
RQ4. To what extent do faculty use video tools?
H4. Faculty are using video tools.
A one sample t test was conducted to test H4. The sample mean was compared
against a null value of 3. The level of significance was set at .05.
RQ5. To what extent do faculty rate text-based tools as effective?
H5. Faculty rate text-based tools as effective.
A one sample t test was conducted to test H5. The sample mean was compared
against a null value of 3. The level of significance was set at .05.
RQ6. To what extent do faculty rate image-based tools as effective?
H6. Faculty rate image-based tools effective.
A one sample t test was conducted to test H6. The sample mean was compared
against a null value of 3. The level of significance was set at .05.
RQ7. To what extent do faculty rate audio tools as effective?
H7. Faculty rate audio tools as effective.
A one sample t test was conducted to test H7. The sample mean was compared
against a null value of 3. The level of significance was set at .05.
RQ8. To what extent do faculty rate video tools as effective?
H8. Faculty rate video tools as effective.
A one sample t test was conducted to test H8. The sample mean was compared
against a null value of 3. The level of significance was set at .05.

32
RQ9. To what extent is there a difference in faculty use of text-based tools based
on age (24-34, 35-44, 45-54, 55-64, 65-74, 75 and older)?
H9. There is a difference in faculty use of text-based tools based on age.
A one-factor Analysis of Variance (ANOVA) was conducted to test H9. The
categorical variable used to group the dependent variable, faculty usage of text-based
tools, was faculty members’ age. The level of significance was set at .05.
RQ10. To what extent is there a difference in faculty use of image-based tools
based on age (24-34, 35-44, 45-54, 55-64, 65-74, 75 or older)?
H10. There is a difference in faculty usage of image-based tools based on age.
A one-factor ANOVA was conducted to test H10. The categorical variable used
to group the dependent variable, faculty usage of image-based tools, was faculty
members’ age. The level of significance was set at .05.
RQ11. To what extent is there a difference in faculty use of audio tools based on
age (24-34, 35-44, 45-54, 55-64, 65-74, 75 or older)?
H11. There is a difference in faculty usage of audio tools based on age.
A one-factor ANOVA was conducted to test H11. The categorical variable used
to group the dependent variable, faculty usage of audio tools, was faculty members’ age.
The level of significance was set at .05.
RQ12. To what extent is there a difference in faculty use of video tools based on
age (24-34, 35-44, 45-54, 55-64, 65-74, 75 or older)?
H12. There is a difference in faculty usage of video tools based on age.

33
A one-factor ANOVA was conducted to test H12. The categorical variable used
to group the dependent variable, faculty usage of video tools, was faculty members’ age.
The level of significance was set at .05.
RQ13. To what extent is there a difference in faculty use of text-based tools based
on number of years of teaching experience (0-5, 5- 9, 10-14, 15-19, 20-24, 25-29, or 30
or more)?
H13. There is a difference in faculty usage of text-based tools based on number of
years of teaching experience.
A one-factor ANOVA was conducted to test H13. The categorical variable used
to group the dependent variable, faculty usage of text-based tools, was faculty members’
number of years of teaching experience. The level of significance was set at .05.
RQ14. To what extent is there a difference in faculty use of image-based tools
based on number of years of teaching experience (0-5, 5- 9, 10-14, 15-19, 20-24, 25-29,
or 30 or more)?
H14.There is a difference in faculty usage of image-based tools based on number
of years of teaching experience.
A one-factor ANOVA was conducted to test H14. The categorical variable used
to group the dependent variable, faculty usage of image-based tools, was faculty
members’ number of years of teaching experience. The level of significance was set at
.05.
RQ15. To what extent is there a difference in faculty use of audio tools based on
number of years of teaching experience (0-5, 5- 9, 10-14, 15-19, 20-24, 25-29, or 30 or
more)?

34
H15. There is a difference in faculty usage of audio tools based on number of
years of teaching experience.
A one-factor ANOVA was conducted to test H15. The categorical variable used
to group the dependent variable, faculty usage of audio tools, was faculty members’
number of years of teaching experience. The level of significance was set at .05.
RQ16. To what extent is there a difference in faculty use of video tools based on
number of years of teaching experience (0-5, 5- 9, 10-14, 15-19, 20-24, 25-29, or 30 or
more)?
H16. There is a difference in faculty usage of video tools based on number of
years of teaching experience.
A one-factor ANOVA was conducted to test H16. The categorical variable used
to group the dependent variable, faculty usage of video tools, was faculty members’
number of years of teaching experience. The level of significance was set at .05.
RQ17. To what extent is there a difference in faculty use of text-based tools based
on primary teaching discipline (Arts & Humanities, Biological Sciences, Business,
Education, Engineering, Physical Sciences, Other Professions, Social Sciences, or Other
Disciplines)?
H17. There is a difference in faculty usage of text-based tools based on the
primary teaching discipline.
A one-factor ANOVA was conducted to test H17. The categorical variable used
to group the dependent variable, faculty usage of text-based tools, was primary discipline.
The level of significance was set at .05.

35
RQ18. To what extent is there a difference in faculty use of image-based tools
based on the primary teaching discipline (Arts & Humanities, Biological Sciences,
Business, Education, Engineering, Physical Sciences, Other Professions, Social Sciences,
or Other Disciplines)?
H18. There is a difference in faculty usage of image-based tools based on the
primary teaching discipline.
A one-factor ANOVA was conducted to test H18. The categorical variable used
to group the dependent variable, faculty usage of image-based tools, was primary
discipline. The level of significance was set at .05.
RQ19. To what extent is there a difference in faculty use of audio tools based on
primary teaching discipline (Arts & Humanities, Biological Sciences, Business,
Education, Engineering, Physical Sciences, Other Professions, Social Sciences, or Other
Disciplines)?
H19. There is a difference in faculty usage of audio tools based on the primary
teaching discipline.
A one-factor ANOVA was conducted to test H19. The categorical variable used
to group the dependent variable, faculty usage of audio tools, was primary discipline.
The level of significance was set at .05.
RQ20. To what extent is there a difference in faculty use of video tools based on
primary teaching discipline (Arts & Humanities, Biological Sciences, Business,
Education, Engineering, Physical Sciences, Other Professions, Social Sciences, or Other
Disciplines)?

36
H20. There is a difference in faculty usage of video tools based on the primary
teaching discipline.
A one-factor ANOVA was conducted to test H20. The categorical variable used
to group the dependent variable, faculty usage of video tools, was primary discipline.
The level of significance was set at .05.
RQ21. To what extent is there a difference in faculty use of text-based tools based
on employment status (full-time tenured, full-time tenure track, full-time non-tenure
track, or adjunct/part-time)?
H21. There is a difference in faculty usage of text-based tools based on
employment status.
A one-factor ANOVA was conducted to test H21. The categorical variable used
to group the dependent variable, faculty usage of text-based tools, was employment status
(full-time tenured, full-time tenure track, full-time non-tenure track, and adjunct/part-
time). The level of significance was set at .05.
RQ22. To what extent is there a difference in faculty member’s use of image-
based tools based on the faculty member’s employment status (full-time tenured, full-
time tenure track, full-time non-tenure track, or adjunct/part-time)?
H22. There is a difference in faculty usage of image-based tools based on
employment status.
A one-factor ANOVA was conducted to test H22. The categorical variable used
to group the dependent variable, faculty usage of image-based tools, was employment
status (full-time tenured, full-time tenure track, full-time non-tenure track, and
adjunct/part-time). The level of significance was set at .05.

37
RQ23. To what extent is there a difference in faculty use of audio tools based on
the employment status (full-time tenured, full-time tenure track, full-time non-tenure
track, or adjunct/part-time)?
H23. There is a difference in faculty usage of audio tools based on employment
status.
A one-factor ANOVA was conducted to test H23. The categorical variable used
to group the dependent variable, faculty usage of audio tools, was employment status
(full-time tenured, full-time tenure track, full-time non-tenure track, and adjunct/part-
time). The level of significance was set at .05.
RQ24. To what extent is there a difference in faculty use of video tools based on
the employment status (full-time tenured, full-time tenure track, full-time non-tenure
track, or adjunct/part-time)?
H24. There is a difference in faculty usage of video tools based on employment
status.
A one-factor ANOVA was conducted to test H24. The categorical variable used
to group the dependent variable, faculty usage of video tools, was employment status
(full-time tenured, full-time tenure track, full-time non-tenure track, and adjunct/part-
time). The level of significance was set at .05.
RQ25. To what extent is there a difference in how the effectiveness of text-based
tools is rated based on age?
H25. There is a difference in how the effectiveness of text-based tools is rated
based on age.

38
A one-factor ANOVA was conducted to test H25. The categorical variable used
to group the dependent variable, effectiveness of text-based tools, was faculty age (24-34,
35-44, 45-54, 55-64, 65-74, 75 or older). The level of significance was set at .05.
RQ26. To what extent is there a difference in how the effectiveness of image-
based tools is rated based on age?
H26. There is a difference in how the effectiveness of image-based tools is rated
based on age.
A one-factor ANOVA was conducted to test H26. The categorical variable used
to group the dependent variable, effectiveness of image-based tools, was faculty age
(24-34, 35-44, 45-54, 55-64, 65-74, 75 or older). The level of significance was set at
.05.
RQ27. To what extent is there a difference in how the effectiveness of audio tools
is rated based on age?
H27. There is a difference in how the effectiveness of audio tools is rated based
on age.
A one-factor ANOVA was conducted to test H27. The categorical variable used
to group the dependent variable, effectiveness of audio tools, was faculty age (24-34,
35-44, 45-54, 55-64, 65-74, 75 or older). The level of significance was set at .05.
RQ28. To what extent is there a difference in how the effectiveness of video tools
is rated based on age?
H28. There is a difference in how the effectiveness of video tools is rated based
on age.

39
A one-factor ANOVA was conducted to test H28. The categorical variable used
to group the dependent variable, effectiveness of video tools, was faculty age (24-34,
35-44, 45-54, 55-64, 65-74, 75 or older). The level of significance was set at .05.
RQ29. To what extent is there a difference in how the effectiveness of text-based
tools is rated based on the number of years of teaching experience?
H29. There is a difference in how the effectiveness of text-based tools is rated
based on the number of years of teaching experience.
A one-factor ANOVA was conducted to test H29. The categorical variable used
to group the dependent variable, effectiveness of text-based tools, was faculty member’s
number of years of teaching experience (0-5, 5- 9, 10-14, 15-19, 20-24, 25-29, or 30 or
more). The level of significance was set at .05.
RQ30. To what extent is there a difference in how the effectiveness of image-
based tools is rated based on the number of years of teaching experience?
H30. There is a difference in how the effectiveness of image-based tools is rated
based on the number of years of teaching experience.
A one-factor ANOVA was conducted to test H30. The categorical variable used
to group the dependent variable, effectiveness of image-based tools, was faculty
member’s number of years of teaching experience (0-5, 5- 9, 10-14, 15-19, 20-24, 25-29,
or 30 or more). The level of significance was set at .05.
RQ31. To what extent is there a difference in how the effectiveness of audio tools
is rated based on the number of years of teaching experience?
H31. There is a difference in how the effectiveness of audio tools is rated based
on the number of years of teaching experience.

40
A one-factor ANOVA was conducted to test H31. The categorical variable used
to group the dependent variable, effectiveness of audio tools, was faculty member’s
number of years of teaching experience ((0-5, 5- 9, 10-14, 15-19, 20-24, 25-29, or 30 or
more). The level of significance was set at .05.
RQ32. To what extent is there a difference in how the effectiveness of video tools
is rated based on the number of years of teaching experience?
H32: There is a difference in how the effectiveness of video tools is rated based
on the number of years of teaching experience.
A one-factor ANOVA was conducted to test H32. The categorical variable used
to group the dependent variable, effectiveness of video tools, was faculty member’s
number of years of teaching experience (0-5, 5- 9, 10-14, 15-19, 20-24, 25-29, or 30 or
more). The level of significance was set at .05.
RQ33. To what extent is there a difference in how the effectiveness of text-based
tools is rated based on the primary teaching discipline?
H33. There is a difference in how the effectiveness of text-based tools is rated
based on the primary teaching discipline.
A one-factor ANOVA was conducted to test H33. The categorical variable used
to group the dependent variable, effectiveness of text-based tools, was primary teaching
discipline (Arts & Humanities, Biological Sciences, Business, Education, Engineering,
Physical Sciences, Other Professions, Social Sciences, or Other Disciplines). The level
of significance was set at .05.
RQ34. To what extent is there a difference in how the effectiveness of image-
based tools is rated based on the primary teaching discipline?

41
H34: There is a difference in how the effectiveness of image-based tools is rated
based on the primary teaching discipline.
A one-factor (ANOVA) was conducted to test H34. The categorical variable used
to group the dependent variable, effectiveness of image-based tools, was primary
teaching discipline (Arts & Humanities, Biological Sciences, Business, Education,
Engineering, Physical Sciences, Other Professions, Social Sciences, or Other
Disciplines). The level of significance was set at .05.
RQ35. To what extent is there a difference in how the effectiveness of audio tools
is rated based on the primary teaching discipline?
H35. There is a difference in how the effectiveness of audio tools is rated based
on the primary teaching discipline.
A one-factor ANOVA was conducted to test H35. The categorical variable used
to group the dependent variable, effectiveness of audio tools, was primary teaching
discipline (Arts & Humanities, Biological Sciences, Business, Education, Engineering,
Physical Sciences, Other Professions, Social Sciences, or Other Disciplines). The level
of significance was set at .05.
RQ36. To what extent is there a difference in how the effectiveness of video tools
is rated based on the primary teaching discipline?
H36: There is a difference in how the effectiveness of video tools is rated based
on the primary teaching discipline.
A one-factor ANOVA was conducted to test H36. The categorical variable used
to group the dependent variable, effectiveness of video based tools, was primary teaching
discipline (Arts & Humanities, Biological Sciences, Business, Education, Engineering,

42
Physical Sciences, Other Professions, Social Sciences, or Other Disciplines). The level
of significance was set at .05.
RQ37. To what extent is there a difference in how the effectiveness of text-based
tools is rated based on employment status?
H37. There is a difference in how the effectiveness of text-based tools is rated
based on employment status.
A one-factor ANOVA was conducted to test H37. The categorical variable used
to group the dependent variable, effectiveness of text-based tools, was employment status
(full-time tenured, full-time tenure track, full-time non-tenure, adjunct/part-time). The
level of significance was set at .05.
RQ38. To what extent is there a difference in how the effectiveness of image-
based tools is rated based on employment status?
H38. There is a difference in how the effectiveness of image-based tools is rated
based on employment status.
A one-factor (ANOVA) was conducted to test H38. The categorical variable used
to group the dependent variable, effectiveness of image-based tools, was employment
status (full-time tenured, full-time tenure track, full-time non-tenure track, adjunct/part-
time). The level of significance was set at .05.
RQ39. To what extent is there a difference in how the effectiveness of audio
tools is rated based on employment status?
H39. There is a difference in how the effectiveness of audio tools is rated based
on employment status.

43
A one-factor (ANOVA) was conducted to test H39. The categorical variable used
to group the dependent variable, effectiveness of audio tools, was employment status
(full-time tenured, full-time tenure track, full-time non-tenure track, adjunct/part time).
The level of significance was set at .05.
RQ40. To what extent is there a difference in how the effectiveness of video tools
is rated based on employment status?
H40. There is a difference in how the effectiveness of video tools is rated based
on employment status.
A one-factor ANOVA was conducted to test H40. The categorical variable used
to group the dependent variable, effectiveness of video tools, was employment status
(full-time tenured, full-time tenure track, full-time non-tenure track, adjunct/part-time).
The level of significance was set at .05.
Limitations
According to Lunenburg and Irby (2008), limitations of a research study are
conditions not within the control of the researcher. These limitations could impact the
findings of the study and impact the ability to generalize the results. Some faculty
members may not have completed the survey due to not understanding the purpose of the
study or not knowing the researcher. Some participants may not have felt comfortable
taking the survey in digital format and would have preferred a paper survey. Some
faculty may have misunderstood a category making the data they provided incorrect and
impact the results.

44
Summary
This chapter described the research design, selection of participants,
measurement, data collection procedures, data analysis and hypothesis testing, and
limitations. Chapter 3 also described the development of the survey tool and the tests
performed to determine validity. Chapter 4 includes the results of the hypotheses testing.

45
Chapter 4
Results
The first purpose of the current study was to determine faculty usage of text-
based, image-based, audio, and video technology applications as teaching tools. A
second purpose of the study was to investigate faculty perceptions about the effectiveness
of these technologies as teaching tools. A third purpose was to examine if there were
relationships between faculty demographics (age, years of teaching experience in higher
education, teaching discipline, and employment status) and faculty usage of Web 2.0
technologies. A final purpose was to examine if there were relationships between faculty
demographics (age, years of teaching experience in higher education, teaching discipline,
and employment status) and perceived effectiveness of Web 2.0 technologies. The
results of hypothesis testing that addressed each of the 40 research questions are
presented in this chapter.
Hypothesis Testing
Each research question is presented followed by the associated hypothesis, type of
analysis used, the results of the hypothesis testing, and a table with the descriptive
analysis.
RQ1. To what extent do faculty use text-based tools?
H1. Faculty are using text-based tools.
A one sample t test was conducted to test H1. The sample mean was compared
against a null value of 3. The level of significance was set at .05. The results of the
analysis indicated a statistically significant difference between the mean and the test
value, t(352) = -17.760, p = .000. On average, faculty members rate their use of text-

46
based tools as almost never or never (M = 1.71, SD = 1.36, N = 353), which is lower than
the test value (3). H1 was not supported.
RQ2. To what extent do faculty use image-based tools?
H2. Faculty are using image-based tools.
A one sample t test was conducted to test H2. The sample mean was compared
against a null value of 3. The level of significance was set at .05. The results of the
analysis indicated a statistically significant difference between the mean and the test
value, t(352) = -26.811, p = .000. On average, faculty members rate their use of image-
based tools as almost never or never (M = 1.37, SD = 1.15, N = 353), which is lower than
the test value (3). H2 was not supported.
RQ3. To what extent do faculty use audio tools?
H3. Faculty are using audio tools.
A one sample t test was conducted to test H3. The sample mean was compared
against a null value of 3. The level of significance was set at .05. The results of the
analysis indicated a statistically significant difference between the mean and the test
value, t(352) = -28.287, p = .000. On average, faculty members rate their use of audio
tools as almost never or never (M = 1.24, SD = 1.17, N = 353), which is lower than the
test value (3). H3 was not supported.
RQ4. To what extent do faculty use video tools?
H4. Faculty are using video tools.
A one sample t test was conducted to test H4. The sample mean was compared
against a null value of 3. The level of significance was set at .05. The results of the
analysis indicated a statistically significant difference between the mean and the test

47
value, t(352) = -14.967, p = .000. On average, faculty members rate their use of video
tools as almost never (M = 2.02, SD = 1.23 , N = 353), which is lower than the test value
(3). H4 was not supported.
RQ5. To what extent do faculty rate text-based tools as effective?
H5. Faculty rate text-based tools as effective.
A one sample t test was conducted to test H5. The sample mean was compared
against a null value of 3. The level of significance was set at .05. The results of the
analysis indicated a statistically significant difference between the mean and the test
value, t(352) = 13.538, p = .000. On average, faculty members agree that text-based tools
are effective (M = 3.61, SD = 0.85, N = 353), which is higher than the test value (3). H5
was supported.
RQ6. To what extent do faculty rate image-based tools as effective?
H6. Faculty rate image-based tools as effective.
A one sample t test was conducted to test H6. The sample mean was compared
against a null value of 3. The level of significance was set at .05. The results of the
analysis indicated a statistically significant difference between the mean and the test
value, t(352) = 14.501, p = .000. On average, faculty members agree that image-based
tools are effective (M = 3.62, SD = 0.80, N = 353), which is higher than the test value (3).
H6 was supported.
RQ7. To what extent do faculty rate audio tools as effective?
H7. Faculty rate audio tools as effective.
A one sample t test was conducted to test H7. The sample mean was compared
against a null value of 3. The level of significance was set at .05. The results of the

48
analysis indicated a statistically significant difference between the mean and the test
value, t(352) = 13.396, p = .000. On average, faculty members agree that audio tools are
effective (M = 3.55, SD = 0.77, N = 353), which is higher than the test value (3). H7 was
supported.
RQ8. To what extent do faculty rate video tools as effective?
H8. Faculty rate video tools as effective.
A one sample t test was conducted to test H8. The sample mean was compared
against a null value of 3. The level of significance was set at .05. The results of the
analysis indicated a statistically significant difference between the mean and the test
value, t(352) = 20.588, p = .000. On average, faculty members agree that video tools are
effective (M = 3.92, SD = 0.84, N = 353), which is higher than the test value (3). H8 was
supported.
RQ9. To what extent is there a difference in faculty use of text-based tools based
on age (24-34, 35-44, 45-54, 55-64, 65-74, 75 and older)?
H9: There is a difference in faculty use of text-based tools based on age.
Preliminary frequency analyses revealed that the age category, 75 and older,
contained only four respondents. Therefore, prior to conducting the analyses that
involved the variable, age, the categories were revised from the original 6 ranges noted in
RQ9 to the following five ranges: (24-34, 35-44, 45-54, 55-64, 65 and older). A one-
factor analysis of variance (ANOVA) was conducted to test H9. The categorical variable
used to group the dependent variable, faculty usage of text-based tools, was faculty
members’ age. The level of significance was set at .05. The results of the analysis
indicated there was not a significant difference between at least two means,

49
F(4, 348) = 1.653, p = .160. See Table 1 for the descriptive statistics for this analysis.
No post hoc was warranted. H9 was not supported.
Table 1
Descriptive Statistics for the Test of H9
Age M SD N
24-34 1.19 1.23 32
35-44 1.71 1.25 92
45-54 1.87 1.42 95
55-64 1.67 1.36 90
65+ 1.84 1.52 44
RQ10. To what extent is there a difference in faculty use of image-based tools
based on age (24-34, 35-44, 45-54, 55-64, 65-74, 75 or older)?
H10. There is a difference in faculty usage of image-based tools based on age.
Preliminary frequency analyses revealed that the age category, 75 and older,
contained only four respondents. Therefore, prior to conducting the analyses that
involved the variable, age, the categories were revised from the original 6 ranges noted in
RQ9 to the following five ranges: (24-34, 35-44, 45-54, 55-64, 65 and older). A one-
factor ANOVA was conducted to test H10. The categorical variable used to group the
dependent variable, faculty usage of image-based tools, was faculty members’ age. The
level of significance was set at .05. The results of the analysis indicated there was not a
significant difference between at least two means, F(4, 348) = 0.919, p = .453. See Table
2 for the descriptive statistics for this analysis. No post hoc was warranted. H10 was not
supported.

50
Table 2
Descriptive Statistics for the Test of H10
Age M SD N
24-34 1.25 0.98 32
35-44 1.53 1.08 92
45-54 1.40 1.19 95
55-64 1.27 1.20 90
65+ 1.23 1.18 44
RQ11. To what extent is there a difference in faculty use of audio tools based on
age (24-34, 35-44, 45-54, 55-64, 65-74, 75 or older)?
H11. There is a difference in faculty usage of audio tools based on age.
Preliminary frequency analyses revealed that the age category, 75 and older,
contained only four respondents. Therefore, prior to conducting the analyses that
involved the variable, age, the categories were revised from the original 6 ranges noted in
RQ9 to the following five ranges: (24-34, 35-44, 45-54, 55-64, 65 and older). A one-
factor ANOVA was conducted to test H11. The categorical variable used to group the
dependent variable, faculty usage of audio tools, was faculty members’ age. The level of
significance was set at .05. The results of the analysis indicated there was not a
significant difference between at least two means, F(4, 348) = 0.543, p = .704. See Table
3 for the descriptive statistics for this analysis. No post hoc was warranted. H11 was not
supported.

51
Table 3
Descriptive Statistics for the Test of H11
Age M SD N
24-34 1.28 1.25 32
35-44 1.25 1.14 92
45-54 1.37 1.15 95
55-64 1.16 1.13 90
65+ 1.11 1.28 44
RQ12. To what extent is there a difference in faculty use of video tools based on
age (24-34, 35-44, 45-54, 55-64, 65-74, 75 or older)?
H12. There is a difference in faculty usage of video tools based on age.
Preliminary frequency analyses revealed that the age category, 75 and older,
contained only four respondents. Therefore, prior to conducting the analyses that
involved the variable, age, the categories were revised from the original 6 ranges noted in
RQ9 to the following five ranges: (24-34, 35-44, 45-54, 55-64, 65 and older). A one-
factor ANOVA was conducted to test H12. The categorical variable used to group the
dependent variable, faculty usage of video tools, was faculty members’ age. The level of
significance was set at .05. The results of the analysis indicated there was not a
significant difference between at least two means, F(4, 348) = 0.481, p = .750. See Table
4 for the descriptive statistics for this analysis. No post hoc was warranted. H12 was not
supported.

52
Table 4
Descriptive Statistics for the Test of H12
Age M SD N
24-34 2.22 1.18 32
35-44 2.04 1.13 92
45-54 2.05 1.28 95
55-64 1.99 1.29 90
65+ 1.84 1.24 44
RQ13. To what extent is there a difference in faculty use of text-based tools based
on number of years of teaching experience (0-5, 5- 9, 10-14, 15-19, 20-24, 25-29, or 30
or more)?
H13. There is a difference in faculty usage of text-based tools based on number of
years of teaching experience.
A one-factor ANOVA was conducted to test H13. The categorical variable used
to group the dependent variable, faculty usage of text-based tools, was faculty members’
number of years of teaching experience. The level of significance was set at .05. The
results of the analysis indicated there was not a significant difference between at least two
means, F(6, 346) = 0.645, p = .694. See Table 5 for the descriptive statistics for this
analysis. No post hoc was warranted. H13 was not supported.
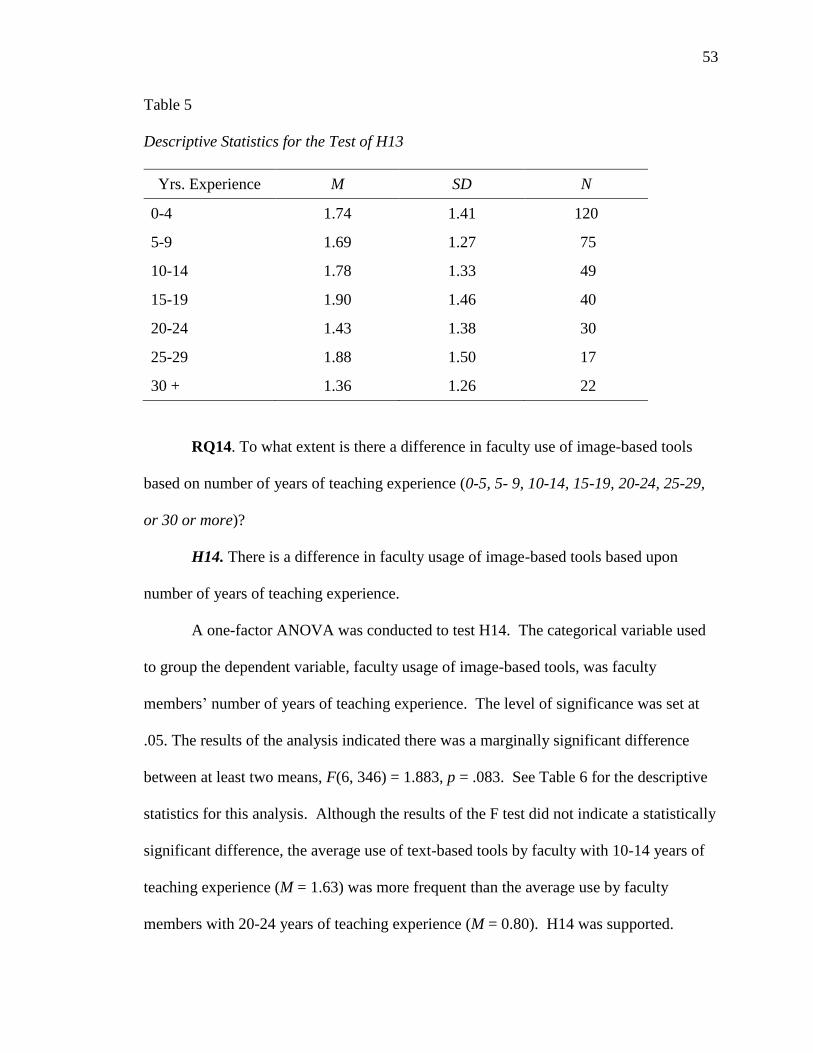
53
Table 5
Descriptive Statistics for the Test of H13
Yrs. Experience M SD N
0-4 1.74 1.41 120
5-9 1.69 1.27 75
10-14 1.78 1.33 49
15-19 1.90 1.46 40
20-24 1.43 1.38 30
25-29 1.88 1.50 17
30 + 1.36 1.26 22
RQ14. To what extent is there a difference in faculty use of image-based tools
based on number of years of teaching experience (0-5, 5- 9, 10-14, 15-19, 20-24, 25-29,
or 30 or more)?
H14. There is a difference in faculty usage of image-based tools based upon
number of years of teaching experience.
A one-factor ANOVA was conducted to test H14. The categorical variable used
to group the dependent variable, faculty usage of image-based tools, was faculty
members’ number of years of teaching experience. The level of significance was set at
.05. The results of the analysis indicated there was a marginally significant difference
between at least two means, F(6, 346) = 1.883, p = .083. See Table 6 for the descriptive
statistics for this analysis. Although the results of the F test did not indicate a statistically
significant difference, the average use of text-based tools by faculty with 10-14 years of
teaching experience (M = 1.63) was more frequent than the average use by faculty
members with 20-24 years of teaching experience (M = 0.80). H14 was supported.

54
Table 6
Descriptive Statistics for the Test of H14
Yrs. Experience M SD N
0-4 1.38 1.15 120
5-9 1.37 1.23 75
10-14 1.63 1.07 49
15-19 1.50 1.01 40
20-24 0.80 1.13 30
25-29 1.35 1.11 17
30+ 1.18 1.14 22
RQ15. To what extent is there a difference in faculty use of audio tools based on
number of years of teaching experience (0-5, 5- 9, 10-14, 15-19, 20-24, 25-29, or 30 or
more)?
H15. There is a difference in faculty usage of audio tools based on number of
years of teaching experience.
A one-factor ANOVA was conducted to test H15. The categorical variable used
to group the dependent variable, faculty usage of audio tools, was faculty members’
number of years of teaching experience. The level of significance was set at .05. The
results of the analysis indicated there was not a significant difference between at least two
means, F(6, 346) = 1.042, p = .398. See Table 7 for the descriptive statistics for this
analysis. No post hoc was warranted. H15 was not supported.

55
Table 7
Descriptive Statistics for the Test of H15
Yrs. Experience M SD N
0-4 1.35 1.21 120
5-9 1.17 1.21 75
10-14 1.43 1.02 49
15-19 1.10 0.98 40
20-24 1.03 1.07 30
25-29 1.41 1.37 17
30 + 0.91 1.31 22
RQ16. To what extent is there a difference in faculty use of video tools based on
number of years of teaching experience (0-5, 5- 9, 10-14, 15-19, 20-24, 25-29, or 30 or
more)?
H16. There is a difference in faculty usage of video tools based on number of
years of teaching experience.
A one-factor ANOVA was conducted to test H16. The categorical variable used
to group the dependent variable, faculty usage of video tools, was faculty members’
number of years of teaching experience. The level of significance was set at .05. The
results of the analysis indicated there was a marginally significant difference between at
least two means, F(6, 346) = 1.822, p = .094. See Table 8 for the descriptive statistics for
this analysis. Although the results of the F test did not indicate a statistically significant
difference, the average use of video tools by faculty with 10-14 years of teaching
experience (M = 2.31) was more frequent than the average use by faculty members with
20-24 years of teaching experience (M = 1.50). H16 was supported.

56
Table 8
Descriptive Statistics for the Test of H16
Yrs. Experience M SD N
0-4 2.14 1.27 120
5-9 2.00 1.17 75
10-14 2.31 1.14 49
15-19 1.98 1.31 40
20-24 1.50 1.20 30
25-29 1.71 1.36 17
30+ 1.86 0.99 22
RQ17. To what extent is there a difference in faculty use of text-based tools based
on primary teaching discipline (Arts & Humanities, Biological Sciences, Business,
Education, Engineering, Physical Sciences, Other Professions, Social Sciences, or Other
Disciplines)?
H17. There is a difference in faculty usage of text-based tools based on the
primary teaching discipline.
A one-factor ANOVA was conducted to test H17. The categorical variable used
to group the dependent variable, use of text-based tools, was the primary teaching
discipline of the faculty member (Arts & Humanities, Biological Sciences, Business,
Education, Engineering, Physical Sciences, Other Professions, Social Sciences, or Other
Disciplines). The level of significance was set at .05. The results of the analysis
indicated there was a statistically significant difference between at least two means, F(7,
345) = 5.092, p = .000. See Table 9 for the descriptive statistics for this analysis. The
Tukey’s HSD post hoc determined five of the differences were statistically significant.

57
The average use of text-based tools by faculty whose primary teaching discipline is
education (M = 2.15) is significantly more frequent than the average use by faculty
members whose primary teaching discipline is arts and humanities (M = 1.55). In
addition, the average use of text-based tools by faculty whose primary teaching discipline
is Business (M = 2.07) is significantly more frequent than the average use by faculty
members whose primary teaching discipline is Biological Sciences (M = 0.87) or
Physical Sciences (M = 0.77). Finally, the average use of text-based tools by faculty
whose primary teaching discipline is Education (M = 2.15) is significantly more frequent
than the average use by faculty members whose primary teaching discipline is Biological
Sciences (M = 0.87) or Physical Sciences (M = 0.77). H17 was supported.
Table 9
Descriptive Statistics for the Test of H17
Discipline M SD N
Arts & Humanities 1.55 1.34 85
Biological Sciences 0.87 1.13 15
Business 2.07 1.45 60
Education 2.15 1.30 86
Other Disciplines 1.58 1.35 24
Other Professions 1.55 1.45 29
Physical Sciences 0.77 0.86 26
Social Sciences 1.68 1.19 28
RQ18. To what extent is there a difference in faculty use of image-based tools
based on the primary teaching discipline (Arts & Humanities, Biological Sciences,

58
Business, Education, Engineering, Physical Sciences, Other Professions, Social Sciences,
or Other Disciplines)?
H18. There is a difference in faculty usage of image-based tools based on the
primary teaching discipline.
A one-factor ANOVA was conducted to test H18. The categorical variable used
to group the dependent variable, faculty usage of image-based tools, was primary
discipline. The level of significance was set at .05. A one-way ANOVA was conducted
to test H18. The categorical variable used to group the dependent variable, use of text-
based tools, was the primary teaching discipline of the faculty member (Arts &
Humanities, Biological Sciences, Business, Education, Engineering, Physical Sciences,
Other Professions, Social Sciences, or Other Disciplines). The level of significance was
set at .05. The results of the analysis indicated there was a statistically significant
difference between at least two means, F(7, 345) = 2.354, p = .023. See Table 10 for the
descriptive statistics for this analysis. The Tukey’s HSD post hoc determined two of the
differences were statistically significant. The average use of image-based tools by
faculty whose primary teaching discipline is Education (M = 1.64) is significantly more
frequent than the average use by faculty members whose primary teaching discipline is
Arts and Humanities (M = 1.19). In addition, the average use of image-based tools by
faculty whose primary teaching discipline is Other Professions (M = 1.79) is significantly
more frequent than the average use by faculty members whose primary teaching
discipline is Other Disciplines (M = 1.00). H18 was supported.

59
Table 10
Descriptive Statistics for the Test of H18
Discipline M SD N
Arts & Humanities 1.19 1.16 85
Biological Sciences 1.27 1.10 15
Business 1.40 1.08 60
Education 1.64 1.14 86
Other Disciplines 1.00 0.78 24
Other Professions 1.79 1.26 29
Physical Sciences 1.19 1.23 26
Social Sciences 1.07 1.15 28
RQ19. To what extent is there a difference in faculty use of audio tools based on
primary teaching discipline (Arts & Humanities, Biological Sciences, Business,
Education, Engineering, Physical Sciences, Other Professions, Social Sciences, or Other
Disciplines)?
H19: There is a difference in faculty usage of audio tools based on the primary
teaching discipline.
A one-factor ANOVA was conducted to test H19. The categorical variable used
to group the dependent variable, use of audio tools, was the primary teaching discipline
of the faculty member (Arts & Humanities, Biological Sciences, Business, Education,
Engineering, Physical Sciences, Other Professions, Social Sciences, or Other
Disciplines). The level of significance was set at .05. The results of the analysis
indicated there was a statistically significant difference between at least two means,

60
F(7, 345) = 2.411, p = .020. See Table 11 for the descriptive statistics for this analysis.
The Tukey’s HSD post hoc determined three of the differences were statistically
significant. The average use of audio tools by faculty whose primary teaching discipline
is Education (M = 1.40) , Arts and Humanities (M = 1.35), and Business (M = 1.30) is
significantly more frequent than the average use by faculty members whose primary
teaching discipline is Physical Sciences (M = 0.46). H19 was supported.
Table 11
Descriptive Statistics for the Test of H19
Discipline M SD N
Arts & Humanities 1.35 1.23 85
Biological Sciences 0.80 0.86 15
Business 1.30 1.20 60
Education 1.40 1.16 86
Other Disciplines 1.29 1.16 24
Other Professions 1.31 1.20 29
Physical Sciences 0.46 0.76 26
Social Sciences 1.18 1.12 28
RQ20. To what extent is there a difference in faculty use of video tools based on
primary teaching discipline (Arts & Humanities, Biological Sciences, Business,
Education, Engineering, Physical Sciences, Other Professions, Social Sciences, or Other
Disciplines)?
H20. There is a difference in faculty usage of video tools based on the primary
teaching discipline.

61
A one-factor ANOVA was conducted to test H20. The categorical variable used
to group the dependent variable, use of video tools, was the primary teaching discipline
of the faculty member (Arts & Humanities, Biological Sciences, Business, Education,
Engineering, Physical Sciences, Other Professions, Social Sciences, or Other
Disciplines). The level of significance was set at .05. The results of the analysis
indicated there was a statistically significant difference between at least two means,
F(7, 345) = 3.339, p = .002. See Table 12 for the descriptive statistics for this analysis.
The Tukey’s HSD post hoc determined three of the differences were statistically
significant. The average use of video tools by faculty whose primary teaching discipline
is Education (M = 2.20) , Social Sciences (M = 2.29), and Business (M = 2.38) is
significantly more frequent than the average use by faculty members whose primary
teaching discipline is Physical Sciences (M = 1.31) . H20 was supported.
Table 12
Descriptive Statistics for the Test of H20
Discipline M SD N
Arts & Humanities 1.84 1.30 85
Biological Sciences 1.47 1.36 15
Business 2.38 1.12 60
Education 2.20 1.16 86
Other Disciplines 1.92 1.06 24
Other Professions 2.07 1.36 29
Physical Sciences 1.31 1.19 26
Social Sciences 2.29 1.01 28

62
RQ21. To what extent is there a difference in faculty use of text-based tools based
on employment status (full-time tenured, full-time tenure track, full-time non-tenure
track, or adjunct/part-time)?
H21. There is a difference in faculty usage of text-based tools based on
employment status.
A one-factor ANOVA was conducted to test H21. The categorical variable used
to group the dependent variable, faculty usage of text-based tools, was employment status
(full-time tenured, full-time tenure track, full-time non-tenure track, and adjunct/part-
time). The level of significance was set at .05. The results of the analysis indicated there
was a statistically significant difference between at least two means, F(3, 349) = 8.885,
p = .000. See Table 13 for the descriptive statistics for this analysis. The Tukey’s HSD
post hoc determined three of the differences were statistically significant. The average
use of text-based tools by faculty whose employment status is adjunct/part-time
(M = 2.20) is significantly more frequent than the average use by faculty members whose
employment status is full-time non-tenure track (M = 1.57), full-time tenure track
(M = 1.44) and full-time tenured (M = 1.34). H21 was supported.
Table 13
Descriptive Statistics for the Test of H21
Employment Status M SD N
Adjunct/Part-Time 2.20 1.47 123
Full-time Non-Tenure Track 1.57 1.27 82
Full-time Tenure Track 1.44 1.25 61
Full-time Tenured 1.34 1.19 87

63
RQ22. To what extent is there a difference in faculty member’s use of image-
based tools based on employment status (full-time tenured, full-time tenure track, full-
time non-tenure track, or adjunct/part-time)?
H22. There is a difference in faculty usage of image-based tools based on
employment status.
A one-factor ANOVA was conducted to test H22. The categorical variable used
to group the dependent variable, faculty usage of image-based tools, was employment
status (full-time tenured, full-time tenure track, full-time non-tenure track, and
adjunct/part-time). The level of significance was set at .05. The results of the analysis
indicated there was a marginally significant difference between at least two means,
F(3,349) = 2.555, p = .055. See Table 14 for the descriptive statistics for this analysis.
Although the results of the F test did not indicate a statistically significant difference, the
average use of imaged-based tools by faculty whose employment status is full-time non-
tenured (M = 1.62) was more frequent than the average use by faculty whose employment
status is full-time tenured (M = 1.14). H122 was supported.
Table 14
Descriptive Statistics for the Test of H22
Employment Status M SD N
Adjunct/Part-Time 1.37 1.13 123
Full-time Non-Tenure Track 1.62 1.16 82
Full-time Tenure Track 1.34 1.06 61
Full-time Tenured 1.14 1.17 87

64
RQ23. To what extent is there a difference in faculty use of audio tools based on
employment status (full-time tenured, full-time tenure track, full-time non-tenure track,
or adjunct/part-time)?
H23. There is a difference in faculty usage of audio tools based on employment
status.
A one-factor ANOVA was conducted to test H23. The categorical variable used
to group the dependent variable, faculty usage of audio tools, was employment status
(full-time tenured, full-time tenure track, full-time non-tenure track, and adjunct/part-
time). The level of significance was set at .05. The results of the analysis indicated there
was not a significant difference between at least two means, F(3, 349) = 1.628, p = .183.
See Table 15 for the descriptive statistics for this analysis. No post hoc was warranted.
H23 was not supported.
Table 15
Descriptive Statistics for the Test of H23
Employment Status M SD N
Adjunct/Part-Time 1.26 1.17 123
Full-time Non-Tenure Track 1.43 1.12 82
Full-time Tenure Track 1.26 1.17 61
Full-time Tenured 1.03 1.19 87
RQ24. To what extent is there a difference in faculty use of video tools based on
employment status (full-time tenured, full-time tenure track, full-time non-tenure track,
or adjunct/part-time)?
H24. There is a difference in faculty usage of video tools based on employment
status.

65
A one-factor ANOVA was conducted to test H24. The categorical variable used
to group the dependent variable, faculty usage of video tools, was employment status
(full-time tenured, full-time tenure track, full-time non-tenure track, and adjunct/part-
time). The level of significance was set at .05. The results of the analysis indicated there
was not a significant difference between at least two means, F(3, 349) = 1.567, p = .197.
See Table 16 for the descriptive statistics for this analysis. No post hoc was warranted.
H24 was not supported.
Table 16
Descriptive Statistics for the Test of H24
Employment Status M SD N
Adjunct/Part-Time 2.10 1.28 123
Full-time Non-Tenure Track 2.15 1.23 82
Full-time Tenure Track 2.05 1.12 61
Full-time Tenured 1.78 1.21 87
RQ25. To what extent is there a difference in how the effectiveness of text-based
tools is rated based on age?
H25. There is a difference in how the effectiveness of text-based tools is rated
based on age.
A one-factor ANOVA was conducted to test H25. Preliminary frequency
analyses revealed that the age category, 75 and older, contained only four respondents.
Therefore, prior to conducting the analyses that involved the variable, age, the categories
were revised from the original 6 ranges noted in RQ9 to the following five ranges:
(24-34, 35-44, 45-54, 55-64, 65 and older). The level of significance was set at .05. The
results of the analysis indicated there was not a significant difference between at least two

66
means, F(4, 348) = 0.890, p = .470. See Table 17 for the descriptive statistics for this
analysis. No post hoc was warranted. H25 was not supported.
Table 17
Descriptive Statistics for the Test of H25
Age M SD N
24-34 3.41 0.98 32
35-44 3.62 0.85 92
45-54 3.71 0.81 95
55-64 3.56 0.88 90
65 + 3.66 0.78 44
RQ26. To what extent is there a difference in how the effectiveness of image-
based tools is rated based on age?
H26. There is a difference in how the effectiveness of image-based tools is rated
based on age.
A one-factor ANOVA was conducted to test H26. Preliminary frequency
analyses revealed that the age category, 75 and older, contained only four respondents.
Therefore, prior to conducting the analyses that involved the variable, age, the categories
were revised from the original 6 ranges noted in RQ9 to the following five ranges:
(24-34, 35-44, 45-54, 55-64, 65 and older). The level of significance was set at .05. The
results of the analysis indicated there was not a significant difference between at least two
means, F(4, 348) = 1.261, p = .285. See Table 18 for the descriptive statistics for this
analysis. No post hoc was warranted. H26 was not supported.

67
Table 18
Descriptive Statistics for the Test of H26
Age M SD N
24-34 3.47 0.88 32
35-44 3.70 0.91 92
45-54 3.72 0.71 95
55-64 3.53 0.78 90
65 + 3.52 0.70 44
RQ27. To what extent is there a difference in how the effectiveness of audio tools
is rated based on age?
H27: There is a difference in how the effectiveness of audio tools is rated based
on age.
A one-factor ANOVA was conducted to test H27. Preliminary frequency
analyses revealed that the age category, 75 and older, contained only four respondents.
Therefore, prior to conducting the analyses that involved the variable, age, the categories
were revised from the original 6 ranges noted in RQ9 to the following five ranges:
(24-34, 35-44, 45-54, 55-64, 65 and older). The level of significance was set at .05. The
results of the analysis indicated there was not a significant difference between at least two
means, F(4, 348) = 0.625, p = .645. See Table 19 for the descriptive statistics for this
analysis. No post hoc was warranted. H27 was not supported.

68
Table 19
Descriptive Statistics for the Test of H27
Age M SD N
24-34 3.53 0.91 32
35-44 3.53 0.78 92
45-54 3.65 0.78 95
55-64 3.52 0.74 90
65 + 3.45 0.73 44
RQ28. To what extent is there a difference in how the effectiveness of video tools
is rated based on age?
H28: There is a difference in how the effectiveness of video tools is rated based
on age.
A one-factor ANOVA was conducted to test H28. Preliminary frequency
analyses revealed that the age category, 75 and older, contained only four respondents.
Therefore, prior to conducting the analyses that involved the variable, age, the categories
were revised from the original 6 ranges noted in RQ9 to the following five ranges:
(24-34, 35-44, 45-54, 55-64, 65 and older). The level of significance was set at .05. The
results of the analysis indicated there was not a significant difference between at least two
means, F(4, 348) = 0.465, p = .762. See Table 20 for the descriptive statistics for this
analysis. No post hoc was warranted. H28 was not supported.

69
Table 20
Descriptive Statistics for the Test of H28
Age M SD N
24-34 3.88 0.87 32
35-44 3.93 0.84 92
45-54 3.99 0.82 95
55-64 3.89 0.87 90
65 + 3.80 0.80 44
RQ29. To what extent is there a difference in how the effectiveness of text-based
tools is rated based on the number of years of teaching experience?
H29: There is a difference in how the effectiveness of text-based tools is rated
based on years of teaching experience.
A one-factor ANOVA was conducted to test H29. The categorical variable used
to group the dependent variable, effectiveness of text-based tools, was faculty member’s
number of years of teaching experience ((0-5, 5- 9, 10-14, 15-19, 20-24, 25-29, or 30 or
more). The level of significance was set at .05. The level of significance was set at .05.
The results of the analysis indicated there was a statistically significant difference
between at least two means, F(6,346) = 2.220, p =.041. See Table 21 for the descriptive
statistics for this analysis. The Tukey’s HSD post hoc determined one differences was
statistically significant, the average rating of effectiveness of text-based tools by faculty
whose years of teaching experience was 25-29 (M = 3.94) was significantly higher than
the rating of effectiveness for faculty whose years of teaching experience was 30 or more
years (M = 3.23). H28 was supported.

70
Table 21
Descriptive Statistics for the Test of H29
Yrs. Experience M SD N
0-4 3.54 0.92 120
5-9 3.72 0.82 75
10-14 3.65 0.83 49
15-19 3.80 0.72 40
20-24 3.40 0.81 30
25-29 3.94 0.83 17
30 + 3.23 0.69 22
RQ30. To what extent is there a difference in how the effectiveness of image-
based tools is rated based on the number of years of teaching experience?
H30: There is a difference in how the effectiveness of image-based tools is rated
based on years of teaching experience.
A one-factor ANOVA was conducted to test H30. The categorical variable used
to group the dependent variable, effectiveness of image-based tools, was faculty
member’s number of years of teaching experience (0-5, 5- 9, 10-14, 15-19, 20-24, 25-29,
or 30 or more). The level of significance was set at .05. The results of the analysis
indicated there was not a significant difference between at least two means,
F(6, 346) = 0.918, p =.482. See Table 22 for the descriptive statistics for this analysis.
No post hoc was warranted. H30 was not supported.

71
Table 22
Descriptive Statistics for the Test of H30
Yrs. Experience M SD N
0-4 3.58 0.88 120
5-9 3.65 0.81 75
10-14 3.80 0.81 49
15-19 3.63 0.77 40
20-24 3.43 0.63 30
25-29 3.71 0.69 17
30 + 3.45 0.60 22
RQ31. To what extent is there a difference in how the effectiveness of audio tools
is rated based on the number of years of teaching experience?
H31: There is a difference in how the effectiveness of audio tools is rated based
on years of teaching experience.
A one-factor ANOVA was conducted to test H31. The categorical variable used
to group the dependent variable, effectiveness of audio tools, was faculty member’s
number of years of teaching experience ((0-5, 5- 9, 10-14, 15-19, 20-24, 25-29, or 30 or
more). The level of significance was set at .05. The results of the analysis indicated there
was not a significant difference between at least two means, F(6, 346) = 1.531, p = 0.167.
See Table 23 for the descriptive statistics for this analysis. No post hoc was warranted.
H31 was not supported.

72
Table 23
Descriptive Statistics for the Test of H31
Yrs. Experience M SD N
0-4 3.56 0.88 120
5-9 3.59 0.70 75
10-14 3.73 0.73 49
15-19 3.50 0.68 40
20-24 3.27 0.83 30
25-29 3.71 0.69 17
30 + 3.36 0.58 22
RQ32. To what extent is there a difference in how the effectiveness of video tools
is rated based on the number of years of teaching experience?
H32: There is a difference in how the effectiveness of video tools is rated based
on years of teaching experience.
A one-factor ANOVA was conducted to test H32. The categorical variable used
to group the dependent variable, effectiveness of video tools, was faculty member’s
number of years of teaching experience (0-5, 5- 9, 10-14, 15-19, 20-24, 25-29, or 30 or
more). The level of significance was set at .05. The results of the analysis indicated there
was a statistically significant difference between at least two means, F(6, 346) = 3.021,
p = .007. See Table 24 for the descriptive statistics for this analysis. The Tukey’s HSD
post hoc determined two of the differences were statistically significant. The average
rating of effectiveness of text-based tools by faculty whose years of teaching experience
was 10-14 (M = 4.27) is significantly higher than the rating of effectiveness by faculty
members whose years of teaching experience was 15-19 (M = 3.78) or 20-24

73
(M = 3.573). H32 was supported.
Table 24
Descriptive Statistics for the Test of H32
Yrs. Experience M SD N
0-4 3.90 0.96 120
5-9 4.00 0.70 75
10-14 4.27 0.70 49
15-19 3.78 0.77 40
20-24 3.57 0.77 30
25-29 3.88 0.78 17
30 + 3.68 0.84 22
RQ33. To what extent is there a difference in how the effectiveness of text-based
tools is rated based on the primary teaching discipline?
H33. There is a difference in how the effectiveness of text-based tools is rated
based on the primary teaching discipline.
A one-factor ANOVA was conducted to test H33. The categorical variable used
to group the dependent variable, effectiveness of text-based tools, was primary teaching
discipline (Arts & Humanities, Biological Sciences, Business, Education, Engineering,
Physical Sciences, Other Professions, Social Sciences, or Other Disciplines). The level of
significance was set at .05. The results of the analysis indicated there was a statistically
significant difference between at least two means, F(7, 345) = 2.815, p = .007. See
Table 25 for the descriptive statistics for this analysis. The Tukey’s HSD post hoc
determined two of the differences were statistically significant. The average rating of
effectiveness of text-based tools by faculty whose teaching discipline was Education

74
(M = 3.81) is significantly higher than the rating of effectiveness by faculty members
whose teaching discipline was Biological Sciences (M = 3.13) or Physical Sciences
(M =3.27). H33 was supported.
Table 25
Descriptive Statistics for the Test of H33
Discipline M SD N
Arts & Humanities 3.56 0.85 85
Biological Sciences 3.13 0.99 15
Business 3.73 0.95 60
Education 3.81 0.76 86
Other Disciplines 3.29 0.86 24
Other Professions 3.66 0.72 29
Physical Sciences 3.27 0.83 26
Social Sciences 3.68 0.72 28
RQ34. To what extent is there a difference in how the effectiveness of image-
based tools is rated based on the primary teaching discipline?
H34: There is a difference in how the effectiveness of image-based tools is rated
based on the primary teaching discipline.
A one-factor (ANOVA) was conducted to test H34. The categorical variable used
to group the dependent variable, effectiveness of image-based tools, was primary
teaching discipline (Arts & Humanities, Biological Sciences, Business, Education,
Engineering, Physical Sciences, Other Professions, Social Sciences, or Other
Disciplines). The level of significance was set at .05. The results of the analysis
indicated there was not a significant difference between at least two means,

75
F(7, 345) = 1.235, p = .283. See Table 26 for the descriptive statistics for this analysis.
No post hoc was warranted. H34 was not supported.
Table 26
Descriptive Statistics for the Test of H34
Discipline M SD N
Arts & Humanities 3.64 0.81 85
Biological Sciences 3.27 1.033 15
Business 3.67 0.73 60
Education 3.70 0.75 86
Other Disciplines 3.29 0.81 24
Other Professions 3.72 0.92 29
Physical Sciences 3.62 0.80 26
Social Sciences 3.57 0.74 28
RQ35. To what extent is there a difference in how the effectiveness of audio tools
is rated based on the primary teaching discipline?
H35. There is a difference in how the effectiveness of audio tools is rated based
on the primary teaching discipline.
A one-factor ANOVA was conducted to test H35. The categorical variable used
to group the dependent variable, effectiveness of audio tools, was primary teaching
discipline (Arts & Humanities, Biological Sciences, Business, Education, Engineering,
Physical Sciences, Other Professions, Social Sciences, or Other Disciplines). The level
of significance was set at .05. The results of the analysis indicated there was a marginally
significant difference between at least two means, F(7, 345) = 1.810, p = .084. See Table
27 for the descriptive statistics for this analysis. Although the results of the F test did not

76
indicate a statistically significant difference, the rating of effectiveness of text-based tools
by faculty whose teaching discipline was Arts and Humanities (M = 3.71) was higher
than rating of effectiveness by faculty members whose teaching discipline was Physical
Sciences (M = 3.15). H35 was supported.
Table 27
Descriptive Statistics for the Test of H35
Discipline M SD N
Arts & Humanities 3.71 0.74 85
Biological Sciences 3.53 0.52 15
Business 3.53 0.81 60
Education 3.57 0.76 86
Other Disciplines 3.33 1.01 24
Other Professions 3.62 0.77 29
Physical Sciences 3.15 0.73 26
Social Sciences 3.57 0.69 28
RQ36. To what extent is there a difference in how the effectiveness of video tools
is rated based on the primary teaching discipline?
H36: There is a difference in how the effectiveness of video tools is rated based
on the primary teaching discipline.
A one-factor ANOVA was conducted to test H36. The categorical variable used
to group the dependent variable, effectiveness of video based tools, was primary teaching
discipline (Arts & Humanities, Biological Sciences, Business, Education, Engineering,
Physical Sciences, Other Professions, Social Sciences, or Other Disciplines). The level
of significance was set at .05. The results of the analysis indicated there was not a

77
significant difference between at least two means, F(7, 345) = 1.289, p = .255. See Table
28 for the descriptive statistics for this analysis. No post hoc was warranted. H36 was
not supported.
Table 28
Descriptive Statistics for the Test of H36
Discipline M SD N
Arts & Humanities 3.88 0.81 85
Biological Sciences 3.73 0.70 15
Business 4.15 0.82 60
Education 3.91 0.83 86
Other Disciplines 3.79 1.06 24
Other Professions 3.90 0.82 29
Physical Sciences 3.65 0.89 26
Social Sciences 4.00 0.72 28
RQ37. To what extent is there a difference in how the effectiveness of text-based
tools is rated based on employment status?
H37. There is a difference in how the effectiveness of text-based tools is rated
based on employment status.
A one-factor ANOVA was conducted to test H37. The categorical variable used
to group the dependent variable, effectiveness of text-based tools, was employment status
(full-time tenured, full-time tenure track, full-time non-tenure, adjunct/part-time). The
level of significance was set at .05. The results of the analysis indicated there was a
statistically significant difference between at least two means, F(3, 349) = 5.571,

78
p = .001. See Table 29 for the descriptive statistics for this analysis. The Tukey’s HSD
post hoc determined two of the differences were statistically significant. The average
rating of effectiveness of text-based tools by faculty whose employment status is
adjunct/part-time (M = 3.85) is significantly higher than the rating of effectiveness by
faculty members whose employment status is full-time tenure track (M = 3.54) or full-
time tenured (M = 3.39). H37 was supported.
Table 29
Descriptive Statistics for the Test of H37
Employment Status M SD N
Adjunct/Part-Time 3.85 0.84 123
Full-time Non-Tenure Track 3.55 0.72 82
Full-time Tenure Track 3.54 1.026 61
Full-time Tenured 3.39 0.77 87
RQ38. To what extent is there a difference in how the effectiveness of image-
based tools is rated based on employment status?
H38. There is a difference in how the effectiveness of image-based tools is rated
based on employment status.
A one-factor (ANOVA) was conducted to test H38. The categorical variable used
to group the dependent variable, effectiveness of image-based tools, was employment
status (full-time tenured, full-time tenure track, full-time non-tenure track, adjunct/part-
time). The level of significance was set at .05. The results of the analysis indicated
there was not a significant difference between at least two means, F(4, 349) = 1.446,
p = .229. See Table 30 for the descriptive statistics for this analysis. No post hoc was
warranted. H38 was not supported.

79
Table 30
Descriptive Statistics for the Test of H38
Employment Status M SD N
Adjunct/Part-Time 3.59 0.78 123
Full-time Non-Tenure Track 3.70 0.76 82
Full-time Tenure Track 3.74 0.91 61
Full-time Tenured 3.49 0.78 87
RQ39. To what extent is there a difference in how the effectiveness of audio
tools is rated based on employment status?
H39. There is a difference in how the effectiveness of audio tools is rated based
on employment status.
A one-factor (ANOVA) was conducted to test H39. The categorical variable used
to group the dependent variable, effectiveness of audio tools, was employment status
(full-time tenured, full-time tenure track, full-time non-tenure track, adjunct/part time).
The level of significance was set at .05. The results of the analysis indicated there was
not a significant difference between at least two means, F(3, 349) = 1.751, p = .156. See
Table 31 for the descriptive statistics for this analysis. No post hoc was warranted. H39
was not supported.

80
Table 31
Descriptive Statistics for the Test of H39
Employment Status M SD N
Adjunct/Part-Time 3.59 0.87 123
Full-time Non-Tenure Track 3.63 0.69 82
Full-time Tenure Track 3.61 0.80 61
Full-time Tenured 3.39 0.67 87
RQ40. To what extent is there a difference in how the effectiveness of video tools
is rated based on employment status?
H40. There is a difference in how the effectiveness of video tools is rated based
on employment status.
A one-factor ANOVA was conducted to test H40. The categorical variable used
to group the dependent variable, effectiveness of video tools, was employment status
(full-time tenured, full-time tenure track, full-time non-tenure track, adjunct/part-time).
The level of significance was set at .05. The results of the analysis indicated there was
not a significant difference between at least two means, F(3, 349) = 0.864, p = .460. See
Table 32 for the descriptive statistics for this analysis. No post hoc was warranted. H40
was not supported.

81
Table 32
Descriptive Statistics for the Test of H40
Employment Status M SD N
Adjunct/Part-Time 3.97 0.91 123
Full-time Non-Tenure Track 3.93 0.75 82
Full-time Tenure Track 3.97 0.77 61
Full-time Tenured 3.79 0.84 87
Summary
Chapter 4 included the data analysis and the hypothesis testing for the 40 research
questions that guided this study. Chapter 5 contains a study summary, including an
overview of the problem, review of the methodology, and major findings. In addition,
Chapter 5 contains findings related to the literature, recommendations for future research,
and conclusions

82
Chapter 5
Interpretation and Recommendations
Chapter 5 provides a summary of the study including an overview of the problem,
purpose statement, research questions, review of the methodology, and major findings
from the hypothesis testing. The major findings are then linked to literature reviewed in
Chapter 2. The chapter concludes with implications for action and recommendations for
future research. Concluding remarks close the chapter.
Study Summary
This section provides a summary of the current study. The summary includes an
overview of the usage and perceived effectiveness of select Web 2.0 tools in the
classroom. The purpose statement, research questions, and methodology are reviewed.
Finally, major findings of the study are explained.
Overview of the problem. For years, educational technology developers and
university administrators have struggled to achieve effective implementation of
technology in classrooms (Baran, 2016; Coley et al., 1997; Khan et al., 2017; Sandholtz,
2001; Silverstein et al., 2000; U.S. Congress, 1995). As college students become more
technologically sophisticated, faculty are increasingly expected to use instructional
technologies more frequently. Faculty need to be aware of what technologies are
available, develop skills in applying available tools to teaching, and develop confidence
in the effectiveness of technologies applied to teaching and student learning.
Understanding the scope of the usage of these technology tools by faculty and their
perceptions of the effectiveness of these tools in teaching and student learning is
important in understanding implementation obstacles.

83
Purpose statement and research questions. The first purpose of the current
study was to determine faculty usage of text-based, image-based, audio, and video
technology applications as teaching tools. A second purpose of the study was to
investigate faculty perceptions about the effectiveness of these technologies as teaching
tools. A third purpose was to examine if there were relationships between faculty
demographics (age, years of teaching experience in higher education, teaching discipline,
and employment status) and faculty usage of Web 2.0 technologies. A final purpose was
to examine if there were relationships between faculty demographics (age, years of
teaching experience in higher education, teaching discipline, and employment status) and
perceived effectiveness of Web 2.0 technologies. To guide this study 40 research
questions were developed, and 40 hypotheses were tested to address the purposes of this
study.
Review of the methodology. A quantitative descriptive survey research design
was used for this study. The dependent variables included in the research study were
whether the faculty member used the Web 2.0 tools and faculty member perceptions of
the Web 2.0 tools as effective teaching and learning tools. The independent variables
included in the current research study were the faculty member’s age, years of teaching
experience, primary teaching discipline, and employment status.
Major findings. Results of the current study indicated that faculty members
almost never or never use text-based, image-based, audio, and video tools. However,
faculty indicated that text-based, image-based, audio, and video tools are effective. The
current study found no significant findings related to age having an impact on the use or
perceived effectiveness of these tools.

84
Study results indicated that the number of years of teaching experience has an
impact on the use of image-based and video tools. Faculty with 10-14 years of teaching
experience used image-based and video tools more frequently than those with 20-24
years of teaching experience. The primary discipline of the faculty also has an impact on
the use text-based, image-based, audio, and video tools. Education and Business faculty
use text-based tools more than Physical Sciences faculty. Education faculty use text-
based and image-based tools more than Arts & Humanities faculty. Other Professions
faculty use image-based tools more than Other Disciplines faculty. Education, Arts &
Humanities, and Business faculty use audio tools more than Physical Sciences faculty
and Business, Education, Social Sciences, and Business faculty use video tools more than
Physical Sciences faculty. Employment status has an impact on the use text-based and
image-based tools. Adjunct/part-time faculty members use text-based tools more than
full-time non-tenure track, full-time tenure-track, and full-time tenured faculty. Also,
full-time non-tenured faculty use image-based tools more than full-time tenured faculty.
Number of years of teaching experience has an impact on ratings of
effectiveness of text-based and video tools. Faculty with 25-29 years of teaching
experience perceived text-based tools as more effective than faculty with 30 or more
years of teaching experience. Additionally, faculty with 10-14 years of teaching
experience perceived video tools as more effective than faculty with 15-24 years of
experience. The faculty members’ primary teaching discipline impacted the perceived
effectiveness of text-based and audio tools. Education faculty perceived text-based tools
as more effective than Biological Sciences or Physical Sciences faculty. Arts &
Humanities faculty perceived that audio tools are more effective than Physical Sciences

85
faculty. Faculty employment status impacts perceived effectiveness of text-based tools.
Adjunct/part-time faculty perceive text-based tools as more effective than full-time
tenured, and full-time tenure track faculty.
Findings Related to the Literature
This section examines the current study’s findings as they relate to the literature
regarding the growth of educational technology use in the classroom and the challenges
of the integration and implementation of those technologies. Daher and Lazarevic (2014)
determined that a majority of the faculty did not use any Web 2.0 tools. They also
concluded that the faculty who did use the tools found they could engage with students
and improve classroom experience. The current study supports these findings. Moseley
(2010) found that expanded frequency in use of technology by faculty and students
increased the usefulness of the technology. The current study did not support these
findings. The current study found that while faculty reported almost never to never in
terms of use of the four Web 2.0 technologies they perceived all four tools to be effective.
Conclusions
This study reviewed the usage of select Web 2.0 tools by faculty. Additionally, it
reviewed the perceived effectiveness of those select Web 2.0 tools as teaching and
student learning tools. The results of the study have implications for university leaders
and faculty. The study’s results have created a foundation for further research for those
interested in efficient and successful implementation of educational technologies in the
classroom.
Implications for action. The research conducted as part of the current study has
implications for university academic leaders, faculty, and higher education technology

86
professionals. The indication that usage of these four tools is lower than expected should
be of concern to university academic leaders, faculty, and higher education technology
professionals. There is a significant expectation in today’s higher education landscape for
increased use of technology instruction. Student expectations are high for use of
technology in their personal and academic lives. There will be increased pressure on
faculty to use varied technology tools in instruction. The reported low use of text-based,
image-based, audio, and video tools in the current study suggests a gap between faculty
use of technology and student expectations.
For those looking to make changes or significant implementations of technology
use in the classroom, the findings from this current study could be helpful. Faculty years
of teaching experience, employment status, and teaching discipline all showed an impact
on the usage and perceived effectiveness of the tools. This information can be used to
strategically find and support early-adopters and provide a foundation for examining why
faculty struggle with implementation of new technologies.
The variances that the current study showed in use and perceived effectiveness of
technology tools based on the primary teaching discipline might also be useful to staff
engaged in offering technology oriented professional development. The results of this
study indicated that faculty in Education and Business disciplines reported using text-
based and audio tools significantly more than other disciplines. Faculty members from
these disciplines could provide workshops for faculty in disciplines where the use is not
as great by sharing examples of how varied technologies can be incorporated into
teaching. Higher education institutions may also consider having specific training on
instructional technologies for all new faculty hires. In addition, workshops related to

87
teaching technologies could be provided for all faculty. These endeavors will require
effort and a commitment of financial resources.
Recommendations for future research. This study added to the research related
to use of technology tools in higher education teaching. While this study provided
implications for academic leaders, faculty, and higher education technology leaders, there
are other areas of research that should be explored. The following are recommendations
for further research related to this topic:
1. This study looked at 4 of the 14 categories in Bower’s (2016) study on Web
2.0 tools. Future research could expand this study to include the remainder of
the 14 categories to provide additional data on usage and perceived
effectiveness of other tools used in teaching in higher education settings.
2. This study used a population of faculty from colleges and universities that
were all private not-for- profit institutions. Future research could be
conducted in public and for-profit colleges and universities.
3. This study did not directly address the question of professional development
related to the use of Web 2.0 tools. Future studies could examine the impact
of professional development on usage of Web 2.0 tools.
4. This study focused on the faculty and their usage and perceived effectiveness
of these tools. A future study could focus on students to determine how they
use these tools and how effective they perceive them as learning tools.
Concluding remarks. Today’s college campuses are filled with a wide range of
generational faculty. Baby Boomers learned from the ‘sage on the stage’. Generation X
faculty lived through a time of enormous investment and change in technology that had

88
yet to impact their daily lives. Millennials were the drivers of the first wave of the
information age, and the newest faculty, the Gen Z group, are just now entering the
faculty ranks as graduate assistants and first year college and university teachers. In
comparison, the class of traditional students entering college for fall 2019 will have been
born after the turn of the century, well into the Digital age. These students have never
lived without technology. They expect to interact with faculty using current technology
tools. This disparity between students and faculty continues. However, the speed at
which characteristics of generations change increases demands for closing the gap
between faculty members use of technology and students’ expectations.
The economics and investments around educational technology has grown
exponentially with the intention of bridging those gaps, creating new academic delivery
models, and creating efficiency in a model that has been criticized for ever escalating
costs. This study highlighted the challenges colleges and universities have related to
faculty usage and perceptions about the effectiveness of select Web 2.0 technology tools.
Implementation of these classroom technologies is less about the technology hardware
and more about the usefulness of these tools in engaging the pedagogy in a way that
creates a positive learning environment. The results of the current study suggest there is
an urgent need to increase faculty use of instructional technology tools. Current and
future students will increasingly expect faculty to use varied technology tools in teaching.

89
References
Ajjan, H., & Hartshorne, R. (2008). Investigating faculty decisions to adopt Web 2.0
technologies: Theory and empirical tests. The Internet and Higher Education,
11(2), 71-80. doi:10.1016/j.iheduc.2008.05.002
Akanegbu, A. (2013, February 28). Vision of learning: A history of classroom
projectors. Retrieved December 1, 2018, from
https://edtechmagazine.com/k12/article/2013/02/vision-learning-history-
classroom-projectors
Alexander, B. (2006, January 1). Web 2.0: A new wave of innovation for teaching and
learning? Retrieved December 1, 2018, from
https://er.educause.edu/articles/2006/1/web-20-a-new-wave-of-innovation-for-
teaching-and-learning
Allen, I. E., & Seaman, J. (2008). Staying the course: Online education in the United
States, 2008. Newburyport, MA: Sloan Consortium.
Anderson, J. (1984). Computing in schools: An Australian perspective (Vol. 2, Ser. 21).
Retrieved November 11, 2018 from
https://files.eric.ed.gov/fulltext/ED246860.pdf
Babson Survey Research Group. (2017). Higher education reports: Online and
distance education. Retrieved November 9, 2018 from
https://www.onlinelearningsurvey.com/highered.html
Bakia, M., Means, B., & Murphy, R. (2014). Learning online: What research tells us
about whether, when and how. New York, NY: Routledge.

90
Baran, E. (2016). Investigating faculty technology mentoring as a university-wide
professional development model. Journal of Computing in Higher Education,
28(1), 45-71. Retrieved November 3, 2018 from
https://link.springer.com/article/10.1007/s12528-015-9104-7
Becker, S. A., Brown, M., Dahlstrom, E., Davis, A., DePaul, K., Diaz, V., & Pomerantz,
J. (2018). NMC Horizon Report 2018 Higher Education Edition. EDUCAUSE/
Retrieved November 11, 2018 from
https://library.educause.edu/~/media/files/library/2018/8/2018horizonreport.pdf
Blessinger, P., & Wankel, C. (2012). New directions in higher education: An introduction
to using wikis, blogs, and webquests. Cutting-edge Technologies in Higher
Education, 6, 3-16.
Boston Consulting Group. (2016, July 1). Where is investment flowing in educational
technology? Retrieved February 1, 2018, from http://img-stg.bcg.com/BCG-
Where-Is-Investment-Flowing-In-Education-Technology-June-2016_tcm9-
54502.pdf
Bower, M., Hedberg, J. G., & Kuswara, A. (2010). A framework for Web 2.0 learning
design. Educational Media International, 47(3), 177-198.
Bower, M. (2016). Deriving a typology of Web 2.0 learning technologies. British Journal
of Educational Technology, 47(4), 763-777.
Bower, M. (2015). A typology of Web 2.0 learning technologies. EDUCAUSE, Feb, 8,
2015.

91
Brack, C., Samarawickrema, G., & Benson, R.(2005). Technology advances:
Transforming university teaching through professional development. In Higher
education in a changing world: Research and development in higher education.
Proceedings of the 29th HERDSA Annual Conference, Sydney, 3-6 July.
http://www.herdsa.org.au/wp-content/uploads/conference/2005/papers/brack.pdf
Brooks, D. C. (2015). ECAR study of faculty and information technology. Louisville, CO:
Educause Center for Analysis and Research, EDUCAUSE.
Buchanan, T., Sainter, P., & Saunders, G. (2013). Factors affecting faculty use of
learning technologies: Implications for models of technology adoption. Journal of
Computing in Higher Education, 25(1), 1-11.
Butler, D. L., & Sellbom, M. (2002). Barriers to adopting technology. Educause
Quarterly, 2, 22-28.
Coley, R., Cradler, J., & Engel, P. K. (1997). Computers and classrooms: The status of
technology in US schools. Princeton, NJ: Educational Testing Service.
Collins, A., & Halverson, R. (2018). Rethinking education in the age of technology: The
digital revolution and schooling in America. New York City, NY Teachers
College Press.
Constantinides, E., & Fountain, S. J. (2008). Web 2.0: Conceptual foundations and
marketing issues. Journal of Direct, Data and Digital Marketing Practice, 9(3),
231-244. Retrieved November 11, 2018 from
https://link.springer.com/article/10.1057/palgrave.dddmp.4350098

92
Corey, R. C. (2012). Digital immigrants teaching digital natives: A phenomenological
study of higher education faculty perspectives on technology integration with
English core content (Doctoral dissertation, Drake University). Retrieved from
https://escholarshare.drake.edu/handle/2092/1636
Cuban, L. (1986). Teachers and machines: The classroom use of technology since 1920
[Kindle DX version]. Retrieved November 11, 2018 from Amazon.com
Daher, T., & Lazarevic, B. (2014). Emerging instructional technologies: Exploring the
extent of faculty use of web 2.0 tools at a midwestern community college.
TechTrends, 58(6), 42-50
Dunn, J. (2011, April 18). The evolution of classroom technology. Retrieved from
http://www.edudemic.com/classroom-technology/
Dziuban, C., Graham, C. R., Moskal, P. D., Norberg, A., & Sicilia, N. (2018). Blended
learning: The new normal and emerging technologies. International Journal of
Educational Technology in Higher Education, 15(1), 3.
Ed Tech. (2016). Ed tech chill: Ed tech startups see funding slump and deals flatline.
Retrieved September 8, 2018, from CBInsights website:
https://www.cbinsights.com/research/ed-tech-2016-funding-drop/
Ellis, R. (2009). Students' experiences of e-learning in higher education: the ecology of
sustainable innovation: New York, NY: Routledge.
Everett, R. R. (1980). Whirlwind. A history of computing in the twentieth century, 365-
384. doi:10.1016/b978-0-12-491650-0.50025-3

93
Fabry, D. L., & Higgs, J. R. (1997). Barriers to the effective use of technology in
education: Current status. Journal of Educational Computing Research, 17(4),
385–395. https://doi.org/10.2190/C770-AWA1-CMQR-YTYV
Fahmy, M. F. (2004). Thinking about technology effects on higher education. Journal of
Technology Studies, 30(1), 53-58.
Fraenkel, J. R., Wallen, N. E., & Hyun, H. H. (2012). How to design and evaluate
research in education. New York, NY: McGraw-Hill
Georgina, D. A., & Hosford, C. C. (2009). Higher education faculty perceptions on
technology integration and training. Teaching and Teacher Education, 25(5), 690-
696.
Georgina, D. A., & Olson, M. R. (2008). Integration of technology in higher education: A
review of faculty self-perceptions. The Internet and Higher Education, 11(1), 1-8.
Grosseck, G. (2009). To use or not to use web 2.0 in higher education? Procedia - Social
and Behavioral Sciences, 1(1), 478-482.
doi:http://dx.doi.org/10.1016/j.sbspro.2009.01.087
Hall, G., & Ivaldi, A. (2017). A qualitative approach to understanding the role of lecture
capture in student learning experiences. Technology, Pedagogy and Education,
26(4), 383-394.
Hall, O.P., Jr. (2013). Assessing faculty attitudes toward technological change in
graduate management education. Journal of Online Learning and Teaching, 9(1),
39. Retrieved on February 15, 2016 from
http://search.proquest.com/docview/1500385874?accountid=40611

94
Hamrick, K. B. (1996). The history of the hand-held electronic calculator. The American
Mathematical Monthly, 103(8), 633-639.
Haran, M. (2015, March 29). A history of education technology. Retrieved on November
9, 2018 from http://institute-of-progressive-education-and-learning.org/a-history-
of-education-technology/
Hickson, R. (2017). The relationship between self-efficacy and teachers' ability to
integrate technology (Doctoral dissertation, Liberty University). Retrieved on
September 21, 2018 from https://digitalcommons.liberty.edu
Indiana University. (2018). FSSE - National Survey of Faculty Engagement. Retrieved
November 3, 2018, from http://fsse.indiana.edu/html/toolsServices.cfm
Keengwe, J. (2007). Faculty integration of technology into instruction and students’
perceptions of computer technology to improve student learning. Journal of
Information Technology Education: Research, 6, 169-180.
Keengwe, J., & Kidd, T. T. (2010). Towards best practices in online learning and
teaching in higher education. MERLOT Journal of Online Learning and Teaching,
6(2), 533-541.
Khan, M. A., Omrane, A., & Rodríguez, A. M. (2017). A theoretical analysis of factors
influencing the decision of faculty to use educational technologies in the context
of institutions of higher education. Advances in Social Sciences Research Journal,
4(1), 147-164.

95
Kim, D. J., Yue, K. B., Hall, S. P., & Gates, T. (2009). Global diffusion of the internet
XV: Web 2.0 technologies, principles, and applications: A conceptual framework
from technology push and demand pull perspective. Communications of the
Association for Information Systems, 24(1), 38.
Kim, K. J., & Bonk, C. J. (2006). The future of online teaching and learning in higher
education. EDUCAUSE quarterly, 29(4), 22-30.
King, J. (Ed.). (2017, January 1). U.S. Dept of Education - Reimagining the role of
technology in higher education. Retrieved on November 11, 2018 from
https://tech.ed.gov/files/2017/01/Higher-Ed-NETP.pdf
Lindsey, M. (n.d.). Member listing. Retrieved November 3, 2018, from
http://www.kscolleges.org/colleges-universities
Long, K. C. (2017). E-learning, information technology, and student success in higher
education. Oxford Research Encyclopedia of Business and Management.
Retrieved November 11, 2018 from
http://oxfordre.com/business/view/10.1093/acrefore/9780190224851.001.0001/ac
refore-9780190224851-e-78
Lockwood, J.A. (1996). A luddite in the classroom: Putting technology in its place,
American Entomologist, 2(2), 72–75. Retrieved on October 7, 2018 from
https://doi.org/10.1093/ae/42.2.72
Lunenburg, F. C., & Irby, B. J. (2008). Writing a successful thesis or dissertation: Tips
and strategies for students in the social and behavioral sciences. Thousand Oaks,
CA: Corwin Press.

96
Morris, L. V. (2018). Reconsidering the future of undergraduate education. Innovative
Higher Education, 43(2), 73-75.
Moseley, W. L. (2010). Student and faculty perceptions of technology's usefulness in
community college general education courses. (Doctoral Dissertation, The
University of Nebraska-Lincoln). Retrieved on December 2, 2018 from
https://digitalcommons.unl.edu
Plimpton, G. A. (1916). The hornbook and its use in America. Retrieved June 06, 2018,
from http://www.americanantiquarian.org/proceedings/44806617.pdf
Pomerantz, J., & Brooks, D. C. (2017). ECAR study of faculty and information
technology: EDUCASE Center for Analysis and Research. Louisville, CO:
EDUCAUSE
Pomerantz, J., Brown, M., & Brooks, D. C. (2018). Foundations for a next generation
digital learning environment: faculty, students, and the LMS. EDUCASE Center
for Analysis and Research, Louisville, CO: EDUCAUSE.
Reiser, R. A. (2001). A history of instructional design and technology: Part I: A history
of instructional media. Educational Technology Research and Development,
49(1), 53.
Ringstaff, C., & Kelley, L. (2002). The learning return on our educational technology
investment. Retrieved on October 18, 2018 at: http://rtecexchange. edgateway.
net/learningreturn. pdf.

97
Ripley, A. (2018, September 11). Why is college in America so expensive? Retrieved
December 1, 2018, from
https://www.theatlantic.com/education/archive/2018/09/why-is-college-so-
expensive-in-america/569884/
Sackett, P. R., & Larson, J. R. (1990). Research strategies and tactics in industrial and
organizational psychology. In M. D. Dunnette & L. M . Hough (Eds.), Handbook
of industrial and organization psychology (2nd
ed.), pp.419-489. Palo Alto, CA:
Consulting Psychologist Press.
Sandholtz, J. H. (2001). Learning to teach with technology: A comparison of teacher
development programs. Journal of Technology and Teacher Education, 9(3), 349-
374.
Sankey, M., & Hunt, L. (2017). Flipped university classrooms: Using technology to
enable sound pedagogy. Journal of Cases on Information Technology, 16(2). pp
26-38. Retrieved on June 3, 2018 from http://www.igi.global.com/article/flipped-
university-classrooms/112089
Sawyer, L. M. (2017). Perceptions and practice: The relationship between teacher
perceptions of technology use and level of classroom technology integration
(Doctoral Dissertation, Southeastern University). Retrieved November 10, 2018
from https://firescholars.seu.edu
Schaffhauser , D. (2018, January 29). Global ed tech investment soars to record high.
Retrieved June 1, 2018, from
https://campustechnology.com/articles/2018/01/29/global-ed-tech-investment-
soars-to-record-high.aspx

98
Shulman, R. (2018, January 26). EdTech investments rise to a historical $9.5 billion:
what your startup needs to know. Retrieved December 1, 2018, from
https://www.forbes.com/sites/robynshulman/2018/01/26/edtech-investments-rise-
to-a-historical-9-5-billion-what-your-startup-needs-to-know/#7e212bc73a38
Silverstein, G., Frechtling, J., & Miyaoka, A. (2000). Evaluation of the use of technology
in Illinois public schools: Final report. Rockville, MD: Westat.
Skinner, B. F. (1958). Teaching machines. Science, 128(3330), 969-977.
Singer, N. (2017, May 13). How Google took over the classroom. Retrieved December 1,
2018, from https://www.nytimes.com/2017/05/13/technology/google-education-
chromebooks-schools.html
U.S. Congress. (1995). Teachers and technology: Making the connection. Washington,
DC: Government Printing Office I.
Venkatesh, V., Croteau, A. M., & Rabah, J. (2014, January). Perceptions of effectiveness
of instructional uses of technology in higher education in an era of Web 2.0. In
2014 47th
Hawaii international conference on system sciences (pp. 110-119).
IEEE.
Wankel, L. A., & Blessinger, P. (2012). New vistas in higher education: An introduction
to using social technologies. Cutting-edge Technologies in Higher Education, 6,
3-16.
Wingo, N. P., Ivankova, N. V., & Moss, J. A. (2017). Faculty perceptions about teaching
online: Exploring the literature using the technology acceptance model as an
organizing framework. Online Learning, 21(1), 15-35

99
Appendices

100
Appendix A: Survey Instrument

101
Use and Perceived Effectiveness of Web 2.0 Tools for
Teaching and Learning at Kansas Independent College
Association Member Institutions
Survey
Doctoral Dissertation Study - Andy Jett - Baker
University
College or University where you are Currently Employed*
Age*
24-34 35-44 45-54 55-64 65-74 75 and older
Number of Years of employment as a faculty member?*
0-4 5-9 10-14 15-19 20-24 25-29 30 or more years
Explanation of Discipline Categories:
Arts & Humanities (Art, English, History, Journalism, Language, Literature, Music,
Philosophy, Speech, Theater, Theology )
Biological Sciences (Biology, Biochemistry, Botany, Environmental Science, Life
Science)
Business (Accounting, Business Administration, Finance, International Business,
Marketing, Management)
Education (Business Education, Elementary Education, Secondary Education, Music
Education, Physical Education, Special Education)
Engineering (Aeronautical, Civil, Chemical, Electrical, Industrial, Materials,
Mechanical)
Physical Sciences (Astronomy, Atmospheric, Chemistry, Earth Science, Mathematics,
Physics, Statistics)
Other Professions ( Architecture, Urban Planning, Health Technology, Law, Library
Science, Medicine, Dentistry, Veterinarian, Nursing, Pharmacy, Allied Health, Therapy)
Social Sciences (Anthropology, Economics, Ethic Studies, Geography, Political Science,
Psychology, Social Work, Sociology, Gender Studies)

102
Other Disciplines (Agriculture, Communications, Computer Science, Family Studies,
Conservation, Kinesiology, Criminal Justice, Military Science, Sports Management,
Public Administration, Technical/Vocational).
Primary Discipline Category*
Arts & Humanities Biological Sciences Business Education
Engineering Physical Sciences Other Professions (see description above)
Social Sciences Other Disciplines (see description above)
Employment Status (what best fits your current status)*
Full-time Tenured Full-time Tenure Track Full-time Non-Tenure Track
Adjunct / Non-Full Time Faculty
Below are four categories of Web 2.0 tools and explanations and examples
of each.
For each category you will be asked about your experience with these tools
when used as part of courses that are primarily taught as on-ground/face
to face.
Text-Based Tools
Examples:
Synchronous Text Discussion - Exchange of text-based comments in real time
Discussion Forums - Asynchronous text discussions organized by threads or themes.
Note-taking and Document Creation - Collaborative authoring of documents in real time
To what extent do you use any of these text-based tools for instruction of your on-ground
classes?*
never use almost never occasionally/sometimes almost every time
frequently use
Text-based tools (as described above) are effective teaching tools?*
strongly disagree disagree neither agree or disagree agree strongly
agree

103
Image-Based Tools
Examples:
Image Sharing - Asynchronous public sharing of images
Image Creation and Editing - Individual creation and editing of images shareable via URL
Drawing - Use of mouse/or digital pen as a tool to create pictures which can be shared via URL
Online White boarding - Use of line, shape, and text tools to structure illustrative processes
Diagramming - Templates for creating diagrams and flow charts
Mind mapping - Creation of images to represent a knowledge network
Word Clouds - Creation and sharing of visual arrangements of key words
To what extent do you use any of these Image-Based tools for instruction of your on-
ground classes?*
never use almost never occasionally/sometimes almost everytime
frequently use
Image-based tools (as described above) are effective teaching tools?*
strongly disagree disagree neither agree or disagree agree strongly
agree
Audio Tools
Examples:
Audio Sharing - Upload and share audio recordings, for instance - podcats
Audio Creation and Editing - Record and often remix audio directly through the browser
To what extent do you use any of these Audio tools for instruction of your on-ground
classes?*

104
never use almost never occasionally/sometimes almost everytime
frequently use
Audio tools (as described above) are effective teaching tools?*
strongly disagree disagree neither agree or disagree agree strongly
agree
Video Tools
Examples:
Video Sharing - Share video content via public repositories
Video Creation and Editing - Create and edit videos through the browser
Video Streaming - Publicly broadcast a live video stream from their video camera or webcam
To what extent do you use any of these Video tools for instruction of your on-ground
classes?*
never use almost never occasionally/sometimes almost every time
frequently use
Video tools (as described above) are effective teaching tools?*
strongly disagree disagree neither agree or disagree agree strongly
agree

105
Appendix B: Baker University IRB Approval

106
Baker University Institutional Review Board
December 17th, 2018 Dear Andy Jett and Tes Mehring, The Baker University IRB has reviewed your project application and approved this project under Expedited Status Review. As described, the project complies with all the requirements and policies established by the University for protection of human subjects in research. Unless renewed, approval lapses one year after approval date. Please be aware of the following: 1. Any significant change in the research protocol as described should be reviewed
by this Committee prior to altering the project. 2. Notify the IRB about any new investigators not named in original application. 3. When signed consent documents are required, the primary investigator must
retain the signed consent documents of the research activity. 4. If this is a funded project, keep a copy of this approval letter with your
proposal/grant file. 5. If the results of the research are used to prepare papers for publication or oral
presentation at professional conferences, manuscripts or abstracts are requested for IRB as part of the project record.
Please inform this Committee or myself when this project is terminated or completed. As noted above, you must also provide IRB with an annual status report and receive approval for maintaining your status. If you have any questions, please contact me at [email protected] or 785.594.4582. Sincerely,
Nathan Poell, MA Chair, Baker University IRB Baker University IRB Committee Scott Crenshaw Jamin Perry, PhD Susan Rogers, PhD Joe Watson, PhD

107
Appendix C: Email to KICA CIOs and Directors of Instructional Technology at
KICA Institutions

108
Email to CIO and Director of IT at each school in population:
Hello all! Hope you are staying warm….this is going to be a crazy week for wind chill---
stay safe!
I have a personal request. I am completing my Ed.D. in Higher Ed Leadership here at
Baker and for my dissertation I am doing a study on the use and perception of Web 2.0
tools by KICA member faculty.
I have gone to each schools website directly and pulled down (sometimes guessing) email
addresses for faculty and will be emailing them later this week.
I am hoping maybe you could give your faculty a ‘heads up’ and letting them know it is
not SPAM and ask them to take the time to take the short survey.
Below is the proposed email I will be sending.
Let me know if you have any questions.

109
Appendix D: Initial Invitation to Participate in the Survey

110
To: Faculty at KICA Institutions
From: Andy Jett – Ed.D. Candidate – Baker University
Date:
Subject: Doctoral Dissertation Study
Dear Faculty member:
I am currently a doctoral student at Baker University, working to complete my
dissertation. As part of this study I am investigating faculty who teach at member
schools of KICA (Kansas Independent Colleges Association) and their usage and
perception of effectiveness of Web 2.0 tools. I kindly ask for your participation in a
survey, which can be found by clicking on the following link:
https://bakeruniversity.formstack.com/forms/andys_edd_dissertation_survey
Bearing in mind the value of your time, the entire survey should take no longer
than 15 minutes for you to complete. While the majority of the survey is multiple-choice
format, it will require you to review some definitions of terms related to categories of
Web 2.0 tools.
Please rest assured that your answers will be kept anonymous. All responses
will be kept confidential and combined with responses from other participants in
summary form. The completion of the survey will indicate your consent to participate
and permission to use the information provided by you in my research study. Lastly,
please know you also have the option to not any question(s) included on the survey that
causes you concern. Likewise, you may discontinue participation at any point during the
survey.
Thank you in advance for your time and participation in the study. I sincerely
appreciate your willingness to support this work. Please do not hesitate to let me know if
you have any questions or concerns regarding the survey or if you would like a copy of
the results. I can be reached anytime at [email protected] or you are welcome to call me
personally at (816) 520-4081.
At the end of the survey you can choose to enter into a drawing for a $100 Amazon Gift
card. Once the survey has concluded we will communicate with the winner via the email
provided.

111
Appendix E: Reminder Invitation to Participate in the Survey

112
To: Faculty at KICA Institutions
From: Andy Jett – Ed.D Candidate – Baker University
Date:
Subject: Doctoral Dissertation Study - Reminder
Dear Faculty member:
This is a kind reminder for your participation in my dissertation survey.
I am currently a doctoral student at Baker University, working to complete my
dissertation. As part of this study I am investigating faculty who teach at member
schools of KICA (Kansas Independent Colleges Association) and their usage and
perception of effectiveness of Web 2.0 tools. I kindly ask for your participation in a
survey, which can be found by clicking on the following link:
https://bakeruniversity.formstack.com/forms/andys_edd_dissertation_survey
Bearing in mind the value of your time, the entire survey should take no longer
than 15 minutes for you to complete. While the majority of the survey is multiple-choice
format, it will require you to review some definitions of terms related to categories of
Web 2.0 tools.
Please rest assured that your answers will be kept anonymous. All responses
will be kept confidential and combined with responses from other participants in
summary form. The completion of the survey will indicate your consent to participate
and permission to use the information provided by you in my research study. Lastly,
please know you also have the option to not any question(s) included on the survey that
causes you concern. Likewise, you may discontinue participation at any point during the
survey.
Thank you in advance for your time and participation in the study. I sincerely
appreciate your willingness to support this work. Please do not hesitate to let me know if
you have any questions or concerns regarding the survey or if you would like a copy of
the results. I can be reached anytime at [email protected] or you are welcome to call me
personally at (816) 520-4081.
At the end of the survey you can choose to enter into a drawing for a $100 Amazon Gift
card. Once the survey has concluded we will communicate with the winner via the email
provided.