Embed Size (px)
Citation preview

12/12/2016
1
Faculty Training for Online Course Development:
Connecting to Student SuccessElizabeth Normandy, Ph.D.
Associate Vice Chancellor of Planning and AccreditationUniversity of North Carolina Pembroke
Ed Damman, Ph.D.Senior Instructional Designer
Center for Innovation in Teaching and LearningUniversity of Illinois at Urbana-Champaign
2016 ANNUAL MEETINGDecember 3‐6, 2016
Hyatt Regency Atlanta and Atlanta Marriott Marquis Atlanta, Georgia
Location of Presentation MaterialsLinks to the final version of the presentation and supporting information.
PowerPoint presentation:https://uofi.box.com/v/2016-SACS-PowerPoint
Folder containing all files:https://uofi.box.com/v/2016-SACS-PresentationMaterial
Note: The links in the 2-page PDF, located on the SACS-COC website homepage under Concurrent Session Handouts (session CS-118) must be manually typed in to the browser; they were not hyperlinked.
NASNTI Grant Overview• UNCP received the NASNTI III grant from the Office of Postsecondary Education, U.S. Department of Education in 2012.
• $350,000 per year for five years. Grant ended in fall 2015.
• HOPES (Harnessing Opportunities through Proactive Education) Program is a part of the grant. Awarded approximately $40, 000 per year for online or hybrid course design or redesign.
• Seeks to provided funding to faculty to design or redesign courses to be offered in an online or hybrid format.
• Improve the quality of online courses through quality assurance training and course review using the Quality Matters rubric.

12/12/2016
2
Workshop Overview• Offered Monday after Fall and Spring semesters
• December 2012 – First group was fourteen faculty
• 124 grants awarded through December 2015. Twenty‐three faculty did not submit for review
• Typically a one‐day workshop (9 to 4)
• QM Overview
• Overview of QM‐Ready Course Design Template
• Course Design Best Practices and Examples from Courses
Breakout & Report Back #1•Discuss what faculty training for building and teaching
online classesexists at your own institution.
(hopefully this will be a brief discussion of around 3 minutes)
•Report back the range of institutional experiences from your group
Application Process (and Intended Outcome)
• Requirements for acceptance• To be eligible, faculty must be employed full‐time and plan to teach the course in one year.
• Applicants must obtain the consent of their department chair and dean prior to submitting the proposal.
• Acceptance rate• Most all applicants were accepted. The only exceptions were faculty who had already received funds from the Office of Distance Education to design an online course or who had already received funds from the NASNTI grant.

12/12/2016
3
Application Process (and Intended Outcome)
• Mechanics of Contract• Committee reviews applications for how the course will improve educational offerings, evidence of student demand, rational for offering the course online, past teaching experience, willingness to attend training, and willingness to submit the course for review.
• Submission of redesigned course for review by Committee for Online Quality required.
• Stipend of $3000, payable after Committees completes the review
• Outcomes • Designed course to be taught within 1 year.
• Faculty implementation of changes to the course suggested by the review committee.
Workshop Participants (and Design Specifics)
• Participant Demographics
• Approximately half of the applicants had previous experience teaching online.
• Several departments with large online offerings went through as a group.
• Workshop Design Specifics
• Based on Quality Matters
• Multiple Formats: One‐day most popular
• Presentation style format with limited hands‐on and consulting
• Typical agenda located in folder with other presentation information.
Left Pocket
• Agenda
• PowerPoint slides ‐ Introduction to QM and to the QM Rubric
• QM rubric score sheet
• QM annotated rubric
• QM rubric mapped to Blackboard course template
• QM alignment handout
Right Pocket• Screen dumps from Blackboard template• Gagne’s Nine Events of Instruction• Course Organization Worksheet, Module Panning Worksheet
• Handouts on learning objectives and assessments
• Bloom’s Taxonomy Breakdown: Roles, Process Verbs, and Products
• The Seven Principles for Good Practice in Undergraduate Education
Workshop Agenda and Materials

12/12/2016
4
QM Ready Course Template (Blackboard)
Faculty Satisfaction of Workshop• Faculty who attended the workshop were very complimentary of the presentation.
• Most reported learning many valuable things that they were able to implement.
For example,“This training inspired me to complete a certificate programs with Online Learning Consortium.”
“The workshop gave me ideas that help me engage my students better.”
“Tips on layout, consistency, accessibility, and adaptive release options were all very useful”.
“…the facilitation ideas made the design process clearer, especially regarding how toalign course and module objectives with the course assessments.
“In my opinion every faculty should attend this workshop. It was very usefulto me”
Submissions for Stipend Payment• Number of Grants Awarded
• Year 1 – 14 (Spring only)
• Year 2 – 37 (Fall and Spring)
• Year 3 – 36 (Fall and Spring)
• Year 4 – 28 (Fall and Spring)
• Year 5 – 9 (Fall only)
• Total – 124 (approximately half of all faculty who teach online)
• Number of Submissions—101 faculty submitted a redesigned course for review (81.5% of grants awarded)
• Number of Redesigned Courses Taught—99 faculty taught the redesigned course ( 79.8 % of grants awarded)

12/12/2016
5
Course Quality (Observation by Committee)
• Peer reviewers were experienced online instructors.
• They observed that the redesigned courses were of exceptional quality.
• They based this assessment upon their extensive knowledge of and experience with online courses.
• Of the more than one hundred courses they reviewed, the peer reviewers sent less than five courses back to the instructor for further improvement.
Foundation of Literature Search
Faculty Training
Student Grades
Course Design
Marek, K. (2009). Learning to teach online: Creating a culture of support for faculty.
Sun, J. and de la Rosa, R. (2015). Faculty training and student perceptions: Does quality matter?
This study ‐ Intersects all three constructs
Jaggers, S. S. and Xu, D. (2016). How do online course design features influence student performance?
Creating a Culture of Faculty SupportMarek (2009) reports on a study of institutional support for training faculty.
The results suggest a model of institutional support that includes faculty course release, program level training and support, and structured mentoring. Implementation of such a model will help institutions create a culture of support for online teaching.
The model provided a basis for institutions’ planning for helping faculty prepare new ways of teaching in a rapidly changing environment.
Marek concluded that universities should see their commitment to faculty development in this area as a significant investment in institutional quality.

12/12/2016
6
Training, Course Design, & LearningSun and de la Rosa (2015) explored the relationship between faculty training using the Quality MattersTM standards and the online course quality as perceived by the students. Results suggest that faculty training significantly enhances learner interaction. The results of faculty training on learning objectives, outcome assessments, and instructional materials are marginally significant.
Jaggers and Xu (2016) concluded that while well organized courses with well‐specified learning objectives may be desirable, these qualities may not have an impact on student grades per se. Only the area of interpersonal interaction predicted student grades in the course.
Research Questions• Research question 1: Faculty report increased satisfaction in teaching
(survey question #5)
• Research question 2: Faculty perceived decreased student support needs(survey question #6)
• Research question 3: Faculty perceived increased student satisfaction(survey question #9)
• Research question 4: Faculty perceived increased student learning(survey question #10 w/ insights from survey questions #7 and #8)
All research questions address the redesigned course versus the same coursetaught before the workshop.
Statistical Analysis – Overview• Data collected from workshop participants N=60 n=50 (83.34%)
• 10‐question survey administered through Survey Monkey
• 2 questions demographic, 2 questions application of workshop ideas
• 6 questions classified as potential outcomes of a redesigned course
• Initial survey sent 11/04/2016, follow‐ups on 11/17/2016 and 11/30/2016
• Nonparemetric Analysis with SPSS v.24• 6 potential outcomes collapsed from 5 Likert‐type response into binomial (yes/no)
• 1‐Sample Binomial: Statistical significance of outcomes exceeding 50/50 chance
• Test re‐run grouped by online teaching experience (+/=/‐)
• Statistical significance set at .05 for entire sample, .10 on groups

12/12/2016
7
Survey Question #1
Survey Question #2
Survey Question #3

12/12/2016
8
Survey Question #4
Survey Question #5
Survey Question #6

12/12/2016
9
Survey Question #7
Survey Question #8
Survey Question #9

12/12/2016
10
Survey Question #10
Collapsing Categories - Questions 1&2
Collapsing Categories - Questions 5-10

12/12/2016
11
Grouped Count – Survey Question #10
Increase in Student LearningGrouped by Online Teaching Experience
AboveAverage
Yes = 9No = 11
(.82)
Aprox.Average
Yes = 8No = 6
([VALUE]) BelowAverage
Yes = 12No = 4
([VALUE])
0.00
0.50
1.00
1.50
2.00
2.50
3.00
3.50
Ra
tio
of
Ye
s t
o N
o
Results• Research question 1: Faculty report increased satisfaction in teaching
Statistically Significant at .05 for entire sample.
• Research question 2: Faculty perceived decreased student support needs
Statistically Significant at .05 for entire sample.
• Research question 3: Faculty perceived increased student satisfaction
Statistically Significant at .05 for below average online teaching experience group.
• Research question 4: Faculty perceived increased student learning
Marginally Significant at .10 for below average online teaching experience group.

12/12/2016
12
Discussion• All survey respondents gained some new ideas; all made some changes to their redesigned course. Nearly 75% reported quite a few or higher to both.
If a goal of the workshop was to expose faculty to new ideas that could be implemented into their courses, that goal was met overwhelmingly.
• Eighty‐four % of survey respondents reported an increase of satisfaction in teaching their redesigned course; this was statistically significant @ .05.
Regardless of the effect on student learning, the increased satisfactionof instructors may possibly offset the time spent to attend theworkshop and redesign the course.
Discussion• Sixty‐six % of respondents reported that students needed less assistance in navigating the redesigned course; this was statistically significant @ .05.General standard one of Quality Matters addresses course overview and introduction; that standard was stressed heavily in the workshop. It would appear that the focus on this standard had an impact on students.
• The remaining 4 variables, deemed to be positive outcomes of the trainingquality of student interaction (SQ#7), increased quality of graded assignments (SQ#8) increased student satisfaction (SQ#9) and increased student learning (SQ#10)
were not found to be statistically significant overall;however, in the below average online teaching experience group, two were significant at .05 and the other two were “marginally”significant at .10 .
Discussion• A linear relationship is indicated in the group analysis of these 4 outcomes, suggesting that as online teaching experience decreases, the percentage of respondents reporting an increase in the 4 outcome variables rises.
Many of the 40‐some instructors who created new courses (not included in this study) also had below average online teaching experience.It is possible their courses would also have positive effects due to the training.
‐0.50
1.50
3.50 Above Average
Below Average
0.00
2.00
4.00Above Average
Below Average

12/12/2016
13
Considerations for Further StudySeveral possible research questions:
• Attrition rates (based on DWF) of redesigned vs. original course
• Grade difference of redesigned vs. original course
Data needed from Registrar’s office:
• The number of drops and withdrawals from each course
• Students’ grade in course (also students’ GPA that semester as a co‐variate)
All data will compare courses before and after redesign
Questions
We’ll entertain questions as time permits reserving the last 5 minutes for Breakout Session #2.
Breakout & Report Back #2•Discuss what types of things this presentation described
in faculty online course design training that would or wouldn’t work at your institution.
(hopefully this will be a brief discussion of around 5 minutes)
•Report back the range of institutional experiences from your group.

12/12/2016
14
Summary and Conclusions
Discussion will reflect on participants’ comments and questions from the break‐out session.
Please direct inquiries regarding this study to:
ReferencesJaggers, S. S. and Xu, D. (2016). How do online course design features influence student performance? Computers & Education 90 (2016), 270 – 284.
Marek, K. (2009). Learning to teach online: Creating a culture of support for faculty. J. of Education for Library and Information Science, 50 (4).
Sun, J. and de la Rosa, R. (2015). Faculty training and student perceptions: Does quality matter? Internet Learning 4 (1) article 4.
Faculty Training for Online Course Development:
Connecting to Student Success
Supplemental InformationThe following slides were not shown
during the presentation in Atlanta2016 ANNUAL MEETINGDecember 3‐6, 2016
Hyatt Regency Atlanta and Atlanta Marriott Marquis Atlanta, Georgia

12/12/2016
15
Grouped Count – Survey Question #5
Increase in Instructor SatisfactionGrouped by Online Teaching Experience
AboveAverage
Yes = 17No = 3(5.67)
Aprox.Average
Yes = 10No = 4
([VALUE]) BelowAverage
Yes = 14No = 2
([VALUE])
0.00
1.00
2.00
3.00
4.00
5.00
6.00
7.00
8.00
Ra
tio
of
Ye
s t
o N
o
Grouped Count – Survey Question #6

12/12/2016
16
Decrease in Student Navigation SupportGrouped by Online Teaching Experience
AboveAverage
Yes = 15 No = 5(3.00)
Aprox.Average
Yes = 9No = 5
([VALUE])
BelowAverage
Yes = 9No = 7
([VALUE])
0.00
0.50
1.00
1.50
2.00
2.50
3.00
3.50
Ra
tio
of
Ye
s t
o N
o
Grouped Count – Survey Question #7
Increase in Student SatisfactionGrouped by Online Teaching Experience
AboveAverage
Yes = 8No = 12(0.67)
Aprox.Average
Yes = 7No = 7
([VALUE])Below
Average
Yes = 12No = 4
([VALUE])
0.00
0.50
1.00
1.50
2.00
2.50
3.00
3.50
Ra
tio
of
Ye
s t
o N
o

12/12/2016
17
Grouped Count – Survey Question #8
Increased Quality in Graded AssignmentsGrouped by Online Teaching Experience
AboveAverage
Yes = 10No = 10(1.00)
Aprox.Average
Yes = 8No = 6
([VALUE]) BelowAverage
Yes = 12No = 4
([VALUE])
0.00
0.50
1.00
1.50
2.00
2.50
3.00
3.50
Ra
tio
of
Yes
to
No
Grouped Count – Survey Question #9
12/12/2016
18
Increase in Student SatisfactionGrouped by Online Teaching Experience
AboveAverage
Yes = 7No = 12(0.58)
Aprox.Average
Yes = 7No = 7
([VALUE])Below
Average
Yes = 13No = 3
([VALUE])
0.00
0.50
1.00
1.50
2.00
2.50
3.00
3.50
4.00
4.50
5.00
Ra
tio
of
Ye
s t
o N
o
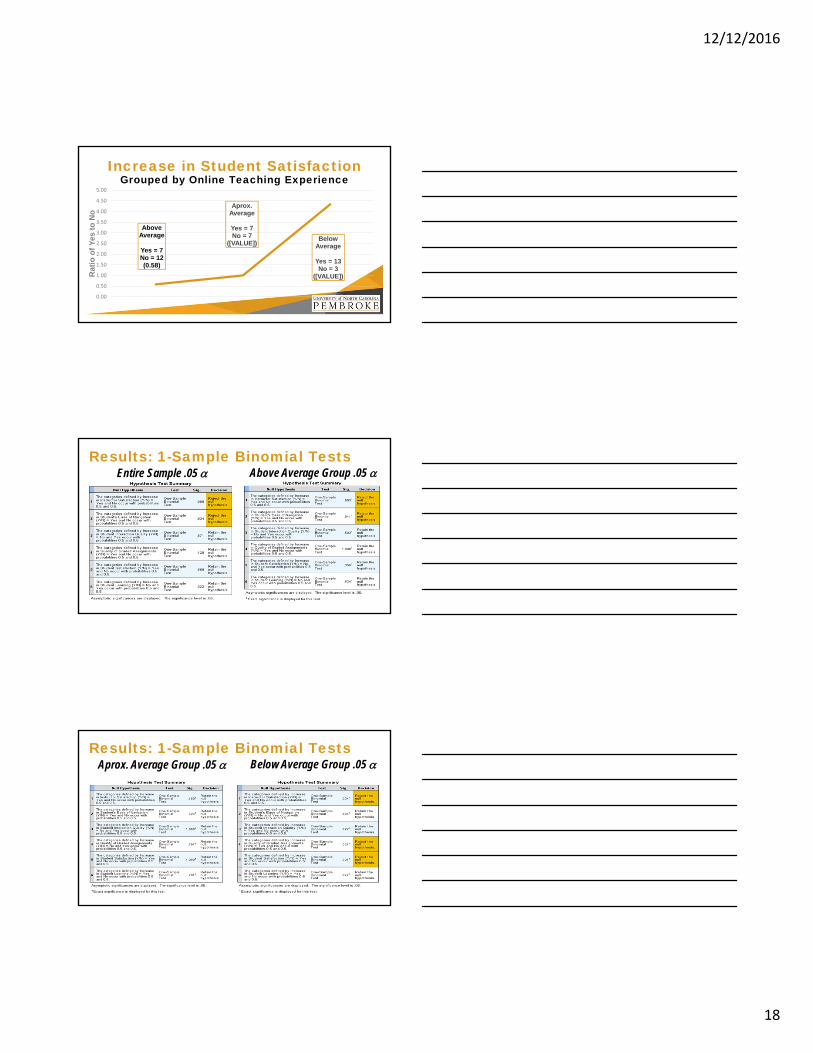
Results: 1-Sample Binomial TestsEntire Sample .05 Above Average Group .05
Results: 1-Sample Binomial TestsAprox. Average Group .05 Below Average Group .05

12/12/2016
19
Results: 1-Sample Binomial TestsEntire Sample .10 Above Average Group .05
Results: 1-Sample Binomial TestsAprox. Average Group .10 Below Average Group .10