Embed Size (px)
Citation preview

2014 Factsof the Property & Casualty Insurance Industry

The FACTS of the Property & Casualty Insurance Industry is published by Insurance Bureau of Canada (IBC), the trade association representing Canada’s private property and casualty (P&C) insurance companies. IBC has published FACTS since 1972 to provide a snapshot of the state of the P&C insurance industry.
Data in 2014 FACTS have been gathered from several national and international sources, including IBC. Data are from 2011, 2012 or 2013 depending on when sources release their information.
In some instances, fi gures may not add up to 100% as a result of rounding. Also because sources collect data in diff erent ways, there may be small diff erences among similar data.
36th edition, 2014 ISSN 1197 3404
FACTS of the Property & Casualty Insurance Industry in Canada 2014

12014 | IBC Facts
The year 2014 is a big year for IBC – it’s our 50th anniversary as the trade association representing the property and casualty insurance industry in Canada. Anniversaries are always a time of refl ection. From my offi ce window in Toronto I can look down on the old Maple Leaf Gardens. Fifty years ago in that building, the Leafs won the Stanley Cup for the third year in a row and the Beatles performed on their fi rst North American tour. Today the Gardens is a grocery store, the Beatles have long since disbanded and the Leafs – well, there’s always hope.
IBC, on the other hand, is more vital than ever. Indeed, from its inception, IBC has moved from strength to strength – in its early days, IBC helped to develop sophisticated data collection processes; we were early advocates for seatbelts and graduated licensing programs; and we successfully made the case for competition in auto insurance in several provincial campaigns.
Today we’re leading the national conversation on climate adaptation and earthquake preparedness. And we’re continuing to educate consumers about safety, including the risks of distracted driving. This year, we also helped to start CANATICS, a non-profi t organization that will use the latest technology to analyze pooled auto insurance industry data to help identify fraud. That’s important to all auto insurance customers.
The 2014 edition of FACTS of the Property and Casualty Insurance Industry captures our industry’s challenges and accomplishments.
As always, in this latest edition you’ll fi nd many facts and fi gures. You’ll fi nd a current tally of how much insurers collected in insurance premiums and how much they’ve paid out in claims on home, car and business insurance. And you’ll fi nd out how much our industry paid in various taxes to various governments and how much insurers have in total assets and invested assets. All of this information is important for telling our industry’s story.
But one number stands out from the rest because of its sheer size. And that’s the number $3.2 billion, which is the estimate of insured losses as a result of natural catastrophes for 2013.
That number is more than double the previous year’s and is the highest for insured losses in Canadian history. It refl ects a year of catastrophes that included the severe fl ooding in southern Alberta, which was the costliest natural disaster ever at more than $1.72 billion in insured losses. And it refl ects the huge impact that severe weather is having on the lives of Canadians.
IBC has advocated vigorously since 2009 for Canadians and their governments to tackle climate change and the need to adapt to severe weather. And as an industry we’ve committed resources
to the issue with the development of MRAT, which stands for “municipal risk assessment tool.” MRAT is an innovative information-sharing tool to help municipalities predict where basement fl ooding caused by sewer backup will happen and improve infrastructure to reduce the risk. We launched an MRAT pilot program in three cities last fall.
Natural disasters don’t just come in the form of severe weather. Canada is also at risk for a major earthquake and we know more could be done to prepare. So IBC commissioned research on the economic impact of a quake in both Western and Eastern Canada, which we’re sharing with governments.
As well, IBC has conducted its own research into the economic costs of disasters. The research, which is being shared with policymakers, is designed to inform fi nancial planning and risk management decisions in the public and private sectors.
We’re proud of what has been achieved over the past 50 years and we’re ready to meet the next challenges on behalf of our members.
Don ForgeronPresident and CEO,Insurance Bureau of Canada
PRESIDENT’SMESSAGE
2 IBC Facts | 2014
CONTENTS
Section one
3–25Canada’s P&C insurance industry, all sectorsIndustry at-a-glance 4Premiums 6Insurance dollar 8Claims 9Taxes and levies 10Operating expenses 12Profi t 13Major issues – severe weather, catastrophic losses, crime, regulation, reinsurance 16
Section two
26–49Canada’s P&C insurance industry by line of businessAuto insurance
Compulsory insurance 28Optional insurance 29“No-fault” insurance 29What’s compulsory where 30Premiums and claims 42Average losses 44Major issues – aff ordable, eff ective auto insurance; safety; crime 44
Home insuranceTypes of coverage 46Premiums and claims 47Major issues – severe weather, earthquakes 47
Business insuranceTypes of coverage 48Premiums and claims 49Major issues – cyber liability, railway third-party liability, cargo theft 49
Section three
50–64Insurance organizationsIBC members 52IBC offi ces 57IBC services 58Superintendents of insurance 59Insurance-related organizations 61

32014 | IBC Facts
Canada’s P&Cinsurance industry,
all sectors
1

4 IBC Facts | 2014
INDUSTRYATAGLANCE
Insurance Bureau of Canada celebrates its 50th anniversary
Established in 1964, IBC is the national industry association representing Canada’s private home, car and business insurers
In 2013, total insured losses from natural disasters were the highest in Canadian history at
$3.2 billion45.3%of direct writtenpremiums were for carinsurance in 2012
In 2013, IBC helped recover stolen vehicles worth$8.7 million
Of its $146 billion in total assets, the P&C insurance industry has $104.2 billionin invested assets
In 2012, Canadian insurers wrote$46 billion in direct written premiums for insurance on consumers’ homes, cars and businesses
In 2011, the P&C insurance industry contributed $7.5 billion in taxes and levies to federal and provincial governments
In 2013, IBC helped start CANATICS, a non-profi t organization thatwill use the latest technology to analyze pooled car insurance industry data to help identify fraud
52014 | IBC Facts
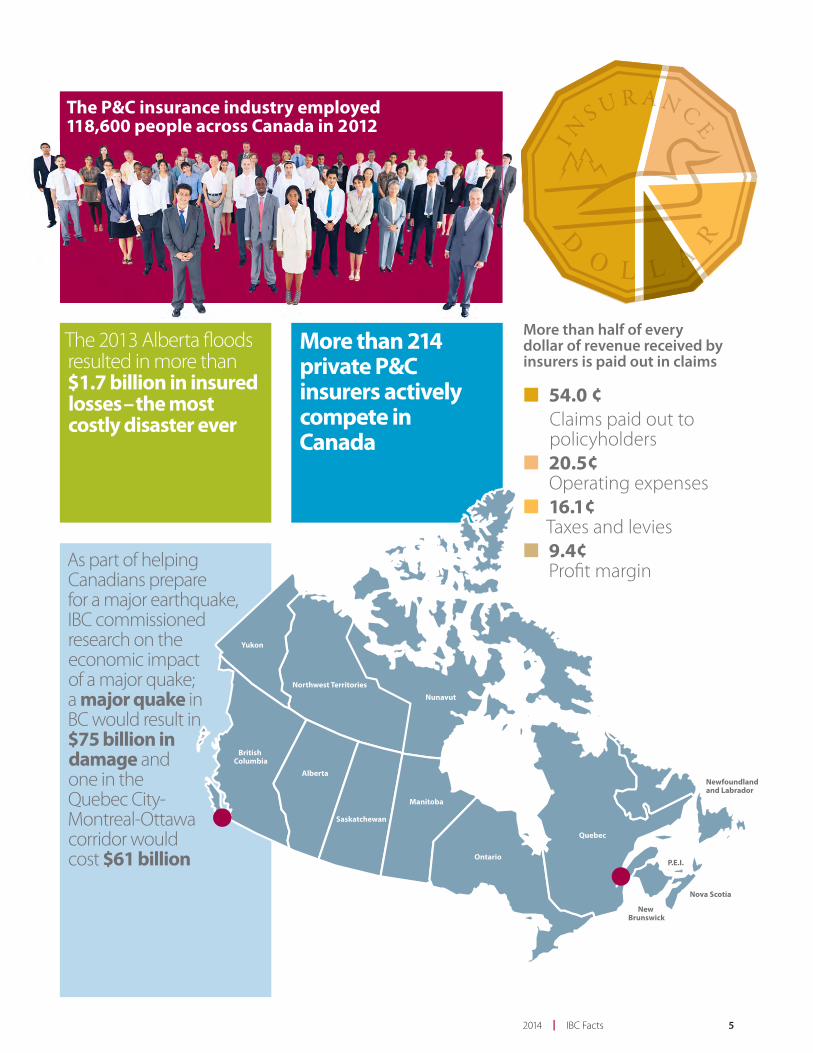
The P&C insurance industry employed118,600 people across Canada in 2012
More than 214 private P&C insurers actively compete in Canada
As part of helping Canadians prepare for a major earthquake,IBC commissioned research on theeconomic impactof a major quake;a major quake inBC would result in $75 billion indamage andone in theQuebec City-Montreal-Ottawacorridor wouldcost $61 billion
The 2013 Alberta fl oods resulted in more than $1.7 billion in insured losses – the most costly disaster ever
Yukon
Northwest Territories
Nunavut
British Columbia
Alberta
Saskatchewan
Manitoba
Ontario
Quebec
Newfoundland and Labrador
New Brunswick
Nova Scotia
P.E.I.
■ 54.0 ¢Claims paid out to policyholders
■ 20.5¢Operating expenses
■ 16.1¢Taxes and levies
■ 9.4¢Profi t margin
More than half of every dollar of revenue received by insurers is paid out in claims

6 IBC Facts | 2014
Insurance premiums are determined based on risk. That is, how likely it is that a customer – and a group of customers with the same set of circumstances – will make a claim, and how much those claims will likely cost. Insurers set premiums based on their best estimate of what they will be required to pay out in claims on the policies they wrote in any given year. They pool the premiums of their many policyholders to cover the losses claimed by the few in that year. Along with covering claim costs, premiums are calculated to cover taxes, operating expenses and expected profi ts. Investment income helps to off set costs.
This requirement to estimate future costs is a unique challenge for the insurance business. In most businesses, the actual costs of producing and selling a product can be calculated before the selling price is determined. However, when setting premiums, P&C insurance companies can only estimate the costs of medical treatments or car or house repairs that they will have to pay sometime in the future.
Consumers are often confused about how premiums are set and are unsure about what a premium represents. Many think that their premiums are kept in an account just for them in case of a loss, but that’s not how it works.
Insurance companies report premiums in two ways. “Direct written” premiums are the total premiums received by a P&C insurance company in a year. “Net written” premiums are the direct written premium amounts adjusted for portions paid in commissions and to reinsurers.
There are more than 214 private P&C insurers actively competing in Canada to sell insurance policies on homes, cars and businesses.
In 2012, private Canadian insurers wrote $46 billion in direct written premiums or $43.7 billion in net written premiums for insurance on consumers’ homes, cars and businesses.
PREMIUMS
Top 20 private P&C insurers by direct written premiums, 2012
Rank Company %1 Intact Group 15.86
2 Aviva Group 7.89
3 RSA Group 6.60
4 TD Insurance Group 6.02
5 Wawanesa Mutual Insurance Company 5.51
6 Co-operators Group 4.86
7 Desjardins Group 4.40
8 State Farm Group 4.11
9 Economical Group 4.02
10 Lloyd’s Underwriters 3.90
11 Dominion of Canada General Insurance Company
2.82
12 Northbridge Group 2.64
13 Allstate Group 2.34
14 AIG Insurance Company of Canada 2.14
15 RBC Group 2.05
16 Zurich Insurance Company Ltd. 2.05
17 La Capitale Financial Group 1.68
18 Chubb Group 1.49
19 Genworth Financial Mortgage Insurance Company Canada
1.24
20 FM Global Group 1.02
Source: IBC, MSA
72014 | IBC Facts
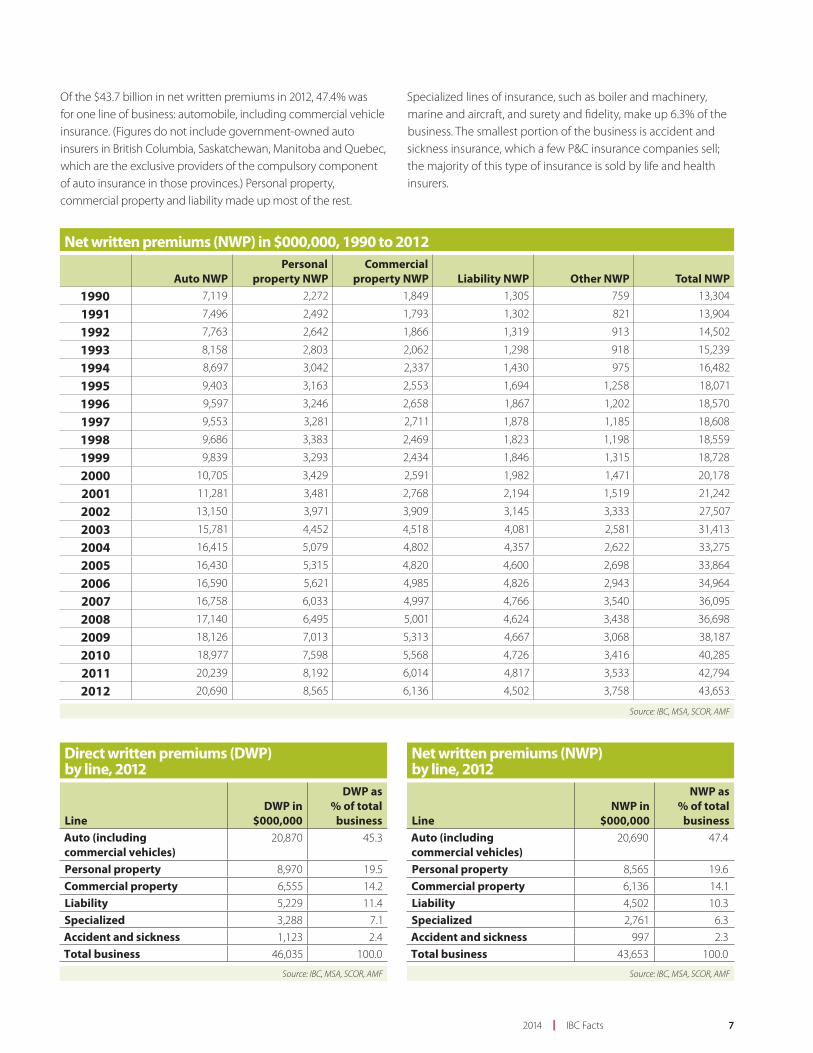
Of the $43.7 billion in net written premiums in 2012, 47.4% was for one line of business: automobile, including commercial vehicle insurance. (Figures do not include government-owned auto insurers in British Columbia, Saskatchewan, Manitoba and Quebec, which are the exclusive providers of the compulsory component of auto insurance in those provinces.) Personal property, commercial property and liability made up most of the rest.
Specialized lines of insurance, such as boiler and machinery, marine and aircraft, and surety and fi delity, make up 6.3% of the business. The smallest portion of the business is accident and sickness insurance, which a few P&C insurance companies sell; the majority of this type of insurance is sold by life and health insurers.
Net written premiums (NWP) in $000,000, 1990 to 2012
Auto NWPPersonal
property NWPCommercial
property NWP Liability NWP Other NWP Total NWP
1990 7,119 2,272 1,849 1,305 759 13,304
1991 7,496 2,492 1,793 1,302 821 13,904
1992 7,763 2,642 1,866 1,319 913 14,502
1993 8,158 2,803 2,062 1,298 918 15,239
1994 8,697 3,042 2,337 1,430 975 16,482
1995 9,403 3,163 2,553 1,694 1,258 18,071
1996 9,597 3,246 2,658 1,867 1,202 18,570
1997 9,553 3,281 2,711 1,878 1,185 18,608
1998 9,686 3,383 2,469 1,823 1,198 18,559
1999 9,839 3,293 2,434 1,846 1,315 18,728
2000 10,705 3,429 2,591 1,982 1,471 20,178
2001 11,281 3,481 2,768 2,194 1,519 21,242
2002 13,150 3,971 3,909 3,145 3,333 27,507
2003 15,781 4,452 4,518 4,081 2,581 31,413
2004 16,415 5,079 4,802 4,357 2,622 33,275
2005 16,430 5,315 4,820 4,600 2,698 33,864
2006 16,590 5,621 4,985 4,826 2,943 34,964
2007 16,758 6,033 4,997 4,766 3,540 36,095
2008 17,140 6,495 5,001 4,624 3,438 36,698
2009 18,126 7,013 5,313 4,667 3,068 38,187
2010 18,977 7,598 5,568 4,726 3,416 40,285
2011 20,239 8,192 6,014 4,817 3,533 42,794
2012 20,690 8,565 6,136 4,502 3,758 43,653
Source: IBC, MSA, SCOR, AMF
Direct written premiums (DWP) by line, 2012
LineDWP in
$000,000
DWP as % of total
businessAuto (including commercial vehicles)
20,870 45.3
Personal property 8,970 19.5
Commercial property 6,555 14.2
Liability 5,229 11.4
Specialized 3,288 7.1
Accident and sickness 1,123 2.4
Total business 46,035 100.0
Source: IBC, MSA, SCOR, AMF
Net written premiums (NWP) by line, 2012
LineNWP in
$000,000
NWP as % of total
businessAuto (including commercial vehicles)
20,690 47.4
Personal property 8,565 19.6
Commercial property 6,136 14.1
Liability 4,502 10.3
Specialized 2,761 6.3
Accident and sickness 997 2.3
Total business 43,653 100.0
Source: IBC, MSA, SCOR, AMF

8 IBC Facts | 20148 IBC Facts | 2014
Source: IBC, MSA
54.0¢Claims paid out to policyholders
20.5¢Operating expenses
16.1¢Taxes
9.4¢Profi t
INSURANCE DOLLAR
The Insurance Dollar pie chart shows how insurers spent each dollar of revenue averaged over the seven years from 2006 to 2012.
More than half of every dollar received is paid out in claims

92014 | IBC Facts
CLAIMS
Net claims incurred (NCI) in $000,000, 1990 to 2012
Auto NCIPersonal
property NCICommercial
property NCI Liability NCI Other NCI Total NCI1990 6,022 1,515 1,313 894 486 10,230
1991 5,799 1,920 1,516 943 498 10,676
1992 6,074 1,907 1,532 1,064 578 11,154
1993 6,420 1,974 1,430 1,004 661 11,490
1994 6,892 1,955 1,493 1,159 545 12,043
1995 7,342 2,003 1,504 1,218 773 12,840
1996 7,034 2,301 1,665 1,449 761 13,210
1997 7,221 2,112 1,838 1,406 613 13,190
1998 7,185 2,523 2,089 1,275 696 13,768
1999 7,475 2,152 1,758 1,438 659 13,483
2000 8,443 2,286 1,847 1,430 784 14,790
2001 9,431 2,316 2,031 1,495 887 16,161
2002 10,844 2,352 2,195 2,085 2,019 19,494
2003 12,028 2,574 2,161 2,632 993 20,388
2004 11,081 2,921 2,033 3,263 864 20,161
2005 10,626 3,570 3,356 3,071 944 21,568
2006 10,968 3,556 2,173 2,577 1,052 20,326
2007 11,753 3,842 2,589 2,642 990 21,817
2008 12,997 4,720 3,157 2,726 1,404 25,003
2009 13,472 5,071 3,454 2,878 1,464 26,338
2010 15,205 4,566 3,276 2,766 1,475 27,288
2011 14,607 5,336 4,087 2,977 1,560 28,567
2012 14,731 5,013 3,981 2,615 1,479 27,817
Source: IBC, MSA, SCOR, AMF
In 2012, Canadian P&C insurers paid out $27.8 billion, or 59%, of insurance company revenues in claims. A note about terminology in the chart below: Net claims incurred are the total claims cost incurred in the period less any share to be paid by reinsurers.
Net claims incurred (NCI) by line, 2012
Line of businessNCI in
$000,000
NCI as % of total
businessAuto (including commercial vehicles)
14,731 53.0
Personal property 5,013 18.0
Commercial property 3,981 14.3
Liability 2,615 9.4
Specialized 916 3.3
Accident and sickness 563 2.0
Total claims 27,817 100.0
Source: IBC, MSA, SCOR, AMF

10 IBC Facts | 2014
In 2011, the P&C insurance industry contributed $7.5 billion in taxes and levies to federal and provincial governments. The taxes that were borne by the industry in 2011 amount to $5.3 billion. These taxes fall into two categories: income taxes and non-income-based taxes. Non-income-based taxes typically represent much more money than income taxes.
Non-income-based taxes are taxes such as provincial insurance premium taxes that are charged regardless of how much net income an insurer makes in a particular year. During a weak fi nancial year, these non-income-based taxes must still be paid, even though net income for insurers has fallen. The relatively high total tax rate for Canadian P&C insurers stems largely from non-income-based taxes.
P&C insurers pay a fi re tax that is collected by some provincial governments to be disbursed to municipalities to support fi re services.
As well, P&C insurers pay a health care levy that is collected by most provincial governments to support the health care system, in particular to pay the public health system costs for victims of automobile collisions. In 2011, the P&C insurance industry paid $279.4 million in health care levies to various provincial governments.
Tax and levies represent about 12% of the average insurance policy premium paid by consumers.
Federal and provincial taxes and levies payable in $000,000, 2011Income taxes 1,224.9
Capital taxes 0.6
Payroll taxes 1,221.6
Realty and business taxes 29.1
Transaction taxesGST on operations and claims 1,140.5
PST on operations and claims 990.8
HST on operations and claims 29.6
PST on premiums (Ont., Que.) 1,189.0
Premium taxes 1,419.6
Transaction subtotal 4,769.6
TAXES ANDLEVIES
Total taxes 7,245.8
Health levies 279.4
Total taxes and levies 7,525.2
Source: IBC
112014 | IBC Facts
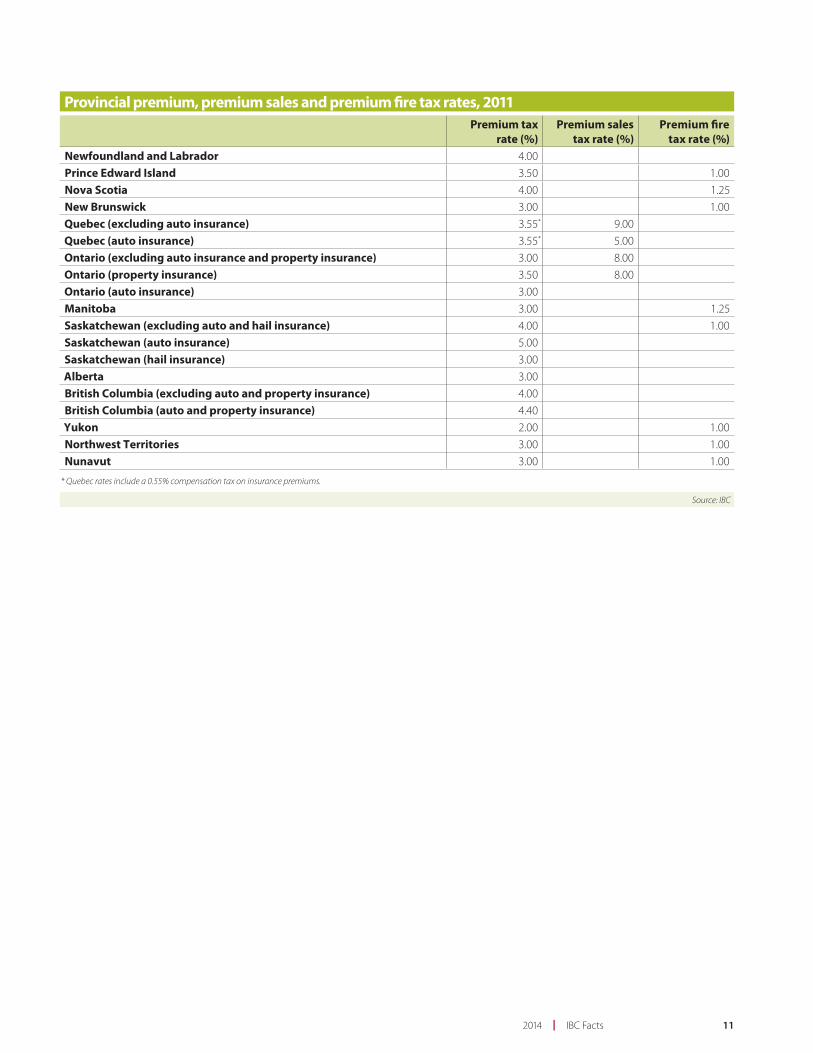
Provincial premium, premium sales and premium fi re tax rates, 2011Premium tax
rate (%)Premium sales
tax rate (%)Premium fi re
tax rate (%)Newfoundland and Labrador 4.00
Prince Edward Island 3.50 1.00
Nova Scotia 4.00 1.25
New Brunswick 3.00 1.00
Quebec (excluding auto insurance) 3.55* 9.00
Quebec (auto insurance) 3.55* 5.00
Ontario (excluding auto insurance and property insurance) 3.00 8.00
Ontario (property insurance) 3.50 8.00
Ontario (auto insurance) 3.00
Manitoba 3.00 1.25
Saskatchewan (excluding auto and hail insurance) 4.00 1.00
Saskatchewan (auto insurance) 5.00
Saskatchewan (hail insurance) 3.00
Alberta 3.00
British Columbia (excluding auto and property insurance) 4.00
British Columbia (auto and property insurance) 4.40
Yukon 2.00 1.00
Northwest Territories 3.00 1.00
Nunavut 3.00 1.00
* Quebec rates include a 0.55% compensation tax on insurance premiums.
Source: IBC

12 IBC Facts | 2014
Average weekly wage compared tobenchmark industries, 2012Mining and quarrying 1,601.6
Professional, scientific and technical services 1,249.1
Public administration 1,148.4
Information and cultural industries 1,122.5
Insurance carriers and related activities 1,102.0Manufacturing 1,005.2
Hospitals 990.6
Educational services 982.7
Banking 980.4
All industries 896.8
Retail trade 526.4
Accommodation and food service 367.0
Source: Statistics Canada Table 281-0027
Operating expenses for P&C insurers include such expenses as facilities costs, information technology, market research and employee compensation.
Employee compensation is the largest operating expense for P&C insurers. The P&C insurance industry employed 118,600 people across Canada in 2012.
Compensation levels in the industry are relatively high compared with most other sectors in the economy. The average weekly salary in 2012 was $1,102. This refl ects the advanced skill mix found in the P&C insurance industry.
Employment in the insurance industry as a whole, which includes life, health and medical as well as P&C, grew by 12.6% between 2007 and 2012, according to Statistics Canada. Growth was highest in New Brunswick, which saw a 75.8% increase, due to an expansion of insurance industry customer service facilities in that province.
OPERATING EXPENSES

132014 | IBC Facts
Profi t or return on equity in the P&C insurance industry is cyclical, fl uctuating around an average of 10.5% for the 37 years since 1975. The 2012 industry return on equity was 10.8%.
Return on equity comes from two revenue streams – underwriting and investment earnings.
In 2012, underwriting posted gains for the tenth consecutive year. The 2012 net underwriting revenue was $2.1 billion. Previous to 2003, underwriting posted losses for 24 years in a row.
On investment, 2012 was a year of relatively low returns of 3.9%. Return on investment moves in lockstep with the yields for 3- and 5-year Government of Canada bonds, which have been falling for the last two decades. Investment income for 2012 was $3.9 billion.
The P&C insurance industry is highly regulated by government and is required by law to invest its assets prudently. More than 80% of invested assets are placed in bonds.
Of its $146 billion in total assets, the P&C insurance industry has $104.2 billion in invested assets. This makes the Canadian P&C insurance industry a major stakeholder and investor in the national economy. P&C insurers invest mainly in domestic government and corporate bonds and in preferred and common stocks. These investments produce a steady fl ow of income and balance the more variable income from the underwriting side of the business, which posts losses in some years and gains in others.
Investments in $000,000 as of December 31, 2012Bonds Shares Mortgages Real estate Term deposits Other Total84,077 13,267 678 75 3,961 2,131 104,190
80.7% 12.7% 0.7% 0.1% 3.8% 2.0% 100.0%
Source: IBC, MSA, SCOR, AMF
PROFIT

14 IBC Facts | 2014
Return on equity, return on investment and underwriting ratios, 1990 to 2012
Return on equityReturn on
investment Earned loss ratioOperating
expense ratio Combined ratio1990 9.7% 10.8% 79.1% 31.3% 110.4%
1991 9.6% 10.9% 78.6% 32.6% 111.2%
1992 8.5% 10.4% 77.7% 32.9% 110.6%
1993 9.5% 10.7% 77.1% 32.8% 109.9%
1994 6.8% 8.0% 75.7% 31.3% 107.0%
1995 11.7% 9.1% 73.3% 30.8% 104.1%
1996 13.6% 10.3% 72.7% 30.7% 103.4%
1997 13.1% 10.4% 71.4% 31.2% 102.6%
1998 6.8% 8.5% 74.9% 32.9% 107.8%
1999 6.5% 7.3% 72.6% 33.2% 105.9%
2000 6.3% 9.0% 75.9% 32.7% 108.7%
2001 2.6% 7.5% 80.0% 31.0% 111.0%
2002 1.7% 5.4% 76.9% 28.9% 105.8%
2003 11.6% 6.2% 69.9% 28.6% 98.4%
2004 18.1% 5.6% 62.7% 28.2% 91.0%
2005 17.2% 5.9% 64.7% 28.7% 93.4%
2006 16.9% 5.9% 59.5% 28.1% 87.5%
2007 14.1% 5.5% 62.5% 28.5% 91.0%
2008 6.0% 3.9% 70.3% 30.0% 100.3%
2009 6.9% 4.2% 69.5% 30.0% 99.6%
2010 7.6% 4.3% 69.1% 30.2% 99.4%
2011 8.0% 4.2% 68.2% 30.3% 98.4%
2012 10.8% 3.9% 64.7% 30.6% 95.3%
A note about terminology:Earned loss ratio is the ratio of claims incurred to net premiums earned.Operating expense ratio is the ratio of operating expenses to net premiums earned.Combined ratio is the ratio of claims and expenses to net premiums earned.
When the combined ratio is 100% or more. it signifi es an underwriting loss.When the combined ratio is less than 100%. it signifi es an underwriting profi t.
Source: IBC. MSA. SCOR. AMF; excluding Lloyd's

152014 | IBC Facts
Return on investment compared with Government of Canada bond yield, 1989 to 2012 (%)
4
12
8
01989
P&C ROI
Yield for 3–5 yearGovernment of Canada Bonds
1991 1993 1995 1997 1999 2001 2003 2005 2007 2009 2011 2012
Return on equity, 1975 to 2012 (%)
11.2%
*Average ROE calculated up to 2010 Source: IBC, MSA; excluding Lloyd’s
9.9% 10.6% 8.3%
5
10
15
20
01975 1980 1985 1990 1995 2000 2005 2010 2012
Average ROE* 10.5%
Source: IBC, MSA, Bank of Canada
16 IBC Facts | 2014
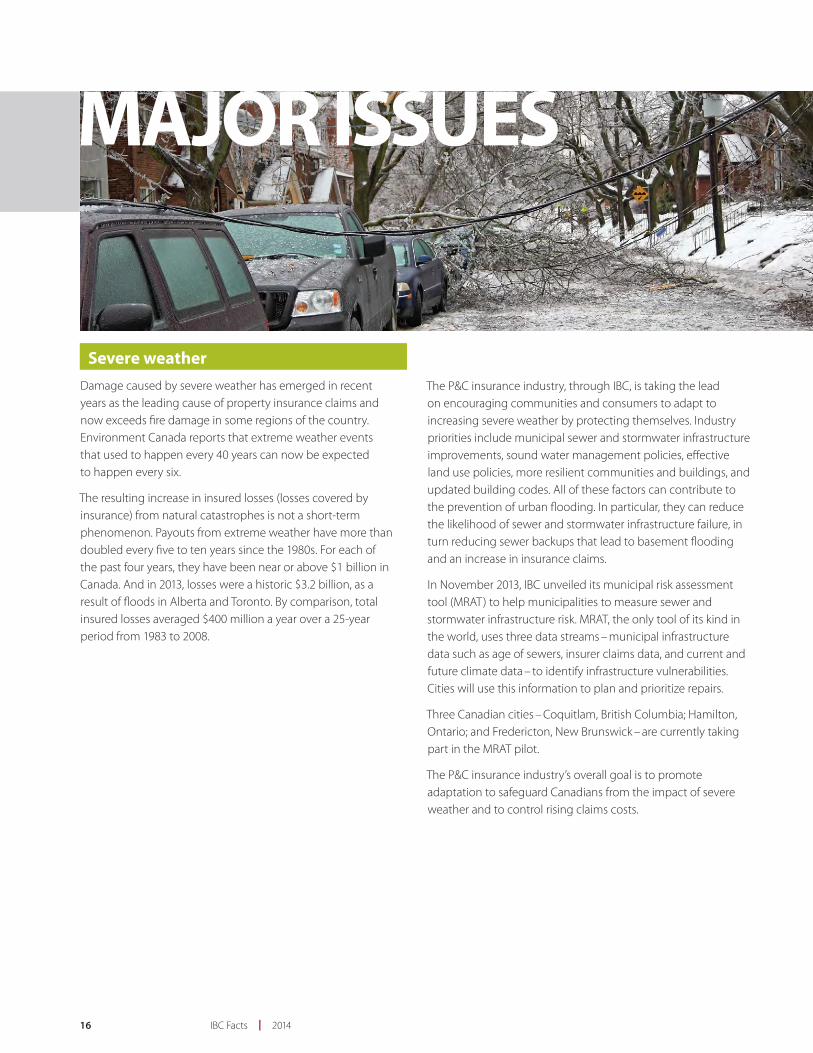
Severe weather
Damage caused by severe weather has emerged in recent years as the leading cause of property insurance claims and now exceeds fi re damage in some regions of the country. Environment Canada reports that extreme weather events that used to happen every 40 years can now be expected to happen every six.
The resulting increase in insured losses (losses covered by insurance) from natural catastrophes is not a short-term phenomenon. Payouts from extreme weather have more than doubled every fi ve to ten years since the 1980s. For each of the past four years, they have been near or above $1 billion in Canada. And in 2013, losses were a historic $3.2 billion, as a result of fl oods in Alberta and Toronto. By comparison, total insured losses averaged $400 million a year over a 25-year period from 1983 to 2008.
The P&C insurance industry, through IBC, is taking the lead on encouraging communities and consumers to adapt to increasing severe weather by protecting themselves. Industry priorities include municipal sewer and stormwater infrastructure improvements, sound water management policies, eff ective land use policies, more resilient communities and buildings, and updated building codes. All of these factors can contribute to the prevention of urban fl ooding. In particular, they can reduce the likelihood of sewer and stormwater infrastructure failure, in turn reducing sewer backups that lead to basement fl ooding and an increase in insurance claims.
In November 2013, IBC unveiled its municipal risk assessment tool (MRAT) to help municipalities to measure sewer and stormwater infrastructure risk. MRAT, the only tool of its kind in the world, uses three data streams – municipal infrastructure data such as age of sewers, insurer claims data, and current and future climate data – to identify infrastructure vulnerabilities. Cities will use this information to plan and prioritize repairs.
Three Canadian cities – Coquitlam, British Columbia; Hamilton, Ontario; and Fredericton, New Brunswick – are currently taking part in the MRAT pilot.
The P&C insurance industry’s overall goal is to promote adaptation to safeguard Canadians from the impact of severe weather and to control rising claims costs.
MAJOR ISSUES
172014 | IBC Facts
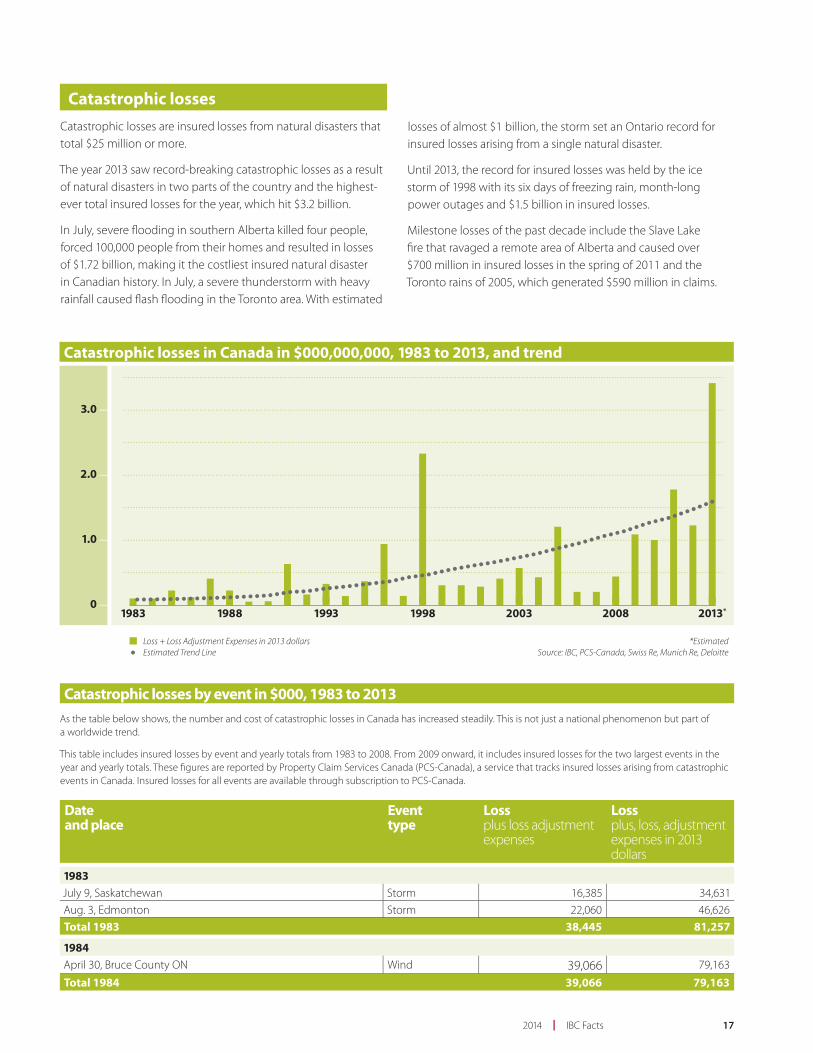
Catastrophic losses in Canada in $000,000,000, 1983 to 2013, and trend
Loss + Loss Adjustment Expenses in 2013 dollarsEstimated Trend Line
*Estimated Source: IBC, PCS-Canada, Swiss Re, Munich Re, Deloitte
1.0
2.0
3.0
01983 1988 1993 1998 2003 2008 2013*
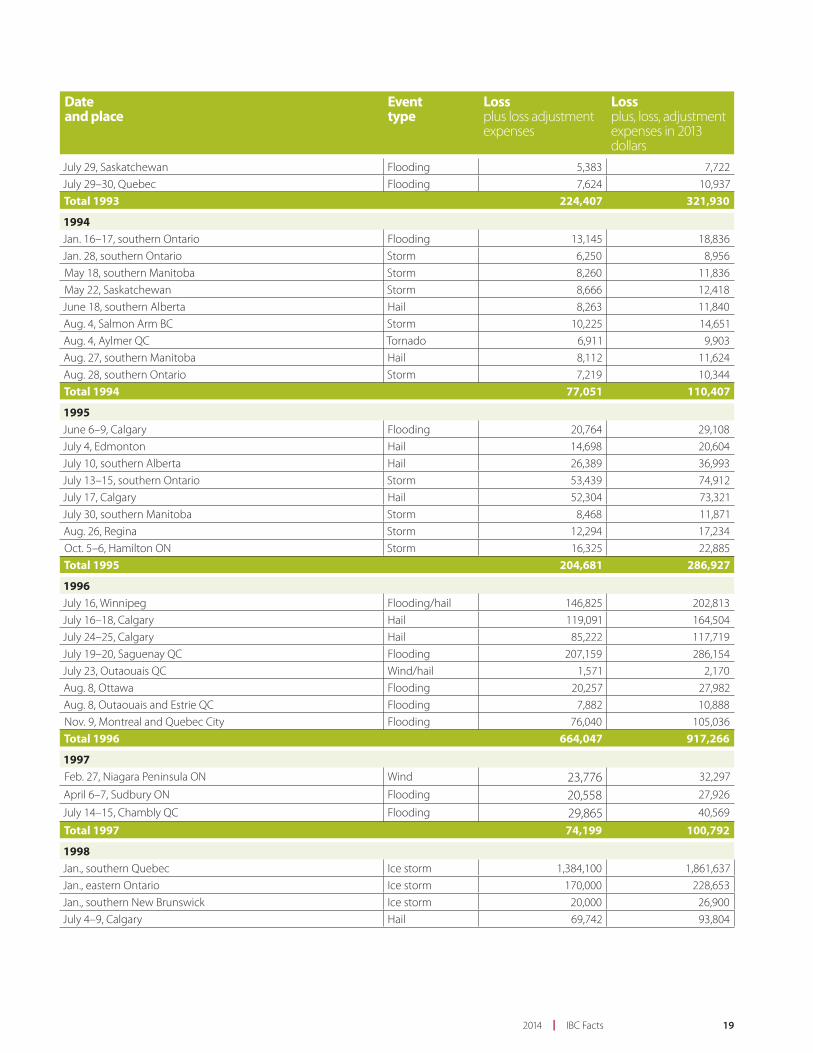
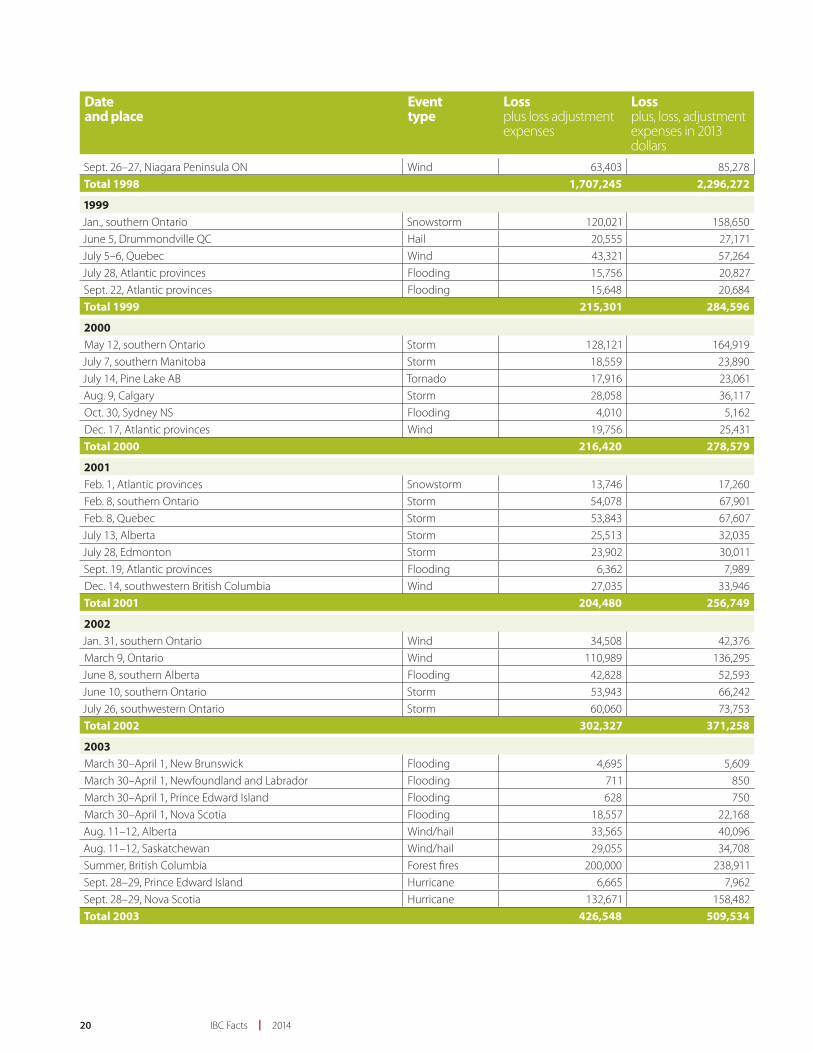
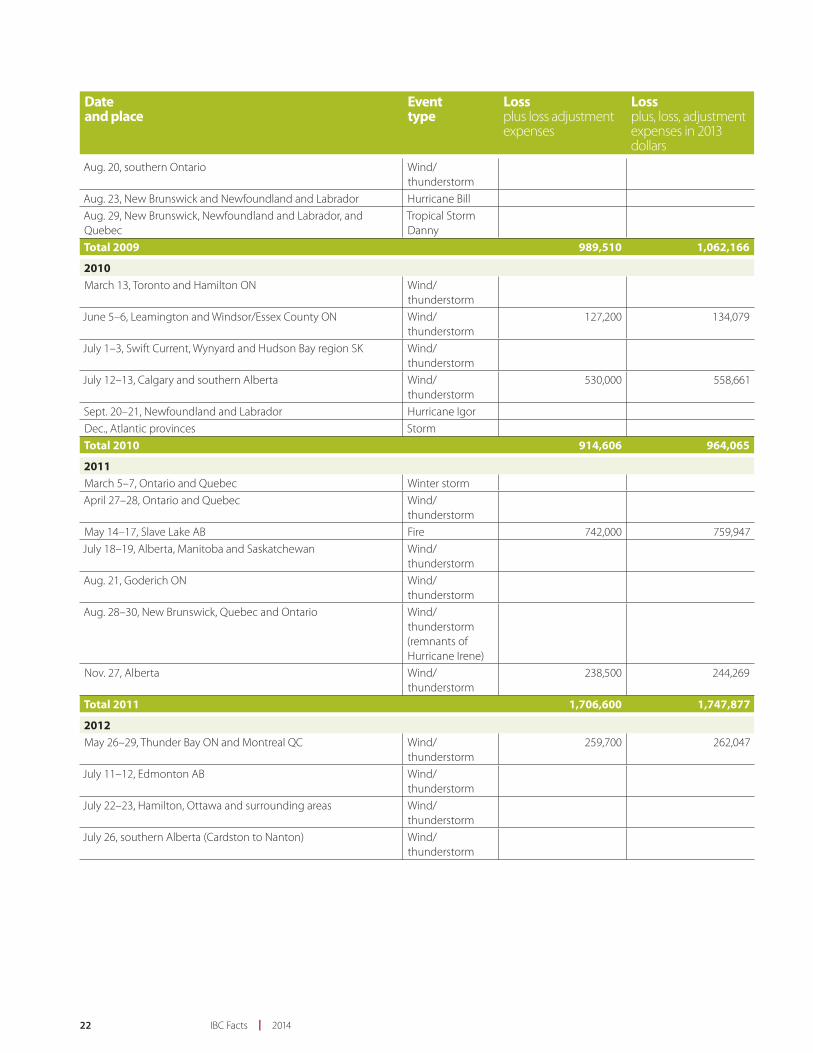
As the table below shows, the number and cost of catastrophic losses in Canada has increased steadily. This is not just a national phenomenon but part of a worldwide trend.
This table includes insured losses by event and yearly totals from 1983 to 2008. From 2009 onward, it includes insured losses for the two largest events in the year and yearly totals. These fi gures are reported by Property Claim Services Canada (PCS-Canada), a service that tracks insured losses arising from catastrophic events in Canada. Insured losses for all events are available through subscription to PCS-Canada.
Dateand place
Eventtype
Lossplus loss adjustmentexpenses
Lossplus, loss, adjustmentexpenses in 2013dollars
1983July 9, Saskatchewan Storm 16,385 34,631
Aug. 3, Edmonton Storm 22,060 46,626
Total 1983 38,445 81,257
1984 April 30, Bruce County ON Wind 39,066 79,163
Total 1984 39,066 79,163
Catastrophic losses by event in $000, 1983 to 2013
Catastrophic losses
Catastrophic losses are insured losses from natural disasters that total $25 million or more.
The year 2013 saw record-breaking catastrophic losses as a result of natural disasters in two parts of the country and the highest-ever total insured losses for the year, which hit $3.2 billion.
In July, severe fl ooding in southern Alberta killed four people, forced 100,000 people from their homes and resulted in losses of $1.72 billion, making it the costliest insured natural disaster in Canadian history. In July, a severe thunderstorm with heavy rainfall caused fl ash fl ooding in the Toronto area. With estimated
losses of almost $1 billion, the storm set an Ontario record for insured losses arising from a single natural disaster.
Until 2013, the record for insured losses was held by the ice storm of 1998 with its six days of freezing rain, month-long power outages and $1.5 billion in insured losses.
Milestone losses of the past decade include the Slave Lake fi re that ravaged a remote area of Alberta and caused over $700 million in insured losses in the spring of 2011 and the Toronto rains of 2005, which generated $590 million in claims.

18 IBC Facts | 2014
Dateand place
Eventtype
Lossplus loss adjustmentexpenses
Lossplus, loss, adjustmentexpenses in 2013dollars
1985May 30, Leamington ON Storm 16,390 31,947
May 31, Barrie ON Tornado 83,922 163,581
Total 1985 100,312 195,529
1986May 29, Montreal Hail 45,473 85,123
Total 1986 45,473 85,123
1987May 29, Montreal Hail 24,891 44,622
July 14, Montreal Storm 44,678 80,094
July 31, Edmonton Tornado 148,377 265,996
Total 1987 217,946 390,712
1988June 7, Medicine Hat AB Tornado 50,027 86,283
July 6, Slave Lake AB Flooding 21,500 37,081
Aug.16, Calgary Hail 37,127 64,034
Total 1988 108,654 187,398
1989July 20, Harrow ON Flooding 13,807 22,667
Total 1989 13,807 22,667
1990July 9, Calgary Hail 16,279 25,498
Total 1990 16,279 25,498
1991March 27–28, Sarnia ON Tornado 25,407 37,681
July 3, Red Deer AB Storm 28,202 41,826
Aug. 27, Maskinongé QC Tornado 17,667 26,202
Sept. 7, Calgary Hail 342,745 508,322
Nov. 30, Ontario Wind 5,429 8,052
Total 1991 419,450 622,083
1992July 31, Calgary Hail 22,078 32,276
July 31, Toronto Flooding 4,898 7,160
Aug. 28, Alberta Hail 5,263 7,694
Aug. 28, Elmira and Aurora ON Flooding 4,348 6,356
Sept. 1, Alberta Hail 7,421 10,849
Oct. 6–7, Avalon NL Wind 8,216 12,011
Nov. 12–13, southern Ontario Wind 36,437 53,267
Nov. 12–13, Quebec Wind 12,056 17,625Total 1992 100,717 147,239
1993March 13–14, Quebec Storm 18,447 26,464
July 25–Aug.14, Winnipeg Flooding 184,837 265,163
July 29–30, Alberta Hail 8,116 11,643
192014 | IBC Facts
Dateand place
Eventtype
Lossplus loss adjustmentexpenses
Lossplus, loss, adjustmentexpenses in 2013dollars
July 29, Saskatchewan Flooding 5,383 7,722
July 29–30, Quebec Flooding 7,624 10,937
Total 1993 224,407 321,930
1994Jan. 16–17, southern Ontario Flooding 13,145 18,836
Jan. 28, southern Ontario Storm 6,250 8,956
May 18, southern Manitoba Storm 8,260 11,836
May 22, Saskatchewan Storm 8,666 12,418
June 18, southern Alberta Hail 8,263 11,840
Aug. 4, Salmon Arm BC Storm 10,225 14,651
Aug. 4, Aylmer QC Tornado 6,911 9,903
Aug. 27, southern Manitoba Hail 8,112 11,624
Aug. 28, southern Ontario Storm 7,219 10,344Total 1994 77,051 110,407
1995June 6–9, Calgary Flooding 20,764 29,108
July 4, Edmonton Hail 14,698 20,604
July 10, southern Alberta Hail 26,389 36,993
July 13–15, southern Ontario Storm 53,439 74,912
July 17, Calgary Hail 52,304 73,321
July 30, southern Manitoba Storm 8,468 11,871
Aug. 26, Regina Storm 12,294 17,234
Oct. 5–6, Hamilton ON Storm 16,325 22,885Total 1995 204,681 286,927
1996July 16, Winnipeg Flooding/hail 146,825 202,813
July 16–18, Calgary Hail 119,091 164,504
July 24–25, Calgary Hail 85,222 117,719
July 19–20, Saguenay QC Flooding 207,159 286,154
July 23, Outaouais QC Wind/hail 1,571 2,170
Aug. 8, Ottawa Flooding 20,257 27,982
Aug. 8, Outaouais and Estrie QC Flooding 7,882 10,888
Nov. 9, Montreal and Quebec City Flooding 76,040 105,036Total 1996 664,047 917,266
1997Feb. 27, Niagara Peninsula ON Wind 23,776 32,297
April 6–7, Sudbury ON Flooding 20,558 27,926
July 14–15, Chambly QC Flooding 29,865 40,569
Total 1997 74,199 100,792
1998Jan., southern Quebec Ice storm 1,384,100 1,861,637
Jan., eastern Ontario Ice storm 170,000 228,653
Jan., southern New Brunswick Ice storm 20,000 26,900
July 4–9, Calgary Hail 69,742 93,804
20 IBC Facts | 2014
Dateand place
Eventtype
Lossplus loss adjustmentexpenses
Lossplus, loss, adjustmentexpenses in 2013dollars
Sept. 26–27, Niagara Peninsula ON Wind 63,403 85,278
Total 1998 1,707,245 2,296,272
1999Jan., southern Ontario Snowstorm 120,021 158,650
June 5, Drummondville QC Hail 20,555 27,171
July 5–6, Quebec Wind 43,321 57,264
July 28, Atlantic provinces Flooding 15,756 20,827
Sept. 22, Atlantic provinces Flooding 15,648 20,684Total 1999 215,301 284,596
2000May 12, southern Ontario Storm 128,121 164,919
July 7, southern Manitoba Storm 18,559 23,890
July 14, Pine Lake AB Tornado 17,916 23,061
Aug. 9, Calgary Storm 28,058 36,117
Oct. 30, Sydney NS Flooding 4,010 5,162
Dec. 17, Atlantic provinces Wind 19,756 25,431Total 2000 216,420 278,579
2001Feb. 1, Atlantic provinces Snowstorm 13,746 17,260
Feb. 8, southern Ontario Storm 54,078 67,901
Feb. 8, Quebec Storm 53,843 67,607
July 13, Alberta Storm 25,513 32,035
July 28, Edmonton Storm 23,902 30,011
Sept. 19, Atlantic provinces Flooding 6,362 7,989
Dec. 14, southwestern British Columbia Wind 27,035 33,946Total 2001 204,480 256,749
2002Jan. 31, southern Ontario Wind 34,508 42,376
March 9, Ontario Wind 110,989 136,295
June 8, southern Alberta Flooding 42,828 52,593
June 10, southern Ontario Storm 53,943 66,242
July 26, southwestern Ontario Storm 60,060 73,753Total 2002 302,327 371,258
2003March 30–April 1, New Brunswick Flooding 4,695 5,609
March 30–April 1, Newfoundland and Labrador Flooding 711 850
March 30–April 1, Prince Edward Island Flooding 628 750
March 30–April 1, Nova Scotia Flooding 18,557 22,168
Aug. 11–12, Alberta Wind/hail 33,565 40,096
Aug. 11–12, Saskatchewan Wind/hail 29,055 34,708
Summer, British Columbia Forest fi res 200,000 238,911
Sept. 28–29, Prince Edward Island Hurricane 6,665 7,962
Sept. 28–29, Nova Scotia Hurricane 132,671 158,482Total 2003 426,548 509,534

212014 | IBC Facts
Dateand place
Eventtype
Lossplus loss adjustmentexpenses
Lossplus, loss, adjustmentexpenses in 2013dollars
2004July 2–11, Edmonton Hail 166,000 194,697
July 15, Calgary Hail 21,500 25,217
July 15, Peterborough ON Flooding 87,303 102,396
Sept. 9, eastern Ontario Rainstorm 57,600 67,557
Total 2004 332,403 389,867
2005June 6–8 and June 17–19, Alberta Flooding 300,000 344,299
June 20–30 and July 1–2, Manitoba Flooding 60,000 68,860
July 5 and Sept. 26, Quebec Rainstorm 57,000 65,417
Aug. 19, Ontario Wind/rainstorm 625,400 717,749
Total 2005 1,042,400 1,196,324
2006Feb. 6, British Columbia Storm 6,406 7,211
Aug. 10, Alberta Hail 13,593 15,300
Sept. 24, Greater Toronto Area Wind/hail 4,628 5,209
Nov.15–Dec. 15, British Columbia Storm 133,086 149,798
Total 2006 157,713 177,518
2007Jan. 5, British Columbia Storm 16,235 17,881
June 5, Alberta Storm 44,621 49,143
June 22–24, Manitoba Storm 17,607 19,391
Summer, Manitoba Storm 47,400 52,204
July 7, Alberta Forest fi res 7,376 8,124
July 28–29, Alberta Hail 16,581 18,261
Aug. 1, Newfoundland and Labrador Wind 6,039 6,651Total 2007 155,859 171,655
2008Jan. 9, Ontario Storm 28,017 30,153
April/May, New Brunswick Flooding 8,010 8,621
June 10, several regions in Quebec Hail 125,000 134,531
July, Lethbridge AB Wind/hail 20,500 22,063
Sept., Saskatchewan Hail 132,000 142,065
Dec., British Columbia Snowstorm 60,000 64,575Total 2008 373,527 402,008
2009Feb. 11–13, Ontario Winter storm
April 25–27, Ontario Wind/ thunderstorm
July 11–13, Hamilton and Ottawa ON, Montreal and Mirabel QC Wind/ thunderstorm
July 24–28, Ontario Wind/ thunderstorm
227,900 244,634
Aug. 1–3, Alberta Wind/ thunderstorm
376,300 403,930
Aug. 13–15, Manitoba Wind/ thunderstorm
22 IBC Facts | 2014
Dateand place
Eventtype
Lossplus loss adjustmentexpenses
Lossplus, loss, adjustmentexpenses in 2013dollars
Aug. 20, southern Ontario Wind/ thunderstorm
Aug. 23, New Brunswick and Newfoundland and Labrador Hurricane Bill
Aug. 29, New Brunswick, Newfoundland and Labrador, andQuebec
Tropical Storm Danny
Total 2009 989,510 1,062,166
2010March 13, Toronto and Hamilton ON Wind/
thunderstorm
June 5–6, Leamington and Windsor/Essex County ON Wind/thunderstorm
127,200 134,079
July 1–3, Swift Current, Wynyard and Hudson Bay region SK Wind/thunderstorm
July 12–13, Calgary and southern Alberta Wind/thunderstorm
530,000 558,661
Sept. 20–21, Newfoundland and Labrador Hurricane Igor
Dec., Atlantic provinces Storm
Total 2010 914,606 964,065
2011March 5–7, Ontario and Quebec Winter storm
April 27–28, Ontario and Quebec Wind/thunderstorm
May 14–17, Slave Lake AB Fire 742,000 759,947
July 18–19, Alberta, Manitoba and Saskatchewan Wind/thunderstorm
Aug. 21, Goderich ON Wind/thunderstorm
Aug. 28–30, New Brunswick, Quebec and Ontario Wind/thunderstorm(remnants of Hurricane Irene)
Nov. 27, Alberta Wind/thunderstorm
238,500 244,269
Total 2011 1,706,600 1,747,877
2012May 26–29, Thunder Bay ON and Montreal QC Wind/
thunderstorm259,700 262,047
July 11–12, Edmonton AB Wind/thunderstorm
July 22–23, Hamilton, Ottawa and surrounding areas Wind/thunderstorm
July 26, southern Alberta (Cardston to Nanton) Wind/thunderstorm

232014 | IBC Facts
Dateand place
Eventtype
Lossplus loss adjustmentexpenses
Lossplus, loss, adjustmentexpenses in 2013dollars
Aug. 12, region around Calgary Wind/thunderstorm
562,000 567,080
Oct. 29–31, Ontario and Quebec Wind/thunderstorm (remnants of Hurricane Sandy)
Total 2012 1,198,000 1,208,828
2013April 11–14, southwestern Ontario Wind/
thunderstorm
May 28–June 2, parts of Ontario and Quebec Wind/thunderstorm
June 19–24, southern Alberta Wind/thunderstorm
1,827,000 1,827,000
July 8–9, Toronto and southern Ontario Wind/thunderstorm
999,500 999,500
July 19, central and southern Ontario and southwest Quebec Wind/thunderstorm
Dec. 22–26, Ontario, Quebec, New Brunswick, Nova Scotia, Prince Edward Island, and Newfoundland and Labrador
Winter storm
Total 2013 3,384,245 3,384,245
Source 1983 to 2008: IBC, PCS-Canada, Swiss Re, Munich Re and Deloitte
Source 2009 to 2013 (excluding 2010): PCS-CanadaSource 2010: PCS-Canada, IBC
24 IBC Facts | 2014
Crime
Insurance crime takes many forms and costs Canadian insurers millions each year. The cost of insurance crime is refl ected in higher premiums. A signifi cant amount of insurance crime involves opportunistic fraud whereby individual policyholders make false or exaggerated claims. Organized crime rings also perpetrate various forms of insurance crime, such as auto theft, staged collisions and associated service provider fraud in which participants make false claims for accident benefi ts and vehicle damage in collusion with rehabilitation facilities andauto repair shops.
The P&C insurance industry, through IBC, investigates organized insurance crime throughout Canada.
Recently, IBC helped to create a new organization to harness the power of data analytics in the fi ght against organized crime rings. CANATICS is a non-profi t organization with the mandate to analyze pooled auto insurance industry data, using the most current tools, to identify suspicious claims that individual insurers can then investigate. By analyzing pooled data, CANATICS can help identify fraud more eff ectively and help prevent payouts to criminals that infl ate the premiums of honest policyholders.
CANATICS is based on similar organizations in the United States and the United Kingdom, which have analyzed pooled industry data for many years to help identify organized fraud activity.
IBC also advocates for a coordinated approach to law enforcement that includes sharing information on investigations and prosecutions across national and international jurisdictions.
Regulation
The P&C insurance industry is regulated by both federal and provincial governments. Regulations related to solvency – or the ability of insurers to meet their fi nancial obligations to policyholders – are the responsibility of the federal Offi ce of the Superintendent of Financial Institutions (OSFI). The regulation of market conduct – or insurers’ responsibility to treat customers fairly including setting fair car insurance rates – falls within the mandate of provincial governments.
While it is not possible to determine the total cost to the industry of compliance with regulatory requirements, it is believed that these costs are very signifi cant and could be as high as hundreds of millions of dollars. The P&C insurance industry, via IBC, advocates for an even-handed approach that strikes the right balance between regulation to ensure a level playing fi eld for business and to strengthen public confi dencein the insurance market on the one hand, and not burdeningthe public with expensive and unnecessary regulations on the other hand.
There is a particularly strong regulatory presence in auto insurance where, typically, there are strict rules governing claims handling, underwriting and complaints management. These are intended to protect consumers against unfair or otherwise inappropriate market practices. Provincial regulators are also active in administering auto insurance rate approval systems. In some cases, these systems can be cumbersome and costly while also causing delays in the industry’s ability to respond to changing market conditions.
The P&C insurance industry, through IBC, engages regulators from the federal and provincial governments on a regular basis in eff orts to ensure that new regulatory initiatives are well justifi ed and do not result in excessive burdens on the industry or costs to consumers. An important theme of these eff orts is to encourage harmonization of legislative and regulatory frameworks for insurance across provincial and territorial jurisdictions. Success in this area could bring signifi cant benefi ts to consumers by enhancing the effi ciency and cost eff ectiveness of insurance regulations.

252014 | IBC Facts
Reinsurance
Reinsurance is insurance for insurers. Reinsurers, which are often international corporations, spread their risks by supporting “primary” insurers in several countries and in many regions around the world. Insurance companies pay premiums to reinsurers in exchange for an agreement to have a proportion of their claims paid for them. Reinsurance is particularly important because it provides primary insurers with additional capital and protection in the event of a major loss or catastrophe. Reinsurance is one of many tools used by insurers to guarantee that they will meet every obligation to pay claims.
In recent years, reinsurers have helped insurance companies pay the claims from several major events. Among these was the fl ooding in Alberta in 2013.

Canada’s P&C insurance industry by line of business
2

28 IBC Facts | 2014
In 2012, auto insurance, which is required by law in every Canadian province, accounted for approximately half the insurance written by P&C insurers. Auto insurance covers the driver, passengers, pedestrians and property involved in a vehicle collision.
Approximately 110 private P&C insurance companies compete for auto insurance business in Canada. In addition to these private insurers, government-owned insurers in British Columbia, Saskatchewan, Manitoba and Quebec are the providers of the compulsory component of auto insurance in those provinces.
Compulsory insuranceThere are three kinds of compulsory coverage:
Accident benefi ts (AB) coverage pays for medical treatment, income replacement and other benefi ts to aid the recovery of collision victims, including drivers, passengers and pedestrians. This coverage also provides funeral expenses and survivor benefi ts in the case of a death. This insurance is compulsory in all provinces except Newfoundland and Labrador. In some provinces, it is referred to as “Section B” benefi ts.
Accident benefi ts are paid on a no-fault basis. This means that the benefi ts are available to anyone insured in a vehicle collision regardless of whether he or she was “at fault” in the collision. See the next page for more detail on no-fault insurance.
Third-party liability (TPL) coverage protects an insured driver and/or owner of the vehicle in the event that someone is killed, is injured or suff ers property damage as a result of the driver’s negligence. Third-party liability is compulsory in all provinces, and in some provinces may include direct compensation property damage (DCPD) coverage. DCPD covers damage to an insured vehicle and to property within the vehicle when another motorist is responsible for the collision. It is called direct compensation because insured parties collect from their own insurers, even though someone else is at fault. DCPD is compulsory in Ontario, Quebec, New Brunswick and now Nova Scotia, where it came into eff ect on April 1, 2013.
Uninsured auto coverage protects an insured person if injured through the fault of a vehicle driver who has no auto liability coverage; it pays what the at-fault driver is liable for, subject to the limit of the policy.
Underinsured motorist protection provides insureds in British Columbia with up to $1 million in coverage for an injury or death caused by an underinsured driver. For example, an at-fault driver with the basic minimum coverage of $200,000
AUTO INSURANCE

292014 | IBC Facts
may have no personal wealth or future earnings potential from which to pay amounts above the policy limit. This $1 million coverage ensures that victims are not disadvantaged by such circumstances. Other jurisdictions in Canada provide for similar coverage on an optional basis.
Optional insuranceCollision and comprehensive insurance are optional in all provinces except Saskatchewan and Manitoba, where both are compulsory.
Collision coverage pays for the cost of repairing or replacing a vehicle following a collision with another vehicle or object, such as a tree, house, animal, guardrail or pothole. Comprehensive coverage pays for repairs to or replacement of a vehicle for damage caused by something other than a collision. The most common insured perils include fi re, theft, vandalism and wind.
“No-fault” insuranceThe concept of “no-fault” insurance developed over time as a way to reduce costs associated with having to prove fault. Before “no fault,” insurers operated only under a tort-based system that required the parties to establish which driver was at fault, with the insurer of the at-fault driver being responsible for covering the losses from injuries resulting from the incident. This process was lengthy and required expensive investigation and often litigation.
Under no-fault insurance, insurers pay for the accident benefi t claims of their own clients regardless of fault.
As a result of no-fault insurance, claims are easier and faster to process.
In most provinces, the driver who did not cause the collision also has the right to sue the at-fault driver for additional costs and damages above the limit of the coverage.
Every province off ers some degree of no-fault insurance. Two provinces – Manitoba and Quebec – have pure no-fault systems, with no right to sue. Other provinces use a mix of no-fault and tort-based systems that specify accident benefi ts limits and the right to sue for additional compensation under certain specifi ed situations, such as when injuries are recognized as permanent and serious.
Yukon
Northwest Territories
Nunavut
British Columbia
Alberta
Saskatchewan
Manitoba
Ontario
Quebec
Newfoundland and Labrador
New Brunswick
Nova Scotia
P.E.I.
Every province off ers some degree of no-fault insurance.
■ pure no-fault systems with no right to sue
■ mix of no-fault and tort-based systems
30 IBC Facts | 2014
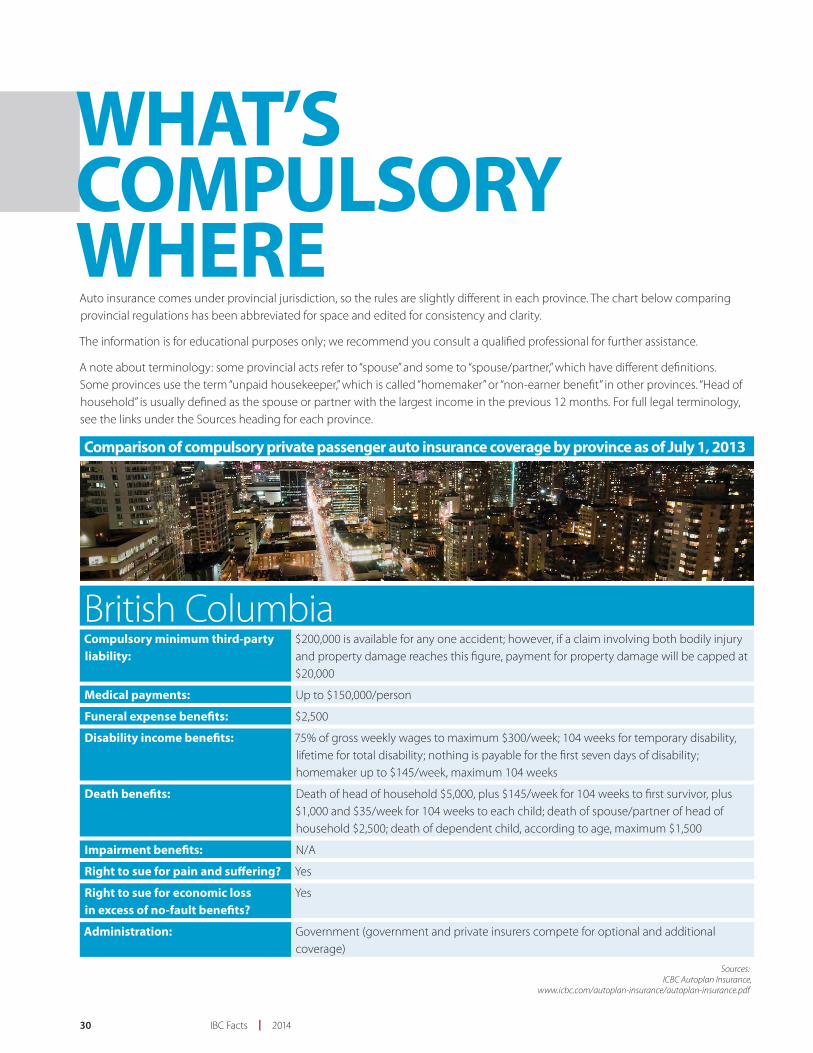
British ColumbiaCompulsory minimum third-party liability:
$200,000 is available for any one accident; however, if a claim involving both bodily injury and property damage reaches this fi gure, payment for property damage will be capped at $20,000
Medical payments: Up to $150,000/person
Funeral expense benefi ts: $2,500
Disability income benefi ts: 75% of gross weekly wages to maximum $300/week; 104 weeks for temporary disability, lifetime for total disability; nothing is payable for the fi rst seven days of disability; homemaker up to $145/week, maximum 104 weeks
Death benefi ts: Death of head of household $5,000, plus $145/week for 104 weeks to fi rst survivor, plus $1,000 and $35/week for 104 weeks to each child; death of spouse/partner of head of household $2,500; death of dependent child, according to age, maximum $1,500
Impairment benefi ts: N/A
Right to sue for pain and suff ering? Yes
Right to sue for economic loss in excess of no-fault benefi ts?
Yes
Administration: Government (government and private insurers compete for optional and additional coverage)
Sources:ICBC Autoplan Insurance,
www.icbc.com/autoplan-insurance/autoplan-insurance.pdf
Auto insurance comes under provincial jurisdiction, so the rules are slightly diff erent in each province. The chart below comparing provincial regulations has been abbreviated for space and edited for consistency and clarity.
The information is for educational purposes only; we recommend you consult a qualifi ed professional for further assistance.
A note about terminology: some provincial acts refer to “spouse” and some to “spouse/partner,” which have diff erent defi nitions. Some provinces use the term “unpaid housekeeper,” which is called “homemaker” or “non-earner benefi t” in other provinces. “Head of household” is usually defi ned as the spouse or partner with the largest income in the previous 12 months. For full legal terminology, see the links under the Sources heading for each province.
WHAT’S COMPULSORY WHERE
Comparison of compulsory private passenger auto insurance coverage by province as of July 1, 2013

312014 | IBC Facts
AlbertaCompulsory minimum third-party liability:
$200,000 is available for any one accident; however, if a claim involving both bodily injury and property damage reaches this fi gure, payment for property damage will be capped at $10,000
Medical payments: Up to $50,000/person
Funeral expense benefi ts: $5,000
Disability income benefi ts: 80% of gross weekly wages to maximum $400/week; up to 104 weeks for total disability; nothing is payable for the fi rst seven days of disability; non-earner benefi t (unemployed person 18 years or older) $135/week, for up to 26 weeks
Death benefi ts: Death any time after accident; death of head of household $10,000, plus 20% ($2,000) for each dependent survivor after fi rst, plus additional $15,000 for fi rst survivor and $4,000 for each remaining survivor; death of spouse/adult interdependent partner of head of household $10,000; death of dependent relative, according to age, maximum $3,000; grief counselling up to $400 per family with respect to death of any one person
Impairment benefi ts: N/A
Right to sue for pain and suff ering? Yes. If injury is deemed “minor” under provincial legislation, maximum award is $4,725
Right to sue for economic loss in excess of no-fault benefi ts?
Yes
Administration: Private insurers
Sources:Alberta Superintendent of Insurance Bulletin 04-2012,
www.fi nance.alberta.ca/publications/insurance/super_bulletin0312.pdf;Automobile Accident Insurance Benefi ts Regulations,
www.qp.alberta.ca/1266.cfm?page=1972_352.cfm&leg_type=Regs&isbncln=0779751140;Alberta Standard Automobile Policy, S.P.F. No. 1,
www.fi nance.alberta.ca/publications/insurance/standard_automobile_policy_2013.pdf

32 IBC Facts | 2014
SaskatchewanCompulsory minimum third-party liability:
$200,000 is available for any one accident; however, if a claim involving both bodily injury and property damage reaches this fi gure, payment for property damage will be capped at $10,000
If no-fault option selected: If tort option selected:
Medical payments: Up to $6,382,084/person Up to $24,954/person for non-catastrophic injury, up to $187,158 for catastrophic injury
Funeral expense benefi ts: $9,573 $6,239
Disability income benefi ts: 90% of net wages based on gross annual income to maximum $86,463/year; nothing is payable for the fi rst seven days of disability unless catastrophically injured
Up to two years; $376/week for total disability, $188/week for partial disability; maximum $19,552/year
Death benefi ts: 45% of deceased’s net income; minimum $65,840 to spouse; 5% of calculated death benefi ts to each dependent child; if no spouse, $14,631 to each surviving parent or child (21 years or older), to maximum $65,840; death of dependent child $29,262
45% of deceased’s net income; minimum $56,147 to spouse; 5% of calculated death benefi ts to each dependent child; if no spouse or dependant, estate receives up to $12,477
Impairment benefi ts: Up to $182,888/person for non-catastrophic injury, up to $223,373 for catastrophic injury
Up to $12,477/person for non-catastrophic injury, up to $162,204 for catastrophic injury
Right to sue for pain and suff ering? No Yes, subject to deductible of $5,000
Right to sue for economic loss in excess of no-fault benefi ts?
Yes Yes
Administration: Government (government and private insurers compete for optional and additional coverage)
Sources:No Fault vs. Tort Liability,
www.sgi.sk.ca/individuals/registration/personalautoinjury/choosinginjuryinsurance/nofaultandtortliability.html; Your Guide to Tort Coverage,
www.sgi.sk.ca/pdf/guide_tort_2013.pdf; Your Guide to No Fault Coverage,
www.sgi.sk.ca/pdf/guide_nofault_2013a.pdf
332014 | IBC Facts
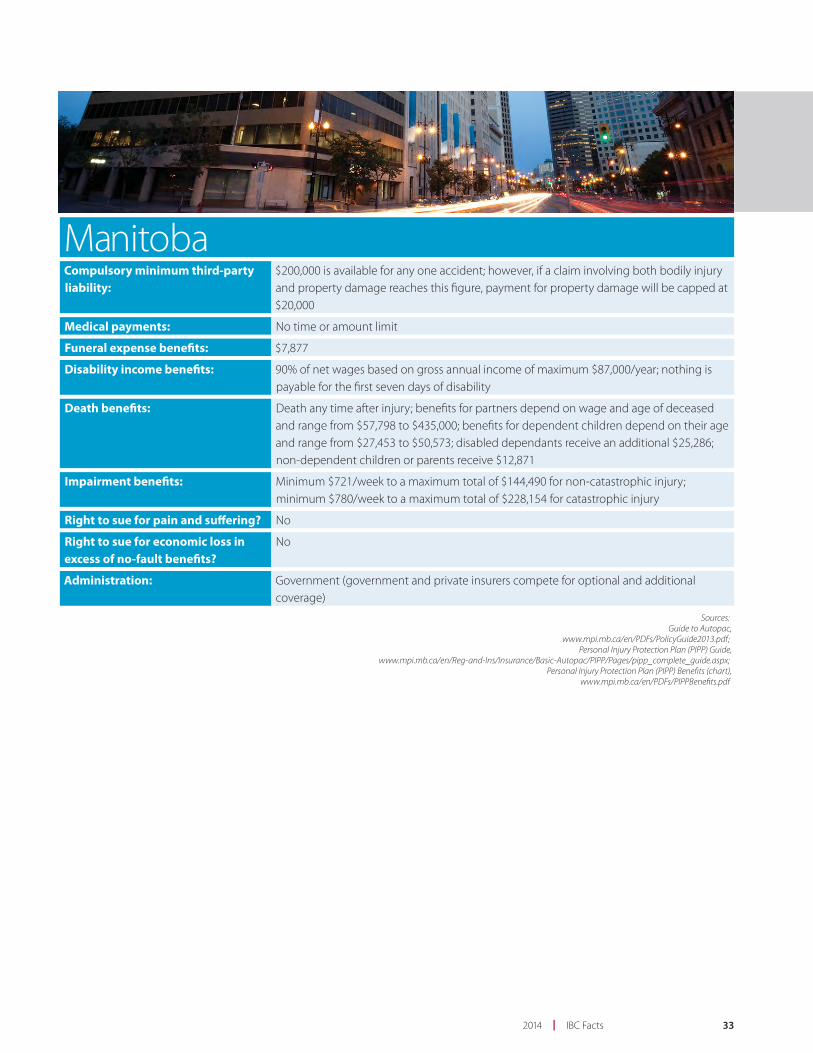
ManitobaCompulsory minimum third-party liability:
$200,000 is available for any one accident; however, if a claim involving both bodily injury and property damage reaches this fi gure, payment for property damage will be capped at $20,000
Medical payments: No time or amount limit
Funeral expense benefi ts: $7,877
Disability income benefi ts: 90% of net wages based on gross annual income of maximum $87,000/year; nothing is payable for the fi rst seven days of disability
Death benefi ts: Death any time after injury; benefi ts for partners depend on wage and age of deceased and range from $57,798 to $435,000; benefi ts for dependent children depend on their age and range from $27,453 to $50,573; disabled dependants receive an additional $25,286; non-dependent children or parents receive $12,871
Impairment benefi ts: Minimum $721/week to a maximum total of $144,490 for non-catastrophic injury; minimum $780/week to a maximum total of $228,154 for catastrophic injury
Right to sue for pain and suff ering? No
Right to sue for economic loss in excess of no-fault benefi ts?
No
Administration: Government (government and private insurers compete for optional and additional coverage)
Sources:Guide to Autopac,
www.mpi.mb.ca/en/PDFs/PolicyGuide2013.pdf;Personal Injury Protection Plan (PIPP) Guide,
www.mpi.mb.ca/en/Reg-and-Ins/Insurance/Basic-Autopac/PIPP/Pages/pipp_complete_guide.aspx;Personal Injury Protection Plan (PIPP) Benefi ts (chart),
www.mpi.mb.ca/en/PDFs/PIPPBenefi ts.pdf

34 IBC Facts | 2014
OntarioCompulsory minimum third-party liability:
$200,000 is available for any one accident; however, if a claim involving both bodily injury and property damage reaches this fi gure, payment for property damage will be capped at $10,000
Medical payments: Up to $3,500 for minor injury; up to $50,000/person for non-minor and non-catastrophic injury for up to 10 years; up to $1 million for catastrophic injury; attendant care up to $36,000 for non-minor and non-catastrophic injury up to 104 weeks
Funeral expense benefi ts: $6,000 (if optional indexation coverage is purchased, this amount may be higher)
Disability income benefi ts: Income Replacement Benefi t: 70% of gross wages to maximum $400/week, minimum $185/week for 104 weeks (longer if victim is unable to pursue any suitable occupation); nothing is payable for the fi rst seven days of disabilityNon-earner Benefi t (disabled unemployed persons, students enrolled in education full time, or students who completed their education less than one year before the accident and are not employed): $185/week for 104 weeks; 26-week wait; limit two years; if student (as defi ned above) is still disabled after 104 weeks, Non-earner Benefi t is $320/week. Not available if the insured is eligible for, and elects to receive, the income replacement or caregiver benefi t
Death benefi ts: Death within 180 days of accident (or three years if continuously disabled prior to death); $25,000 minimum to spouse, $10,000 to each surviving dependant, $10,000 to each parent/guardian (if optional indexation coverage is purchased, these amounts may be higher)
Impairment benefi ts: N/A
Right to sue for pain and suff ering? Yes, if injury meets severity test (called “threshold”), and subject to deductible. Lawsuit allowed only if injured person dies or sustains permanent and serious disfi gurement and/or impairment of important physical, mental or psychological function. The court assesses damages and deducts $30,000 ($15,000 for a Family Law Act claim)
Right to sue for economic loss in excess of no-fault benefi ts?
Yes. Income replacement award above no-fault benefi t is based on net income after deductions for income tax, Canada Pension and Employment Insurance. Injured person may sue for 70% of net income loss before trial, 100% of gross after trial; also for medical, rehabilitation and related costs when injury meets severity test for pain and suff ering claims
Administration: Private insurers
Sources:Ontario Automobile Policy,
www.fsco.gov.on.ca/en/auto/forms/Documents/OAP-1-Application-and-Endorsement-Forms/1215E.1.pdf; Statutory Accident Benefi ts Schedule (SABS), Insurance Act, O. Reg. 34/10,
www.e-laws.gov.on.ca/html/regs/english/elaws_regs_100034_e.htm;Financial Services Commission of Ontario: Auto Bulletins,
www.fsco.gov.on.ca/en/auto/autobulletins/Pages/default.aspx
352014 | IBC Facts
QuebecPrivate Insurance
Public Insurance
Compulsory minimum third-party liability:
$50,000 is available for any one accident; liability limits relate to property damage claims within Quebec and to personal injury and property damage claims outside Quebec
Medical payments: No time or amount limit
Funeral expense benefi ts: $4,913
Disability income benefi ts: 90% of net wages based on gross annual income of maximum $67,500/year; nothing is payable for the fi rst seven days of disability; indexed
Death benefi ts: Death any time after accident; benefi ts depend on gross annual income multiplied by a factor between one and fi ve, depending on age of the victim; benefi ts for spouse range from $65,559 to $337,500; benefi ts for dependent children depend on their age and range from $31,139 to $57,366; if there is no surviving spouse/dependant, parents or estate receive $52,546
Impairment benefi ts: Up to $229,887
Right to sue for pain and suff ering? No
Right to sue for economic loss in excess of no-fault benefi ts?
No
Administration: Bodily injury: government; property damage: private insurers
Sources:The Insurance Policy for All Quebecers: Accident Victim,
www.saaq.gouv.qc.ca/en/accident_victim/insurance_policy/index.php;Compensation Table,
www.saaq.gouv.qc.ca/en/accident_victim/insurance_policy/compensation_table.php;Table of Death Benefi ts,
www.saaq.gouv.qc.ca/en/accident_victim/insurance_policy/death_table.php;

36 IBC Facts | 2014
New BrunswickCompulsory minimum third-party liability:
$200,000 is available for any one accident; however, if a claim involving both bodily injury and property damage reaches this fi gure, payment for property damage will be capped at $20,000
Medical payments: Up to $50,000/person; four-year time limit
Funeral expense benefi ts: $2,500
Disability income benefi ts: Maximum $250/week; 104 weeks for partial disability, lifetime for total disability; must be disabled for at least seven days to qualify; unpaid housekeeper $100/week, maximum 52 weeks
Death benefi ts: Death within 180 days after accident (or two years if continuously disabled prior to death); death of head of household $50,000, plus $1,000 to each dependent survivor after fi rst; death of spouse/partner of head of household $25,000; death of dependant $5,000
Impairment benefi ts: N/A
Right to sue for pain and suff ering? Yes. If injury is deemed “minor” under provincial legislation, maximum award is $7,500
Right to sue for economic loss in excess of no-fault benefi ts?
Yes
Administration: Private insurers
Sources:New Brunswick Standard Owner’s Policy N.B.P.F. No.1,
www.gnb.ca/0062/InsuranceBranch/PDF/Bulletins/StandardOwnersAct-E.pdf
372014 | IBC Facts
Nova ScotiaCompulsory minimum third-party liability:
$500,000 is available for any one accident
Medical payments: Up to $50,000/person; four-year time limit (Consumers have option to purchase additional coverage)
Funeral expense benefi ts: $2,500 (Consumers have option to purchase additional coverage)
Disability income benefi ts: Maximum $250/week; 104 weeks for partial disability, lifetime for total disability; must be disabled for at least seven days to qualify; unpaid housekeeper $100/week, maximum 12 weeks (Consumers have option to purchase additional coverage)
Death benefi ts: Death within 180 days after accident (or two years if continuously disabled prior to death); death of head of household $25,000, plus $1,000 to each dependent survivor after fi rst; death of spouse/partner $25,000; death of dependant $5,000 (Consumers have option to purchase additional coverage)
Impairment benefi ts: N/A
Right to sue for pain and suff ering? Yes. If injury is deemed “minor” under provincial legislation, maximum award is $8,100
Right to sue for economic loss in excess of no-fault benefi ts?
Yes
Administration: Private insurers
Sources:N.S. Reg. 326/2011, Automobile Insurance Contract Mandatory Conditions Regulations Schedule “A”,
www.novascotia.ca/just/regulations/rg2/2012/ja1312.pdfNova Scotia Standard Automobile Policy S.P.F. No.1, 2005,
www.novascotia.ca/fi nance/site-fi nance/media/fi nance/NS_Auto_Standard_Policy_Form1.pdf
38 IBC Facts | 2014
Prince Edward IslandCompulsory minimum third-party liability:
$200,000 is available for any one accident; however, if a claim involving both bodily injury and property damage reaches this fi gure, payment for property damage will be capped at $10,000
Medical payments: Up to $25,000/person; four-year time limit
Funeral expense benefi ts: $1,000
Disability income benefi ts: Maximum $140/week; 104 weeks for partial disability, lifetime for total disability; must be disabled for at least seven days to qualify; unpaid housekeeper $70/week, maximum 12 weeks
Death benefi ts: Death within 180 days after accident (or two years if continuously disabled prior to death); death of head of household $10,000, plus $1,000 to each dependent survivor after fi rst; death of spouse of head of household $10,000; death of dependant $2,000
Impairment benefi ts: N/A
Right to sue for pain and suff ering? Yes. If injury deemed “minor” under provincial regulation, maximum award is $2,500
Right to sue for economic loss in excess of no-fault benefi ts?
Yes
Administration: Private insurers
Sources:Insurance Act, RSPEI 1988, c I-4,
http://canlii.ca/en/pe/laws/stat/rspei-1988-c-i-4/latest/rspei-1988-c-i-4.html Prince Edward Island Standard Automobile Policy S.P.F. No.1 (not available online)
392014 | IBC Facts
Newfoundland and LabradorCompulsory minimum third-party liability:
$200,000 is available for any one accident; however, if a claim involving both bodily injury and property damage reaches this fi gure, payment for property damage will be capped at $20,000
Medical payments: (Optional to buy) Up to $25,000/person; four-year time limit
Funeral expense benefi ts: (Optional to buy) $1,000
Disability income benefi ts: (Optional to buy) Maximum $140/week; 104 weeks for partial disability, lifetime for total disability; must be disabled for at least seven days to qualify; unpaid housekeeper $70/week, maximum 12 weeks
Death benefi ts: (Optional to buy) Death within 180 days after accident (or two years if continuously disabled prior to death); death of head of household $10,000, plus $1,000 to each dependent survivor after fi rst; death of spouse $10,000; death of dependant $2,000
Impairment benefi ts: N/A
Right to sue for pain and suff ering? Yes. Awards for minor injuries are subject to deductible of $2,500
Right to sue for economic loss in excess of no-fault benefi ts?
Yes
Administration: Private insurers
Sources:Automobile Insurance Act, Chapter A-22, an Act Respecting Automobile Insurance,
http://assembly.nl.ca/Legislation/sr/statutes/a22.htm;Newfoundland & Labrador Standard Automobile Policy S.P.F. No.1 (not available online)

40 IBC Facts | 2014
YukonCompulsory minimum third-party liability:
$200,000 is available for any one accident; however, if a claim involving both bodily injury and property damage reaches this fi gure, payment for property damage will be capped at $10,000
Medical payments: Up to $10,000/person; two-year time limit
Funeral expense benefi ts: $2,000
Disability income benefi ts: 80% of gross weekly wages to maximum $300/week; 104 weeks for temporary or total disability; nothing is payable for the fi rst seven days of disability; unpaid housekeeper $100/week, maximum 26 weeks
Death benefi ts: Death any time after accident; death of head of household $10,000, plus $2,000 to each dependent survivor other than the fi rst, and 1% of total principal sum to each dependant/survivor after fi rst, for 104 weeks; death of spouse of head of household $10,000; death of dependent relative, according to age, maximum $3,000
Impairment benefi ts: N/A
Right to sue for pain and suff ering? Yes
Right to sue for economic loss in excess of no-fault benefi ts?
Yes
Administration: Private insurers
Sources:Insurance Act, O.I.C. 1988/090, www.gov.yk.ca/legislation/regs/oic1988_090.pdf;
Yukon Territories Standard Automobile Policy S.P.F. No.1 (not available online)

412014 | IBC Facts
Northwest Territories and NunavutCompulsory minimum third-party liability:
$200,000 is available for any one accident; however, if a claim involving both bodily injury and property damage reaches this fi gure, payment for property damage will be capped at $10,000
Medical payments: Up to $25,000/person; four-year time limit
Funeral expense benefi ts: $1,000
Disability income benefi ts: 80% of gross weekly wages to maximum $140/week; 104 weeks for temporary disability; lifetime for total disability; nothing is payable for the fi rst seven days of disability; unpaid housekeeper $100/week, maximum 12 weeks
Death benefi ts: Death within 180 days after accident (or two years if continuously disabled prior to death); death of head of household $10,000, plus $1,500 to single survivor or $2,500 to each survivor after fi rst if more than one; death of spouse of head of household $10,000; death of dependant $2,000
Impairment benefi ts: N/A
Right to sue for pain and suff ering? Yes
Right to sue for economic loss in excess of no-fault benefi ts?
Yes
Administration: Private insurers
Sources:
Northwest TerritoriesInsurance Act, R.S.N.W.T. 1988, c.I-4, www.justice.gov.nt.ca/PDF/ACTS/Insurance.pdf;
Northwest Territories Standard Automobile Policy S.P.F. No.1 (not available online)
NunavutInsurance Act, R.S.N.W.T.1988, c.I-4,
www.justice.gov.nu.ca/apps/search/docSearch.aspx (search “Insurance act” in title);Nunavut Territories Standard Automobile Policy S.P.F. No.1 (not available online)

42 IBC Facts | 2014
Private passenger auto insurance claims, 2012Third-party liability (includes DCPD where
applicable) Accident benefi ts Collision ComprehensiveNumber of insured vehicles 10,401,220 10,375,192 7,159,505 8,204,454
Number of claims 349,335 100,748 232,292 277,838
Total cost of claims in $000 4,474,397 2,109,092 1,258,719 651,952
Source: 2012 GISA Automobile Insurance Experience Exhibits
Commercial auto insurance claims, 2012Third-party liability (includes DCPD where
applicable) Accident benefi ts Collision ComprehensiveNumber of insured vehicles 963,933 955,884 375,586 495,817
Number of claims 20,652 2,419 7,963 10,356
Total cost of claims in $000 489,367 81,849 74,140 59,885
Source: 2012 GISA Automobile Insurance Experience Exhibits
Premiums and claimsPrivate insurers wrote policies providing them with $20.7 billion in net written premiums for auto insurance in 2012.
Car insurance premiums, like all insurance premiums, are determined based on risk. Insurers estimate how likely it is that a customer – and a group of customers with the same set of circumstances – will make a claim, and how much those claims will likely cost in a given year. A number of factors help to determine car insurance premiums. These include where a customer lives, the type of vehicle that customer drives, how the vehicle is used and the customer’s driving record and driver profi le (a driver profi le includes the claims history of a group of customers of the same age, for example).
For a complete breakdown of how each dollar collected by insurers is spent, see Insurance Dollar, page 8.
In 2012, Canadian private P&C insurers paid out $14.7 billion in net claims incurred to policyholders for all types of auto insurance coverage: third-party liability, accident benefi ts, collision and comprehensive, and other coverages. Third-party liability claims payouts accounted for 55.7% of all net claims incurred. The vast majority of claims – 87% – are for incidents involving private passenger vehicles.
A note about terminology: The tables below show claims costs by accident year, which is how much insurers will pay out for all claims that occurred in that year (although in some instances claims may be paid in future years).

432014 | IBC Facts
Cost of claims for private passenger auto by type of coverage in $000, 1990 to 2012Third-party
liability (includes DCPD where
applicable) Accident benefits Collision Comprehensive Other* Total1990 2,035,794 645,327 789,050 476,248 100,197 4,046,6161991 1,557,223 826,630 782,701 691,504 112,617 3,970,6761992 1,690,892 955,247 771,711 615,656 100,816 4,134,3221993 1,891,894 1,013,499 794,386 654,682 104,268 4,458,7291994 1,806,448 1,583,445 779,566 657,289 106,721 4,933,4691995 1,836,659 1,460,207 742,144 667,006 146,309 4,852,3251996 2,013,311 1,488,634 738,032 668,771 159,227 5,067,9741997 2,367,893 1,020,203 710,974 540,848 211,333 4,851,2521998 2,647,796 1,167,722 730,958 576,313 261,789 5,384,5791999 3,029,483 1,363,443 824,667 536,664 279,656 6,033,9132000 3,294,612 1,627,522 959,375 577,220 334,102 6,792,8312001 3,467,618 1,782,345 972,174 586,275 381,412 7,189,8222002 3,716,720 2,123,513 1,061,507 569,493 417,040 7,888,2732003 3,527,096 1,984,235 1,005,173 540,173 417,973 7,474,6492004 3,216,077 1,719,269 930,018 485,357 404,888 6,755,6092005 3,236,802 1,896,576 984,032 531,984 410,442 7,059,8352006 3,461,057 2,193,308 1,059,481 531,643 417,395 7,662,8842007 3,829,155 2,568,156 1,240,510 635,607 446,005 8,719,4342008 3,911,647 2,861,211 1,260,740 661,588 463,229 9,158,4142009 4,300,442 3,921,439 1,203,176 662,769 485,551 10,573,3772010 4,542,873 3,849,136 1,153,930 747,229 478,259 10,771,4272011 4,596,973 2,026,159 1,235,462 641,812 487,468 8,987,8742012 4,889,973 1,832,948 1,262,024 788,989 454,910 9,228,845
Source: IBC Economic Trends, with data from GISAFigures may not add up to 100% as a result of rounding
*Includes uninsured auto, underinsured motorist, all perils and specified perils

44 IBC Facts | 2014
Average lossesInsurers track loss amounts in two ways. They calculate the average cost per claim (severity) and the average cost per insured vehicle (loss cost).
The average cost per claim is calculated by dividing the total cost of claims by the number of claims. In 2012, the national average
Average cost ($) per claim by type of coverage for private passenger automobile insurance, 2008 to 2012Type of coverage 2008 2009 2010 2011 2012Third-party liability 11,742 12,604 13,035 13,282 14,241
Accident benefi ts 29,573 37,471 34,812 20,546 19,074
Collision 5,5145 4,994 5,113 5,331 5,477
Comprehensive 2,679 2,568 2,879 2,294 2,623
Source: 2012 GISA Automobile Insurance Experience Exhibits
Average cost ($) per insured vehicle by type of coverage for private passenger vehicles, 2008 to 2012Type of coverage 2008 2009 2010 2011 2012Third-party liability 395.95 429.61 446.56 443.86 462.21
Accident benefi ts 290.27 392.41 379.00 195.97 173.39
Collision 184.76 173.80 164.73 173.63 173.18
Comprehensive 84.69 83.31 92.64 78.40 94.26
Source: 2012 GISA Automobile Insurance Experience Exhibits
Major issues – aff ordable, eff ective auto insurance
Aff ordable and eff ective auto insurance is an ongoing concern of the insurance industry. In Canada, provincial governments oversee almost all aspects of auto insurance, from what type of mandatory benefi ts are included, to the setting of rates, to how insurers treat their customers. The insurance industry continually works with governments to improve the auto insurance product and system, with the goal of balancing aff ordability with adequate, eff ective benefi ts for all those who are injured.
For example, in Ontario, where auto insurance premiums are high compared to the rest of the country, the insurance industry is working to address issues that have driven up rates. These include spiralling health care and treatment costs, insurance fraud, problems in the current mediation dispute resolution system and more.
In Alberta, New Brunswick, Nova Scotia and Prince Edward Island, caps on general damage awards for those having minor injuries such as sprains, strains and associated whiplash-type disorders have been eff ective in keeping rates aff ordable.
Major issues – safetyThe number of motor vehicle collision deaths and injuries continues to decline in Canada as a result of improved driver behaviour, improved vehicle design and, to some extent, better road networks.
In 1990, 3,963 people died in traffi c accidents, while in 2011 (the most recent year for which Transport Canada statistics are available), 2,006 died. This is a reduction of 49%. The decline in the rate of injuries has also been signifi cant. In 1990, 262,680 Canadians were injured in collisions; this was reduced to 166,725 by 2011, which is a reduction of 37%.
Many of today’s most eff ective road safety measures are the result, in part, of insurer advocacy. Insurers were leaders in advocating for the mandatory use of seatbelts. Insurers have also advocated for stronger penalties for drinking and driving and better law enforcement, which have made a signifi cant impact on driver behaviours. The industry played a big role in the introduction of graduated driver licensing in all provinces, which also improved safety.
cost per claim for private passenger auto insurance claims was $9,247,326,126÷1,034,622= $8,938.
The average cost per insured vehicle is calculated by dividing the total cost of claims by the number of insured vehicles. In 2012, the national average cost per insured private passenger vehicle was $9,247,326,126÷10,602,528 = $872.18.

452014 | IBC Facts
As new road safety concerns emerge, such as driver distraction and the increasing number of aging drivers, insurers are helping to identify the factors that lead to increased risk and are working to implement measures that will help keep Canadians safe.
Reducing driver distraction is the latest focus of advocacy to improve driver behaviour. IBC has been a strong advocate for education about the dangers of distracted driving. All provinces and territories in Canada, except Nunavut, now have bans in place on hand-held electronic devices, including cellphones, while driving.
Improved vehicle design – including airbags, energy-absorbing car frames and anti-lock braking systems – has also contributed to the reduction in deaths and injuries from collisions.
Of course, some vehicles are safer than others. The Canadian Loss Experience Automobile Rating (CLEAR) system identifi es the average size and frequency of insurance claims for most makes and models of cars. Most insurance companies use CLEAR to rate vehicles based on their safety record and the cost to repair or replace them, and then off er lower premiums to drivers who buy cars with better ratings.
While vehicles improve, the Canadian road network is not always keeping pace. Much of it is used beyond capacity, particularly in large urban centres. Increased volume of traffi c increases collision risk. However, road design and maintenance improvements, including better lighting, more shock-absorbent roadside barriers and speedier snow removal and de-icing programs, can reduce risk.
Major issues – crimeAuto insurance crime costs the Canadian P&C insurance industry hundreds of millions of dollars each year. Auto insurance crime can be perpetrated by a single policyholder making a false or exaggerated claim or by a large organized crime ring that steals vehicles, operates chop shops and stages collisions to support accident benefi ts claims.
Insurance fraud and vehicle theft are attractive activities for organized crime rings because they are highly profi table and yet are low risk compared to other forms of crime. These cases are complex and diffi cult to prosecute because they cross many boundaries – jurisdictional, political, geographic and administrative.
The P&C insurance industry, led by IBC, works on several fronts to prevent, detect and investigate auto insurance fraud and vehicle theft and to recover stolen vehicles. These eff orts include raising consumer awareness and partnering with insurers, law enforcement and government agencies.
In 2013, IBC also helped to start CANATICS, a non-profi t organization that will use the latest technology to analyze pooled auto insurance industry data to help identify fraud.
Auto theft accounts for a large percentage of all property crime in Canada. Organized rings are carrying out a growing number of high-value auto thefts, including thefts of Canadian autos bound for international export.
Following advocacy eff orts from IBC, the federal government enacted Bill S-9 in 2010. The law recognized auto theft as a serious, violent crime (not just a property crime) in both the Criminal Code of Canada and the Youth Criminal Justice Act and introduced tougher penalties for those who commit auto theft.
To assist police in fi nding stolen vehicles, IBC partners with police services in Alberta and Ontario, using licence plate reader technology to scan the plates of cars on streets and in parking lots and to compare their numbers to a national list of stolen vehicles. When a match is found, police are alerted.
IBC has also partnered with national and international law enforcement and Canada Border Services Agency to recover autos stolen in Canada and bound for export. In 2013, IBC helped recover 493 high-value stolen autos, worth $8.7 million, before they could be shipped off shore.
This was an increase from the $8.1 million worth of stolen vehicles recovered in 2012.
On the prevention side of this issue, IBC publishes a list every year of the most frequently stolen cars to alert consumers of the risks.
The 10 most frequently stolen autos in Canada, 20132000 Honda Civic SiR 2-door
2006 Chevrolet Trailblazer SS 4-door 4WD SUV
2002 Cadillac Escalade 4-door 4WD SUV
2005 Cadillac Escalade 4-door 4WD SUV
2006 Ford F350 SD 4WD pickup
2005 Cadillac Escalade ESV 4-door AWD SUV
2006 Acura RSX Type S 2-door
2007 Ford F250 SD 4WD pickup
2007 Ford F350 SD 4WD pickup
2003 Acura RSX Type S 2-door

46 IBC Facts | 2014
Home or personal property insurance is the second largest line of P&C policies after auto insurance. It covers the property, belongings and personal liability of the policyholder and the policyholder’s spouse/partner, children (according to age limits) and dependants (according to age and other limits). Home insurance includes house, condominium, cottage, mobile home and tenant’s insurance.
All property owners and tenants need home insurance; however, unlike auto insurance, home insurance is not required by law. In spite of this, most banks and mortgage holders require proof of insurance prior to lending money to buy a house or cottage.
Like all insurance premiums, the price an individual pays for home insurance depends on a number of factors related to risk. Insurers analyze these risks, and fi gure out how likely it is that a policyholder – or a group of people with the same set of circumstances – will make a claim, and how much that claim will cost.
Insurers look at many factors when setting a home insurance premium, including the neighbourhood and the frequency and types of past claims in that area, the cost to replace a home’s contents and restore a home to its previous condition, the condition and age of the roof, the types of heating, electrical and plumbing systems, details about any additional structures on the property and more.
Types of coverageHome insurance policies generally cover a homeowner’s residential building, outbuildings, contents, additional living expenses (which may be incurred if an insured event damages the home) and liability. A tenant’s insurance policy generally covers loss or damage to personal belongings, additional living expenses and liability.
There are many kinds of coverage:
• A comprehensive policy protects a home and its contents from loss or damage from all perils except those specifi cally excluded. A peril is a chance event that is unexpected and accidental. Coverage for some perils excluded from comprehensive policies – for example, earthquake coverage – may be purchased as an add-on to the policy. However, for some excluded perils, such as overland fl ooding, no home insurance coverage is available.
• A broad-form policy protects a home from loss or damage for all perils except those specifi cally excluded; it also insures contents for only those perils named in the policy.
• A standard, basic or named perils policy protects a home and its contents from perils specifi cally named in the policy.
• A no-frills policy off ers very basic coverage for properties that do not meet with insurers’ normal underwriting standards.
HOME INSURANCE
472014 | IBC Facts
Premiums and claimsIn 2012, private P&C insurers wrote $8.6 billion in net written premiums for personal property insurance and paid out $5 billion in net claims incurred.
For a complete breakdown of how each dollar of revenue collected by insurers is spent, see Insurance Dollar, page 8.
Major issues – severe weatherThe increasing incidence of severe weather is a growing risk that disrupts lives and costs billions of dollars. In 2013, insured damage caused by natural disasters was the highest in Canadian history at $3.2 billion. The losses of 2013 came after four years in a row where insured losses from natural disasters were near or above $1 billion, which was already a record high.
Canadian communities are seeing more severe weather, especially more intense rainfall. This can overburden sewer and stormwater infrastructure, resulting in more sewer backups in homes and businesses. Many urban communities have older stormwater infrastructure that is not built to handle these intense storms. Installing a backfl ow valve is one way that individuals can reduce their risk of having a sewer backup. Many communities provide incentives to assist homeowners with the cost of installation.
The P&C insurance industry leads national strategies to adapt to the eff ects of extreme weather. After several years of research and development, IBC recently unveiled a new predictive tool for municipalities to help them pinpoint vulnerabilities in their sewer and stormwater infrastructure that could lead to sewer backup and basement fl ooding.
The new technology, called MRAT for “municipal risk assessment tool,” combines information about municipal infrastructure, current and future climate, and insurance claims to give city engineers a new and revealing picture of where infrastructure is vulnerable now and projects that vulnerability forward to 2020 and 2050. The tool was developed with fi nancial support from Natural Resources Canada’s Innovative Risk Management Tools program.
IBC launched MRAT in November 2013 as a pilot project in partnership with three municipalities – Coquitlam, BC, Fredericton, NB, and Hamilton, ON. MRAT will help municipalities identify vulnerabilities in their sewer and stormwater infrastructure in order to prioritize improvements to prevent sewer backups and keep basements dry.
Major issues – earthquakesNatural Resources Canada predicts that within the next 50 years there is a 30% chance of a signifi cant quake in British Columbia and a 5% to 15% chance of one in the Quebec City-Montreal-Ottawa region. The P&C insurance industry is engaged in research with a view to better prepare Canadians to minimize risk of death, injury and damage.
In 2013, IBC released a study it commissioned from AIR Worldwide (global experts in catastrophic modelling) to quantify the overall insurance and economic costs of a 1-in-500-year earthquake and provide a detailed analysis of the aftermath.
The study modelled two major, realistically possible earthquake events. The western scenario shows the eff ect of a 9.0-magnitude earthquake off the coast of British Columbia. Overall economic losses in that scenario total almost $75 billion, with insured losses totalling $20 billion. The eastern scenario shows the eff ect of a 7.1-magnitude earthquake near Quebec City. In that scenario, overall economic losses total almost $61 billion, and insured losses total $12 billion. Insured losses are relatively low in both scenarios because there is low take-up of residential earthquake insurance in Canada’s two risk zones. Although these zones cover only a small fraction of Canada by area, 40% of Canadians live within them.
Earthquake damage is not covered under a home insurance policy but can be purchased as an add-on to the policy. Consumers living in earthquake-prone areas in Quebec, Ontario and British Columbia could benefi t from separate earthquake coverage. Earthquake insurance often has a higher deductible than coverage for other perils and generally covers loss or damage to property that is directly caused by the shaking of the earth.

48 IBC Facts | 2014
Businesses and non-profi t organizations, including charities, purchase insurance as part of good management practices. In larger enterprises, risk managers evaluate perils to the organization, implement programs to reduce and manage those dangers and purchase insurance to backstop remaining exposures.
Smaller businesses, which don’t tend to have risk managers, depend more on the advice of insurance representatives to identify risks and help them select insurance to cover potential losses.
Home-based businesses, like all businesses, require coverage for possible business-related losses. For example, an owner of a home-based business may require commercial liability coverage. Business risks are not covered by the liability section of a personal property policy.
Types of coverageThere are many kinds of business insurance coverage:
• Commercial general liability is the most basic form of business insurance. It covers bodily injury, property damage, personal injury, advertising injury, tenant’s legal liability and other types of liability.
• Directors’ and offi cers’ insurance covers such areas as breach of duty, actual or alleged errors, errors or omissions, neglect and misleading statements by directors and offi cers.
• Errors and omissions insurance provides protection for people who give professional advice (e.g., consultants, fi nancial planners). It protects these professionals if clients claim damages as a result of the business professional’s faulty performance.
• Business interruption insurance covers revenues lost during a shutdown because of such events as fi res and riots. It can cover the period of time needed to resume profi tability. Some business owners may also purchase optional insurance to cover extra operating expenses – such as telephone, advertising, rentals or moving to other premises – that could be incurred if the business must carry on at another location or outsource work during the period of damage.
BUSINESS INSURANCE

492014 | IBC Facts
Premiums and claimsIn 2012, private P&C insurers wrote $6.1 billion in net written premiums for commercial property insurance and paid out $4 billion in net claims incurred.
Also in 2012, private P&C insurers wrote $4.5 billion in net written premiums for commercial liability insurance and paid out $2.6 billion in net claims incurred.
For a complete breakdown of how each dollar collected by insurers is spent, see Insurance Dollar, page 8.
Major issues – cyber liabilityAlong with other members of the fi nancial services industry that deal with large amounts of sensitive data, insurers are increasingly at risk of being targeted by cybercriminals. With cyberattacks growing in frequency and sophistication, and Canadians becoming more reliant on technology and sharing information online, organizations of all kinds are starting to assess their exposure to cyber risk.
In 2013, the Offi ce of the Superintendent of Financial Institutions (OSFI), Canada’s federal fi nancial services regulator, warned banks and insurance companies of the need to review and improve their cyber security initiatives.
IBC is currently investigating cyber risk posed to insurance companies from a Canadian perspective.
Major issues – railway third-party liability
The devastating train disaster in Lac-Mégantic raised serious concerns about shipping hazardous materials by rail and the minimum insurance requirements for railways.
The tragic derailment killed 47 residents and destroyed the downtown of the small Quebec community. With environmental clean-up costs expected to exceed $200 million and several pending lawsuits from survivors, the rail company’s third-party liability coverage of $25 million falls short of what will be needed.
Shortly after the tragedy, the Canadian Transportation Agency (the federal regulator) announced a public consultation process and review of the adequacy of third-party liability coverage. The review could lead to future regulatory changes that will undoubtedly aff ect commercial insurance writers.
Insurance Bureau of Canada is participating in the review and will be actively following this issue.
Major issues – cargo theft Stealing and re-selling truck cargo – usually consumer goods including electronic goods, frozen food, clothing and more – has become a lucrative business for organized crime rings in Canada. According to the Canadian Trucking Alliance, a conservative estimate puts cargo theft costs at $5 billion each year.
In 2011, in partnership with member insurers and the Canadian Trucking Alliance, IBC Investigative Services began a pilot reporting project to collect, analyze and share cargo loss information with law enforcement across Canada. The project resulted in several recoveries of stolen trailers and consumer goods.
Building on this success, IBC is expanding the cargo loss reporting program to include more insurers and additional law enforcement – including border authorities in Canada and the United States – in an eff ort to crack down on cargo theft, raise awareness, improve reporting, recover stolen property and bring criminals to justice.

Insurance organizations
3
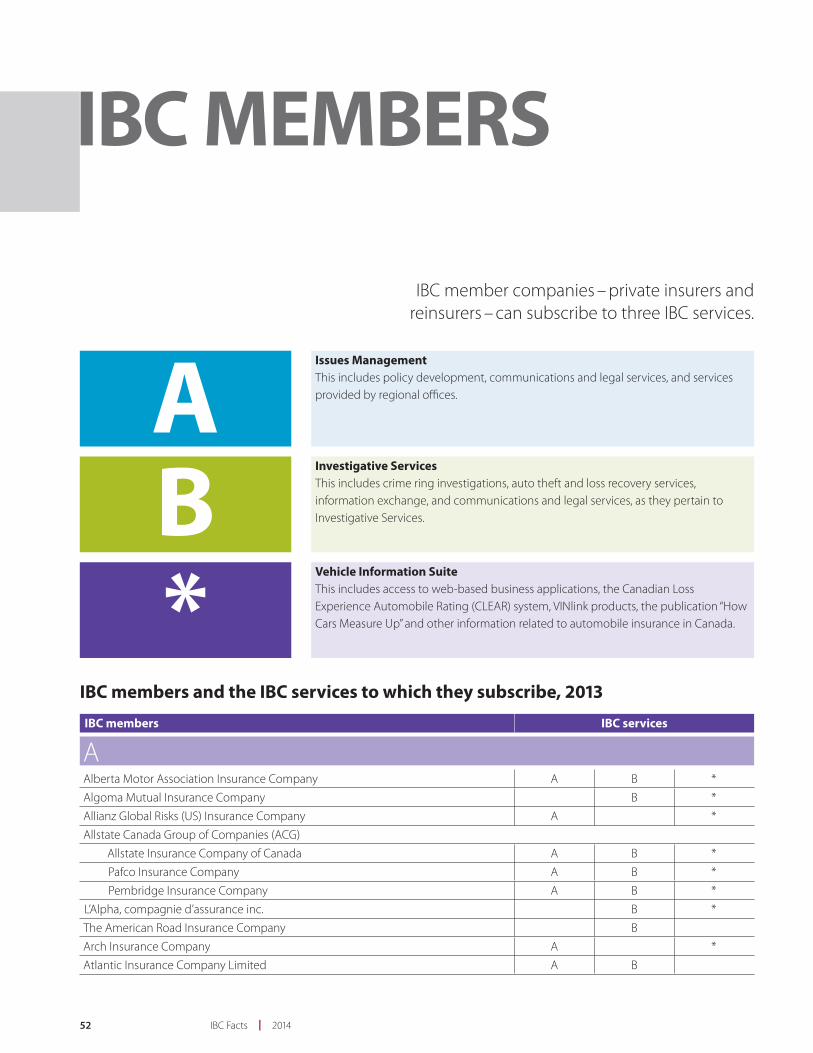
52 IBC Facts | 2014
IBC MEMBERS
AIssues ManagementThis includes policy development, communications and legal services, and services provided by regional offi ces.
BInvestigative ServicesThis includes crime ring investigations, auto theft and loss recovery services, information exchange, and communications and legal services, as they pertain to Investigative Services.
*Vehicle Information SuiteThis includes access to web-based business applications, the Canadian Loss Experience Automobile Rating (CLEAR) system, VINlink products, the publication “How Cars Measure Up” and other information related to automobile insurance in Canada.
IBC members IBC services
AAlberta Motor Association Insurance Company A B *
Algoma Mutual Insurance Company B *
Allianz Global Risks (US) Insurance Company A *
Allstate Canada Group of Companies (ACG)
Allstate Insurance Company of Canada A B *
Pafco Insurance Company A B *
Pembridge Insurance Company A B *
L’Alpha, compagnie d’assurance inc. B *
The American Road Insurance Company B
Arch Insurance Company A *
Atlantic Insurance Company Limited A B
IBC member companies – private insurers and reinsurers – can subscribe to three IBC services.
IBC members and the IBC services to which they subscribe, 2013

532014 | IBC Facts
IBC members IBC services
Atradius Credit Insurance N.V. A
Aviva Canada Inc.
Aviva Insurance Company of Canada A B *
Elite Insurance Company A B *
Pilot Insurance Company A B *
S & Y Insurance Company A B *
Scottish & York Insurance Co. Limited A B *
Traders General Insurance Company A B *
AXIS Reinsurance Company (Canadian Branch) A
BBCAA Insurance Corporation A B
The Boiler Inspection and Insurance Company of Canada A B
Brant Mutual Insurance Company B *
CCAA Insurance Company (Ontario) A B *
Caisse Centrale de Réassurance A
Canadian Direct Insurance Inc. B *
La Capitale Financial Group
La Capitale assurances générales inc. A B *
Unica Insurance Incorporated A B *
L’Unique assurances générales inc. A B *
Chubb Group of Insurance Companies
Chubb Insurance Company of Canada A B *
Federal Insurance Company of Canada A B *
Mitsui Sumitomo Insurance Company Limited A B *
Continental Casualty Company A B
The Co-operators Group Limited
Co-operators General Insurance Company B *
COSECO Insurance Company B *
The Sovereign General Insurance Company B *
CorePointe Insurance Company B *
CUMIS General Insurance Company B *
DDesjardins General Insurance Group
Certas Direct Insurance Company A B *
Desjardins assurances générales Inc. A B *
The Personal General Insurance Inc. A B *
The Dominion of Canada General Insurance Company A B *
EEcclesiastical Insurance Offi ce PLC A B
Echelon General Insurance Company B *

54 IBC Facts | 2014
IBC members IBC services
The Economical Insurance Group
Economical Mutual Insurance Company A B *
Federation Insurance Company of Canada A B *
The Missisquoi Insurance Company A B *
Perth Insurance Company A B *
Waterloo Insurance Company A B *
Electric Insurance Company A
Euler Hermes American Credit Indemnity Company A
Everest Insurance Company A
Everest Reinsurance Company A
FFundy Mutual Fire Insurance Company B
GGeneral Reinsurance Corporation A
Gore Mutual Insurance Company A B *
Le Groupe Estrie Richelieu, compagnie d’assurance A B *
The Guarantee Company of North America A B *
HHalwell Mutual Insurance Company B *
Hartford Fire Insurance Company A B *
HDI-Gerling Industrial Insurance Company A
Howick Mutual Insurance Company B *
IIndustrielle Alliance, Assurance auto et habitation inc. B *
Intact Financial Corporation
AXA Assurances Agricoles Inc. A B *
AXA Assurances Inc. A B *
AXA Canada A B *
AXA Insurance (Canada) A B *
AXA Pacifi c Insurance Company A B *
Belair Insurance Company Inc. A B *
Intact Insurance Company A B *
JEVCO Insurance Company A B *
The Nordic Insurance Company of Canada A B *
Novex Insurance Company A B *
Trafalgar Insurance Company of Canada A B *
International Insurance Company of Hannover PLC A

552014 | IBC Facts
IBC members IBC services
LLawyers’ Professional Indemnity Company A
Liberty Mutual Insurance Company A B *
MMetro General Insurance Corporation Ltd. A *
Motors Insurance Corporation B *
Munich Reinsurance America, Inc. A B
The Mutual Fire Insurance Company of British Columbia A
NNational Bank Insurance (InnovAssur, Assurances générales inc.) A B *
Northbridge Insurance
Federated Insurance Company of Canada A B *
Northbridge Commercial Insurance Corporation A B *
Northbridge General Insurance Corporation A B *
Northbridge Personal Insurance Corporation A B *
Tokio Marine & Nichido Fire Insurance Co., Ltd. A B *
Zenith Insurance Company A B *
North Kent Mutual Fire Insurance B *
North Waterloo Farmers Mutual Insurance Company A *
OOdyssey America Reinsurance Corporation (Canadian Branch) A
Old Republic Insurance Company of Canada A B
Omega General Insurance Company A
Oxford Mutual Insurance Company B
PPartner Reinsurance Company of the U.S. A B
Peace Hills General Insurance Company A B *
Portage la Prairie Mutual Insurance Company B *
Protective Insurance Company A
RRBC General Insurance Company A B *
RSA
Ascentus Insurance Ltd. A B *
Canadian Northern Shield Insurance Company A B *
Quebec Assurance Company A B *
Royal & SunAlliance Insurance Company of Canada A B *
Unifund Assurance Company A B *
L’Union Canadienne, compagnie d’assurances A B *Western Assurance Company A B *

56 IBC Facts | 2014
IBC members IBC services
SSentry Insurance, A Mutual Company A
Sirius America Insurance Company A
SSQ, Société d’assurances générales inc. A B *
State Farm Insurance Companies
State Farm Fire & Casualty Company A B *
State Farm Mutual Automobile Insurance Company A B *
Swiss Reinsurance Group
Swiss Reinsurance Company Canada A
Westport Insurance Corporation A B
TTD Insurance
Primmum Insurance Company A B *
Security National Insurance Company A B *
TD General Insurance Company A B *
TD Home and Auto Insurance Company A B *
The Toa Reinsurance Company of America A
Travelers Insurance Company of Canada
The St. Paul Fire and Marine Insurance Company A *
Travelers Insurance Company of Canada A *
Trillium Mutual Insurance B *
Triton Insurance Company A
WThe Wawanesa Mutual Insurance Company A B *
Wynward Insurance Group B
XXL Insurance Company Limited A B *

572014 | IBC Facts
IBC OFFICESHead offi ce
Don ForgeronPresident and CEO777 Bay Street, Suite 2400P.O. Box 121Toronto, Ontario M5G 2C8
Tel: 416-362-2031Fax: 416-361-5952
Regional offi ces
OttawaChristopher WhiteVice-President, Federal Aff airs155 Queen Street, Suite 808Ottawa, Ontario K1P 6L1
Tel: 613-236-5043Fax: 613-236-5208
Western and Pacifi cWilliam AdamsVice-President, Western and Pacifi c10104-103 Avenue, Suite 2603Edmonton, Alberta T5J 0H8
Tel: 780-423-2212Fax: 780-423-4796
510 Burrard Street, Suite 901Vancouver, British Columbia V6C 3A8
Tel: 604-684-3635Fax: 604-684-6235
OntarioRalph PalumboVice-President, Ontario777 Bay Street, Suite 2400P.O. Box 121Toronto, Ontario M5G 2C8
Tel: 416-362-2031Fax: 416-644-4961
QuébecJohanne LamanqueVice-President, Quebec and Executive Director800, rue du Square-Victoria, bureau 2410C.P. 336, succ. Tour de la BourseMontréal, Québec H4Z 0A2
Tel: 514-288-1563Fax: 514-288-0753
AtlanticAmanda DeanVice-President, Atlantic1969 Upper Water Street, Suite 1706Purdy’s Wharf, Tower IIHalifax, Nova Scotia B3J 3R7
Tel: 902-429-2730Fax: 902-420-0157

58 IBC Facts | 2014
Investigative Services
British Columbia34A-2755 Lougheed Highway, Suite 571Port Coquitlam, British Columbia V3B 5Y9
Tel: 604-944-2431Fax: 604-944-1326
Prairies370, 5222-130 Avenue S.E., Suite 400Calgary, Alberta T2Z 0G4
Tel: 403-258-3677Fax: 403-255-9054
Ontario365 Evans Avenue, Suite 501Etobicoke, Ontario M8Z 1K2
Tel: 416-252-3441Fax: 416-252-6940
Québec630, boul. René-Lévesque ouest, bureau 2440Montréal, Québec H3B 1S6
Tel: 514-933-8953Fax: 514-933-7814
Atlantic1969 Upper Water Street, Suite 1706Purdy’s Wharf, Tower IIHalifax, Nova Scotia B3J 3R7
Tel: 902-429-2730Fax: 902-422-5151
Consumer Information Centres
British Columbia, Manitoba and Saskatchewan1-877-772-3777 ext. 222
Alberta1-800-377-6378
Ontario1-800-387-2880
Québec1-877-288-4321
Atlantic1-800-565-7189 ext. 228
IBC SERVICES

592014 | IBC Facts
CanadaJulie DicksonSuperintendentOffi ce of the Superintendent of Financial Institutions Canada255 Albert StreetOttawa, Ontario K1A 0H2Tel: 613-990-7788Fax: 613-990-5591www.osfi -bsif.gc.ca
British ColumbiaCarolyn RogersSuperintendent and Chief Executive Offi cerFinancial Institutions Commission of British Columbia555 West Hastings Street, Suite 2800P.O. Box 12116Vancouver, British Columbia V6B 4N6Tel: 604-660-3555Fax: 604-660-3365Email: fi com@fi combc.cawww.fi c.gov.bc.ca
AlbertaMark PrefontaineSuperintendent of InsuranceAlberta Treasury Board and FinanceFinancial Sector Regulation and Policy (FSRP)9515-107 Street, Room 402Terrace BuildingEdmonton, Alberta T5K 2C3Tel: 780-427-8322Fax: 780-420-0752www.fi nance.alberta.ca
SaskatchewanDavid WildSuperintendent of InsuranceFinancial Institutions DivisionFinancial and Consumer Aff airs Authority1919 Saskatchewan Drive, Suite 601Regina, Saskatchewan S4P 4H2Tel: 306-787-6700Fax: 306-787-9006Email: fi [email protected]
ManitobaJim ScalenaSuperintendent of Financial InstitutionsFinancial Institutions Regulation Branch405 Broadway Avenue, Suite 1115Winnipeg, Manitoba R3C 3L6Tel: 204-945-2542Fax: 204-948-2268Email: [email protected]/fi rb
OntarioPhilip HowellChief Executive Offi cer and Superintendent of Financial ServicesFinancial Services Commission of Ontario5160 Yonge Street, 17th FloorP.O. Box 85Toronto, Ontario M2N 6L9Tel: 416-250-7250Fax: 416-590-7070Toll-free: 1-800-668-0128www.fsco.gov.on.ca
QuébecLouis MorissetAutorité des marchés fi nanciers(Agence nationale d’encadrement du secteur fi nancier)800, rue du Square-Victoria, 22e étageC.P. 246, Tour de la BourseMontréal, Québec H4Z 1G3Tel: 514-395-0337Fax: 514-873-3090Toll-free: 1-877-525-0337
Place de la Cité, tour Cominar 2640, boul. Laurier, bureau 400Québec, Québec G1V 5C1Tel: 418-525-0337Fax: 418-525-9512www.lautorite.qc.ca
SUPERINTENDENTS OF INSURANCEas of January 1, 2014

60 IBC Facts | 2014
New BrunswickAngela MazerolleSuperintendent of InsuranceFinancial and Consumer Services Commission649-440 King Street, King’s PlaceFredericton, New Brunswick E3B 5H8Tel: 506-658-3060Fax: 506-658-3059www.fcnb.ca
Nova ScotiaDouglas MurphySuperintendent of InsuranceDepartment of Finance and Treasury BoardFinancial Institutions Division1723 Hollis Street, 4th FloorP.O. Box 2271Halifax, Nova Scotia B3J 3C8Tel: 902-424-6331Fax: 902-424-1298Email: [email protected]/fi nance/
Prince Edward IslandRobert A. BradleySuperintendent of InsuranceDepartment of Environment, Labour and JusticeShaw Building, 4th Floor95 Rochford StreetP.O. Box 2000Charlottetown, Prince Edward Island C1A 7N8Tel: 902-368-6478Fax: 902-368-5283Email: [email protected]
Newfoundland and LabradorCraig WhalenDeputy Superintendent of InsuranceService NL2nd Floor W. Block, Confederation Building100 Prince Philip DriveP.O. Box 8700St. John’s NL A1B 4J6Tel: 709-729-2570Fax: 709-729-4151Email: [email protected]
YukonFiona CharbonneauSuperintendent of InsuranceProfessional Licensing and Regulatory Aff airs (C-5)Mailing address: P.O. Box 2703 C-5Whitehorse, Yukon Y1A 2C6Physical location: 307 Black StreetWhitehorse YT Y1A 2N1Tel: 867-667-5111Fax: 867-667-3609Email: [email protected]
Northwest TerritoriesDouglas DoakSuperintendent of InsuranceTreasury Division, Department of Finance4922-48th StreetP.O. Box 1320YK Centre, 3rd FloorYellowknife, Northwest Territories X1A 2L9Tel: 867-920-3423Fax: 867-873-0325Email: [email protected] n.gov.nt.ca
NunavutDan CarlsonSuperintendent of InsuranceDepartment of FinanceP.O. Box 2260Iqaluit, Nunavut X0A 0H0Tel: 867-975-6813Fax: 867-975-5845Email: [email protected] nance.gov.nu.ca

612014 | IBC Facts
ADR Institute of Canada, Inc.234 Eglinton Avenue East, Suite 405Toronto, Ontario M4P 1K5Tel: 416-487-4733Fax: 416-487-4429Toll-free: 1-877-475-4353Email: [email protected]
Appraisal Institute of CanadaInstitut canadien des évaluateurs403-200 Catherine StreetOttawa, Ontario K2P 2K9Tel: 613-234-6533Fax: 613-234-7197Email: [email protected]
Canadian Association of Direct Relationship Insurers250 Consumers Road, Suite 301Toronto, Ontario M2J 4V6Tel: 416-773-0101Fax: 416-495-8723Email: [email protected]
Canadian Association of Financial Institutions in Insurance55 St. Clair Avenue West, Suite 255Toronto, Ontario M4V 2Y7Tel: 416-494-9224Fax: 416-967-6320Email: info@cafi i.comwww.cafi i.com
Canadian Association of Fire InvestigatorsAssociation canadienne des enquêteurs incendieKanata North RPO, Box 72044c/o Golden Planners Inc.310-1390 Prince of Wales DriveOttawa, Ontario K2C 3N6Tel: 613-228-1934Email: cafi @cafi .cawww.cafi .ca
Canadian Association of Insurance Womenwww.caiw-acfa.com
Canadian Association of Mutual Insurance Companies311 McArthur Avenue, Suite 205Ottawa, Ontario K1L 6P1Tel: 613-789-6851Fax: 613-789-7665www.camic.ca
Canadian Board of Marine Underwriters2233 Argentia Road, Suite 100Mississauga, Ontario L5N 2X7Tel: 905-826-4768Fax: 905-826-4873Email: [email protected]
Canadian Boiler and Machinery Underwriters’ Associationc/o Boiler Inspection and Insurance Companyof Canada250 Yonge Street, Suite 3000Toronto, Ontario M5B 2L7Tel: 416-216-7201Fax: 416-363-0538www.cbmua.org
INSURANCERELATED
ORGANIZATIONS

62 IBC Facts | 2014
Canadian Council of Insurance RegulatorsCCIR Secretariat5160 Yonge StreetP.O. Box 85Toronto, Ontario M2N 6L9Tel: 416-590-7290Fax: 416-226-7878Email: [email protected]
Canadian Fire Safety Association2175 Sheppard Avenue East, Suite 310Toronto, Ontario M2J 1W8Tel: 416-492-9417Fax: 416-491-1670Email: [email protected] resafety.com
Canadian Independent Adjusters’ AssociationCentennial Centre5401 Eglinton Avenue West, Suite 100Toronto, Ontario M9C 5K6Tel: 416-621-6222Fax: 416-621-7776Toll-free: 1-877-255-5589Email: [email protected]
Canadian Institute of Actuaries360 Albert Street, Suite 1740Ottawa, Ontario K1R 7X7Tel: 613-236-8196Fax: 613-233-4552Email: head.offi [email protected]
Canadian Insurance Accountants AssociationAssociation canadienne des comptables d’assurance2175 Sheppard Avenue East, Suite 310Toronto, Ontario M2J 1W8Tel: 416-971-7800Fax: 416-491-1670Email: [email protected]
Canadian Insurance Claims Managers Associationc/o Insurance Bureau of Canada777 Bay Street, Suite 2400P.O. Box 121Toronto, Ontario M5G 2C8Tel: 416-362-2031Fax: 416-361-5952www.cicma.ca
Canadian Life and Health Insurance Association Inc.1 Queen Street East, Suite 1700Toronto, Ontario M5C 2X9Tel: 416-777-2221Fax: 416-777-1895Email: [email protected]
Centre for Study of Insurance Operations110 Yonge Street, Suite 500Toronto, Ontario M5C 1T4Tel: 416-360-1773Toll-free: 1-800-463-2746
1155, rue University, bureau 1305Montréal, Québec H3B 3A7Tel: 514-393-8200Toll-free: 1-877-393-2372www.csio.com
Facility Association777 Bay Street, Suite 2400P.O. Box 121Toronto, Ontario M5G 2C8Tel: 416-863-1750Fax: 416-868-0894Toll-free: 1-800-268-9572Email: [email protected]
Fire Prevention Canada3332 McCarthy RoadP.O. Box 37009Ottawa, Ontario K1V 0W0Tel: 613-749-3844Email: info@fi precan.cawww.fi precan.ca

632014 | IBC Facts
Fire Underwriters Surveywww.fi reunderwriters.ca
Atlantic Canada:238 Brownlow Avenue, Suite 300Dartmouth, Nova Scotia B3B 1Y2Tel: 1-877-634-8564
Ontario150 Commerce Valley Drive WestMarkham, Ontario L3T 7Z3Tel: 1-800-268-8080
Québec255, boul. Crémazie Est, 2e étageMontréal, Québec H2M 1M2Tel: 1-800-263-5361
Western Canada3999 Henning DriveBurnaby, British Columbia V5C 6P9Tel: 1-800-665-5661
General Insurance OmbudService10 Milner Business Court, Suite 701Toronto, Ontario M1B 3C6Tel: 416-299-6931Fax: 416-299-4261Toll-free: 1-877-225-0446www.giocanada.org
Groupement des assureurs automobiles800, rue du Square-Victoria, bureau 2410C.P. 336, succ. Tour de la BourseMontréal, Québec H4Z 0A2Tel: 514-288-4321Email: [email protected]
Institute for Catastrophic Loss Reduction20 Richmond Street East, Suite 210Toronto, Ontario M5C 2R9Tel: 416-364-8677Fax: 416-364-5889Email: [email protected]
Insurance Brokers Association of Canada18 King Street East, Suite 1210Toronto, Ontario M5C 1C4Tel: 416-367-1831Fax: 416-367-3687Email: [email protected]
Insurance Bureau of Canada777 Bay Street, Suite 2400P.O. Box 121Toronto, Ontario M5G 2C8Tel: 416-362-2031Fax: 416-361-5952www.ibc.ca
Insurance Institute of Canada18 King Street East, 6th FloorToronto, Ontario M5C 1C4Tel: 416-362-8586Fax: 416-362-1126Toll-free: 1-866-362-8585Email: [email protected]
Nuclear Insurance Association of Canada401 Bay Street, Suite 1600Toronto, Ontario M5H 2Y4Tel: 416-646-6232www.niac.biz
Property and Casualty Insurance Compensation Corporation20 Richmond Street East, Suite 210Toronto, Ontario M5C 2R9Tel: 416-364-8677Fax: 416-364-5889Email: [email protected]
Reinsurance Research Councilc/o Funnel Communications Inc.189 Queen Street East, Suite 1Toronto, Ontario M5A 1S2Tel: 416-968-0183Fax: 416-968-6818Email: [email protected]
Risk and Insurance Management Society, Inc.Tel: 416-636-9745www.rimscanada.ca
Surety Association of Canada6299 Airport Road, Suite 709Mississauga, Ontario L4V 1N3Tel: 905-677-1353Fax: 905-677-3345www.surety-canada.com

64 IBC Facts | 2014
Traffi c Injury Research Foundation171 Nepean Street, Suite 200Ottawa, Ontario K2P 0B4Tel: 613-238-5235Fax: 613-238-5292Toll-free: 1-877-238-5235www.tirf.ca
Underwriters Laboratories of Canada7 Underwriters RoadToronto, Ontario M1R 3A9Tel: 416-757-3611Fax: 416-757-8727Toll-free: 1-866-937-3852Email: [email protected]

On the web
ibc.cagetintheknow.ibc.ca
By telephone
416-362-2031
On Twitter
@InsuranceBureau


