Embed Size (px)
Citation preview

2016 - 2017
Facts & Institutional
Figures
Center for Institutional Effectiveness

1 The College of New Jersey Facts & Figures 2016-2017
The College of New Jersey
Facts & Institutional Figures
Prepared By:
The Center for Institutional Effectiveness
Mosen Auryan
Associate Provost for Institutional Effectiveness
Jim Mehalick
Director of Business Intelligence
Marie Tuscano
Assistant Director of Institutional Research
LaMont Rouse
Assistant Director of Assessment
Jennifer Sizoo
Research Analyst
Telephone: 609/771-2801 Fax: 609/637-5136
Center for Institutional Effectiveness Homepage: http://cie.tcnj.edu
2 The College of New Jersey Facts & Figures 2016-2017
Contents
Mission & Vision______________________________________________________ 4
At A Glance __________________________________________________________ 5
SYNPOSIS OF UNDERGRADUATE DEGREE PROGRAMS AND MAJORS _______ 7
SYNPOSIS OF GRADUATE DEGREE PROGRAMS AND MAJORS______________ 9
TOP 20 MOST POPULAR UNDERGRADUATE MAJORS _____________________ 11
AVERAGE SCHOLASTIC APTITUDE TEST SCORES BY ADMIT TYPE FOR FIRST-TIME
FRESHMAN _________________________________________________________ 12
FIRST-TIME FRESHMAN ADMISSIONS ACTIVITY __________________________ 13
DISTRIBUTION OF COMPLETED ADMISSIONS APPLICATIONS AND ACCEPTED
OFFERS ____________________________________________________________ 14
ENROLLMENT BY SCHOOL AND ATTENDANCE STATUS __________________ 15
TRENDS IN TOTAL ENROLLMENT ______________________________________ 17
ETHNICITY OF STUDENTS ____________________________________________ 18
COLLEGE ENROLLMENT BY GENDER __________________________________ 20
UNDERGRADUATE ENROLLMENT BY GENDER AND RESIDENCE STATUS ___ 21
ENROLLMENT BY MAJOR ____________________________________________ 23
1st TO 2nd YEAR RETENTION FOR ENTERING FIRST-TIME, FULL-TIME FRESHMEN BY
SCHOOL AND ETHNICITY________________________________________________25
GRADUATION RATES FOR ENTERING FIRST-TIME, FULL-TIME FRESHMAN ETHNICITY
AND GENDER _______________________________________________________ 25
DEGREES GRANTED BY SCHOOL, DEGREE TYPE AND MAJOR _____________ 26
EMPLOYEES BY ETHNICITY AND IPEDS OCCUPATIONAL CATEGORY _______ 28
EMPLOYEES BY GENDER _____________________________________________ 29
NUMBER OF FACULTY BY RANK AND TENURE STATUS ___________________ 30
TENURE STATUS AMONG FULL-TIME TENURE TRACK FACULTY ___________ 31
AVERAGE TOTAL COMPENSATION OF FULL-TIME FACULTY BY RANK ______ 32
STATEMENT OF OPERATING ACTIVITIES _______________________________ 33
OPERATING REVENUE, EXPENSES AND TRANFERS ______________________ 34
CHANGE IN NET ASSETS _____________________________________________ 36

3 The College of New Jersey Facts & Figures 2016-2017
EXTERNALLY SPONSORED ACTIVITIES _________________________________ 37
UNDERGRADUATE TUITION, FEES, ROOM AND BOARD CHARGES PER YEAR AND
ANNUAL RATE OF INCREASE _________________________________________ 38
BUILDING INVENTORY _______________________________________________ 39
COLLEGE LIBRARY __________________________________________________ 40
THE COLLEGE OF NEW JERSEY REGIONAL, NATIONAL, AND SPECIALIZED
ACCREDITORS ______________________________________________________ 41
ADMINISTRATIVE ORGANIZATION CHART___________________________________ 42
BOARD OF
TRUSTEES_______________________________________________________43
4 The College of New Jersey Facts & Figures 2016-2017
Mission & Vision
MISSION STATEMENT
The College of New Jersey, founded in 1855 as the New Jersey State Normal School, is primarily an undergraduate and residential college with targeted graduate programs. Grounded in the liberal arts, TCNJ’s personalized, collaborative, and rigorous education engages students at the highest level within and beyond the classroom. TCNJ believes in the transformative power of education to develop critical thinkers, responsible citizens, and lifelong learners and leaders. The College empowers its diverse students, staff and faculty to sustain and enhance their communities both locally and globally.
VISION
TCNJ will offer an unparalleled education in a vibrant, collaborative and inclusive community of learners who will make a distinct mark on the world. By following our values, we will serve as a national exemplar of public higher education, and we will do this while being committed to accessibility and affordability.

5 The College of New Jersey Facts & Figures 2016-2017
At A Glance
HISTORY/LOCATION 1855 New Jersey State Normal School 1908 New Jersey State Normal School at Trenton 1929 New Jersey State Teachers College and State Normal School at Trenton 1937 New Jersey State Teachers College at Trenton 1958 Trenton State College 1996 The College of New Jersey The College of New Jersey (TCNJ) is a highly selective institution that has earned national recognition for its commitment to excellence. TCNJ currently is ranked as the No. 1 public institution in the northern region of the country by U.S. News & World Report, and is considered a best value in higher education by both Princeton Review and Kiplinger’s Personal Finance. TCNJ was also awarded, in 2006, a Phi Beta Kappa chapter, an honor shared by less than 10 percent of colleges and universities nationally. The College of New Jersey’s academic tradition reaches back to 1855 when it was established by the state legislature as the New Jersey State Normal School. It was the first teacher training school in the state and the ninth in the nation. Governor Rodman Price, sometimes called the founder of the New Jersey Normal School, promoted the idea of a training institute for New Jersey’s teachers and mobilized support among influential state leaders. Originally located on Clinton Avenue in Trenton, the Normal School flourished in the latter 1800s, expanding both its academic offerings and physical facilities. In 1925, the first four-year baccalaureate degree program was established. This change marked the beginning of TCNJ’s transition from a normal school to a teachers’ college and was accompanied by a change in physical surroundings. In 1928, a beautiful 210-acre tract of land in Ewing Township was purchased as a new site for the College. Graduate study was instituted at the College in 1947, and accreditation from various national associations was forthcoming in the 1950s. The enactment of the Higher Education Act of 1966 paved the way for TCNJ to become a multipurpose institution by expanding its degree programs into a variety of fields other than education. By 1972, seventy percent of entering students were selecting non-teaching majors. In the 1970s, a period of declining enrollments nationwide, the College made a decision to raise, rather than lower, its already high standards. Since that time, the academic profile of entering classes has continued to rise and as a result, the College has become one of the most competitive schools of its kind in the nation. Today the College provides academically prepared students with a challenging undergraduate education and a rewarding residential experience, small classes, and a prestigious faculty.

6 The College of New Jersey Facts & Figures 2016-2017
ACADEMIC SCHOOLS, PROGRAMS AND DEGREES
The College of New Jersey emphasizes the undergraduate experience. A strong liberal arts core forms the foundation for a wealth of degree programs offered through TCNJ’s seven schools—Arts & Communication; Business; Humanities & Social Sciences; Education; Science; Nursing, Health, & Exercise Science; and Engineering. The College is enriched by an honors program and extensive opportunities to study abroad, and its award-winning First-Year Experience and freshman orientation programs have helped make its retention and graduation rates among the highest in the country.
CAMPUS
Known for its natural beauty, the College’s campus is set on 289 tree-lined acres in suburban Ewing Township. The College has 39 major buildings, including a state-of-the-art library; 14 residence halls that accommodate 3,600 students; an award-winning student center; more than 20 academic computer laboratories; a full range of laboratories for nursing, microscopy, science, and technology; a music building with a 300-seat concert hall; and a collegiate recreation and athletic facilities complex. TCNJ has a full-time undergraduate enrollment of approximately 6,200 students (95 percent from New Jersey).
STUDENT LIFE
The College of New Jersey encourages students to expand their talents and skills through more than 150 organizations that are open to students. These groups range from performing ensembles and professional and honor societies to student publications, Greek organizations, as well as intramural and club sports. The College also offers numerous leadership opportunities through the Student Finance Board, Student Government Association, and Residence Hall Government to name a few.
ATHLETICS
High achievement and scholarship in the classroom have been mirrored by the success of The College of New Jersey’s varsity student-athletes. Since the 1978–79 Lion wrestling team captured the College’s first National Collegiate Athletic Association (NCAA) team championship, TCNJ has established itself as one of the nation’s most successful Division III (non-athletic scholarship) programs. Since 1979, The College of New Jersey has amassed a total of 39 Division III crowns in six different sports. In addition, the Lions have posted 32 runner-up awards, giving the College an aggregate of 71 first- and second-place finishes. That figure is tops among the nation’s 400-plus Division III colleges and universities during the past 30 years. The Lions have also produced 54 Division III CoSIDA Academic All-Americans. As impressive as the overall athletic record is, TCNJ’s accomplishment as a leader in women’s sports is even greater. Since NCAA Championships were initiated for women in 1981, only TCNJ has won 32 Division III team championships. The total does not include the Lions’ lacrosse championship in 1981 or the softball championships in 1980 and 1981, which were sponsored by the AIAW (Association for Intercollegiate Athletics for Women) prior to women’s sports inclusion in the NCAA. In the fall of 1999, TCNJ’s women’s athletic program was voted as the top Division III institution for female student-athletes by Sports Illustrated for Women.
7 The College of New Jersey Facts & Figures 2016-2017
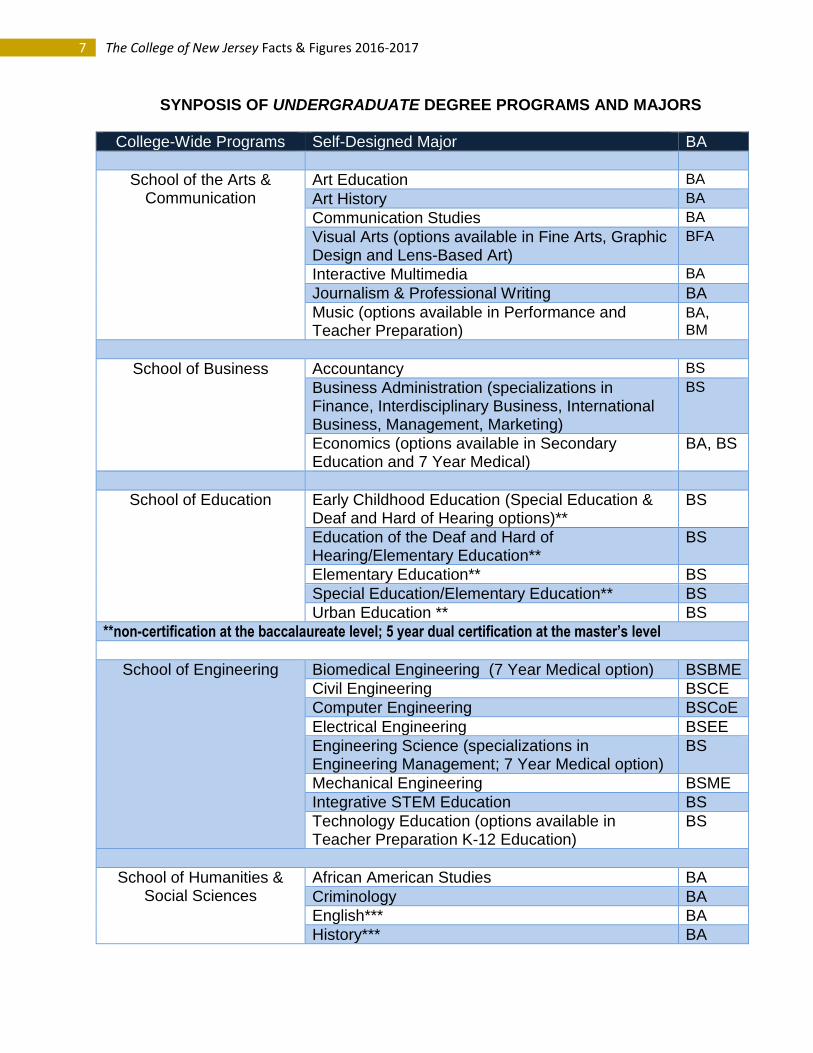
SYNPOSIS OF UNDERGRADUATE DEGREE PROGRAMS AND MAJORS
College-Wide Programs Self-Designed Major BA
School of the Arts & Communication
Art Education BA
Art History BA
Communication Studies BA
Visual Arts (options available in Fine Arts, Graphic Design and Lens-Based Art)
BFA
Interactive Multimedia BA
Journalism & Professional Writing BA
Music (options available in Performance and Teacher Preparation)
BA, BM
School of Business Accountancy BS
Business Administration (specializations in Finance, Interdisciplinary Business, International Business, Management, Marketing)
BS
Economics (options available in Secondary Education and 7 Year Medical)
BA, BS
School of Education Early Childhood Education (Special Education & Deaf and Hard of Hearing options)**
BS
Education of the Deaf and Hard of Hearing/Elementary Education**
BS
Elementary Education** BS
Special Education/Elementary Education** BS
Urban Education ** BS
**non-certification at the baccalaureate level; 5 year dual certification at the master’s level
School of Engineering Biomedical Engineering (7 Year Medical option) BSBME
Civil Engineering BSCE
Computer Engineering BSCoE
Electrical Engineering BSEE
Engineering Science (specializations in Engineering Management; 7 Year Medical option)
BS
Mechanical Engineering BSME
Integrative STEM Education BS
Technology Education (options available in Teacher Preparation K-12 Education)
BS
School of Humanities & Social Sciences
African American Studies BA
Criminology BA
English*** BA
History*** BA

8 The College of New Jersey Facts & Figures 2016-2017
International Studies BA
Philosophy ** BA
Political Science BA
Psychology BA
Sociology BA
Spanish*** BA Women's and Gender Studies BA
** option in 7 Year Medical Programs *** options in Secondary Education and 7 Year Medical Programs
School of Nursing, Health, and Exercise Science
Health and Exercise Science (option available in Teacher Preparation)
BS
Nursing BSN Public Health BA
School of Science Biology* BS
Chemistry* BS
Computer Science BS
Mathematics* (option available in Statistics) BA
Physics* BS
*options available in Secondary Education and 7 Year Medical Programs
Key
BA Bachelor of Arts
BFA Bachelor of Fine Arts
BM Bachelor of Music
BS Bachelor of Science
BABME Bachelor of Arts in Biomedical Engineering
BSCE Bachelor of Science in Civil Engineering
BSCoE Bachelor of Science in Computer Engineering
BSEE Bachelor of Science in Electrical Engineering
BSE Bachelor of Science in Engineering
BSME Bachelor of Science in Mechanical Engineering
BSN Bachelor of Science in Nursing

9 The College of New Jersey Facts & Figures 2016-2017
SYNPOSIS OF GRADUATE DEGREE PROGRAMS AND MAJORS
Educational Specialist Marriage and Family Counseling EDS
Master of Arts School Counseling MA
Clinical Mental Health Counseling MA
Marriage, Couples and Family Counseling and Therapy
MA
English MA
Master of Arts in Teaching Elementary Education (Leads to Certification) MAT
Early Childhood (Leads to Certification)Program A (no prior teaching certificate) Program B (already P-3 certified through alternate route)
MAT
MAT Early Childhood: Urban (available only to graduates of TCNJ’s undergraduate portion of this program) MAT Elementary: Urban (available only to graduates of TCNJ’s undergraduate portion of this program)
MAT
Education of the Deaf and Hard of Hearing (available only to graduates of TCNJ’s undergraduate portion of this program)
MAT
Secondary Education- English (Leads to Certification/new applicants not accepted after 2017-18 academic year)
MAT
Secondary Education- Social Studies (Leads to Certification/new applicants not accepted after 2017-18 academic year)
MAT
Secondary Education- Mathematics (Leads to Certification)
MAT
Secondary Education- Science: Biology, Chemistry or Physics (Leads to Certification)
MAT
Secondary Education-Technology Education 2014-2015 Planner
MAT
Special Education (Leads to Certification) Alternate Route to Special Education Certification Program
MAT
Special Education (Leads to Certification) MAT
Master of Education Teaching English as a Second Language MED
Reading (Leads to Certification) MED
Reading (with Reading Specialist Certification) MED
Educational Leadership: Instruction (through RTC) MED

10 The College of New Jersey Facts & Figures 2016-2017
Educational Leadership (Leads to Principal Certification)
MED
Special Education (Must be Certified in Special Education)
MED
Special Education (Must be Certified in Other Area)
MED
Special Education- Teacher of Students with Blindness or Visual Impairment (Must be Certified)
MED
Integrative Science, Technology, Engineering and Math (I-STEM)
MED
Master of Science in Nursing
Family Nurse Practitioner MSN
Family Nurse Practitioner (for Certified NPs) MSN
Adult-Gerontological Nurse Practitioner MSN
Neonatal Nurse Practitioner Planner 2008-2009
MSN
Clinical Nurse Leader *Program recently highlighted in Advance for Nurses.
MSN
Bridge to the Master of Science in Nursing for RNs (not available for school nursing)
MSN
School Nurse MSN

11 The College of New Jersey Facts & Figures 2016-2017
20 MOST POPULAR UNDERGRADUATE MAJORS FALL 2016
Rank Major 1 Biology
2 Psychology
3 Elementary Education
4 Communication Studies
5 Nursing
6 Finance
7 English
8 Marketing
9 Accountancy
10 Health & Exercise Science
11 History
12 Criminology
13 Management
14 Mathematics
15 Special Education
16 Computer Science
17 Political Science
18 Biomedical Engineering
19 Interactive Multimedia
20 Business – Open Option
Note: Ranks are based on primary major enrollment counts. SOURCE: CIE Enrollment data

12 The College of New Jersey Facts & Figures 2016-2017
AVERAGE SAT SCORES BY ADMIT TYPE FOR FIRST-TIME FRESHMEN ENTERING FALL 2016
SAT Critical Reading Scores Regular Admits 604
EOF Admits 522 All Admits 593
National Average 494
SAT Mathematics Scores Regular Admits 629
EOF Admits 545 All Admits 617
National Average 508
SAT Writing Scores Regular Admits 607
EOF Admits 532 All Admits 596
National Average 482
Source: TCNJ Center for Institutional Effectiveness/College Board 2016

13 The College of New Jersey Facts & Figures 2016-2017
FIRST-TIME FRESHMAN ADMISSIONS ACTIVITY FALL 2016
Total
Applications
Offered
Admission
Offer Rate Offer
Accepted
Yield
All Students
Total 11825 5778 48.86% 1457 25.2%
NJ Residents
Total 10486 4948 47.19% 1355 27.4%
NonResident
Total 1339 830 61.98% 102 13.3%
Source: TCNJ Center for Institutional Effectiveness

14 The College of New Jersey Facts & Figures 2016-2017
DISTRIBUTION OF COMPLETED ADMISSIONS APPLICATIONS AND ACCEPTED OFFERS
FIRST-TIME FRESHMAN FROM SELECT STATES FALL 2016
State Offers
Accepted % of Total
New Jersey 1355 93.00%
New York 41 2.81%
Pennsylvania 31 2.13%
Maryland 4 0.27%
Connecticut 4 0.27%
California 2 0.14%
Delaware 2 0.14%
District of Columbia
1 0.07%
Massachusetts 1 0.07%
Other 16 1.10%
Total All Enrolled 1457 100%
CIE fall 2016 Admissions data
Total Applications
New Jersey
New York
Pennsylvania
Connecticut
Maryland
Massachusetts
California
Total Offers Accepted
New Jersey
New York
Pennsylvania
Connecticut
Maryland
Delaware
California
Massachusetts
District of Columbia
Other
State Total Applications
% of Total
New Jersey 10486 89.26%
New York 508 4.68%
Pennsylvania 212 2.19%
Connecticut 64 0.66%
Maryland 47 0.50%
Massachusetts 35 0.47%
California 45 0.27%
Delaware 36 0.24%
District of Columbia
14 0.18%
Virginia 17 0.13%
Other 361 1.43%
15 The College of New Jersey Facts & Figures 2016-2017
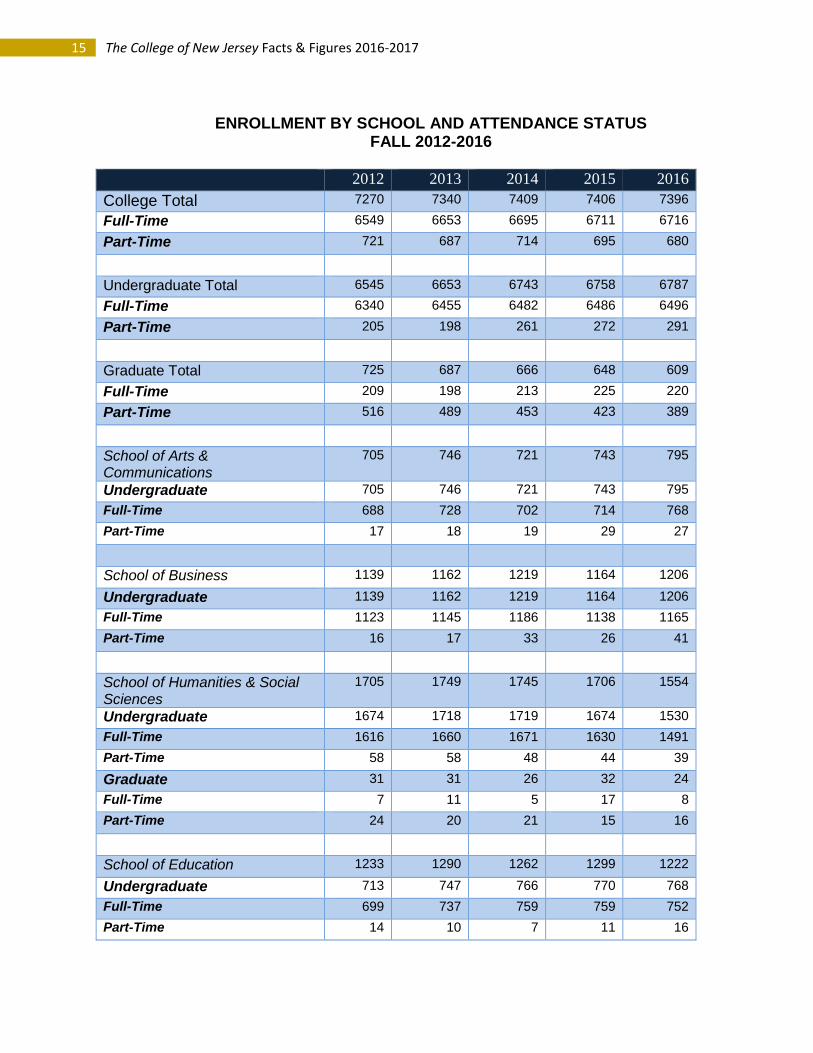
ENROLLMENT BY SCHOOL AND ATTENDANCE STATUS FALL 2012-2016
2012 2013 2014 2015 2016
College Total 7270 7340 7409 7406 7396
Full-Time 6549 6653 6695 6711 6716
Part-Time 721 687 714 695 680
Undergraduate Total 6545 6653 6743 6758 6787
Full-Time 6340 6455 6482 6486 6496
Part-Time 205 198 261 272 291
Graduate Total 725 687 666 648 609
Full-Time 209 198 213 225 220
Part-Time 516 489 453 423 389
School of Arts & Communications
705 746 721 743 795
Undergraduate 705 746 721 743 795
Full-Time 688 728 702 714 768
Part-Time 17 18 19 29 27
School of Business 1139 1162 1219 1164 1206
Undergraduate 1139 1162 1219 1164 1206
Full-Time 1123 1145 1186 1138 1165
Part-Time 16 17 33 26 41
School of Humanities & Social Sciences
1705 1749 1745 1706 1554
Undergraduate 1674 1718 1719 1674 1530
Full-Time 1616 1660 1671 1630 1491
Part-Time 58 58 48 44 39
Graduate 31 31 26 32 24
Full-Time 7 11 5 17 8
Part-Time 24 20 21 15 16
School of Education 1233 1290 1262 1299 1222
Undergraduate 713 747 766 770 768
Full-Time 699 737 759 759 752
Part-Time 14 10 7 11 16

16 The College of New Jersey Facts & Figures 2016-2017
Fall Enrollment Continued 2012 2013 2014 2015 2016
School of Education
Graduate 520 543 496 529 454
Full-Time 197 180 196 180 211
Part-Time 323 363 300 349 243
School of Engineering 546 529 525 555 581
Undergraduate 546 529 525 555 581
Full-Time 541 523 520 550 574
Part-Time 5 6 5 5 7
School of Nursing, Health & Exercise Science
553 528 540
571
652
Undergraduate 530 500 514 537 619
Full-Time 515 482 481 471 524
Part-Time 15 18 33 66 95
Graduate 26 28 26 34 33
Full-Time 3 6 10 10 0
Part-Time 23 22 16 24 33
School of Science 1092 1060 1003 1058 1088
Undergraduate 1092 1060 1003 1058 1088
Full-Time 1073 1046 981 1040 1070
Part-Time 19 14 23 18 18
Non-Matriculated/ Visiting/Undeclared /Independent Studies
294 276 394 394 289
Undergraduate 191 276 191 257 200
Full-Time 134 182 134 184 152
Part-Time 57 94 57 73 48
Graduate 85 118 85 53 89
Full-Time 1 2 1 18 1
Part-Time 84 116 84 35 88
Official Census Date headcounts Note: Enrollment counts include first majors only.

17 The College of New Jersey Facts & Figures 2016-2017
TRENDS IN TOTAL ENROLLMENT FALL 2012-2016
TRENDS IN TOTAL ENROLLMENT BY SCHOOL Fall 2012 – 2016
63406455 6482 6486 6496
205
198261 272 291209
198
213 225 220
516489
453 423 389
2 0 1 2 2 0 1 3 2 0 1 4 2 0 1 5 2 0 1 6
UGRD Full-Time UGRD Part-Time GRAD Full-Time GRAD Part-Time
0
200
400
600
800
1000
1200
1400
1600
1800
2000
2012 2013 2014 2015 2016
Arts & Comm Business Humanities & Soc.Sciences
Education Engineering Nursing Health & Ex.Science
Science

18 The College of New Jersey Facts & Figures 2016-2017
ETHNICITY OF STUDENTS FALL 2012-2016
Undergraduate Race/Ethnicity
2012 2013 2014 2015 2016
White 4303 4391 4360 4405 4482
African-American/Black
363 324 345 378 380
Hispanic 666 742 854 830 857
Asian 579 611 681 690 741
Native American 8 10 15 17 12
Native Hawaiian* 25 19 20 21 14
Not Reported 504 477 410 368 260
Two or More Races* 81 63 45 30 25
Non-Resident Alien* 16 16 13 19 16
Total 6545 6653 6743 6758 6787
Graduate
Race/Ethnicity 2012 2013 2014 2015 2016
White 471 471 417 428 436
African-American/Black
48 52 42 51 43
Hispanic 29 34 36 53 43
Asian 35 27 30 37 33
Native American 2 2 3 2 1
Native Hawaiian* 2 3 4 2 2
Not Reported 132 92 131 74 51
Two or More Races* 5 6 3 1 0
Non-Resident Alien* 1 0 0 0 0
Total 725 687 666 648 609
*Federal reporting requirements for ethnicity were revised in 2010. New categories for Native Hawaiian, Two or more races
and Non-Resident Aliens were added, Other was removed. Official Census Date enrollment counts

19 The College of New Jersey Facts & Figures 2016-2017
ETHNICITY OF STUDENTS BY SCHOOL FALL 2016
Undergraduate Race/Ethnicity Undergraduate African
American Asian Hispanic Native
American Native Hawaii
an
Non Resident Alien
Not Reported
Two or more races
White Total
School of Arts & Communications
41 55 91 2 0 0 23 3 580 795
School of Business 62 121 154 3 5 3 37 4 817 1206
School of Humanities & Social Sciences
112 121 217 0 1 1 55 8 1015 1530
School of Education 27 40 87 4 3 1 17 2 587 768
School of Engineering 20 72 75 1 2 3 15 0 393 581
School of Nursing Health & Exercise Science
43 62 76 0 2 0 26 3 407 619
School of Science 60 257 131 1 0 6 39 4 590 1088
Non-Matriculated /Visiting & Other
15 13 26 1 1 2 48 1 93 200
Total Undergraduate 380 741 857 12 14 16 260 25 4482 6787
Graduate Race/Ethnicity Graduate African
American Asian Hispanic Native
American Native
Hawaiian Non
Resident Alien
Not Reported
Two or
more races
White Total
School of Humanities & Social Sciences
1 1 0 0 0 0 1 0 21 24
School of Education 31 18 38 1 2 0 26 0 338 454
School of Engineering 0 1 1 0 0 0 0 0 7 9
School of Nursing Health & Exercise Science
2 6 1 0 0 0 0 0 24 33
Non-Matriculated & Visiting
9 7 3 0 0 0 24 0 46 89
Total Graduate 43 33 43 1 2 0 51 0 436 609
Official Census Date enrollment counts.
20 The College of New Jersey Facts & Figures 2016-2017
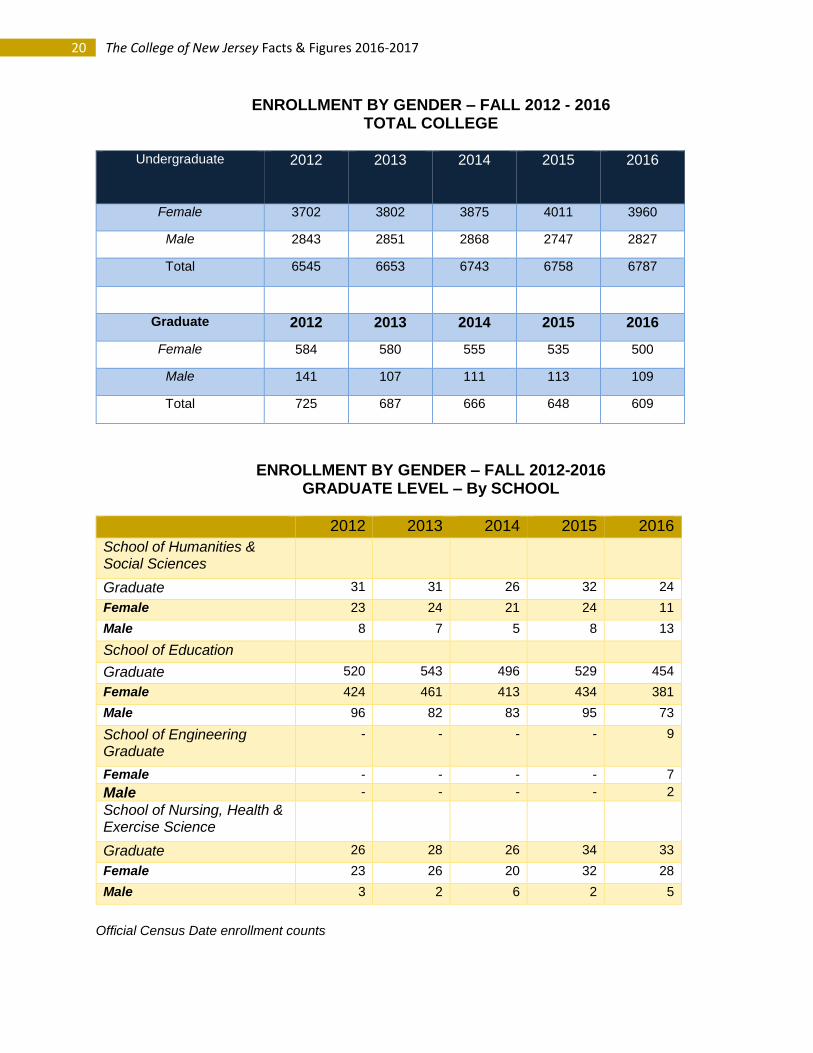
ENROLLMENT BY GENDER – FALL 2012 - 2016 TOTAL COLLEGE
Undergraduate 2012 2013 2014 2015 2016
Female 3702 3802 3875 4011 3960
Male 2843 2851 2868 2747 2827
Total 6545 6653 6743 6758 6787
Graduate 2012 2013 2014 2015 2016
Female 584 580 555 535 500
Male 141 107 111 113 109
Total 725 687 666 648 609
ENROLLMENT BY GENDER – FALL 2012-2016 GRADUATE LEVEL – By SCHOOL
2012 2013 2014 2015 2016
School of Humanities & Social Sciences
Graduate 31 31 26 32 24
Female 23 24 21 24 11
Male 8 7 5 8 13
School of Education
Graduate 520 543 496 529 454
Female 424 461 413 434 381
Male 96 82 83 95 73
School of Engineering Graduate
- - - - 9
Female - - - - 7
Male - - - - 2
School of Nursing, Health & Exercise Science
Graduate 26 28 26 34 33
Female 23 26 20 32 28
Male 3 2 6 2 5
Official Census Date enrollment counts

21 The College of New Jersey Facts & Figures 2016-2017
ENROLLMENT BY GENDER – FALL 2012-2016
UNDERGRADUATE LEVEL – BY SCHOOL
2012 2013 2014 2015 2016
School of Arts & Communications 705 746 721 743 795
Female 411 446 429 460 506
Male 294 300 292 283 289
School of Business 1139 1162 1219 1164 1206
Female 466 453 471 466 462
Male 673 709 748 698 744
School of Education 713 747 786 770 768
Female 667 699 723 729 721
Male 46 48 43 41 47
School of Engineering 546 529 525 555 581
Female 122 127 129 138 143
Male 424 402 396 417 438
School of Humanities & Social Sciences
1674 1718 1719 1674 1530
Female 1028 1085 1078 1096 986
Male 646 633 641 578 544
School of Nursing Health & Exercise Science
530 500 514 537 619
Female 382 363 369 402 469
Male 148 137 145 135 150
School of Science 1092 1060 1003 1058 1088
Female 524 522 518 571 577
Male 568 538 485 487 511
Other Undergraduate: Non-
Matriculated, Undecided, Visiting, Independent Studies
146 191 276 257 200
Female 102 107 158 149 96
Male 44 84 118 108 104
Official Census Date Enrollment Counts

22 The College of New Jersey Facts & Figures 2016-2017
ENROLLMENT BY RESIDENCE (In-State/Out-of-State) FALL 2012 - 2016
Undergraduate 2012 2013 2014 2015 2016
NJ Resident 6178 6269 6289 6338 6376
Non-Resident 367 384 454 420 411
Total 6545 6653 6743 6758 6787
Graduate 2012 2013 2014 2015 2016
NJ Resident 617 590 561 565 501
Non-Resident 108 97 105 83 108
Total 725 687 666 648 609
Residence By School 2012 2013 2014 2015 2016
Undergraduate School of Arts & Communications
705 746 721 743 795
NJ Resident 666 706 688 717 765
Non-Resident 39 40 33 26 30
Undergraduate School of Business 1139 1162 1219 1164 1206
NJ Resident 1095 1114 1172 1113 1144
Non-Resident 44 48 47 51 62
Undergraduate School of Education 713 747 766 770 768
NJ Resident 671 701 715 717 721
Non-Resident 42 46 51 53 47
Undergraduate School of Engineering
546 529 525 555 581
NJ Resident 508 482 477 487 516
Non-Resident 38 47 48 68 65
Undergraduate School of Humanities & Social Sciences
1674 1718 1719 1674 1530
NJ Resident 1602 1652 1658 1617 1478
Non-Resident 72 66 61 57 52
Undergraduate School of Nursing Health & Exercise Science
530 500 514 537 619
NJ Resident 492 459 481 489 562
Non-Resident 38 41 33 48 57
Undergraduate School of Science 1092 1060 1003 1058 1088
NJ Resident 1023 998 952 1002 1028
Non-Resident 69 62 51 56 60
Other Undergraduate: Non-
Matriculated, Undecided, Visiting 146 191 276 257 200
NJ Resident 121 157 146 196 162
Non-Resident 25 34 130 61 38

23 The College of New Jersey Facts & Figures 2016-2017
ENROLLMENT BY MAJOR FALL 2012-2016
Please use the following link to access tables that contain enrollment data for majors over the past five fall terms. The enrollment tables include enrollment by plan (1st Major) with breakouts for FT/PT, Race/Ethnicity, Gender, Academic Level, Second Major, and Sub-plan and are derived from the 10th day census date.
FactBook_PlanEnrollbyTermAY2012_2016

24 The College of New Jersey Facts & Figures 2016-2017
FIRST YEAR TO SECOND YEAR RETENTION RATES FOR
ENTERING FIRST-TIME, FULL-TIME FRESHMAN BY ETHNICITY
FALL 2010 – FALL 2016
Fall 2010 Fall 2011 Fall 2012 Fall 2013 Fall 2014 Fall 2015 5 YR AVG % Retained from cohort to 2nd
Fall Term
Total # Freshmen in Cohort
1421 1371 1363 1404 1416 1454 --
African American
87.00% 95.24% 90.91% 91.94% 97.83% 92.05% 92.50%
Asian 96.18% 94.71% 94.87% 92.25% 92.96% 96.39% 94.56%
Hispanic 92.05% 92.81% 89.47% 92.93% 94.44% 93.81% 92.59%
Native American
87.50% 83.33% 100.00% 100.00% 100.00% 75.00% 90.97%
Native Hawaiian
100.00% 100.00% 83.33% 100.00% 100.00% 100.00% 97.22%
Not Reported 98.41% 96.30% 89.01% 98.81% 100.00% 90.57% 95.52%
White 95.64% 94.37% 95.26% 94.77% 94.47% 93.88% 94.73%
% Retained from Total Cohort to 2nd Fall Term
93.83% 93.82% 93.84% 94.31% 94.63% 93.67% 94.02%
1st YEAR to 2nd YEAR RETENTION RATES BY SCHOOL FALL 2010 – FALL 2016
School 2011 2012 2013 2014 2015
Arts & Communication 86.96% 86.43% 91.02% 98.64% 96.05%
Business 93.04% 89.45% 90.00% 95.51% 95.02%
Education 86.67% 90.54% 90.32% 96.67% 93.33%
Engineering 78.10% 78.86% 84.62% 93.42% 95.71%
Humanities and Social Sciences
84.53% 85.20% 89.30% 93.37% 89.70%
Nursing, Health & Exercise Science
84.21% 82.08% 85.11% 91.35% 95.10%
Science 87.88% 83.58% 89.31% 94.14% 92.52%
All TCNJ 93.82% 93.84% 94.31% 94.63% 93.67%
Source: Official Census Date Enrollment/freshmen cohort data- % returning in School

25 The College of New Jersey Facts & Figures 2016-2017
4 YEAR, 5 YEAR & 6 YEAR GRADUATION RATES FOR
ENTERING FIRST-TIME FRESHMAN BY ETHNICITY & GENDER
FALL 2006 – FALL 2010 COHORTS
Entering Cohort Year 2006 2007 2008 2009 2010
Total Number in Cohort 1270 1297 1295 1283 1421
% Graduating within 4 Years 72% 73% 73% 73% 75%
% Female 77 78 76 77 78
% Male 66 64 67 65 71
% African-American 37 37 37 55 47
% Asian 86 76 84 78 82
% Hispanic 58 58 58 56 58
% Native American 100 100 0 0 100
% Native Hawaiian/Pacific Islander 0 0 25 80 50
% Non-Resident Alien 0 0 50 50 50
% White 76 78 76 75 79
% Two or More Races 0 100 77 83 69
% Not Reported 75 72 81 67 81
% Graduating within 5 Years 85% 83% 84% 83% 85%
% Female 87 86 86 87 86
% Male 82 79 81 78 83
% African-American 59 56 60 71 62
% Asian 93 83 91 84 90
% Hispanic 72 71 77 73 75
% Native American 100 100 0 0 100
% Native Hawaiian/Pacific Islander 0 79 75 100 100
% Non-Resident Alien 0 0 100 50 50
% White 89 87 87 86 87
% Two or More Races 0 87 89 92 79
% Not Reported 83 84 87 81 90
% Graduating within 6 Years 87% 85% 87% 85% 87%
% Female 88 87 88 88 87
% Male 85 81 85 80 86
% African-American 66 64 69 74 70
% Asian 93 83 91 85 92
% Hispanic 77 76 81 75 78
% Native American 100 100 0 0 100
% Native Hawaiian/Pacific Islander 0 83 100 100 100
% Non-Resident Alien 0 0 100 50 50
% White 90 88 89 87 89
% Two or More Races 0 100 90 92 79
% Not Reported 85 84 88 82 90
Source: IPEDS Graduate Rate Survey first-time freshmen cohorts

26 The College of New Jersey Facts & Figures 2016-2017
DEGREES GRANTED BY SCHOOL AND DEGREE TYPE 2011-2016
School Degree 2011-12 2012-13 2013-14 2014-15 2015-16
Arts & Comm UGRD BA 112 98 118 120 142
Arts & Comm UGRD BFA 46 28 35 28 30
Arts & Comm UGRD BM 15 20 25 28 15
Business UGRD BA 7 6 5 4 5
Business UGRD BS 285 272 265 321 341
Humanities & Soc. Sci GRAD MA 15 9 19 14 16
Humanities & Soc. Sci UGRD BA 395 376 392 381 393
Humanities & Soc. Sci UGRD BS 34 40 46 48 45
Education GRAD CER 30 26 31 30 25
Education GRAD EDS 5 3 3 1 6
Education GRAD MA 43 35 45 35 39
Education GRAD MAT 111 124 107 104 111
Education GRAD MED 263 178 207 204 215
Education GRAD MS 7 6 1 0 0
Education GRAD SCT 102 86 111 187 146
Education UGRD BS 162 171 166 157 188
Engineering UGRD BABM 4 1 0 0 0
Engineering UGRD BS 20 8 4 5 9
Engineering UGRD BSBM 21 27 26 24 23
Engineering UGRD BSCE 19 32 39 24 21
Engineering UGRD BSCO 9 6 10 12 11
Engineering UGRD BSEE 10 5 13 16 13
Engineering UGRD BSES 0 3 3 1 7
Engineering UGRD BSME 23 33 39 24 21
Independent Studies UGRD BA 14 8 9 11 12
Nursing, Hlth, Ex. Sci GRAD MED 2 1 1 0 0
Nursing, Hlth, Ex. Sci GRAD MSN 9 10 10 5 8
Nursing, Hlth, Ex. Sci GRAD SCT 0 1 0 0 0
Nursing, Hlth Ex. Sci UGRD BS 72 63 63 68 71
Nursing, Hlth Ex. Sci UGRD BSN 45 68 63 65 72
Science UGRD BA 59 46 57 48 42
Science UGRD BS 216 149 203 155 186
Source: CIE Graduation Statistics (defined by Federal IPEDS standards – July 1 through June 30).

27 The College of New Jersey Facts & Figures 2016-2017
DEGREES GRANTED BY SCHOOL AND PROGRAM 2012 – 2016
Use the link below to access tables containing the number of degrees awarded by School, plan, race/ethnicity and gender from 2012-13 up to 2016-17. FactBookDegreesbyTerm1126_1174

28 The College of New Jersey Facts & Figures 2016-2017
EMPLOYEES BY IPEDS OCCUPATIONAL CATEGORY 2016 - 2017
Number of Staff by Employment Status and Occupational Category
Academic Year 2016 - 2017
Occupational Category Reported Values FTE Staff
# of Full-time Staff # of Part-time Staff
Total Number of Staff 1185 545 1367
Instructional Staff 355 497 521
Librarians, Curators, Archivists 34 5 36
Student & Academic Affairs and other Education Services 94 16 99
Management Occupations 101 0 101
Business & Financial Operations 64 1 64
Computer, Engineering & Science Occupations 42 4 43
Community, Social Service, Legal, Arts, Design, Entertainment, Sports and Media Occupations
109 15 114
Healthcare Practitioners & Technical Occupations 17 0 17
Service Occupations 62 0 62
Office and Administrative Support 110 7 112
Natural Resources, Construction, and Maintenance Occupations
197 0 197
Source: IPEDS Human Resources Survey 2016-17

29 The College of New Jersey Facts & Figures 2016-2017
EMPLOYEES BY GENDER FALL 2012 - 2016
2012 2013 2014 2015 2016
Faculty - Full-Time 349 347 356 355 355
Male 175 175 174 167 167
Female 174 172 182 188 188
Faculty - Part-Time/Adjuncts 444 474 464 498 497
Male 209 215 218 226 218
Female 235 259 246 272 279
Staff - Full-Time 677 683 758 765 830
Male 302 310 333 335 370
Female 375 373 425 430 460
Staff - Part-Time 12 13 87 35 48
Male 3 3 47 12 20
Female 9 10 40 23 28
Total Employees 1,482 1,517 1,665 1,653 1,730
Male 689 703 772 740 775
Female 793 814 893 913 955
Source: IPEDS Human Resources Survey

30 The College of New Jersey Facts & Figures 2016-2017
NUMBER OF FACULTY BY RANK AND TENURE STATUS FALL 2012-FALL 2016
2012 2013 2014 2015 2016
Ten/ Ten Trk
Non Ten
Total Ten/ Ten Trk
Non Ten
Total Ten/ Ten Trk
Non Ten
Total Ten/ Ten Trk
Non Ten
Total Ten/ Ten Trk
Non Ten
Total
Full-Time:
Professor 91 0 91 90 0 90 96 0 96 98 0 98 106 0 98
Associate Professor
138 1 139 140 2 142 149 1 150 146 1 147 142 1 147
Assistant Professor
95 17 112 100 10 110 85 19 104 91 15 106 91 12 106
Instructor 0 7 7 0 5 5 0 6 6 0 4 4 0 3 4
Total Full-Time Faculty
324 25 349 330 12 347 330 26 356 335 20 355 339 16 355
Total Part-Time Faculty
0 20 20 0 17 17 0 21 21 0 16 16 0 19 19
Total 324 45 369 330 29 364 330 47 377 335 36 371 339 35 374
Part-Time Faculty includes regular part-time faculty. Adjuncts are not included.
Source: EIS HR Data

31 The College of New Jersey Facts & Figures 2016-2017
TENURE STATUS AMONG FULL-TIME TENURE TRACK FACULTY FALL 2012 - FALL 2016
2012 2013 2014 2015 2016
Tenured/ Eligible
% Tenured
Tenured/ Eligible
% Tenured
Tenured/ Eligible
% Tenured
Tenured/ Eligible
% Tenured
Tenured/ Eligible
% Tenured
Professor 89/91 97.8% 90/90 100% 96/96 100% 98/98 100% 106/106 100%
Associate Professor
113/138 81.9% 136/140 97.1% 142/149 95.3% 141/146 96.6% 133/142 93.7%
Assistant Professor
36/95 37.9% 57/100 57.0% 36/85 42.4% 32/91 35.2% 20/91 22.0%
Total 238/324 73.5% 283/330 85.8% 274/330 83.0% 271/335 80.9% 259/339 76.4%
Key: % Tenured = # Tenured/# Eligible * 100. Note: Counts include active faculty. Source: EIS/HR Faculty Data

32 The College of New Jersey Facts & Figures 2016-2017
AVERAGE SALARY OF FULL-TIME FACULTY BY RANK ACADEMIC YEARS 2012-13 THROUGH 2016-17
2012-13 2013-14 2014-15 2015-16 2016-17
Average Salary $
% Increase
from Previous
Year
Average Salary $
% Increase
from Previous
Year
Average Salary $
% Increase
from Previous
Year
Average Salary $
% Increase
from Previous
Year
Average Salary $
% Increase
from Previous
Year Professor $116,382 0.8% $118,454 2.9% $118,176 1.2% $120,493 4.6% $118,691 0.14%
Associate Professor
$92,609 0.9% $94,650 3.2% $96,938 4.8% $97,216 2.9% $96,540 1.2%
Assistant Professor
$74,075 0.8% $77,631 4.8% $78,741 4.9% $80,696 1.5% $80,268 1.4%
Instructor $75,491 0.0% $72,275 8.3% $71,079 9.0% $75,552 4.5% $76,208 0.0%
Note: Includes full-time continuing faculty from previous year.
Percentage of increase from previous year reflects the percentage of change in total salary expenditures for
continuing faculty.
Source: CIE/AAUP Annual Survey of Faculty Compensation
33 The College of New Jersey Facts & Figures 2016-2017
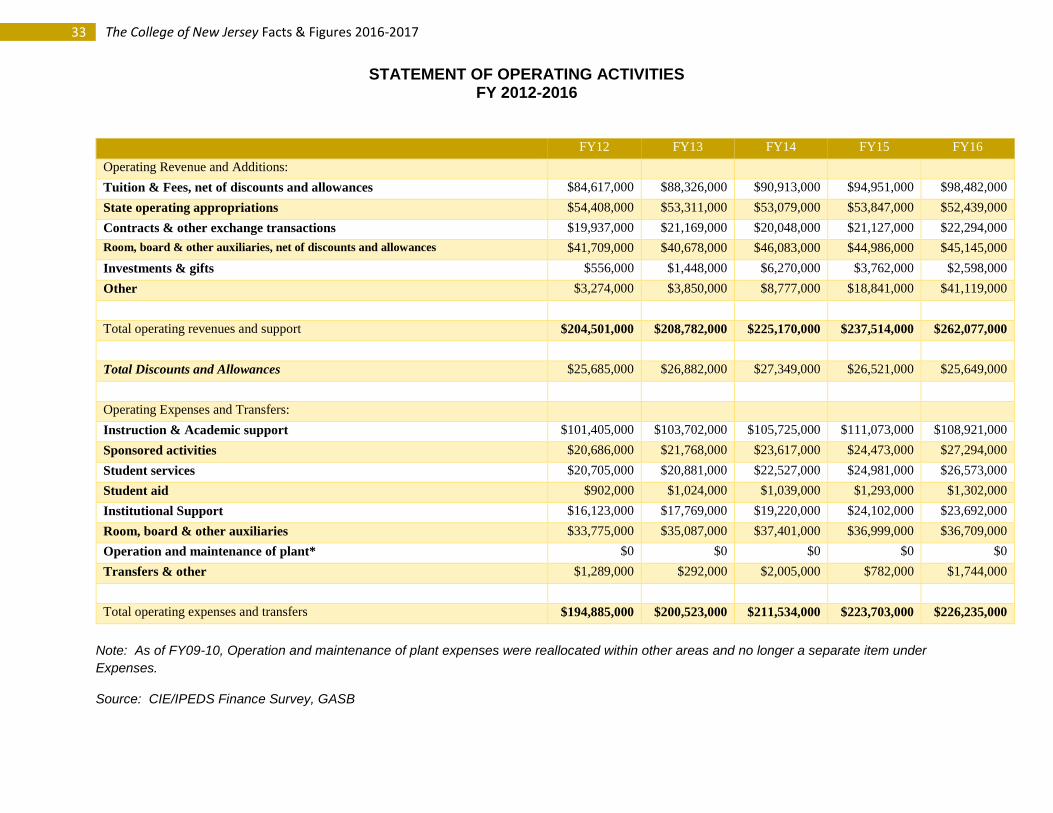
STATEMENT OF OPERATING ACTIVITIES FY 2012-2016
FY12 FY13 FY14 FY15 FY16
Operating Revenue and Additions:
Tuition & Fees, net of discounts and allowances $84,617,000 $88,326,000 $90,913,000 $94,951,000 $98,482,000
State operating appropriations $54,408,000 $53,311,000 $53,079,000 $53,847,000 $52,439,000
Contracts & other exchange transactions $19,937,000 $21,169,000 $20,048,000 $21,127,000 $22,294,000
Room, board & other auxiliaries, net of discounts and allowances $41,709,000 $40,678,000 $46,083,000 $44,986,000 $45,145,000
Investments & gifts $556,000 $1,448,000 $6,270,000 $3,762,000 $2,598,000
Other $3,274,000 $3,850,000 $8,777,000 $18,841,000 $41,119,000
Total operating revenues and support $204,501,000 $208,782,000 $225,170,000 $237,514,000 $262,077,000
Total Discounts and Allowances $25,685,000 $26,882,000 $27,349,000 $26,521,000 $25,649,000
Operating Expenses and Transfers:
Instruction & Academic support $101,405,000 $103,702,000 $105,725,000 $111,073,000 $108,921,000
Sponsored activities $20,686,000 $21,768,000 $23,617,000 $24,473,000 $27,294,000
Student services $20,705,000 $20,881,000 $22,527,000 $24,981,000 $26,573,000
Student aid $902,000 $1,024,000 $1,039,000 $1,293,000 $1,302,000
Institutional Support $16,123,000 $17,769,000 $19,220,000 $24,102,000 $23,692,000
Room, board & other auxiliaries $33,775,000 $35,087,000 $37,401,000 $36,999,000 $36,709,000
Operation and maintenance of plant* $0 $0 $0 $0 $0
Transfers & other $1,289,000 $292,000 $2,005,000 $782,000 $1,744,000
Total operating expenses and transfers $194,885,000 $200,523,000 $211,534,000 $223,703,000 $226,235,000
Note: As of FY09-10, Operation and maintenance of plant expenses were reallocated within other areas and no longer a separate item under
Expenses.
Source: CIE/IPEDS Finance Survey, GASB

34 The College of New Jersey Facts & Figures 2016-2017
OPERATING REVENUE, EXPENSES AND TRANFERS FISCAL YEAR 2016
REVENUE ($262,077,000)
EXPENSES & TRANSFERS ($226,235,000)
Source: CIE/IPEDS 2016-17 Finance Survey, GASB
Tuition &
Fees* 38%
State Operating
Appropriations
20%
Contracts &
Other Exchange
Transactions8%
Room, Board &
Other
Auxiliaries*17%
Investments &
Gifts 1%
Other 16%
Instruction &
Academic
Support 48%
Sponsored
Activities
12%
Student
Services 12%
Student Aid
1%
Institutional
Support 10%
Room, Board
& Other
Auxiliaries
16%
Transfers &
Other 1%
35 The College of New Jersey Facts & Figures 2016-2017
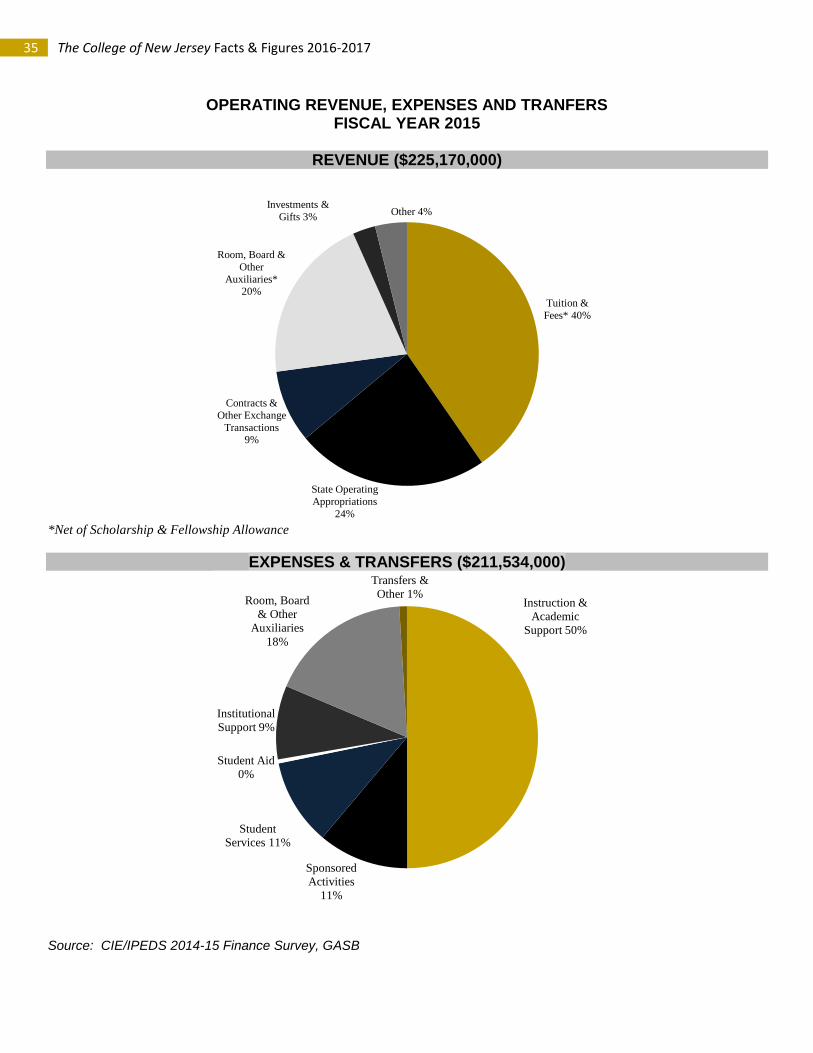
OPERATING REVENUE, EXPENSES AND TRANFERS FISCAL YEAR 2015
REVENUE ($225,170,000)
*Net of Scholarship & Fellowship Allowance
EXPENSES & TRANSFERS ($211,534,000)
Source: CIE/IPEDS 2014-15 Finance Survey, GASB
Tuition &
Fees* 40%
State Operating
Appropriations
24%
Contracts &
Other Exchange
Transactions9%
Room, Board &
Other
Auxiliaries*20%
Investments &
Gifts 3%Other 4%
Instruction &
Academic
Support 50%
Sponsored
Activities
11%
Student
Services 11%
Student Aid
0%
Institutional
Support 9%
Room, Board
& Other
Auxiliaries
18%
Transfers &
Other 1%

36 The College of New Jersey Facts & Figures 2016-2017
CHANGE IN NET ASSETS FY 2013 - FY 2016
FY13 FY14 FY15 FY16
Assets:
Current Assets $103,666,000 $120,239,000 $127,811,000 $126,811,000
Capital Assets, net $592,234,000 $587,655,000 $601,473,000 $638,881,000
Other noncurrent assets $34,963,000 $65,599,000 $64,571,000 $53,879,000
Total assets $730,863,000 $773,493,000 $793,855,000 $819,571,000
Deferred outflow of resources $23,806,000 $22,559,000 $25,893,000 $47,366,000
Liabilities:
Current liabilities $38,850,000 $47,537,000 $55,912,000 $54,970,000
Noncurrent liabilities $364,933,000 $389,375,000 $497,877,000 $516,552,000
Total liabilities $403,783,000 $436,912,000 $553,789,000 $571,522,000
Deferred inflows of resources - - $3,537,000 $724,000
Net Assets:
Invested in capital assets, net of related
debt
$229,996,000 $229,359,000 $251,027,000 $283,072,000
Restricted expendable $2,298,000 $11,641,000 $11,383,000 $12,607,000
Unrestricted $118,592,000 $118,140,000 $12,000 ($988,000)
Total net position $350,886,000 $359,140,000 $262,422,000 $294,691,000
Ratio of current assets to current liabilities 2.67 2.53 2.29 2.31
Source: Treasurer’s Office, TCNJ (Amounts for years prior to FY15 have not been restated to reflect the effect of GASB 68)

37 The College of New Jersey Facts & Figures 2016-2017
EXTERNALLY SPONSORED ACTIVITIES AWARDED GRANTS – FY2016
Awarded - FY2016
SCHOOL DEPARTMENT TOTAL AWARDS
Art & Communications TCNJ Center for the Arts $6,350.00
Journalism & Professional Writing $20,000.00
School of Art & Communications Total $26,350.00
Business SBDC $198,985.00
Economics $48,891.00
School of Business Total $325,923.15
Centers CELR $1,626,088.00
NJ Sustainable Self Institute $1,521.370.00
The Liberal Learning Center $67,296.00
Community Centers Total
$3,214,754.00
Education Special Education $1,298,594.87
Ed. Admin. & Secondary Ed. $381,864.00
Counselor Education $27,500.00
School of Education Total $1,707,958.87
Engineering Civil Engineering $349,426.66
Biomedical Engineering $8,000.00 Electrical/Computer Engineering $50,000.00
Mechanical Engineering $164,986.00 Tech Studies - STEM $146,500.00
School of Engineering Total
$718,912.66
School of Nursing Health & Exercise Total Nursing $433,830.50
Science Biology $761,344.00
Chemistry $25,000.00
Computer Science $14,673.00
Mathematics & Statistics $14,710.00
Physics $1,204,000.00
School of Science Total
$2,019,727.00
Student Affairs Total Health & Wellness $621,773.00
College of New Jersey Total
$9,069,229.18
Source: Director of Grants

38 The College of New Jersey Facts & Figures 2016-2017
UNDERGRADUATE TUITION, FEES, ROOM AND BOARD CHARGES AND ANNUAL RATE OF INCREASE, ACADEMIC YEARS 2006-07 UP TO 2016-17
Tuition Fees Room & Board*
Resident Non-Resident
Year $ % Increase $ % Increase $ % Increase $ % Increase
2006-07 7,615 8.0% 14,161 15.0% 2,938 4.7% 8,843 4.6%
2007-08 8,072 6.0% 15,295 8.0% 3,235 10.1% 9,242 4.5%
2008-09 8,718 8.0% 16,825 10.0% 3,590 11.0% 9,612 4.0%
2009-10 8,980 3.0% 17,666 5.0% 3,742 4.2% 9,996 4.0%
2010-11 9,340 4.0% 18,726 6.0% 3,953 5.6% 10,358 3.6%
2011-12 9,760 4.5% 19,569 4.5% 4,127 4.4% 10,677 3.1%
2012-13 10,102 3.5% 20,254 3.5% 4,276 3.6% 10,998 3.0%
2013-14 10,355 2.5% 20,760 2.5% 4,375 2.3% 11,343 3.0%
2014-15 10,562 2.0% 21,175 2.0% 4,462 2.0% 11,676 2.9%
2015-16 10,879 3.0% 21,810 3.0% 4,587 2.8% 12,498 7.0%**
2016-17 11,124 2.3% 22,301 2.3% 4,670 1.8% 12,881 3.1%***
Source: CIE/Common Data Set
* Board = Carte Blanche ‘C’ plan
** Board charges for 2015-16 reflect pricing for Carte Blanche ‘B’ plan
*** Board Charges for 2016-17 reflect pricing for ‘Ala Carte 1’plan

39 The College of New Jersey Facts & Figures 2016-2017
CAMPUS BUILDING INVENTORY
2016-17
SqFt.% Sq.Ft. #Buildings
Academic 31.8% 1,095,515 15
Institutional 3.0% 104,148 2
Maintenance 1.3% 43,111 3
Parking Garages 23.3% 803,684 5
Recreational 7.3% 248,753 5
Residential 33.3% 1,148,021 15
Other 0.1% 3,055 1
Total Campus Buildings 100.0% 3,446,287 46
Source: TCNJ Facilities, Residential Education Offices
Academic31.8%
Institutional3.0%
Maintenance1.3%
Parking Garages23.3%
Recreational7.3%
Residential33.3%
Other 0.1%

40 The College of New Jersey Facts & Figures 2016-2017
THE COLLEGE OF NEW JERSEY LIBRARY
Facilities and Services The College of New Jersey Library, provides high-quality information resources, expertise and a learning environment that enhance the search for knowledge and understanding. The Library serves as an intellectual, cultural and social center for the College, empowering TCNJ community members to become self-directed, lifelong learners and responsible citizens. The five-story, 135,000 square-foot facility, in addition to housing the traditional library collections and services, provides 26 group study rooms, a café, a late-night study area, and a 105-seat multi-purpose auditorium.
TCNJ Library Collections: Archives: Materials documenting the college's history, dating from the Normal School era in the mid-1800's to the present. Materials range from early annual reports and a historic textbook collection, through college publications, to photographs, slides, and memorabilia.
Children’s/Young Adults Collection: This specialized area of over 28,000 titles contains many award winning fiction
and non-fiction resources for young people from preschool age through senior high school. Included are reference materials for school age students including: folk tales, poetry, subject guides to picture books, bibliotherapy, selected summaries, review sources and encyclopedias.
Curriculum & K-12 Elementary – High School Texts Collections: The Curriculum Reference Collection contains
several thousand curriculum guides on microfiche from the Kraus Curriculum Development Library. Behavior objective guides by subject, multiple titles in the series, Educators Guide to Free Materials, and Scope and Sequence charts.
General Collection: The General Collection consists of more than 562,000 books that have been selected by faculty and subject specialist librarians to support course offerings of the college and to provide a broad representative collection of titles across many disciplines. This growing collection includes fiction, non-fiction, and children's/youth books.
Music & Media: The library's Music and Media Collections consist of ca. 7,500 volumes of printed music, ca. 21,000 sound recordings in LP and CD format, and ca. 13,000 video recordings in DVD, VHS and U-Matic formats.
Periodicals: The library has access to over 30,000 periodical titles, which are available in a variety of formats: print, online, and microfilm/microfiche.
Reference: The Reference Collection numbers approximately 11,000 volumes and includes general encyclopedias,
almanacs, dictionaries, atlases, and the like, as well as a large collection of subject specific reference works.
Library Holdings (Fiscal Year 2016): Books, serial backfiles, and government documents : 841,070 (including bound periodicals & newspapers; physical & digital/electronic) Current serial subscriptions: 86,024 (paper, microform & electronic titles) Video and audio (units): 58,206 Online electronic database access: 122 Total Circulation: 47,963

41 The College of New Jersey Facts & Figures 2016-2017
THE COLLEGE OF NEW JERSEY REGIONAL, NATIONAL, AND SPECIALIZED ACCREDITORS
Accreditation Board for Engineering and Technology (ABET) American Chemical Society (ACS)
Association to Advance Collegiate Schools of Business (AACSB) Association of Small Business Development Centers (SBDC)
Commission on Collegiate Nursing (CCNE) Computing Accreditation Commission of Accreditation Board for Engineering and Technology (CAC)
Council on Education of the Deaf (CED) Council for Accreditation of Counseling & Related Education Programs (CACREP)
Engineering Accreditation Commission of Accreditation Board for Engineering and Technology (EAC) Middle States Commission on Higher Education (MSCHE)
National Association of Schools of Music (NASM) Council for the Accreditation of Educator Preparation (CAEP)
National League for Nursing Accreditation Commission (NLNAC)

42 The College of New Jersey Facts & Figures 2016-2017
ADMINISTRATIVE ORGANIZATIONAL CHART 2015

43 The College of New Jersey Facts & Figures 2016-2017
MEMBERS OF THE BOARD OF TRUSTEES
AS OF SEPTEMBER 2016
Ex-Officio Members
Dr. R. Barbara Gitenstein, PhD, President, Ex-Officio
Officers of the Board
Mr. Jorge A. Caballero, Chair
Ms. Susanne Svizeny, Vice Chair
Dr. Robert A. Altman, Secretary
Appointed Members
Mr. Bradley S. Brewster Mr. Miles Powell II
Mr. Christopher R. Gibson, Esq. Ms. Eleanor V. Horne
Mrs. Rosie Hymerling Ms. Treby Williams
Dr. Frederick Keating Mr. Albert M. Stark
Mr. Brian Markison Dr. Joshua M. Zeitz
Student Members
Ms. Dana Disarno, Student Trustee
Ms. Priscilla Nunez, Alternate Student Trustee
Faculty Representatives
Dr. Jana Gevertz
Dr. Morton Winston
Staff Representatives
Mr. Joseph O’Brien
Mr. Timothy Grant

44 The College of New Jersey Facts & Figures 2016-2017
Equal Employment Opportunity & Diversity/Affirmative Action
The College of New Jersey is committed to equal opportunity, affirmative action and diversity. The College values diversity and is actively engaged in enriching the diversity of its faculty, staff and students. Central to the College’s mission is creating a climate that is inclusive and respectful to everyone on campus. The College of New Jersey does not discriminate on the basis of race, creed, color, national origin, nationality, ancestry, age, sex/gender (including pregnancy), marital status, civil union status, domestic partnership status, familial status, religion, affectional or sexual orientation, gender identity or expression, atypical hereditary cellular or blood trait, genetic information, liability for service in the Armed Forces of the United States, or disability.