Embed Size (px)
Citation preview

Facts & Figures SOLAR Energy
1
Facts & FiguresSOLAR Energy
KenyaNigeriaCameroonEthiopiaGhanaRwandaSenegalTanzaniaUganda
UNLOCKING SOLAR CAPITAL AFRICA1 & 2 NOVEMBER 2016 NAIROBI, KENYA

Facts & Figures SOLAR Energy
2
Table of Contents
Contact details - Solarplaza team
1. An event for Africa, in Africa
2. Regional Overview
3. Kenya
4. Nigeria
5. Cameroon
6. Ethiopia
7. Ghana
8. Rwanda
9. Senegal
10. Tanzania
11. Uganda
12. General Summary
Sources & Links
p 3.
p 4.
p 5.
p 12.
p 18.
p 25.
p 31.
p 37.
P 42.
P 46.
P 51.
P57.
P61.
P62.

Facts & Figures SOLAR Energy
3
Contact details - Solarplaza team
1. An event for Africa, in Africa
2. Regional Overview
3. Kenya
4. Nigeria
5. Cameroon
6. Ethiopia
7. Ghana
8. Rwanda
9. Senegal
10. Tanzania
11. Uganda
12. General Summary
Sources & Links
Contact Details Solarplaza Team
Dr. Eveline JansenProject [email protected] +31 10 3027907
Jordan KouzmanoffEditor [email protected] +31 10 280 9198
Disclaimer: This overview is provided by Solarplaza International BV ("Solarplaza") as a service to its customers on an "as-is, as-available" basis for informational purposes only. Solarplaza assumes no responsibility for any errors or omissions in these materials. Solarplaza makes no commitment to update the information contained herein. This overview is protected by copyright laws, and may only be reproduced, republished, distributed, transmitted, displayed, broadcast or otherwise exploited in any manner only by accrediting Solarplaza as the source of it and providing a full hyperlink to www.unlockingsolarcapital.com where it was originally published.
Borja GutierrezProject [email protected] +31 10 3027905
Szabolcs MagyariEditor [email protected] +31 10 280 9198
Saul OostEditor
Kristiaan VersteegEditor

Facts & Figures SOLAR Energy
4
1. An event for Africa, in Africa
Africa is quickly becoming one of the most significant regions in the global expansion of the PV industry. The high levels of solar irradiation, extreme growing energy demand, increasing level of commitment by governments in the region to renewable energy generation, and the lack of an established sophisticated energy infrastructure are just some of the factors that are sparking a growing interest from international stakeholders.
The purpose of this report is to provide an overview of the key facts and figures related to some of the key markets as a prelude to the Unlocking Solar Capital: Africa conference Solarplaza will be organizing 1-2 November 2016 in Nairobi, Kenya.
Solarplaza and GOGLA are proud to announce the organization of Unlocking Solar Capital: Africa - the unique international platform and 2-day conference focusing on unlocking capital for new solar project development in Africa. This event will connect solar project development and finance & investment in the three leading solar electrification segments (On-grid Solar, micro-grids, off-grid lighting and household electrification).Unlocking Solar Capital: Africa, Solarplaza’s 7th event on the continent, will bring together hundreds of representatives from development banks, investment funds, solar
developers, IPPs, EPCs & other solar stakeholders. Learn more about the program, speakers and more here.
Key characteristics
• 300+ senior executives, finance and project development
• Unprecedented depth and focus through separate tracks for on-grid, mini-grid and off-grid solar financing and development
• Guaranteed matchmaking through our customized software, interactive networking breaks and a dedicated matchmaking session;
• Taking place in Nairobi, one of Africa’s key hotspots (home of one of the largest continental stock exchange markets and a myriad of local & international businesses)
In preparation of the conference, we are bringing you this report to get a more in-depth look into all the facts & figures of the solar PV market in Africa. The report will give an overview of a range of issues related to PV project development including the demographic landscape, legislation and policies, electricity generation and capacity, and more in the following countries: Kenya, Nigeria, Cameroon, Ethiopia, Ghana, Rwanda, Senegal, Tanzania, Mali and Uganda.
www.unlockingsolarcapital.com

Facts & Figures SOLAR Energy
5
2. Regional Overview
Energy demand
Malfunctioning grid structures and a lack of reach in the overall infrastructure are common phenomena in the sub-Saharan region and are key issues to address for the development of the region. Furthermore, average electrification rates throughout the continent are
very low. Often times electricity is only accessible for 30-50% of the population consisting of a relatively higher percentage in urban areas and a very low levels in rural regions. Most rural regions do not have access to the main grid of the country. When they do have access, power supply is often intermittent making it difficult for businesses to
Introduction
Africa is one of the largest, relatively untapped, territories in terms of energy investment. Even though most countries bear a developing or sub-developing status, the combined GDP of Africa amounts to about 800 billion USD and there are more than half a billion people living there (Table 2.1). Since investment capital in the country
is very low, the development of Africa’s energy infrastructure is in the hands of external investors. One of the main barriers for investors’ entry into African countries is the nature of governmental regulations promoting and protecting investors. There is often very little transparency, high levels of corruption and few regulatory institutions to ensure businesses’ rights.
Facts & Figures - Selected Countries* (CALCULATIONS)
Combined GDP Approx. 800,000,000,000 USD
Average GDP per Capita Approx. 1,510 USD
Combined GDP Growth (2015) Approx. 4.16%
Combined inhabitants Approx. 515,000,000
Installed Solar PV Capacity (2015) > 1.7 GW
Electrification rate (2012) > 40%
Average Horizontal Radiation Africa
(Calculations based on IRENA report, exclusions areas unsuitable for RE taken into account)
1. Tanzania (Approx. 5.6 kWh/m2/day ) 2. Kenya (Approx. 5.4 kWh/m2/day ) 3. Uganda (Approx. 5.3 kWh/m2/day )

Facts & Figures SOLAR Energy
6
businesses to work consistently. These unfavourable present circumstances, combined with the fact that solar PV costs are dropping and projects becoming more attractive, has resulted in numerous opportunities for PV projects throughout the continent. Furthermore, the easy and quick implementation of Solar PV gives it a competitive advantage over other renewable energy sources, especially for the electrification of rural areas.
Potential for renewables
In many parts of Africa, power is generated by old fossil fuel plants and generators. In 2012, 65% of the total energy production came from coal and/or gas sources (Figure 2.1). These power generation techniques, on top of
their highly unsustainable nature, have proven to be very costly for both African governments and consumers and have urged officials to explore other energy sources. The most widely adopted renewable energy source in sub-Saharan Africa is hydroelectricity accounting for 22% of total energy production (Figure 2.1). These sources have proven to be very competitive alternatives for fossil fuels due to their high energy yields and low consumer costs. However, not all countries have a geography that favours a hydroelectricity facility (river / lake at higher altitude); droughts and irregular rainfalls have a severe impact, causing serious problems in power supply. Additionally, there is a large environmental impact from the creation of such a hydrodam.
Figure 2.1: Electricity generation by fuel in sub-Saharan Africa in the New Policies Scenario, 2012 vs. 2040.

Facts & Figures SOLAR Energy
7
Solar energy can prove to be a viable solution to meet the growing energy demand due to the region’s outstanding inherent characteristics. The sub-Saharan region contains countries with some of the continents highest irradiation levels in Africa, notably Tanzania, Kenya and Ethiopia. These countries experience irradiation levels up to 2000 kWh/m2/year displaying great potential for Solar PV systems (Figure 2.3). These potentials are already being tapped on a
small scale via in mini-grid and off-grid initiatives. Presently, 37% of all minigrid and off-grid initiatives has a solar energy component, and this is expected to grow to 47% in 2040 due to the new policies throughout the region (Figure 2.2). This growth will be aided by the collaboration of SE4ALL, Inensus GmbH and Energy4Impact. The initiative will include market intelligence, investments and support in a technical and advisory role.
Figure 2.2: Technology mix for mini-grid and off-grid power generation in sub-Saharan Africa in the New Poli-cies Scenario, 2040
Policies and targets
As an intention to move from costly fossil fuel sources to renewable sources and to meet the growing energy demand, many countries have implemented policies that either limit the usage of fossil fuels or promote renewable energy source. An overview of several policies is shown in table (Table 2.3). The solar capacity is projected to exceed 6 GW by 2020 and reach 45 GW in 2040 with Solar
PV accounting for three-quarters of the total and concentrated solar power accounting for the rest. The solar capacity additions increase from an average of 0.9 GW per year until 2020 and then to an average of 2.2 GW per year thereafter. This rate of growth translates into the biggest compounded average annual growth rate out of all energy sources both in electricity generation and electrical capacity corresponding to 22.1% and 26% respectively, within the

Facts & Figures SOLAR Energy
8
projected time frame of 2012-40 (Table 2.2). Policies promoting the use of Solar energy will be crucial in the country-wide adoption process as solar powered
products bear relatively high upfront costs compared to other renewable energy sources.
Figure 2.3: Global horizontal irradiation map of Africa.

Facts & Figures SOLAR Energy
9
Table 2.2: Projected total energy generation and total electricity capacity of Africa under new policy scenario.

Facts & Figures SOLAR Energy
10
Country Sector Policies and Targets
Kenya Efficiency/Renew-ables/Nuclear
• Set standards for electrical appliances• Set energy efficiency obligations for utilities• Energy bill 2014 provides for the creation of Energy
Efficiency and Conservation Agency to enforce energy efficiency standards
• Eliminate kerosene as a household fuel by 2022.• Requirement to install solar water heaters in buildings
connected to the grid
Nigeria Efficiency/Renew-ables/Nuclear
• Make reliable energy available for 75% of the population by 2020 and 100% by 2030 by connecting an average of 1.5 million households per year
Cameroon Efficiency/Renew-ables/Nuclear
• Vision 2035• Increase production and deliver electricity with an
emphasis on renewable energy.• New framework to promote the implementation of
renewable energy sources• Exemption of value-added tax for solar panels• Electrification Master plan• Electrification of rural areas• By 2020, the government aspires to reach
electrification rates of 48% countrywide, with 75% electrification in urban areas and 20% in rural ones.
Ethiopia Efficiency/Renew-ables/Nuclear
• Increasing energy generation capacity from 2.26 GW to 17,34 GW and increasing the country’s electricity service coverage from 60% to 90%
• New law to focus on the proliferation of Power Purchase Agreements the development of off-grid systems, and the enactment of more efficient on-grid management policies.
• Power Africa initiative• Establishing 30,000 MW of energy generation
capacity.• Eastern Africa Power Pool (EAPP)• Facilitates cross-border grid connections and
mandates the establishment of common codes and standards
Table 2.3: An overview of the policy in each of the focus countries.
Policy Overview in Focus Countries

Facts & Figures SOLAR Energy
11
Country Sector Policies and Targets
Ghana Efficiency/Renew-ables/Nuclear
• Feed-in tariff established by the Renewable Energy Act in 2011.
Rwanda Efficiency/Renew-ables/Nuclear
• Increase access to electricity from 17% to at least 60% by 2020 and give access to all schools and hospitals by 2017
• Reduce share of bioenergy in energy demand to 50% by 2020.
• Expand the transmission network by 2100 km by 2017
Senegal Efficiency/Renew-ables/Nuclear
• Ensuring energy security and increasing the energy access for all
• Developing a policy mix combining thermal generation, bio-energy, coal, gas, and renewables and seizing the opportunities of regional interconnections
• Continuing and accelerating the liberalization of the energy sector by encouraging independent production and institutional reform of the sector
• Improving the competitiveness of the sector in order to lower the cost of energy and reduce sector subsidies
• Strengthening regulation of the sector
Tanzania Efficiency/Renew-ables/Nuclear
• National Energy Policy• a reduction in the dependence of the energy sector on
fossil fuels;• the proliferation of renewable energy, particularly
non-hydro alternatives, due to Tanzania’s frequent droughts;
• achieving 100% national electrification rate by 2030;• adding 8,990 MW of electrical generation capacity by
2035.• Standardized Power Purchase Agreements to private
investors under the Electricity Act of 2008
Uganda Efficiency/Renew-ables/Nuclear
• Increase the use of modern renewable energy from the current 4% to 61% of the total energy consumption by the year 2017.
• Global Energy Transfer Feed-in Tariff program• Premium payment mechanism• Security for facilities against off-takers and political
risk• Private financing mechanisms from Deutsche Bank
Table 2.3: An overview of the policy in each of the focus countries.
Facts & Figures SOLAR Energy
12
3. Kenya
Introduction
Kenya, one of the strongest and most advanced economies in Central and East Africa, has set out ambitious goals to meet its growing energy demand. Kenya has been heavily investing in renewable energy sources in order to meet the energy demand that is projected to grow at a rate of more than 18% annually. Although the country has focused on the construction of hydroelectric and geothermal plants, the electrification of rural and remote areas remain a challenge. These areas can have as low as 6.7% of electrification rate. Solar energy, however, seems like the perfect solution for the problem. With the country’s insolation levels of 4-6kWh/m2/day(Figure 3.1) and peak insolation hours lasting up to 5-7 hours, Solar energy development is certainly going to be a main focus for Kenya .
Figure 3.1: Solar irradiation of Kenya.
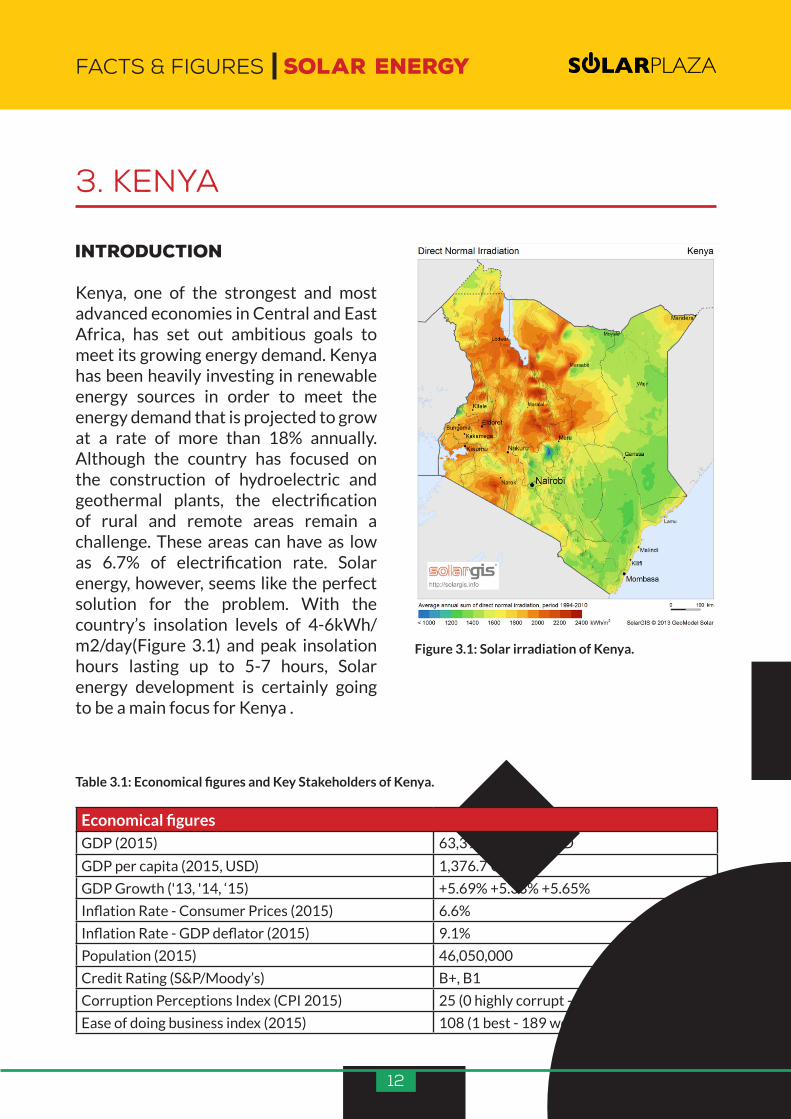
Economical figures
GDP (2015) 63,398,040,000 USD
GDP per capita (2015, USD) 1,376.7 USD
GDP Growth ('13, '14, ‘15) +5.69% +5.33% +5.65%
Inflation Rate - Consumer Prices (2015) 6.6%
Inflation Rate - GDP deflator (2015) 9.1%
Population (2015) 46,050,000
Credit Rating (S&P/Moody’s) B+, B1
Corruption Perceptions Index (CPI 2015) 25 (0 highly corrupt - 100 very clean)
Ease of doing business index (2015) 108 (1 best - 189 worst)
Table 3.1: Economical figures and Key Stakeholders of Kenya.

Facts & Figures SOLAR Energy
13
Economical figures
Access to electricity (2016) 56%
• Power consumption per capita in kWh 168
• Renewable electricity as % of total output (2012) 75%
• Renewable consumption (% of total consumption, 2012)
78.5%
Noteworthy solar projects
Name Capacity Location Status Developer
Garissa Solar PV Plant
50 MWp Garissa, Kenya Under construction Rural Electrification Authority
Lamu Solar PV 40MW Lamu, Kenya Under construction Kenya Solar Energy
Table 3.2: Noteworthy solar projects of Kenya.
Figure 3.2: Total energy production and final energy consumption in Kenya.
Key Stakeholders
Energy regulator • Ministry of Energy (MOE)• Energy Regulatory Commission (ERC)
Utilities • Kenya Electricity Generating Company (KenGen)• Kenya Power and Lightning Company (KPLC)
Top Banks • Equity Bank• Standard Chartered Bank• KCB

Facts & Figures SOLAR Energy
14
Kenya´s openness to renewable energy sources is reflected in its total energy production. Over two-thirds of the total energy production in Kenya comes from renewable energy sources with the main emphasis on hydroelectricity and geothermal energy (Figure 3.2). These sources of energy, however, mainly power the entities that are located close to the grid. The rate of electrification is very low in in rural and remote places which is evident from the relatively low residential energy consumption found in Figure 3.2. The electrification of this segment will be inevitable in the upcoming years if Kenya wants to sustain its socio-economic development.
Regulatory framework
Kenya’s current Energy Policy and Act was articulated in 2004 and implemented through The Energy Act of 2006. The act states clear policies on the mitigation of climate change with the promotion of renewable energy sources. Hence, a feed-in-tariff was put in place for renewable energy. In 2011, the Least Cost Power Development Plan (LCPDP) was updated that stated long-term goals with regards to electricity generation till the year 2030. The electricity demand was projected to go up to
19,220 MW by 2030, with geothermal and hydropower being the main power sources by that time. The government has also put in place solar energy targets in its National Energy Plan (2012). Installed solar capacity is to reach 100 MW by 2016, 200 MW by 2022 and 500 MW by 2030.
The enactment of the Public Private Partnerships Act (PPPA) has also changed the energy landscape of Kenya greatly. The PPPA has created a framework for PPP’s in Kenya and has provided operational details on how PPP projects should be tendered, approved and implemented. Partnerships of this kind can prove to be an opportunity for private companies affiliated with solar PV.
When compared to the rest of Sub-Saharan Africa, Kenya has a relatively strong regulatory framework, which offers an enabling environment for investors. There are many examples of successful PPP projects, though they are all wind and geothermal projects. In addition to the robust regulatory framework there are many Green-Mini grid and ReFit Programmes in place that stimulate development on micro and off-grid level.
Electricity tariffs
1 KES = .0099EUR Charges (KES // USD)
Fixed charge Energy charge (per kWh)
Demand charge (per kVA)
DC (Domestic, 240V) 150 // 1.485 2.5 // 0.02475 (<50kWh)13.68 // 0.135432 (50-1500 kWh)21.57 // 0.213543 (>1500 kWh)
n/a
SC (Small Commercial, 240V) 150 // 1.485 14.00 // 0.1386 n/a

Facts & Figures SOLAR Energy
15
1 KES = .0099EUR Charges (KES // USD)
Fixed charge Energy charge (per kWh)
Demand charge (per kVA)
CI1 (Commercial, 415V) 2 000 // 19.8 9.45 // 0.093555 800 // 7.92
CI2 (Commercial, 11kV) 4 500 // 44.55 8.25 // 0.081675 520 // 5.148
CI3 (Commercial, 33kV) 5 500 // 54.45 7.75 // 0.076725 270 // 2.673
CI4 (Commercial, 66kV) 6 500 // 64.35 7.55 // 0.074745 220 // 2.178
CI5 (Commercial, 132kV) 17 000 // 168.3 7.35 // 0.072765 220 // 2.178
IT (Domestic water heating) 150 // 1.485 13.75 // 0.136125
Table 3.3: Electricity tariffs for domestic and commercial use in Kenya.
Solar PV
On-grid
The largest operational PV project in Kenya is situated in Changoi, Kenya The project was developed for the Williamson Tea company, as its management was looking for cost effective and reliable ways to secure its energy requirements. The 1 MW plant supplies 30% of the daily energy requirements, and when the factory is not running it supplies the surplus to the national grid. Several proposals for large scale utility projects have been approved by the Kenyan government this year. These are a few of the largest projects announced or under construction:• A 55 MW solar PV plant in the East
Kenyan county of Garissa. The 128 million USD investment will be financed through concessional funding of the Chinese government.
• A 40 MW solar PV plant in the Northern
Kenyan county of Isiolo. The plant will be the first of its kind to qualify for the Kenya feed-in tariff.
• A 40 MW solar farm along the Nakuru-Marigat road. The project, named Migotiyo Solar Park will be developed by a special purpose vehicle and requires a total investment of 65 million USD.
Although most large projects are currently often undertaken by companies from outside Kenya, also Kenya-based companies are emerging as important players in the market. E.g. Kenya Solar Energy Ltd. has proposed to construct a 40 MW PV plant in Lamu County and has recently received a green light to commence construction.
Microgrid
The installation of mini-grids has recently taken a leap in Kenya. Through the Rural Electrification Master Plan of 2008, the government encourages current diesel

Facts & Figures SOLAR Energy
16
generators to install PV systems to reduce diesel reliance. This market is growing rapidly and has received international support. A good example of this is the World Bank which, through its “Scaling Up Renewable Energy” program, funded the hybridisation of 12 existing (brown) mini-grids to solar-diesel hybrids.
Microgrid systems can be especially useful for villages that are too far away from the main power lines to access the grid. Corporations like Powerhive and small institutions like Generalia are on their way to power over 100 villages and 200,000 residents in Kenya with microgrid PV systems, decreasing the reliance on dangerous fuels. SteamaCo and Powerhive have introduced a new payment method for microgrid energy that is attractive to both consumers and investors. The new smart microgrid platform enable the capturing of consumer payments by a mobile money platform. Through this method, investors like Enel Green power are partnering up with Powerhive to power at least 90,000 residents with PV electricity in the near future.
An example that illustrates the potential of microgrid opportunities is the solar project at Strathmore University. In September 2015, the university signed a power purchase agreement with the Government of 20 years. It was the first time the government had agreed to purchase solar power. According to the director at the University Research Centre, Izael Pereira Da Silva, the university has seen its buildings save 160,000 USD on energy costs. When comparing this to the 1.3 million USD costs involved, the institution has shown that there is certainly a case to be made for microgrid systems in Kenya.
Off-grid
One of the most interesting business models that is being used in Kenya to enable energy access and tackle the problem of high upfront costs, is the pay-as-you-go interface. This system allows users to pay for their electricity as they use it. Companies such as UK startup Azuri Technologies also provide solutions that allow households to pay for solar power as they use it with scratch cards, making them a lot more affordable. Once users have paid for their startup system, they will have the opportunity to upgrade, making it possible for them to develop and grow stores.
Off-grid solar initiatives have experienced a rise due to companies like BBOXX, which promote the use of renewables energy sources in rural areas of Africa. BBOXX matches the prices of existing energy sources and spreads the expenses of the solar system over time to widen its customer base and make solar energy affordable for a larger audience. Moreover the integration of their PV systems with mobile payment platforms provides a convenient solution
Another initiative that has helped thousands in rural Kenya comes from M-KOPA. The company provides a 8W battery
Image: African Solar Designs

Facts & Figures SOLAR Energy
17
powered-system that comes with three lights, mobile phone-charging and a solar powered radio. Customers now also have the opportunity to choose a 20MW system with digital TV. Besides the electrification of rural households, the company is also helping customers reduce their energy bill by providing an alternative to expensive kerosene sources.
Extra: Solar potential - Challenges and Opportuni-ties
The potential for solar projects in Kenya is quite big, as the country experiences solar radiations of 4-6kwh/m2/day, and on average six hours of strong sunlight. Especially in the West of the country (Figure 3.1), radiation reaches levels high above average when compared to the rest of the world. These conditions imply a great potential for utility-scale projects that can be connected to the grid. As stated in an Elsevier-paper on PV grid connection in Kenya: “ Kenya has the potential to generate orders of magnitude more electricity from solar PV than is consumed each year from
its national grid”.
A big hurdle is of course the low electrification rate of 56% of the population. Utility scale projects can offer to be a sizable part of the solution, but because so many villages are too far away from the power lines, it will definitely not offer a solution to these areas. Therefore the growth in the microgrid and off-grid markets is a logical and absolutely necessary development in Kenya’s energy supply. The new generation of microgrids is beginning to win funding from investors, as it solves previous problems with maintenance and bill collections.
Another challenge is dealing with the insecurity concerning grid extension plans. The lack of clarity that the government gives regarding these plans can make consumers and investors uncertain about whether to invest in mini grids in general. Moreover there is the question of how necessary further power generation through PV is when there is more than 1GW of coal power expected to be added to the grid.

Facts & Figures SOLAR Energy
18
4. Nigeria
Introduction
Nigeria is considered one of the biggest economies in Africa with more than 182 million people (Table 4.1), yet about 55% of the population has no access to grid-connected electricity. The total energy production consists of mainly hydroelectricity and the exploitation of Nigeria’s vast oil reserves, however waste is used as a source of energy mostly in the rural regions. To keep up with the desired growth plan, Nigeria is in immediate need of electrifying its rural regions and improving its existing infrastructure. Power outages and intermittent power supply remain a challenge that roots from its weak, radial transmission system. This aspect forces Nigeria to look at alternative energy sources to power micro- and off grid
solutions. Solar energy is a promising alternative as irradiation levels average 5.5-6.7kWh/m2/day with an average of six hours of sunshine per day (Figure 4.1).
Figure 4.1: Average annual irradiation map of Nigeria
Economical figures
GDP (2015) 481,066,150,000 USD
GDP per capita (2015, USD) 2,640.30 USD
GDP Growth ('13, '14, ‘15) +5.39% +6.31% +2.65%
Inflation Rate - Consumer Prices (2015) 9.0%
Inflation Rate - GDP deflator (2015) 2.9%
Population (2015) 182,202,000
Credit Rating (S&P/Moody’s) B+, B1
Corruption Perceptions Index (CPI 2015) 26 (0 highly corrupt - 100 very clean)
Ease of doing business index (2015) 169 (1 best - 189 worst)
Table 4.1: Economical figures and key stakeholders of Nigeria

Facts & Figures SOLAR Energy
19
Economical figures
Access to electricity (2015) 40%
• Power consumption per capita in kWh 142
• Renewable electricity as % of total output (2012) 20%
• Renewable consumption (% of total consumption, 2012)
86.5%
Noteworthy solar projects
Name Capacity Location Status Developer
Unknown 100MW Enugu State, Nigeria
Signed Memoran-dum of Understand-ing
Martifer Solar
Nova Scotia Power Plan
100MW Jigawa state, Nigeria
Targeting financial closure
Scatec
JCM Solar PV plant
80MW Katsina State, Nigeria
Beginning construc-tion
JCM
Table 4.2: Noteworthy solar projects of Nigeria.
Figure 4.2: Total energy production and final energy consumption in Nigeria
Key Stakeholders
Energy regulator • Federal Ministry of Power• Nigerian Electricity Regulatory Commission (NERC)
Utilities • Nigerian Electricity Supply Industry (NESI)
Top Banks • First Bank of Nigeria• Zenith Bank• United Bank of Africa

Facts & Figures SOLAR Energy
20
The total energy production of Nigeria is estimated to be 13 GW, however, due to the poor maintenance and the outdated technology of the infrastructure the actual capacity is 6.1 GW. Of the total available energy, gas and hydro energy are the most abundant providing the majority of energy in Nigeria. Energy produced from gas accounts for 81.6% (Figure 4.2) of the total energy production as Nigeria contains one of the top ten natural gas endowments of the world and the biggest one in Africa. The other source of energy that is widely adopted in Nigeria is hydroelectricity accounting for 18.4% of the total energy production (Figure 4.2). The popularity of hydroelectricity in the country can be linked to the numerous rivers and waterfalls that are in Nigeria.
Regulatory framework
There has been an energy policy in place in Nigeria since 2006, called the Renewable Energy Master Plan (REMP). The policy was implemented to increase the share of renewables to account for 10% of Nigerian total energy consumption by 2025. The plan includes an installed capacity target of 500 MW by 2025. Nigeria’s power minister has mentioned the ministry aims to boost the installed capacity of solar PV to 1 GW over the next 10 years.
More recently, the Nigerian Electricity Regulatory Commission approved regulations regarding feed-in-tariffs for RE sourced electricity. Electricity distribution companies are now required to source 50% of their supplied electricity
from RE sources. The legislations stress the regulatory institutions’ ambitions to reach the set targets within the next couple of years.
The Energising Access to Sustainable Energy (EASE) aims to improve framework conditions for renewable energy and energy efficiency for in particular the use of renewable energies by households and small and medium enterprises. The programme will be run in a partnership with the World Bank (contributing €4.6 million) and the GIZ (Deutsche Gesellschaft für Internationale Zusammenarbeit) (contributing €9 million). The programme includes the design of energy strategies to increase energy access and the development of business plans to demonstrate commercial viability of certain resources.
The government of Nigeria has laid out the National Renewable Energy and Energy Efficiency policy in 2015, aiming to provide a comprehensive framework for the development and exploitation of renewable energy sources. Solar energy is projected to grow on the medium term (2020) to 1,343.17 MW and on the long term (2030) to 6.830,97 MW.
Image: Rural Reporters

Facts & Figures SOLAR Energy
21
Charge by DISCOs NGN // USD (per kWh)
Yola Ibadan Kano Enugu
R2 (residential) R2A: 23.25 // 0.0744
R2B: 24.75 // 0.0792
23.09 // 0.073888
R2A: 20.26 // 0.064832
27.13 // 0.086816
C2 (commercial) 43.78 // 0.140096
38.87 // 0.124384
36.25 // 0.116 42.40 // 0.13568
Table 4.3: Electricity tariff for residential and commercial consumption in Nigeria
Electricity tariffs
Nigeria’s tariff level is determined under a Multi-year Tariff Order (MYTO). The latest MYTO was put in place for the period of 1 April 2015 to December 2018. The biggest change in the new MYTO was the abolition of fixed costs for both residential and commercial consumers. Despite the abolition of fixed costs, Nigerian residents and companies cannot fully enjoy the economic ease as rates increased significantly per kWh. The raise in tariffs have enraged many Nigerian citizens in light of the intermittent energy supply and the outdated infrastructure. The Minister of Power explained that the increase in tariffs will boost investment in the sector and investment would drive down electricity prices on the long-term. The tariffs for both residential
and commercial consumption for four Distribution companies (DISCOs) across Nigeria are shown in Table 4.3.
Solar PV
On-grid
No utility scale power plants are connected to the grid so far. There are however some small scale projects in the pipeline and expected to go ahead later this year. For example the 0.4 MW solar PV installation at the Noodle Factory in Kaduna, aimed to lower the costs of the current diesel operation. Several companies have pledged to invest a total sum of above 5 GW in solar PV projects for the coming 2-5 years (Table 4.4).
Company Capacity Type Description
People’s Home Association
500 MW Utility-Scale Consists of five 100 MW projects
Solar Force Nigeria Limited
200 MW Microgrid Consists of 1 MW projects in villages all across Nigeria

Facts & Figures SOLAR Energy
22
Table 4.4: A list of the largest solar projects pledged by private companies
In addition to these pledges, the government-owned energy purchasing company Nigerian Bulk Electricity Trading (NBET) recently signed the first ever solar power purchase agreements (PPAs) in Nigeria, totalling 975 MW of solar PV with 12 producers.
The announced PPA’s of close to 1000 MW have given other companies reason to see the huge solar potential in Nigeria. Engineering and Procurement Company Sterling and Wilson have announced that they are aiming to increase their African market by constructing grid-connected projects totalling 250 MW. In the meanwhile, Nigus Greenenergy and Volt Renewables have signed a MoU with the Nigerian government for the development of 300 MW solar PV capacity in the next 3 years.
This information reveals there is without doubt a big interest from investors and developers to look at opportunities for large-scale solar PV projects. Especially in the northern part of the country, where radiation is highest.
Microgrid
The current generation of solar PV in Nigeria is 15 MW, which consists only of micro and off-grid solutions, as no utility-scale project is connected to the grid yet. Still the need to power the rural and remote areas of Nigeria has given birth to several Microgrid solar PV projects. The National Agency for Science and Engineering Infrastructure (NASENI) has established a solar panel manufacturing plant that produces solar panels at an annual capacity of 7.5 MW. The production plant has been in operation since September, 2011, and sells to the Nigerian market as well as the rest of the West-African solar market.
One project, initiated by Schneider Electric SE, was among five projects that were awarded for outstanding solar projects that help communities through their social impact. The project entailed the electrification of 170 schools, with 190,000 students, and 11 public health
Company Capacity Type Description
Solius NGC 300 MW Unknown Solius has also announced it will set up a training centre for power sector profes-sionals
SkyPower FAS En-ergy
3 GW Utility-Scale The combination of projects amount to 5 billion USD worth of investments, and will provide 30,000 green jobs
New Generation Power Chicago; Motir Seaspire
1.2 GW Utility-Scale Signed agreements together with Motir Seaspire and the Nigerian government. The projects will amount to 2 billion USD worth of investments.

Facts & Figures SOLAR Energy
23
centers, servicing 4.7 million patients. Furthermore, the project also saved the schools and hospitals a total of 1 million USD per year in diesel costs, benefiting the community with over 3000 jobs.
Off-grid
The rural electrification rate in Nigeria is at a comparably low level, only 34% of the rural population had access to electricity as of 2012. Because grid extension on a large scale takes a long time, opportunities for utility-scale projects in rural areas are limited. This opens doors for off-grid solutions, however.
The unreliable main grid power supply and costly petrol power generators, have given birth to an interesting initiative in Nigeria’s rural communities. Arnergy, a lagos-based renewable energy company is providing pay-as-you-go services for people without any or without sufficient access to electricity. The company charges customers only for the energy that has been used on a daily or a monthly basis. Customers with internet access can purchase energy units via Arnergy’s app, Rana and customers without access to the internet through distribution agents called “Solar angels”.
There are also other more integrated approaches for PV systems taking place in different areas. Polio has not been eradicated in Nigeria yet, as vaccines have for a long time not been available to the public. The vaccines needed for the eradication must be kept at low temperatures at all times, so they must be stored in refrigerators. But
in rural Nigeria there is often no grid to connect the refrigerators to, which posed a serious problem in removing the disease. A solution was needed to keep the vaccines, needed for the eradication program, at low temperatures during the day and night. KXN Nigeria knew that vaccine refrigerators powered by solar PV could provide 24 hour reliability. With external funding, they had installed above 750 refrigerators against the price of 11,000 USD each. This illustrates how companies can provide off-grid solutions where infrastructure is lacking in rural areas.
Extra: Key challenges and opportunities
One of the main challenges Nigeria faces is the foreign investors’ lack of trust in the country’s currency. Nigeria, a country that is predominantly reliant on its exported oil, is experiencing the consequences of falling oil prices. Even though it only accounts for 10% of Nigeria’s total export, exports from oil account for 70% of total export revenue and 95% of the government’s revenues. Nigeria’s president refused to devalue the national currency (naira), however foreign investors still fear
Image: Greentech Lead

Facts & Figures SOLAR Energy
24
that an investment made into PV plants could diminish as the naira decreases in value when the currency is inevitably devalued.
Investors, however, are not safe even when they have already decided to make an investment in the country. A recent study investigated why many solar power projects failed to develop. The study’s leader, Eugene Ikejemba who is an engineering PhD student at the university of Twente in the Netherlands, identified two main reasons for the failure of solar projects. The first reason was that governments and agencies, who were in charge of implementing the projects, often failed to provide essential expertise for the project’s planning. The project planners only think of solar projects as “finding an empty plot of land and implementing a project” said Ikejemba while the management of the projects after its completion is often neglected. The other reason for the solar projects’ failure is that governments did not provide long-term regulation and support for the import and installation of solar panels.
One of the main opportunities in Nigeria for solar projects come from Nigeria’s poor energy infrastructure. Out of the 13 MW which is the total installed power capacity of Nigeria, the transmission system is on only available to deliver about 6 MW of energy to consumers. Furthermore, the transmission system in Nigeria is mostly radial meaning that there is a single path for transmission from the energy source. As a result, the smallest fault in this system could
translate into the collapse of the entire transmission network. Such an event occurred in 2016 on the 31st of March when no electricity was produced for three whole hours in the country. These aspects coupled with the poor electrification of rural areas provide an excellent opportunity for solar power in off-grid and mini-grid applications.
Another aspect that could give rise to the implementation of solar power in the near future comes from the problem of liquidity in Nigeria’s energy sector. The Distribution Companies (DISCOs) at the end of the supply chain were unable to collect revenues which hurt the other members of the supply chain such as Generation Companies (GENCOs), gas suppliers and service providers. This event led to a cash crunch and has clearly cast doubt on future investments from DISCOs. On the other hand, this opens another big opportunity for solar power in its micro-grid and off-grid applications. As some industries require uninterrupted power supply and are more reliable in terms of paying, there is potential for industrial clusters and small cottage industries to develop around fully off-grid power sources.
Image: Nigeria Today

Facts & Figures SOLAR Energy
25
5. Cameroon
Introduction
Cameroon is estimated to have around 24 million inhabitants and a GDP per capita of 1,250 USD (Table 5.1). Still the access of electricity in 2015 only amounted to 55% (Table 5.1) with rural regions as low as 20%. Cameroon has the second most abundant hydroelectricity potential on the continent and it already accounts to more than two-thirds of its total energy production (Figure 5.2). The grid infrastructure is in poor conditions and hydroelectricity is subject to the water level fluctuations which brought officials attention to a more steady energy source: solar power. Besides the expansion of hydroelectricity, Cameroon is also implementing regulations that will favor the use of solar energy. Cameroon offers very favourable conditions for solar PV systems especially in its Northern regions where irradiation levels can reach up to 5.8 kWh/day/m2 (Figure 5.1).
Figure 5.1: Annual solar irradiation map of Came-roon.
Economical figures
GDP (2015) 29,198,370,000 USD
GDP per capita (2015, USD) 1,250.8 USD
GDP Growth ('13, '14, ‘15) 5.56% +5.93% +6.24%
Inflation Rate - Consumer Prices (2015) 2.7%
Inflation Rate - GDP deflator (2015) 2.6%
Population (2015) 23,344,000
Credit Rating (S&P/Moody’s) B, B2
Corruption Perceptions Index (CPI 2015) 27 (0 highly corrupt - 100 very clean)
Table 5.1: Economical figures and key stakeholders of Cameroon.

Facts & Figures SOLAR Energy
26
Economical figures
Ease of doing business index (2015) 172 (1 best - 189 worst)
Access to electricity (2015) 55%
• Power consumption per capita in kWh 278
• Renewable electricity as % of total output (2012) 73.4%
• Renewable consumption (% of total consumption, 2012)
78.1%
Noteworthy solar projects
Name Capacity Location Status Developer
JCM Greenquest
72MW Mbalmayo, Cameroon
Approved grant to finance
JCM Greenquest Solar Corporation
Table 5.2: Noteworthy solar projects in Cameroon.
Figure 5.2: Total electricity production and final consumption of Cameroon
Key Stakeholders
Energy regulator • Ministère de l’Energie et de l”Eau (MINEE)• Electricity Sector Regulatory Agency (ARSEL)• Rural Electrification Agency (AER)
Utilities • ENEO Cameroun (56% held by Actis)
Top Banks • AfriLand First Bank• ACEP Cameroun• Alios Finance Cameroun

Facts & Figures SOLAR Energy
27
The country of Cameroon produces approximately 1475 MW of electricity. Out of the total energy produced, hydroelectricity is the most popular one amounting to more than 70% of the total production. The two main hydro stations of the country are both located on the Sananga river. Due to cameroon’s high dependence on hydro energy and the hydro stations dependency on the same river, the country is heavily affected by droughts and water level fluctuations. The other prevalent source of energy is fossil fuel - which manifests itself in the form of approximately 30 aging diesel power stations serving as a backup solution.
Regulatory framework
Under the long-term energy sector development plan (PDSE 2030) and the poverty reduction strategy paper (PRSP) the country is seeking to leave its under-developed status behind. To achieve this, investment in energy sector is inevitable. Cameroon is also heavily expanding towards renewable energy sources to diversify its energy portfolio. These ambitions are aided by the objectives laid down under the Vision 2035. The policy aims to increase production and deliver electricity with an emphasis on renewable energy. Besides this policy Cameroon is creating a new legal framework for the promotion of renewable energy. The framework will cover promotional, legal and financial operation matters of the implementation of renewable energy sources. Even though the setting up of such framework is in its initial phases, David Payang of the
Ministry of Environment has confirmed that a committee is now in place to write a draft law.
In 2011, the Ministry of Finance exempted solar panels from value-added tax. This exemption will ease solar power consumers of 19.25% of their tax and has contributed significantly to the expansion of solar systems in the Cameroonian residential area. According to the Ministry of Mines, Water and Energy, over 12 per cent of Cameroon homes run on solar energy predominantly in the urban areas.
Cameroon also puts a big emphasis on the electrification of its rural areas in its Rural Electrification Master Plan. The aim of this initiative is to provide 660 localities through the extension of interconnected grids and rehabilitation of already existing energy sources. By 2020, the government aspires to reach electrification rates of 48% countrywide, with 75% electrification in urban areas and 20% in rural ones.
Image: Sandel Environment

Facts & Figures SOLAR Energy
28
Electricity tariffs
Category Range USD/kWh
LV <110 kWh 0.0896
>801 kWh 0.168
Public Lighting Independently of range 0.112
MV Normal hours 0-200 hours 0.1232
>401 hours 0.1008
Peak hours Independently of range 0.1456
HV Negotiate on case by case bas
Table 5.3: Electricity tariffs for different voltage levels in Cameroon
Solar PV
On-grid
There are currently no utility scale PV projects in Cameroon.The source of energy production has been mainly hydroelectricity for the past decades. Besides hydroelectricity, Cameroon also relies on energy produced from fossil fuels, however, due to the expensive nature of this solution it is only used in emergencies. But solar solutions are gaining attention.
A French company, Generale du Solaire, together with an investment fund, Aborescence Capital have signed a memorandum of understanding to build a number of solar PV plants totaling to 300MW. The plants, when ready, are expected to produce 32 GWh of energy per year and will peak when energy from hydroelectric is at the lowest. The first part of the plan will be built in the Adamaoua region, northern Cameroon
where irradiation levels are the highest in the country reaching to 5.8 kWh/m2/day.
Joule Africa signed a memorandum of understanding to build 100MW solar power plant in the northern regions of Cameroon. The project is aimed to boost Cameroon’s energy production capacity by 15%.
JCM Greenquest Solar Corporation, the Cameroonian offshoot of Canadian JCM Capital together with African Development Bank (AfDB) approved a 770,000 USD preparation grant to pave the way for the country’s first independent power producer (IPP). The grant will facilitate the construction of a 72 MW solar plant in Cameroon.
South African company, GSC Ltd. started a project aiming to construct solar power plants adding up to 500 MW after several feasibility studies.

Facts & Figures SOLAR Energy
29
The project was estimated to require 18 months and a total of 2.2 billion USD for completion. The project had allegedly secured 80% of the necessary funding through South Korean business conglomerate Hanwha group, and Irish solar developer Investricity. PV systems, as part of the project, have already been installed southern cities of Sangmelima, Meyomessala, Mengong Benbgis, the northern city of Maroua and the coastal city of Yingui
Microgrid
Singyes solar, a China-based solar power technology firm, completed and passed inspection of its first smart-microgrid project. The project entailed the construction of a system that provides electricity for the lighting project of the presidential palace with a total capacity of 50kVA.
Off-grid
A recent study conducted by the university of Dschang, Cameroon investigated the feasibility of off-grid solar, hydro and biogas electricity supply systems. PV systems were concluded to be among the most economical options for villages located in the Northern regions of the country providing at least 6.21kWh/m²/day. The solutions investigated were shown to outperform grid extensions for distances greater than 33.5km and 9km with energy costs of 0.527 €/kWh and 0.215€/kWh respectively.
PowerOak, a Dutch company specializing
in off-grid power supply solutions, is providing Cameroonian locals with 10KW three-phase distributed off-grid solar power generators in Cameroon. This initiative can help the spread of commercial solar power generators electrifying remote areas.
Yandalux, a Hamburg-based solar PV plant developer, installed a 10kW off-grid PV system at the Foyer du Marin in the port city in Douala, Cameroon. The system consists PV generators, batteries and a diesel generator and is expected to cover a quarter of the cities energy demand.
Extra
One of the main challenges Cameroon is facing lays in the discontinuity of its national grid infrastructure. This issue prevents the transfer of power among the three separate grids: the Northern Interconnected Grid (NIG), the Eastern Isolated Grid (EIG) and the Southern Interconnected Grid (SIG) (Figure 5.3). As a result, solar micro-grid and off-grid solutions can be huge factors in Cameroon’s electrification ambitions.
Image: Now How Africa

Facts & Figures SOLAR Energy
30
Figure 5.3: Main transport grids in Cameroon.
The unreliability of hydroelectricity in the wake of climate change and the general tendency to promote solar energy in Cameroon has pushed to government to seek viable solutions. One possible solution to these issues is the
initiative for Cameroon’s locally trained technicians. The university of Yaounde is offering courses to train engineers who can extend this form of sustainable energy throughout the country.

Facts & Figures SOLAR Energy
31
6. Ethiopia
Introduction
Ethiopia is among Africa’s fastest growing nations, boasting an impressive average GDP growth rate of 10.5% over the past 10 years (Table 6.1). In addition, Ethiopia is home to over 99 million people (Table 6.1), which makes it the second most populous country in Africa, behind Nigeria. Despite its recent progress, however, Ethiopia remains one of the poorest African states with a GDP per capita of barely 619.10 USD (Table 6.1). The development of Ethiopia’s renewable energy sector has been one of the leading drivers of economic growth in the country. The bulk of the country’s 2.26 GW energy generation capacity comes from hydroelectricity, which accounts for 86% of the country’s total capacity (Figure 6.2). The government of Ethiopia considers private investment in its renewable energy sector as critical for the success of its ambitious Growth and Transformation Plan (GTP), which aims
Figure 6.1:Global horizontal irradiation of Ethiopia
Economical figures
GDP (2015) 61,537,140,000 USD
GDP per capita (2015, USD) 619.1 USD
GDP Growth ('13, '14, ‘15) +10.6% +10.3% +9.61%
Inflation Rate - Consumer Prices (2015) 10.1%
Inflation Rate - GDP deflator (2015) 6.4%
Population (2015) 99,391,000
Credit Rating (S&P/Moody’s) B, B1
Corruption Perceptions Index (CPI 2015) 33 (0 highly corrupt - 100 very clean)
Table 6.1: Economical figures and key stakeholders in Ethiopia
to reshape the country into a middle-income state by 2025. Considering the high amount of solar irradiation Ethiopia receives, averaging at 5.2 kWh/m2/day (Figure 6.1), the development of solar PV projects in Ethiopia is an extremely lucrative opportunity for investors.

Facts & Figures SOLAR Energy
32
Economical figures
Ease of doing business index (2015) 146 (1 best - 189 worst)
Access to electricity (2015) 26.6%
• Power consumption per capita in kWh 65
• Renewable electricity as % of total output (2012) 99.0%
• Renewable consumption (% of total consumption, 2012)
93.5%
Noteworthy solar projects
Name Capacity Location Status Developer
Unknown 20MW Addis Ababa, Ethiopia
Commissioned Sky Energy International and Metals and Engineering Corporation (METEC)
Table 5.2: Noteworthy solar projects in Cameroon.
Figure 6.2: Total electricity production and final consumption of Ethiopia
Key Stakeholders
Energy regulator • Ministry of Water and Energy (MWE)• Ethiopia Energy Agency (EEA)
Utilities • Ethiopian Electric Power Corporation (EEPCO)
Top Banks • Dashen Bank• Cooperative Bank of Oromia• Bank of Abyssinia
Facts & Figures SOLAR Energy
33
Ethiopia’s total energy production amounts to 2.26 GW. An overwhelming amount of the country’s energy generation capacity, 86%, comes from its hydropower plants (Figure 6.2), which harness Ethiopia’s extensive river system. Currently in development are several ambitious hydropower plants, the most notable ones being Gibe III, Adama II, and the Grand Ethiopian Renaissance Dam, which would collectively provide 8,060 MW of capacity. Wind power accounts for 8% of Ethiopia’s energy generation capacity (Figure 6.2), with the Adama wind farm providing 153 MW of capacity. Fossil fuels account for less than 4% of Ethiopia’s energy generation capacity (Figure 6.2), mainly in the form of gas turbines.
Regulatory framework
The Ethiopian government’s Growth and Transformation Plan includes very ambitious targets for 2020, including increasing energy generation capacity from 2.26 GW to 17,34 GW and increasing the country’s electricity service coverage from 60% to 90%. The government acknowledges that private investment will be pivotal in the
achievement of these goals, and they’ve made significant progress to encourage foreign direct investment in Ethiopia’s renewable energy sector. In 2012 the government amended its investment proclamation to include provisions for the establishment of development zones with tax, investment, and infrastructure incentives. in 2014 the government passed Proclamation 810/2013, a law focusing extensively on the proliferation of independent Purchasing Power Agreements, the development of off-grid systems, and the enactment of more efficient on-grid management policies.
The most significant foreign energy partner in Ethiopia is the Power Africa initiative. It was launched by the United States in 2013 with the goal of establishing 30,000 MW of energy generation capacity across sub-Saharan Africa. Another significant international initiative is the Eastern Africa Power Pool (EAPP). Based in Ethiopia, the EAPP facilitates cross-border grid connections and mandates the establishment of common codes and standards.
Electricity tariffs

Facts & Figures SOLAR Energy
34
No. Tariff Category Monthly (Consump-tion kWh)
Rate (BR per kWh // USD per kwH)
1.1.1 Domestic
Equivalent Flat Rate 0.4735 // 0.021338441
First Block 01-50 kWh 0.2730 // 0.012302839
Second Block 51-100 kWh 0.3564 // 0.016061289
Third Block 101-200 kWh 0.4993 // 0.022501127
Fourth Block 201-300 kWh 0.5500 // 0.02478594
Fifth Block 301-400 kWh 0.5666 // 0.025534024
Sixth Block 401-500 kWh 0.5880 // 0.026498423
Seventh Block above 500 kWh 0.6943 // 0.031288869
1.1.2 General (Commercial)
Equivalent Flat Rate 0.6723 // 0.030297431
First Block First 50 kWh 0.6088 // 0.027435782
Second Block Above 50 kWh 0.6943 // 0.031288869
1.1.3 Low Voltage (380 V) Industrial Tariff
Equivalent Flat Rate 0.5578 // 0.025137449
Peak 0.7426 // 0.033465525
Off-Peak 0.5435 // 0.024493015
1.1.4 Medium Voltage (15 or 33 kV )Industrial Tariff
Equivalent Flat Rate 0.4086 // 0.0184137
Peak 0.5085 // 0.022915728
Off-Peak 0.3933 // 0.0177242
1.1.5 Medium Voltage (15 or 33 kV )Industrial Tariff
Equivalent Flat Rate 0.3805 // 0.01714736
Peak 0.4736 // 0.021342947
Off-Peak 0.3664 // 0.016511942
1.1.6 Street Light Tariff
Equivalent Flat Rate 0.4843 // 0.021825146
Table 6.3: Electricity tariff for domestic and commercial consumption in Ethiopia

Facts & Figures SOLAR Energy
35
Solar PV
On-grid
Currently there are no utility-scale solar PV projects in Ethiopia. Since an overwhelming part of the country’s power is generated through hydropower plants, the solar energy sector in Ethiopia is still in its earliest stages of development.
Recently, the Ethiopian government signed a memorandum of understanding with the US-based Green Technology Africa for the development of utility-scale grid-connected solar PV plants with a total capacity of 300 MW.
Microgrid
German-based SMA Solar Technology has invested in the creation and installation of small PV systems to power hospital wards across Ethiopia. The system consists of 100 solar panels with an individual capacity of 1.5 kW.
Off-grid
Small photovoltaic home systems, offered by the Solar Energy Foundation, with rechargeable batteries could provide regular lighting and even power radios and televisions. The Ethiopian initiative installed the first batch of systems free of charge, but additional units are funded through a loan with affordable monthly payments.
Estimates from Ethio Resource Group put the sum of off-grid solar PV capacity
in Ethiopia state at 5.3 MW. More than 87% of this capacity is used to power telecom systems, both landline and mobile network stations. This percentage is expected to increase further due to the Ethiopian government’s pursuit of universal mobile access throughout the country.
Extra: Challenges and Opportunities
Ethiopia’s potential for solar PV projects is immense. Considering the country’s high levels of solar irradiation, which averages around 5.2 kWh/m2/day, utility-scale PV power plants would benefit greatly from a dramatically increased level of output. This is especially valid for the eastern and northern parts of the country, where irradiation levels can reach as high as 6.25 kWh/m2/day.
Due to Ethiopia’s lack of operational utility-scale solar PV plants, there is ample opportunity for entrepreneurial firms to enter this new market in its earliest stages of development. The government of Ethiopia is actively
Image: Green Technology Africa

Facts & Figures SOLAR Energy
36
encouraging foreign direct investment, especially directed towards the development of the country’s young solar energy sector.
Of course, despite Ethiopia’s enormous energy potential, the country continues to be plagued by challenges to its development. Although huge progress has been made in the national electrification rate, which has more than doubled over the past ten years, it
still remains at a low 26%. The national electricity grid uses outdated loss-prone technology. In addition, the majority of Ethiopia’s population lives in rural areas without a functional grid connection. Although this is a great opportunity for the development of off-grid or microgrid solar solutions, Ethiopia’s decentralized population and insufficient power grid present serious developmental challenges for utility-scale.

Facts & Figures SOLAR Energy
37
7. Ghana
Introduction
Despite being one of the smaller African countries, Ghana has shown immense economic progress over the past 25 years. The combination of progressive government policies and sustained efforts to alleviate poverty have fostered a strong private sector in Ghana, which is home to over 27 million people (Table 7.1). Nevertheless, Ghana remains plagued by frequent power outages and an inadequate power supply. In addition, only 52% of rural areas have access to electricity, a figure which leaves a lot of room for improvement. The government has made efforts to encourage foreign direct investment in the country, and it has recognized that the proliferation of renewable energy, particularly off-grid solutions, will be a key driver for Ghana’s goal of universal electrification. The development of solar PV systems in Ghana presents a significant opportunity for investors; the country’s solar irradiation rate ranges between 4.4 - 5.6 kWh/m2/day (Figure 7.1), while the government’s incentives for
Figure 7.1: Global horizontal irradiation map of Ghana
Economical figures
GDP (2015) 37,864,370,000 USD
GDP per capita (2015, USD) 1,381.4 USD
GDP Growth ('13, '14, ‘15) +7.3% +3.99% +3.88%
Inflation Rate - Consumer Prices (2015) 17.1%
Inflation Rate - GDP deflator (2015) 18.8%
Population (2015) 27,410,000
Table 7.1: Economical figures and key stakeholders in Ghana
the development of renewable energy present investors with a significant cushion against risk.

Facts & Figures SOLAR Energy
38
Noteworthy solar projects
Name Capacity Location Status Developer
Unknown 20 MW (40 MW planned)
Accra, Ghana Connected to grid Beijing Xiaocheng Company
Unknown 100 MW Nyimbale-Sankan, Ghana
Approaching financial closure
Home Energy Africa
Table 5.2: Noteworthy solar projects in Cameroon.
Figure 7.2: Total energy production and total energy consumption in Ghana
Key Stakeholders
Energy regulator • Ministry of Energy• Public Utility Regulatory Commission (PERC)
Utilities • Energy Commission
Top Banks • Barclays Bank of Ghana• Fidelity Bank• Ecobank Ghana
Economical figures
Credit Rating (S&P/Moody’s) B-, B3
Corruption Perceptions Index (CPI 2015) 47 (0 highly corrupt - 100 very clean)
Ease of doing business index (2015) 114 (1 best - 189 worst)
Access to electricity (2015) 80%
• Power consumption per capita in kWh 382
• Renewable electricity as % of total output (2012) 67.10%
• Renewable consumption (% of total consumption, 2012)
49.5%

Facts & Figures SOLAR Energy
39
The majority of Ghana’s electrical generation capacity comes from the country’s three large hydropower plants, Akosombo, Bui, and Kpong, which collectively represent 1,598 MW or 64% of capacity. The remainder of Ghana’s electrical generation capacity comes from fossil fuels, with oil and gas accounting for 25.6% and 10.4% respectively (Figure 7.2). In total, Ghana’s electrical generation capacity is 2,450 MW.
Regulatory framework
Recent claims were made by the Minister of Power, that the number of residents having access to electricity had gone up to 80% by the end of 2015, which is very close to South Africa’s electricity access. However, rural areas, especially in the Northern region, are still struggling to connect to the grid. This is why the Ministry of Energy has lately put an emphasis on the electrification of rural areas, in particularly by constructing large scale (renewable) utility projects.
Ghana’s currently energy policy aims to have 10% of electricity consumption stem from renewable energy by the end of 2020. The current share of renewable energy in electricity consumption is below 2%, and the government has recognized the importance of working on this issue. The Nzema Power Station is the country’s first major venture into solar energy. With a capacity of 155 MW, the power plant is expected to be commissioned in late 2016.
The National Electrification
Scheme (NES) has been a successful governmental program in greatly increasing the population’s electricity access. Constituted in 1989, its goal is to extend the grid throughout the country by 2020. Because of the success of the program, there is little room for off-grid systems. Parts of the country that are not connected to the grid yet are convinced they will be soon, making it less attractive for these regions to invest big in micro or off-grid energy supplies.
Ghana has developed an RE policy, which is stated in the Renewable Energy Act of 2011. One of the key provisions of the act is that an RE fund is introduced as an incentive for the promotion of RE generation. Since the establishing of the policy, progress has been made in the field of solar energy. This is also due to the feed-in-tariff that has been made for utility scale grid interconnection.
Electricity tariffs
Image: PRLOG

Facts & Figures SOLAR Energy
40
Electricity tariffs effective from 1 October 2014, Gp (Ghana pesewas, Ghana Cedi (GHS); GHS 1 = Gp 100; 1 USD = 399.99 Gp)
Charges (Gp per kWh // USD per kWh)
Non-residential 0-300 kWh 59.24 // 0.14
301-600 kWh 63.04 // 0.15
601+ kWh 99.47 // 0.24
Monthly service charge 645.88 // 1.61
Residential 0-50 kWh 20.54 // 0.05
51-300 kWh 41.21 // 0.10
301-600 kWh 53.48 // 0.13
601+ kWh 59.42 // 0.14
Monthly service charge 387.53 // 0.96
Table 7.3: Electricity tariff for residential and non-residential consumption in Ghana
Solar PV
On-grid
Operational:Nzema Solar Power Station: The largest solar PV plant in Africa is now under construction in the western region of Ghana. The plant, being built by Blue Energy will have an installed capacity of 155 MW. The plant is expected to go online in October this year.
Gomoa Onyandze: Currently the largest operational plant in Ghana, located in Onyandze, Gomoa East. The plant is built by BXC Ghana, a subsidiary from BXC China. The project required a 30 million USD investment and commenced operations in earlier this year.
Navrongo Solar Power Station: The first utility-scale PV project in Ghana. With an installed capacity of 2 MW and a required investment of 8 million USD, it
was one of the first efforts to achieve the target to have an energy mix with 10% renewables by 2020. The plant became operational in 2013.
Microgrid
Black Star Energy Limited, a Ghanaian subsidiary of Energicity Corp, is providing a financially viable alternative to expensive fossil fuel sources in Affulkrom, Ghana. Offering energy through mini-grids, the company is able to support a wide range of customer needs — from the use of fans, TV’s, refrigerators, and sewing machines, to powering commercial refrigeration, restaurants and bars, health clinics, schools, grain mills and cold storage.
Another initiative was launched by the government to electrify rural areas in Accra, Ghana. The aim of the initiative is to ensure universal access to electricity, energy security and job creation. With

Facts & Figures SOLAR Energy
41
the support of World Bank, there are currently between 5 to 7 mini-grid schemes are under development.
Off-grid
It is estimated that 4,000 off-grid solar systems have been distributed in Ghana. Accra-based developer Strategic Power Solutions (SPS) has launched a new PV module manufacturing plant following a 50 million USD investment in Kpone, a commercial hub just outside the country’s capital. SPS is a subsidiary of Strategic Security Systems International (3SIL), an independent Ghanaian conglomerate specialising in the procurement of solar products. According to numerous reports, SPS’ motivation for the project included a desire to make Ghana more independent with its energy and provide
a clean and stable solution to the national grid. Ghana’s first ever PV manufacturing plant will mainly produce crystalline PV modules at a rate of 30MW a year.
Extra
The macroeconomic climate in Ghana is extremely favorable for foreign investors. Considering Ghana’s long-lasting economic and political stability and the significant financial and bureaucratic incentives mandated by the government, Ghana presents an investment opportunity of a quality rivalling South Africa. A testament to Ghana’s immense progress in the energy sector is the fact that its national electrification rate is the second highest among all sub-Saharan countries.

Facts & Figures SOLAR Energy
42
8. Rwanda
Introduction
Rwanda is a country endowed with plentiful natural resources. Despite its large reserves of methane gas, large river systems and high levels of solar irradiation, Rwanda’s electric generation capacity amounts to barely 186 MW, spread out among its 10.5 million residents (Table 8.1). The majority of Rwanda’s electric generation capacity come from hydroelectric power plants. Rwanda’s 26,338 km2 land area makes it one of the smallest nations in mainland Africa. Consequently it’s population density is among the highest, with the majority of its population living in rural areas and surviving on subsistence agriculture. While only 24.5% of Rwanda’s population has access to electricity (Table 8.1), the country’s
location just a few degrees south of the Equator makes it a prime candidate for the development of solar PV plants.
Figure 8.1: Global horizontal irradiation map of Rwanda.
Economical figures
GDP (2015) 8,095,980,000 USD
GDP per capita (2015, USD) 697.3 USD
GDP Growth ('13, '14, ‘15) +4.68% +7.01% +6.9%
Inflation Rate - Consumer Prices (2015) 2.5%
Inflation Rate - GDP deflator (2015) 1.2%
Population (2015) 11,610,000
Credit Rating (S&P/Moody’s) B+, B2
Corruption Perceptions Index (CPI 2015) 54 (0 highly corrupt - 100 very clean)
Ease of doing business index (2015) 62 (1 best - 189 worst)
Table 8.1: Economical figures and key stakeholders of Rwanda.

Facts & Figures SOLAR Energy
43
Economical figures
Access to electricity (2015) 42.5%
• Power consumption per capita in kWh -
• Renewable electricity as % of total output (2012) 43.3%
• Renewable consumption (% of total consumption, 2012)
86.8%
Noteworthy solar projects
Name Capacity Location Status Developer
Rwamagana Solar Power Station
8.5MW Kigali, Rwanda Commissioned Gigawatt Global
Table 8.2: Noteworthy solar projects in Rwanda.
Figure 8.2: Total energy production (2013) and total energy consumption in Rwanda.
Key Stakeholders
Energy regulator • Ministry of Infrastructure• Rwanda Utilities Regulatory Agency (RURA)
Utilities • Energy, Water and Sanitation Authority
Top Banks • Access Bank Rwanda• Bank of Kigali• Commercial Bank of Rwanda

Facts & Figures SOLAR Energy
44
Rwanda’s total electrical generation capacity amounts to 186 MW, 59% of which comes from the country’s 7 largest hydroelectric power plants (Figure 8.2). Thermal power generation, mostly from diesel and heavy oil fuel, account for the remaining 40% of electrical generation capacity, with methane gas representing barely 1% of total capacity (Figure 8.2). Rwanda’s national electrification rate sits at 24.5%, which 23% coming from on-grid systems and only 1.5% coming from off-grid-systems. This leaves over several million of the country’s residents without access to electricity and ranks Rwanda among the countries with the least annual electricity consumption per capita.
Regulatory framework
The government of Rwanda has ambitious goals for the development of its energy sector. Notably, it intends
to expand the country’s electrical generation capacity to 563 MW and to increase the national electrification rate to 70% by 2018. In order to achieve these targets the government has enacted various incentives to encourage private sector investment, like exemption from VAT on imported power equipment, free repatriation of profits, and investment allowance of up to 50%. In an effort to remove regulatory hurdles for investors, in 2014 the government of Rwanda disbanded the previous electric utility and reincorporated it as the Rwanda Energy Group Limited. In 2016 the Rwandan Cabinet approved the Rural Electrification Strategy, in which the Ministry of Infrastructure emphasizes the importance of private sector investment and sets forth clear guidelines for the achievement of the government’s electrification goals.
Electricity tariffs
End-users Electricity tariff in Rwanda (RWF // USD per kWh)
Low Voltage (Industrial) 182 // 0.23
Medium Voltage (All residential and Non residential) 126 // 0.16
Table 8.3: Electricity tariff for residential and non-residential consumption in Rwanda
Solar PV
On-grid
On February 5th, 2015 Rwanda’s first utility-scale solar PV plant was inaugurated. Developed by GigaWatt Rwanda Limited, the solar plant boasts
28,600 panels with a total capacity of 8.58 MW.
Goldsol II is developing a 10 MW solar PV plant in the Kayonza Eastern Province. The plant is estimated to cost 20 million USD.

Facts & Figures SOLAR Energy
45
A 2.4 MW solar PV plant in south-eastern Rwanda is used to power eight secondary schools. Funded partially by the European Union, the power plant is part of a larger program that aims to electrify schools in 27 districts across Rwanda.
Microgrid
The world’s largest off-grid battery system is coming to Rwanda by German commercial system manufacturer Tesvolt. The 2.86 MWh storage system will be connected to a 3.3 MW PV plant as part of an agricultural project. The mini-grid project aims to supply energy during power cuts, which are very common in the region.
The government of Rwanda has pledged to set up 100 solar PV mini-grids in rural areas as part of an effort to mitigate the effects of climate change. Since Rwanda is a country that is very heavily affected by climate change, the country is taking extensive measures to become a developed, climate resilient and low carbon economy by 2050.
Off-grid
According to the Ministry of Infrastructure, off-grid solar solutions are proliferating in Rwanda. The Climate Investment Funds have allocated 50 million USD through the Scaling up Renewable Energy Program to fund the development of off-grid systems in Rwanda.
The private sector is the leading
developer of off-grid solar solutions in Rwanda, the biggest company present in the market being Off Grid Electric. The government of Rwanda mandates strong and explicit support for such private sector initiatives.
Extra
Despite its ambitious goals and the incentives it has enacted, Rwanda faces significant challenges in attracting foreign investors. The most prominent hurdle to such endeavors is currency risk: over the past four years the Rwandan Franc has depreciated by more than 25%, which has cut into the already tight margins of existing energy projects. Nevertheless, Rwanda’s abundant natural resources and growing demand for electricity make the development of renewable energy in the country an investment with large upside potential.
Image: Gigawatt Global

Facts & Figures SOLAR Energy
46
9. Senegal
Introduction
Senegal is part of the Economic Community of West African States and has been praised as one of Africa’s model democracies. As a result of the democratic nature of the country, Senegal bears a relatively stable economy despite high unemployment and widespread poverty. According to World Bank, however, Senegal has been trapped in a low-growth equilibrium since 2006 experiencing lower growth rates than other Sub-Saharan countries. One of the key ways the government is aiming to solve this problem is through the improvement and diversification of the energy sector. As a result, Senegal has passed many legislations promoting the energy sector.The country is very reliant on fossil and hydro energy sources, adding up to more than 90% of the total energy production (Figure 9.2). Since the majority of the country
experiences solar irradiation levels upwards of 5.5 kWh/m2/day (Figure 9.1), solar power will play a huge role in the country’s electrification plan. Several utility-scale solar PV projects have been started in the recent years, as well as mini-grid initiatives aimed to electrify rural regions.
Figure 9.1: Global horizontal irradiation map of Senegal and Gambia.
Economical figures
GDP (2015) 13,779,570,000 USD
GDP per capita (2015, USD) 910.80 USD
GDP Growth ('13, '14, ‘15) +3.49% +4.31% +6.49%
Inflation Rate - Consumer Prices (2015) 0.1%
Inflation Rate - GDP deflator (2015) -1.1%
Population (2015) 15,129,000
Credit Rating (S&P/Moody’s) B+, B1
Corruption Perceptions Index (CPI 2015) 44 (0 highly corrupt - 100 very clean)
Ease of doing business index (2015) 153 (1 best - 189 worst)
Table 9.1: Economical figures and key stakeholders of Senegal.

Facts & Figures SOLAR Energy
47
Economical figures
Access to electricity (2015) 56.5%
• Power consumption per capita in kWh 219
• Renewable electricity as % of total output (2012) 9.8%
• Renewable consumption (% of total consumption, 2012)
51.4%
Noteworthy solar projects
Name Capacity Location Status Developer
Senergy 30MW Méouane, Senega
Starting Construction
Solairedirect and Schneider Electric
Figure 9.2: Noteworthy solar projects in Senegal.
Figure 9.2: Total electricity production and final consumption of Senegal in 2013.
Key Stakeholders
Energy regulator • Inter-Ministerial Committee on Renewable Energy, Ministry of Energy (MoE), Ministry of Renewable Energy (MER)
• Commission de Régulation du Secteur de l’Electricité (CRSE)
Utilities • Société Nationale d’Electricité du Sénégal (SENELEC)
Top Banks • CBAO Groupe Attijariwafa Bank• Société Générale de Banques au Sénégal• Ecobank Sénégal

Facts & Figures SOLAR Energy
48
Senegal has a total electricity generation capacity of 660 MW out of which 444.7 MW are connected to the grid. The country mainly depends on fossil fuels consisting of heavy fuel oil and diesel accounting to 84.3% of the total production (Figure 9.2). These fossil fuel sources also have to be imported which increases electricity tariffs significantly. The other prevalent source of energy is hydroelectricity. The Senegal river, providing a perfect source for hydroelectricity, makes up approximately 10% of the total energy production. The main hydroelectricity plants are Manantali and Felou supplying the region with electricity.
Regulatory framework
Senegal initiated a comprehensive energy development in 1997 through the Lettre de Développement du Secteur de l’Énergie (LPDSE). Over time this letter is revised multiple times, with the latest version published in 2012. The report serves as a point of reference for the government’s task to improve the performance of the energy sector in the medium term. The main points are:
1. Ensuring energy security and increasing the energy access for all
2. Developing a policy mix combining thermal generation, bio-energy, coal, gas, and renewables and seizing the opportunities of regional interconnections
3. Continuing and accelerating the liberalization of the energy sector by encouraging independent production and institutional reform of the sector
4. Improving the competitiveness of the sector in order to lower the cost of energy and reduce sector subsidies
5. Strengthening regulation of the sector
The renewable energy 2010 act consists of several decrees which are updated on an irregular basis. The two most important and recent decree have been added and updated in 2011 and mainly aim to set the conditions for the remuneration of electricity from renewable energy sources.
Decree No. 2011-2013
Lays down the conditions of power purchase and remuneration for renewable energy sources and establishes the conditions of their connection to the gridProvides formula for the avoided cost, serving as a reference for the calculation of the power purchase price cap.Elaborates on the renewable power purchase obligation and feed-in tariff for different renewable energy technologies.
Decree No. 2011-2014
Provides conditions for the power
Image: Little Sun

Facts & Figures SOLAR Energy
49
purchase of surplus renewable energy-based electricity from self-producersFixes the maximum intake from renewable energy sources (variable power)Demands the regulator to propose a purchase price based on several variables
Besides the Renewable Energy Act of 2010, Senegal is also in the process of publishing an additional policy. The policy allegedly includes a target of achieving 10% of the total energy
production from renewable energy by 2020. Although the specific sources of renewables are not specified, it can be assumed that country will not pursue hydroelectricity as this form of energy already accounts for about 10% of the total energy production. Furthermore, the new policy also aims to develop flagship projects, identify sources of funding and improving the already existing legal framework.
Electricity tariffs
Low voltage electricity cost (CFA/kWh // USD/kWh)
one-phase two-phase three-phase
Domestic use
Low power 106,44 // 0.180948 114,20 // 0.19414 117,34 // 0.199478
Medium power 112,96 // 0.192032 115,10 // 0.19567 116,69 // 0.198373
Commercial use
Low power 151,59 // 0.257703 152,45 // 0.259165 153,83 // 0.261511
Medium power 152,72 // 0.259624 153,40 // 0.26078 155,46 // 0.264282
Table 9.3: Low voltage electricity costs for domestic and commercial use in Senegal
Solar PV
On-grid
A joint venture of Senergy, Meridiam and Fonsis Sa (respectively a local energy company, a Fance-based global investor and asset manager and Fonsis Sa, a French investment fund, has started construction of a 30 MW solar PV project. The project location is Méouane, western Senegal and once finished, it will be the biggest solar plant in West Africa. The plant will consist of 96,000 solar
panels and will cost 27 billion CFA (44.8 million USD).
A sequel project named Senergy II started construction in February 2016. The project is part of a bigger project to create a portfolio of 600 MW of renewable energy in Sub-Saharan Africa by 2020. The projects are carried out by a partnership between an African renewable energy company GreenWish and global private equity firm Denham Capital. The solar project will provide 20 MW to the grid and upon completion it

Facts & Figures SOLAR Energy
50
will receive a feed-in tariff which was not revealed by the CEO GreenWish.
Microgrid
This system consists of 18 mini-grids, 16 of which are comprised of a 5 kWp PV array, a 10kVA backup generator and an 800Ah battery bank. All systems are AC-coupled to facilitate expansion and eventual grid connection. Two of the mini-grids deviate from this standard set-up: one additionally has a 5kW wind turbine, and the other has a larger 13.3kWp PV array without a backup generator. The mini-grids supply 18-24 hours per day of electricity to households, businesses and social institutions, none of which were previously electrified. The mini-grids supply an average of 30 clients each.
An interesting initiative aiming to electrify rural regions of Africa was created by SOLAR23 provider of turnkey, grid-connected and off-grid PV systems. The solar PV system was established in 2008 for a rural village of 900 inhabitants in Ndelle, Senegal. The system consists of three PV plants adding up to 8.4 kWp and several high-quality industrial lead acid batteries. In 2012, due to the success of the initiative, it was scaled up by 50% totaling 14 kWp capacity. Based on the good experience in Ndelle SOLAR23 and its local partner ENERGIE-R have electrified more than 100 villages in Senegal. By 2020 the companies aim to scale up to more than 10,000 mini-grids in the Sub-Sahara region.
Off-grid
Akon Lighting Africa is a local project to install independent off-grid solar systems that can directly benefit inhabitants of rural regions in Africa. Besides Senegal, the initiative is present in 15 countries throughout Africa. The initiative comprises of two types of solar PV products: Solar street lights and pre-paid home solar systems. Both products aim to increase safety of rural countries and promote commercial activities during night.
Extra
Senegal is very well endowed with solar irradiation with most parts of the country reaching more than 5.5 kWh/m2/day (Figure 9.1). Despite the potential, solar energy is relatively untapped besides some of the proposed solar plant projects and the recent implementations of mini-grid initiatives.
Image: Ecopreneurist

Facts & Figures SOLAR Energy
51
10. Tanzania
Introduction
Tanzania is the largest country in East Africa and is among the few nations that have not experienced civil war since independence. Due to its political stability it is considered one of the safest African countries for investment. Home to over 55 million people (Table 10.1), Tanzania’s economic landscape is dominated by agriculture, which accounts for 70% of the country’s gross exports and employs 75% of the workforce. Only 30% of the population resides in urban areas, and the national electrification rate is only 24% (Table 10.1). Tanzania’s energy sector makes use of the country’s plentiful rivers, with hydroelectric power plants representing 35% of total energy generation capacity (Figure 10.2). Although the majority of Tanzania’s energy generation comes from fossil fuels, there has been
strong support for the development of renewable energy in the country.
Figure 10.1: Global horizontal irradiation map of Tanzania
Economical figures
GDP (2015) 44,895,390,000 USD
GDP per capita (2015, USD) 864.90 USD
GDP Growth ('13, '14, ‘15) +7.26% +6.97% +6.97%
Inflation Rate - Consumer Prices (2015) 5.6%
Inflation Rate - GDP deflator (2015) 5.2%
Population (2015) 53,470,000
Credit Rating (S&P/Moody’s) not rated
Corruption Perceptions Index (CPI 2015) 30 (0 highly corrupt - 100 very clean)
Ease of doing business index (2015) 139 (1 best - 189 worst)
Table 10.1: Economical Figures and key stakeholders of Tanzania

Facts & Figures SOLAR Energy
52
Economical figures
Access to electricity (2015) 24.0%
• Power consumption per capita in kWh 89
• Renewable electricity as % of total output (2012) 29.2%
• Renewable consumption (% of total consumption, 2012)
88.2%
Noteworthy solar projects
Name Capacity Location Status Developer
unknown 60MW Kigoma Region, northwest Tanzania
Awarded Tender Camco International Limited and Rex Investment Ltd
Table 10.2: Noteworthy solar projects in Tanzania
Figure 10.2: Total energy production and final consumption of Tanzania in 2013
Key Stakeholders
Energy regulator • Ministry of Energy and Minerals• Energy and Water Utilities Regulatory Authority (EWURA)
Utilities • TANESCO and private companies
Top Banks • CRDB BANK• NMB – NATIONAL MICROFINANCE BANK• NBC – NATIONAL BANK OF COMMERCE

Facts & Figures SOLAR Energy
53
Tanzania’s indigenous natural resources are extremely abundant, with an estimated 4.7 GW of hydroelectric capacity, 53.3 trillion cubic feet (TCF) of proven natural gas reserves, and 1,200 million tons of coal. Tanzania also features very favorable conditions for the development of renewable energy: its average wind speed is 10 m/s, and its average solar irradiation is 4.6 kWh/m2/day (Figure 10.1). Despite its huge potential, Tanzania’s electric generation capacity is barely 1.58 GW. The majority of its capacity comes from fossil fuels, 34% from natural gas and 31% from diesel (Figure 10.2). Although Tanzania currently has 6 operational hydroelectric power plants, which collectively represent 35% of the country’s electrical generation capacity, their actual output has significantly diminished due to the droughts that have gripped Tanzania since 2011. There is currently a single wind power station under construction in Tanzania with a capacity of 100 MW. Despite the minimal development of solar and wind energy in Tanzania, the government is continuously seeking to encourage private sector development.
Regulatory framework
Tanzania’s political stability is one of its greatest advantages. The investment climate in Tanzania has been overwhelmingly favorable since 1997, when the government passed the Tanzania Investment Act, which established a governmental organization specifically dedicated to the facilitation of foreign direct investment. The Energy and Water Utilities Regulatory
Authority, established in April 2001, handles policy making and regulation of the electricity industry, and in 2005, the Rural Energy Agency and Rural Energy Fund were established to promote rural electrification. The government of Tanzania laid out comprehensive goals in its National Energy Policy from 2003, the most significant targets are:a reduction in the dependence of the energy sector on fossil fuels;the proliferation of renewable energy, particularly non-hydro alternatives, due to Tanzania’s frequent droughts;achieving 100% national electrification rate by 2030;adding 8,990 MW of electrical generation capacity by 2035.To achieve these goals, Tanzania’s state-owned electric utility company TANESCO has initiated the Tanzania Energy Development and Access Project with funding from the World Bank and the Global Environment Facility. Under this project, the government hopes to attract private sector investment in the development of rural microgrid and off-grid solutions. Since passing the Electricity Act of 2008, Tanzania provides Standardized Power Purchase Agreements to private investors interested in developing small-scale renewable energy projects (between 0.1 MW and 10 MW).
Image: World Bank

Facts & Figures SOLAR Energy
54
Electricity tariffs
Tariff Net tariffs effective from 1 January 2014, TZS // USD
Service charge/month
Energy charge (per kWh)
Maximum demand charge (kVA/month)
D-1 (low usage tariff, average < 75 kWh/month)
– 100 // 0.04At 75+ kWh: 350 // 0.16
–
T-1 (general usage tariff) 5520 // 2.52 306 // 0.14 –
T-2 (general consumption tariff, > 7,500 kWh/metering period)
14233 // 6.50 205 // 0.09 15004 // 6.85
T-3 (medium voltage) 16769 // 7.66 163 // 0.07 13200 // 6.03
T-4 (high voltage) – 159 // 0.07 16550 // 7.56
Table 10.3: Electricity tariffs for different voltage levels in Tanzania.
Solar PV
On-grid
There are currently no utility-scale solar PV projects in Tanzania. There are several large-scale projects in the planning stages (150MW), but a lack of confidence by investors in long term payment from the utility have hampered progress. Although the government has dropped VAT and import duties on solar energy generation equipment, the combination of low tariffs and high currency inflation has continued to push major investors away from utility-scale solar PV development in Tanzania.
Microgrid
In northwestern Tanzania the Jumeme Rural Power Supply company is constructing a 5 MW microgrid that
will power 16 villages. The €17 million project is being financed by the European Commission and the Sustainable Energy Fund for Africa.
Off-grid
More than 500 kW of solar PV capacity have been installed in Tanzania over the past three years. About 30% of this capacity is in the form of solar home systems (10 - 200W).
Sunfunder: Investing and borrowing platform for off-grid solutions.
MobiSol: Delivers prepaid energy to rural residents. There is a 36-month installment plan, during which the system has to be paid off. Systems vary in power from 30W to 200W.
M-Power “Off-grid Electric”: Customers

Facts & Figures SOLAR Energy
55
pay for PV generated electricity by mobile phone.
Tanzania’s government announced in 2015 the launch of its One Million Solar Homes initiative, which plans to provide solar power to a million Tanzanian homes by the end of 2017. The program’s main financiers are the International Finance Corporation, the Overseas Private Investment Corporation, and USAID’s Development Innovation Ventures Program.
Extra
Despite the country’s huge potential, Tanzania’s solar PV industry is still in its earliest phases of development. The government has passed laws to incentivise private investment, but these efforts have still not borne fruit. The biggest challenges for Tanzania are its significantly high inflation, which has devalued the Tanzanian shilling by over 20% over the past year and has made
foreign direct investment unprofitable. The country’s increasing reliance on fossil fuel emergency generators during extended drought periods has been depleting Tanzania’s currency reserves, which contributes to its overall low energy tariffs. With these challenges in mind, the development of solar PV projects in Tanzania can be extremely lucrative for an investor with the right risk appetite, especially considering the favorable regulatory framework and Tanzania’s overall political stability.
Image: Wagner Solar

Facts & Figures SOLAR Energy
56
11. Uganda
Introduction
Uganda has rebounded from a civil war and economic catastrophe to become a relatively peaceful, stable and prosperous country. Despite its stability, the economy continues to be limited by weak exports and a lack of external investments. In 2014, Uganda has experienced significantly weaker GDP growth due to the under-execution of externally financed public investments (Table 11.1). The level of electrification is very low, about 20% of the population has access to the electricity grid. To tackle this issue the government has put in place policies that provide incentive for external investors to invest in Uganda’s energy sector. The country is especially focused on the development of renewable energy sources with its specified feed-in-tariffs system. The country’s development is very skewed towards the Central and Western regions while the other parts of
the country suffers from very high levels of underdevelopment and poverty. The adoption of solar PV technology can especially benefit the poorer regions as annual irradiation levels reach 6.6 kWh/m2/day (Figure 11.1).
Figure 11.1: Global horizontal irradiation map of Uganda.
Economical figures
GDP (2015) 26,369,240,000 USD
GDP per capita (2015, USD) 675.6 USD
GDP Growth ('13, '14, ‘15) +3.27% +4.82% +5.04%
Inflation Rate - Consumer Prices (2015) 5.2%
Inflation Rate - GDP deflator (2015) 3.6%
Population (2015) 39,032,000
Credit Rating (S&P/Moody’s) B, B1
Corruption Perceptions Index (CPI 2015) 25 (0 highly corrupt - 100 very clean)
Ease of doing business index (2015) 122 (1 best - 189 worst)
Table 11.1: Economical figures and key stakeholders of Uganda.

Facts & Figures SOLAR Energy
57
Economical figures
Access to electricity (2015) 20.0%
• Power consumption per capita in kWh -
• Renewable electricity as % of total output (2012) 65.3%
• Renewable consumption (% of total consumption, 2012)
90.3%
Noteworthy solar projects
Name Capacity Location Status Developer
Access Power 10MW Soroti, Uganda To be commissioned Access and Eren Renewable Energy
Figure 11.2: Noteworthy solar projects in Uganda.
Figure 11. 2: Total energy production of Uganda in 2015.
Key Stakeholders
Energy regulator • Ministry of Energy and Mineral Development• The Electricity Regulatory Authority
Utilities • UEGCL (Generation)• UETCL (Transmission)• UEDCL (Distribution)
Top Banks • STANBIC BANK UGANDA• STANDARD CHARTERED BANK UGANDA• CENTENARY BANK

Facts & Figures SOLAR Energy
58
Uganda has one of the lowest electrification per capita in the entire world at around 20%. The electricity generation capacity amounts to 810 MW for almost 40 million people (Table 11.1). The use of hydroelectricity is the most abundant in the country accounting for 80% of total energy production (Figure 11.2). The largest hydroelectricity plant located in Bujagali produces 250MW of the total energy. The country’s huge dependence on hydroelectricity makes it very vulnerable for erratic rainfalls and droughts. The second most important energy production method is the production from diesel fuel accounting for 14% of the total production (Figure 11.2). Uganda has recently increased heavy fuel capacity by the addition of 50 MW worth of fossil fuel plants. Bioenergy, more specifically Bagasse (sugar cane fibre), provides the remaining 6% of Ugandan electricity production (Figure 11.2). This method is especially effective in rural regions where biomass is abundant and other electricity sources are scarce. The two most important bioenergy companies are Kakira Sugar Works (1985) Limited and Kinyara Sugar Limited and both are licensed to generate electricity for the main grid of Uganda.
Regulatory framework
Uganda has in place the Renewable Energy Policy 2007 of which the overarching objective is “to increase the use of modern renewable energy from the current 4% to 61% of the total energy consumption by the year 2017.” The country has established
a Standardized Power Purchase Agreement and Feed-in Tariffs (FiTs) for renewable energy projects, although these are not yet applicable to the Kiziizi mini-grid. Uganda also made solar and hydro renewable energy technologies VAT exempt to incentives the use of such energy sources.
Uganda recently launched the Global Energy Transfer Feed-in Tariff program (GET FiT). The program has been effective since 2013 and aims to address the key barriers private investors are facing in the renewable energy sector. The program brought premium payment mechanisms (a results-based top-up on the existing REFiT). The program also guarantees facilities to secure against off-takers and political risks. Finally, through the program, investors have the opportunity to use private financing mechanisms from Deutsche Bank that will offer debt and equity at competitive rates. The program has approved a total of of 17 projects amounting to 128 MW including Small Hydro, Biomass, Solar PV and Bagasse. As a result of the success of these projects, combined with the global cost reduction of solar PV prices, the European Union offered Uganda
Image: Comboni

Facts & Figures SOLAR Energy
59
Net tariffs per kWh in Q3 2015, UGX // USD, (1 USD = 3,418.90 UGX)
Tariff Umeme West Nile Rural
Ferdsult Engineer-ing Servic-es
Kilembe Invest-ments
Bundi-bugyo Electricity Coop-erative Society
Pader Abim Communi-ty Multi-purpose Electricity Coop-erative Society
Kyegegwa Rural Elec-tricity Co-operative Society
Domestic 558.4 // 0.16
557.03 // 0.16
511.91 // 0.14
517.3 // 0.15
515.5 // 0.15
561.6 // 0.16
Commer-cial
508.6 // 0.14
542.59 // 0.15
477.24 // 0.13
400.8 // 0.11
479.7 // 0.14
532.6 // 0.15
448.4 // 0.13
Medium industrial
471.6 // 0.13
Table 11.3: Electricity tariff for commercial and domestic consumption in Uganda.
Solar PV
On-grid
East-Africa’s largest (and also sub-Saharan Africa’s largest) privately funded PV plant is set to begin construction in Uganda. The project is developed by French clean energy firm Eren RE and Access Clean Energy. The funding is proved by a truly international effort including London’s Emerging Africa Infrastructure Fund, Dutch development bank FMO and Germany’s KfW Development Bank. The project
is located in the region of Soroti in the northeastern corner of Uganda and will power 40,000 households. The project is a direct result of Uganda’s renewable energy policy, as the first project to be approved through the GET FIT Solar Facility. The tariff of the project for the upcoming 20 years will be 0.16 USD / kWh, however, end users will only pay 0.11 USD / kWh as a result of the subsidy provided by the GET FIT program.
Minigrid
The Energy for Rural Transformation
€20 million through the Special EU Sustainable Energy for All Investment fund for the solar facility. Since then ERA has initiated 20 MW of grid-connected
solar PV plants that had come online in 2015.
Electricity tariffs

Facts & Figures SOLAR Energy
60
(ERT) programme (part of the Rural Electrification Strategy and Plan), started back in 2002, now specifically focuses on increasing rural energy access from 1% to 10% through a combination of grid extension, mini-grids, and solar home system programmes.
Off-grid
Foundation Rural Energy Services (FRES): a non-profit, small multinational that establishes companies in rural areas in Africa through solar PV systems. The company installs Solar Home Systems mainly for commercial use. The company charges a fixed monthly fee and as well as an amount based on the kWh consumption. The maintenance and replacement as well as the initial capital costs are incurred by FRES’ own capital.
Rural Energy Foundation (Now called Solar Now) in the beginning focussed very much on training local networks of entrepreneurs to stimulate innovation and bring solar to the people. The company has shifted that focus to providing energy systems to a variety of homes and have provided electricity for over 300,000 people in 9 countries.
Extra
Uganda experiences average irradiation levels of 5-6 kWh/m2/day. The highest irradiation levels are in the Northern and Eastern parts of the country exceeding 6 kWh/m2/day(Figure 11.1). Despite the huge solar potential and the beneficial regulatory framework, solar energy is primarily used in rural communities, solar cooking and providing water heating and power to public building such as hospitals. The adoption of solar systems in rural areas could provide a great solution against the use of expensive diesel generators and this tendency is promising to continue along other rural areas of Uganda.
Image: VOA news

Facts & Figures SOLAR Energy
61
12. General Summary
Sub-Saharan Africa is home to over a billion people and consistently ranks among the poorest regions in the world. Despite making huge progress over the past two decades, these countries are still struggling in many aspects. Generating electricity is one of the biggest challenges Sub-Saharan countries face, as only 35.3% of their citizens have consistent access to electricity. This challenge, however, also presents an opportunity. Right now, banks and foreign investors are racing to secure contracts for the development of renewable energy projects throughout Sub-Saharan Africa. Considering the immense demand that will arise as these developing countries mature into middle-income economies, various private and governmental parties are currently laying the groundwork for large-scale renewable energy solutions that will eventually become the bedrock of Sub-Saharan growth.
The African continent presents significant opportunities for the development of solar PV energy. Its average solar irradiation rate is the highest among all continents, with some countries boasting an impressive 4,300 hours of annual sunshine. In the face of its immense potential, solar PV remains one of the least developed renewable energy industries. The total capacity of commissioned solar PV power plants remains well under 1 GW, and although recently there have been numerous signed MoUs and sealed investment deals, the majority of projects in development will not come online until 2020. To further encourage foreign investment Sub-Saharan governments have gone to great lengths mandating financial incentives and lifting bureaucratic hurdles. The challenge of providing energy for Sub-Saharan Africa is rapidly becoming a forefront of investment in the developing world and it will be a defining point in the region’s economic future.
Learn more about Africa’s high-potential solar energy markets at Unlocking Solar Capital Africa, on 1 & 2 November 2016, in Nairobi, Kenya.
Information & registration: www.unlockingsolarcapital.com

Facts & Figures SOLAR Energy
62
Sources & Links
1 An event for Africa, in Africa
http://onlinelibrary.wiley.com/doi/10.1002/tie.21677/pdfhttp://www.ruralelec.org/sites/default/files/productive_use_of_energy_final_web_0.pdfhttp://www.magenta-global.com.sg/africa-mini-grids-summit-2014/http://www.irena.org/DocumentDownloads/Publications/IRENA_Solar_PV_Costs_Africa_2016.pdfhttps://about.bnef.com/white-papers/climatescope-2014-focus-africa/
2. Regional Overview
http://www.iea-pvps.org/fileadmin/dam/public/report/PICS/IEA-PVPS_-__A_Snapshot_of_Global_PV_-_1992-2015_-_Final_2_02.pdfhttp://data.worldbank.org/indicator/EG.ELC.ACCS.ZS?end=2012&start=2011https://about.bnef.com/white-papers/climatescope-2014-focus-africa/https://about.bnef.com/white-papers/climatescope-2014-focus-africa/http://www.financialnigeria.com/afdb-s-se4all-africa-hub-to-support-green-mini-grid-developers-sustainable-443.htmlhttps://www.iea.org/publications/freepublications/publication/WEO2014_AfricaEnergyOutlook.pdf
3. Kenya
http://www.africa-eu-renewables.org/market-information/kenya/energy-sector/http://data.worldbank.org/indicator/NY.GDP.MKTP.CD?end=2015&name_desc=false&start=2013http://data.worldbank.org/indicator/NY.GDP.MKTP.KD.ZG?end=2015&locations=KE&name_desc=false&start=2013http://data.worldbank.org/indicator/FP.CPI.TOTL.ZGhttp://data.worldbank.org/indicator/NY.GDP.DEFL.KD.ZGhttp://data.worldbank.org/indicator/SP.POP.TOTL?end=2015&start=2014http://www.tradingeconomics.com/country-list/ratinghttp://www.transparency.org/cpi2015/#results-tablehttp://data.worldbank.org/indicator/IC.BUS.EASE.XQhttp://www.reegle.info/countries/kenya-energy-profile/KEhttp://www.eisourcebook.org/cms/Kenya%20Energy%20Act,2006.pdfhttp://irekproject.net/files/2015/11/Solar_and_wind_energy_projects_Kenya-IREK1.pdfhttp://pppunit.go.ke/index.php/legal-regulatory-frameworkhttps://www.expertguides.com/articles/an-overview-of-kenyas-energy-sector-good-winds-ahead/arflldzzhttp://www.pppunit.go.ke/index.php/project/ongoing-projectshttp://www.ruralelec.org/sites/default/files/esiafrica-renewablemini-grids.pdfhttps://stima.regulusweb.com/historichttp://www.solarcentury.com/za/case-studies/east-africas-largest-solar-farm/http://www.pv-tech.org/news/kenya-to-construct-55mw-solar-plant-with-chinese-government-fundinghttp://www.businessdailyafrica.com/Corporate-News/40MW-solar-energy-farm-in-Nakuru/-/539550/3281612/-/m7eu11z/-/index.htmlhttp://www.businessdailyafrica.com/Corporate-News/Company-gets-green-light-to-build-40MW-solar-plant-in-Lamu/539550-3186416-qwdqjkz/index.htmlhttp://www.worldbank.org/en/news/feature/2016/07/07/mini-grids-bringing-low-cost-timely-electricity-to-the-rural-poorhttp://www.aiche.org/chenected/2016/02/new-smart-solar-microgrids-speed-rural-electrification-kenyahttp://www.nation.co.ke/business/Strathmore-to-sell-solar-power-to-Kenya-Power-/-/996/2914862/-/6sae0iz/-/index.htmlhttp://www.azuri-technologies.com/what-we-dohttp://www.ashden.org/winners/azuri13http://www.bboxx.co.uk/customers/http://solar.m-kopa.com/about/company-overview/http://www.sciencedirect.com/science/article/pii/S0306261915008818http://www.energy.go.ke/index.php/projects/on-going-projects.html
4. Nigeria
http://www.financialnigeria.com/opportunities-for-off-grid-solutions-in-the-nigerian-power-sector-sustainable-293.htmlhttp://www.africa-eu-renewables.org/market-information/nigeria/renewable-energy-potential/http://www.se4all-africa.org/se4all-in-africa/country-data/nigeria/http://www.reegle.info/countries/nigeria-energy-profile/NGhttp://buzznigeria.com/nigerian-banks/https://www.iea.org/statistics/statisticssearch/report/?country=NIGERIA&product=electricityandheat&year=2013http://www.africa-eu-renewables.org/market-information/nigeria/http://www.iea.org/policiesandmeasures/pams/nigeria/name-24808-en.phphttp://cleantechnica.com/2015/11/04/nigeria-mandates-50-renewable-energy-procurement/
Facts & Figures SOLAR Energy
63
http://www.reegle.info/countries/nigeria-energy-profile/NGhttps://www.google.com/url?q=http://www.vanguardngr.com/2016/02/how-45-electricity-tariff-hike-will-affect-you/&sa=D&ust=1477042638968000&usg=AFQjCNGNcNaqITvpziUe5QpNJVH1twBcWghttp://www.vanguardngr.com/2016/03/in-nigeria-small-scale-solar-plants-are-letting-the-sunshine-in/https://cleantechnica.com/2014/12/28/nigeria-signs-fresh-agreement-1-gw-solar-power-capacity/https://www.google.com/url?q=http://cleantechnica.com/2014/05/14/is-3000mw-of-new-nigeria-solar-power-a-model-to-end-ener-gy-poverty/&sa=D&ust=1477042638936000&usg=AFQjCNHYpHSZMQqITXhjA0-vThJxtRYQHQhttps://www.google.com/url?q=http://cleantechnica.com/2014/11/27/nigeria-solar-power-mou/&sa=D&ust=1477042638931000&us-g=AFQjCNHy7qnoNwh2o17NTRqIYBVRLHxmDAhttp://www.pv-magazine.com/news/details/beitrag/movements-in-nigerias-pv-market-as-ppas-get-signed_100025267/#axzz4Ek37mMjphttp://www.moneycontrol.com/news/business/sterlingwilson-eyes-250-mw-solar-projectsnigeria_7081201.htmlhttp://www.ijetae.com/files/Volume3Issue6/IJETAE_0613_87.pdfhttp://www.pv-magazine.com/news/details/beitrag/intersolar-awards-2016--five-winners-of-outstanding-solar-projects_100025128/#ax-zz4ErKaAJBnhttp://data.worldbank.org/indicator/EG.ELC.ACCS.RU.ZShttp://techcabal.com/2016/06/07/arnergy-nigeria-is-bringing-pay-as-you-go-solar-power-services-to-rural-communities/http://www.ashden.org/winners/kxnhttp://www.pv-magazine.com/news/details/beitrag/-nigerias-solar-hopes-stall_100024679/#ixzz4F2MqV8Tzhttp://www.scidev.net/global/energy/news/nigerian-solar-power-failure.htmlhttp://saharareporters.com/2016/03/31/nigerias-power-generation-crumbles-zero-megawatts-several-hours
5. Cameroon
https://www.iea.org/statistics/statisticssearch/report/?country=CAMEROON&product=electricityandheat&year=2013http://www.reeep.org/cameroon-2012http://www.reegle.info/countries/cameroon-energy-profile/CMhttps://www.google.com/url?q=https://www.usaid.gov/powerafrica/cameroon&sa=D&ust=1477042638885000&usg=AFQjCNEcOSZiGd-kocsPuuFivjlRe_19c_ghttp://www.cameroon-today.com/bank-cameroon.htmlhttps://www.iea.org/statistics/statisticssearch/report/?country=CAMEROON&product=electricityandheat&year=2013https://www.usaid.gov/powerafrica/cameroonhttps://www.mbendi.com/indy/powr/af/ca/p0005.htm#5https://www.laurea.fi/en/document/Documents/Cameroon%20Fact%20Sheet.pdfhttp://powerstruggle.discoursemedia.org/investigation/power-to-the-people-solar-energy-is-helping-cameroon-overcome-poverty/http://powerstruggle.discoursemedia.org/investigation/power-to-the-people-solar-energy-is-helping-cameroon-overcome-poverty/http://www.reegle.info/policy-and-regulatory-overviews/CMhttp://www.euei-pdf.org/sites/default/files/field_publication_file/Cameroon_Power_Sector_Market_Brief_Dec2013_EN.pdfhttp://renewables.seenews.com/news/french-pair-plans-300-mw-of-solar-installations-in-cameroon-508456http://www.businessincameroon.com/energy/1001-5907-generale-du-solaire-and-arborescence-capital-shooting-for-300-mw-of-solar-power-in-cameroonhttp://www.pv-tech.org/news/joule_africa_signs_for_100mw_solar_power_plant_in_cameroonhttp://www.pv-magazine.com/archive/articles/beitrag/prep-grant-approved-for-72-mw-pv-plant-in-cameroon_100017935/#axz-z4LXBB0edXhttps://www.esi-africa.com/news/sa-develops-solar-park-in-cameroon/http://www.photon.info/en/news/cameroon-plans-100-mw-solar-projecthttp://singyessolar.com/html/me_news_details.php?id=190174https://www.google.nl/url?sa=t&rct=j&q=&esrc=s&source=web&cd=1&cad=rja&uact=8&ved=0ahUKEwiQ5Jjf0bHPAhUDBBoKHUW-9DosQFggjMAA&url=http%3A%2F%2Fwww.homerenergy.com%2Fwebcast-downloads%2FNFAH_Eustace%2Foff-grid_generation_op-tions_for_Cameroon.ppt&usg=AFQjCNESPPxl2rgWaQ-zdez_yNmkJm1bVQ&bvm=bv.134052249,d.d2shttp://www.poweroak.solar/featured/factory-wholesale-price-for-10kw-three-phase-distributed-on-off-micro-grid-system-in-cameroon.htmlhttp://powerstruggle.discoursemedia.org/investigation/power-to-the-people-solar-energy-is-helping-cameroon-overcome-poverty/
6. Ethiopia
http://www.tradingeconomics.com/ethiopia/gdp-growth-annualhttp://data.worldbank.org/country/ethiopiahttps://www.usaid.gov/sites/default/files/documents/1860/Ethiopia%20Country%20Fact%20Sheet_0.pdfhttp://www.energy.gov.et/Solarhttp://www.reegle.info/countries/ethiopia-energy-profile/ET#government_agencieshttp://ethiopianbusinessreview.net/index.php/statistics/item/444-top-ten-private-banks-in-ethiopia-ranked-by-earning-per-share-in-2012-13http://www.pv-magazine.com/archive/articles/beitrag/new-pv-panel-plant-commissioned-in-ethiopia_100009953/#axzz4MIPbWLoPhttps://www.iea.org/statistics/statisticssearch/report/?country=ETHIOPIA&product=electricityandheat&year=2013https://www.usaid.gov/sites/default/files/documents/1860/Ethiopia_IG_2015_05_03.pdfhttp://mgafrica.com/article/2015-06-28-with-sub-sahara-africas-largest-wind-farm-ethiopia-seeks-to-be-green-energy-super-powerhttps://www.africaintelligence.com/c/dc/LOI/1415/GTP-II.pdfhttps://www.usaid.gov/sites/default/files/documents/1860/Ethiopia_IG_2015_05_03.pdf
Facts & Figures SOLAR Energy
64
https://www.usaid.gov/sites/default/files/documents/1860/Ethiopia_IG_2015_05_03.pdfhttps://www.usaid.gov/sites/default/files/documents/1860/Ethiopia%20Country%20Fact%20Sheet_0.pdfhttps://www.google.com/url?q=http://eappool.org/interconnection-code-compliance-program/&sa=D&ust=1477042638804000&us-g=AFQjCNGgvZIJiwEB6N1xFGmlf1ZhbgT9sQhttps://www.gpoba.org/sites/gpoba/files/OperationsManual/OM%20-%20Ethiopia%20Electricity.pdfhttp://www.sun-connect-news.org/fileadmin/DATEIEN/PV-Industry-ET-04-09-12_final.pdfhttp://greentechnologyafrica.com/the-potential-of-utility-scale-solar-energy-power-plant-in-ethiopia/http://www.ashden.org/winners/SEF09http://data.worldbank.org/indicator/EG.ELC.ACCS.ZS?locations=ET&name_desc=false
7. Ghana
https://www.rvo.nl/sites/default/files/2014/06/Kansrapport%20Renewable%20energy%20Ghana.pdfhttps://www.usaid.gov/sites/default/files/documents/1860/Ghana%20Country%20Fact%20Sheet__6.21.16.pdfhttp://www4.unfccc.int/submissions/INDC/Published%20Documents/Ghana/1/GH_INDC_2392015.pdfhttp://www.irena.org/DocumentDownloads/Publications/IRENA_RRA_Ghana_Nov_2015.pdfhttp://buzzghana.com/top-10-biggest-banks-ghana/https://cleantechnica.com/2016/04/17/ghanas-largest-solar-pv-project-just-connected-to-the-grid/http://www.pv-magazine.com/news/details/beitrag/ustda-backs-100-mw-pv-project-in-ghana-_100024695/#axzz4MIbp6lcLhttps://www.iea.org/statistics/statisticssearch/report/?country=GHANA&product=electricityandheat&year=2013https://www.usaid.gov/sites/default/files/documents/1860/Ghana%20Country%20Fact%20Sheet__04_01_15_Final.pdfhttps://www.esi-africa.com/news/electricity-access-ghana-ranks-highest-with-sa-says-donkor/https://www.rvo.nl/sites/default/files/2016/05/Business%20opportunities%20for%20Renewable%20Energy%20in%20Ghana.pdfhttps://www.theguardian.com/environment/2012/dec/04/africa-largest-solar-power-plant-ghanahttp://www.sciencedirect.com/science/article/pii/S1364032116300880http://www.purc.com.gh/purc/sites/default/files/4th_qtr_aaf_2014.pdfhttps://www.theguardian.com/environment/2012/dec/04/africa-largest-solar-power-plant-ghanahttp://www.pv-tech.org/news/new-solar-farm-launches-20mw-into-ghanas-national-gridhttp://edition.myjoyonline.com/pages/news/201305/105648.phphttp://energicitycorp.com/shining-light-on-cocoa-farmers-in-ghana-2/https://www.ghanabusinessnews.com/2013/02/10/solar-energy-to-power-rural-electricity-launched/http://www.pv-tech.org/news/ghana-launches-first-pv-module-plant-for-us50-million
8. Rwanda
http://www.statistics.gov.rw/https://www.usaid.gov/sites/default/files/documents/1860/RwandaCountryFactSheet__2016.09%20FINAL.pdfhttp://data.worldbank.org/indicator/NY.GDP.MKTP.KD.ZG?end=2015&locations=KE&name_desc=false&start=2013http://www.globalbrandsmagazine.com/list-of-commercial-banks-in-rwanda/http://www.afdb.org/fileadmin/uploads/afdb/Documents/Project-and-Operations/Rwanda_-_Energy_Sector_Review_and_Action_Plan.pdfhttp://www.se4all.org/sites/default/files/Rwanda_RAGA_EN_Released.pdfhttp://www.epd-rwanda.com/overview-of-rwanda-energy-sector-kigali.htmlhttps://www.usaid.gov/sites/default/files/documents/1860/RwandaCountryFactSheet__2016.09%20FINAL.pdfhttp://www.rdb.rw/rdb/energy.htmlhttps://www.usaid.gov/sites/default/files/documents/1860/RwandaCountryFactSheet__2016.09%20FINAL.pdfhttp://www.mininfra.gov.rw/fileadmin/user_upload/aircraft/Rural_Electrification_Strategy.pdfhttp://www.reg.rw/index.php/tariff-publicationhttp://cleanleap.com/rwanda-launches-first-utility-scale-solar-power-plant-east-africahttp://constructionreviewonline.com/2014/05/goldsol-ll-construct-10mw-solar-power-plant-rwanda/http://www.panapress.com/Solar-power-stations-to-supply-Rwandan-schools-with-electricity--13-798739-17-lang2-index.htmlhttp://www.pv-magazine.com/news/details/beitrag/worlds-largest-off-grid-battery-system-headed-to-rwanda_100024973/#axz-z4LYPHkSk3http://constructionreviewonline.com/2016/04/rural-areas-in-rwanda-to-get100-solar-pv-mini-grids/http://www.focus.rw/wp/2016/04/rural-areas-expect-100-solar-pv-mini-grids-under-climate-action-plan/http://www.mininfra.gov.rw/fileadmin/user_upload/aircraft/Rural_Electrification_Strategy.pdfhttp://offgrid-electric.com/innovation/#producthttps://www.odi.org/sites/odi.org.uk/files/odi-assets/publications-opinion-files/10253.pdf
9. Senegal
http://www.africa-eu-renewables.org/market-information/senegal/http://ametrade.org/interviews/world-bank-senelec/http://www.africa-eu-renewables.org/market-information/senegal/renewable-energy-potential/http://data.worldbank.org/indicator/NY.GDP.MKTP.KD.ZG?end=2015&locations=KE&name_desc=false&start=2013http://www.reegle.info/countries/senegal-energy-profile/SNhttps://www.iea.org/statistics/statisticssearch/report/?country=SENEGAL&product=electricityandheat&year=2013http://www.africa-eu-renewables.org/market-information/senegal/renewable-energy-potential/http://www.reegle.info/policy-and-regulatory-overviews/SN

Facts & Figures SOLAR Energy
65
http://www.reeep.org/senegal-2014http://www.senelec.sn/images/tarifsdu1eraout09b.pdfhttp://www.photon.info/en/news/senergy-breaks-ground-30-mw-pv-plant-senegalhttp://www.reuters.com/article/us-africa-solar-idUSKCN10F18Ihttp://minigridpolicytoolkit.euei-pdf.org/casestudies/senegal2https://www.solarwirtschaft.de/fileadmin/media/pdf/offgrid_2015/SOLAR23_AC_minigrids.pdfhttp://akonlightingafrica.com/
10. Tanzania
http://www.energycharter.org/fileadmin/DocumentsMedia/CONEXO/20150827-Tanzania_Pre-Assessment_Report.pdfhttp://www.africa-eu-renewables.org/market-information/tanzania/energy-sector/http://www.reegle.info/countries/tanzania-energy-profile/TZhttp://www.africa-eu-renewables.org/market-information/tanzania/energy-sector/http://naibuzz.com/2016/03/27/5-biggest-banks-tanzania/https://www.iea.org/statistics/statisticssearch/report/?country=TANZANIA&product=electricityandheat&year=2013http://www.energycharter.org/fileadmin/DocumentsMedia/CONEXO/20150827-Tanzania_Pre-Assessment_Report.pdfhttp://www.undp.org/content/undp/en/home/ourwork/environmentandenergy/strategic_themes/climate_change/carbon_finance/CDM/tanzania.htmlhttp://www.africa-eu-renewables.org/market-information/tanzania/energy-sector/http://www.droughtmanagement.info/literature/UNW-DPC_NDMP_Country_Report_Tanzania_2014.pdfhttp://www.energycharter.org/fileadmin/DocumentsMedia/CONEXO/20150827-Tanzania_Pre-Assessment_Report.pdfhttp://www.afdb.org/fileadmin/uploads/afdb/Documents/Generic-Documents/Renewable_Energy_in_Africa_-_Tanzania.pdfhttp://www.africa-eu-renewables.org/market-information/tanzania/energy-sector/https://www.esmap.org/sites/esmap.org/files/TEDAP%20SPPs%2011-18.pdfhttps://www.giz.de/fachexpertise/downloads/2015-tanesco-presentation-tansania.pdfhttp://www.africa-eu-renewables.org/market-information/tanzania/energy-sector/https://energypedia.info/wiki/Tanzania_Energy_Situation#Off-Grid_Solar_Lighting_or_Pico-Solar_Productshttp://www.africansolardesigns.com/resources_32_493092621.pdfhttp://www.renewableenergyworld.com/articles/2015/11/minigrids-seen-as-answer-for-620-million-africans-without-power.htmlhttp://www.undp.org/content/undp/en/home/ourwork/environmentandenergy/strategic_themes/climate_change/carbon_finance/CDM/tanzania.htmlhttp://www.ashden.org/awards/2016/internationalhttp://www.ruralelec.org/sites/default/files/are_best_practices_africa_2014_final_web.pdfhttp://www.ashden.org/winners/OffGrid14http://www.pv-magazine.com/news/details/beitrag/tanzania-announces-one-million-solar-homes-initiative_100018261/#axzz3nPVBsx-wYhttp://www.afdb.org/fileadmin/uploads/afdb/Documents/Generic-Documents/Renewable_Energy_in_Africa_-_Tanzania.pdfhttps://www.giz.de/fachexpertise/downloads/2015-tanesco-presentation-tansania.pdf
11. Uganda
http://www.focus-economics.com/countries/ugandahttp://www.africa-eu-renewables.org/market-information/uganda/http://www.finance.go.ug/dmdocuments/16-16-Energy.pdfhttp://www.reegle.info/countries/uganda-energy-profile/UGhttp://naibuzz.com/2016/05/20/8-biggest-banks-uganda/http://www.africa-eu-renewables.org/market-information/uganda/energy-sector/https://www.hivos.org/sites/default/files/uganda_profile.pdfhttp://www.africaein.net/UG/en/about/view/1084http://www.africa-eu-renewables.org/market-information/uganda/energy-sector/http://www.bujagali-energy.com/http://www.africa-eu-renewables.org/market-information/uganda/energy-sector/http://www.reeep.org/uganda-2012http://minigridpolicytoolkit.euei-pdf.org/casestudies/uganda2http://www.iea.org/policiesandmeasures/pams/uganda/name-127325-en.phphttp://www.era.or.ug/index.php/opportunities/investment/renewable-energy-investment-guidehttp://www.pv-magazine.com/news/details/beitrag/construction-set-to-begin-on-10-mw-solar-plant-in-uganda_100023263/#ax-zz4Dor8ESKShttp://www.pv-magazine.com/archive/articles/beitrag/uganda-greenlights-inaugural-10-mw-solar-plant_100017472/#axzz4M0aOnRQj http://minigridpolicytoolkit.euei-pdf.org/system/files_force/attachments/Mini-Grid%20Policy%20Toolkit%20Case%20Study%20-%20Uganda_0.pdf?download=1http://www.ruralelec.org/sites/default/files/are_best_practices_africa_2014_final_web.pdfhttp://www.ashden.org/winners/REF10http://www.africa-eu-renewables.org/market-information/uganda/renewable-energy-potential/

Facts & Figures SOLAR Energy
66
12. General Summary
http://data.worldbank.org/region/sub-saharan-africahttp://data.worldbank.org/region/sub-saharan-africahttps://www.kpmg.com/Africa/en/IssuesAndInsights/Articles-Publications/General-Industries-Publications/Documents/Power%20in%20Africa%20%20sector%20report%202015.pdf
Websites economic figures
http://data.worldbank.org/indicator/NY.GDP.MKTP.CD?end=2015&name_desc=false&start=2013http://data.worldbank.org/indicator/NY.GDP.PCAP.CD?end=2015&name_desc=false&start=2013http://data.worldbank.org/indicator/NY.GDP.MKTP.KD.ZG?end=2015&locations=KE&name_desc=false&start=2013http://data.worldbank.org/indicator/FP.CPI.TOTL.ZGhttp://data.worldbank.org/indicator/NY.GDP.DEFL.KD.ZGhttp://data.worldbank.org/indicator/SP.POP.TOTL?end=2015&start=2014http://www.tradingeconomics.com/country-list/ratinghttp://www.transparency.org/cpi2015/#results-tablehttp://data.worldbank.org/indicator/IC.BUS.EASE.XQ
Disclaimer: This overview is provided by Solarplaza International BV ("Solarplaza") as a service to its customers on an "as-is, as-available" basis for informational purposes only. Solarplaza assumes no responsibility for any errors or omissions in these materials. Solarplaza makes no commitment to update the information contained herein. This overview is protected by copyright laws, and may only be reproduced, republished, distributed, transmitted, displayed, broadcast or otherwise exploited in any manner only by accrediting Solarplaza as the source of it and providing a full hyperlink to www.unlockingsolarcapital.com where it was originally published.

Facts & Figures SOLAR Energy
67
Facts & FiguresSOLAR Energy Kenya | Nigeria | Cameroon | Ethiopia | Ghana | Rwanda | Senegal | Tanzania | Uganda
UNLOCKING SOLAR CAPITAL AFRICA1 & 2 NOVEMBER 2016 /// NAIROBI, KENYA