Embed Size (px)
Citation preview

Facts and Figures of the Canadian Mining Industry

2 FACTS & FIGURES 2018
TITLE
The Mining Association of Canada (MAC) is the national organization of the Canadian mining industry. We represent companies involved in mineral exploration, mining, smelting, refining and semi-fabrication. Our member companies account for most of Canada’s output of metals and minerals.
MAC’s functions include advocacy, stewardship and collaboration. Our goals are to promote the industry’s interests nationally and internationally, to work with governments on policies affecting minerals, to inform the public and to encourage member firms to cooperate to solve common problems. We work closely with provincial and territorial mining associations, other industries, and environmental and community groups in Canada and around the world.
DATA AND SOURCESThis annual report reflects currently available data, the majority from 2017, though some from prior years and some from 2018. Dollar amounts are expressed in Canadian dollars unless noted otherwise.
Author: Brendan Marshall, Vice President, Economic and Northern Affairs
Design: McKenna Design & Strategy
Acknowledgments: This report could not have been prepared without the significant assistance of the dedicated staff of the Minerals and Metals Sector at Natural Resources Canada. Special thanks are also extended to Cynthia Waldmeier from MAC and Monique Laflèche.
THE MINING ASSOCIATION OF CANADA

FACTS & FIGURES 2018 3
TITLE
LIST OF FIGURES 04
LIST OF ANNEXES 05
STATE OF THE INDUSTRY AND KEY ISSUES 06
MINING: ONE INDUSTRY, MANY APPLICATIONS 09
1. MINING AND THE CANADIAN ECONOMY 10Global Economic Trends 10Mining’s Contribution to the Canadian Economy 12Mining in the Provinces and Territories 12Taxes and Other Payments to Governments 14Indirect Contributions to Mining Industry Suppliers 14
2. THE ACTIVITIES: PRODUCTION, PROCESSING AND TRANSPORTATION 25Production of Key Minerals 25Production Values 25Processing of Minerals 26Transportation of Mining Products 26
3. THE MONEY: RESERVES, PRICES, FINANCING, EXPLORATION AND INVESTMENT 35Canadian Reserves 35Mineral and Metal Prices 35Financing 36Exploration 36Investment 38
4. THE PEOPLE: EMPLOYMENT, COSTS AND INNOVATION 46Mining Industry Employment 46Workplace Safety and Health 49Key Costs 50Innovation and Research and Development 50
5. THE ENVIRONMENT: SUSTAINABLE DEVELOPMENT AND SOCIAL RESPONSIBILITY 56Environmental Stewardship 56Climate Change and the Mining Industry 59The Clean Energy Economy 62Indigenous Relations and Benefit Agreements 63Regulatory Environment 65
6. THE WORLD: INTERNATIONAL MARKET ACTIVITIES AND DEVELOPMENTS 72Canadian Mining’s International Presence 72Canada’s Mineral Trade 74Canada’s Trade Policies 74The Canadian Investment Regime 77
ANNEXES 84
THE CANADIAN MINING INDUSTRY AT A GLANCE 108
TABLE OF CONTENTS

4 FACTS & FIGURES 2018
TITLE
Figure 1: Canada’s Real Gross Domestic Product by Industry, 2007–2017 16Figure 2: Canada’s Real Gross Domestic Product, Mining, Mineral Manufacturing, and Oil and Gas, 2007-2017 17Figure 3: Natural Resources Satellite Account, Indicators, Annual (Dollars X 1,000,000) 18Figure 4: Canadian Mining Industry Clusters 20Figure 5: Value of Canadian Mineral Production by Province and Territory, 2008 and 2017P 21Figure 6: Total Mineral Development Expenditures, by Stage and Province and Territory, 2017P 22Figure 7: Comparative Analysis of Canada and US Mineral Tax Treatment 23Figure 8: Canada V USA: A Tax Comparison 24Figure 9: Value of Canadian Mineral Production, 1999–2017P 29Figure 10: Canada’s Top Ten Metallic and Non-Metallic Mineral Products, by Value of Production, 2006 and 2016P 30Figure 11: Production of Synthetic Crude Oil by Oil Sands Mining Plants, Alberta and Canada, by Quantity and Value, 1998-2017 31Figure 12: Non-Ferrous Smelters and Refineries in Canada, 2017 32Figure 13: Canadian Production of Selected Refined Metals, 2004-2017P 34 Figure 14: Crude Minerals and Processed Mineral Products Transported by Canadian Railways, 2004-2017P 34Figure 15: Canadian Reserves of Selected Metals, 1980 - 2016P 40Figure 16: Metal Prices, 2001-2017 41Figure 17: Monthly Metal Prices 2018 42Figure 18: Mining Equity Raised - Role of Toronto Stock Exchange, 2000–2017 42Figure 19: Geographic Reach of TSX - Listed Companies, January 2018 43Figure 20: Mineral Exploration and Deposit Appraisal Expenditures, by Province and Territory, 2006 - 2018i 43Figure 21: Mineral Exploration and Deposit Appraisal Expenditures, by Company Type, 2007 - 2018i 44Figure 22: Mineral Exploration and Deposit Appraisal Expenditures, by Target, 2008 and 2017P 44Figure 23: Capital Expenditures in the Canadian Mining Industry, 2009 - 2018i 45Figure 24: Minerals Sector Employment, by Subsector and Product Group, 2017 53Figure 25: Representation of Women in Mining Industry and All Industries, Selected Occupations and All Occupations (2011 & 2016) 53Figure 26: Representation of Indigenous Peoples in the Workforce, Mining Industry and All Industries, 2016 54Figure 27: Representation of New Canadians and Visible Minorities in the Mining Workforce (2006, 2011, 2016) 54Figure 28: Cumulative Hiring Requirements* by Forecast Scenario (2019–2029) 55Figure 29: Selected Costs of Production in the Mineral Industry1, 2016 55Figure 30: MAC Member Company Application of International Standards and Programs 66Figure 31: TSM Tailings Management 67Figure 32: TSM Biodiversity Conservation Management 68 Figure 33: TSM Energy Use And Ghg Emissions Management 69 Figure 34: Mining Industry Energy and GHG Emissions Data, 1990 and 2014 -2016 70Figure 35: Environmental Assessments Under Ceaa 2012-2018 71Figure 36: The Geographical Distribution of Canada’s Mining Assets, 2016 78Figure 37: Canadian Mineral Industry Direct Investment Abroad and Foreign Direct Investment Stocks, 1999-2017P 79Figure 38: Mining Company Investment in Host Countries - 2017 80Figure 39: Balance of Canada’s Mineral Trade, 2017 82Figure 40: Value of Canada’s Mining and Mineral Processing Industry Trade, 2003-2017 83
LIST OF FIGURES
FACTS & FIGURES 2018 5
TITLE
Annex 1: Producing Mines in Canada, 2017 84Annex 2: Mining Establishments in Canada, by Mineral, Province or Territory, 2016 89Annex 3: Canadian Production of Leading Minerals, by Province and Territory, 2017P 90Annex 4: Canada’s World Role as a Producer of Certain Important Minerals, 2017P 91Annex 5: Mineral Production of Canada, 2010 - 2017P 95Annex 6: Canadian Reserves of Selected Major Metals, 1978 - 2016P 98 Annex 7: Employment Count and Annual Compensation in the Canadian Mining, Smelting and Refining Industries, 2007–2017 99Annex 8: Total Compensation per Job, by Select Canadian Industrial Sector, 2007-2017 101Annex 9: Domestic Exports of Minerals and Mineral Products, by Commodity and Country of Destination, 2017 102Annex 10: Total Imports of Minerals and Mineral Products, by Commodity and Country of Import, 2017 105
LIST OF ANNEXES

6 FACTS & FIGURES 2018
TITLE
ECONOMIC CONTRIBUTIONThe mining industry has contributed greatly to Canada’s economic strength. The industry directly employs 426,000 workers across the country in mineral extraction, smelting, fabrication and manufacturing, and indirectly employs an additional 208,000. Proportionally, the mining industry is also the largest private sector employer of Indigenous peoples and provided over 16,500 jobs to community members in 2017. In 2017, the minerals sector directly and indirectly contributed $97 billion, or 5%, to Canada’s total nominal GDP.
Internationally, Canada is one of the leading mining countries and one of the largest producers of minerals and metals. The industry accounted for 19%, or $97 billion, of the value of Canadian goods exports in 2017, selling a diversified array of minerals and metals abroad.
Canada remained the world’s top destination for non-ferrous exploration spending in 2017, but continued to cede market share to other jurisdictions, including Australia. This marks the sixth consecutive year that Canada’s share of international exploration investment has fallen, and underscores’ Canada’s long-term decline in the share of global exploration spending, from 20.5% in 2008 to 13.8% in 2017. This is indicative of the fierce competition for global mineral investment, and the financing challenges junior companies are facing. The federal government’s recognition of this challenge, and subsequent decision to renew the Mineral Exploration Tax Credit for a five-year term, should help address this trend.
While mining is important to Canada at the local community level, it also contributes to the economies of large cities. Toronto, for example, is the global hub for mining finance. The Toronto Stock Exchange (TSX) and TSX Venture Exchange are the world’s number one mining and exploration listing venues, where nearly one-third, or $8.5 billion, of the world’s total equity capital was raised in 2017. Vancouver features the world’s leading cluster of exploration companies, while Montreal is home to major aluminum and iron ore firms. Edmonton has become a centre for oil sands expertise and Saskatoon for uranium and potash.
Other evidence of the industry’s vast economic reach is that mining is the single largest industrial customer group of Canada’s railways and is a major user of Canada’s ports. Annually, the industry accounts for approximately 50% of total rail freight revenue generated and is the largest single shipping sector by volume by both rail and marine modes.
The average annual pay for a mining worker in 2017 exceeded $117,000, which surpassed the average annual earnings of workers in the forestry, manufacturing, finance and construction sectors respectively.
A STATE OF TRANSITIONCanada has long been the dominant global mining nation—in mineral production, mining finance, mining services and supplies, and sustainability and safety. However, there are signs that this leadership position is slipping, which has the potential to jeopardize Canada’s ability to seize new opportunities for growth.
STATE OF THE INDUSTRY AND KEY ISSUES
IN AN ERA OF RAPID TECHNOLOGICAL AND CLIMATE CHANGE, CANADA HAS THE OPPORTUNITY TO PROVIDE THE WORLD WITH RESPONSIBLY SOURCED RAW MATERIALS ESSENTIAL TO THE TRANSITION TO A LOWER-CARBON ECONOMY, WHILE SIMULTANEOUSLY BENEFITING FROM A MAJOR DOMESTIC ECONOMIC DRIVER.

FACTS & FIGURES 2018 7
STATE OF THE INDUSTRY AND KEY ISSUES
• The value of total projects planned and under construction from 2018 to 2028 has reduced by 55% since 2014, from $160 billion to $72 billion.
• Only four new mining projects, all gold mines, were submitted for federal environmental assessment in 2017 – far below highs seen in 2012-2014.
• Over the last five years, Canada has lost more ground than it has gained in the commodities for which it is a top-five global producer.
• Australia’s mining supply sector surpassed Canada’s in recent years.
• Mining innovation dollars are steadily flowing out of Canada to countries such as Australia, Germany and South Africa.
While Canada has long benefited from a prosperous minerals and metals industry, we are not immune to global competitive forces, and cannot take the benefits and opportunities that mining presents to Canadians for granted. Critical to bolstering the industry’s domestic and international leadership is a predictable, consistent and competitive domestic investment environment.
FEDERAL POLICIES AND CANADIAN MINING COMPETITIVENESSWith a federal election only months away, now more than ever it is essential that the challenges and opportunities faced by Canada’s multifaceted mining sector are considered, many of which are critical to the industry’s longevity.
While the government has contributed positively in some respects with policy developments and investments supporting Canada’s mining sector in recent years, significant challenges persist. Domestic legislative and regulatory processes with implications for project permitting and costs endure, while recent supply chain failures have damaged Canada’s reputation as a reliable trade partner.
Immediate action by government to quell increasing investment leakage and minimize the impacts of projected low-growth scenarios is needed. Specifically, the Mining Association of Canada (MAC) and its members urge the federal government to:
• Improve the federal project review process: The process should be effective and timely, from pre-environmental

8 FACTS & FIGURES 2018
STATE OF THE INDUSTRY AND KEY ISSUES
assessment (EA) to post-EA permitting, with meaningful consultation with Indigenous communities.
• Invest in critical infrastructure in remote and northern regions: Establish a specific allocation for Canada’s Arctic within the Canada Infrastructure Bank that has flexible criteria shaped in recognition of unique Arctic realities, or develop a stand-alone Arctic fund to advance clean energy and development priorities in the region.
• Improve Canada’s transportation network: The mining industry is the largest user of Canada’s rail and marine transportation networks. As such, it is important that an efficient logistics supply chain is in place to effectively move products to market and bolster overall business competitiveness.
• Address climate change while protecting Canadian businesses: We have persistently underscored the need for climate change policy to ensure the competitiveness of EITE sectors, to be sensitive to changing economic and geographical realities and supply-chain exposure, and to minimize compliance burden. Approaches that fail to address these concerns risk creating carbon leakage that will diminish Canadian competitiveness with no global net gain in GHG reductions – a “lose-lose” scenario.
• Enhance industry innovation: Just as minerals and metals are key inputs into the low-carbon economy, the technologies that they produce are critical to enhancing industry environmental performance. Public policies and investments that recognize and support the industry’s innovation priorities are essential.
• Improve access to trade: It is essential that the government’s agenda to enhance and diversify market access through the negotiation of strategic free trade agreements with key partners is prioritized.
• Accelerate Indigenous inclusion in mining: All of the above will determine whether and the extent to which the mining industry can continue to develop and maintain strong and trusting relationships with Indigenous communities near, or with an interest in, mining activities.
Canada’s mining industry continues to evolve, particularly in its work in sustainable mining practices through MAC’s externally-verified performance system, Towards Sustainable Mining® (TSM®). This program, which was recently profiled in the United Nations Climate Change Secretariat’s report on climate change action, has received international attention, and five countries outside of
Canada have adopted TSM to support meeting society’s needs for minerals, metals and energy products in the most socially, economically and environmentally responsible way. This is a testament to Canadian mining leadership on the world stage.
Looking forward, there is a tremendous opportunity for Canada. To achieve it, policies and regulations that encourage sustainable mining development, both at home and abroad, are essential to enable our sector to expand its already significant contributions to communities across the country, while improving our environmental performance.

FACTS & FIGURES 2018 9
TITLE
The mining and mineral manufacturing sector – covering metal, non-metal and coal mines; oil sands mining operations; and manufacturing in the form of smelters, refineries, and fabrication facilities – is generically known as the “mining industry.”
MINING AND ITS ROLE IN A LOW CARBON FUTUREThere is a natural synergy between mining and clean technology. Raw materials are transformed into technology that, having gone full circle, assists mining operations in reducing environmental footprints and enhancing efficiency and reliability. These same raw materials also enable the world to transition to a low carbon future.
Clean energy and “green” products require metals and minerals as building blocks. Water purification systems rely on nickel and a host of rare earth elements. Hybrid cars draw energy from nickel hydride batteries and use far more copper than traditional vehicles. Efficient, lightweight vehicles and aircraft need aluminum as well as lighter composites and alloys involving nickel and other metals to reduce weight and improve efficiency. Clean energy sources such as nuclear, solar, wind and hydrogen use a range of minerals and metals in their equipment and processes.
Because the mining industry is vital to daily life and Canada’s future, its opportunities, challenges, investments and needs are inseparable from those of broader society. Historically, thanks to the industry’s innovation and investment, and the strategic support of governments, Canada has benefited from low-cost mineral and metal products, good jobs and
MINING
ONE INDUSTRY, MANY APPLICATIONS
significant wealth development opportunities. During this time, company best practices have resulted in the international recognition of the Canadian mining industry as a global leader in corporate social responsibility and environmental stewardship. Looking forward, as global competition for mineral investment increases, Canada must adapt to preserve its leadership.
THE MINING INDUSTRY IS CRUCIAL TO THE EVERYDAY LIFE OF ALL CANADIANS. WE NEED MINING TO BUILD THE PRODUCTS WE RELY ON IN OUR DAILY LIVES, AND FOR THE TECHNOLOGIES AND INFRASTRUCTURE REQUIRED FOR A LOW CARBON FUTURE.
• Batteries (nickel, cadmium, lithium, cobalt)
• Circuitry (gold, copper, aluminum, steel, lithium, titanium, silver, cobalt, tin, lead, zinc)
• Display screens (silicon, boron, lead, barium, strontium, phosphorus, indium)
• Electric cars (copper, lithium, aluminum, nickel, cadmium, cobalt, zinc)
• Musical instruments (copper, silver, steel, nickel, brass, cobalt, copper, iron, aluminum)
• Sports equipment (graphite, aluminum, titanium, calcium carbonate, sulphur)
• Wind turbines (steelmaking coal, iron ore, copper, nickel)
• Energy (coal, uranium, oil sands)
PRODUCTS THAT RELY ON MINING

10 FACTS & FIGURES 2018
TITLE
SECTION 1
MINING AND THE CANADIAN ECONOMY
GLOBAL ECONOMIC TRENDSIn October, the International Monetary Fund (IMF) revised down its forecast for 2018-19 global growth, projecting the global economy to grow at 3.7% over the next two years – a projection consistent with 2017 global growth levels. The October update reduced the organization’s April forecast by 0.2 percentage points, attributing the weakened forecast to increased trade tensions and associated disruptions in the flow of goods and services. Maurice Obstfeld, IMF’s Chief Economist, explained that “the impacts of trade policy and uncertainty are becoming evident at the macroeconomic level, while anecdotal evidence accumulates on the resulting harm to companies. Trade policy reflects politics, and politics remain unsettled in several countries, posing further risks.”
Despite the revised forecast, projected growth remains stronger than in recent years. However, the longevity of political and trade uncertainty, particularly between the world’s two largest economies, may challenge the resiliency of projected global economic growth. With China as the world’s leading consumer of a host of minerals and metals, markets have already reacted to the escalating trade war between China and the US.
For example, commodity prices retreated broadly in August on concerns that mounting tariffs between the US and China would reduce demand for industrial materials. Meanwhile, the White House continues to escalate its trade dispute with Beijing, leveling further tariffs on another $200 billion in Chinese exports in mid-September. At the time of writing, it was premature to assess the broader ripple-
through effect of these developments on global demand for mineral and metal products.
Emerging EconomiesDespite the above uncertainty, the IMF forecasts that GDP growth from emerging markets and developing economies will persist at 2017 levels, or 4.7% for 2018-19 respectively. Reversing their consecutive year-over-year negative GDP growth in 2017, Russia and Brazil’s economies are forecast to further expand by 0.2 and 0.4 percentage points respectively in 2018, with the Brazilian economy forecast to grow by a further 1% in 2019.
Bouncing back after recent volatility, India’s economic growth is projected to rise year-over-year through to 2019, capping at 7.4%, while China’s growth (albeit over a much larger base than in previous years) is forecast to continue moderating, persisting at 6.6% growth in 2018, and dropping to 6.2% growth in 2019. While China’s transition from rapid industrial growth presents some uncertainty over the anticipated strength of global demand for raw materials, China’s demand for mining products is anticipated to remain strong over the longer-term.
Developments in Advanced EconomiesEconomic activity in advanced economies is forecast to nudge upward 0.1 percentage points in 2018, to 2.4%, and then contract to 2.1% in 2019. The economic growth of every country in the IMF’s advanced economies grouping is forecast to plateau or reduce in 2019 except in the United Kingdom – whose growth has been stagnant in recent years.
LIKE OUR NATION’S ECONOMY, THE CANADIAN MINING INDUSTRY IS NOT IMMUNE TO GLOBAL ECONOMIC TRENDS. THE PROFITABILITY OF COMPANIES DEPENDS IN PART ON THE PERFORMANCE OF COMMODITY PRICES, WHICH ARE SUBJECT TO MARKET VOLATILITY AND DRIVEN BY GLOBAL SUPPLY AND DEMAND. IN TURN, THE EXTENT TO WHICH MINING COMPANIES CONTRIBUTE TO THE CANADIAN ECONOMY, BE IT THROUGH DIRECT AND INDIRECT EMPLOYMENT OR TAXES AND ROYALTIES, DEPENDS ON THEIR ABILITY TO OPERATE PROFITABLY. ECONOMIC FORECASTS HELP COMPANIES PLAN THEIR BUSINESS ACTIVITIES.

FACTS & FIGURES 2018 11
MINING AND THE CANADIAN ECONOMY
Consistent with this broader trend, Canada’s growth trajectory was revised down by the IMF with real GDP projected to slow to 2.1% in 2018, then to 2% in 2019. This represents a 1/3 drop in projected growth over two years. The IMF links concerns over weak external competitiveness, sluggish labor productivity growth, and population aging to limit potential growth over the medium term to about 1.75%, significantly lower than Canada’s historical average.
Underscoring the above are worrisome economic trends. At the time of writing, data indicated that:
• Canada’s share of non-energy exports to the US are in a 16-year decline, averaging 0.5% annually
• Foreign direct investment (FDI) to Canada is down 26% since 2010, now at 1/3 peak levels of 2007
• Canadian capital investment is now under 10% of GDP, its lowest level since the global financial crisis
• Investment per Canadian worker is only 70% of the OECD average, and 59% of that in the US
The above underscores the need for immediate action by Canadian governments to quell increasing investment leakage and minimize the impacts of projected low- growth scenarios.
Canadian Mining Industry OutlookThe Canadian mining industry’s economic prospects are uncertain over the short term. Domestically, legislative and regulatory processes with implications for project permitting and costs persist, while recent supply chain failures have damaged Canada’s reputation as a reliable trade partner. Internationally, these challenges are amplified by an increasingly unpredictable trade relationship with the US, whose comprehensive tax reform has significantly enhanced that jurisdiction’s investment competitiveness over Canada’s.
As the middle classes of the world’s most populous countries continue to emerge, and as their consumption patterns more closely resemble those of western industrialized countries, growth in mineral and metal demand is poised to continue. The degree to which Canada participates in this longer-term growth trajectory is contingent on the establishment of a competitive domestic business environment.
One significant growth opportunity for Canada’s mining sector is the global transition to a lower carbon future. Minerals and metals are the building blocks of lower carbon technologies, and a 2017 World Bank report concluded that the increased use of wind, solar and energy storage technologies will heighten the demand for many mining products.
For example, Clean Energy Canada highlights the opportunity that a lower carbon economy presents to Canada and its mining industry, noting that Canada has rich deposits in many of the minerals and metals needed in renewable energy technologies.

12 FACTS & FIGURES 2018
MINING AND THE CANADIAN ECONOMY
Noting that Canada is home to 14 of the 19 metals and minerals needed to make a solar PV panel, the think-tank highlights MAC’s Towards Sustainable Mining® (TSM®) initiative, and the fact that Canada hosts some of the lowest carbon-intensive mines in the world thanks to the energy mix and company adoption of lower emitting technologies at their sites.
As a leading producer of responsibly sourced mineral and metal products globally, Canada has an opportunity to become the world’s leading supplier of inputs integral to a lower carbon economy. Critical to realizing this potential is reconciling ongoing environmental, Indigenous, transportation, tax and other mineral policies and regulations with the need for domestic business competitiveness and certainty.
MINING’S CONTRIBUTION TO THE CANADIAN ECONOMY Mining contributes significantly to the Canadian economy. The direct and indirect wages and employment of approximately 634,000 people across the country (of which 426,000 are direct jobs), taxes and royalties collected by governments, and the capital expenditures required for project development and operation are only some examples of its important contributions. Beyond its direct economic impact, the industry also supports many firms and sectors that supply miners with the goods and services they need to operate.
Contribution to Canada’s GDPReal GDP is used by policy makers, financial institutions and other businesses to help determine the economic health of the nation. Since real GDP measures the volume of goods and services produced, an increase in its value is a sign of a healthy economy while a decline indicates that the economy is not functioning to its full capacity.
Historically, the value of minerals and metals to Canada’s economy has ranged between 2.7% and 4.5% of the country’s real GDP. In 2017, the industry’s contribution remained within this range at 3.3%.
2017 Contribution The extractive industry, which combines mineral extraction with oil and gas extraction, contributed $152.1 billion, or 8.6%, to Canada’s real GDP in 2017 (see Figure 1). By this measure – up 1.1% year-over-year – the extractive industry is the fourth largest of Canada’s 18 industries, surpassed only by the services, real estate, and manufacturing sectors.
The mining industry as a whole goes beyond extraction to include mineral manufacturing and needs to be carved
out from the broader mining and oil and gas category. The mining industry’s 2017 contribution to real GDP is detailed in Figure 2, which divides industry activity into four stages:
• Stage 1, extraction of minerals (metals, non-metals, and coal): $24.6 billion
• Stage 2, primary metal manufacturing (smelting, refining, rolling, extruding, alloying, and casting of primary metals): $14.9 billion
• Stage 3, non-metallic mineral product manufacturing (abrasives, lime, cement, glass, and ceramics): $5.9 billion
• Stage 4, fabricated metal product manufacturing (forging, stamping and heat-treating to produce reinforcing bars, fabricated wire, cutlery, tools, and hardware): $12.9 billion
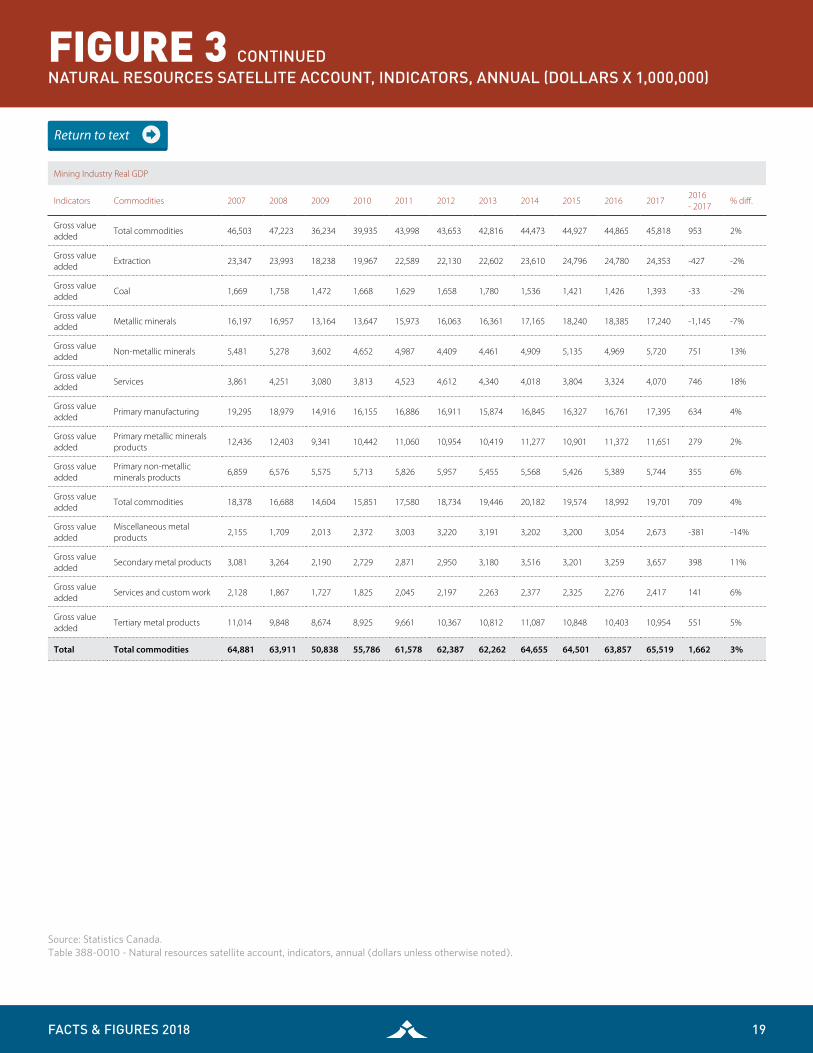
The difference between real and nominal GDP is that real GDP is only calculated in terms of expenditure, whereas nominal GDP is calculated by using current dollars, and is produced in terms of income and expenditure. In short, real GDP is better at illustrating the performance of a sector over time, whereas nominal GDP is useful to illustrate an industry’s contribution to the economy in a given year. Accordingly, mining’s nominal GDP for 2017 increased year-over-year by 11% from $64-$72 billion dollars, largely due to rising prices over the course of 2017. See Figure 3 and read about GDP for more information.
MINING IN THE PROVINCES AND TERRITORIES Year-over-year, mineral production values were projected to increase for 2017 in eight of Canada’s 13 provinces and territories. The production values for five jurisdictions were projected to decrease, however, three remained roughly consistent year-over-year. British Columbia posted the largest gain in absolute value, exceeding $2.5 billion. The Northwest Territories also increased by approximately $800 million year-over-year. Ontario experienced the single largest absolute drop in production value year-over-year, falling from $10.5 billion to $9.8 billion. Overall, total production value is up year-over-year by 7.7%, or more than $3 billion.
MINING’S DIRECT CONTRIBUTION TO 2017 REAL GDP TOTALED $58.4 BILLION, A 1.4% INCREASE YEAR-OVER-YEAR, WHILE THE SECTOR’S CONTRIBUTION TO NOMINAL GDP TOTALED $72 BILLION, AN 11% INCREASE YEAR-OVER-YEAR.

FACTS & FIGURES 2018 13
MINING AND THE CANADIAN ECONOMY
Regional Distribution of MiningFigure 4 illustrates the geographical location of Canada’s mining clusters and active mineral development regions (details in Annex 1). The Northwest Territories are the country’s dominant source of diamonds. Leading in the production of gold are Ontario and Quebec. Saskatchewan produces all of Canada’s uranium and has world-class potash reserves. British Columbia is prominent in steelmaking coal production. Newfoundland and Labrador and Quebec produce virtually all of Canada’s iron ore. Several provinces also have strong copper and nickel production. (For detailed mineral production by province and territory, see Annex 2 and Annex 3.)
Mining also has significant ties to Canada’s major cities. Some of the largest Canadian and international mining companies are headquartered or have a significant presence in urban centres such as Vancouver (Goldcorp, Teck Resources Limited), Saskatoon (Cameco Corporation, PotashCorp), Toronto (Barrick Gold Corporation, Vale, Glencore), and Montreal (ArcelorMittal, Iron Ore Company of Canada, Rio Tinto Alcan).
Vancouver is the global centre of expertise for mineral exploration. Some 700 exploration companies are located in British Columbia, most of which are in the greater Vancouver area.
Toronto is the global centre for mining finance. The Toronto Stock Exchange has the most listed mining companies globally, and the city itself is home to several dozen mining company head offices, as well as several hundred mining suppliers, consulting firms, and service providers.
As home to Rio Tinto Alcan, and to significant mining research and education facilities, Montreal holds considerable global expertise in aluminum smelting.
The global emergence of the oil sands over the past two decades has transformed Edmonton and Calgary into centres of expertise in this area, and Saskatoon has risen to the forefront of the uranium and potash sectors.
Regional Value of MiningThe value of Canadian mineral production increased by 7.7% in 2017, rising more than $3 billion from 2016 levels (see Figure 5).
A correlation exists between production values and expenditures on resource development. The top four provinces by production value in 2017 – Saskatchewan, Ontario, Quebec, and British Columbia – also led in expenditures on mineral resource development (see Figure 6). Of the $7.8 billion invested in mine complex development in Canada, combined spending across these four provinces exceeded $5.8 billion (75% of the total) and ranged from $896 million to $1.9 billion, with Saskatchewan leading in expenditure. This suggests that these four provinces will remain vital to Canada’s mineral production well into the future.
The three territories together received 22% ($570 million) of total 2017 Canadian spending on exploration and deposit appraisal (the first two columns of Figure 6). This amount, more than three times the territories’ share of production value (7%), reflects global interest in Canada’s northern mineral potential. On certain measures, this interest is materializing into wealth development as the territories also accounted for 13% ($990 million) of total mine complex development expenditure.
Canada-wide: $43.9 billion
TOP 4 PROVINCES1. Ontario: $9.9 billion
2. British Columbia: $8.8 billion
3. Quebec: $8.6 billion
4. Saskatchewan: $5.7 billion
VALUE OF MINING IN 2017
Total mining establishments: 1,189 Metals: 63 Non-metals: 1,126
PROVINCES WITH THE MOST METAL MINESQuebec: 21 Ontario: 17 British Columbia: 8
MAIN TYPES OF NON-METAL MINESSand and gravel quarries: 721 Stone quarries: 293 Peat mines: 62
CANADIAN MINES IN 2017

14 FACTS & FIGURES 2018
MINING AND THE CANADIAN ECONOMY
The majority of this investment (67%) went to Nunavut, where Agnico Eagle is developing its Meliadine mine, and Amaruk satellite deposit. Overall territorial exploration and deposit appraisal is mixed, showing signs of recovery in the Yukon but not in the Northwest Territories and Nunavut:
• $81.3 million in the Northwest Territories, down from $90 million in 2017
• $110.7 million in Nunavut, down consecutively from $215.1 million in 2015
• $172 million in Yukon, up from $90.4 million in 2016
TAXES AND OTHER PAYMENTS TO GOVERNMENTSEach year, Canadian governments receive considerable taxes and royalties as a result of mining activity. Specifically, these payments come from the first three stages of activity – extraction, smelting, and processing (see Figure 2).
Payments to Governments Canada’s payment disclosure legislation, the Extractive Sector Transparency Measures Act, which came into force in 2015, requires companies to disclose the payments they make to governments that exceed a $100,000 threshold. Ultimately, this creates greater transparency of the taxes, royalties and other forms of disbursement that companies pay to governments, at home and abroad. Although the legislation came into force in 2015, the publication of tax payments began in 2017.
According to the Natural Resource Governance Institute, in 2017, extractive sector companies reported payments totalling more than $9.3 billion to Canadian governments. These payments, to Indigenous, municipal, provincial and federal governments, are generally royalty or tax payments sourced from over 1,800 projects across the country.
INDIRECT CONTRIBUTIONS TO MINING INDUSTRY SUPPLIERSThe mining industry’s economic impact goes far beyond its direct contribution to the GDP. For instance, mining accounts for approximately half of Canada’s rail-freight revenues and tonnage annually, typically exceeding $6 billion in expenditure (details in Section 2).
Organizations such as CN Rail, CP Rail, and the Ports of Montreal, Quebec and Vancouver depend on a vibrant mining industry. Further, specialists in legal, environmental, taxation, engineering and other skillsets support the industry’s many requirements to locate, develop, construct, operate, and reclaim a mine.
Supply relationships like these create mutual synergies. For instance, supplier companies play a crucial role in introducing and spreading innovative technologies and ideas within the mining industry.
InfoMine, a mining database, reported in 2018 that more than 3,700 firms provide technical, legal, financial, accounting, environmental and other expertise to the Canadian mining industry. Most of these suppliers are located in Ontario and British Columbia, followed by Alberta, Quebec, Saskatchewan and Manitoba. In 2016, InfoMine reported that Australia’s identified mining supply sector surpassed that of Canada’s, bumping Canada to third place. In 2017, this gap expanded with Australia adding more than 200 firms to its list. In 2018, Canada was trailing by nearly 800 firms, only having added 2 firms year-over-year. This is one of many indicators suggesting that Canada’s attractiveness as a destination for mineral investment is eroding. (See Section 3 of this report for more discussion on investment trends.)
Tax PolicyCanada’s mining tax regime has been falling behind international competitors for years. Budgets 2012 and 2013 reduced or eliminated several direct and indirect mining related tax credits. In areas such as dividend withholding tax and corporate restructuring rules, other jurisdictions have amended their fiscal regimes to better attract FDI while Canada has not. Most recently, the Tax Cuts and Jobs Act reforms have significantly reduced Canada’s mining tax competitiveness vis-à-vis the US.
United States: 5,999 Australia: 4,549 Canada: 3,772 Brazil: 3,653 Chile: 1,827
Source: InfoMine
NUMBER OF MINING SUPPLIERS IN LEADING COUNTRIES
EXTRACTIVE SECTOR PAYMENTS TO CANADIAN GOVERNMENTS TOTALED MORE THAN $9.3 BILLION IN 2017.

FACTS & FIGURES 2018 15
MINING AND THE CANADIAN ECONOMY
Essential to understanding the impact of recent US tax changes is appreciating the broader package of reforms, and not focusing exclusively on changes to the headline CIT rate. Figure 7 provides an overview of several measures that enhance the competitiveness of the US mining tax regime over that of Canada, including:
• A lower aggregate CIT rate
• A 100% immediate depreciation rate for eligible capital investment
• Favorable treatment for high margin exports (amounting to ~8% tax reduction)
• A resource allowance of up to 50%
The cumulative competitiveness increase of these measures is significant. Figure 8 models the implications of the new US tax regime against the status quo tax system in Canada on the same copper mine. It illustrates an approximate 40% to 50% reduction in the effective tax rate for the same mine in the US compared to Canada.
MAC advocated for government action to reduce Canada’s waning international mining tax competitiveness. For example, to be competitive with the new US tax rate for exporters (16.06%), federal and provincial governments would need to reduce their corporate income tax rate to 8% respectively or reinstate a resource allowance of 33%. Specifically, governments should consider:
• Reducing the headline CIT rate to achieve equivalency with the US rate for exporters or reinstate a 33% resource allowance
• Reversing, reinstating and enhancing mining tax reforms from Federal Budgets 2012 and 2013, including augmenting the ACCA to enable immediate depreciation
• Exempting corporations from dividend withholding tax when companies have paid sufficient corporate income tax
• Enabling corporate reorganizations performed by Canadian or foreign groups to be tax free
• Modernizing the tax treatment of Qualified Environmental Trusts (QETs) by extending the carryback period from three to seven years, allowing reclamation to be deducted at the consolidated level when incurred regardless of which mine is being reclaimed, and by making QETs tax-exempt until the distribution of funds
In November, the 2018 Fall Economic Statement proposed several measures that will enhance the investment competitiveness of Canada’s mining and metal manufacturing sectors, including:
• The Accelerated Investment Incentive, which will enable miners to write off three times the eligible cost of newly acquired assets in the year the investment is made
• Extending the Mineral Exploration Tax Credit (METC) for a five-year term, bringing greater investment certainty for early stage mineral exploration
• Allowing businesses to immediately write-off the full cost of clean energy equipment
MAC welcomed the above measures as an important boost to Canadian mining competitiveness, and will remain engaged in pursuit of further reforms to further enhance investment competitiveness.

16 FACTS & FIGURES 2018
TITLE
Source: Statistics Canada, CANSIM Table 379-0031.Note: Values at Basic Prices in 2007 Constant Dollars.
($ millions) 2007 2008 2009 2010 2011 2012 2013 2014 2015 2016 2017
All industries 1,468,927 1,478,592 1,429,913 1,476,176 1,524,395 1,552,003 1,589,454 1,631,228 1,649,263 1,673,141 1,761,730
Agriculture 16,619 18,083 17,592 17,291 17,637 17,813 20,938 19,900 20,637 21,482 18,482
Forestry and logging 4,457 4,165 3,286 3,794 4,173 4,093 4,209 3,963 4,254 4,287 4,395
Fishing, hunting and trapping 1,064 1,103 1,074 1,141 1,121 1,138 1,159 1,283 1,340 1,278 980
Support activities for agriculutre and forestry
2,057 2,064 2,148 2,215 2,225 2,117 2,324 2,394 2,474 2,587 2,587
Mining (including milling) and quarrying, and oil and gas extraction
112,438 108,866 100,068 104,795 111,115 108,281 113,901 120,482 122,751 124,871 152,084
Support activities for mining and oil and gas extraction
10,669 11,471 8,314 10,290 12,204 12,445 12,581 13,964 8,989 6,472 7,923
Electric power, gas and water utilities
35,753 37,068 34,888 35,375 36,476 36,124 36,127 36,174 35,946 36,123 39,099
Construction 102,098 104,738 98,211 105,559 109,208 117,567 122,475 125,225 120,114 116,739 124,958
Manufacturing 187,791 177,371 152,564 159,596 165,154 167,793 166,662 172,316 172,563 174,033 183,132
Trade, wholesale 79,666 78,942 73,615 79,144 85,194 87,920 91,657 95,269 96,164 97,247 102,303
Trade, retail 77,269 79,656 77,683 80,009 80,843 81,119 85,637 88,805 90,591 92,957 96,516
Transportation and warehousing
62,645 62,619 60,198 62,620 65,077 65,915 67,177 69,614 72,334 74,814 79,497
Information and cultural industries
48,668 49,025 48,302 49,327 49,954 50,350 49,893 50,010 49,965 50,211 52,731
Finance and insurance 97,528 96,050 95,249 97,260 100,546 102,164 106,052 109,211 114,972 120,350 123,579
Real estate and rental and leasing
168,568 172,618 177,200 182,930 188,680 194,632 200,043 206,041 212,994 219,389 228,902
Community, business and personal services
199,343 203,556 199,763 199,209 204,847 210,206 215,497 220,704 223,354 224,694 202,201
Public administration 92,264 96,296 101,505 104,310 106,165 105,283 104,876 105,578 105,930 107,375 109,391
Health care and social assistance
96,254 98,424 100,702 102,232 103,998 105,614 105,712 107,270 109,478 112,507 116,485
Educational services 75,833 78,541 79,699 81,294 82,003 83,546 84,858 85,419 86,887 88,312 116,485
Return to text
FIGURE 1CANADA’S REAL GROSS DOMESTIC PRODUCT, BY INDUSTRY, 2007-2017

FACTS & FIGURES 2018 17
TITLE
Source: Statistics Canada, CANSIM Table 379-0031.Note: Values at Basic Prices in 2007 Constant Dollars.
($ millions) 2007 2008 2009 2010 2011 2012 2013 2014 2015 2016 2017
Metal mines 16,630 17,153 13,316 13,805 16,158 16,249 17,566 18,456 19,161 19,448 17,352
Non-metal mines 5,329 5,035 3,436 4,439 4,759 4,206 4,284 4,486 4,698 4,591 5,843
Coal mines 1,632 1,719 1,438 1,631 1,594 1,620 1,760 1,669 1,455 1,473 1,399
Total Mining 23,591 23,907 18,190 19,875 22,511 22,075 23,610 24,611 25,314 25,512 24,594
Primary metal manufacturing 15,602 15,248 11,483 12,836 13,598 13,466 13,001 13,868 12,943 13,884 14,911
Fabricated metal product manufacturing
14,361 13,102 11,141 11,592 12,547 13,466 13,783 14,042 13,559 12,591 12,929
Non-metallic mineral product manufacturing
6,504 6,235 5,287 5,417 5,524 5,648 5,544 5,827 5,689 5,634 5,930
Total Mineral Manufacturing 36,467 34,585 27,911 29,845 31,669 32,580 32,328 33,737 32,191 32,109 33,770
Oil and gas extraction 88,847 84,959 81,878 84,920 88,604 86,206 90,291 95,871 97,437 99,359 112,553
Petroleum and coal products manufacturing
7,155 7,036 7,468 7,044 6,728 6,782 6,741 6,666 6,620 6,513 7,113
Support activities for mining and oil and gas
10,669 11,471 8,314 10,290 12,204 12,445 12,581 13,964 8,989 6,472 7,923
Total Oil and Gas and Associated Manufacturing 106,671 103,466 97,660 102,254 107,536 105,433 109,613 116,501 113,046 112,344 127,589
Return to text
FIGURE 2CANADA’S REAL GROSS DOMESTIC PRODUCT, MINING, MINERAL MANUFACTURING, AND OIL AND GAS, 2007-2017

18 FACTS & FIGURES 2018
TITLE
Return to text
FIGURE 3NATURAL RESOURCES SATELLITE ACCOUNT, INDICATORS, ANNUAL (DOLLARS X 1,000,000)
Mining Industry Nominal GDP
Indicators Commodities 2007 2008 2009 2010 2011 2012 2013 2014 2015 2016 20172016 - 2017
% diff.
Gross value added
Total commodities 46,502 48,579 33,422 43,329 54,095 46,934 43,711 43,308 43,502 43,075 49,231 6,156 13%
Gross value added
Extraction 23,347 25,877 17,533 25,336 32,892 26,444 24,862 23,888 24,547 24,609 28,270 3,661 13%
Gross value added
Coal 1,669 3,881 3,242 3,989 5,575 3,704 2,726 1,998 1,872 1,659 3,115 1,456 47%
Gross value added
Metallic minerals 16,198 13,218 8,210 13,056 16,766 14,132 14,105 13,568 13,470 14,134 15,173 1,039 7%
Gross value added
Non-metallic minerals 5,480 8,778 6,081 8,291 10,551 8,608 8,031 8,322 9,205 8,816 9,982 1,166 12%
Gross value added
Services 3,861 4,684 3,472 4,550 6,127 6,269 5,873 5,368 5,217 4,825 6,125 1,300 21%
Gross value added
Primary manufacturing 19,294 18,018 12,417 13,443 15,076 14,221 12,976 14,052 13,738 13,641 14,836 1,195 8%
Gross value added
Primary metallic minerals products
12,435 11,733 7,191 8,157 9,605 8,538 7,432 8,312 8,043 7,915 8,549 634 7%
Gross value added
Primary non-metallic minerals products
6,859 6,285 5,226 5,286 5,471 5,683 5,544 5,740 5,695 5,726 6,287 561 9%
Gross value added
Total commodities 18,380 17,534 15,537 16,527 18,664 20,226 20,731 21,455 21,876 21,667 22,782 1,115 5%
Gross value added
Services and custom work 2,128 2,026 1,933 1,980 2,115 2,165 1,973 2,072 2,114 2,076 2,245 169 8%
Gross value added
Secondary metal products 3,083 3,303 2,093 2,559 2,788 2,941 2,948 3,307 2,947 3,001 3,366 365 11%
Gross value added
Tertiary metal products 11,014 10,491 9,191 9,294 10,463 11,604 12,358 12,452 12,636 12,212 13,130 918 7%
Gross value added
Miscellaneous metal products
2,155 1,714 2,320 2,694 3,298 3,516 3,452 3,624 4,179 4,378 4,041 -337 -8%
Total Total commodities 64,882 66,113 48,959 59,856 72,759 67,160 64,442 64,763 65,378 64,742 72,013 7,271 10%
Source: Statistics Canada.Table 388-0010 - Natural resources satellite account, indicators, annual (dollars unless otherwise noted).
FACTS & FIGURES 2018 19
TITLE
Return to text
FIGURE 3 CONTINUEDNATURAL RESOURCES SATELLITE ACCOUNT, INDICATORS, ANNUAL (DOLLARS X 1,000,000)
Mining Industry Real GDP
Indicators Commodities 2007 2008 2009 2010 2011 2012 2013 2014 2015 2016 20172016 - 2017
% diff.
Gross value added
Total commodities 46,503 47,223 36,234 39,935 43,998 43,653 42,816 44,473 44,927 44,865 45,818 953 2%
Gross value added
Extraction 23,347 23,993 18,238 19,967 22,589 22,130 22,602 23,610 24,796 24,780 24,353 -427 -2%
Gross value added
Coal 1,669 1,758 1,472 1,668 1,629 1,658 1,780 1,536 1,421 1,426 1,393 -33 -2%
Gross value added
Metallic minerals 16,197 16,957 13,164 13,647 15,973 16,063 16,361 17,165 18,240 18,385 17,240 -1,145 -7%
Gross value added
Non-metallic minerals 5,481 5,278 3,602 4,652 4,987 4,409 4,461 4,909 5,135 4,969 5,720 751 13%
Gross value added
Services 3,861 4,251 3,080 3,813 4,523 4,612 4,340 4,018 3,804 3,324 4,070 746 18%
Gross value added
Primary manufacturing 19,295 18,979 14,916 16,155 16,886 16,911 15,874 16,845 16,327 16,761 17,395 634 4%
Gross value added
Primary metallic minerals products
12,436 12,403 9,341 10,442 11,060 10,954 10,419 11,277 10,901 11,372 11,651 279 2%
Gross value added
Primary non-metallic minerals products
6,859 6,576 5,575 5,713 5,826 5,957 5,455 5,568 5,426 5,389 5,744 355 6%
Gross value added
Total commodities 18,378 16,688 14,604 15,851 17,580 18,734 19,446 20,182 19,574 18,992 19,701 709 4%
Gross value added
Miscellaneous metal products
2,155 1,709 2,013 2,372 3,003 3,220 3,191 3,202 3,200 3,054 2,673 -381 -14%
Gross value added
Secondary metal products 3,081 3,264 2,190 2,729 2,871 2,950 3,180 3,516 3,201 3,259 3,657 398 11%
Gross value added
Services and custom work 2,128 1,867 1,727 1,825 2,045 2,197 2,263 2,377 2,325 2,276 2,417 141 6%
Gross value added
Tertiary metal products 11,014 9,848 8,674 8,925 9,661 10,367 10,812 11,087 10,848 10,403 10,954 551 5%
Total Total commodities 64,881 63,911 50,838 55,786 61,578 62,387 62,262 64,655 64,501 63,857 65,519 1,662 3%
Source: Statistics Canada.Table 388-0010 - Natural resources satellite account, indicators, annual (dollars unless otherwise noted).

20 FACTS & FIGURES 2018
TITLE
Source: The Mining Association of Canada.
Return to text
FIGURE 4CANADIAN MINING INDUSTRY CLUSTERS

FACTS & FIGURES 2018 21
TITLE
Return to text
FIGURE 5VALUE OF CANADIAN MINERAL PRODUCTION BY PROVINCE AND TERRITORY, 2008 AND 2017p
2008 2017p
Province/Territory ($ current millions) (%) RANK ($ current millions) (%) RANK
Ontario 8,947.7 19.8 1 9,862.5 22.5 1
British Columbia 7,087.6 15.7 3 8,835.8 20.1 2
Quebec 5,801.3 12.8 4 8,609.5 19.6 3
Saskatchewan 8,603.9 19.0 2 5,718.2 13.0 4
Newfoundland and Labrador 5,315.8 11.8 5 2,926.6 6.7 5
Alberta 3,588.5 7.9 6 2,443.9 5.6 6
Northwest Territories 2,123.5 4.7 7 2,070.2 4.7 7
Manitoba 1,687.0 3.7 8 1,655.7 3.8 8
Nunavut 12.7 … 12 844.4 1.9 9
New Brunswick 1,537.0 3.4 9 392.8 0.9 10
Yukon 207.6 0.5 11 300.9 0.7 11
Nova Scotia 307.0 0.7 10 237.4 0.5 12
Prince Edward Island 3.2 … 13 6.0 … 13
Canada 45,222.7 100.0 43,903.8 100.0
Sources: Natural Resources Canada; Statistics Canada.P Preliminary; ... Amount too small to be expressed.Note: This table includes the production of coal but excludes the production of petroleum and natural gas. Numbers may not add to totals due to rounding. As of reference year 2017, Statistics Canada has ceased the collection of the cement data. Values for cement production have been removed from 2008 numbers.

22 FACTS & FIGURES 2018
TITLE
Return to text
FIGURE 6TOTAL MINERAL DEVELOPMENT EXPENDITURES, BY STAGE AND PROVINCE AND TERRITORY, 2017p
Source: Natural Resources Canada, based on the Federal-Provincial-Territorial Survey of Mineral Exploration, Deposit Appraisal and Mine Complex Development Expenditures.P Preliminary. Note: Includes on-mine-site and off-mine-site activities. Includes field work, overhead costs, engineering, economic, pre-feasibility, feasibility, and environmental studies, and land access costs. Expenditures for mine complex development include machinery and equipment and non-residential construction.
($ millions)
Province/Territory Exploration Deposit Appraisal Mine Complex Development Total
Newfoundland and Labrador 35.9 1.3 512.2 549.4
Nova Scotia 5.0 14.4 183.2 202.6
New Brunswick 13.1 1.2 16.7 31.0
Quebec 365.7 414.2 1,381.2 2,161.1
Ontario 379.8 230.7 1,919.7 2,530.2
Manitoba 24.9 13.7 174.1 212.7
Saskatchewan 159.4 30.5 1,607.0 1,796.9
Alberta 4.3 32.7 93.9 130.9
British Columbia 182.4 79.0 896.8 1,158.2
Yukon 109.4 80.6 14.2 204.3
Northwest Territories 84.0 6.0 309.1 399.1
Nunavut 117.0 173.8 667.0 957.8
Canada 1,481.0 1,078.1 7,775.0 10,334.2

FACTS & FIGURES 2018 23
TITLE
Return to text
FIGURE 7COMPARATIVE ANALYSIS OF CANADA AND US MINERAL TAX TREATMENT
Canada USA
Tax Rate: Federal 15,0% 21,0%
Province / State (deductible) 11,5% 6,0%
Total 26,5% 25,7%
Tax rate on export (FDII - high margin goods or services)
26,5% 16,1%
Depreciation rate 25% DB 100%
Resources Allowance / Percentage Depletion N/A up to 50%
R&D Credits all incremental
Interest deduction Thin cap rules 30% EBITDA
Loss carry forward
pre-2018 losses 100% income 100% income
pre-2017 losses 100% income 80% income
Source: The Mining Association of Canada.

24 FACTS & FIGURES 2018
TITLE
Return to text
FIGURE 8CANADA V USA: A TAX COMPARISON
USA Canada USA Canada
Revenue 1,000 $ 1,000 $ 2,000 $ 2,000 $
Deductible costs (800) $ (800) $ (800) $ (800) $
Taxable income before percentage depletion 200 $ 200 $ 1,200 $ 1,200 $
Percentage depletion / Lesser of USA Canada USA Canada
50% of mining profit 100 $ 600 $
15% of gross mining revenue1 150 $ (100) $ N/A 300 $ (300) $ N/A
100 $ 200 $ 900 $ 1,200 $
USA Canada USA Canada
Resource allowance at 33 1/3% N/A (67) $ N/A (400) $
100 $ 133 $ 900 $ 800 $
Taxable income USA Canada USA Canada
Federal tax 21.0% 15.0% 21.0% 15.0%
State (deductible) / Provincial tax 6.0% 11.5% 6.0% 11.5%
25.7% 26.5% 25.7% 26.5%
USA Canada USA Canada
Income tax payable 26 $ 35 $ 232 $ 212 $
Effective tax rate 12.9% 17.7% 19.3% 17.7%
Source: Mining Association of Canada.1) Percentage of gross mining revenue varies with the ore mined.2) Taxpayers can deduct the highest between depletion and the percentage depletion. Depletion is computed on capitalized development costs.

FACTS & FIGURES 2018 25
TITLE
SECTION 2
THE ACTIVITIES: PRODUCTION, PROCESSING
AND TRANSPORTATION
PRODUCTION OF KEY MINERALSRichly endowed with natural resources, Canada ranks among the top five countries in the global production of 16 major minerals and metals (details in Annex 4):
• First in potash
• Second in uranium and niobium
• Third in nickel, gemstones, indium, aluminum, and platinum group metals
• Fourth in cobalt, cadmium, graphite, and sulphur
• Fifth in diamonds, titanium, gold, and mica
While Canada produces some 60 different minerals and metals, its status as a top-five producer has slipped and shifted over the past 15 years. Today, Canada no longer holds this position as a producer of copper, zinc, molybdenum, lead and cadmium, having been surpassed by other countries at different times. Over the past five years, Canada has lost ranking for seven out of 16 commodities for which it had been a top-five producer. Notable, however, is that Canada has become a top-five producer over the same time period of four commodities for which it previously was not on the charts. These include mica, indium, gemstones and graphite. Also notable is that Canada is third in the world for diamonds, according to value, despite being fifth in production.
PRODUCTION VALUESIn 2017, the value of Canadian mineral production increased for the first time in four years, rising 7.7% (or by more than $3 billion) to $43.9 billion (see Figure 9). Values increased across metal, non-metal and coal streams, though coal accounted for the largest increase, rising $2.2 billion. Increases are indicative of steady upward mobility in commodity prices over the course of 2017.
Canada’s top 10 minerals and metals (see Figure 10) each had production values of more than $1.6 billion in 2017, with five (gold, potash, copper, iron ore and coal) at more than $3 billion each. Values for seven out of the 10 commodities are projected to increase in 2017, with coal leading the charge with a 77% ($2.7 billion) increase year-over-year, followed by diamonds with a nearly $1 billion increase, and then potash with an 18%, or $682 million increase. Together, the top 10 minerals and metals represented $37.4 billion (87%) of Canada’s total mineral production value in 2017. See Annex 5 for a complete set of production volumes and values.
On the petroleum front, synthetic crude oil accounted for 30.3% of Canada’s crude oil production volume in 2017, up modestly over 2016 (see Figure 11). Indicative of an increase in oil prices, the absolute value of synthetic crude oil production increased from $19.3 billion to $25.4 billion year-over-year.
CANADA’S STRENGTH IN MINING RESTS ON THE ABILITY TO PRODUCE AND PROCESS MINERALS COMPETITIVELY AND TO TRANSPORT PRODUCTS EFFICIENTLY TO DOMESTIC AND INTERNATIONAL MARKETS. THESE PRODUCTION, PROCESSING AND TRANSPORTATION ACTIVITIES FORM THE BASE THAT ALLOWS THE INDUSTRY TO STAY GLOBALLY COMPETITIVE AND EXPAND ITS CANADIAN INVESTMENTS.

26 FACTS & FIGURES 2018
THE ACTIVITIES: PRODUCTION, PROCESSING AND TRANSPORTATION
PROCESSING OF MINERALSCanada has a large mineral-processing industry, with 31 facilities - comprised of non-ferrous metal smelters, refineries and conversion facilities – in seven provinces (see Figure 12).
Canada’s integrated smelters and refineries were built in proximity to world-class mines, most located inland, without access to low-cost marine transport. As local ore reserves increasingly become depleted (discussed in Section 3) and the production of base metal concentrate declines, smelters and refineries are transitioning from integrated production to the more expensive custom treatment of concentrates imported from other countries. Additionally, they are also using more secondary raw materials and scrap feed.
The quantity and value of refined metal production in Canada has become irregular due to the depletion of reserves and greater dependence on imported concentrates. Figure 13 shows that the production volumes for refined metals over the past 10 years have been mixed. Nickel, lead, cobalt and aluminum have increased, while copper, cadmium and zinc have decreased.
The competitiveness of Canada’s mineral-processing industry depends largely on the ability to secure reliable sources of feedstock from domestic mines – a supply that, in recent years, has gone into decline. Importing feedstock from abroad greatly influences the cost and profitability of domestic refining and smelting operations.
If the industry is to remain competitive, enhancing domestic levels of mineral production through requisite investment in exploration and development is essential.
Other factors also influence the competitiveness of Canada’s mineral-processing industry. Canada’s processing facilities operate in a global arena, where China and other countries are expanding their capacity and competing fiercely for raw materials. The cost of electricity is also a factor in some Canadian jurisdictions. Given the energy-intensive nature of these value-added processes, high-cost power jurisdictions dampen the competitiveness of existing operations and can deter future investment. Finally, the age of some Canadian operations, and their ability to meet potential regulatory requirements, also affects their viability.
In the face of these combined factors, the downstream Canadian mining industry risks being left behind. At stake are the benefits Canada has historically derived from a robust value-added mineral-processing and manufacturing sector, such as stable, long-term, and high-paying employment. For example, primary metal manufacturing accounted for nearly 46,000 jobs in 2017. Adding non-metallic mineral product manufacturing increases that number by 50,000 jobs. Both sectors combined account for almost one quarter of the industry’s overall direct employment for the year. While significant, these numbers have been in decline. Since 2007, employment in primary metal manufacturing has dropped by more than 25,000 jobs.
TRANSPORTATION OF MINING PRODUCTSCanada’s logistics supply chain is critical to the flow of mined and refined products to both domestic and international markets. The mining industry is the largest industrial customer group of Canada’s transportation sector, providing it with considerable tonnage, especially in select bulk commodities such as iron ore, coal, potash, and sulphur.
RailAs the largest shipper by both freight revenue and volume shipped, the mining industry is the Canadian rail system’s most significant customer. In 2017, shipments of coal, iron ore, potash and other minerals and metals represented 53.3% of total Canadian rail freight revenue (see Figure 14).
Canada’s rail freight system operates primarily as a dual monopoly, shared by CN and CP – Canada’s only Class I railways. Mining operations, in addition to communities and businesses, are frequently captive to only one railway given the remoteness of their locations.
• New Brunswick: 1 smelter
• Quebec: 9 smelters, 4 refineries, 2 secondary smelters
• Ontario: 2 secondary smelters, 3 refineries, 3 smelter/refineries, 1 conversion facility
• Manitoba: 1 smelter/refinery, 1 refinery
• Alberta: 1 refinery
• British Columbia: 1 smelter, 1 secondary smelter, 1 smelter/refinery, 1 processing plant
• Newfoundland and Labrador: 1 refinery
CANADA’S MINERAL-PROCESSING FACILITIES

FACTS & FIGURES 2018 27
THE ACTIVITIES: PRODUCTION, PROCESSING AND TRANSPORTATION
In 2008, the Canada Transportation Act (CTA) was amended to better protect shippers from potential abuse of market power by railways. The changes, supported by MAC and the Canadian mining industry, improved the balance between rail customers’ interests (lower rates, better service) and those of rail companies (higher rates, more profit) by strengthening the ability to arbitrate disputes over rail fees and ancillary charges. While these measures were an improvement, challenges have persisted in the relationship between railways and rail customers, with the former seeking deliberately to decrease the accessibility and functionality of the remedies that shippers have recourse to in the CTA.
In light of numerous challenges, and as a follow-up to these legislative changes, the federal government launched the Rail Freight Service Review in 2010, aimed at identifying service problems, examining best practices, and recommending remedies to improve service. Despite the resulting recommendations, the federal government’s commitment to table legislation to enact a shipper’s right to a service-level agreement fell short, as specific service provisions were not legislated in the Fair Rail Freight Service Act.
The inadequacy of this legislation resulted in continued rail service failures across all shipping sectors. The government responded with the Fair Rail for Grain Farmers Act, which enacted narrow grain-sector-specific legislative measures without any consultation. The scale of this issue garnered national media attention, and in June 2014, then-Minister of Transport, the Honourable Lisa Raitt, launched the 2015 statutory review of the Canada Transportation Act ahead of schedule.
Transportation Modernization ActIn spring 2017, and building on Transportation 2030: A Strategic Plan for the Future of Transportation in Canada, the Minister of Transport, the Honourable Marc Garneau, tabled Bill C-49, the Transportation Modernization Act.
While the package of reforms went further than those of Minister Garneau’s predecessors, they still fell short of rebalancing the position of railways and customers in the rail freight market. On the backdrop of a costly and reputationally damaging supply chain disruption in winter 2018, MAC, in partnership with seven other resource shipping associations, advanced two recommendations to improve the bill. The first was to give shippers a right to a costing assessment in the context of a Final Offer Arbitration (FOA), one of the remedies under the CTA. The second was to give the Canada Transportation Agency
unilateral “own-motion” powers to investigate service disruptions in the rail freight market– with the aim of expeditiously advancing solutions to reduce economic harm.
For decades, the one useful remedy for captive shippers was FOA. For a FOA to work properly, there has to be reasonable access to information on both sides of an arbitration, including with respect to costing. Without such information, shippers are negotiating in the dark, and arbitrators are unable to assess the reasonableness of bids. For many years, shippers requested such information during a FOA and the railways complied, leading to fair processes and reasonable outcomes. But that changed about a decade ago when railways started objecting to this information being shared, leaving shippers at a major disadvantage and effectively nullifying the FOA remedy.
MAC’s amendment would have made the provision of costing information a mandatory input into a FOA process, restoring the remedies to function as originally designed. The amendment was rejected on the basis of a false premise, and the own-motion powers proposal was reduced in scope, requiring the Agency to seek permission from the Minister instead of being able to act independently as a third-party regulator should be.
At the time of writing, MAC is unsurprised that none of bill’s new tools had been used since C-49’s enactment, despite their having been lauded by decision-makers as key solutions to the challenges shippers face. Meanwhile, service challenges have been mounting in recent weeks, and shippers across the supply chain are growing increasingly concerned that a supply chain disruption could occur again this winter, as occurred last. Unfortunately, shippers will have little recourse, and the window to affect change has closed for now.
TruckingTrucking plays a smaller yet important role in moving mining products. This, for the most part, has to do with the sheer volume of mined materials needing shipment, the remote location of many mining operations, and the factors that determine the economic viability of freight shipment by rail versus truck.
According to the federal government’s 2016 report, Transportation in Canada, trucks carried more than $223 billion in Canadian exports in 2016, 10% of which ($21.9 billion) were mining-related products. Trucks also carried $295 billion in imports to Canada, 9% of which ($25 billion) were mining-related products.

28 FACTS & FIGURES 2018
THE ACTIVITIES: PRODUCTION, PROCESSING AND TRANSPORTATION
Another key role trucking plays in the mining industry is the delivery of mining supply inputs to mine sites, such as fuel for operations. Mining sites that do not have access to rail rely on truck and marine shipping for these essential materials.
A 2016 report prepared for the Canadian Trucking Alliance indicates a two-fold demographic problem facing the trucking industry over the next decade. Firstly, truck drivers are among the oldest workforce in Canada, with 22% of drivers being between 55 and 64 years of age, with only 15% being between 25 and 34. The shortfall of truck drivers in Canada is estimated to reach 34,000 by 2024, though other plausible factors could increase this number to 48,000. Overcoming this shortfall – or preventing it – is a complex task, however immigration and improved recruitment strategies can and must play a role.
The Government of Canada is undertaking a consultation to “update the National Occupational System (NOC) and the associated Career Handbook”. The Express Entry program links Canada’s immigration system with the NOC, as it allows people classified as “federal skilled workers” to apply for expedited permanent residence to Canada. Modifying the NOC to allow for Transportation Truck Driver access to the Express Entry immigration option would help mitigate the truck driver shortage, improving the productivity of Canada’s economy.
MarineMining is also a leading customer of Canadian ports. The Port of Montreal handles large volumes of iron ore and salt, as well as other mineral products such as fertilizer, ores, gypsum, and scrap metal. Total mined products account for approximately 3 million tonnes annually, or ~50%, of the port’s dry bulk cargo shipments for the year. Generally, these arrive by ship as inbound cargo and are then transported by rail or truck to the region’s smelting and refining facilities.
Beyond Montreal, the mining industry is a major contributor to Canada’s St. Lawrence Seaway. Shipments of iron ore, coke and coal represent ~30% of total seaway traffic, with iron ore accounting for the single-largest share of any commodity shipped. Total mining products account for ~40% of total volume.
Steelmaking coal accounts for ~30% of the total volume handled at the Port of Vancouver annually, which moves shipments to China, Japan, and other Asian markets. Fertilizer/potash represents another 10% of the port’s volume, and minerals and ores another 13%.
All told, mining products account for more than 50 million tonnes, or roughly 45% of the port’s volume.
The International Maritime Organization (IMO) is the global body that regulates pollution and safety practices at sea. The evolution of the International Maritime Solid Bulk Cargoes Code has implications for the way mining companies ship their products. (See Section 6 of this report for more discussion.)
PipelinesThe North American energy landscape is changing rapidly. Historically, Canadian oil companies shipped the majority of their product to the US, which was reliant on imports to meet its oil demand. However, hydraulic fracturing to produce oil and gas from shale and tight rock formations is transforming the US into a self-sufficient energy producer. Even in a low price environment, this development has drastically reduced the country’s needs for imported oil. Meanwhile, growth in global oil demand has shifted to Asia, with China surpassing the US as the world’s largest oil importer.
This shift in demand is challenging Canadian oil companies because existing transportation infrastructure is impeding their ability to access global markets. It is important to note that there are costs associated with the inadequacy of Canada’s existing pipeline network. Declining US demand, together with insufficient pipeline capacity and transportation bottlenecks in the US Midwest, are driving down the price for Canadian crude oils relative to other crude oils. In November 2018, Canadian heavy oil slumped below at $13-per-barrel compared to US Brent and West Texas Intermediate benchmarks, which remained above $50-per-barrel. Rachel Notley, Alberta’s Premier, has estimated the price decline to be costing Alberta oil producers, in aggregate, in excess of $80 million a day. When tallied, and if the price decline persists, economic losses approaching $30 billion could accrue over the course of the year.
To address this situation, Canada must develop new pipeline and port infrastructure to reach markets in Asia, the US Gulf Coast, eastern Canada, and the US seaboard markets. The first step is constructing the Trans Mountain Expansion Pipeline as expeditiously as possible.

FACTS & FIGURES 2018 29
TITLE
$ billions 1999 2000 2001 2002 2003 2004 2005 2006 2007 2008 2009 2010 2011 2012 2013 2014 2015 2016 2017p
Metals 9.7 11.0 10.4 10.4 9.7 12.4 14.6 21.1 26.2 22.6 15.5 21.4 25.6 23.6 23.5 24.2 23.1 23.3 24.0
Non-metals 6.1 6.2 6.3 6.5 7.4 8.7 8.8 8.6 9.8 17.7 10.2 13.2 16.2 14.9 13.9 14.1 14.8 12.1 13.6
Coal 1.5 1.4 1.6 1.6 1.5 1.6 2.9 2.9 2.7 5.0 4.4 5.5 7.5 5.9 4.9 3.9 3.1 4.0 6.2
Total Mineral Production
17.3 18.6 18.2 18.5 18.6 22.7 26.3 32.6 38.7 45.3 30.1 40.1 49.3 44.4 42.3 42.2 41.0 39.4 43.9
Sources: Natural Resources Canada; Statistics Canada.P Preliminary. Note: This table includes the production of coal but excludes the production of petroleum and natural gas. Numbers may not add to totals due to rounding.
Return to text
FIGURE 9VALUE OF CANADIAN MINERAL PRODUCTION, 1999–2017p

30 FACTS & FIGURES 2018
TITLE
2007 2017p
Unit of MeasureQuantity($ millions)
$ Value($ millions)
Quantity($ millions)
$ Value($ millions)
Gold 000 kg 102 2,461 164 8,690
Potash (K20)1 kt 11,085 2,815 12,214 4,571
Copper 000 t 578 4,418 584 4,669
Iron Ore kt 32,774 2,503 49,009 3,814
Nickel 000 t 245 9,795 201 2,694
Coal kt 69,131 2,735 59,893 6,238
Diamonds 000 ct 17,144 1,800 22,724 2,619
Sand and gravel kt 243,096 1,497 290,613 2,539
Stone kt 149,982 1,403 155,254 1,604
Sources: Natural Resources Canada; Statistics Canada.P Preliminary.Note: 1Shipments of potash to Canadian potassium sulphate plants are not included in this table. As of 2017, Statistics Canada is no longer conducting the monthly survey of cement, and values are no longer included in Canada’s mineral production. Cement production has also been excluded from 2007 values for comparability with 2017 data.
Return to text
FIGURE 10CANADA’S TOP TEN METALLIC AND NON-METALLIC MINERAL PRODUCTS, BY VALUE OF PRODUCTION, 2006 AND 2016p

FACTS & FIGURES 2018 31
TITLE
Synthetic Crude Oil (000's of m3)
Total Crude Oil and Equivalents
Synthetic Crude as % of Total
Synthetic Crude Oil ($000)
Total Crude Oil and Equivalents ($000)
Synthetic Crude as % of Total
ALBERTA
1998 17,870.8 94,676.2 18.9 2,313,518 9,734,475 23.8
1999 18,766.9 89,065.5 21.1 3,252,547 13,727,829 23.7
2000 18,608.0 89,136.1 20.9 5,188,916 21,687,681 23.9
2001 20,260.6 89,364.5 22.7 4,995,003 17,734,825 28.2
2002 25,494.6 89,885.1 28.4 6,455,743 19,778,759 32.6
2003 25,028.8 95,311.4 26.3 6,777,342 22,187,602 30.5
2004 26,661.9 101,007.0 26.4 8,570,468 27,767,704 30.9
2005 21,932.5 98,878.7 22.2 9,213,624 33,282,754 27.7
2006 28,764.2 106,017.8 27.1 14,831,145 38,498,843 38.5
2007 39,900.2 108,853.3 36.7 18,012,945 42,130,415 42.8
2008 38,020.7 108,322.4 35.1 25,214,415 62,941,690 40.1
2009 44,330.8 112,937.7 39.3 19,043,537 43,934,049 43.3
2010 46,110.5 119,559.3 38.6 23,473,269 54,005,153 43.5
2011 49,375.1 129,183.4 38.2 30,518,182 69,033,911 44.2
2012 52,455.2 143,873.9 36.5 28,588,084 69,346,737 41.2
2013 54,328.1 154,324.2 35.2 34,382,129 79,535,264 43.2
2014 55,345.9 168,971.7 32.8 35,467,401 94,140,139 37.7
2015 56,646.4 179,262.9 31.6 21,512,827 57,544,954 37.4
2016 54,072.0 179,202.5 30.2 19,276,126 51,957,648 37.1
2017 59,560.6 196,698.9 30.3 25,368,232 71,038,745 35.7
CANADA
1998 17,870.8 128,400.3 13.9 2,313,518 12,940,149 17.9
1999 18,766.9 122,287.0 15.3 3,252,547 18,698,282 17.4
2000 18,608.0 127,769.2 14.6 5,188,916 30,523,595 17
2001 20,260.7 128,951.0 15.7 4,995,003 24,911,953 20.1
2002 25,494.6 136,969.8 18.6 6,455,743 29,956,080 21.6
2003 25,028.8 144,813.2 17.3 6,777,342 33,610,498 20.2
2004 26,661.9 149,159.6 17.9 8,570,468 40,639,940 21.1
2005 21,932.5 146,207.9 15.0 9,213,624 49,159,801 18.7
2006 28,764.2 161,434.0 17.8 14,831,145 63,649,683 23.3
2007 39,900.2 160,448.3 24.9 18,012,945 62,919,592 28.6
2008 38,020.7 158,950.4 23.9 25,214,415 91,757,005 27.5
2009 44,330.8 158,100.4 28.0 19,043,537 61,558,676 30.9
2010 46,110.5 165,335.3 27.9 23,473,269 75,174,373 31.2
2011 49,375.1 175,312.1 28.5 30,518,182 95,496,704 32.3
2012 52,455.2 189,133.7 27.7 28,588,084 94,076,834 30.4
2013 54,328.1 202,292.6 26.9 34,382,129 106,507,173 32.3
2014 55,345.9 218,050.8 25.4 35,467,401 122,128,728 29.0
2015 56,646.4 224,157.5 25.3 21,512,827 72,081,704 29.8
2016 54,072.0 225,089.3 24.0 19,276,126 65,410,168 29.5
2017 59,560.6 243,808.3 24.4 25,368,232 88,202,203 28.8
Sources: Natural Resources Canada; Statistics Canada.
Return to text
FIGURE 11PRODUCTION OF SYNTHETIC CRUDE OIL BY OIL SANDS MINING PLANTS, ALBERTA AND CANADA, BY QUANTITY AND VALUE, 1998-2017

32 FACTS & FIGURES 2018
TITLE
Owner/Operator Operation Type of facility Location Outputs
Newfoundland and Labrador
Vale Newfoundland and Labrador Limited Long Harbour (Ref.) Long Harbour Ni, Cu, Co
New Brunswick
Glencore Canada Corporation Brunswick (Sm.) Belledune Pb, Ag, Bi
Quebec
Rio Tinto Aluminum Inc./Aluminium Austria Metall Québec/Hydro Aluminium a.s./Société générale de financement du Québec/Marubeni Québec Inc.
Alouette (Sm.) Sept-Îles Al
Alcoa Corporation Baie-Comeau (Sm.) Baie-Comeau Al
Rio Tinto Aluminum Inc. Grande-Baie (Sm.) Grande-Baie Al
Rio Tinto Aluminum Inc. Laterrière (Sm.) Laterrière Al
Rio Tinto Aluminum Inc. Vaudreuil Works (Ref.) Jonquière Alumina
Rio Tinto Aluminum Inc. Arvida (Sm.) Arvida Al
Rio Tinto Aluminum Inc. Alma (Sm.) Alma Al
Alcoa Corporation Deschambault (Sm.) Deschambault Al
Alcoa Corporation/Rio Tinto Aluminum Inc. Bécancour (Sm.) Bécancour Al
Glencore Canada Corporation CCR (Ref.) Montréal-EstCu, Au, Ag, Se, Te, Ni, PGM
Terrapure Environmental Sainte-Catherine (Ref.), (Sec. Sm.) Sainte-Catherine Recycled Pb
Glencore Canada CorporationGeneral Smelting Company of Canada
(Sec. Sm.) Lachine Recycled Pb
Glencore Canada Corporation/Noranda Income FundCanadian Electrolytic Zinc Limited (CEZinc)
(Ref.) Valleyfield Zn, Cd, S*
Glencore Canada Corporation Horne (Sm.) Rouyn-Noranda Cu, Au, Ag
Return to text
FIGURE 12NON-FERROUS SMELTERS AND REFINERIES IN CANADA, 2017
Source: Natural Resources Canada.Note: Included are operations that produced in 2014.(Sm.) Smelter.(Ref.) Refinery.(Sec. Sm.) Secondary smelter.(Pl.) Plant.(Con. Fac) Conversion facility.S* Sulphuric acid.

FACTS & FIGURES 2018 33
TITLE
FIGURE 12 CONTINUEDNON-FERROUS SMELTERS AND REFINERIES IN CANADA, 2017
Source: Natural Resources Canada.Note: Included are operations that produced in 2014.(Sm.) Smelter.(Ref.) Refinery.(Sec. Sm.) Secondary smelter.(Pl.) Plant.(Con. Fac) Conversion facility.S* Sulphuric acid.
Owner/Operator Operation Type of facility Location Outputs
Ontario
Royal Canadian Mint Ottawa (Ref.) Ottawa Au, Ag, Cu, PGM
Cameco Corporation Port Hope (Con. Fac.) Port Hope U
Vale Canada Limited Port Colborne (Ref.) Port Colborne Electrolytic Co, PGM, Co oxide
Tonolli Canada Ltd. Mississauga (Sec. Sm.) Mississauga Recycled Pb
Real Alloy Canada Ltd. Mississauga (Sec. Sm.) Mississauga Recycled Zn
Asahi Refining Canada Ltd. Brampton (Sm.), (Ref.) Brampton Au, Ag, Recycled Pb
Glencore Canada Corporation Sudbury (Sm.), (Pl.) Sudbury Ni, Cu, Co, Au, Ag, PGM
Vale Canada Limited Copper Cliff Complex (Sm.), (Ref.), (Pl.) Sudbury Ni, Au, Ag, Se, Te, PGM, S*
Cameco Corporation Blind River (Ref.) Blind River U
Manitoba
Vale Canada Limited Thompson (Sm.), (Ref.) Thompson Ni, Cu, Co
HudBay Minerals Inc. Flin Flon (Ref.) Flin Flon Zn
Alberta
Sherritt International Corporation/General Nickel Company S.A. (The Cobalt Refinery Company Inc.)
The Cobalt Refinery Company Inc.
(Ref.) Fort SaskatchewanNi, Co, Cu sulphide, ammonium sulphate
British Columbia
Teck Resources Limited Trail (Sm.), (Ref.), (Pl.) Trail Zn, Pb, Bi, Cd, In, Ge, Au, Ag, S*
Metalex Products Ltd. Richmond (Sec. Sm.) Burnaby Recycled Pb
Rio Tinto Alcan Inc. Kitimat (Sm.) Kitimat Al

34 FACTS & FIGURES 2018
TITLE
Metals 2004 2005 2006 2007 2008 2009 2010 2011 2012 2013 2014 2015 2016 2017p
Aluminum 2,592,160 2,894,204 3,051,128 3,082,625 3,120,148 3,030,269 2,963,210 2,987,964 2,780,556 2,967,364 2,858,238 2,880,035 3,208,707 3,211,882
Cadmium 1,880 1,727 2,090 1,388 1,409 1,299 1,357 1,240 1,286 1,313 1,187 1,159 2,305 1,802
Cobalt 4,673 4,618 4,555 4,883 4,899 4,358 4,145 5,317 5,322 4,012 4,527 5,359 5,584 6,469
Copper 526,955 515,223 500,463 453,453 442,050 335,896 319,618 273,761 275,990 321,511 325,352 330,902 314,074 327,113
Lead 241,169 230,237 250,464 236,688 259,094 258,854 273,017 282,589 279,150 281,781 281,456 268,863 273,299 276,079
Nickel 151,518 139,683 146,899 153,647 167,732 116,909 105,413 142,445 146,850 152,728 149,486 149,717 158,381 154,080
Zinc 805,438 724,035 824,464 802,103 764,310 685,504 693,014 662,151 648,619 651,638 649,217 683,118 685,409 603,947
(million tonnes) 2005 2006 2007 2008 2009 2010 2011 2012 2013 2014 2015 2016 2017p
Total Freight Volume 1 260.7 258.7 255.7 244.4 212.9 235.4 250.8 253.5 268.0 277.9 287.6 281.7 295.1
Total Crude Minerals 112.8 108.0 112.0 111.9 85.0 107.6 109.8 103.4 112.0 112.0 123.2 120.5 128.2
Total Processed Mineral Products 27.3 27.9 27.7 27.6 21.7 24.6 26.5 27.3 28.3 28.1 28.7 28.3 29.0
Total Crude and Processed Minerals 140.1 135.9 139.8 139.4 106.7 132.3 136.4 130.7 140.3 140.1 151.9 148.8 157.2
Crude Minerals and Processed Mineral Products as a Percentage of Total Freight Volume
53.7 52.5 54.7 57.1 50.1 56.2 54.4 51.5 52.4 50.4 52.8 52.8 53.3
Sources: Natural Resources Canada; Statistics Canada.P Preliminary.
Sources: Natural Resources Canada; Statistics Canada.P Preliminary.Note: 1Total freight volume reflects revenue freight, which refers to a local or interline shipment from which earnings accrue to a carrier. Total crude minerals include coal, but not oil and gas. Totals may not add due to rounding. Values for 2005 to 2016 have been revised.
Return to text
Return to text
FIGURE 13CANADIAN PRODUCTION OF SELECTED REFINED METALS, 2004-2017 P
FIGURE 14CRUDE MINERALS AND PROCESSED MINERAL PRODUCTS TRANSPORTED BY CANADIAN RAILWAYS, 2004-2017p

FACTS & FIGURES 2018 35
TITLE
SECTION 3
THE MONEY: RESERVES, PRICES, FINANCING, EXPLORATION AND INVESTMENT
CANADIAN RESERVESThe past 30 years have seen marked declines in proven and probable Canadian mineral reserves in all major base metals (see Figure 15 and Annex 6). Since 1980, the most dramatic declines have been in lead (99.6%) and zinc (92%). Copper (45%) and nickel (69%) reserves have also fallen significantly, as have silver (89%).
Recent years have shown fluctuating growth for certain commodities. Since 2009, gold, silver and copper reserves have fluctuated, with gold at historic highs and copper at heights not seen since the early 1990s. Zinc, lead and nickel, on the other hand, have ebbed downward, with current levels suggesting continued decline.
Consistent investment over time and access to large tracks of land to explore are needed to reverse the long-term decline in proven and probable reserves. To ensure the Canadian mining industry maintains its competitive advantage in this crucial area, the federal and provincial governments should continue to invest in geoscience and strengthen policies that provide incentives for exploration spending within Canada’s borders. For example, the federal government’s recent five-year renewal of the Mineral Exploration Tax Credit is a very welcome development for the mineral exploration sector.
MINERAL AND METAL PRICESMineral and metal prices are affected daily by global economic events. Prices for mined products are driven largely by the strength and performance of major economies. China, in particular, buys approximately
50% of the world’s base metals, up from just 5% in the 1980s. Additionally, as a means of controlling exports of key commodities, China stockpiles iron ore, aluminum, copper, nickel, tin, zinc, oil and other commodities when prices are low, making it difficult for analysts to accurately forecast how supply and demand dynamics are likely to affect prices for minerals.
Figure 16 illustrates the strong growth, on an annual basis, in mineral prices from 2000 to 2007, the dramatic decline for most metals in late 2008, the robust rebound of prices through 2011, and the subsequent downward pressure on many minerals and metals during the recent downturn. More recently, after two years of upward momentum across a number of minerals and metals, a number of prices for key materials are down year-to-date. The most dramatic decline is that of zinc, down nearly 25%, or $0.42 per pound, though still enjoying relatively strong prices compared to earlier lows. Uranium, on the other hand, after having struggled with downward price pressure for several years, is up more than $5.50 per pound (see Figure 17).
The general consensus is that demand for mineral and metal products should be favourable over the medium to long term, despite volatility. Rising incomes and increased prosperity in developing countries due to industrialization and urbanization will continue to drive global demand, as will the transition to a lower carbon future. With the gradual emergence of India and its demand for minerals and metals – which some speculate will overtake China by 2050 – the mining industry should enjoy favourable commodity prices despite anticipated periods of market volatility.
THE FINANCIAL HEALTH OF THE MINERAL EXPLORATION AND MINING SECTOR CAN BE MEASURED BY EXPLORATION AND DEPOSIT APPRAISAL AND BY CAPITAL SPENDING, BOTH OF WHICH ARE AFFECTED BY MINERAL AND METAL PRICES. GAUGING SPENDING LEVELS ALSO HELPS TO PREDICT THE FUTURE OF CANADA’S MINERAL PRODUCTION.
36 FACTS & FIGURES 2018
THE MONEY: RESERVES, PRICES, FINANCING, EXPLORATION AND INVESTMENT
FINANCINGCanada is the leading global centre for mining finance. The Toronto Stock Exchange (TSX) and TSX Venture Exchange (TSX-V) list 50% of the world’s publicly traded mining companies, which combined accounted for more mining equity capital raised (38% of the global total) than any other exchange in the last five years. In 2017, 1,211 of the firms listed on the TSX were mining companies. Together, they had a combined market value of $313.8 billion and raised $8.53 billion in equity. TSX-listed mining companies mainly deal in gold, copper, uranium, silver, diamonds, zinc, nickel, lithium, iron ore, zinc and molybdenum.
The TSX-V gives emerging companies efficient access to capital while offering investors a regulated market for venture investments. In 2018, the 997 mining companies listed on the TSX-V had a combined quoted market value of $22.9 billion and raised $3.2 billion in equity capital for the year. While junior mining companies have faced challenges in raising capital in recent years, this indicates improvement in access to capital to finance exploration activities. For more information, please visit the TSX at www.tsx.com/listings/listing-with-us/sector-and-product-profiles/mining.
Global FinancingThe global mining industry raised $24.2 billion in equity in 2017, up $2.5 billion year-over-year. As Figure 18 shows, while this level of equity is substantially lower than during peak levels of the super-cycle in 2009, it has increased consecutively over the past three years, and also represents an eight-fold increase over the $3.1 billion raised in 2000.
In 2017, 59% of all global mining equity financings were done on the two exchanges, representing over 35% of the equity capital raised globally for the same year – a 6% drop year-over-year.
Also noteworthy is that the TSX and TSX-V’s share of global mining equity raised in 2017 ($8.5 billion) represented a $900 million drop in absolute value compared to the previous year. While a number of factors likely contributed
to this, it suggests a modest loss of market share for mining and exploration financing at a time when investment in the sector globally is on the rise.
The large proportion of public financing conducted on the TSX reflects the exchange’s appeal to both junior and senior companies. The TSX-V’s unique ability to efficiently handle equity financings in the $1 million to $5 million range is one reason why Canadian companies lead the exploration business.
TSX-listed mining companies also have a strong global focus. As of January 2018, TSX and TSX-V companies were involved in 5,667 mineral projects worldwide (see Figure 19), with more than half of them in Canada. Most of the projects involve exploration, and very few will turn into operating mines. However, the locations do illustrate the prime areas of mining interest, and the broad international reach of the exchange.
EXPLORATIONThe goal of exploration is to locate large, high-grade reserves with minimal disturbance to the ground and the environment. Technological advances, including GPS surveying, airborne technologies and down-hole seismic imaging, have enabled companies to locate new deposits previously beyond discovery using traditional methods. Like research and development, exploration requires healthy levels of investment over the long term in order to achieve success.
Exploration and subsequent mine development are required to maintain healthy reserve levels. If this does not happen, the value-added aspects of Canada’s mining industry – such as smelting, refining and manufacturing – will diminish over time, and national and regional economies that benefit from strength in sectors such as manufacturing will weaken.
Exploration and Deposit Appraisal in CanadaThe financial health of the mineral exploration sector can be measured by spending on exploration and deposit appraisal. Gauging spending levels also assists in predicting the future of Canada’s mineral production. Natural Resources Canada (NRCan), which provides the numbers below, defines the two kinds of spending as follows:
• Exploration expenditures: Spending on activities up to and including the first delineation of a previously unknown mineral deposit.
On the TSX: 1,211
• Senior TSX companies: 224
• TSX-V companies: 987
TSX-LISTED MINING COMPANIES - 2017

FACTS & FIGURES 2018 37
THE MONEY: RESERVES, PRICES, FINANCING, EXPLORATION AND INVESTMENT
• Deposit appraisal expenditures: Spending on activities that bring a delineated deposit to the stage of detailed knowledge required for a production feasibility study.
The two expenditures combined are generically called “exploration spending.”
After six consecutive years of declining exploration expenditure, the industry witnessed a long-sought reversal of this trend in 2017. Rising by 30% year-over-year, exploration investment increased from $1.6 billion to $2.1 billion (see Figure 20). Looking ahead, investment intentions suggest a further increase in exploration spending in 2018 of 6%, or $2.23 billion.
Financing for Junior Mining SectorA major issue for junior mining companies is the persistent challenge of raising capital.
Indicative of this dampened financial investment climate is the reversal in exploration and deposit appraisal expenditures. For example, in 2007, junior companies accounted for the majority (67%) of expenditure on these activities, with majors accounting for the balance (see Figure 21). From 2007 until 2015, juniors accounted for less each year, and the majors’ share grew to 63%. The three consecutive years from 2016 to 2018 are indicative of a return toward normalcy as junior companies’ absolute share of exploration and deposit appraisal improved.
Allocation of Investment by Minerals and MetalsPrecious metals attracted the lion’s share of Canadian exploration spending again in 2017, accounting for 65% overall (see Figure 22) – a 5% increase over 2016. In 2017, spending intentions were $1.4 billion, a 48% increase year-over-year.
While base metal exploration’s share of total investment remained consistent year-over-year at ~14%, the absolute value of dollars invested in base metal exploration increased by 40%, from $209 million to $294 million. While it is positive that base metal exploration investment didn’t contract further year-over-year, this trend reinforces the ongoing depletion of Canadian base metal reserves, the replenishment of which is not keeping pace with global demand for these highly important metals. Without sustained and effective exploration, Canadian base metal production will outstrip reserve additions, reducing the competitiveness of our smelters and refineries.
In absolute terms, it is noteworthy that exploration and deposit appraisal expenditures were up year-over-year for all targets save two: uranium and non-metals (excluding diamonds). For the former, part of the challenge has been
the stubbornly low price for uranium despite projected increases in the number of nuclear reactors slated to come online in support of carbon-free electricity. As above noted, however, prices for uranium have increased in 2018, suggesting this target may attract more exploration and deposit appraisal investment in next year’s set of numbers.
International ExplorationGlobally, Canada has been a top destination for mineral exploration investment for the past 37 years. Canada dropped to second place in 1992 for non-ferrous exploration budgets, surpassed by Australia. In 2004, Canada regained the top position where it has remained ever since, despite forfeiting market-share.
SNL Metals & Mining, in its 2018 edition of the State of Mineral Finance, assessed that global exploration expenditures from 2012-2017 declined over 65% from a peak of US $20.5 billion in 2012 to US $6.9 billion in 2016. The report confirmed a trend reversal in 2017 as expenditures increased approximately 15% compared to 2016 (to US $7.9 billion). Canada and Australia continued to lead global activity in 2017, accounting for 13.8% and 13.5% of expenditures, respectively. Of note is Canada’s long-term decline in the share of global exploration spending, from 20.5% in 2008 to 13.8% in 2017.
When exploration budgets factor in iron ore, SNL data indicate that Canada no longer attracts the single-largest share of total global mineral exploration budgets, conceding first place to Australia. Australia’s attractiveness as a destination for investment has increased recently with its introduction of a flow-through share mechanism to bolster investment in early stage exploration. Part of the challenge in Canada is regulatory uncertainty, as companies will not invest where they do not believe they can permit a mine. At the time of writing, many regulatory review processes remained ongoing, with significant decisions laying ahead. Another challenge for junior companies in recent years has been raising capital to finance exploration activities. The government's decision to extend the Mineral Exploration Tax Credit for five years, discussed further below, will help address this challenge and bring more predictability for explorers seeking to raise capital.
Only a handful of major discoveries and projects will come into production within the next five years, and many new developments will be smaller scale. The industry is still paying for the period of low exploration spending in the 1990s and early 2000s when the last super-cycle began. The dramatic rise in spending during the 2000s, in tandem with rising metal prices, was offset to some extent by the rising costs of drilling, assaying, geosciences expertise, fuel

38 FACTS & FIGURES 2018
THE MONEY: RESERVES, PRICES, FINANCING, EXPLORATION AND INVESTMENT
and other inputs. Regulatory and infrastructure challenges are also contributing factors in lengthening the time it takes for new discoveries to develop into producing mines. The decrease in global exploration spending in recent years will result in a further decline in the rate at which major discoveries are made.
INVESTMENTCapital SpendingCapital spending is a barometer of how confident managers and investors are about current production capacity and future demand. Capital spending enables improvements such as:
• New mine construction and increases to existing mine capacity
• Process and technology improvements
• Modernization and expansion of smelters and refineries
• New product lines
• Mill improvements
• Energy retrofits
• Environmental improvements
Government and business capital spending also open up new regions for development. The extension of the Highway 37 transmission line in northeastern British Columbia is a good example of a long-term strategic infrastructure investment. Notably, this capital cost of $400 million will enhance the economics of an estimated $15 billion in mineral projects, with one already built – the $450 million, 300-person Red Chris mine owned by Imperial Metals – and others in development. Similarly, the extension of the Monts Otish Highway in northern Quebec will improve future prospects for the development of gold, diamond and copper projects in the surrounding region.
Most recently, the federal government announced $155 million for the T’licho Road and $90 million to extend a section of the McKenzie Valley Highway in the Northwest Territories, and $360 million for the Yukon Resource Gateway to expand several road networks in the Yukon. These projects will enhance the economics of several mining projects, such as Fortune Minerals’ Nico project in the Northwest Territories, Goldcorp’s Kaminak Gold project, and Western Copper and Gold’s Casino project in the Yukon. In addition, this investment in infrastructure will reduce exploration costs, improving land access.
Mining Industry Capital Investment In 2017, capital spending in the Canadian mining industry accounted for 4.4% of Canada’s total at $11.7 billion, down 0.5% year-over-year. This amount is down 16% from the previous year and marks the fifth consecutive year that capital spending has fallen (see Figure 23). For 2018, capital investment intentions project a sixth consecutive annual drop to $11.1 billion. This is particularly concerning given mineral and metal prices for a number of commodities have been rising, despite volatility, since January 2016.
Although capital spending covers all four stages of the industry, some 90% is typically invested in the first two stages, extraction (Stage 1) and smelting/refining (Stage 2). Within Stage 1, approximately two-thirds of capital spending goes towards construction and one-third towards machinery and equipment. Within Stage 2, the ratio is reversed, with about one-fifth of spending directed to construction and the rest to machinery and equipment.
Spending on repairs, most of which falls into the machinery and equipment category, is not included in Figure 23 as this data lags behind capital expenditure data by one year. Adding 2016 repair costs (about $3.9 billion) to 2017 capital ($11.6 billion) and exploration ($2.1 billion) spending produced roughly $17.2 billion in Canadian mineral development investment in 2017.
Current and Future Investments Healthier commodity prices have returned a cautious optimism to the global mining industry, which could lead mining companies to make new and significant investments. However, there are also recent indicators that Canada’s competitiveness as a destination for mineral investment is eroding, just as an upturn in the industry is underway:
• Capital investment in the mining sector has declined each year since 2012, with investment intentions for 2018 in line with this trend. Only four new mining projects were submitted to the federal environmental assessment registry under the Canadian Environmental Assessment Act (CEAA 2012) in 2016 – all of them gold.
• The size of Australia’s mining supply sector surpassed Canada’s in 2015.
• Over the last five years, Canada has lost more ground than it has gained in the commodities for which it is a top-five global producer.
Beyond the above quantitative metrics, qualitative indicators from MAC member companies suggest that Canada’s competitiveness is declining compared to other jurisdictions.

FACTS & FIGURES 2018 39
THE MONEY: RESERVES, PRICES, FINANCING, EXPLORATION AND INVESTMENT
Mining companies are assessing other jurisdictions outside of our own as alternative destinations for developing projects.
The recent edition of NRCan’s annual report, Natural Resources: Major Projects Planned and Under Construction – 2018 to 2028, presents a grim picture of major mining project investment in Canada, indicating that the total value of projects planned and under construction from 2018 to 2028 has reduced by 55% since 2014, from $160 billion to $72 billion.
Although mineral prices were in decline in recent years, they account for only part of the drop in mineral investment. In 2016, the year in which Canada’s total mining project investment decreased by approximately $50 billion, Australia’s capital expenditure rose for 18 consecutive months, according to the Minerals Council of Australia. This suggests that more than just mineral pricing determines where companies invest, and that they are increasingly more confident in Australia than in Canada as a destination.
Mining Industry Competitiveness and Federal Public PolicyMAC maintains that federal regulatory policies have dampened Canada’s competitiveness as a destination for mineral investment. Reviews of federal environmental legislation, the pan-Canadian climate change policy, long-standing transportation challenges, and tax competitiveness concerns all contribute to the uncertain policy landscape in Canada. MAC has remained very engaged in many of these policy consultations and is cautiously optimistic that a number of the key considerations we have made have been taken into account by decision makers. Nevertheless, the Canadian mining industry is awaiting the outcomes of these major government decisions in policy areas of concern – all of which are critically important to maintaining our competitiveness.
Recent announcements by the federal government have provided cause for cautious optimism, and MAC welcomed the measures included in the 2018 Fall Economic Statement as an important boost to Canadian mining competitiveness. Key measures proposed that will enhance the investment competitiveness of Canada’s mining and metal manufacturing sectors, include:
• The Accelerated Investment Incentive, which will enable miners to write off three times the eligible cost of newly acquired assets in the year the investment is made.
• Extending the Mineral Exploration Tax Credit for a five-year term, bringing greater investment certainty for early stage mineral exploration.
• Allowing businesses to immediately write-off the full cost of clean energy equipment.
At the same time, federal, provincial and territorial governments have also acknowledged the issue of declining competitiveness and have, collectively, committed to develop a strategy for addressing it. The Canadian Minerals and Metals Plan will be launched in 2019, and the industry is hopeful that it will include new measures to boost support and renew interest in Canada as a destination for mineral exploration and mining investment.
While more work is needed to improve Canada’s mining tax competitiveness, these measures are both timely, important and substantial. Critical to Canada taking full advantage of these measures to attract investment is achieving greater clarity in the regulatory environment.
Mining is a significant engine of the Canadian economy and supports many other important sectors, including construction, manufacturing and transportation. While Canada remains one of the top mining countries, its leadership in this arena is not guaranteed. If Canada loses its competitiveness, this will translate into an increasing amount of exploration and mining investments flowing offshore, job losses, deteriorating trade balances and, overall, a weakening of our economic strength.

40 FACTS & FIGURES 2018
TITLE
Metal Contained in Proven and Probable Mineable Ore1 in Operating Mines2 and Deposits Committed to Production3
YearCopper(000 t)
Nickel(000 t)
Lead(000 t)
Zinc(000 t)
Molybdenum(000 t)
Silver(t)
Gold(t)
1980 16,714 8,348 9,637 27,742 551 33,804 826
1985 14,201 7,041 8,503 24,553 331 29,442 1,373
1990 11,261 5,776 5,643 17,847 198 20,102 1,542
1995 9,250 5,832 3,660 14,712 129 19,073 1,540
2000 7,419 4,782 1,315 8,876 97 13,919 1,142
2003 6,037 4,303 749 6,251 78 9,245 1,009
2004 5,546 3,846 667 5,299 80 6,568 787
2005 6,589 3,960 552 5,063 95 6,684 958
2006 6,923 3,940 737 6,055 101 6,873 1,032
2007 7,565 3,778 682 5,984 213 6,588 987
2008 7,456 3,605 534 5,005 222 5,665 947
2009 7,290 3,301 451 4,250 215 6,254 918
2010 10,747 3,074 400 4,133 254 6,916 1,473
2011 10,570 2,936 247 4,812 256 6,954 2,225
2012 10,364 2,617 126 4,163 256 5,598 2,148
2013 10,777 2,682 116 3,532 145 5,013 2,140
2014 10,214 2,287 88 2,972 121 5,498 2,070
2015 9,937 2,725 83 3,009 101 5,345 1,984
2016 P 9,101 2,604 40 2,231 98 3,626 1,910
Source: Natural Resources Canada, based on company reports and the Federal-Provincial/Territorial Annual Survey of Mines and Concentrators. 1No allowance is made for losses in milling, smelting and refining. Excludes material classified as “resources.” 2Includes metal in mines where production has been suspended temporarily. 3Excludes metal in placer deposits because reserves data are generally unavailable. P Preliminary. Note: One tonne (t) = 1.1023113 short tons = 32 150.746 troy oz.
Return to text
FIGURE 15CANADIAN RESERVES OF SELECTED METALS, 1980 - 2016 P

FACTS & FIGURES 2018 41
TITLE
Aluminum Copper Gold Iron Ore1 Nickel Silver Uranium Zinc
Prices US ¢/lb US ¢/lb US $/tr. oz US $/DMT US $/lb US ¢/tr. oz US $/lb US ¢/lb
2018 (May) $99.92 $313.42 $1,324.98 $71.20 $6.18 $1,666.40 $21.61 $149.61
2017 $89.25 $279.86 $1,257.56 $71.76 $4.72 $1,706.58 $21.66 $131.13
2016 $72.12 $214.20 $1,326.03 $56.67 $4.62 $1,928.50 $23.00 $103.79
2015 $75.41 $249.52 $1,160.11 $55.21 $5.36 $1,571.67 $36.46 $81.50
2014 $84.62 $311.13 $1,266.12 $96.84 $7.65 $1,907.15 $33.21 $98.05
2013 $83.70 $332.29 $1,411.06 $135.36 $6.81 $2,385.81 $38.17 $86.64
2012 $91.59 $360.58 $1,668.81 $128.53 $7.89 $3,121.17 $48.40 $88.35
2011 $108.77 $400.10 $1,568.58 $167.79 $10.38 $3,526.42 $56.37 $99.47
2010 $98.55 $341.74 $1,224.66 $146.72 $9.89 $2,019.67 $46.84 $97.99
2009 $75.50 $233.67 $972.98 $79.99 $6.64 $1,469.43 $46.06 $75.06
2008 $116.68 $315.47 $871.67 $61.57 $9.57 $1,499.90 $61.71 $85.01
2007 $119.65 $322.83 $696.66 $36.63 $16.88 $1,341.47 $99.33 $147.03
2006 $116.55 $304.85 $604.34 $33.45 $11.00 $1,156.96 $49.61 $145.15
2005 $86.10 $166.84 $444.88 $28.11 $6.69 $733.96 $28.67 $62.66
2004 $77.82 $129.96 $409.21 $16.39 $6.27 $669.05 $18.60 $47.51
2003 $64.92 $80.68 $363.51 $13.82 $4.37 $491.07 $11.55 $37.75
2002 $61.23 $70.72 $309.97 $12.68 $3.07 $462.52 $9.88 $35.31
2001 $66.46 $72.74 $269.98 $12.99 $2.77 $441.43 $8.82 $41.27
Source: Market Insider 1April 2010 marked the end of the 40-year global benchmarking system for sale of iron ore under contract prices. Thus, new historical data based on U.S. $/dmt will have to be utilized.
Return to text
FIGURE 16METAL PRICES, 2001-2017

42 FACTS & FIGURES 2018
TITLE
Source: Gamah International, compiled by Toronto Stock Exchange.Note: All values as at December 31, 2015.
Source: Market Insider.
(US$ billions)
Equity Raised 2000 2007 2008 2009 2010 2011 2012 2013 2014 2015 2016 2017
Worldwide 3.1 50.3 46.6 65.9 29.6 31.7 14.8 15 14.40 19.8 22.7 24.2
TSX exchanges 1.1 17.6 8.3 22.2 17.8 12.5 10.3 6.9 8.9 6.8 9.4 8.5
% of worldwide total on TSX and TSX-V
36 35 18 34 60 39 70 46 62 34 41 35
($ current)
Aluminum Gold Silver Copper Nickel Zinc Iron Ore Uranium
US ¢/lb US$/tr. oz US$/tr. oz US$/lb US$/lb US$/lb US$/DMT US$/lb
Jan-18 $110.89 $1,333.22 $17.18 $3.53 $6.45 $1.72 $76.15 $23.31
Feb-18 $108.56 $1,329.55 $16.60 $3.50 $6.80 $1.77 $75.92 $21.80
Mar-18 $104.46 $1,326.52 $16.49 $3.40 $6.69 $1.64 $72.57 $21.86
Apr-18 $113.31 $1,334.22 $16.63 $3.43 $6.97 $1.59 $64.62 $20.76
May-18 $114.84 $1,307.15 $16.49 $3.42 $7.18 $1.53 $66.72 $22.05
Jun-18 $111.70 $1,281.82 $16.51 $3.48 $7.57 $1.54 $65.01 $23.14
Jul-18 $103.28 $1,235.30 $15.74 $3.13 $6.90 $1.33 $63.56 $23.78
Aug-18 $103.61 $1,201.87 $14.99 $3.02 $6.70 $1.26 $67.87 $26.20
Sep-18 $102.91 $1,197.47 $14.28 $3.03 $6.26 $1.22 $68.28 $27.17
Oct-18 $102.04 $1,216.36 $14.58 $3.11 $6.15 $1.34 $70.79 $27.67
Nov-18 $97.52 $1,223.58 $14.39 $3.10 $5.62 $1.30 $74.27 $28.95
% Change-to-date
-12.05% -8.22% -16.24% -12.33% -12.77% -24.67% -2.48% 24.21%
Return to text
Return to text
FIGURE 17MONTHLY METAL PRICES 2018
FIGURE 18MINING EQUITY RAISED - ROLE OF TORONTO STOCK EXCHANGE, 2000–2017

FACTS & FIGURES 2018 43
TITLE
FIGURE 20MINERAL EXPLORATION AND DEPOSIT APPRAISAL EXPENDITURES, BY PROVINCE AND TERRITORY, 2006 - 2018 i
Source: Natural Resources Canada, based on the Federal-Provincial/Territorial Survey of Mineral Exploration, Deposit Appraisal and Mine Complex Development Expenditures.P Preliminary; iIntentions.Note: Includes on-mine-site and off-mine-site activities. Includes field work, overhead costs, engineering, economic and pre- or production feasibility studies, environment, and land access costs. Numbers may not add to totals due to rounding.
Source: InfoMine, TSX/TSX-V Market Intelligence Group, compiled by the Toronto Stock Exchange.
Location of Mineral Projects Number Percent
Canada 3,048 54
Latin America 1,113 20
United States 643 11
Africa 372 7
Asia/Russia/Middle East 251 4
United Kingdom and Europe 240 4
Total 5,667 100
($ millions)
Province/Territory 2006 2007 2008 2009 2010 2011 2012 2013 2014 2015 2016 2017 P 2018 i
% change from 2017 to 2018
Newfoundland and Labrador
148.0 146.7 54.9 105.2 156.8 199.9 117.2 80.7 47.4 25.4 36.7 38.5 4.9% 32.52%
Nova Scotia 23.5 21.4 9.0 16.7 13.7 14.6 12.3 7.0 10.1 5.3 19.4 17.3 -10.8% 51.43%
New Brunswick 35.8 32.7 8.1 17.1 27.1 28.0 27.6 29.0 8.6 14.2 14.3 18.1 26.6% 34.90%
Quebec 476.4 526.1 379.3 511.6 833.9 620.7 381.8 317.4 259.5 297.4 576.5 656.7 13.9% 38.78%
Ontario 571.7 799.3 536.2 853.4 1,067.7 961.5 562.0 468.1 440.2 394.3 526.2 593.0 12.7% 23.58%
Manitoba 102.6 152.1 97.8 83.5 140.0 105.6 61.4 28.0 46.9 47.3 38.5 54.7 42.1% 24.50%
Saskatchewan 314.0 430.7 311.0 299.4 334.6 411.1 221.7 245.2 257.0 228.7 189.9 165.1 -13.1% -19.54%
Alberta 11.8 20.8 8.3 15.2 47.3 35.2 38.9 26.1 18.5 16.7 27.5 39.7 44.4% 49.06%
British Columbia 470.6 435.4 217.1 374.4 645.1 734.1 493.0 448.9 346.3 231.5 257.7 290.9 12.9% 7.16%
Yukon 144.7 134.0 90.9 156.9 331.7 233.2 100.6 107.1 92.2 90.4 165.1 172.3 4.4% 6.59%
Northwest Territories
193.7 147.7 44.1 81.7 93.8 108.7 77.9 101.7 100.9 73.0 90.0 81.3 -9.7% -3.26%
Nunavut 338.0 432.6 187.6 256.7 535.7 422.5 257.6 158.0 215.0 204.5 169.3 110.7 -34.6% -25.37%
Total 2,830.8 3,279.5 1,944.4 2,771.9 4,227.4 3,875.1 2,352.0 2,017.4 1,842.4 1,628.8 2,111.3 2,238.2 6.01% 15.48%
Return to text
Return to text
FIGURE 19GEOGRAPHIC REACH OF TSX-LISTED COMPANIES, JANUARY 2018

44 FACTS & FIGURES 2018
TITLE
Source: Natural Resources Canada, based on the Federal-Provincial-Territorial Survey of Mineral Exploration, Deposit Appraisal and Mine Complex Development Expenditures.P Preliminary; iIntentions. Note: Includes on-mine-site and off-mine-site activities. Includes field work, overhead costs, engineering, economic and pre- or production feasibility studies, environment, and land access costs. Totals may not add due to rounding.
Type of Company 2007 % 2008 % 2009 % 2010 % 2011 % 2012 %
Junior 1,904.4 67.3 2,117.8 64.6 1,110.7 57.1 1,547.0 55.8 2,049.1 48.5 1,847.0 47.7
Senior 926.5 32.7 1,161.7 35.4 833.7 42.9 1,224.9 44.2 2,178.3 51.5 2,028.1 52.3
Total 2,830.8 3,279.5 1,944.4 2,771.9 4,227.4 3,875.1
Type of Company 2013 % 2014 % 2015 % 2016 % 2017 P % 2018 i %
Junior 963.6 41.0 814.3 40.4 577.7 31.4 633.9 38.9 964.1 48.2 1,025.5 45.8
Senior 1,388.4 59.0 1,203.2 59.6 1,264.7 68.6 994.9 61.1 1,147.7 57.4 1,212.7 54.2
Total 2,352.0 2,017.4 1,842.4 1,628.8 2,000.5 2,238.2
Return to text
2007 2016 P
$ millions % of Total $ millions % of Total
Precious metals 842.1 25.7 1,375.8 65.17
Base metals 1,161.4 35.4 294.0 13.93
Uranium 409.0 12.5 135.4 6.41
Coal 51.9 1.6 54.0 2.56
Non-metals (excluding diamonds) 179.4 5.5 57.5 2.72
Other metals 189.6 5.8 88.9 4.21
Diamonds 221.6 6.8 78.8 3.73
Iron ore 224.4 6.8 26.8 1.27
Total 3,279.5 100.0 2,111.2 100.0
Return to text
Source: Natural Resources Canada, based on the Federal-Provincial/Territorial Survey of Mineral Exploration, Deposit Appraisal and Mine Complex Development Expenditures.P Preliminary. Note: Includes on-mine site and off-mine site activities. Includes field work, overhead costs, engineering, economic and pre- or production feasibility studies, environment, and land access costs. Totals may not add due to rounding.
FIGURE 21MINERAL EXPLORATION AND DEPOSIT APPRAISAL EXPENDITURES, BY COMPANY TYPE, 2007 - 2018 i
FIGURE 22MINERAL EXPLORATION AND DEPOSIT APPRAISAL EXPENDITURES, BY TARGET, 2008 AND 2017 P

FACTS & FIGURES 2018 45
TITLE
Return to text
FIGURE 23CAPITAL EXPENDITURES IN THE CANADIAN MINING INDUSTRY, 2009 - 2018 i
Source: Statistics Canada, CANSIM Table 029-0046.P Preliminary; iIntentions.Note: Includes capital construction and machinery and equipment. As of 2014, capital expenditures on non-residential construction and on machinery and equipment exclude expenditures related to intellectual property, including mineral exploration activities. Historical values have been revised to reflect these methodological changes. Totals may not add due to rounding.
($ millions) 2009 2010 2011 2012 2013 2014 2015 2016 2017 2018
Stage 1 - Total Mineral Extraction 6,194 9,054 12,163 16,916 15,086 11,115 10,188 9,637 8,200 8,085
Metal ore mineral extraction 3,537 5,504 8,108 11,020 9,174 5,298 4,881 5,137 5,504 5,690
Non-metallic mineral extraction 2,297 2,853 3,083 4,812 5,243 5,433 5,078 4,294 2,361 1,891
Coal mining 361 697 972 1,085 668 384 230 206 335 504
Stage 2 - Primary Metal Manufacturing 948 1,823 2,936 3,864 3,458 3,332 3,219 2,329 1,902 1,693
Stage 3 - Non-Metallic Mineral Product Manufacturing 581 765 672 572 459 976 1,136 1,196 855 611
Stage 4 - Fabricated Metal Product Manufacturing 750 608 729 536 574 640 735 746 703 694
Total Mining and Mineral Processing 8,473 12,250 16,500 21,888 19,577 16,062 15,279 13,908 11,660 11,083
Non-conventional oil extraction (oil sands) 10,249 17,113 22,163 26,246 29,029 35,711 23,420 16,596 12,829 10,209

46 FACTS & FIGURES 2018
TITLE
SECTION 4
THE PEOPLE: EMPLOYMENT, COSTS
AND INNOVATION
THE CANADIAN MINING INDUSTRY ACCOUNTS FOR ONE IN EVERY 29 JOBS ACROSS CANADA AND, PROPORTIONALLY, IS THE LARGEST INDUSTRIAL EMPLOYER OF INDIGENOUS CANADIANS.
MINING INDUSTRY EMPLOYMENTAccording to Statistics Canada data, the mining industry directly employed 426,000 people in 2017, accounting for roughly one in every 43 Canadian jobs (see Figure 24). When indirect jobs are included, the industry’s employment reach increases significantly. According to Natural Resources Canada estimates, the mining industry indirectly employed an additional 208,000 individuals in 2017. Together, the industry’s direct and indirect employment exceeds 634,000 jobs, accounting for one in every 29 jobs in Canada.
Overall Employment NumbersIn 2017, 107,000 (52%) of those directly employed in mining worked in Stage 1, mineral extraction (see Figure 24). This included approximately 40,000 workers in metal mining, 25,000 workers in non-metal mining and 5,000 workers in coal mining (see Figure 24), with services accounting for the balance.
In the oil sands extraction sector, recent data show that Suncor and Syncrude directly employ approximately 14,000 and 5,000 people, respectively, in mining and oil and gas activities. These figures do not include indirect employees, which number in the thousands. Other oil sands mining companies, such as Canadian Natural Resources Limited and Imperial, increase these numbers further.
Employment statistics for mining and oil sands can change rapidly because of the cyclical reality of commodity markets and fluctuating prices, globalization and other trends. Recent mergers and acquisitions have changed the landscape of Canadian mining. Some companies have been acquired or no longer report separate employment figures.
Other companies report global figures without disaggregating for the Canadian component of their operations.
For example, Statistics Canada reported that employment in mining, quarrying, and oil and gas extraction rebounded in 2017 – after two years of losses – rising by 10,000 jobs (or 5.2%), with just under half of the increase taking place in Alberta (+4,700 or +4.8%). Increases were also reported in British Columbia (+1,600 or +9.0%), Quebec (+1,400 or +8.5%) and Ontario (+1,200 or +5.0%), where the rise was concentrated in the metal mining industry. In 2018, due to pipeline constraints and the significant price discount at which Canadian oil is selling, there is high likelihood that Alberta’s share of employment growth year-over-year will be constrained and potentially reverse.
Women in MiningWomen continue to be underrepresented in the mining labour force. According to the Mining Industry Human Resources Council’s (MiHR) 2018 edition of the Canadian Mining Labour Market Outlook, women accounted for only 16% of mining’s labour force in 2016 – down 1% from 2011. This remains significantly lower in relation to the Canadian
ACCORDING TO NATURAL RESOURCES CANADA, THE MINING INDUSTRY INDIRECTLY EMPLOYED AN ADDITIONAL 208,000 INDIVIDUALS IN 2017, BRINGING TOTAL EMPLOYMENT TO 634,000 JOBS.

FACTS & FIGURES 2018 47
THE PEOPLE: EMPLOYMENT, COSTS AND INNOVATION
labour force as a whole, where according to 2016 census data, women represent 48% of the national workforce.
Although the representation of women has remained relatively unchanged, there is indication of a momentum shift. For the selected occupations, women’s representation has increased across all industries in recent years, from 27% in 2011 to 31% in 2016 (see Figure 25). However, the mining industry has yet to realize these gains since the share in these occupations has remained constant, at 12% in both 2011 and 2016. This trend points to potential opportunities for the mining industry to increase its representation among the selected occupations. Overall, the findings from MiHR’s previous research remain constant — the industry continues to struggle with underrepresentation of women.
Concerted efforts by both industry and government are underway to attract and retain talented women in the mining industry. Developed on the foundation of a 2014-2016 research initiative – Strengthening Mining’s Talent Alloy: Exploring Gender Inclusion – MiHR’s Gender Equity in Mining Works (GEM Works) program offers comprehensive training to help establish Change Agents within an organization and ultimately eliminate unintentional barriers to gender inclusion found in dated policies, procedures and practices. Validated through industry leading labour market research and funded through Employment and Social Development Canada’s Sectoral Initiatives Program and the Department of Status of Women, the driving intent of GEM Works is to provide mining companies with tangible tools and training to increase the participation of women in the sector.
Following a successful launch of the pilot program in 2016, the number of active sites who have adopted and/or continue to use GEM Works training has increased. To learn more about this important work, visit MiHR’s website.
Employment of Indigenous PeopleProportionally, the mining industry is the largest private sector employer of Indigenous Canadians. According to MiHR research, Indigenous people represented more than 7% of the mining workforce in Canada in 2016, up from roughly 5% in 2011. Most of the Indigenous people in the mining industry are either Métis or First Nations, though Inuk employment in the sector has been growing as mining opportunities in Inuit regions have increased in recent years. Indigenous people are better represented in the mining industry (7.4%) than in all other industries (3.9%). Interestingly, the share of the mining workforce that is Métis nearly doubles the share found in all industries (see Figure 26).
Indigenous people in Canada comprise three main groups: First Nations, Métis and Inuit. In 2016, they accounted for 5% of the total population, up from about 4% in 2006, and 3% in 1996. Since 2006, the Indigenous population in Canada has grown by 43% − more than four times the rate of the non-Indigenous population − and is expected to reach more than 2.5 million over the next two decades.
A critical challenge is to ensure that this new cohort of Indigenous Canadians has the opportunity to participate meaningfully in the Canadian workforce and is provided with training and educational opportunities to advance and thrive. Approximately one in four Indigenous people of working age are not participating in the labour force. Since attaining an appropriate level of education is an important factor to entering the labour force, training to develop the requisite skills for meaningful participation is critical for accessing well-paying mining jobs.
Fortunately, the mining industry has proven an effective vehicle not just for Indigenous employment, but also for skills training and upward mobility. For example, Indigenous people in the mining workforce are increasingly pursuing formal education credentials. In 2006, 30% had no certificate, diploma or degree; by 2016, that rate fell to 22%. From 2006 to 2016, the share of Indigenous people in the mining workforce with a college, CEGEP or other non-university certificate or diploma rose by three percentage points, as did the rate for those with a university certificate, diploma or degree at bachelor level or above.
Potential for increased Indigenous employment remains strong. Most Indigenous communities are located within 200 kilometres of some 180 producing mines and more than 2,500 exploration properties. Also, many mines and projects are located on traditional lands. Indigenous people across the country are, therefore, ideally situated to access employment opportunities (and other benefits) in the mining industry. To learn more about how mining demonstrates opportunities for inclusive growth, see Section 5.
THE PROPORTION OF ABORIGINAL WORKERS IN THE MINING INDUSTRY IS WELL ABOVE THAT OF INDIGENOUS WORKERS IN THE CANADIAN WORKFORCE.

48 FACTS & FIGURES 2018
THE PEOPLE: EMPLOYMENT, COSTS AND INNOVATION
New Canadians and Visible Minority WorkersCensus data from 2016 demonstrate that immigrants and visible minorities in Canada each make up one-fifth of the country’s total population. Of the visible minority population, 30% were born in Canada. Statistics Canada projects that the immigrant share of Canada’s population could reach between 25% and 30% by 2036; Canada’s visible minority population is expected to be even higher, between 31% and 38%.
According to MiHR research, in 2016, the representation of immigrants (13%) and visible minorities (9%) in the mining workforce were both lower relative to all industries (23% and 21% respectively). Concurrently, the share of the mining workforce that are immigrants has been modestly increasing, from 12% in 2006 to 13% in 2016 (see Figure 27). Similarly, the share of visible minorities in mining is smaller relative to immigrants, but this gap is closing; the share of visible minorities in the mining workforce grew from 7% in 2006 to 9% in 2016.
Given an aging Canadian population, the need for new immigrants is increasing. Thus, appealing to this demographic is important to the medium- and longer-term sustainability of the mining sector workforce.
Need for Workers and SkillsThe mining industry, both in Canada and abroad, faces a number of human resources challenges. MiHR’s 2019 edition of the Canadian Mining Labour Market Outlook, estimates that the Canadian mining industry will need to hire 97,450 new workers over the next decade to 2029. These new hires are required to replace retirees and fill new positions to meet baseline production targets (see Figure 28). In its report, MiHR also forecasts contractionary and expansionary hiring scenarios. Notably, even in a contractionary scenario, the hiring forecast predicts that new hires will be necessary to meet labour demand.
This workforce shortage is compounded by the wave of the industry’s skilled core of workers who are retiring. By 2029, MiHR forecasts that more than 60,000 employees will retire from the sector, which represents over 25% of the industry’s current workforce by MiHR definitions. This will result in a significant loss of industry knowledge and experience.
This shift in demographics will lead to an entirely new set of challenges, with relatively inexperienced workers replacing those far more seasoned, particularly in the high turnover trades and production occupations. This places an additional onus on industry to work collaboratively with government and educational institutions to ensure that
new entrants to the sector have the skills required for high-demand jobs within mining. In addition, companies need to ensure that new employees have opportunities to learn from those with significant experience both during training programs and on the job.
The mining industry comprises 70 core mining occupations and needs new workers for all of them. Among those required are geoscientists, metallurgists, mining engineers and geologists, as well as workers skilled in computer technology, information management, mechanical repair, and heavy equipment operation in addition to other areas. Because today’s mining industry relies on advanced technologies, much of the demand is for highly skilled workers.
It is also important to note that competition for skilled workers is fierce both within Canada and globally. In fact, companies in other countries are actively recruiting Canadian graduates and workers, making retention challenging and recruitment highly competitive.
Various actions have been proposed to address the mining skills shortage in Canada:
• Promote the industry to women, youth, Indigenous people and non-traditional worker groups.
• Develop programs that bring back retired workers, retain older workers and increase mentoring.
• Improve educational programs and employer-provided training.
• Introduce standards for key occupations to facilitate domestic worker mobility and skills recognition.
The federal government has taken some steps to help address this problem, such as the expansion of the Youth Employment Strategy, the proposed Post-Secondary Industry Partnership and Co-operative Placement Initiative, and continued funding for the Aboriginal Skills and Employment Training Strategy (ASETS). MAC supports an expansion of this program, which has proved to be a valuable source of funding for Aboriginal skills training initiatives.
MiHR has also benefited from programmatic support, specifically in developing critical research to inform industry actions to address its human resources challenges and meet its employment needs. Ensuring MiHR can continue to produce crucial research and deliver strategic programs is essential for supporting the industry’s workforce needs and meeting its commitments to diversity.

FACTS & FIGURES 2018 49
THE PEOPLE: EMPLOYMENT, COSTS AND INNOVATION
WORKPLACE SAFETY AND HEALTHIn mining, safety comes first. As a core industry value and practice, Canadian mining companies invest significant time and effort in developing and maintaining a positive safety culture in all aspects of their operations, diligently working with their employees, contractors and communities to reach the goal of “zero harm.”
All mine sites have on-site professionals dedicated to safety and health in the workplace. Larger mines have numerous specialized safety trainers on site; smaller mines often contract out safety training to specialist companies.
Labour unions and industry associations have played a key role in improving worker safety and health by encouraging the sharing of best practices, developing industry standards and providing third-party verification of safety programs. MAC members, through the Towards Sustainable Mining® (TSM®) initiative, for example, make commitments in safety and health, crisis management and communications planning protocols to ensure that key mining risks are managed responsibly at our members’ facilities (see Section 5 of this report for more on TSM.)
The John T. Ryan TrophiesMining Safety Appliances (MSA) Canada began sponsoring a mine safety trophy in 1941. Named the John T. Ryan Trophies in honour of the company’s co-founder, the trophies have since become the most prestigious safety awards in the Canadian mining industry. They are still sponsored by MSA Canada and are presented nationally and regionally in three mining categories: metal mines, coal mines and select mines. The trophies are awarded annually by the Canadian Institute of Mining, Metallurgy and Petroleum to the Canadian metalliferous mine, coal mine and select mines that had the lowest accident frequency per 200,000 hours worked during the previous year.
Mining safety statistics can be an invaluable tool for tracking the effectiveness of safety programs and driving improvements, whether for a safety manager working on site or for industry discussions on safety regulations. Ensuring that safety statistics are useful requires that not only are existing figures and analyses made easily accessible, but that the people and organizations compiling statistics understand the information needs of safety professionals.
In 2018, the following MAC members were recipients of John T. Ryan Trophies, in the following categories:
• New Gold’s New Afton Mine – Regional Metal BC / Yukon
• Cameco’s Cigar Lake Mine – Regional Metal Prairies and Territories
• Glencore’s Sudbury INO Nickel Rim South Mine – Regional Metal Ontario
• Goldcorp’s Éléonore Mine – Regional Select Quebec and Maritimes
• DeBeers’ Victor Mine – Regional Select East

50 FACTS & FIGURES 2018
THE PEOPLE: EMPLOYMENT, COSTS AND INNOVATION
KEY COSTSMining companies have limited control over the revenue side of their statement of return because mineral prices are generally set through international trading and exchanges. To remain competitive, companies rigorously work to control their costs.
Wages The Canadian mining industry boasts the highest wages and salaries of all industrial sectors in Canada (see Annexes 7 and 8 for details). The average annual pay for a mining worker in 2017 exceeded $117,000, which surpassed the average annual earnings of workers in forestry, manufacturing, finance and construction by a range of $28,000 to $45,000.
This wage gap has remained relatively consistent in recent years. In remote regions or in situations where workers rotate, higher wages help to attract and retain them.
Overall Production CostsMining operations incur significant production costs. The industry’s three main production costs – wages, energy (fuel and electricity), and materials and supplies – totalled $4.8 billion, $2.6 billion and $7.7 billion, respectively, in 2016, the most recent year for which data are available (see Figure 29). Together, these figures constitute a 1% decrease in the cost of mining in Canada year-over-year for operational expenditures.
Remote and Northern RegionsLack of infrastructure, sparse or no population, and often extreme seasonal temperatures make remote and northern regions in Canada high-cost jurisdictions in which to build and operate a mine. Frequently, companies that seek to develop mining projects in remote and northern regions must build the infrastructure they require for operation. Historically, this infrastructure has included the following: power generation and transmission; transportation infrastructure such as ports, road and railways; and airstrips and on-site accommodation for fly-in/fly-out employees.
These additional costs constitute a northern premium that companies and industries operating in centrally located jurisdictions generally do not incur. The mining cost differential can be significant between jurisdictions that lack infrastructure and those that have better access to a mode of transport for mining resupply and bringing product to market, a community where workers can live, and access to the power grid. A company’s requirement to build infrastructure in the North that would already be built and accessible in the south accounts for a large portion of the increased costs.
To better understand these costs, MAC and industry partners undertook a study that compared the costs of operating in a remote and northern region relative to the costs of operating a comparable mine in a centrally located jurisdiction. The study determined that for base and precious metals, the premium associated with developing a remote and northern mine ranges from 2 to 2.5 times the cost of a comparable mine in a southern region. Furthermore, the report determined that 70% of this cost increase is related directly to infrastructure investment.
The future of mining lies increasingly in remote and northern Canada. At the same time, mining development is helping the government achieve its stated economic, Indigenous reconciliation and climate change goals in these regions. For this reason, MAC is encouraged by recent federal infrastructure investment decisions that recognize northern challenges and opportunities, such as the Trade and Transportation Corridors Initiative (TTCI), which dedicates $400 million for trade-enabling infrastructure in the territories. MAC also supports the Investing in Canada Plan, which allocates funding on a per-capita “plus” model. These are creative and much-needed investments in Canada’s north. Beyond these programmatic developments, positive funding decisions in support of the Yukon Resource Gateway ($360 million) and the T’licho Road ($155 million) and a section of the McKenzie Valley Highway ($90 million) in the Northwest Territories will increase project viability and community connectivity, reduce costs and remoteness and, ultimately, lessen territorial reliance on Ottawa.
While MAC welcomed the creation of the Canada Infrastructure Bank (CIB), we are concerned that it will not be a viable vehicle for northern infrastructure investment. Given the success of the initiative, MAC recommends that government renew the TTCI fund in Budget 2019, including the $400 million allocation for Arctic infrastructure. Over the medium term, MAC recommends government establish a specific allocation for Canada’s Arctic within the CIB that has flexible criteria shaped in recognition of unique Arctic realities, or develop a stand-alone Arctic specific fund to advance clean energy and development priorities in the region.
INNOVATION, RESEARCH AND DEVELOPMENTInnovation is a broad theme, and relevant statistics are not always current or easy to compare. The information presented below indicates that Canadian mining embraces innovation, but that Canada faces a challenge in facilitating a robust environment in which to foster innovation and enhance research and development (R&D).

FACTS & FIGURES 2018 51
THE PEOPLE: EMPLOYMENT, COSTS AND INNOVATION
Canada’s mining industry is committed to innovation and environmental sustainability, and these two priorities are being realized at Goldcorp’s Borden project, which aims to be the country’s first all-electric underground mine.
“Sustainability is increasingly important in our industry, and the concept of an all-electric mine, complete with electric-powered trucks to operate within it, is an exciting game changer for the sector,” said Brent Bergeron, Goldcorp Inc.’s Executive Vice President for Corporate Affairs and Sustainability. “This initiative showcases how serious we are when it comes to innovation, in addition to being a partner in the fight against climate change.”
Not only does this project, which aims to start commercial production in 2019, showcase how a Canadian mining company can lead the way in reducing carbon emissions, but it also serves as an important example on how the industry can be a leader for change when it comes to the resource economy. In its all-electric focus, the Borden mine will eliminate the use of vehicles powered by fossil fuels, which will have a positive impact in eliminating greenhouse gas emissions.
“We are proud to be part of a project that could have lasting impacts on the future of the mining industry,” concluded Bergeron. “Innovation, clean technology and environmental sustainability are key parts of our business, and we are looking forward to seeing what other projects come to fruition with this goal in mind in the years to come.”
GOLDCORP’S BORDEN MINE ELECTRIFICATION PROJECT

52 FACTS & FIGURES 2018
THE PEOPLE: EMPLOYMENT, COSTS AND INNOVATION
Mining provides the minerals and metals that are essential to the household items Canadians use every day, and it is important that the process of extracting these resources is done in the most environmentally respectful way. Vale, one of the world’s most significant producers of nickel and a MAC member, has been prioritizing this goal through its Clean AER Project.
“Vale has operated in communities across Canada for over 100 years and so it is important to us that we have initiatives in place that promote sustainable mining practices,” explained Dave Stefanuto, Vale’s vice-president of North Atlantic Projects. “Our $1 billion Clean AER Project, focused on reducing sulfur dioxide emissions by 85% and metals particulate by 40%, is just one example of how innovation and reducing our environmental footprint can go hand in hand.”
These emission reductions reflect how seriously companies in Canada are taking the call to mine responsibly, particularly when it comes to the environment. As a member of MAC, Vale follows the Towards Sustainable Mining program, a set of principles that focus on the need to mine in the most socially, economically and environmentally sustainable ways. The Clean AER Project is one example that shows the innovation taking place in ensuring Canada’s mining industry is at the forefront of mining responsibly. “This project has reduced emissions so significantly that Vale’s iconic Superstack will no longer be required and construction of two smaller and more efficient stacks is underway,” said Stefanuto. “We will continue to look for innovative ways to reduce our environmental footprint in Sudbury and in the other communities we operate in.”
VALE’S $1 BILLION CLEAN AER PROJECT
While the industry invests millions of dollars each year in R&D, Canada underperforms compared to its peers. At risk is Canada’s ability to attract new investment as other jurisdictions offer more attractive innovation environments.
Canada’s Approach to InnovationMAC and its members are committed to ongoing improvement and are continually innovating to protect the environment and reduce their energy use and GHG emissions. Over the past two decades, mining companies have focused on improving energy efficiency and reduced emissions at their operations through measures such as MAC’s mandatory TSM initiative and through innovations at the mine-site level.
To remain sustainable, progressive and profitable, the industry must innovate and collectively challenge existing ways of thinking. Through innovation investment from industry and governments, the Canadian mining industry can address these critical business challenges and continuously improve the sector’s environmental and health and safety performance. This will help ensure that Canada’s mining sector can maintain and grow its immense socio-economic contributions to communities across the
country, while meeting Canadians’ evolving expectations about the industry.
Canada’s current innovation system comprises in excess of 7,000 funding programs, the vast majority of which support university research and not innovation. As a nation, Canada has made significant progress in fundamental research yet continues to lag far behind other OECD countries when it comes to innovation, business investments in innovation and business productivity.
While many sectors of Canada’s economy have benefitted from significant innovation investments by governments, including through the innovation superclusters program, the minerals industry is notable in the lack of any substantial, strategic and long-term government investment in innovation. While companies invest significantly in their own projects, the existing funding apparatus does not complement many industry priorities, and, therefore, opportunities to leverage greater value for innovation investments are lost.

FACTS & FIGURES 2018 53
TITLE
Source: Statistics Canada. Table 38-10-0285-01 Natural resources satellite account, indicators. Indirect employment is a Natural Resources Canada estimate based on Statistics Canada data.
Return to text
FIGURE 24MINERALS SECTOR EMPLOYMENT, BY SUBSECTOR AND PRODUCT GROUP, 2017
Subsector/Commodity group (000 jobs)
Direct 426
Primary 204
Extraction 107
Coal 5
Metallic minerals 40
Non-metallic minerals 25
Services 37
Primary manufacturing 97
Primary metallic mineral products 46
Primary non-metallic mineral products 50
Downstream 222
Secondary metal products 27
Tertiary metal products 132
Miscellaneous metal products 38
Services and custom work 26
Indirect 208
Total minerals sector 634
FIGURE 25REPRESENTATION OF WOMEN IN MINING INDUSTRY AND ALL INDUSTRIES, SELECTED OCCUPATIONS AND ALL OCCUPATIONS (2011 & 2016)
Return to text
2016 2011
Mining Industry / Selected Occupations 0.12372316 % 0.12 %
Mining Industry / All Occupations 0.160904827 % 0.17 %
All Industries / Selected Occupations 0.313121909 % 0.27 %
All Industries / All Occupations 0.47810073 % 0.48 %
Source: Mining Industry Human Resources Council, Statistics Canada (2016 Census), 2018.

54 FACTS & FIGURES 2018
TITLE
FIGURE 26REPRESENTATION OF INDIGENOUS PEOPLES IN THE WORKFORCE, MINING INDUSTRY AND ALL INDUSTRIES, 2016
FIGURE 27REPRESENTATION OF NEW CANADIANS AND VISIBLE MINORITIES IN THE MINING WORKFORCE (2006, 2011, 2016)
Source: Mining Industry Human Resources Council, Statistics Canada (2016 Census), 2018.
Source: Mining Industry Human Resources Council, Statistics Canada (2006 Census, 2011 NHS, 2016 Census), 2018.
Aboriginal Status All Industries Mining Industry
Indigenous 3.9% 7.4%
Métis 1.7% 3.2%
First Nations 2.0% 3.4%
Inuk (Inuit) 0.1% 0.6%
Indigenous responses not included elsewhere 0.1% 0.1%
Multiple Indigenous responses 0.0% 0.1%
Diversity Status 2006 2011 2016
Immigrant 12% 14% 13%
Visible Minority 7% 9% 9%
Return to text
Return to text

FACTS & FIGURES 2018 55
TITLE
FIGURE 29SELECTED COSTS OF PRODUCTION IN THE MINERAL INDUSTRY1, 2016
Sources: Natural Resources Canada; Statistics Canada.1Excludes the oil and gas extraction industry.Note: Value of Production vs. Mineral Production: Value of Production is for mining activity only and wouldn’t include all costs related to shipping etc. that are included in Value of Shipments (or Mineral Production).Numbers may not add due to rounding.
Source: Mining Industry Human Resources Council, Statistics Canada (2016 Census), 2018.
Return to text
FIGURE 28 CUMULATIVE HIRING REQUIREMENTS* BY FORECAST SCENARIO (2019–2029)
By Industry Establishments SurveyedWages for Production and Related Workers Fuel and Electricity Materials and Supplies Value of Production
(number) ($000) ($000) ($000) ($000)
Metal Ore Mining 63 2,845,554 1,521,683 5,517,460 22,692,149
Nonmetallic Mining and Quarrying
1,124 1,366,406 739,204 1,612,338 9,944,967
Coal 18 582,671 301,791 632,311 3,751,352
Total Mineral Industry 1,205 4,794,631 2,562,678 7,762,109 36,388,468
Replacement Requirements
Net Change in Employment Retirement Non-Retirement
Cumulative Hiring Requirements
Contractionary -30,150 56,240 23,790 49,890
Baseline 11,930 60,200 25,320 97,450
Expansionary 45,210 63,440 26,580 135,230
Return to text
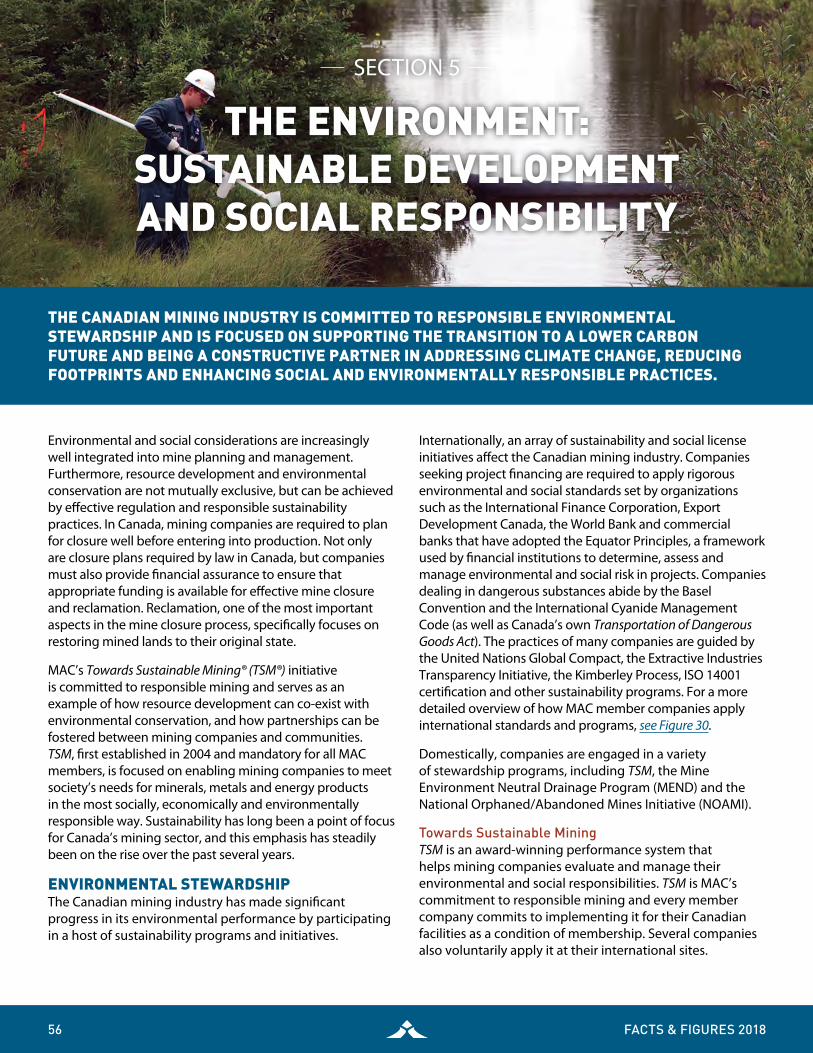
56 FACTS & FIGURES 2018
TITLE
SECTION 5
THE ENVIRONMENT: SUSTAINABLE DEVELOPMENT AND SOCIAL RESPONSIBILITY
Environmental and social considerations are increasingly well integrated into mine planning and management. Furthermore, resource development and environmental conservation are not mutually exclusive, but can be achieved by effective regulation and responsible sustainability practices. In Canada, mining companies are required to plan for closure well before entering into production. Not only are closure plans required by law in Canada, but companies must also provide financial assurance to ensure that appropriate funding is available for effective mine closure and reclamation. Reclamation, one of the most important aspects in the mine closure process, specifically focuses on restoring mined lands to their original state.
MAC’s Towards Sustainable Mining® (TSM®) initiative is committed to responsible mining and serves as an example of how resource development can co-exist with environmental conservation, and how partnerships can be fostered between mining companies and communities. TSM, first established in 2004 and mandatory for all MAC members, is focused on enabling mining companies to meet society’s needs for minerals, metals and energy products in the most socially, economically and environmentally responsible way. Sustainability has long been a point of focus for Canada’s mining sector, and this emphasis has steadily been on the rise over the past several years.
ENVIRONMENTAL STEWARDSHIPThe Canadian mining industry has made significant progress in its environmental performance by participating in a host of sustainability programs and initiatives.
Internationally, an array of sustainability and social license initiatives affect the Canadian mining industry. Companies seeking project financing are required to apply rigorous environmental and social standards set by organizations such as the International Finance Corporation, Export Development Canada, the World Bank and commercial banks that have adopted the Equator Principles, a framework used by financial institutions to determine, assess and manage environmental and social risk in projects. Companies dealing in dangerous substances abide by the Basel Convention and the International Cyanide Management Code (as well as Canada’s own Transportation of Dangerous Goods Act). The practices of many companies are guided by the United Nations Global Compact, the Extractive Industries Transparency Initiative, the Kimberley Process, ISO 14001 certification and other sustainability programs. For a more detailed overview of how MAC member companies apply international standards and programs, see Figure 30.
Domestically, companies are engaged in a variety of stewardship programs, including TSM, the Mine Environment Neutral Drainage Program (MEND) and the National Orphaned/Abandoned Mines Initiative (NOAMI).
Towards Sustainable MiningTSM is an award-winning performance system that helps mining companies evaluate and manage their environmental and social responsibilities. TSM is MAC’s commitment to responsible mining and every member company commits to implementing it for their Canadian facilities as a condition of membership. Several companies also voluntarily apply it at their international sites.
THE CANADIAN MINING INDUSTRY IS COMMITTED TO RESPONSIBLE ENVIRONMENTAL STEWARDSHIP AND IS FOCUSED ON SUPPORTING THE TRANSITION TO A LOWER CARBON FUTURE AND BEING A CONSTRUCTIVE PARTNER IN ADDRESSING CLIMATE CHANGE, REDUCING FOOTPRINTS AND ENHANCING SOCIAL AND ENVIRONMENTALLY RESPONSIBLE PRACTICES.

FACTS & FIGURES 2018 57
THE ENVIRONMENT: SUSTAINABLE DEVELOPMENT AND SOCIAL RESPONSIBILITY
Since its establishment in 2004, participation in TSM has grown steadily and the Québec Mining Association has adopted the initiative for their members.
In recent years, TSM’s positive reputation has been attracting international attention. In 2015, the Finnish Mining Association (FinnMin) adopted TSM for its members’ operations, the first national mining association outside of Canada to do so. Since then, the Cámara Argentina de Empresarios Mineros, the Botswana Chamber of Mines and the Chamber of Mines of the Philippines have adopted TSM and are at various stages of implementing the program. In 2018, Confederación nacional de empresarios de la minería y de la metalurgia, the national mining association in Spain, became the latest national mining association to join TSM.
How TSM WorksTSM includes a set of tools and indicators that drive performance and ensure key mining risks are managed responsibly at mining facilities. By adhering to the TSM Guiding Principles, mining companies demonstrate leadership by:
• Engaging with and supporting local communities
• Driving world-leading environmental practices
• Committing the resources and leadership to promote the safety and health of employees
TSM’s core strengths are focused on:
• Accountability. TSM reporting at the facility level of their Canadian operations is mandatory for members.
• Transparency. Annual reporting is conducted against the TSM indicators with independent verification.
• Credibility. TSM includes ongoing consultation with a national Community of Interest (COI) Advisory Panel to improve industry performance and shape TSM for continual advancement.
• Driving performance. TSM includes a requirement to demonstrate measurable continual sustainability improvement.
Currently, TSM sets out performance indicators and targets in seven areas:
• Tailings management
• Energy use and greenhouse gas emissions management
• Aboriginal and community outreach
• Crisis management and communications planning
• Biodiversity conservation management
• Safety and health
• Preventing forced and child labour
Over the course of 2017 and 2018, water experts from across the industry have worked diligently to develop a set of performance indicators to measure water governance, operational water management, watershed-level planning and water performance and reporting at the mine-site level. The new Water Stewardship Protocol will be phased-in over the next few years, with public reporting scheduled to begin in 2021.
Each year, MAC produces a TSM Progress Report detailing the facility-level performance of participating companies. TSM assessments take place at the facility level to ensure that management systems are in place, with results externally verified every three years. In 2017, 67 facilities reported their 2017 results.
Below is a summary of results for three areas that pertain to environmental stewardship: tailings management, biodiversity conservation management, and energy use and greenhouse gas emissions management. For a more complete overview of industry performance, please refer to the 2018 TSM Progress Report, which is available on the MAC website.
Tailings ManagementTailings facilities are necessary components of mining activity, and it is crucial that they be managed responsibly to protect human safety and the environment. Overall, the industry’s performance in tailings management has improved significantly over the years (see Figure 31). This is largely due to senior executives recognizing the importance of managing a facility’s most significant environmental and safety risks. While the 2017 TSM results show a decline in performance, on an aggregate basis, for Indicators 3 and 4 of the Tailings Management Protocol, this drop is partially attributable to facilities new to TSM who are still working to align their systems with the program criteria. In addition, seven facilities (including six closed sites), that previously reported Level As were downgraded to Level Cs for Indicator 3 and Level Bs for Indicator 4 during external verification. MAC has been engaged with the two companies responsible for the seven facilities and been assured that action is underway to bring their performance back to previous levels.

58 FACTS & FIGURES 2018
THE ENVIRONMENT: SUSTAINABLE DEVELOPMENT AND SOCIAL RESPONSIBILITY
Following the tailings breach at the Mount Polley Mine in August 2014, MAC initiated internal and external reviews of its TSM Tailings Management Protocol and Guides. Both reviews confirmed the strength of the existing Tailings Management Protocol and Guides while also identifying opportunities to incorporate proven and emerging best practices for tailings management. The review has resulted in significant revisions to the TSM Tailings Management Protocol, A Guide to the Management of Tailings Facilities and Developing an Operation, Maintenance and Surveillance Manual for Tailings and Water Management Facilities. The revised Protocol and Guides are available at www.mining.ca/tailings-management and reporting against the new Protocol will begin in 2020.
Beyond TSM, oil sands operators are making measured progress in tailings management. The Oil Sands Tailings Consortium (OSTC) was founded in 2010 when seven of Canada’s largest oil sands mining companies agreed to share tailings research and technology in a unified effort to advance tailings management. In March 2012, the OSTC became part of Canada’s Oil Sands Innovation Alliance (COSIA), which is discussed in more detail below.
Biodiversity Conservation ManagementMining, conducted in consultation with communities of interest, can co-exist with biodiversity conservation. Adopting responsible practices for biodiversity conservation management through all stages of a mine’s life cycle is an industry priority. The TSM Biodiversity Conservation Management Protocol confirms that mining facilities have made formal commitments to manage biodiversity at their sites, that action plans for significant biodiversity aspects are implemented, and that biodiversity conservation reporting systems are in place to inform decision making and to publicly communicate the performance of facilities.
Figure 32 demonstrates that MAC members have continued to make significant improvements across the three indicators:
• 75% have senior management commitment to biodiversity conservation in place.
• 69% have implemented a biodiversity conservation management system.
• 66% report publicly on biodiversity conservation activities and performance.
Energy Use and Greenhouse Gas (GHG) Emissions ManagementImproving energy efficiency and reducing GHG emissions are priorities for the Canadian mining industry to limit impacts on the environment, address climate change, and help reduce operational costs at mine sites.
The TSM Energy Use and GHG Emissions Management Protocol confirms whether a facility has established a comprehensive system for energy use and GHG emissions. For this Protocol, a facility must show its management system includes assigned accountability from senior management, and that it has a process in place to ensure energy data are reviewed regularly and are well integrated into operator actions. Facilities are also expected to provide energy awareness training, and have systems in place to track and report energy use and GHG emissions data for both internal and external reporting. Finally, in TSM’s spirit of continuous improvement, this Protocol seeks to confirm that facilities establish and meet targets for their energy use and GHG emissions performance.
The requirements to obtain a Level A in this TSM Protocol are more stringent than those for obtaining ISO 50001 certification. While ISO is a more broadly recognizable program globally, this comparison helps contextualize the
Managing tailings in the oil sands is a key environmental priority for the mining industry. Oil sands operators are committed to developing technologies to speed-up reclamation outcomes. One example is Permanent Aquatic Storage Structure treatment process (PASS) , developed by Suncor Energy. This technology involves adding a coagulant and a flocculant to fluid tailings, which allows water quality to be improved and improves consolidation that accelerates water release. Other innovative examples include Syncrude’s centrifuge technology and Canadian Natural’s Atmospheric Fines Drying process, both of which accelerate the release of water from tailings, enhancing the drying process.
These innovative technologies and processes are expected to accelerate the rate of reclamation and, in the years ahead, help to ensure the industry is reclaiming the landscape in a progressive manner. Suncor, Syncrude and Canadian Natural are sharing intellectual property and industry best practices with the broader oil sands mining industry through their collaboration with member companies in COSIA.
PROMISING TECHNOLOGY FOR OIL SANDS TAILINGS

FACTS & FIGURES 2018 59
THE ENVIRONMENT: SUSTAINABLE DEVELOPMENT AND SOCIAL RESPONSIBILITY
extent of the commitment that MAC members make in pursuit of energy and GHG management excellence. Of the facilities participating in TSM:
• 84% have comprehensive energy use and GHG emissions management systems.
• 96% have implemented energy use and GHG emissions management reporting systems.
• 54% have established and met performance targets.
The percentage of facilities that have achieved a Level A or higher has increased since 2013, the year in which the Protocol went through a substantial revision when the number of indicators was condensed from six to three. This change acknowledged that in the mining sector facilities produce GHGs primarily through the burning of fossil fuels for energy and, thus, GHG emissions are controlled by managing energy consumption. Figure 33 shows performance for the three indicators of the TSM Energy Use and GHG Emissions Management Protocol.
Since 2015, mining companies pursuing energy management best practices to increase energy efficiency and reduce GHG emissions through the TSM initiative became eligible for funding from the Canadian Industry Program for Energy Conservation (CIPEC), a division of Natural Resources Canada. This is a significant endorsement of TSM and a powerful recognition of the program’s effectiveness in improving energy management practices at Canadian mining operations.
CLIMATE CHANGE AND THE MINING INDUSTRYMAC and its members are committed to supporting the transition to a lower carbon future, and to being a constructive partner with the Government of Canada on this important issue. To assist government in the development of an effective pan-Canadian climate change policy, MAC released these Principles for Climate Change Policy Design in April 2016.
The Principles specifically focused on:
• Establishing a broad-based carbon price that is applicable to all sectors of the Canadian economy.
• Being revenue neutral by investing revenues generated through carbon pricing into the development of lower emission technologies to manage the transition to a lower carbon future, including climate adaptation, and to ensure a level playing field for trade-exposed industries that are emission intensive.
• Addressing competitiveness and carbon leakage concerns across all sectors to prevent declines in investment, employment, tax revenues and trade.
• Being predictable, flexible and sensitive to changing economic conditions and geographic circumstances, to enable consumers and industry to adapt and to treat regions fairly, particularly Canada’s north.
• Being simple, complementary and effective to ensure that a national climate change regime works in tandem with existing provincial schemes, avoids duplication, and is simple to understand and administer.
• Supporting investments in the development and implementation of technologies that lower emissions through capital investments, which could include public-private partnerships.
• Recognizing early action, acknowledging that some companies have been proactive in reducing their climate footprints and that several provinces have already established climate change mitigation regimes.
Mining Sector Emissions ProfileAccording to the Canadian Energy and Emissions Data Centre, direct emissions from Canada’s operating metal and non-metal mines accounted for just 0.8% of the country’s total GHG emissions in 2016 (see Figure 34).
Despite lacking federally regulated targets, many extraction operations have improved their capabilities in compressed air, ventilation, metering and energy management, and have been doing so for years. Canadian mining companies are also involved in innovative initiatives to find non-diesel alternatives for large mobile equipment (see the Borden Mine case study in Section Four). Investment in these areas is a priority for the industry as older and deeper mines require more energy to access and extract the same amount of ore.
Oil sands production has a track record of continuous improvement in emissions reduction. Between 1990 and 2012, GHG emissions associated with every barrel of oil sands crude produced decreased by 28%. For oil sands mining, GHG emissions reductions have been driven by innovations such as hydrotransport and efficiency improvements in bitumen extraction, upgrading, and natural-gas-fired cogeneration for electricity and steam.

60 FACTS & FIGURES 2018
THE ENVIRONMENT: SUSTAINABLE DEVELOPMENT AND SOCIAL RESPONSIBILITY
Despite reductions in the energy intensity of each barrel of oil produced, the absolute level of GHG emissions has grown as oil sands production volumes have increased.
Federal Climate Change PolicyMAC is engaged in several concurrent policy and regulatory initiatives pertaining to climate change, among which include:
• Proposed regulations for a Clean Fuel Standard (CFS)
• Federal Backstop and Output-Based Pricing System
• Proposed Regulations for Stationary Diesel Engines
• Proposed enhanced GHG reporting requirements
While these initiatives each require independent consideration, how they interrelate must also be assessed. It is critical that they work harmoniously to create a consistent, complementary and coordinated approach.
In Canada’s growing patchwork of climate change initiatives, provincial and federal policies are increasingly likely to target the same GHG emissions. What concerns MAC is a potential scenario whereby existing or developing regulatory initiatives result in double regulation of the same emissions in one or more respects. The mining industry is concerned that some of these initiatives may
duplicate or conflict with what provincial governments are already doing. This duplication would increase overall costs, create additional reporting and compliance burden, frustrate private sector innovation, and generally blunt the incentive for corporations to take action, all without achieving significant additional GHG emissions reductions.
MAC believes that carbon pricing is the simplest and most cost-effective way to lower GHG emissions and recommends that the government:
• Make carbon pricing the core of its climate policy, which should be backed by robust protections for EITE sectors and should also be sensitive to remote and northern regions.
• Clearly demonstrate complementarity before adopting non-pricing climate change policies and regulations (such as the CFS) to avoid cumulative effects. This demonstration should include a robust and publicly-disclosed economic impact assessment.
Output-Based Pricing System (OBS)MAC has been working constructively with the federal government on the proposed output-based standards for mining, smelting, and iron ore pelletizing. To date, we are pleased to see some of our priorities recognized in the changes proposed by Environment and Climate Change Canada, including reducing stringency, disaggregating from the proposed single standards, and enabling facilities that emit between 10-50kt GHG to opt-in to the OBS program in 2019. MAC will continue to work to ensure the OBS for mining and metal manufacturing facilities recognize factors such as remoteness, supply chain exposure, and have appropriate product and facility level aggregation.
Clean Fuel Standard (CFS) RegulationWhile MAC supports the federal government’s efforts to identify opportunities to meaningfully reduce GHG emissions, elements of the proposed CFS regulation are problematic. MAC recommended the government begin with the transportation sector first – like other jurisdictions where such standards have been deployed – but the decision to proceed with the broader liquid fuels stream first (including industrial consumers) is likely to adversely affect the industry, due to a number of different factors.
MAC supports a CFS on liquid fuels for the transportation sector (exempting heavy industry) and if the government chooses to pursue a broader scope, the incorporation of robust EITE protections under any CFS regulation will be critical.
While Suncor’s Oil Sands Base plant uses a first generation extraction process called Naphthenic Froth Treatment, the company’s new Fort Hills mine uses a process called Paraffinic Froth Treatment (PFT). The bitumen product they obtain using this partial upgrading process has been upgraded to a better quality as it removes up to 10% of the asphaltenes — which is essentially composed of low-value heavy hydrocarbon molecules and undesirable particulates. Rejecting the portions of heavy hydrocarbon closer to source reduces both the diluent required for transportation and the energy and hydrogen needed to refine the bitumen into fuels. This higher quality oil sands product can be processed at a wider range of refineries. As a result of this technology, the GHG emissions for the average barrel extracted at Fort Hills are on par with the average crude refined in the U.S.
LOW CARBON EXTRACTION AT SUNCOR’S FORT HILLS MINE

FACTS & FIGURES 2018 61
THE ENVIRONMENT: SUSTAINABLE DEVELOPMENT AND SOCIAL RESPONSIBILITY
Climate Change Policy in the NorthNorthern energy costs are compounded by the infrastructure deficit in the territories and remote regions of the provinces. The extremely limited reach of transmission and distribution infrastructure means mines and development projects are off-grid and dependent almost exclusively on diesel. Beyond the cost of fuel itself, the cost per unit of delivered fuel is inflated significantly by associated investments essential to supporting the mines’ energy supply chain. Fuel-switching opportunities are also limited and are contingent on geographical considerations.
High energy costs in the North have long served as a strong incentive to maximize energy and fuel efficiency, but evidence suggests that the proverbial “low-hanging” fruit are gone, meaning future improvements will be incremental and gradual barring a technological breakthrough. Moreover, fuel switching opportunities in remote and northern Canada are limited and contingent on geographical considerations. Together, the infrastructure deficit and the state of currently available technologies do not provide sufficient options to displace diesel (and associated emissions) in the timeframe needed, nor on the scale required, to avoid companies absorbing the carbon price almost exclusively as a cost of business. Further, extreme temperatures have not demonstrated the viability of the CFS for an industrial application in a pan-Canadian context.
The purpose of pricing carbon or establishing a CFS is not to penalize companies, but to price pollution as Canada works to meet its targets. Policies that fail to take into account competitiveness concerns will drive away investment and exacerbate an already challenging business situation for many companies operating in the North. MAC recommends that any climate change plan or policy must be sensitive to the geographical realities of remote and northern regions. Accommodating for remote and northern limitations in a manner that does not unduly penalize the firm is critical for any northern climate change scenario to have the intended effect.
Mining and Natural GasMining companies that have had access to natural gas have been using it to power operations for decades. Recent developments in natural gas have increased its viability and generated interest from other miners across the industry. Technological advances in gas extraction have boosted supply through new finds and increased access to known deposits. Due to market developments in North America, gas prices remain low compared to Europe and Asia. As a cleaner fuel, gas also has a smaller GHG footprint than diesel fuel. This places natural gas in a good position to help miners reduce their carbon emissions when it is viable to fuel switch.
One example is ArcelorMittal, a MAC member piloting a project to switch to natural gas for its Port Cartier operation. The pilot projects the displacement of 4.7 million litres of heavy fuel oil in 2018, mitigating 4,800 tonnes of CO2 equivalent. If successful and deployed permanently, the fuel-switching project will reduce emissions by an estimated 50,000 tonnes of CO2 equivalent annually. In addition, Western Copper and Gold intends to power its Yukon-based Casino project, which is still at the permitting stage, with natural gas. This would be a first for mining in the territories.
For many mines, however, there are other considerations. Given that natural gas prices are subject to volatility – such as winter price spikes – questions over the viability of switching require detailed analysis. In many situations, mining companies face similar challenges in accessing natural gas as they do with other diesel-replacing alternatives. In remote areas, particularly in the North, no direct transmission or distribution pipeline network exists – and building one would be capital-intensive. Maritime transportation of natural gas is also expensive as it requires ships and unloading and storage facilities – a compounded challenge as very little port infrastructure currently exists, and all-weather road systems are scarce.
Sitting on a plateau 600 metres high on the Ungava Peninsula in northern Quebec, Glencore’s Raglan Mine is well situated to take advantage of the power of wind. In 2014, the company did exactly that when it completed its construction of a 120-metre-high wind turbine and storage facility, the largest in Quebec.
The project, a private-public partnership between Raglan Mine, TUGLIQ Energy and the federal and provincial governments, was unprecedented in scale, and was specially designed for severe Arctic climate conditions.
In its inaugural year, the 3-megawatt wind turbine and storage facility saved 2.1 million litres of diesel and reduced GHG emissions by 5.85 kilotons. Based on these results, Glencore estimates that it will save more than $40 million in fuel-related costs over the projected 20-year life of the wind turbine. This successful pilot project could have transformative impacts across northern Canada, helping to pave the way for the more widespread adoption of greener energy alternatives.
MINERS PUT ENERGY INTO RENEWABLE POWER

62 FACTS & FIGURES 2018
THE ENVIRONMENT: SUSTAINABLE DEVELOPMENT AND SOCIAL RESPONSIBILITY
Natural gas technologies, however, continue to improve and incrementally enhance the fuel’s usability for miners. Some natural gas generation technologies have been designed to retrofit existing diesel systems, making a fuel switch less capital intensive. From an end-use perspective, progress has also been made towards the development of liquid natural gas engines for heavy vehicles where potential fuel savings and emissions mitigation are significant.
Mining and Renewable EnergyRenewable energy technologies and their economics continue to improve. Renewable power is appealing to mining companies because it has the potential to reduce energy costs and environmental impacts, enhance energy security and address climate change.
Given the heightened cost of powering mining operations, companies are giving the benefits of renewable energy technologies greater consideration. The levelized cost of electricity for wind, solar photovoltaic, concentrated solar power and some biomass technologies has steadily decreased, enhancing their competitiveness, particularly for off-grid generation. According to the International Renewable Energy Agency, prices of solar photovoltaic modules have fallen by about 80% since the end of 2009, while wind turbine prices have fallen by 30–40%.
While cost competitiveness improvements in renewable energy are both welcome and attractive, they do not account for additional capital costs associated with remote development. The technology improvements also vary based on the quality of the renewable resource. Just as miners need to go where the viable deposits are located, renewable energy generation is contingent on the strength and reliability of the renewable asset. This restriction prevents renewable energy generation from becoming an industry-wide energy solution, no matter how improved the technology is.
But for mines that have access to a viable renewable asset, diversifying energy portfolios with a reliable intermittent power source that simultaneously offsets their reliance on diesel has benefits that may merit the investment. Recent examples include IAMGOLD’s Rosebel Mine in Suriname, and Glencore’s Raglan Mine in Quebec.
Rio Tinto’s and Dominion Diamond Corporation’s Diavik Diamond Mine in the Northwest Territories provides one concrete example on how Canada’s mining companies prioritize innovative and environmentally responsible ways to extract minerals and metals. The wind farm at the award-winning Diavik Diamond Mine was first introduced in 2012 and has seen impressive results.
This $31 million project is Rio Tinto’s first wind generation facility and also holds the distinction of being the first large-scale wind farm in Canada’s Northwest Territories. It uses leading edge cold climate technology to overcome the problem of industrial lubricants freezing in sub-Arctic conditions. As a renewable energy source, the wind farm is exceeding targets and providing around 10% of the mine’s power needs. In addition to its role in producing much needed power, the wind farm also reduces Diavik’s seasonal winter road fuel haul by approximately 100 loads.
THE CLEAN ENERGY ECONOMYThere is a natural synergy between mining and clean technology. Raw materials are transformed into technology that, having gone full circle, assist mining operations in reducing environmental footprints and enhancing efficiency and reliability. These same raw materials are also enabling the world to transition to a low carbon future.
Promising technology areas include low carbon energy, energy storage, carbon capture and storage, green buildings and materials, clean vehicles and renewable energy.
A cleaner society depends on metals and minerals for building blocks. Hybrid vehicles, for example, draw energy from nickel hydride batteries. Catalytic converters, which reduce air pollution from vehicles, require platinum, rhodium and cerium. Rechargeable batteries are made from lithium, and solar cells require gallium, indium and germanium. The average electric car contains 75 kilograms of copper wiring, nearly three times as much as a conventional vehicle. Water purification systems rely on nickel and rare earth elements. The fuel efficiency of aircraft has improved by 70% over the past 40 years because of materials like aluminum, and next-generation technologies will be based on even lighter composites.
As primary materials, mining products will remain fundamental to the Canadian economy as it transitions towards a lower carbon future. There is no green economy without the mining industry, and as our industry continues to improve its environmental performance, so will its products continue to shape our world.
Recycling and E-WasteE-waste is one of the fastest-growing waste streams in the world and includes items such as mobile devices, computers, monitors, televisions and DVD players, among other electronic equipment. The lifespan of computers in developing countries, for example, has dropped significantly in recent years, and mobile devices frequently have a lifespan of less than two years. As consumers and businesses favour disposable technology and a shorter

FACTS & FIGURES 2018 63
THE ENVIRONMENT: SUSTAINABLE DEVELOPMENT AND SOCIAL RESPONSIBILITY
life cycle for electronics, the amount of e-waste generated is increasing. For example, according to recent data by Statistics Canada, 76% of Canadians of all ages owned a smart phone, suggesting the technology to be ubiquitous across the country.
A large portion of e-waste can be recycled, components of which can be recovered as “urban ore.” E-waste recycling involves reprocessing obsolete or unwanted electronics that have exhausted their reuse potential and would otherwise be disposed of in landfills. From 50,000 mobile phones, Electronics Product Stewardship Canada estimates that approximately 1 kilogram of gold, 400 grams of palladium, 10 kilograms of silver, and 420 kilograms of copper can be recycled. By recycling these items, valuable materials are kept out of landfills and can produce new products using resources that do not need to be mined.
For example, Glencore’s Horne smelter, located in Rouyn-Noranda, Canada, has been recovering copper and precious metals from end-of-life electronics for over 30 years. The smelter receives end-of-life electronics from North America, Europe, Asia and South America. The materials are sampled
for accurate value determination and processed to produce copper anodes. These are shipped to a Montreal refinery for further refinement into saleable products.
It is estimated that the world’s supply of end-of-life electronics offers a material resource of 40 million tonnes annually, from which a variety of component materials can be recycled. Propelling these efforts internationally is the Basel Convention, which controls the export of hazardous waste and requires e-waste to be treated as close to its origins as possible. The Convention, which entered into force in 1992, now has 186 parties, 53 of which are signatories, including Canada and the European Union.
While e-waste recycling programs have increased across Canada in recent years, more awareness is needed among Canadians of the options available for recycling old electronics. As well, the future of metal and e-waste recycling in Canada depends partly on how far government regulations go in requiring manufacturers and consumers to take responsibility for the life cycle of the products they use.
INDIGENOUS RELATIONS AND BENEFIT AGREEMENTSProportionally, the mining industry is the largest private sector employer of Indigenous peoples in Canada. This can be partly attributed to the nearness of 1,200 Indigenous communities to mining operations. Most of these communities are located within 200 kilometres of approximately 180 producing mines and more than 2,500 active exploration properties. This geographical proximity serves as a foundation for relationship building between industry and Indigenous communities. (See Section 4 of this report for more discussion.)
Over the past decade, the Canadian mining industry has increasingly embraced the signing of impact benefit agreements (IBAs) or other agreements (such as community and impact benefit agreements, community benefit agreements, and community participation agreements) between mining companies and Indigenous peoples and collectives. Such agreements have helped solidify local support for mining projects, provided a local work force, and facilitated Indigenous participation in the mining sector and the benefits that flow from it. While earlier agreements typically contained provisions for employment and training, more recent IBAs promote business opportunities through set-aside contracts and joint ventures. They also consider social and cultural matters, provide for environmental monitoring, set up funding arrangements and dispute resolution mechanisms, and include direct payment and resource-sharing arrangements, among other provisions.
About 770 kilograms of steelmaking coal (metallurgical coal not thermal coal) are required to produce 1 tonne of steel, and more than 700 million tonnes of steelmaking coal are used each year in global steel production. Steel is used to create the infrastructure and other materials Canadians use every day. For example, steel is crucial for:
• Public transportation. Approximately 30,000 tonnes of steelmaking coal was required to build Vancouver’s Canada Line. This 19-kilometre rapid transit line currently accommodates more than three million passenger trips through Vancouver per month.
• Personal recreation. Approximately 1.1 kilograms of steelmaking coal is required to build the average bicycle frame.
• Alternative energy. Approximately 100 tonnes of steelmaking coal is necessary to produce the steel to build the average wind turbine.
Source: Teck Resources Limited
COAL’S ROLE IN A SUSTAINABLE SOCIETY
64 FACTS & FIGURES 2018
THE ENVIRONMENT: SUSTAINABLE DEVELOPMENT AND SOCIAL RESPONSIBILITY
Since the groundbreaking 1974 Strathcona Agreement, hundreds of bilateral agreements (IBAs or other agreements at the exploration stage) have been signed, including 455 since the year 2000 (Source: NRCan).
Progressive agreements, such as the Ekati mine project agreement in the Northwest Territories and the Raglan Agreement in Quebec, have provided Indigenous communities with jobs, skills training, profit-sharing and environmental benefits. In addition to these agreements, the industry has taken proactive policy positions on issues such as resource revenue-sharing, which supports greater participation of Indigenous peoples, communities, businesses and governments in the mining industry.
Agreements between Vale and Labrador’s Innu and Inuit people include sections on training, employment, contracting, financial benefits, environmental matters and dispute settlement. In the partnership between the Government of British Columbia and the Stk'emlupsemc of the Secwepemc Nation (SSN), the provincial government shares revenues from New Gold’s New Afton mine directly with the SSN, in addition to New Afton’s separate agreement with the same bands. This government-to-government agreement broke new ground in Indigenous and natural resources public policy, providing the confidence and mutual benefit needed for mining projects to move forward.
Since then, other revenue-sharing agreements have been struck between the Government of British Columbia and First Nations communities across the province. This year, the Ktunaxa Nation Council and Teck Resources have concluded one of the most comprehensive agreements of its kind in Canada. Spanning approximately 40 years and all five operations in the Elk Valley region, the agreement sets out commitments for both parties in the areas of consultation and engagement, environment and land stewardship, employment and business opportunities for Ktunaxa citizens, and cultural resources management.
While the relationship between mining companies and Indigenous Canadians has largely been positive, several public policy issues currently create uncertainty for both groups. Mining companies operating in Canada have seen an increasing level of complexity related to the Crown’s duty to consult. This complexity is largely reflected in the different policy responses by federal, provincial and territorial governments as to what the actual “trigger” is for consultation, how the consultation process will unfold, who will lead the process, what procedural aspects are delegated to companies, and what support exists for the
parties involved. Added to this is the frequent duplication and lack of coordination of effort by both levels of government on consultation activities for the same project.
The Supreme Court of Canada, in its recent decision on the Tsilhqot’in First Nation’s claim, recognized Indigenous title, a first in Canadian law. It also provided clarity on the criteria needed to demonstrate title and the rights and obligations that flow from that, and, in the process also identified where title was found not to exist. The Court clearly recognizes that, in some circumstances, the right to title can be limited by the Crown. So, there is no absolute veto under Canadian law, even in the case where title has been proven. But for the Crown to place limits on Indigenous title, it has to demonstrate both a compelling public interest for the project and ensure that future Indigenous generations will not be deprived of the benefit of the land were the project to go ahead – a very significant test. At its core, the decision embodies the balancing act between empowering and limiting the authority of both Indigenous peoples and governments. The Canadian mining industry believes it is a significant decision that provides much more clarity going forward.
The federal government has committed to the implementation of the United Nations Declaration on the Rights of Indigenous Peoples (UNDRIP) in a manner that fits within Canada’s Constitutional and legal framework. This work is part of ongoing efforts by the federal government to renew Canada’s relationship with Indigenous peoples and the recognition of Section 35 rights through the development of the Recognition and Implementation of Indigenous Rights Framework. UNDRIP’s principle of Free, Prior and Informed Consent (FPIC), in this context, is generally understood to refer to a process of continuous engagement. Several MAC members, who are also members of the International Council on Minerals and Metals (ICMM), have committed to “work toward obtaining the consent of Indigenous peoples” consistent with ICMM’s Indigenous Peoples and Mining Position Statement.
The Canadian mining sector has a proven track record of working towards and maintaining positive and respectful relationships with affected Indigenous communities. Building constructive relationships with Indigenous communities, pursuing understanding and shared commitments through formal agreements is of great importance to our industry and is considered a best practice.
Engagement with Indigenous peoples and other communities of interest (COI) is a core component of MAC’s TSM initiative. Each year, MAC members are evaluated

FACTS & FIGURES 2018 65
THE ENVIRONMENT: SUSTAINABLE DEVELOPMENT AND SOCIAL RESPONSIBILITY
against the TSM Aboriginal and Community Outreach Protocol. To achieve a Level A, which equates to good practice, TSM requires facilities to have formal systems in place to establish who they should be speaking with about their operations and how to best engage with them. Facilities must also establish two-way dialogue with COI, have systems in place to receive and respond to concerns, and keep the public apprised of their activities and performance. Facilities are also required to publicly report on their engagement with communities. MAC is currently undertaking a review of this Protocol to ensure that it reflects current best practices with respect to community engagement and Indigenous relations and drives performance improvements at the mine-site level.
REGULATORY ENVIRONMENTDeveloping and operating a mine in Canada requires compliance with a multitude of federal and provincial or territorial legislative and regulatory requirements. Some of these requirements are specific to mining, while many more apply generally to environmental protection, and the health and safety of workers and the public. To deal with this complexity, Canadian companies, as well as domestic and foreign investors, rely on governments to provide clear information about requirements, approval processes, timelines and responsibilities.
New mines and major expansions must undergo federal reviews and approvals in addition to the review and permitting requirements of their provincial jurisdiction, which is the primary regulator. New mining projects and major expansions are subject to the Canadian Environmental Assessment Act (CEAA 2012) and, depending on the details of the project and the mine site, they may require approvals under other federal legislation, such as the Fisheries Act and the Navigation Protection Act. All three federal Acts were amended in 2012. As a result of these reforms, mining projects disproportionately made up the vast majority of the Canadian Environmental Assessment Agency’s case load (see Figure 35).
In 2016, the federal government initiated reviews of the three federal Acts, and, in February 2018, tabled in Parliament Bill C-68 and Bill C-69. Bill C-68 proposes to make amendments to the Fisheries Act and Bill C-69 proposes an Impact Assessment Act to replace CEAA 2012 and proposes amendments to the Navigation Protection Act to create the Canadian Navigable Waters Act. Both Bills are being considered by the Senate of Canada. If passed by this Parliament, they would come into force no earlier than mid-2019.
MAC has participated actively in the legislative review process and is a member of the Multi-Interest Advisory Committee, which was formed to assist in the review.
The mining industry has a keen interest in supporting the responsible management of species at risk in Canada. This is demonstrated through commitments made as part of TSM as well as the substantial investments made with respect to wildlife monitoring and research studies. MAC actively participates in the Species At Risk Advisory Committee and the National Boreal Caribou Knowledge Consortium. MAC also participated on the National Advisory Panel for the Pathway to 2020, which completed its mandate in early 2018.
For the mining industry to thrive in Canada, the process for reaching a decision on whether a mine can be built, and under what conditions, needs to be determined through a timely, coordinated and seamless process that continues to be grounded in meaningful consultation. In turn, this will help restore and preserve Canada’s reputation as an attractive jurisdiction for mineral investment and sustainable mining development.
Beyond the federal environmental assessment review, in 2018 the government completed amendments to a key Fisheries Act regulation related to mining: The Metal and Diamond Mining Effluent Regulations (MDMER). These amendments were the outcome of a three-year review that concluded in 2015. These amendments expand the scope of the previous Metal Mining Effluent Regulations to include diamond mines. The new requirements will come into force in stages. Some, including the application to diamond mines and amended requirements for environmental monitoring came into force immediately. Others, including more stringent requirements for effluent quality, will take effect in 2021.

66 FACTS & FIGURES 2018
TITLE
Return to text
FIGURE 30MAC MEMBER COMPANY APPLICATION OF INTERNATIONAL STANDARDS AND PROGRAMS
Sources: MAC Member Companies, TSM Progress Report 2018.
Agnico Eagle Mines Ltd.
IAMGOLD Corporation
HudBay Minerals Inc.
Teck Resources Limited **
New Gold Inc.**
Goldcorp**
Barrick Gold Corporation
Kinross Gold Corporation
First Quantum Minerals Inc.
Vale (Base Metals)
Eldorado Gold
Glencore
Newmont Mining Corporation
ArcelorMittal
Excellon
Lundin
De Beers Canada Inc.**
Rio Tinto
Sherritt
COMPANIES/BUSINESS UNITS HEADQUARTERED IN CANADA WITH INTERNATIONAL OPERATIONS:
COMPANIES HEADQUARTERED OUTSIDE OF CANADA WITH CANADIAN OPERATIONS:
IFC
Soc
ial a
nd E
nviro
nmen
tal P
erfo
rman
ce S
tand
ards
Jant
zi S
ocia
l Ind
ex
Inte
rnat
iona
l Cya
nide
Cod
e
MA
C T
owar
ds S
usta
inab
le M
inin
g*
WG
C C
onfli
ct F
ree
Gol
d St
anda
rd
OH
SAS
180
01
Extr
activ
e In
dust
ries
Tra
nspa
renc
y In
itiat
ive
OEC
D G
uide
lines
for
Mul
tinat
iona
l Ent
erpr
ises
Glo
bal R
epor
ting
Initi
ativ
e
Wat
er D
iscl
osur
e Pr
ojec
t
ICM
M S
usta
inab
le D
evel
opm
ent F
ram
ewor
k
ISO
14
00
1: E
MS
Stan
dard
UN
Glo
bal C
ompa
ct
Vol
unta
ry P
rinc
iple
s on
Sec
urity
and
Hum
an R
ight
s
AA
10
00
Car
bon
Dis
clos
ure
Proj
ect
Car
bon
Pric
ing
Lead
ersh
ip C
oalit
ion
Dow
Jon
es S
usta
inab
ility
Inde
x
Resp
onsi
ble
Jew
elle
ry
Kim
berl
ey P
roce
ss
Industry Sustainability
Initiatives
CommoditySpecific
StandardsFina
ncin
g St
anda
rds
Reporting, Disclosure and Transparency Standards
ManagementSystem
Standards
Listed on Socially
Responsible Investing Indices
International Voluntary Initiatives
INTERNATIONAL INITIATIVES
MAC MEMBER COMPANY APPLICATION OF INTERNATIONAL STANDARDS AND PROGRAMS
*Applied at international facilities.
**TSM is applied at international facilities, but results are not reported publicly.
***Applies only to select international facilities.

FACTS & FIGURES 2018 67
TITLE
Sources: MAC Member Companies, TSM Progress Report 2018.
Return to text
FIGURE 31TSM TAILINGS MANAGEMENT
TAILINGS MANAGEMENT ASSESSMENTSPERCENTAGE OF FACILITIES AT A LEVEL A OR HIGHER 2006, 2016 AND 2017

68 FACTS & FIGURES 2018
TITLE
Sources: MAC Member Companies, TSM Progress Report 2018.
FIGURE 32TSM BIODIVERSITY CONSERVATION MANAGEMENT
Return to text
BIODIVERSITY CONSERVATION MANAGEMENT ASSESSMENTSPERCENTAGE OF FACILITIES AT A LEVEL A OR HIGHER 2012, 2016 AND 2017

FACTS & FIGURES 2018 69
TITLE
Sources: MAC Member Companies, TSM Progress Report 2018.
FIGURE 33TSM ENERGY USE AND GHG EMISSIONS MANAGEMENT
Return to text
ENERGY USE AND GHG EMISSIONS MANAGEMENT ASSESSMENTS PERCENTAGE OF FACILITIES AT A LEVEL A OR HIGHER 2013, 2016 AND 2017

70 FACTS & FIGURES 2018
TITLE
1990 2014 2015 2016
Canadian economy
Canadian energy use (PJ) 9,608 11,787 11,924 11,903
Energy used by broader industry (PJ) 2,400 3,614 3,656 3,502
Canadian GHG emissions (mt) 613 732 741 737
Direct GHG emissions by all industries (mt) 104.1 147.8 149.6 143.2
Metal and non-metal mining
Total energy use (PJ) 143 150 150 153
Share of Canadian energy use (%) 1.48 1.28 1.26 1.28
Total GHG emissions (Mt CO2e) 5.93 6.1 6.1 6.05
Share of Canadian GHG emissions (%) 0.97 0.83 0.82 0.82
Source: Canadian Industrial Energy End-Use Data Analysis Centre (CIEEDAC) Report, 2017.Note: Total includes direct and indirect emissions.MAC has sought to include coal and oil sands mining data into the above calculations to provide a more representative, mining sector-wide statistic; however, CIEEDAC does not have access to oil sands mining or coal mining energy and emissions data to augment the non-metal mining data set.
FIGURE 34MINING INDUSTRY ENERGY AND GHG EMISSIONS DATA, 1990 AND 2014 -2016
Return to text

FACTS & FIGURES 2018 71
TITLE
Source: Canadian Environmental Assessment Agency.
FIGURE 35ENVIRONMENTAL ASSESSMENTS UNDER CEAA 2012-2018
Return to text
12
10
8
6
4
2
0
2012 20152013 20162014 20182017
CEAA REGISTRY
Note: 2012 and 2018 not complete years.

72 FACTS & FIGURES 2018
TITLE
SECTION 6
THE WORLD: INTERNATIONAL MARKET
ACTIVITIES AND DEVELOPMENTS
CANADIAN MINING’S INTERNATIONAL PRESENCECanadian mining companies operate in more than 100 countries around the world. According to Natural Resources Canada, 651 Canadian companies held mining assets abroad (CMAA) valued at $164 billion in 2016 – the most recent year for which data is available. While down in value 3.1% year-over-year, these assets account for two-thirds of total Canadian mining assets, and represent the second highest year on record as values peaked in 2015 (see Figure 36). By comparison, this figure is nearly twice that of Canadian mining assets at home, which amounted to $94.1 billion.
As geographic indicators, Latin America and Africa, respectively, were the top two continental destinations for Canadian international mining assets. The value of Canadian mining assets in Africa specifically experienced a modest decline (5.5%) in 2016. The most notable changes occurred in:
• Democratic Republic of the Congo (-$1.3 billion): Lundin Mining recorded an impairment loss as a result of a definitive agreement to sell its indirectly held interest in the Tenke Fungurume copper-cobalt mine, which was completed in April 2017.
• Mali (+$308 million): B2Gold has a majority interest in the Fekola Gold project, which started production at the end of 2017.
• South Africa (+$401.5 million): Platinum Group Metals was ramping up the Maseve platinum mine.
In Latin America, which accounted for 54% of CMAA, increases in assets held in Panama, Brazil and Peru were offset by declines in Chile and Mexico. This resulted in a consistent overall value for the region compared to the previous year at $88 billion in 2016. Notable developments occurred in:
• Brazil (+$808.1 million): Wheaton Precious Metals (formerly Silver Wheaton), a precious metals streaming company, increased its interest in Vale’s Salobo copper-gold mine again in 2016.
• Chile (-$1.6 billion): Yamana Gold recorded an impairment loss in 2016 at its El Peñón gold-silver mine.
• Mexico (-$1.1 billion): Aurcana sold its La Negra silver mine to a foreign interest. Yamana Gold sold its Mercedes gold mine to Premier Gold Mines, another Canadian company, but the asset was recorded at a lower value. Primero Mining recorded an impairment loss at its San Dimas gold mine.
• Panama (+$1.3 billion): First Quantum Minerals continued to develop its Cobre Panama copper mine, which was reported to be 46% complete at the end of 2016 and is scheduled to commence production in 2018. Capital expenditures for the project are anticipated to total $7.3 billion.
• Peru (+$531.8 million): Franco-Nevada acquired a precious metals stream from Glencore’s Antapaccay copper mine.
CANADIAN EXPLORATION AND MINING COMPANIES HAVE A SIGNIFICANT PRESENCE OUTSIDE CANADA’S BORDERS, AND CANADA IS REGARDED AS A GLOBAL LEADER FOR RESPONSIBLE MINING. BEYOND BEST PRACTICES, HOWEVER, WORLD MARKET CONDITIONS SHAPE THE INDUSTRY, AS DO GLOBAL TRADE AND INVESTMENT POLICIES.

FACTS & FIGURES 2018 73
9 INDUSTRY, INNOVATION AND INFRASTRUCTURELocal procurement increases skills and transfers technology to less developed countries.
THE WORLD: INTERNATIONAL MARKET ACTIVITIES AND DEVELOPMENTS
There are significant annual investments associated with these assets. In fact, companies listed on the Toronto Stock Exchange (TSX) and the Venture Exchange (TSX-V) raised $930 million for African mining projects in 2017 and $4.4 billion in equity capital for Latin American mining projects for the same year. Despite these investments, Canadian mining companies are facing increased competition from other mining jurisdictions operating internationally, including Australia and China.
Canadian Direct Investment AbroadCanadian Direct Investment Abroad (CDIA), and mining’s share of it, is an indicator of the industry’s international presence. CDIA was projected at $1.12 trillion in 2017 (see Figure 37). Of that, the mining sector accounted for $82.7 billion, or 7%, of the total. While this total is down 9% year-over-year, it remains a significant contributor, and is subject to modest fluctuations on occasion.
The Value of Company Expenditures in Host CountriesBeyond measuring inflows and outflows of industry capital, the impact of a mine’s horizontal value chain on local communities and host countries’ national GDP is considerable. This value chain significantly exceeds the taxes and royalties paid to governments, and can help reshape the dialogue around resource nationalism by more clearly identifying mining’s vast economic contributions.
It has been estimated that approximately 80% of all money spent in building and operating a mine is spent in the host country through wages, local procurement and payments to various levels of government. This estimate is supported by research conducted by MAC in 2018. Using methodology developed by the World Gold Council, MAC surveyed its members on their 2017 expenditures related to mining activities outside of Canada. The purpose of this study was to better understand the Canadian mining sector’s overall contributions to economic development around the world, beyond focusing exclusively on taxes and royalties.
Ten MAC member companies – representing 53 producing mines and non-producing operations, that together employ 73,500 employees and contractors – provided
information on their expenditures related to employee salaries, payments to suppliers, community investment, taxes and royalties, and payments to providers of capital.
The data provided by these 53 operations reveal results similar to those in the World Gold Council’s 2014 report, Responsible gold mining and value distribution, which showed that the majority of expenditures associated with mining activities are spent in host countries. For MAC’s survey, the reported expenditures totalled US$18.6 billion, with US$16.5 billion (89%) being spent within the host country, though there is a range from 41% expenditure in Mauritania to 98% expenditure in Chile.
The survey also found that the largest beneficiaries within host countries are companies that supply equipment and services to mining operations, accounting for 60% of the total. The second largest beneficiaries are payments to employees, accounting for 26% of the total, followed by combined payments to governments and communities accounting for 9% of the total. Figure 38 summarizes the consolidated survey data for 24 national jurisdictions and demonstrates that the broader economic contributions mining generates extend far beyond taxes and royalties.
Local Procurement and the Sustainable Development GoalsThe positive economic impacts created when Canadian mining companies procure goods and services in their host countries and communities can be game-changers for economic and social development. While civil society and the public at large have tended to focus heavily on the level of tax paid by mining companies, procurement is the single-largest payment type a mining operation will make over its lifespan.
Therefore, recognition of the role that local procurement can play in helping to achieve Sustainable Development Goals (SDGs) is increasing. As discussed in the joint report, Mapping Mining to the Sustainable Development Goals: An Atlas, local procurement can contribute meaningfully to a number of SDGs as shown below.
1 NO POVERTYLocal procurement creates revenue and jobs for the countries that host mining.
8 DECENT WORK AND ECONOMIC GROWTHLocal procurement creates jobs with learning opportunities and more balanced growth in host countries.
10 REDUCED INEQUALITIESLocal procurement helps ensure the benefits of mining are more shared across the economy.
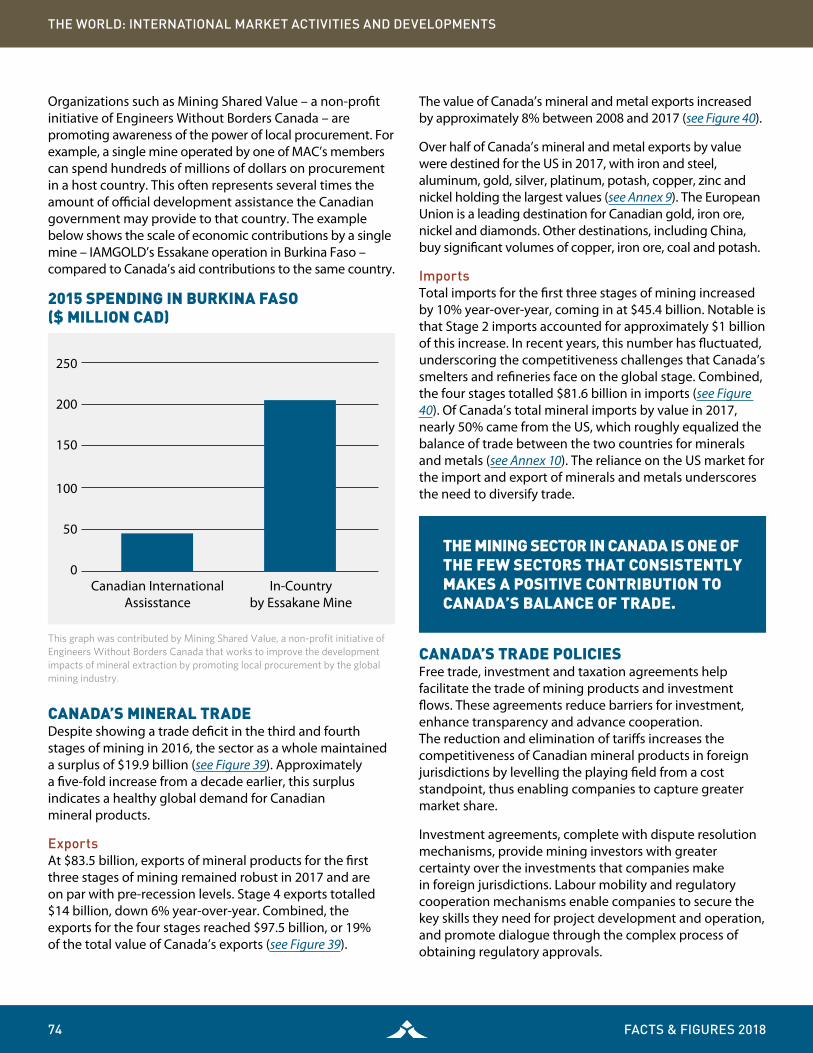
74 FACTS & FIGURES 2018
Organizations such as Mining Shared Value – a non-profit initiative of Engineers Without Borders Canada – are promoting awareness of the power of local procurement. For example, a single mine operated by one of MAC’s members can spend hundreds of millions of dollars on procurement in a host country. This often represents several times the amount of official development assistance the Canadian government may provide to that country. The example below shows the scale of economic contributions by a single mine – IAMGOLD’s Essakane operation in Burkina Faso – compared to Canada’s aid contributions to the same country.
2015 SPENDING IN BURKINA FASO ($ MILLION CAD)
This graph was contributed by Mining Shared Value, a non-profit initiative of Engineers Without Borders Canada that works to improve the development impacts of mineral extraction by promoting local procurement by the global mining industry.
CANADA’S MINERAL TRADEDespite showing a trade deficit in the third and fourth stages of mining in 2016, the sector as a whole maintained a surplus of $19.9 billion (see Figure 39). Approximately a five-fold increase from a decade earlier, this surplus indicates a healthy global demand for Canadian mineral products.
ExportsAt $83.5 billion, exports of mineral products for the first three stages of mining remained robust in 2017 and are on par with pre-recession levels. Stage 4 exports totalled $14 billion, down 6% year-over-year. Combined, the exports for the four stages reached $97.5 billion, or 19% of the total value of Canada’s exports (see Figure 39).
THE WORLD: INTERNATIONAL MARKET ACTIVITIES AND DEVELOPMENTS
250
200
150
100
50
0Canadian International
AssisstanceIn-Country
by Essakane Mine
The value of Canada’s mineral and metal exports increased by approximately 8% between 2008 and 2017 (see Figure 40).
Over half of Canada’s mineral and metal exports by value were destined for the US in 2017, with iron and steel, aluminum, gold, silver, platinum, potash, copper, zinc and nickel holding the largest values (see Annex 9). The European Union is a leading destination for Canadian gold, iron ore, nickel and diamonds. Other destinations, including China, buy significant volumes of copper, iron ore, coal and potash.
ImportsTotal imports for the first three stages of mining increased by 10% year-over-year, coming in at $45.4 billion. Notable is that Stage 2 imports accounted for approximately $1 billion of this increase. In recent years, this number has fluctuated, underscoring the competitiveness challenges that Canada’s smelters and refineries face on the global stage. Combined, the four stages totalled $81.6 billion in imports (see Figure 40). Of Canada’s total mineral imports by value in 2017, nearly 50% came from the US, which roughly equalized the balance of trade between the two countries for minerals and metals (see Annex 10). The reliance on the US market for the import and export of minerals and metals underscores the need to diversify trade.
CANADA’S TRADE POLICIES Free trade, investment and taxation agreements help facilitate the trade of mining products and investment flows. These agreements reduce barriers for investment, enhance transparency and advance cooperation. The reduction and elimination of tariffs increases the competitiveness of Canadian mineral products in foreign jurisdictions by levelling the playing field from a cost standpoint, thus enabling companies to capture greater market share.
Investment agreements, complete with dispute resolution mechanisms, provide mining investors with greater certainty over the investments that companies make in foreign jurisdictions. Labour mobility and regulatory cooperation mechanisms enable companies to secure the key skills they need for project development and operation, and promote dialogue through the complex process of obtaining regulatory approvals.
THE MINING SECTOR IN CANADA IS ONE OF THE FEW SECTORS THAT CONSISTENTLY MAKES A POSITIVE CONTRIBUTION TO CANADA’S BALANCE OF TRADE.

FACTS & FIGURES 2018 75
However, international agreements do not alone facilitate trade. Trade-enabling transportation infrastructure is essential for companies to get their goods to market. Beyond infrastructure expansion, the efficient operation of Canadian modes of transportation, such as rail, is critical. Further, the efforts of Canada’s Trade Commissioner Service, and other outward looking programs, including Export Development Canada, are critical supports for Canadian companies operating aboard.
Part of maintaining Canada’s global leadership is ensuring that Canadian mining and supply sectors have access to modern and comprehensive trade and investment vehicles to meet the world where it does business. MAC is pleased to see the Government of Canada pursuing a robust trade agenda, and supports participation in the following engagements.
Investor State Dispute Settlement (ISDS) MechanismsISDS protections are critically important to the Canadian mining industry due to unique factors that define mineral
investments. First, mining companies must go to where commercially developable mineral and metal deposits are located. While Canada is rich in many minerals and metals, a significant number of our members also have operations overseas, with particularly high concentrations in some countries. For example, nearly 70 per cent of foreign-owned mining companies operating in Mexico are based in Canada. On the macro level, Canadian mining companies possess $163 billion in assets in more than 100 countries around the world.
These operations are more vulnerable than those of other sectors due to the tremendous up-front capital costs involved with mineral development. It is common for an average mine’s initial capital expenditure to exceed $1 billion before any minerals are produced or processed. After production begins, mines typically operate for several years to recover capital before any profit is realized. In the event of an interruption of mineral production beyond the miner’s control, that investment is as immobile as it is grounded in the host country.
ISDS mechanisms provide a strong enforcement tool that helps to ensure that Canadian investors, businesses and their workers will be treated fairly overseas and can continue to bring the international dollars home. While a last resort for companies, this mechanism is an essential part of modernized Canadian trade and investment agreements, including Canada’s own FIPA model. It is critical that it remains so in agreements going forward.
Canada, US, Mexico Free Trade AgreementOn November 30th, 2018, Canada, the US and Mexico signed the Canada, United States and Mexico Free Trade Agreement (CUSMA).
CUSMA is based on the North American Free Trade Agreement which originally came into effect on January 1st, 1994. The present agreement was the result of more than a year of negotiations including threats of tariffs by the US against Canada.
MAC appreciates the negotiations were protracted and welcomes the reduction in business uncertainty that the signing of the agreement brings. MAC was disappointed, however, that the United States-Mexico-Canada Agreement (USMCA) did not include an ISDS mechanism. ISDS protections are critically important to the Canadian mining industry due to the unique factors that define mineral investments, and MAC supports their continued inclusion in trade agreements ongoing, as well as Canada’s continued pursuit of FIPA with key partners.
THE WORLD: INTERNATIONAL MARKET ACTIVITIES AND DEVELOPMENTS

76 FACTS & FIGURES 2018
THE WORLD: INTERNATIONAL MARKET ACTIVITIES AND DEVELOPMENTS
While Canadian investors in the US will no longer have recourse to ISDS mechanisms, the signing and subsequent coming into force of the Comprehensive and Progressive Agreement for Trans-Pacific Partnership (discussed below) will have ISDS provisions that Canadian investors will have recourse to for investments in Mexico.
Comprehensive and Progressive Agreement for Trans-Pacific PartnershipMAC supports the government’s ratification of the Comprehensive and Progressive Agreement for Trans-Pacific Partnership (CPTPP), a new free trade agreement between Australia, Brunei, Canada, Chile, Japan, Malaysia, Mexico, New Zealand, Peru, Singapore and Vietnam. Once the CPTPP enters into force it will be one of the largest free trade agreements in the world and will provide enhanced market access to key Asian markets.
From 2014 to 2016, Canada’s exports of metals and minerals to CPTPP countries were worth, on average, $6.8 billion per year. Metals and minerals exports currently face tariffs in a number of CPTPP markets, including Australia (up to 5%), Japan (up to 11.7%), Malaysia (up to 50%), New Zealand (up to 10%) and Vietnam (up to 40%). These tariffs will be fully eliminated under the CPTPP.
In January 2017, the US withdrew from the TPP. Historically, Canada has had close trade ties with the US, so the value of the TPP for Canadian mining companies was focused on the expansion of trade relationships with a broader consortium of countries whose economies are growing rapidly, and whose future anticipated growth is strong. Even without the participation of the US, the CPTPP has strategic value for Canadian mining companies by expanding their access to growing markets.
Trade Relations with ChinaChina is the single largest consumer of raw materials. Recent estimates suggest that China accounts for 54% of aluminum, 48% of copper, 50% of nickel, and 45% of all steel (and, therefore, a significant percentage of steelmaking coal) consumed globally. China is also a major consumer of precious metals, buying or mining 23% and 15% of the world’s gold and silver supply, respectively. The country also consumes 13% of the world’s uranium production, a number poised to increase given the number of nuclear reactors under construction or being commissioned.
China is Canada’s third-largest market for the export of minerals and metals after the US and the European Union, with an export value exceeding $4.6 billion in 2017, or approximately 5% of our overall total.
With 18 countries having free trade agreements in place with China, and 22 more countries in various stages of negotiation and pre-negotiation discussions, many nations have acknowledged that their economic futures are inexorably tied to it. Given this reality and China’s importance to Canada’s future, MAC has encouraged the federal government to continue enhancing economic and diplomatic relations with the aim of launching free trade negotiations.
A free-trade agreement (FTA) with China is a significant opportunity for Canada to capture greater Chinese market share for raw materials. Further, Canada possesses a North American advantage in that the Ports of Metro Vancouver and Prince Rupert are, on average, three days closer to multiple Asian ports, including Chinese ports, than our American and Mexican competitors.
Mercosur Mercosur is a South American sub-regional common market trade bloc whose current full members are Argentina, Brazil, Paraguay and Uruguay. On March 9th, 2018 in Asuncion, Paraguay, negotiations toward a comprehensive Canada-Mercosur FTA were launched.

FACTS & FIGURES 2018 77
THE WORLD: INTERNATIONAL MARKET ACTIVITIES AND DEVELOPMENTS
MAC has supported the government’s efforts to reassess the viability of a FTA with Mercosur, and participated in consultations on the matter. Combined, the assets of Canadian companies operating in Brazil and Argentina account for 5% and 8%, respectively, of the value of Canadian mining assets abroad.
Beyond investments and assets, MAC and its members are exporting best practices in mining sustainability to Mercosur countries.
The most significant recent example of this is in Argentina, where the Cámara Argentina de Empresarios Mineros (CAEM) adopted MAC’s Towards Sustainable Mining® (TSM®) initiative. Argentina’s adoption of TSM is an important step forward in cooperation on responsible mining standards between Canada and a major mining jurisdiction in Latin America.
Pacific Alliance The Pacific Alliance is a regional initiative created in 2011 by Chile, Colombia, Mexico and Peru that seeks the free movement of goods, services, capital and people. Each of the above countries are significant destinations for Canadian mineral investment, and closer trade ties with this alliance is something that MAC supports.
With a combined GDP of $2.5 trillion, and 223 million inhabitants, the Pacific Alliance constitutes an important market for Canada. The Alliance’s overarching goals are to foster the free movement of goods, services, capital and people and to promote greater competitiveness and economic growth for member countries.
In June 2017, Canada was among the first countries invited to become an Associated State of the Pacific Alliance, along with Australia, New Zealand and Singapore.
THE CANADIAN INVESTMENT REGIME Foreign investment gives Canadian businesses easier access to new technologies and ideas, and enhances connectivity to larger markets and production chains. Ensuring that two-way flows of capital remain fair and open is essential. Negotiating safeguards for industry investment abroad, while enabling foreign investment into Canada, are key.
Foreign Investment Promotion and Protection Agreements (FIPA)A FIPA is a bilateral agreement aimed at protecting and promoting foreign investment through legally binding rights and obligations. At the time of writing, Canada had 37 FIPAs in force, had signed two others yet to come into force, concluded negotiations with six additional countries,
and remains engaged in ongoing negotiations with 14 other countries.
While the enforcement components of FIPAs are rarely used, such as ISDS discussed above, the mere existence of a FIPA provides foreign governments with a set of rules and expectations for fairness and transparency, and gives investors additional confidence. At the time of writing, the department of Global Affairs Canada is reviewing their FIPA program, a component of which includes consulting with stakeholders. MAC will remain engaged in this process, and underscores the importance of the continued inclusion of robust ISDS mechanisms in these agreements going forward.
Investment in Latin America Eight of Canada’s 37 active FIPAs are with Latin American countries, reflecting the industry’s presence in the region, as well as the continent’s mineral wealth and potential. As of 2017, Canadian companies held $88 billion in assets in Latin America, nearly half of the total value of Canada’s overseas mineral assets.
Investment in AfricaSince 2010, the Canadian government has concluded, signed or brought 12 FIPA negotiations into force with African countries. A further three FIPA negotiations are currently ongoing with African countries. In recent years, many African countries have been seeking to benefit from their natural resource endowments, and have become more open to new mining investments and the expansion of existing mining projects. Some of the major resources mined in Africa include iron ore, diamonds, gold, platinum, uranium, copper and coal.
While significant opportunities for strong partnerships exist between mining companies and their host countries, challenges must be overcome to ensure projects can develop in ways that enable the host community, country and company to benefit.
Foreign Direct Investment in CanadaCanada relies heavily on foreign direct investment (FDI), and the mining industry and downstream value-added manufacturing activities accounted for approximately $46 billion, or 6%, of FDI in 2017. When isolated from this total, 2017 mining FDI into Canada totalled $28 billion, approximately 3.5% of Canada’s overall total (see Figure 37).

78 FACTS & FIGURES 2018
TITLE
Source: Minerals and Metals Sector, Natural Resources Canada.
FIGURE 36THE GEOGRAPHICAL DISTRIBUTION OF CANADA’S MINING ASSETS, 2016
Return to text

FACTS & FIGURES 2018 79
TITLE
($ millions)
Total, all industries Mining (except oil and gas)Non-metallic mineral
product manufacturingPrimary metal manufacturing
Fabricated metal product manufacturing
Year
Canadian direct
investment abroad
Foreign direct investment in
Canada
Canadian direct
investment abroad
Foreign direct investment in
Canada
Canadian direct
investment abroad
Foreign direct investment in
Canada
Canadian direct
investment abroad
Foreign direct investment in
Canada
Canadian direct
investment abroad
Foreign direct investment in
Canada
1999 290,730 252,563 23,878 5,520 3,048 4,867 9,859 3,732 4,570 2,162
2000 356,506 319,116 23,666 5,535 2,621 5,009 11,662 4,593 4,881 2,214
2001 399,253 340,429 23,666 7,122 3,257 5,425 14,393 4,266 6,091 2,468
2002 435,494 356,819 22,779 6,069 3,028 5,682 13,281 4,064 5,582 2,442
2003 412,217 373,685 22,374 5,666 2,632 6,276 x 4,428 5,464 2,681
2004 448,546 379,450 22,481 8,611 2,105 6,108 x 5,200 4,624 2,748
2005 452,195 397,828 23,025 10,291 2,237 3,659 x 4,484 4,707 2,198
2006 518,839 437,171 23,849 22,375 6,439 6,243 26,255 9,563 4,458 2,941
2007 515,294 512,266 25,045 23,502 5,590 6,525 26,438 29,126 3,251 3,125
2008 641,920 550,539 27,189 9,544 6,787 7,768 30,828 41,879 3,775 2,920
2009 630,818 573,901 38,801 12,219 6,212 8,158 24,132 37,899 3,420 2,473
2010 637,285 592,406 46,706 16,140 5,953 7,276 4,227 34,201 2,293 2,157
2011 675,020 603,455 54,541 14,701 6,384 8,067 5,636 33,784 2,262 2,968
2012 704,335 633,778 63,782 18,622 5,305 7,881 3,172 32,542 2,010 3,153
2013 778,371 688,873 77,108 21,898 5,835 7,092 4,715 27,954 2,270 3,270
2014 845,203 744,671 78,744 36,871 1,155 7,718 7,299 28,986 3,925 3,504
2015 1,043,822 782,912 82,379 21,064 2,867 8,421 4,442 14,923 3,385 2,384
2016 1,083,730 808,738 86,048 24,357 1,669 7,924 5,966 8,803 4,813 1,894
2017 1,121,102 824,035 82,689 28,242 1,612 8,209 3,080 9,761 4,418 1,915
Source: Statistics Canada, CANSIM Table 376-0052.P Preliminary.
FIGURE 37CANADIAN MINERAL INDUSTRY DIRECT INVESTMENT ABROAD AND FOREIGN DIRECT INVESTMENT STOCKS, 1999-2017P
Return to text

80 FACTS & FIGURES 2018
TITLE
CountryTotal in-country
expenditures (US$m)Total Expenditure (US$m)1 As a % of total expenditures
Payments to governments (US$m)2
Payments to Suppliers (US$m)
Argentina $726,122,821.56 $830,837,490.19 87% $5,260,000.00 $415,068,943.13
Australia $141,513,000.00 $141,513,000.00 100% $10,928,000.00 $86,542,000.00
Bolivia $58,019,394.94 $58,019,394.94 100% $21,530,000.00 $17,069,864.70
Brazil $556,220,000.00 $664,520,000.00 84% $5,320,000.00 $474,500,000.00
Burkina Faso $290,702,560.48 $440,362,560.48 66% $56,260,000.00 $192,214,625.19
Canada $3,889,418,621.53 $4,085,701,002.90 95% $334,944,284.00 $2,427,537,282.77
Chile $336,741,001.00 $344,771,001.00 98% $20,356,666.00 $249,924,335.00
Dominican Republic $392,099,378.77 $608,598,757.55 64% $53,650,000.00 $181,860,000.00
Finland $239,068,983.23 $253,158,116.00 94% $16,610,000.00 $190,101,197.23
Ghana $238,580,000.00 $304,780,000.00 78% $30,080,000.00 $154,500,000.00
Greece $220,747,274.02 $245,725,451.22 90% $330,000.00 $177,287,390.29
Guatamala $59,955,033.29 $65,398,908.00 92% $12,881,503.00 $29,268,171.55
Mauritania $271,000,000.00 $660,150,000.00 41% $13,200,000.00 $215,600,000.00
Mexico $2,742,143,948.72 $2,935,836,911.09 93% $16,030,000.00 $1,435,183,092.03
Papua New Guinea $256,203,000.00 $376,701,000.00 68% $3,180,000.00 $74,532,250.00
Peru $621,024,556.67 $636,686,740.67 98% $29,740,000.00 $456,328,872.66
Romania $21,507,800.57 $24,899,305.71 86% $230,000.00 $19,085,025.78
Russia $461,520,000.00 $526,820,000.00 88% $163,620,000.00 $208,200,000.00
Saudi Arabia $127,035,000.00 $143,570,000.00 88% $- $63,515,000.00
Suriname $281,936,421.00 $407,655,362.10 69% $100,290,000.00 $145,000,000.00
Turkey $258,362,000.00 $292,392,000.00 88% $38,850,000.00 $185,950,000.00
USA $3,627,901,714.00 $3,703,106,714.00 98% $520,591,000.00 $2,211,464,500.00
Zambia $745,720,000.00 $851,780,000.00 88% $62,740,000.00 $559,210,000.00
Total $16,563,542,509.79 $18,602,983,715.85 112% $1,516,621,453.00 $10,169,942,550.33
Source: Mining Association of Canada.Note: 1 Includes in-jurisdiction payments to providers of capital.2 Includes royalties and land use, income and other taxes, employee taxes, other payments.3 Contractor salaries are included as payments to suppliers.* Information not available.
Return to text
FIGURE 38MINING COMPANY INVESTMENT IN HOST COUNTRIES - 2017

FACTS & FIGURES 2018 81
TITLE
Country Payments to employees Communities (US$m)Payments to providers
of capitalTotal mineral revenue
Number of employees and contractors3
Argentina $244,119,811.44 $3,161,352.00 0 $22,178,000,000.00 6,429
Australia $43,955,000.00 $88,000.00 0 $170,500,000.00 329
Bolivia $19,419,530.24 $- 0 $85,887,382.53 596
Brazil $75,000,000.00 $1,400,000.00 0 $447,000,000.00 3,709
Burkina Faso $42,000,000.00 $227,935.29 0 $547,300,000.00 3,234
Canada $1,115,081,758.76 $11,855,296.00 $5,960.80 $4,375,887,837.00 13,673
Chile $64,700,000.00 $1,760,000.00 0 $52,000,000.00 2,787
Dominican Republic $58,974,000.00 $1,614,000.00 0 $1,419,353,915.00 4,793
Finland $31,777,000.00 $580,786.00 0 $249,300,000.00 957
Ghana $53,100,000.00 $900,000.00 0 $317,600,000.00 1,899
Greece $41,252,508.76 $1,877,374.97 0 $53,481,725.04 492
Guatamala $13,666,259.74 $4,139,099.00 0 $87,011,504.00 559
Mauritania $40,400,000.00 $1,800,000.00 0 $298,400,000.00 4,917
Mexico $1,075,032,571.69 $4,812,100.00 0 $2,414,181,486.50 2,950
Papua New Guinea $178,068,000.00 $422,750.00 0 $- 2,862
Peru $80,296,484.01 $8,909,200.00 0 $1,019,715,024.89 2,849
Romania $2,036,780.73 $155,994.06 0 $- 318
Russia $88,900,000.00 $800,000.00 0 $726,900,000.00 2,620
Saudi Arabia $63,515,000.00 $5,000.00 0 $371,000,000.00 216
Suriname $35,846,421.00 $800,000.00 0 $385,610,000.00 1,709
Turkey $32,690,000.00 $872,000.00 0 $337,900,000.00 1,609
USA $894,420,514.00 $1,425,700.00 0 $1,676,800,000.00 9,858
Zambia $120,950,000.00 $2,820,000.00 0 $- 4,211
Total $4,415,201,640.37 $50,426,587.32 $5,960.80 $37,213,828,874.96 73,576
Source: Mining Association of Canada.Note: 1 Includes in-jurisdiction payments to providers of capital.2 Includes royalties and land use, income and other taxes, employee taxes, other payments.3 Contractor salaries are included as payments to suppliers.* Information not available.
Return to text
FIGURE 38 CONTINUEDMINING COMPANY INVESTMENT IN HOST COUNTRIES - 2017

82 FACTS & FIGURES 2018
TITLE
Stage Domestic Exports ($ thousands) Total Exports ($ thousands) Total Imports ($ thousands) Balance of Trade ($ thousands)
Stage I 29,916,881 29,964,026 9,271,015 20,693,011
Stage II 36,669,840 37,118,129 13,794,946 23,323,183
Stage III 16,877,042 17,977,087 22,315,507 -4,338,420
Stage IV 14,002,728 16,449,482 36,237,396 -19,787,914
Total 97,466,491 101,508,724 81,618,864 19,889,860
Sources: Natural Resouces Canada; Statistics Canada.Note: Total exports represents the sum of domestic exports and re-exports. Re-exports are the goods of foreign origin that have not been materially transformed in Canada. This includes foreign goods withdrawn for export from bonded customs warehouses. Totals may not add due to rounding. As of 2014, Natural Resources Canada no longer includes nitrogen within the minerals and metals trade statistics. Historical data have been revised to reflect this change.
FIGURE 39BALANCE OF CANADA’S MINERAL TRADE, 2017
Return to text

FACTS & FIGURES 2018 83
TITLE
YearDomestic Exports
($ thousands)Total Exports ($ thousands)
Imports ($ thousands)
Balance of Trade ($ thousands)
2003 45.6 47.0 45.0 2.1
2004 53.7 55.5 51.9 3.6
2005 61.0 63.2 56.3 6.8
2006 71.4 74.2 61.6 12.5
2007 80.1 83.6 62.2 21.4
2008 90.2 93.0 68.7 24.3
2009 62.7 65.0 54.7 10.3
2010 80.2 83.2 66.1 17.1
2011 95.9 100.3 76.7 23.6
2012 88.1 91.1 75.5 15.6
2013 86.9 90.0 73.4 16.6
2014 89.6 93.2 79.9 13.4
2015 92.0 96.2 80.9 15.3
2016 88.7 92.9 77.0 15.9
2017 97.5 101.5 81.6 19.9
Sources: Natural Resouces Canada; Statistics Canada.Note: Total exports represents the sum of domestic exports and re-exports. Re-exports are the goods of foreign origin that have not been materially transformed in Canada. This includes foreign goods withdrawn for export from bonded customs warehouses. Totals may not add due to rounding. As of 2014, Natural Resources Canada no longer includes nitrogen within the minerals and metals trade statistics. Historical data have been revised to reflect this change.
FIGURE 40VALUE OF CANADA’S MINING AND MINERAL PROCESSING INDUSTRY TRADE, 2003-2017
Return to text
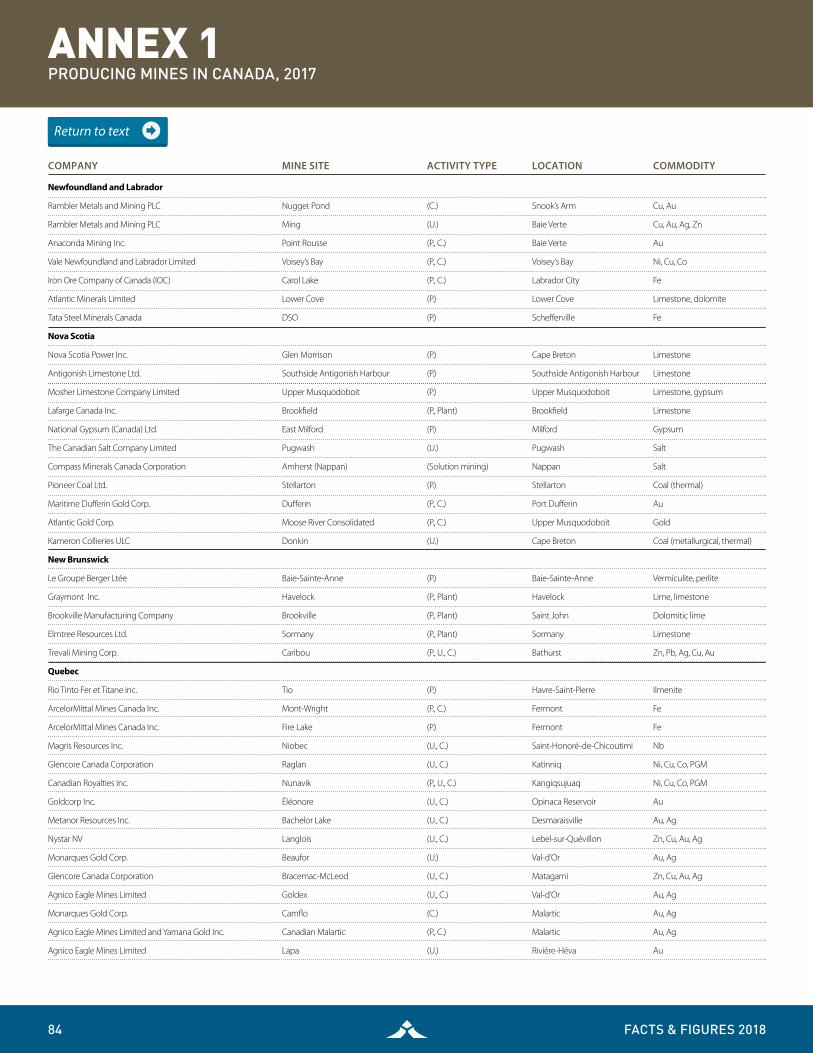
84 FACTS & FIGURES 2018
TITLE
Newfoundland and Labrador
Rambler Metals and Mining PLC Nugget Pond (C.) Snook’s Arm Cu, Au
Rambler Metals and Mining PLC Ming (U.) Baie Verte Cu, Au, Ag, Zn
Anaconda Mining Inc. Point Rousse (P., C.) Baie Verte Au
Vale Newfoundland and Labrador Limited Voisey’s Bay (P., C.) Voisey’s Bay Ni, Cu, Co
Iron Ore Company of Canada (IOC) Carol Lake (P., C.) Labrador City Fe
Atlantic Minerals Limited Lower Cove (P.) Lower Cove Limestone, dolomite
Tata Steel Minerals Canada DSO (P.) Schefferville Fe
Nova Scotia
Nova Scotia Power Inc. Glen Morrison (P.) Cape Breton Limestone
Antigonish Limestone Ltd. Southside Antigonish Harbour (P.) Southside Antigonish Harbour Limestone
Mosher Limestone Company Limited Upper Musquodoboit (P.) Upper Musquodoboit Limestone, gypsum
Lafarge Canada Inc. Brookfield (P., Plant) Brookfield Limestone
National Gypsum (Canada) Ltd. East Milford (P.) Milford Gypsum
The Canadian Salt Company Limited Pugwash (U.) Pugwash Salt
Compass Minerals Canada Corporation Amherst (Nappan) (Solution mining) Nappan Salt
Pioneer Coal Ltd. Stellarton (P.) Stellarton Coal (thermal)
Maritime Dufferin Gold Corp. Dufferin (P., C.) Port Dufferin Au
Atlantic Gold Corp. Moose River Consolidated (P., C.) Upper Musquodoboit Gold
Kameron Collieries ULC Donkin (U.) Cape Breton Coal (metallurgical, thermal)
New Brunswick
Le Groupe Berger Ltée Baie-Sainte-Anne (P.) Baie-Sainte-Anne Vermiculite, perlite
Graymont Inc. Havelock (P., Plant) Havelock Lime, limestone
Brookville Manufacturing Company Brookville (P., Plant) Saint John Dolomitic lime
Elmtree Resources Ltd. Sormany (P., Plant) Sormany Limestone
Trevali Mining Corp. Caribou (P., U., C.) Bathurst Zn, Pb, Ag, Cu, Au
Quebec
Rio Tinto Fer et Titane inc. Tio (P.) Havre-Saint-Pierre Ilmenite
ArcelorMittal Mines Canada Inc. Mont-Wright (P., C.) Fermont Fe
ArcelorMittal Mines Canada Inc. Fire Lake (P.) Fermont Fe
Magris Resources Inc. Niobec (U., C.) Saint-Honoré-de-Chicoutimi Nb
Glencore Canada Corporation Raglan (U., C.) Katinniq Ni, Cu, Co, PGM
Canadian Royalties Inc. Nunavik (P., U., C.) Kangiqsujuaq Ni, Cu, Co, PGM
Goldcorp Inc. Éléonore (U., C.) Opinaca Reservoir Au
Metanor Resources Inc. Bachelor Lake (U., C.) Desmaraisville Au, Ag
Nystar NV Langlois (U., C.) Lebel-sur-Quévillon Zn, Cu, Au, Ag
Monarques Gold Corp. Beaufor (U.) Val-d’Or Au, Ag
Glencore Canada Corporation Bracemac-McLeod (U., C.) Matagami Zn, Cu, Au, Ag
Agnico Eagle Mines Limited Goldex (U., C.) Val-d’Or Au, Ag
Monarques Gold Corp. Camflo (C.) Malartic Au, Ag
Agnico Eagle Mines Limited and Yamana Gold Inc. Canadian Malartic (P., C.) Malartic Au, Ag
Agnico Eagle Mines Limited Lapa (U.) Rivière-Héva Au
COMPANY MINE SITE ACTIVITY TYPE LOCATION COMMODITY
Return to text
ANNEX 1PRODUCING MINES IN CANADA, 2017

FACTS & FIGURES 2018 85
PRODUCING MINES IN CANADA, 2017
Agnico Eagle Mines Limited LaRonde (U., C.) Preissac Au, Zn, Cu, Pb, Ag
IAMGOLD Corporation Westwood-Doyon (U., C.) Cadillac Au, Cu, Ag, Zn
Hecla Mining Company Casa Berardi (U., C.) North of La Sarre, Casa Berardi Twp. Au, Ag
K+S Windsor Salt Ltd Seleine (U.) Îles-de-la-Madeleine Salt
Le Groupe Berger Ltée Saint-Modeste (P.) Saint-Modeste Vermiculite, perlite
Graymont Inc. Marbleton (P., Plant) Marbleton Limestone, lime
Graymont Inc. Bedford (P., Plant) Bedford Limestone, lime
OMYA (Canada) Inc. Saint-Armand (P., Plant) Saint-Armand Calcium carbonate
CRH plc Joliette (P., Plant) Joliette Limestone
Graymont Inc. Joliette (P., Plant) Joliette Lime, limestone
Imerys Mica Suzorite, Inc. Lac Letondal (P.) Parent, Suzor Twp. Mica
Imerys Graphite and Carbon Lac-des-Îles (P., Plant) Saint-Aimé-du-Lac-des-Îles Graphite
Abcourt Mines Inc. Sleeping Giant (C.) North of Amos Au, Ag
Abcourt Mines Inc. Elder (U.) Rouyn-Noranda Au, Ag
Ciment Québec inc. Quebec (P., Plant) Québec City Limestone
Ciment Québec inc. Saint-Basile (P., Plant) Saint-Basile Limestone
Graymont Inc. Les Carrières Calco (P., Plant) St-Marc-des-Carrières Calcium carbonate
Stornoway Diamond Corporation Renard (P., U., C.) Mistissini Diamonds
Carrière d’Acton Vale ltée Acton Vale (P., Plant) Acton Vale Calcium carbonate
Lafarge Canada Inc. St-Constant (P., Plant) St-Constant Limestone
Demix Agrégats Laval (P., Plant) Laval Limestone
Ciment Québec inc. Laval (P., Plant) Laval Limestone
Colacem Canada inc. Kilmar (P., Plant) Calumet Limestone
Ressources Nottaway Inc. Vezza (U.) North of Amos Au, Ag
Ontario
Detour Gold Corporation Detour Lake (P., C.) Matagami Au
Kirkland Lake Gold Ltd. Holt (U., C.) Timmins Au
Kirkland Lake Gold Inc. Macassa (U., C.) Kirkland Lake area Au, Ag
McEwen Mining Inc. Black Fox (P., U., C.) Matheson Au
Kirkland Lake Gold Inc. Taylor (U.) Cochrane Au
Alamos Gold Inc. Young-Davidson (U., C.) Kirkland Lake area Au
Glencore Canada Corporation Nickel Rim South (U.) Sudbury Ni, Cu, Co, PGM, Au
Vale Canada Limited Garson (U.) Sudbury Ni, Cu, Co, PGM, Au, Ag, Se, Te
Vale Canada Limited Stobie (U.) Sudbury Ni, Cu, Co, PGM, Au, Ag, Se, Te
Vale Canada Limited Clarabelle (C.) Sudbury Ni, Cu, Co, PGM, Au, Ag, Se, Te
Vale Canada Limited Copper Cliff North (U.) Sudbury Ni, Cu, Co, PGM, Au, Ag, Se, Te
Goldcorp Inc. Hoyle Pond (U.) South of Porcupine Au
Tahoe Resources Inc. Bell Creek (U., C.) Timmins Au
Vale Canada Limited Creighton (U.) Sudbury Ni, Cu, Co, PGM, Au, Ag, Se, Te
Goldcorp Inc. Dome (U., C.) Timmins Au
Goldcorp Inc. Hollinger (P.) Timmins Au
Vale Canada Limited Coleman/McCreedy East (U.) Sudbury Ni, Cu, Co, PGM, Au, Ag, Se, Te
Glencore Canada Corporation Fraser (U.) Sudbury Ni, Cu, Co, PGM
Glencore Canada Corporation Strathcona (C.) Sudbury Ni, Cu, Co, PGM, Au, Ag, Se, Te
Glencore Canada Corporation Kidd Creek (U., C.) Timmins Cu, Zn, Ag, Se, Te, In, Cd
KGHM Polska Miedz S.A. Levack/Morrison (U.) Sudbury Cu, Ni
COMPANY MINE SITE ACTIVITY TYPE LOCATION COMMODITY

86 FACTS & FIGURES 2018
PRODUCING MINES IN CANADA, 2017
Vale Canada Limited Totten (U.) Worthington Ni, Cu, Co, PGM, Au
Tahoe Resources Inc. Timmins West (U.) Timmins Au
Alamos Gold Inc. Island Gold (U., C.) Dubreuilville Au
Wesdome Gold Mines Ltd. Mishi (P., C.) Timmins Au
Wesdome Gold Mines Ltd. Eagle River (U., C.) Wawa Au
Barrick Gold Corporation Hemlo (Williams) (P., U., C.) Marathon Au
North American Palladium Ltd. Lac des Iles (P., U., C.) Thunder Bay PGM, Ni, Au, Cu, Co
Goldcorp Inc. Musselwhite (U., C.) Thunder Bay Au, Ag
Goldcorp Inc. Red Lake (U., C.) Balmertown Au, Ag
Canadian Wollastonite St. Lawrence (P.) Kingston Wollastonite
OMYA (Canada) Inc. Tatlock (P.) Tatlock Calcium carbonate
Lafarge Canada Inc. Bath (P.) Bath Limestone
ESSROC Canada Inc. Picton (P.) Picton Limestone
CRH plc Ogden Point (P.) Ogden Point Limestone
Unimin Canada Ltd. Blue Mountain (P., Plant) Blue Mountain Nepheline syenite
St. Marys CBM (Canada) Inc. Bowmanville (P.) Bowmanville Limestone
CGC Inc. Hagersville (U., Plant) Hagersville Gypsum
E.C. King Contracting Ltd. (Miller Paving Co.) Owen Sound (P.) Owen Sound Dolomitic lime
MarFred Minerals Ltd. Tracey Lake (U.) North Williams Barite
St Marys CBM (Canada) Inc. St Marys (P.) St. Marys Limestone
Compass Minerals Canada Corporation Goderich (U., Plant) Goderich Salt
IMERYS Talc Penhorwood (P.) Penhorwood Talc
K+S Windsor Salt Ltd. Windsor (solution mining) Windsor Salt
K+S Windsor Salt Ltd. Ojibway (U.) Windsor Salt
De Beers Canada Inc. Victor (P., Plant) James Bay Lowlands Diamonds
Miller Minerals (Miller Paving Co.) Bucke (P.) New Liskeard Limestone
Carmeuse Lime (Canada) Limited Dundas (P.) Dundas Dolomitic lime
Lafarge Canada Inc. Dundas (P.) Dundas Limestone
Carmeuse Lime (Canada) Limited Beachville (P., Plant) Ingersoll Limestone, lime
Compass Minerals Canada Corporation Goderich (solution mining) Goderich Salt
Boreal Agrominerals Inc. Spanish River Carbonite (P.) Northwest of Sudbury Vermiculite
Lafarge Canada Inc. Meldrum Bay (P., Plant) Manitoulin Island Limestone, dolomite
New Gold Inc. Rainy River (P., U., C.) Fort Frances Au, Ag, Ni, Cu, Co
Manitoba
Tantalum Mining Corporation of Canada Limited Tanco (U., C.) Lac-du-Bonnet Cs
Vale Canada Limited Thompson (P., U., C.) Thompson Ni, Cu, Co, PGM
Vale Canada Limited Birchtree (U.) Thompson Ni, Cu, Co, PGM
HudBay Minerals Inc. Snow Lake Cu, Zn, Au, Ag Snow Lake Cu, Zn
HudBay Minerals Inc. Lalor Lake (U.) Snow Lake Cu, Zn, Au, Ag
HudBay Minerals Inc. Reed Cu, Zn, Au, Ag Snow Lake Cu, Zn
HudBay Minerals Inc. 777 (U.) Flin Flon Cu, Zn, Au, Ag
HudBay Minerals Inc. Flin Flon Cu, Zn, Au, Ag Flin Flon Cu, Zn
Graymont Inc. Faulkner (P., Plant) Faulkner Limestone, lime
CertainTeed Gypsum Canada, Inc. Amaranth (P.) Harcus Gypsum
ERCO Worldwide Hargrave (U., Plant) Virden Sodium chlorate
COMPANY MINE SITE ACTIVITY TYPE LOCATION COMMODITY

FACTS & FIGURES 2018 87
PRODUCING MINES IN CANADA, 2017
Saskatchewan
SSR Mining Inc. Santoy (U.) Santoy Lake Au
SSR Mining Inc. Seabee (U., C.) Laonil Lake Au, Ag
Cameco Corporation Cigar Lake (U.) Wollaston Lake U
Cameco Corporation McArthur River (U.) North of Key Lake U
Cameco Corporation Key Lake (C.) North of Highrock Lake U
Potash Corporation of Saskatchewan Inc. Rocanville (U., Plant) Rocanville Potash
The Mosaic Company Esterhazy (K-1 and K-2) (U., Plant) Esterhazy Potash, salt
Compass Minerals Canada Corporation Wynyard (Big Quill) (P., U., Plant) Wynyard Potassium sulphate
Canadian Clay Products Inc. Wilcox (P.) Wilcox Clay, bentonite
The Mosaic Company Belle Plaine (U., Plant) Belle Plaine Potash, salt
Potash Corporation of Saskatchewan Inc. Lanigan (U.) Lanigan Potash
The Mosaic Company Colonsay (U., Plant) Colonsay Potash, salt
Potash Corporation of Saskatchewan Inc. Allan (U., Plant) Allan Potash
Potash Corporation of Saskatchewan Inc. Patience Lake (U., Plant) Blucher Potash
Saskatchewan Mining and Minerals Inc. Chaplin Lake (P., Plant) Chaplin Sodium sulphate
Potash Corporation of Saskatchewan Inc. Cory (U., Plant) Cory Potash
Agrium Inc. Vanscoy (U., Plant) Vanscoy Potash, salt
Compass Minerals Canada Corporation Unity (solution mining) Unity Salt
Westmoreland Coal Company Estevan (P.) Bienfait Coal (thermal)
Westmoreland Coal Company Poplar River (P.) Coronach Coal (thermal)
K+S Potash Canada Bethune (U., Plant) Bethune Potash
Alberta
K+S Windsor Salt Ltd Lindbergh (solution mining) Elk Point Salt
Hammerstone Corporation Steepbank (P.) North of Fort McMurray Limestone
Hammerstone Corporation Muskeg Valley (P.) North of Fort McMurray Limestone
Rio Petro Ltd. Sunnynook (solution mining) Cessford Salt
Suncor Energy Inc. Fort McMurray West (P.) Fort McMurray Limestone
Calcium Incorporated Calling Lake (solution mining) Calling Lake Salt
Tiger Calcium Services Inc. Mitsue (solution mining) Slave Lake Salt
Graymont Inc. Summit (P., Plant) Coleman Limestone, lime
Graymont Inc. Exshaw (Gap) (P., Plant) Exshaw Limestone, lime
Lafarge Canada Inc. Exshaw (P., Plant) Exshaw Limestone
Burnco Rock Products Ltd. Clearwater (P., Plant) Clearwater River Limestone
Lehigh Cement Company Mcleod (P.) Cadomin Limestone
Westmoreland Coal Company Sheerness (P.) Hanna Coal (thermal)
Westmoreland Coal Company Paintearth (P.) Forestburg Coal (thermal)
Westmoreland Coal Company Genesee (P.) Genesee Coal (thermal)
Transalta Corporation Highvale (P.) Seba Beach Coal (thermal)
Westmoreland Coal Company Coal Valley (P.) Edson Coal (thermal)
Teck Resources Limited Cardinal River (Cheviot) (P.) Hinton Coal (metallurgical)
Suncor Energy Inc. Millennium and Steepbank (P.) Fort McMurray Upgraded crude oil
Shell Canada Energy Jackpine (P.) Fort MacKay Upgraded crude oil
Syncrude Canada Ltd. Aurora North and South (P.) Fort MacKay Upgraded crude oil
Syncrude Canada Ltd. Mildred Lake (P.) Fort MacKay Upgraded crude oil
Shell Canada Energy Muskeg River (P.) Fort MacKay Upgraded crude oil
Canadian Natural Resources Ltd. Horizon (P.) Fort MacKay Upgraded crude oil
COMPANY MINE SITE ACTIVITY TYPE LOCATION COMMODITY
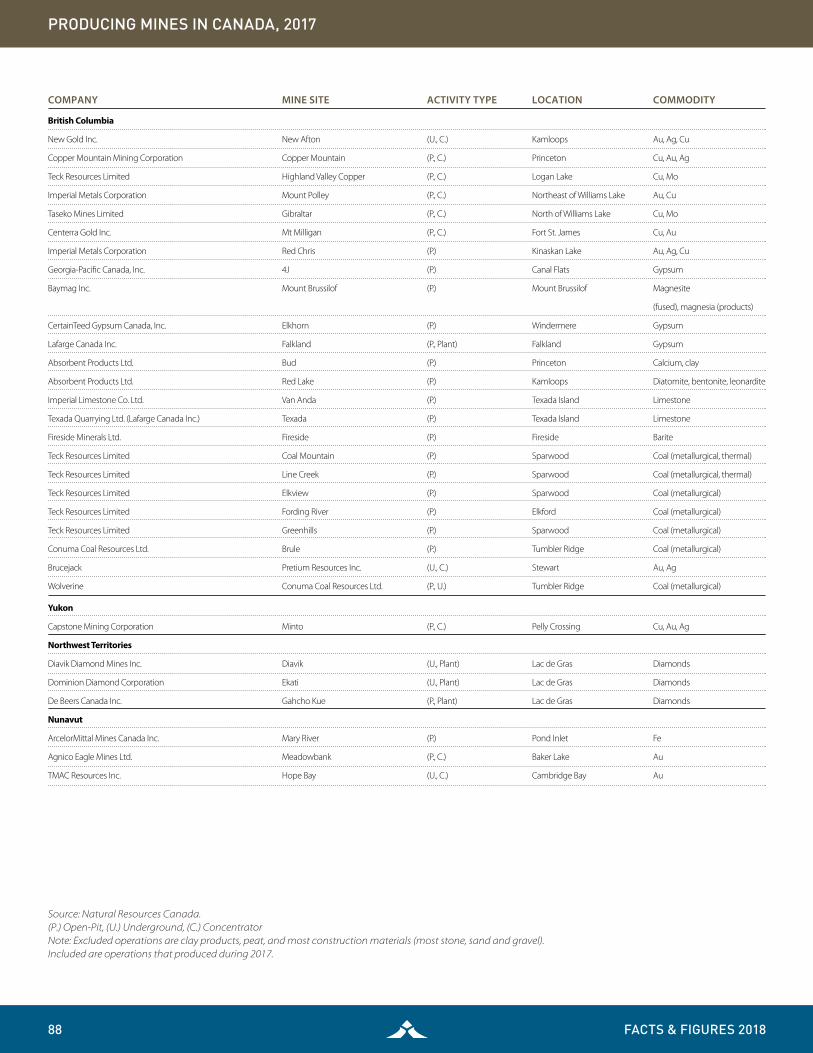
88 FACTS & FIGURES 2018
British Columbia
New Gold Inc. New Afton (U., C.) Kamloops Au, Ag, Cu
Copper Mountain Mining Corporation Copper Mountain (P., C.) Princeton Cu, Au, Ag
Teck Resources Limited Highland Valley Copper (P., C.) Logan Lake Cu, Mo
Imperial Metals Corporation Mount Polley (P., C.) Northeast of Williams Lake Au, Cu
Taseko Mines Limited Gibraltar (P., C.) North of Williams Lake Cu, Mo
Centerra Gold Inc. Mt Milligan (P., C.) Fort St. James Cu, Au
Imperial Metals Corporation Red Chris (P.) Kinaskan Lake Au, Ag, Cu
Georgia-Pacific Canada, Inc. 4J (P.) Canal Flats Gypsum
Baymag Inc. Mount Brussilof (P.) Mount Brussilof Magnesite
(fused), magnesia (products)
CertainTeed Gypsum Canada, Inc. Elkhorn (P.) Windermere Gypsum
Lafarge Canada Inc. Falkland (P., Plant) Falkland Gypsum
Absorbent Products Ltd. Bud (P.) Princeton Calcium, clay
Absorbent Products Ltd. Red Lake (P.) Kamloops Diatomite, bentonite, leonardite
Imperial Limestone Co. Ltd. Van Anda (P.) Texada Island Limestone
Texada Quarrying Ltd. (Lafarge Canada Inc.) Texada (P.) Texada Island Limestone
Fireside Minerals Ltd. Fireside (P.) Fireside Barite
Teck Resources Limited Coal Mountain (P.) Sparwood Coal (metallurgical, thermal)
Teck Resources Limited Line Creek (P.) Sparwood Coal (metallurgical, thermal)
Teck Resources Limited Elkview (P.) Sparwood Coal (metallurgical)
Teck Resources Limited Fording River (P.) Elkford Coal (metallurgical)
Teck Resources Limited Greenhills (P.) Sparwood Coal (metallurgical)
Conuma Coal Resources Ltd. Brule (P.) Tumbler Ridge Coal (metallurgical)
Brucejack Pretium Resources Inc. (U., C.) Stewart Au, Ag
Wolverine Conuma Coal Resources Ltd. (P., U.) Tumbler Ridge Coal (metallurgical)
COMPANY MINE SITE ACTIVITY TYPE LOCATION COMMODITY
PRODUCING MINES IN CANADA, 2017
Source: Natural Resources Canada.(P.) Open-Pit, (U.) Underground, (C.) ConcentratorNote: Excluded operations are clay products, peat, and most construction materials (most stone, sand and gravel).Included are operations that produced during 2017.
Yukon
Capstone Mining Corporation Minto (P., C.) Pelly Crossing Cu, Au, Ag
Northwest Territories
Diavik Diamond Mines Inc. Diavik (U., Plant) Lac de Gras Diamonds
Dominion Diamond Corporation Ekati (U., Plant) Lac de Gras Diamonds
De Beers Canada Inc. Gahcho Kue (P., Plant) Lac de Gras Diamonds
Nunavut
ArcelorMittal Mines Canada Inc. Mary River (P.) Pond Inlet Fe
Agnico Eagle Mines Ltd. Meadowbank (P., C.) Baker Lake Au
TMAC Resources Inc. Hope Bay (U., C.) Cambridge Bay Au

FACTS & FIGURES 2018 89
TITLE
Metals
Iron Ore 1 - - - 1 - - - - - - - 1 3
Gold & Silver Ore 1 - - - 14 12 - 1 - - - - 1 29
Lead-zinc Ore - - - 1 - - - - - - - - - 1
Nickel-copper Ore 1 - - - 2 3 1 - - - - - - 7
Copper, copper-zinc Ore 1 - - - 2 1 1 - - 8 1 - - 14
Uranium - - - - - - - 5 - - - - - 5
Other Metals - - - - 2 1 1 - - - - - - 4
TOTAL METALS 4 - - 1 21 17 3 6 - 8 1 - 2 63
Non-metals
Diamonds - - - - 1 1 - - - - - 4 - 6
Gypsum - - - 1 - - - - - 1 - - - 2
Peat 1 1 1 22 24 - 5 1 6 1 - - - 62
Potash - - - 1 - - - 9 - - - - - 10
Salt - - 2 - 1 4 - 3 1 - - - - 11
Sand and gravel 1 1 6 12 72 257 14 58 214 85 1 - - 721
Stone 2 - 18 9 94 113 8 - 24 25 - - - 293
Shale, Clay and other refractory minerals - - 1 - 4 2 - 1 1 2 - - - 11
Other nonmetals - - - - 3 2 - 1 - 3 1 - - 10
TOTAL NON-METALS 4 2 28 45 199 379 27 73 246 117 2 4 - 1126
NL PE NS NB QC ON MB SK AB BC YT NT NV TOTAL
Sources: Natural Resources Canada; Statistics Canada. - Nil
Return to text
ANNEX 2MINING ESTABLISHMENTS IN CANADA, BY MINERAL, PROVINCE OR TERRITORY, 2016

90 FACTS & FIGURES 2018
TITLE
Sources: Natural Resources Canada; Statistics Canada. P Preliminary; - Nil; x Confidential. 1Excludes shipments to Canadian potassium sulphate plants. 2Mineral production of sand and gravel for Nunavut is included in totals for the Northwest Territories.Note: As of reference year 2017, Statistics Canada has ceased the collection of cement data.
Return to text
ANNEX 3CANADIAN PRODUCTION OF LEADING MINERALS BY PROVINCE AND TERRITORY, 2017P
GOLD COAL COPPER POTASH (K2O)1 IRON ORE
KILOGRAMS $000 KILOTONNES $000 TONNES $000 KILOTONNES $000 KILOTONNES $000
Newfoundland 664 35,141 - - 36,696 293,495 - - 21,432 1,732,828
Prince Edward Island - - - - - - - - - -
Nova Scotia - - x x - - - - - -
New Brunswick - - - - - - - - - -
Quebec 56,073 2,965,543 - - 35,797 286,305 - - 24,930 1,831,021
Ontario 72,863 3,853,526 - - 168,884 1,350,736 - - - -
Manitoba 4,477 236,755 - - 38,337 306,621 - - - -
Saskatchewan 2,562 135,489 x x - - 12,214 4,570,601 - -
Alberta 32 1,666 x x - - - - - -
British Columbia 13,355 706,298 x x 287,812 2,301,922 - - - -
Yukon 3,055 161,547 - - 16,306 130,417 - - - -
Northwest Territories - - - - - - - - - -
Nunavut 11,232 594,035 - - - - - - 2,647 249,771
Canada 164,313 8,690,001 59,893 6,238,177 583,833 4,669,497 12,214 4,570,601 49,009 3,813,620
NICKEL DIAMONDS SAND AND GRAVEL2 STONE ZINC
TONNES $000 000 CARATS $000 KILOTONNES $000 KILOTONNES $000 TONNES $000
Newfoundland 51,479 690,746 - - 1,692 7,289 7,526 63,660 - -
Prince Edward Island - - - - 116 1,624 x x - -
Nova Scotia - - - - 3,449 29,799 9,028 99,962 - -
New Brunswick - - - - 2,295 12,414 7,254 57,683 33,921 127,339
Quebec 48,102 645,435 1,524 169,161 16,129 96,351 42,449 491,446 88,542 332,385
Ontario 79,375 1,065,055 700 389,837 89,454 608,708 68,874 700,297 70,180 263,456
Manitoba 21,834 292,974 - - 15,041 137,440 6,785 61,550 124,118 465,937
Saskatchewan - - - - 11,024 98,263 - - - -
Alberta - - - - 119,040 1,240,638 4,685 54,282 - -
British Columbia - - - - 31,418 298,835 7,755 67,878 - -
Yukon - - - - 709 2,937 x x - -
Northwest Territories - - 20,500 2,059,633 246 4,624 843 5,900 - -
Nunavut - - - - - - - - - -
Canada 200,791 2,694,210 22,724 2,618,631 290,613 2,538,920 155,254 1,603,511 316,760 1,189,117

FACTS & FIGURES 2018 91
TITLE
RANK OF FIVE LEADING COUNTRIES
WORLD 1 2 3 4 5
Return to text
Canada Russia Belarus China Germany
Potash (K2O equivalent) (mine production) 000 t 42,000 12,000 7,200 6,400 6,200 2,900
% of world total 28.6 17.1 15.2 14.8 6.9
Kazakhstan Canada Australia Namibia Niger
Uranium (metal content) (2015) t 62,366 24,575 14,039 6,315 3,654 3,479
(mine production) % of world total 39.4 22.5 10.1 5.9 5.6
Brazil Canada
Niobium (mine production) t 64,000 57,000 6,o00
% of world total 89.1 9.4
Russia Botswana Canada Angola South Africa
Gemstones 000 t 73,000 23,500 14,000 13,000 8,100 6,700
% of world total 31.5 19.2 17.8 11.1 9.2
Indonesia Philippines Canada New Caledonia Australia
Nickel (mine production) 000 t 2,100 400 230 210 210 190
% of world total 19.0 11.0 10.0 10.0 9.0
South Africa Russia Canada Zimbabwe United States
Platinum group metals (metal content) kg 410,000 218,000 102,000 31,000 27,000 16,900
% of world total 53.2 24.9 7.6 6.6 4.1
Congo Russia Australia Canada Cuba
Cobalt (mine production)2 t 110,000 64,000 5,600 7,300 4,300 4,200
% of world total 58.2 5.1 6.6 3.9 3.8
China Russia Canada India UAE
Aluminum (primary metal) 000 t 60,000 32,600 3,600 3,210 3,200 2,600
% of world total 54.3 6.0 5.4 5.3 4.3
China South Korea Canada Japan Begium
Indium 000 t 720 310 215 70 70 20
% of world total 43.1 29.9 9.7 9.7 .8
ANNEX 4CANADA’S WORLD ROLE AS A PRODUCER OF CERTAIN IMPORTANT MINERALS, 2017P

92 FACTS & FIGURES 2018
TITLECANADA’S WORLD ROLE AS A PRODUCER OF CERTAIN IMPORTANT MINERALS, 2017P
RANK OF FIVE LEADING COUNTRIES
WORLD 1 2 3 4 5
China United States Russia Canada UAE
Sulphur, elemental (mine production) 000 t 83,000 17,800 9,660 7,000 5,300 5,300
% of world total 21.4 11.6 8.4 6.4 6.4
Canada third, by value Russia D.R.C Botswana Australia Canada
Diamonds (precious) (2015) 000 carats 134,071 40,322 23,207 20,501 13,958 13,036
% of world total 30.1 17.3 15.3 10.4 9.7
South Africa China Australia Mozambique Canada
Titanium concentrate (Ilmenite) 000 t 5,860 1,300 800 720 490 475
% of world total 22.2 13.7 12.3 8.4 8.1
South Africa Australia china Mozambique Canada
Gold (mine production) t 6,200 1,300 900 800 550 475
% of world total 21.0 14.5 12.9 8.9 7.7
China South Korea Japan Canada Kazakhstan
Cadmium (metal) t 23,000 8,200 3,600 2,200 1,700 1,500
% of world total 35.7 15.7 9.6 7.4 6.5
China India Brazil Canada Mozambique
Graphite 000 t 1,200 780 150 95 30 23
% of world total 65.0 12.5 7.9 2.5 1.9
Finland Turkey United States China Canada
Mica (natural) 000 t 1,130,000 65,000 40,000 31,700 25,000 22,000
% of world total 5.8 3.5 2.8 2.2 1.9
Canada sixth Finland Ireland Germany Sweden Belarus
Peat 000 t 26,200 7,500 4,300 3,400 2,100 1,500
% of world total 28.6 16.4 13.0 8.0 5.7
Canada tenth Chile Peru China United States Australia
Copper (mine production) 000 t 19,700 5,330 2,390 1,860 1,270 920
% of world total 27.1 12.1 9.4 6.4 4.7
Canada eighth Australia Brazil China India Russia
Iron ore (mine production) (usable ore) 000 t 2,400 880 440 340 190 100
% of world total 36.7 18.3 14.2 7.9 4.2
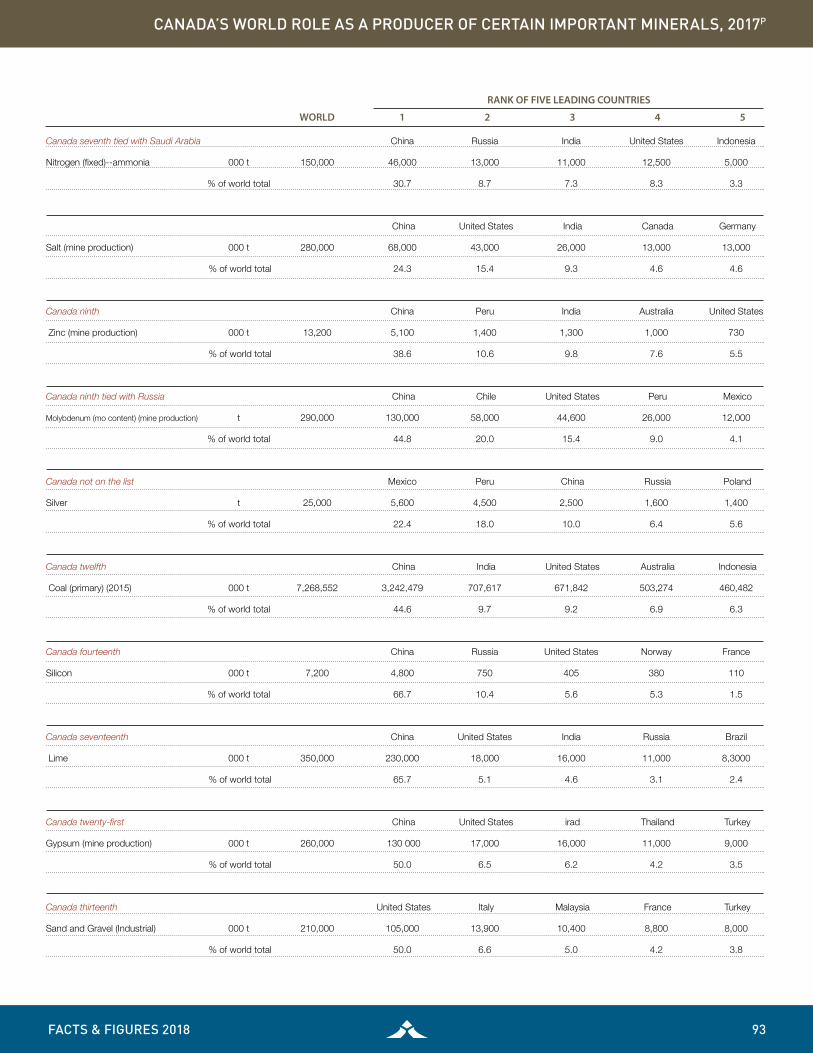
FACTS & FIGURES 2018 93
TITLECANADA’S WORLD ROLE AS A PRODUCER OF CERTAIN IMPORTANT MINERALS, 2017P
Canada seventh tied with Saudi Arabia China Russia India United States Indonesia
Nitrogen (fixed)--ammonia 000 t 150,000 46,000 13,000 11,000 12,500 5,000
% of world total 30.7 8.7 7.3 8.3 3.3
China United States India Canada Germany
Salt (mine production) 000 t 280,000 68,000 43,000 26,000 13,000 13,000
% of world total 24.3 15.4 9.3 4.6 4.6
Canada ninth China Peru India Australia United States
Zinc (mine production) 000 t 13,200 5,100 1,400 1,300 1,000 730
% of world total 38.6 10.6 9.8 7.6 5.5
Canada ninth tied with Russia China Chile United States Peru Mexico
Molybdenum (mo content) (mine production) t 290,000 130,000 58,000 44,600 26,000 12,000
% of world total 44.8 20.0 15.4 9.0 4.1
Canada not on the list Mexico Peru China Russia Poland
Silver t 25,000 5,600 4,500 2,500 1,600 1,400
% of world total 22.4 18.0 10.0 6.4 5.6
Canada twelfth China India United States Australia Indonesia
Coal (primary) (2015) 000 t 7,268,552 3,242,479 707,617 671,842 503,274 460,482
% of world total 44.6 9.7 9.2 6.9 6.3
Canada fourteenth China Russia United States Norway France
Silicon 000 t 7,200 4,800 750 405 380 110
% of world total 66.7 10.4 5.6 5.3 1.5
Canada seventeenth China United States India Russia Brazil
Lime 000 t 350,000 230,000 18,000 16,000 11,000 8,3000
% of world total 65.7 5.1 4.6 3.1 2.4
Canada twenty-first China United States irad Thailand Turkey
Gypsum (mine production) 000 t 260,000 130 000 17,000 16,000 11,000 9,000
% of world total 50.0 6.5 6.2 4.2 3.5
Canada thirteenth United States Italy Malaysia France Turkey
Sand and Gravel (Industrial) 000 t 210,000 105,000 13,900 10,400 8,800 8,000
% of world total 50.0 6.6 5.0 4.2 3.8
RANK OF FIVE LEADING COUNTRIES
WORLD 1 2 3 4 5

94 FACTS & FIGURES 2018
TITLECANADA’S WORLD ROLE AS A PRODUCER OF CERTAIN IMPORTANT MINERALS, 2017P
RANK OF FIVE LEADING COUNTRIES
WORLD 1 2 3 4 5
Sources: U.S. Geological Survey (USGS); International Energy Association; Kimberley Process. n.a. Not applicable.
China Vietnam Russia Bolivia Austria
Tungsten (mine production) t 95,000 79,000 7,200 3,100 1,100 950
% of world total 83.2 7.6 3.3 1.2 1.0
Canada not on the list China Australia United States Peru Russia
Lead (mine production) 000 t 4,700 2,400 450 313 300 250
% of world total 51.1 9.6 6.7 6.4 5.3

FACTS & FIGURES 2018 95
TITLE
METALLIC MINERALS 2010 2011 2012 2013 2014 2015 2016 2017P
Unit (quantity) ($000) (quantity) ($000) (quantity) ($000) (quantity) ($000) (quantity) ($000) (quantity) ($000) (quantity) ($000) (quantity) ($000)
Antimony t x x x x x x 148 1,562 4 45 1 5 0 3 0 3
Bismuth t 91 1,759 136 3,346 110 2,370 103 2,006 4 97 2 29 2 31 2 33
Cadmium t 2,403 9,644 1,516 4,135 247 500 160 316 129 276 68 102 60 113 59 129
Cesium t x x x x x x x x x x x x x x x x
Cobalt t 2,644 125,144 3,741 146,768 3,698 114,604 4,005 118,114 3,907 137,844 4,339 156,720 4,216 149,145 3,866 276,995
Copper t 507,883 3,941,677 553,725 4,831,801 560,476 4,453,541 620,989 4,695,298 654,468 4,983,772 697,322 4,905,661 679,524 4,379,532 583,833 4,669,497
Gold kg 102,147 4,143,067 101,975 5,087,438 106,373 5,704,878 131,404 6,141,048 151,472 6,817,154 160,751 7,667,339 161,497 8,590,179 164,313 8,690,001
Ilmenite 000 t x x x x x x x x x x x x x x x x
Indium kg x x x x x x x x x x x x x x x x
Iron Ore 000 t 36,178 5,314,154 35,705 5,505,772 38,892 4,875,068 42,063 5,348,433 43,173 4,173,516 46,220 2,854,585 46,731 3,165,022 49,009 3,813,620
Iron, remelt 000 t x x x x x x x x x x x x x x x x
Lead t 62,397 138,022 62,548 166,003 62,014 127,438 22,895 50,506 3,579 8,288 3,699 8,485 12,020 29,785 13,137 39,648
Lithium t x x x x x x x x x x - - - - - -
Molybdenum t 8,524 x 8,543 x 8,936 x 7,956 186,788 9,358 259,876 2,505 48,846 2,783 53,105 5,286 106,729
Nickel t 156,270 3,509,833 211,417 4,787,323 203,970 3,546,420 218,026 3,372,864 218,233 4,069,165 225,351 3,408,431 230,210 2,926,428 200,791 2,694,210
Niobium (Columbium)
t 4,298 x 4,551 x 4,705 x 4,916 x 5,774 x 5,385 x 6,099 x 6,981 x
Platinum group
kg 9,864 260,304 22,337 749,572 22,490 644,195 25,465 767,363 31,386 1,058,992 33,248 1,059,512 31,471 947,560 27,278 993,885
Selenium t 97 8,001 128 17,500 145 16,656 138 10,411 142 8,879 156 6,575 175 3,886 49 2,170
Silver t 570 381,086 582 658,514 657 659,005 620 489,872 472 320,274 371 239,656 385 282,666 345 247,502
Tantalum t - - - - - - 40 12,698 - - - - - - - -
Tellurium t 8 1,913 9 3,167 10 1,540 8 895 8 1,066 10 990 18 870 17 763
Tungsten t 364 7,370 2,466 73,707 2,554 88,436 3,017 86,293 2,708 84,331 2,289 62,339 - - - -
Uranium t 9,927 1,230,182 9,017 1,307,174 9,520 1,197,441 7,889 806,418 9,780 933,583 13,279 1,609,476 14,133 1,248,600 9,501 585,040
Zinc t 609,567 1,356,287 591,004 1,281,887 601,514 1,171,147 412,277 811,361 322,605 771,026 275,410 632,892 301,210 832,545 316,760 1,189,117
Total, Metallic Minerals . . 21,358,783 .. 25,569,557 .. 23,558,411 .. 23,497,305 .. 24,225,029 .. 23,125,240 .. 23,302,112 24,032,382
Return to text
ANNEX 5MINERAL PRODUCTION OF CANADA, 2010-2017P

96 FACTS & FIGURES 2018
TITLEMINERAL PRODUCTION OF CANADA, 2010-2017P
NON-METALLIC MINERALS
2010 2011 2012 2013 2014 2015 2016 2017P
Unit (quantity) ($000) (quantity) ($000) (quantity) ($000) (quantity) ($000) (quantity) ($000) (quantity) ($000) (quantity) ($000) (quantity) ($000)
Barite 000 t 21 6,500 x x x x x x x x x x x x x x
Carbonatite 000 t x x x x x x x x x x x x x x x x
Cement¹ 000 t 11,523 1,512,624 11,914 1,587,136 12,553 1,621,476 12,022 1,618,827 12,136 1,692,131 12,334 1,689,851 11,820 1,615,674 .. ..
Chrysotile 000 t x x x x x x x x x x x x x x x x
Clay products²
000 t .. 148,907 .. 135,422 .. 136,502 .. 122,577 .. 118,012 .. 124,446 .. 140,122 .. 151,018
Diamonds 000 ct
11,804 2,377,147 10,752 2,509,232 10,529 2,005,764 10,600 1,964,125 12,012 2,236,043 11,677 2,148,583 13,315 1,888,732 22,724 2,618,631
Gemstones t 35 4,966 42 2,941 178 3,217 554 4,607 6,919 5,991 8,233 7,953 154 5,852 70 4,472
Graphite 000 t x x x x x x x x x x x x x x x x
Gypsum³ 000 t 3,046 47,771 2,449 34,632 1,832 24,987 1,837 25,872 1,793 25,474 1,726 19,675 1,679 17,655 2,738 39,323
Lime 000 t 1,863 288,787 1,937 294,909 1,965 316,322 1,856 308,127 1,995 344,816 1,852 335,489 1,807 330,366 1,827 300,615
Magnesite 000 t x x x x x x x x x x x x x x x x
Marl 000 t x x - - - - - - - - - - - - - -
Mica 000 t x x x x x x x x x x x x x x x x
Nepheline syenite
000 t 603 57,304 602 58,377 586 61,892 646 72,911 654 83,805 614 97,880 571 81,219 625 59,963
Peat 000 t 1,286 260,664 1,139 213,359 1,277 238,018 1,173 213,798 1,178 249,078 1,297 257,030 1,452 330,653 1,671 343,111
Phosphate 000 t x x x x x x x x - - - - - - - -
Potash (K2O)4 000 t 9,700 5,061,927 10,686 7,569,282 8,976 6,342,562 10,196 5,768,609 10,818 5,581,264 11,462 6,132,751 10,790 3,735,632 12,214 4,570,601
Potassium sulphate
000 t x x x x x x x x x x x x x x x x
Pumice 000 t x x x x x x x x x x x x 5 273 x x
Quartz (silica)³
000 t 1,503 66,372 1,620 84,280 1,517 85,256 2,331 80,064 2,011 90,441 2,053 107,377 2,256 95,614 2,515 117,988
Salt 000 t 10,278 602,607 12,757 697,404 10,820 487,686 12,244 655,848 14,473 752,321 14,343 791,980 10,252 445,891 11,250 458,306
Sand and gravel
000 t 211,342 1,573,968 222,288 1,560,213 239,307 1,822,978 241,113 1,941,867 223,407 1,831,464 228,030 1,884,531 280,550 2,398,633 290,613 2,538,920
Soapstone, talc, pyrophyllite
000 t 100 26,125 116 25,244 130 30,249 175 34,223 90 38,985 175 50,335 199 55,513 225 53,908
Sodium sulphate
000 t x x x x x x x x x x x x x x x x
Stone³ 000 t 170,664 1,637,757 161,729 1,591,511 152,977 1,559,358 147,746 1,509,427 147,739 1,541,321 158,034 1,687,916 160,016 1,664,188 155,254 1,603,511
Sulphur, elemental
000 t 6,247 298,990 5,970 637,250 5,594 581,611 5,624 342,937 5,252 326,335 5,187 423,452 4,746 193,877 4,930 175,961
Sulphur, in smelter gas
000 t 610 70,903 638 116,022 665 132,230 677 129,197 590 100,125 558 114,383 635 110,307 534 74,162
Titanium dioxide
000 t x x x x x x x x x x x x x x x x
Tremolite 000 t - - - - - - - - - - - - - - - -
Wollastonite 000 t - - - - - - - - - - - - x x x x
Zeolite 000 t x x x x x x x x - - - - x x 0 0
Total, Nonmetallic Minerals (Including Cement1)
. . 14,699,276 .. 17,839,820 .. 16,471,421 .. 15,476,804 .. 15,778,620 .. 16,519,513 .. 13,724,154 .. ..
Total, Nonmetallic Minerals (Excluding Cement1)
. . 13,186,652 .. 16,252,684 .. 14,849,945 .. 13,857,977 .. 14,086,489 .. 14,829,662 .. 12,108,480 .. 13,633,196
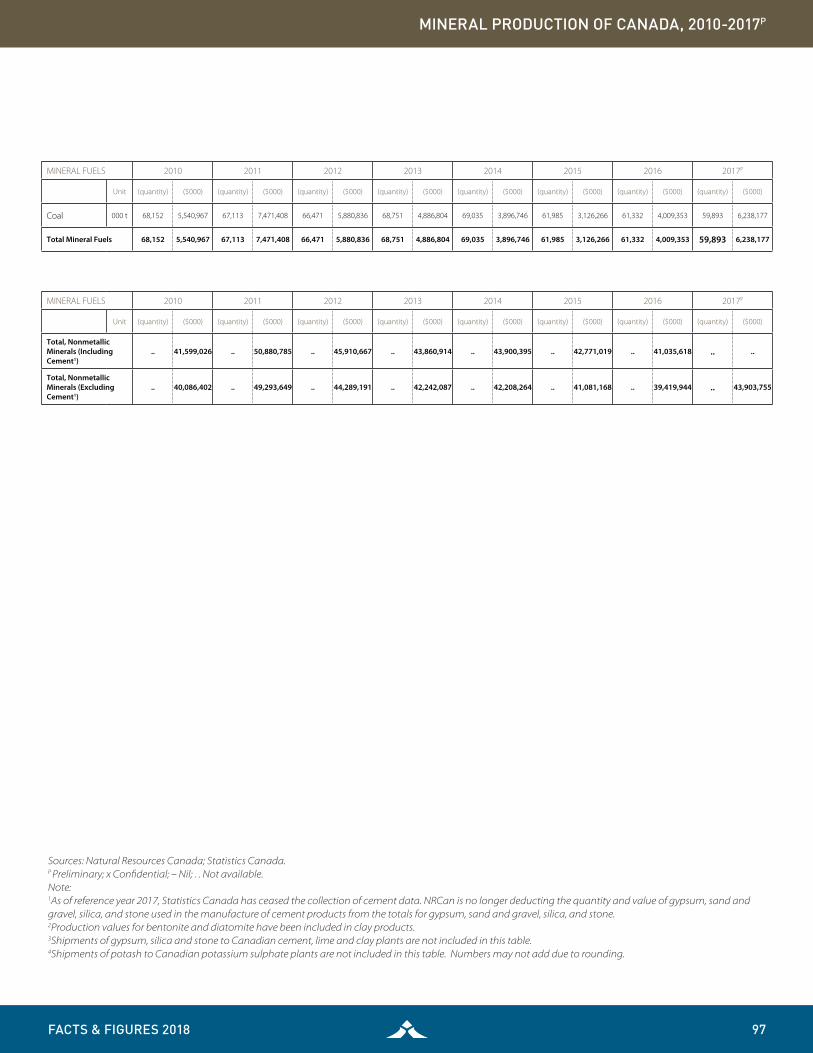
FACTS & FIGURES 2018 97
TITLEMINERAL PRODUCTION OF CANADA, 2010-2017P
Sources: Natural Resources Canada; Statistics Canada.P Preliminary; x Confidential; – Nil; . . Not available.Note: 1As of reference year 2017, Statistics Canada has ceased the collection of cement data. NRCan is no longer deducting the quantity and value of gypsum, sand and gravel, silica, and stone used in the manufacture of cement products from the totals for gypsum, sand and gravel, silica, and stone.2Production values for bentonite and diatomite have been included in clay products.3Shipments of gypsum, silica and stone to Canadian cement, lime and clay plants are not included in this table.4Shipments of potash to Canadian potassium sulphate plants are not included in this table. Numbers may not add due to rounding.
MINERAL FUELS 2010 2011 2012 2013 2014 2015 2016 2017P
Unit (quantity) ($000) (quantity) ($000) (quantity) ($000) (quantity) ($000) (quantity) ($000) (quantity) ($000) (quantity) ($000) (quantity) ($000)
Coal 000 t 68,152 5,540,967 67,113 7,471,408 66,471 5,880,836 68,751 4,886,804 69,035 3,896,746 61,985 3,126,266 61,332 4,009,353 59,893 6,238,177
Total Mineral Fuels 68,152 5,540,967 67,113 7,471,408 66,471 5,880,836 68,751 4,886,804 69,035 3,896,746 61,985 3,126,266 61,332 4,009,353 59,893 6,238,177
MINERAL FUELS 2010 2011 2012 2013 2014 2015 2016 2017P
Unit (quantity) ($000) (quantity) ($000) (quantity) ($000) (quantity) ($000) (quantity) ($000) (quantity) ($000) (quantity) ($000) (quantity) ($000)
Total, Nonmetallic Minerals (Including Cement1)
.. 41,599,026 .. 50,880,785 .. 45,910,667 .. 43,860,914 .. 43,900,395 .. 42,771,019 .. 41,035,618 .. ..
Total, Nonmetallic Minerals (Excluding Cement1)
.. 40,086,402 .. 49,293,649 .. 44,289,191 .. 42,242,087 .. 42,208,264 .. 41,081,168 .. 39,419,944 .. 43,903,755

98 FACTS & FIGURES 2018
TITLE
Source: Natural Resources Canada, based on company reports and the Federal-Provincial/Territorial Annual Survey of Mines and Concentrators. 1No allowance is made for losses in milling, smelting and refining. Excludes material classified as “resources.” 2Includes metal in mines where production has been suspended temporarily. 3Excludes metal in placer deposits because reserves data are generally unavailable. rRevised; P Preliminary. Note: One tonne (t) = 1.1023113 short tons = 32 150.746 troy oz.
METAL CONTAINED IN PROVEN AND PROBABLE MINEABLE ORE1 IN OPERATING MINES2 AND DEPOSITS COMMITTED TO PRODUCTION
YearCopper (000 t)
Nickel (000 t)
Lead (000 t)
Zinc (000 t)
Molybdenum (000 t)
Silver (t)
Gold3
(t)
1978 16,184 7,843 8,930 26,721 464 30,995 505
1979 16,721 7,947 8,992 26,581 549 32,124 575
1980 16,714 8,348 9,637 27,742 551 33,804 826
1981 15,511 7,781 9,380 26,833 505 32,092 851
1982 16,889 7,546 9,139 26,216 469 31,204 833
1983 16,214 7,393 9,081 26,313 442 31,425 1,172
1984 15,530 7,191 9,180 26,000 361 30,757 1,208
1985 14,201 7,041 8,503 24,553 331 29,442 1,373
1986 12,918 6,780 7,599 22,936 312 25,914 1,507
1987 12,927 6,562 7,129 21,471 231 25,103 1,705
1988 12,485 6,286 6,811 20,710 208 26,122 1,801
1989 12,082 6,092 6,717 20,479 207 24,393 1,645
1990 11,261 5,776 5,643 17,847 198 20,102 1,542
1991 11,040 5,691 4,957 16,038 186 17,859 1,433
1992 10,755 5,605 4,328 14,584 163 15,974 1,345
1993 9,740 5,409 4,149 14,206 161 15,576 1,333
1994 9,533 5,334 3,861 14,514 148 19,146 1,513
1995 9,250 5,832 3,660 14,712 129 19,073 1,540
1996 9,667 5,623 3,450 13,660 144 18,911 1,724
1997 9,032 5,122 2,344 10,588 149 16,697 1,510
1998 8,402 5,683 1,845 10,159 121 15,738 1,415
1999 7,761 4,983 1,586 10,210 119 15,368 1,326
2000 7,419 4,782 1,315 8,876 97 13,919 1,142
2001 6,666 4,335 970 7,808 95 12,593 1,070
2002 6,774 4,920 872 6,871 82 11,230 1,023
2003 6,037 4,303 749 6,251 78 9,245 1,009
2004 5,546 3,846 667 5,299 80 6,568 787
2005 6,589 3,960 552 5,063 95 6,684 965
2006 6,923 3,940 737 6,055 101 6,873 1,032
2007 7,565 3,778 682 5,984 213 6,588 987
2008 7,456 3,605 636 5,005 222 5,665 947
2009 7,290 3,301 451 4,250 215 6,254 918
2010 10,747 3,074 400 4,133 254 6,916 1,473
2011 10,570 2,936 247 4,812 256 6,954 2,225
2012 10,364 2,617 126 4,163 256 5,598 2,148
2013 11,198 2,673 116 3,532 145 5,212 2,158
2013 10,777 2,682 116 3,532 145 5,013 2,140
2014 10,214 2,287 88 2,972 121 5,498 2,070
2015 9,937 2,725 83 3,009 101 5,345 1,984
2016P 9,101 2,604 40 2,231 98 3,626 1,910
Return to text
ANNEX 6CANADIAN RESERVES OF SELECTED MAJOR METALS, 1978-2016P

FACTS & FIGURES 2018 99
TITLE
Return to text
ANNEX 7EMPLOYMENT COUNT AND ANNUAL COMPENSATION IN THE CANADIAN MINING, SMELTING AND REFINING INDUSTRIES, 2007-2017
Number of Employees Compensation per Job
Metal Mines
2007 27,020 101,875
2008 28,480 108,464
2009 23,955 126,947
2010 25,520 125,829
2011 28,220 123,332
2012 31,005 122,291
2013 32,860 142,937
2014 34,050 142,474
2015 31,355 133,799
2016 31,510 130,906
2017 34,050 130,791
Non-metal Mines
2007 18,970 74,893
2008 20,985 80,468
2009 19,360 81,499
2010 20,825 83,930
2011 21,615 88,192
2012 20,890 91,784
2013 24,620 88,265
2014 29,575 80,301
2015 32,755 77,086
2016 27,685 99,458
2017 29,260 100,092
Coal Mines
2007 4,935 110,541
2008 5,315 114,275
2009 5,515 116,476
2010 6,325 107,232
2011 6,495 121,897
2012 6,525 131,956
2013 8,895 127,662
2014 7,515 127,382
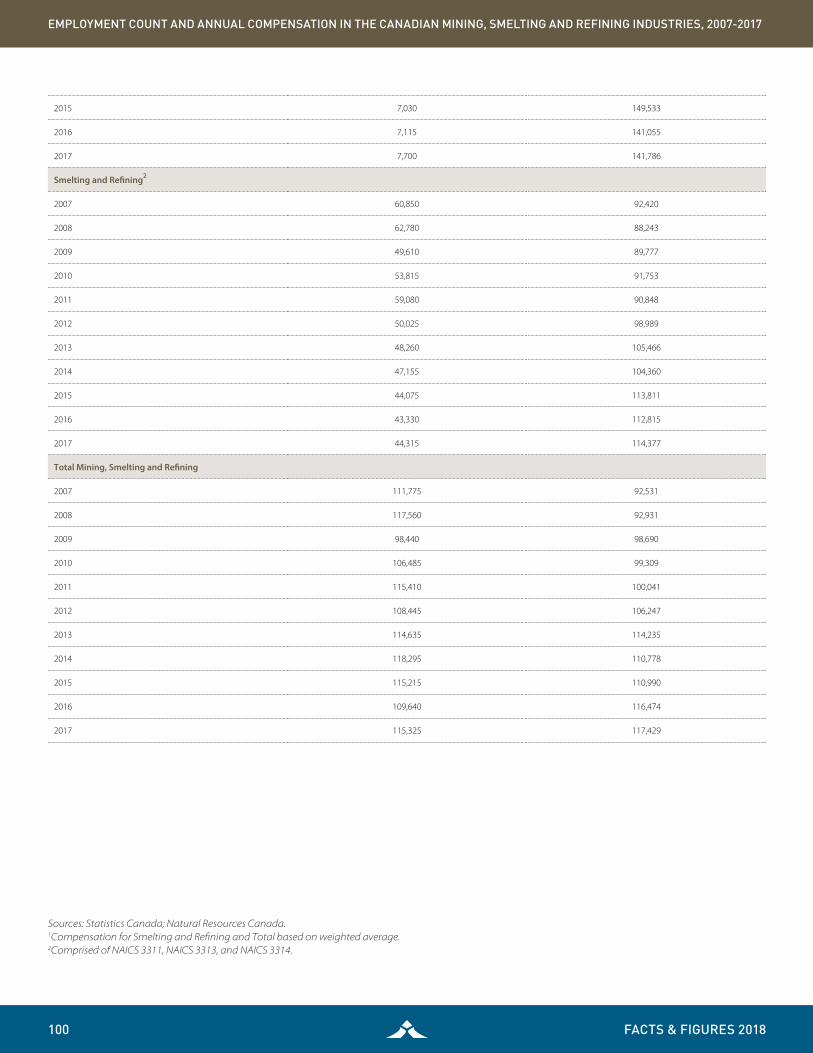
100 FACTS & FIGURES 2018
EMPLOYMENT COUNT AND ANNUAL COMPENSATION IN THE CANADIAN MINING, SMELTING AND REFINING INDUSTRIES, 2007-2017
2015 7,030 149,533
2016 7,115 141,055
2017 7,700 141,786
Smelting and Refining2
2007 60,850 92,420
2008 62,780 88,243
2009 49,610 89,777
2010 53,815 91,753
2011 59,080 90,848
2012 50,025 98,989
2013 48,260 105,466
2014 47,155 104,360
2015 44,075 113,811
2016 43,330 112,815
2017 44,315 114,377
Total Mining, Smelting and Refining
2007 111,775 92,531
2008 117,560 92,931
2009 98,440 98,690
2010 106,485 99,309
2011 115,410 100,041
2012 108,445 106,247
2013 114,635 114,235
2014 118,295 110,778
2015 115,215 110,990
2016 109,640 116,474
2017 115,325 117,429
Sources: Statistics Canada; Natural Resources Canada.1Compensation for Smelting and Refining and Total based on weighted average.2Comprised of NAICS 3311, NAICS 3313, and NAICS 3314.

FACTS & FIGURES 2018 101
TITLE
Return to text
ANNEX 8TOTAL COMPENSATION PER JOB, BY SELECT CANADIAN INDUSTRIAL SECTOR, 2007-2017
Sources: Statistics Canada; Natural Resources Canada. 1Based on a weighted average of NAICS 212, 3311, 3313, and 3314.
Forestry ($) Mining, Smelting and Refining1 ($) Manufacturing ($) Construction ($) Finance and Insurance ($)
2007 64,322 92,531 61,503 65,095 64,929
2008 65,878 92,931 63,121 67,044 63,586
2009 65,009 98,690 62,659 66,816 63,606
2010 66,300 99,309 63,217 67,103 64,045
2011 68,864 100,041 65,081 68,944 65,872
2012 72,926 106,247 67,427 71,252 69,776
2013 78,101 114,235 69,278 67,604 71,031
2014 81,124 110,778 71,582 69,863 74,143
2015 82,419 110,990 74,455 71,931 79,360
2016 82,583 116,474 75,511 71,543 82,405
2017 81,708 117,429 75,260 72,305 88,826

102 FACTS & FIGURES 2018
TITLE
Return to text
ANNEX 9DOMESTIC EXPORTS OF MINERALS AND MINERAL PRODUCTS, BY COMMODITY AND COUNTRY OF DESTINATION, 2017
METALS U.S.A. ($) European Union (EU-28) ($) China ($) Japan ($) Other Countries ($) Total ($)
Aluminum 11,113,575,983 135,302,207 263,821,332 328,633,486 899,982,198 12,741,315,206
Antimony 461,522 428,063 — — 18,781 908,366
Barium — — — — 7,140 7,140
Beryllium 117,989 — — — — 117,989
Bismuth 364,268 3,657 — 88,988 15,503 472,416
Cadmium 266,008 1,827,233 1,967,097 180,070 440,805 4,681,213
Calcium metals 1,544,454 1 130 903 321,985 1,867,473
Chromium 12,055,677 7,840 — — 132,479 12,195,996
Cobalt 97,175,456 63,928,693 4,750,223 191,615,467 207,901,193 565,371,032
Copper 3,849,733,688 821,758,184 936,130,873 766,237,440 847,076,426 7,220,936,611
Gold 4,021,877,346 12,551,150,429 455,062,793 110,631,838 1,479,813,727 18,618,536,133
Iron and steel 12,959,444,484 224,198,908 166,589,978 15,538,917 1,552,474,323 14,918,246,610
Iron ore 126,786,176 2,180,303,235 553,505,576 609,759,833 1,090,920,628 4,561,275,448
Lead 827,094,584 9,735,170 12,300,624 2,985,756 31,852,962 883,969,096
Lithium 30,556 894,221 5,940,772 — — 6,865,549
Magnesium and magnesium compounds 45,320,336 71,977 196,800 2,630 444,751 46,036,494
Manganese 1,002,473 25,775 102,907 — 662,165 1,793,320
Mercury 638,548 90,734 40 — 3,532 732,854
Molybdenum 71,837,841 53,685,637 — 14,767 9,614,051 135,152,296
Nickel 956,068,245 1,073,566,440 383,262,754 173,830,715 1,189,524,376 3,776,252,530
Niobium 99,308,687 75,036,473 55,498,096 2,868,594 37,990,084 270,701,934
Platinum group metals 527,957,071 134,888,243 5,463,820 9,893,966 135,058,756 813,261,856
Rare earth metals 135,795 4,329 — — 44,819 184,943
Selenium 1,323,436 337,967 8,122,008 — 2,444,436 12,227,847
Silicon 161,519,346 519,254 409,829 31,001 17,933,852 180,413,282
Silver 969,575,133 31,844,924 8,709,447 14,681,524 17,682,244 1,042,493,272
Tantalum 2,763,107 75,941 — 2,218 104,790 2,946,056
Tellurium — — — — — —
Tin 39,505,753 1,622,459 33,862 — 1,828,846 42,990,920
Titanium metal 43,216,916 36,302,581 2,123,677 1,924,668 11,756,351 95,324,193
Tungsten 14,979,571 5,451,401 785,423 43,243 960,572 22,220,210
Uranium and thorium 1,137,018,063 293,672,864 23,622,131 10,889,296 165,350,921 1,630,553,275
Vanadium 136,284,977 301,984,281 45,668,904 26,537,599 11,417,543 521,893,304
Zinc 1,806,238,146 11,382,514 58,474,969 411,847 186,845,674 2,063,353,150
Zirconium 1,037,575 4,774,555 6,579,921 79,618 338,612 12,810,281
Other metals 4,111,110,413 758,832,685 64,962,685 76,945,676 915,800,169 5,927,651,628
Grand Total 43,137,369,623 18,773,708,875 3,064,086,671 2,343,830,060 8,816,764,694 76,135,759,923
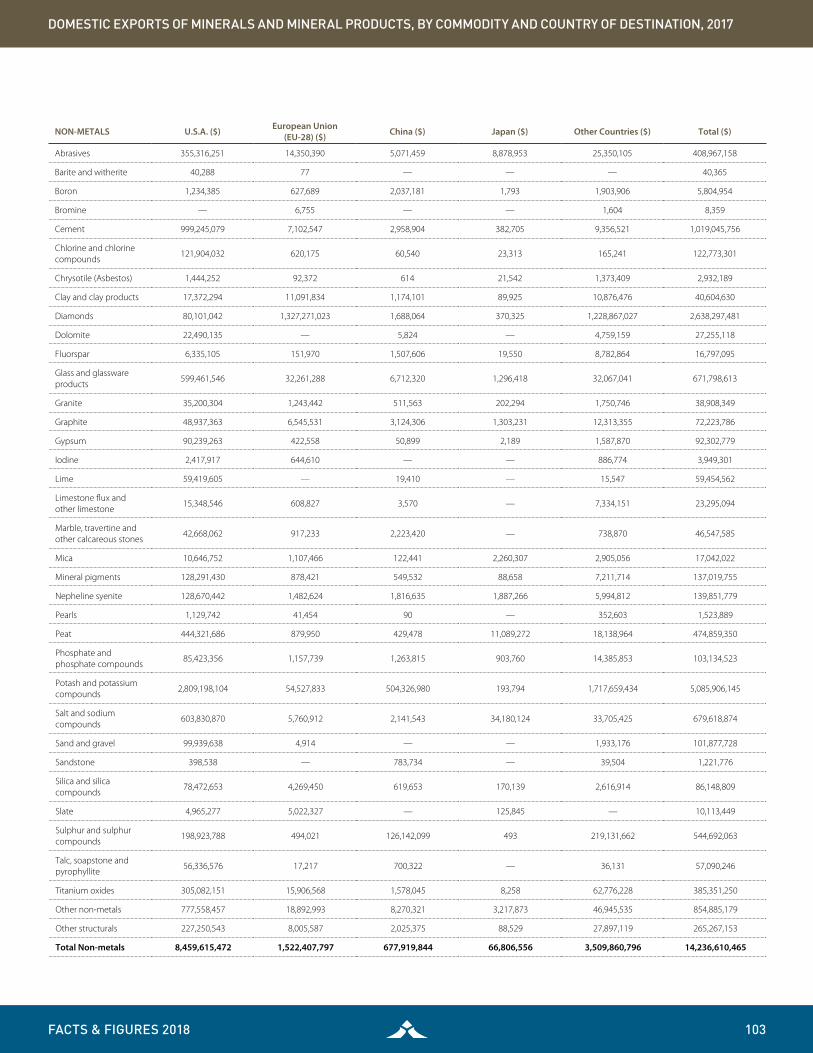
FACTS & FIGURES 2018 103
DOMESTIC EXPORTS OF MINERALS AND MINERAL PRODUCTS, BY COMMODITY AND COUNTRY OF DESTINATION, 2017
NON-METALS U.S.A. ($) European Union (EU-28) ($) China ($) Japan ($) Other Countries ($) Total ($)
Abrasives 355,316,251 14,350,390 5,071,459 8,878,953 25,350,105 408,967,158
Barite and witherite 40,288 77 — — — 40,365
Boron 1,234,385 627,689 2,037,181 1,793 1,903,906 5,804,954
Bromine — 6,755 — — 1,604 8,359
Cement 999,245,079 7,102,547 2,958,904 382,705 9,356,521 1,019,045,756
Chlorine and chlorine compounds
121,904,032 620,175 60,540 23,313 165,241 122,773,301
Chrysotile (Asbestos) 1,444,252 92,372 614 21,542 1,373,409 2,932,189
Clay and clay products 17,372,294 11,091,834 1,174,101 89,925 10,876,476 40,604,630
Diamonds 80,101,042 1,327,271,023 1,688,064 370,325 1,228,867,027 2,638,297,481
Dolomite 22,490,135 — 5,824 — 4,759,159 27,255,118
Fluorspar 6,335,105 151,970 1,507,606 19,550 8,782,864 16,797,095
Glass and glassware products
599,461,546 32,261,288 6,712,320 1,296,418 32,067,041 671,798,613
Granite 35,200,304 1,243,442 511,563 202,294 1,750,746 38,908,349
Graphite 48,937,363 6,545,531 3,124,306 1,303,231 12,313,355 72,223,786
Gypsum 90,239,263 422,558 50,899 2,189 1,587,870 92,302,779
Iodine 2,417,917 644,610 — — 886,774 3,949,301
Lime 59,419,605 — 19,410 — 15,547 59,454,562
Limestone flux and other limestone
15,348,546 608,827 3,570 — 7,334,151 23,295,094
Marble, travertine and other calcareous stones
42,668,062 917,233 2,223,420 — 738,870 46,547,585
Mica 10,646,752 1,107,466 122,441 2,260,307 2,905,056 17,042,022
Mineral pigments 128,291,430 878,421 549,532 88,658 7,211,714 137,019,755
Nepheline syenite 128,670,442 1,482,624 1,816,635 1,887,266 5,994,812 139,851,779
Pearls 1,129,742 41,454 90 — 352,603 1,523,889
Peat 444,321,686 879,950 429,478 11,089,272 18,138,964 474,859,350
Phosphate and phosphate compounds
85,423,356 1,157,739 1,263,815 903,760 14,385,853 103,134,523
Potash and potassium compounds
2,809,198,104 54,527,833 504,326,980 193,794 1,717,659,434 5,085,906,145
Salt and sodium compounds
603,830,870 5,760,912 2,141,543 34,180,124 33,705,425 679,618,874
Sand and gravel 99,939,638 4,914 — — 1,933,176 101,877,728
Sandstone 398,538 — 783,734 — 39,504 1,221,776
Silica and silica compounds
78,472,653 4,269,450 619,653 170,139 2,616,914 86,148,809
Slate 4,965,277 5,022,327 — 125,845 — 10,113,449
Sulphur and sulphur compounds
198,923,788 494,021 126,142,099 493 219,131,662 544,692,063
Talc, soapstone and pyrophyllite
56,336,576 17,217 700,322 — 36,131 57,090,246
Titanium oxides 305,082,151 15,906,568 1,578,045 8,258 62,776,228 385,351,250
Other non-metals 777,558,457 18,892,993 8,270,321 3,217,873 46,945,535 854,885,179
Other structurals 227,250,543 8,005,587 2,025,375 88,529 27,897,119 265,267,153
Total Non-metals 8,459,615,472 1,522,407,797 677,919,844 66,806,556 3,509,860,796 14,236,610,465

104 FACTS & FIGURES 2018
DOMESTIC EXPORTS OF MINERALS AND MINERAL PRODUCTS, BY COMMODITY AND COUNTRY OF DESTINATION, 2017
MINERAL FUELS U.S.A. ($) European Union (EU-28) ($) China ($) Japan ($) Other Countries ($) Total ($)
Coal 480,913,200 871,310,430 932,475,797 1,693,925,269 3,113,984,444 7,092,609,140
Coke 721,058 122 — — 789,795 1,510,975
Total Mineral Fuels 481,634,258 871,310,552 932,475,797 1,693,925,269 3,114,774,239 7,094,120,115
Total Mining Domestic Exports 52,078,619,353 21,167,427,224 4,674,482,312 4,104,561,885 15,441,399,729 97,466,490,503
Sources: Natural Resouces Canada; Statistics Canada. - Nil.Note: Stages 1 to 4

FACTS & FIGURES 2018 105
TITLE
METALS U.S.A. European Union (EU-28) China Mexico Other Countries Total
Aluminum 3,485,223,421 319,750,387 694,066,216 35,959,924 2,555,539,507 7,090,539,455
Antimony 1,647,182 617,653 17,216,204 76,741 1,557,666 21,115,446
Barium 5,592,979 820,098 1,220,296 — 54,185 7,687,558
Beryllium 874,690 4,272 81,128 191,646 16 1,151,752
Bismuth 562,061 95,548 1,067,684 92,989 91,302 1,909,584
Cadmium 3,256,580 3,756,266 15,117,088 2,011 37,079,668 59,211,613
Calcium metals 45,996,354 6,707,375 1,083,405 59,088 2,148,229 55,994,451
Chromium 7,891,369 7,660,775 5,518,785 438,511 95,698,236 117,207,676
Cobalt 39,139,717 16,428,021 279,227 229 35,523,472 91,370,666
Copper 1,827,064,570 230,945,010 167,962,502 128,647,406 1,299,766,115 3,654,385,603
Gallium — — — — — —
Germanium 8,844,316 177,244 333,895 249 4,146,870 13,502,574
Gold 1,571,307,353 24,764,393 2,005,219 170,519,020 7,266,746,289 9,035,342,274
Hafnium — — — — — —
Indium — — — — — —
Iron and steel 13,801,169,463 2,632,232,616 3,455,743,578 1,251,133,635 3,747,547,167 24,887,826,459
Iron ore 715,829,892 3,468,467 8,907 464 10,160,235 729,467,965
Lead 189,290,663 13,776,003 9,482,600 11,190,420 137,575,788 361,315,474
Lithium 128,736,131 9,816,117 18,611,598 241,799 46,519,154 203,924,799
Magnesium and magnesium compounds 58,384,087 13,788,415 205,568,459 1,363,593 27,452,670 306,557,224
Manganese 106,317,711 15,008,908 48,424,696 7,761,433 212,962,840 390,475,588
Mercury 1,043,959 7,123,720 815,926 9,251,555 2,454,114 20,689,274
Molybdenum 48,783,314 9,099,809 2,674,741 4,109,704 26,638,911 91,306,479
Nickel 464,818,440 188,894,922 11,819,203 3,582,763 106,660,230 775,775,558
Niobium 15,469,352 310,830 68,742 — 38,352,793 54,201,717
Platinum group metals 184,550,045 71,987,140 2,468,195 248,523 251,782,740 511,036,643
Rare earth metals 411,820 199,019 2,133,757 — 90,949 2,835,545
Rhenium — — — — — —
Selenium 481,517 492,807 51,789 87,265 681,773 1,795,151
Silicon 10,099,946 953,049 2,982,532 — 52,527,706 66,563,233
Silver 337,522,078 296,997,368 76,988,614 240,509,542 1,054,495,478 2,006,513,080
Strontium 27,522 309,026 — 416,190 115 752,853
Tantalum 1,042,584 103,573 84,566 — 992,907 2,223,630
Tellurium 337,175 490,033 4,390,314 — 3,368,412 8,585,934
Thallium 4,147 — — — — 4,147
Tin 32,205,776 813,311 13,760,267 404,202 42,584,029 89,767,585
Titanium metal 170,365,425 20,543,119 23,458,597 77,669 96,729,721 311,174,531
Tungsten 17,852,547 2,186,441 5,108,935 — 2,914,926 28,062,849
Uranium and thorium 68,689,097 18,348,182 833,015 3 291,536,119 379,406,416
Vanadium 1,337,970 6,896,524 18,954,271 — 32,896,572 60,085,337
Return to text
ANNEX 10TOTAL IMPORTS OF MINERALS AND MINERAL PRODUCTS, BY COMMODITY AND COUNTRY OF IMPORT, 2017

106 FACTS & FIGURES 2018
TOTAL IMPORTS OF MINERALS AND MINERAL PRODUCTS, BY COMMODITY AND COUNTRY OF IMPORT, 2017
Zinc 722,204,459 29,236,783 4,594,474 106,869,368 183,994,389 1,046,899,473
Zirconium 52,495,629 860,270 174,585 — 2,122,203 55,652,687
Other metals 5,943,090,923 1,410,694,504 2,666,494,157 1,640,761,918 2,792,201,891 14,453,243,393
Grand Total 30,069,962,264 5,366,357,998 7,481,648,167 3,613,997,860 20,463,595,387 66,995,561,676
NON-METALS U.S.A. European Union (EU-28) China Mexico Other Countries Total
Abrasives 222,544,958 118,514,602 52,470,084 10,741,618 118,481,474 522,752,736
Arsenic 435 3,949 53,611 — 24,108 82,103
Barite and witherite 6,910,827 422,110 2,757,570 — 21,127,472 31,217,979
Boron 33,062,004 2,437,886 377,705 1 14,332,859 50,210,455
Calcium (Industrial minerals)
— — — — — —
Cement 525,513,255 71,935,322 143,114,186 8,593,412 128,742,198 877,898,373
Chlorine and chlorine compounds
102,932,938 10,172,369 12,858,364 2,238,138 5,775,785 133,977,594
Chrysotile (Asbestos) 134,164,335 8,000,825 10,127,950 593,062 17,390,943 170,277,115
Clay and clay products 321,015,122 316,835,420 548,217,822 69,413,044 197,048,773 1,452,530,181
Diamonds 103,933,873 50,371,785 3,628,507 — 380,650,599 538,584,764
Dolomite 22,625,636 13,163 171,514 — 27,707 22,838,020
Feldspar 1,012,346 374 — — 32,309 1,045,029
Fluorspar 21,550,587 1,572,832 2,274,042 30,618,985 16,518,621 72,535,067
Glass and glassware products
2,397,378,987 313,884,617 726,795,916 282,748,831 207,951,199 3,928,759,550
Granite 15,748,902 18,952,393 30,395,818 67,168 65,944,698 131,108,979
Graphite 127,027,113 122,934,516 222,658,345 12,954,937 45,941,685 531,516,596
Gypsum 183,934,439 7,373,855 631,913 3,620,096 212,141 195,772,444
Iodine 6,582,268 1,560,035 57,812 161 6,341,713 14,541,989
Lime 61,433,936 325,554 37,311 — 25,448 61,822,249
Limestone flux and other limestone
38,148,545 1,078,319 2,277,657 3,373 602,601 42,110,495
Marble, travertine and other calcareous stones
16,414,926 43,687,252 43,622,644 2,382,167 45,760,512 151,867,501
Mica 4,273,428 1,471,205 452,367 1,644 1,875,511 8,074,155
Mineral pigments 161,331,310 46,228,474 9,166,163 1,369,867 19,344,942 237,440,756
Nepheline syenite 450,691 182 — — 32,237 483,110
Olivine 2,897,421 2,906,308 10,491,115 59,009 2,879,186 19,233,039
Pearls 13,211,625 2,991,961 27,976,125 120,467 9,240,013 53,540,191
Peat 12,555,177 2,068,003 235,458 129 4,443,554 19,302,321
Perlite 13,092,588 434 122 — — 13,093,144
Phosphate and phosphate compounds
621,064,272 23,592,447 13,060,866 1,066,774 46,849,780 705,634,139
Potash and potassium compounds
83,839,501 8,597,132 7,442,928 664,654 19,535,530 120,079,745
Salt and sodium compounds
525,606,351 41,436,980 71,625,825 31,421,487 107,349,764 777,440,407
Sand and gravel 21,209,548 155,656 1,582,955 98,962 371,585 23,418,706
Sandstone 1,198,986 97,146 104,496 — 5,096,534 6,497,162

FACTS & FIGURES 2018 107
TOTAL IMPORTS OF MINERALS AND MINERAL PRODUCTS, BY COMMODITY AND COUNTRY OF IMPORT, 2017
Silica and silica compounds
403,366,268 25,286,522 23,803,152 5,196,010 14,534,636 472,186,588
Slate 1,275,907 130,947 4,745,758 5,810 2,177,185 8,335,607
Sulphur and sulphur compounds
28,295,113 543,717 1,103,435 131 305,160 30,247,556
Talc, soapstone and pyrophyllite
15,728,927 1,167,368 133,527 — 141,673 17,171,495
Titanium oxides 205,801,716 16,890,691 35,395,865 21,309,073 16,216,998 295,614,343
Vermiculite — — — — — —
Other non-metals 1,139,179,439 121,038,131 47,713,205 22,576,973 109,006,018 1,439,513,766
Other structurals 120,514,011 27,056,736 54,968,093 2,734,431 40,645,857 245,919,128
Total Non-metals 7,716,827,711 1,411,737,218 2,112,530,226 510,600,414 1,672,979,008 13,424,674,577
MINERAL FUELS U.S.A. European Union (EU-28) China Mexico Other Countries Total
Coal 765,981,855 5,010,409 459,390 269,960 179,694,976 951,416,590
Coke 225,584,318 617,711 562 — 21,007,345 247,209,936
Total Mineral Fuels 991,566,173 5,628,120 459,952 269,960 200,702,321 1,198,626,526
Total Mining Imports 38,778,356,148 6,783,723,336 9,594,638,345 4,124,868,234 22,337,276,716 81,618,862,779
Sources: Natural Resouces Canada; Statistics Canada. - Nil.

108 FACTS & FIGURES 2018
THE CANADIAN MINING INDUSTRY AT A GLANCE
THE CANADIAN MINING INDUSTRY AT A GLANCE
n/a—not available
2005 2007 2009 2013 2014 2015 2016 2017
Mining industry GDP ($ billion) 40.0 41.9 32.0 57 55.6 57.6 97 1 97
Percentage of total Canadian GDP (%) 3.8 3.4 2.7 3.5 3.4 3.4 3.3 3.3
Value of mineral production ($ billion) 27.4 40.6 32.2 44.7 42.8 40.8 43.9 43.9
Synthetic crude production value ($ billion) 9.2 18.0 n/a 35.5 21.5 19.6 25.3 25.3
Synthetic crude production (million cubic metres) 21.9 39.9 n/a 55.3 56.6 54.1 59.7 59.7
Number of mining establishments 859 766 961 1209 n.a 1201 1126 1126
Mineral extraction employment 47,000 53,000 52,000 60,215 60,565 71,380 70,000 70,000
Total direct and indirect mining industry employment 353,000 360,000 308,000 376,000 560,000 596,000 634,000 634,000
Mineral exploration/appraisal spending ($ billion) 1.3 2.8 1.9 1.9 1.7 1.6 2.2 2.2
Mining industry capital expenditures ($ billion) 7.4 10.1 9.8 15.07 15.3 n.a 11.1 11.1
Oil sands capital expenditures ($ billion) 9.8 16.8 10.6 25.1 23.4 n.a 10.2 10.2
Stock of foreign mining direct investment ($ billion) n/a n/a n/a 21.1 10.4 35.5 28.2 28.2
Stock of Canadian mining direct investment abroad ($ billion) 56.4 57.3 64.5 n/a 62.6 90.8 82.7 82.7

FACTS & FIGURES 2018 109
TITLE
WWW.MINING.CA
@theminingstory