Embed Size (px)
Citation preview

2014THE NORWEGIAN PETROLEUM SECTOR
2014

New native apps for Android and Windows Phone are now available
• All the fields • All the wells • All the production • All the operators • All the licenses • News, maps and more
www.oilfacts.no
Cover: The first oil field in the North Sea, the Ekofisk field, started production in 1971. The field has been developed and expanded through-out the years. Old facilities have been removed and new ones installed in order to enable production for another 30–40 years. This picture shows the field as it emerges today, after three new facilities were installed in the summer of 2013 (Photo: Kjetil Alsvik/ConocoPhillips)
PB • FACTS 2014
What do you think about Facts 2014? Please send your comments to [email protected].
2014THE NORWEGIAN PETROLEUM SECTOR

4 • FACTS 2014
Editor:Yngvild Tormodsgard, Ministry of Petroleum and Energy
Design: Artdirector/Klas JønssonPaper: Cover: Galerie art silk 250 g, Inside pages: Arctic silk 115 gGraphic production: 07 MEDIA Printing: 07 MEDIACirculation: 13 500 New Norwegian / 12 000 EnglishPublication number: Y-0103/15 E
Cover: The Ekofisk Field in the North Sea(Photo : Kjetil Alsvik/ConocoPhillips)
ISSN 1504-3398

FACTS 2014 • 54 • FACTS 2014
Tord LienMinister of Petroleum and Energy
2013 was yet another good year in the Norwegian petroleum sector. The activity level is high; the shelf is explored, resources discovered, fields developed and hydrocarbons produced and sold. Norwegian oil and gas is finding its way to customers all over the world. Norwegian petroleum activities have been the dominant domestic industry for decades and have contributed to huge value creation, a substantial number of jobs and wide-ranging effects in local communities. In other words, we have plenty of reasons to be proud. An effective, well-founded regulatory framework stimulates the companies on the shelf to make decisions that maximize the value for the Norwe-gian society. Our service and supply industry is competitive, highly knowledgeable and in the forefront in many areas. We have an envi-ronmentally sound petroleum production, and our reputation as a stable, secure supplier of oil and gas to the markets is strong. Nevertheless, current realities do not allow us to ease our efforts. In order to generate the greatest possible values from our oil and gas resources, we must continue to improve. We must address future challenges in a serious manner. We will do so with a set of clear ground rules and continuous access to new, promising acreage. A predictable regulatory framework, including taxes and fees, contribute to sound resource management and facilitate both improved recovery from existing fields and development of smaller discoveries. The cost level on the Norwegian shelf has increased in recent years. In spite of new acreage and exciting discoveries, sectors of the Norwegian continental shelf are maturing. This puts pressure on the
profitability of both projects and companies. The industry must take action to control these costs. Succeeding with this will be crucial in order to live up to the results from 2013. The objective of our petroleum policy is to generate the greatest possible values from the resources on the Norwegian shelf in the best interest of the Norwegian society. This will require the best efforts of everyone involved. Within a clear regulatory framework, we will work together in a smarter, more efficient and well organ-ised manner. We must develop knowledge, innovation and new technology. Then, and only then, will we be equipped for the future.
Minister of Petroleum and Energy

6 • FACTS 2014

FACTS 2014 • 76 • FACTS 2014
CONTENT Minister’s Introduction 5
1. Norway’s largest industry 9 Norwegian petroleum history 10 Current petroleum activities 12
Significance to the Norwegian economy 12The companies on the shelf 13Production 13Costs 14
2. The Norwegian continental shelf 15 Areas on the Norwegian shelf 16
The southern North Sea 17The central North Sea 18The northern North Sea 19The Norwegian Sea 21The Barents Sea 21
Petroleum resources 22Reserves 23Contingent resources 23Undiscovered resources 23The North Sea 23The Norwegian Sea 23The Barents Sea 24
3. Framework and organisation 27 Legal framework 28 State organisation 29 The State’s revenues from petroleum activities 30
4. The Norwegian Petroleum Industry – from well to market 33
Exploration activity 34Exploration policy in mature and frontier areas 34
Development and operation 38Efficient production of petroleum resources 38Improved recovery in mature areas 39Improved recovery 39Efficient operations 40New discoveries – efficient utilisation of infrastructure 40Decommissioning after production ends 42
The energy market 42Price development 43Oil 43Natural gas 44
Gas exports from the Norwegian shelf 45Organisation of the gas transport system 47Regulated access to the transport system 47
Emissions and discharges from the petroleum activities 47Greenhouse gas emissions 48Other emissions to air 49Operational discharges to sea 50Acute discharges 51
5. The service and supply industry 53Development and employment 54Revenues 54Deliveries throughout the value chain 55International success 56
6. The future petroleum industry 57 R&D in the oil and gas industry 58
PETROMAKS 2 58DEMO 2000 58PETROSENTER - Petroleum research centres 59Other research programmes 59
An industry geared towards the future 59
Appendix 61 Appendix 1: Historical statistics 62 Appendix 2: The petroleum resources 65 Appendix 3: Pipelines and onshore facilities 74 Appendix 4: Conversion factors 77

8 • FACTS 2014

FACTS 2014 • 9PB • FACTS 2014
NORWAy’S LARGEST INdUSTRy
The Troll A platform has its foundation 303 meters below sea level. The natural gas produced at Troll A is sent to Kollsnes in Hordaland County for processing (Photo: Harald Pettersen, Statoil)
1

10 • FACTS 201410 • FACTS 2014
Figure 1.1 Historical timeline. Year of discovery in brackets
The petroleum activities have been key to the emergence of Norway’s current welfare state. Few believed the industry would have such an immense impact on the Norwegian economy when the first pro-duction licences were awarded in the mid-1960s. Fifty years later, the activity level on the Norwegian shelf remains high, and the industry is currently the largest and most important sector of our economy, measured in value creation, State revenues and exports. This chapter will provide an account of the incredible Norwegian petroleum pioneers and what is currently happening on the Norwegian shelf.
Norwegian petroleum history
About 50 years have passed since petroleum activities commen-ced on the Norwegian shelf, and many of the early fields are still producing. The adventure started in the North Sea and has gradu-ally moved north as the knowledge has increased.
At the end of the 1950s, few people imagined that the Norwegian continental shelf concealed a wealth of oil and gas. However, the gas discovery in Groningen in the Netherlands in 1959 led to new-found optimism regarding the North Sea’s petroleum potential. In October 1962, Philips Petroleum sent a letter to the Norwegian authorities requesting permission to explore for oil in the North Sea. The company wanted a licence for the parts of the North Sea situa-ted on the Norwegian continental shelf. The offer was USD 160 000 per month, and was regarded as an attempt to acquire exclusive rights. The Norwegian authorities refused to sign over the entire shelf to a single company. If the areas were to be opened for explora-tion, more than one company would be needed. In May 1963, the Government proclaimed sovereignty over the Norwegian continental shelf. A new act established that the State was the landowner, and that only the King (Government) could grant licences for exploration and production. But even though Norway had proclaimed sovereignty over vast ocean areas, some important clarifications were still needed regarding delineation of the continental shelf, primarily in relation to Denmark and the UK. Agreements to delineate the continental shelf were signed in March
1965 on the basis of the equidistance principle. The first licensing round was announced on 13 April 1965. 22 production licences were awarded, covering 78 blocks. The first exploration well was drilled in the summer of 1966, but turned out to be dry. The Norwegian oil era started with the discovery of Ekofisk in 1969. Production from the field started on 15 June 1971, and several large discoveries were made in the following years. In the 1970s, exploration activities were concentrated in the North Sea. The area north of the 62nd parallel was opened for petroleum activity in 1979 and exploration was gradually initiated. Only a limited number of blocks were announced for each licensing round, and the most pro-mising areas were explored first. This led to world-class discoveries, and production from the Norwegian continental shelf has been dominated by these large fields. They were given names such as Ekofisk, Statfjord, Oseberg, Gullfaks and Troll. These fields have been, and are still, very important for the development of petroleum activi-ties in Norway. Development of these large fields has also led to the establishment of infrastructure, enabling tie-in of a number of other fields. Production from several of the major fields is now in decline, and the trend is now development of and production from new, smaller fields. Current Norwegian petroleum production is therefore divided among a larger number of fields than before. In the early days, the authorities chose a model where the petro-leum activities were primarily carried out by foreign companies. They dominated exploration activities and developed the first oil and gas fields. Norwegian participation gradually grew over time with the addition of Norsk Hydro, Saga Petroleum. Statoil was established in 1972 with the State as sole owner. A principle was also established to give the State a 50 per cent ownership interest in each production licence. In 1993, this principle was changed so that an assessment is made in each individual case as to whether there will be State partici-pation, and whether the ownership interest will be higher or lower. In 1999, Saga was acquired by Norsk Hydro, and Statoil was partially privatised in 2001. This led to the establishment of Petoro. Petoro took over administration of the State’s Direct Financial Interest (SDFI), esta-blished in 1985, from Statoil. In 2007, Statoil merged with Norsk Hydro’s oil and gas division, and today, about 50 Norwegian and foreign companies are active on the shelf.
Ekofisk
(1969)1971
Statfjord
(1974)1979
Gullfaks
(1978)1986
Oseberg
(1979)1988
Troll
(1983)1996

FACTS 2014 • 1110 • FACTS 201410 • FACTS 2014
Fact box 1.1 What is petroleum?
Oil and gas are organic materials, broken down, transformed and deposited in ocean areas over millions of years. Most of the oil and gas deposits on the Norwegian continental shelf originate from a thick layer of black clay that is currently several thousand metres under the seabed. The black clay is a source rock, which means a deposit containing significant organic residue. The clay was deposi-ted around 150 million years ago at the bottom of a sea that covered much of present-day North-Western Europe. This Sea was unique in that the seabed was dead and stagnant, yet the upper water masses were teeming with life. Large amounts of microscopic phytoplank-ton accumulated in the oxygen-free bottom sediments. Over time, they were buried deeper, and after a long chemical conversion through bacterial decomposition and subsequent thermal effects, liquid hydrocarbons and gas were formed in the source rock. Oxygen-free decomposition of organic matter produces substances such as kerogen, which in turn releases oil and gas at increased temperatures and pressures. On the Norwegian conti-nental shelf, the temperature increases by 25 degrees per kilo-metre of depth. After more than one hundred million years of erosion and sedimentation, there can be several kilometres of clay and sand on top of the source rock. Oil is formed when the kerogen’s temperature reaches 60 - 120 degrees; at higher tempe-ratures, mainly gas is formed. As the oil and gas are released, they seep out of the source rock and follow the path of least resistance, determined by pres-
sure and the rock’s permeability. Because hydrocarbons are lighter than water, they will migrate upward in porous, water-bearing rocks. The oil and gas migration takes place over thousands of years, and can extend over tens of kilometres until it is stopped by denser layers. Reservoir rocks are porous and always saturated with various compositions of water, oil and gas. Most of Norway’s petroleum resources are trapped in reservoir rocks deposited in large deltas formed by rivers that ran into the sea during the Jurassic Age. The main reservoirs on e.g. the Gullfaks, Oseberg and Statfjord fields are in the large Brent delta from the Jurassic Age. Large reserves are also found in sand deposited on alluvial plains from the Triassic Age (the Snorre field), in shallow seas from the Late Jurassic Age (the Troll field) and as subsea fans from the Pala-eocene Age (the Balder field). In the southern North Sea, thick layers of chalk, consisting of microscopic calcareous algae, consti-tute an important reservoir rock. Clay stone and argillaceous sandstone form dense deposits that affect migration routes from the source rock to the reservoir. They are also essential for keeping petroleum in place in the reser-voir over an extended period of time. Dense deposits that form a cap over the reservoir rocks are called cap rocks. In addition, the reservoir rocks must have a shape that collects the oil in a so-cal-led trap. When an area contains source rocks, reservoir rocks, cap rocks and a trap, the preconditions are present for discovering oil and gas deposits.
The Geological Timescale
200
2 000 0
56 34 23 5
0488 251299359416444
Cambrian
Palaeocene Eocene Oligocene Miocene Pliocene
Ordo-vician Silurian Devonian Carboni-
ferous Permian Triassic Jurassic Cretaceous
Plei
stoc
ene
/ Hol
ocen
e
Paleo-gene
Neo-gene
1 000million years
Paleo-zoic
Meso-zoic
Firstshellfish& corals
65.5million years
Firstfish
First land plants
Firsthorses
Firstwhales
Firstmonkeys
Firstapes
Firsthominids
Firstmodernhumans
First insectsFirst tetrapods
First reptilesFirst mammal-like reptiles
First dinosaurs LastdinosaursFirst mammals
FirstfloweringplantsFirst
birds
1.8
542million years
145.5 65.5

12 • FACTS 2014
Current petroleum activities
The petroleum industry is Norway’s largest industry measured in value creation, State revenues and export value. Since production started on the Norwegian continental shelf in the early 1970s, the industry has contributed approx. NOK 11 000 billion to the Norwegian GDP, measured in 2013 NOK. The industry has thus been highly important for the Norwegian economy and the financing of the Norwegian welfare state. The State’s tax revenues are currently transferred to the Government Pension Fund – Global, which was valued at more than NOK 5000 billion as of 1st of January 2013. However, only 44 percent of the projected recoverable resources on the Norwegian continental shelf have been produced.
Significance to the Norwegian economy
The Norwegian petroleum management system is based on the principle that exploration, development and operations must gene-rate the greatest possible values for society, and that the revenues shall benefit the State and thus the Norwegian society as a whole. The petroleum resources are highly valuable. This is the primary reason why the State claims a large share of the value creation through taxes, fees and the State’s Direct Financial Interest (SDFI).
Tax revenues in 2012 totalled approx. NOK 232 billion. The State also receives substantial income from direct ownership in fields through the SDFI scheme. The State’s total net cash flow from petroleum activities in 2012 totalled NOK 401 billion, measured in 2013 NOK. Total revenue from the sector amounted to about 29 per cent of the State’s total revenues.
The State’s revenues from the petroleum activities are transferred to a special fund, the Government Pension Fund – Global. The expec-ted returns from the fund can be spent over the fiscal budget. At the end of 2013, the Fund was valued to NOK 5038 billion. This cor-responds to about one million kroner per Norwegian citizen.
Figure 1.3 The net government cash flow from petroleum activities (Source: Norwegian Public Accounts)
Figure 1.4 The net government cash flow from petroleum activities in 2012 (bill. 2013-NOK) (Source: Norwegian Public Accounts)
232.14.1
151.114.1
401.4
TaxesEnvironmental taxes and area feesSDFIStatoil dividendTotal:
-100
0
100
200
300
400
500
1971 1976 1981 1986 1991 1996 2001 2006 2011
Bill.
NO
K 20
13 v
alue
Statoil dividendRoyalty and area feeSDFIEnvironmental taxesTaxesState net cash �ow
Figure 1.2 Macro-economic indicators for the petroleum sector 2013 (Source: Statistics Norway, Ministry of Finance)
The petroleum sector’s share of GDP
The petroleum sector’s share of state revenues
The petroleum sector’s share of total investment
The petroleum sector’s share of total exports
21.5 %29.1 % 30.7 %
48.9 %

FACTS 2014 • 1312 • FACTS 2014
In addition to direct income to the State, the industry also creates ripple effects both locally and regionally, from south to north. The Norwegian petroleum industry has its roots in Rogaland County, but has developed in time with the offshore activity’s gradual expansion northwards. Strong petroleum expertise clusters and internationally competitive supplier services are currently establis-hed in many parts of the country.
The industry employs a substantial segment of the Norwegian popu-lation. Oil companies and companies that supply the petroleum industry currently employ about 150 000 people. Taking into account the effect of the petroleum industry’s demand on the overall economy, the number of people employed is approx. 250 000.
Continuous focus on research and development has helped Norway to recover a large share of the proven resources, compared with other oil provinces. The activity on the Norwegian continental shelf is also subject to strict requirements as regards to health, safety and the external environment. Good interaction between the State, companies, supplier industry, special interest organisations and the R&D sector is an important prerequisite for achieving good results in these areas.
The companies on the Shelf
A broad range of companies carry out petroleum activities on the Norwegian shelf. In the beginning only a few major international oil companies operated on the shelf, but today there are more than 50
companies involved in exploration, production and infrastructure. This diverse set of small and large companies breeds competition, which again promotes efficiency. At the same time, this safeguards interest in a large number of different projects, and various techno-logies and plays are utilised. Measured by the companies’ pro-duction volumes in 2013, Statoil is the largest company on the Nor-wegian shelf, followed by large international companies such as ExxonMobil, Total, Shell, ConocoPhillips and ENI.
Production
In 2012, Norway was the world’s third largest gas exporter and the tenth largest oil exporter. The export value of pipeline services and export of crude oil and gas for all companies totalled about NOK 564 billion in 2013, which corresponds to about 49 per cent of Norway’s total export value.
In 2012, Norway was ranked the world’s 15th largest oil producer and 6th largest gas producer. 213.7 million Sm3 o.e. of marketable petroleum was produced in 2013. Half of this was gas. This is about five per cent less than in 2012, and 20 per cent less compared with the peak year 2004. A total of 78 fields are currently in production on the Norwegian shelf. Four new fields came on stream in 2013; Jette, Hyme, Skarv and Skuld. Plans for Development and Operation (PDOs) were approved for four new fields in 2013. Three of these fields are in the North Sea (Ivar Aasen, Gina Krog and Oseberg Delta 2) and one is located in the Norwegian Sea (Aasta Hansteen).
Figure 1.5 The size of the Government Pension Fund - Global (Statistics Norway, NBIM)
0%
20%
40%
60%
80%
100%
120%
140%
160%
180%
0
1000
2000
3000
4000
5000
6000
1996 1998 2000 2002 2004 2006 2008 2010 2012
Billi
on N
OK
Billi
on N
OK
Marked value fundPercentage of GDP
0
50
100
150
200
250
300
1971 1976 1981 1986 1991 1996 2001 2006 2011 2016
³M
ill. S
m³ o
il eq
uiva
lent
s pe
r yea
r
Gas (40 MJ) Condensate NGL Oil
Figure 1.6 Historical production of oil and gas, and prognosis for production in coming years (Source: The Norwegian Petroleum Directorate)

14 • FACTS 2014
Costs
Even minor petroleum projects can be compared with the largest industrial investments on the mainland and vast amounts have been invested in exploration, field development, transport infra-structure and onshore facilities since activity started on the Norwegian continental shelf. Substantial investments are also being made in existing fields in order to increase recovery rates and extend field lifetimes. This requires new wells, facility modification and new infrastructure. Investments, including exploration, totalled approx. NOK 210 billion in 2013, or about 31 per cent of the country’s total capital expenditures. Operating costs in 2013 amounted to about NOK 67 billion.
Investment and operating costs have grown in recent years. This is an international trend caused e.g. by the high demand for scarce input factors in the petroleum industry. At the same time, costs on the Norwegian shelf are somewhat higher than in other comparable petroleum provinces.
Fact box 1.2 Government Pension Fund – Global
The Government Pension Fund - Global (SPU) was established in 1990 for the purpose of ensuring a long term perspective when using the State’s petroleum revenues. Through an investment fund with a very long time horizon, the petroleum wealth can benefit both current and future generations. The first transfer to the SPU took place in 1996. The State’s total net cash flow from petroleum activities is transferred to the Government Pension Fund - Global on an annual basis. In addition, the Fund receives income through returns, including interest and yield on the fund’s investments. The petroleum revenues are gradually phased into the economy by covering the structural non-oil deficit in the fiscal budget. In order to alleviate economic fluctuations, ensure sound capacity utilisation and low unemployment, the amount spent will be either higher or lower than the expected real returns. Over the long term, however the phase-in will take place in line with development in the Fund’s expected real returns. Net cash flow from the petroleum activities – Non-oil deficit in the fiscal budget + Return on the Fund’s investments = Revenues for the Government Pension Fund - Global
Figure 1.7 Historical investments (exploration costs not included) (Source: The Norwegian Petroleum Directorate / The Ministry of Petroleum and Energy)
0 20 40 60 80
100 120 140 160 180 200
1990 1993 1996 1999 2002 2005 2008 2011 2014 2017
Bill.
201
3-N
OK
Not decided projects
Approved and decided investments in �elds discoveries and pipelines/ onshore plants

FACTS 2014 • 15PB • FACTS 2014
THE NORWEGIAN CONTINENTAL SHELf
The Aker Barents drilling rig exploring for petroleum in the Barents Sea.(Photo: Harald Pettersen, Statoil)
2
16 • FACTS 201416 • FACTS 2014
Areas on the Norwegian shelf
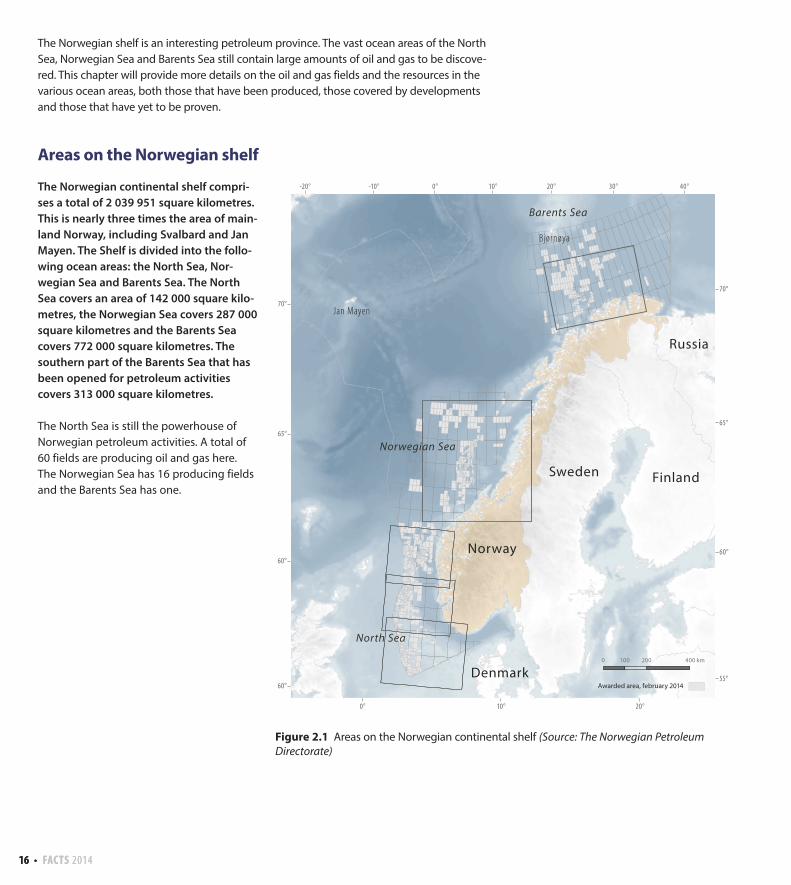
The Norwegian continental shelf compri-ses a total of 2 039 951 square kilometres. This is nearly three times the area of main-land Norway, including Svalbard and Jan Mayen. The Shelf is divided into the follo-wing ocean areas: the North Sea, Nor-wegian Sea and Barents Sea. The North Sea covers an area of 142 000 square kilo-metres, the Norwegian Sea covers 287 000 square kilometres and the Barents Sea covers 772 000 square kilometres. The southern part of the Barents Sea that has been opened for petroleum activities covers 313 000 square kilometres.
The North Sea is still the powerhouse of Norwegian petroleum activities. A total of 60 fields are producing oil and gas here. The Norwegian Sea has 16 producing fields and the Barents Sea has one.
70°
65°
60°
60°55°
60°
65°
70°
40°30°20°10°0°-10°-20°
0° 10° 20°
Finland
Jan Mayen
Bjørnøya
0 200 400 km100
Norway
Sweden
Denmark
Russia
North Sea
Norwegian Sea
Barents Sea
Awarded area, february 2014
Figure 2.1 Areas on the Norwegian continental shelf (Source: The Norwegian Petroleum Directorate)
The Norwegian shelf is an interesting petroleum province. The vast ocean areas of the North Sea, Norwegian Sea and Barents Sea still contain large amounts of oil and gas to be discove-red. This chapter will provide more details on the oil and gas fields and the resources in the various ocean areas, both those that have been produced, those covered by developments and those that have yet to be proven.

FACTS 2014 • 1716 • FACTS 201416 • FACTS 2014
The southern North Sea
The southern North Sea is still an important petroleum province for Norway, more than 40 years after production started on Ekofisk. According to current plans, the field will keep producing for another 40 years. Thirteen fields are producing in this part of the North Sea. One field, Brynhild, is under development. Ekofisk is a hub for petro-leum activities in the area, and many fields are tied in to the infra-
structure on Ekofisk for further transport via the Norpipe system. The southern North Sea still contains substantial resources, particu-larly in the large chalk fields. Oil and gas from the fields in the southern North Sea are transported in part by vessels and in part via pipelines to onshore facilities in the UK and on the Continent.
Figure 2.2 Fields and discoveries in the southern North Sea (Source: The Norwegian Petroleum Directorate)
)È)È3/7-8 S
Ula
Tambar Øst
Gaupe
EkofiskEldfisk
Blane
Gungne
Gyda
Trym
EmblaValhall
VargRev
Sigyn
Tor
Hod
Tambar
Oselvar2/4-17 Tjalve
Cod
2/12-1 Mjølner
Edda
2/5-3 Sørøst Tor
2/4-21
Tommeliten Gamma
18/10-1
17/12-1 Bream
7/12-5
Yme
2/3-1
15/12-21
8/10-4 SMime
1/5-2 Flyndre
1/9-1 Tommeliten Alpha
Vest Ekofisk
Albuskjell
15/8-1 Alpha
Brynhild
Farsund
58°
57°
56°
LANG
ELED
EUROPIPE II
ZEEP
IPE
I STATPIPEFRANPIPE
EUROPIPE I
58°
57°
56°
6°4°2°
6°4°2°
ZEEP
IPE
II B
0 30 6015 k m
Awarded area, february 2014
NORPIPE GAS PIPELINE
NORPIPE OIL PIPELINE
ULA OIL TRANSPORT
18 • FACTS 2014
The central North Sea
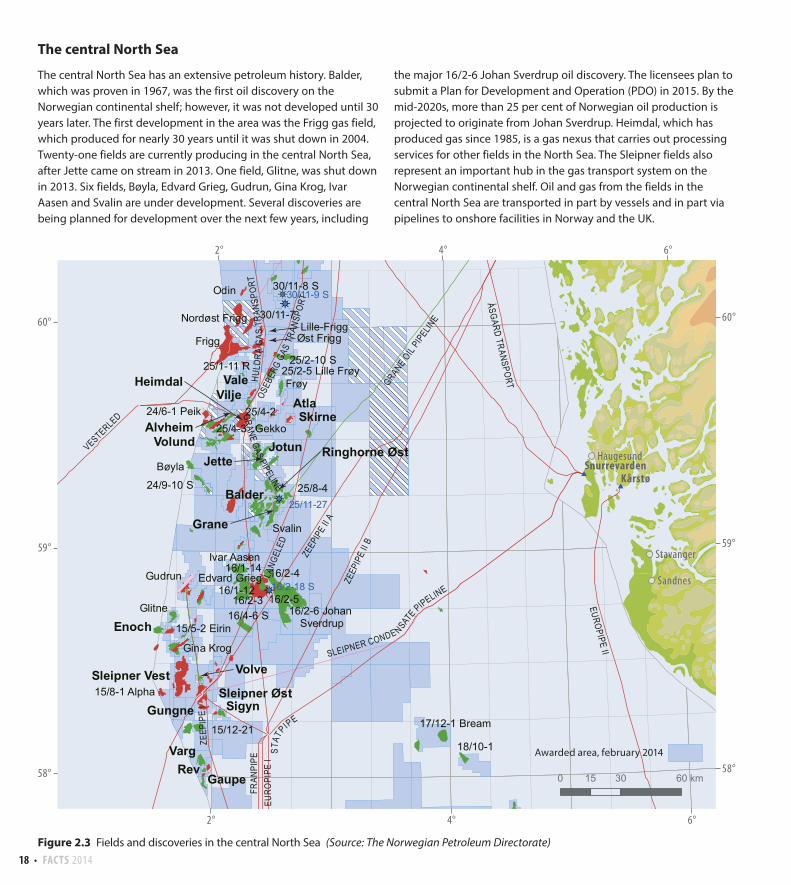
The central North Sea has an extensive petroleum history. Balder, which was proven in 1967, was the first oil discovery on the Norwegian continental shelf; however, it was not developed until 30 years later. The first development in the area was the Frigg gas field, which produced for nearly 30 years until it was shut down in 2004. Twenty-one fields are currently producing in the central North Sea, after Jette came on stream in 2013. One field, Glitne, was shut down in 2013. Six fields, Bøyla, Edvard Grieg, Gudrun, Gina Krog, Ivar Aasen and Svalin are under development. Several discoveries are being planned for development over the next few years, including
the major 16/2-6 Johan Sverdrup oil discovery. The licensees plan to submit a Plan for Development and Operation (PDO) in 2015. By the mid-2020s, more than 25 per cent of Norwegian oil production is projected to originate from Johan Sverdrup. Heimdal, which has produced gas since 1985, is a gas nexus that carries out processing services for other fields in the North Sea. The Sleipner fields also represent an important hub in the gas transport system on the Norwegian continental shelf. Oil and gas from the fields in the central North Sea are transported in part by vessels and in part via pipelines to onshore facilities in Norway and the UK.
Figure 2.3 Fields and discoveries in the central North Sea (Source: The Norwegian Petroleum Directorate)
)È
)È
)È)È
)È
)È
)È
16/2-18 S
25/11-27
30/11-9 S
Grane
Sleipner Vest Volve
Balder
Jette
Enoch
Gaupe
Jotun
SkirneAlvheim
Gungne
Ringhorne Øst
Varg
Atla
Rev
ValeHeimdal
SigynSleipner Øst
Volund
Vilje
16/2-6 Johan Sverdrup
30/11-8 S
Lille-FriggØst Frigg
Frøy
Glitne
16/2-4
Nordøst Frigg
Edvard Grieg
16/4-6 S
25/4-3 Gekko
24/9-10 S
16/2-5
Ivar Aasen
Svalin
25/8-4
18/10-1
15/5-2 Eirin
17/12-1 Bream
Frigg
16/1-12
Gina Krog
15/12-21
25/4-2
Odin
Bøyla
25/1-11 R
30/11-7
15/8-1 Alpha
25/2-5 Lille Frøy
16/1-14
24/6-1 Peik
16/2-3
Gudrun
25/2-10 S
Sandnes
Haugesund
Stavanger
60°
59°
58°
60°
59°
58°
2° 4° 6°
2° 4° 6°
EUROPIPE II
ZEEP
IPE
II B
FRAN
PIPE
VESTERLED
ZEEP
IPE
I
EURO
PIPE
I
ÅSGARD TRANSPORTLA
NGEL
ED
ZEEP
IPE
II A
$
$Snurrevarden
Kårstø
0 30 60 km15
STAT
P IPE
Awarded area, february 2014
GRANE OIL
PIPELINE
HULD
RA G
AS T
RANS
PORT
OSEB
ERG
GAS
TRAN
SPOR
T
GRANE GAS PIPELINE
SLEIPNER CONDE NSATE PIPELINE
FACTS 2014 • 1918 • FACTS 2014
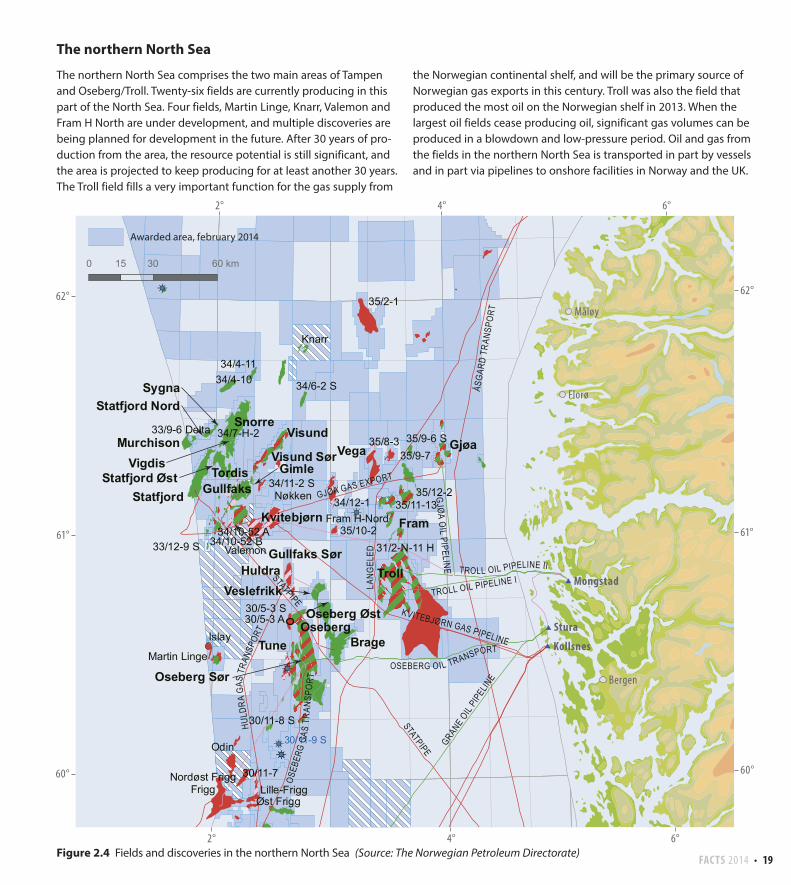
The northern North Sea
The northern North Sea comprises the two main areas of Tampen and Oseberg/Troll. Twenty-six fields are currently producing in this part of the North Sea. Four fields, Martin Linge, Knarr, Valemon and Fram H North are under development, and multiple discoveries are being planned for development in the future. After 30 years of pro-duction from the area, the resource potential is still significant, and the area is projected to keep producing for at least another 30 years. The Troll field fills a very important function for the gas supply from
the Norwegian continental shelf, and will be the primary source of Norwegian gas exports in this century. Troll was also the field that produced the most oil on the Norwegian shelf in 2013. When the largest oil fields cease producing oil, significant gas volumes can be produced in a blowdown and low-pressure period. Oil and gas from the fields in the northern North Sea is transported in part by vessels and in part via pipelines to onshore facilities in Norway and the UK.
Figure 2.4 Fields and discoveries in the northern North Sea (Source: The Norwegian Petroleum Directorate)
0 30 60 km15
)È
)È
)È
)È
)È
)È
30/11-9 S
Snorre
Fram
Sygna
Statfjord
Visund
Tordis
Veslefrikk
Brage
Gullfaks
Oseberg Sør
Statfjord Nord
Murchison
Tune
Huldra
Kvitebjørn
Oseberg
Vega
Oseberg Øst
Visund SørGjøa
Gimle
Troll
Statfjord ØstVigdis
Gullfaks Sør34/10-52 B
35/12-2
33/12-9 S Valemon
Fram H-Nord
35/9-6 S
34/4-10
30/11-8 S
Lille-FriggØst Frigg
Nordøst Frigg
34/12-1
34/7-H-233/9-6 Delta
34/11-2 S Nøkken
34/6-2 S
31/2-N-11 H
Martin Linge
Frigg
35/11-13
Odin
35/9-7
30/11-7
34/10-52 A
35/2-1
30/5-3 S
Knarr
35/10-2
35/8-3
34/4-11
Islay30/5-3 A
Bergen
Florø
Måløy62°
61°
60°
61°
60°
62°
2° 4° 6°
2° 4° 6°
Mongstad
Stura
Kollsnes$
$
$
STATPIPELA
NGEL
ED
STATPIPE
ÅSGA
RD T
RANS
PORT
Awarded area, february 2014
GRANE OIL
PIPEL
INE
GJØA GAS EXPORT
GJØA OIL PIPELINE
OSEBERG OIL TRANSPORT
KVITEBJØRN GAS PIPELINE
TROLL OIL PIPELINE II
HULD
RA G
AS T
RANS
PORT
OSEB
ERG
GAS
TRAN
SPOR
T
TROLL OIL PIPELINE I

20 • FACTS 2014
0 50 100 km25
)È
)È
)È
)È
)È
)È)È
)È
)È
)È
)È
)È
)È
6407/8-6 A
6608/10-15
6506/9-3
6406/6-3
6607/12-2 S
6407/8-6
Urd
Mikkel
Morvin
Ormen Lange
Åsgard
Alve
Skuld
Njord Draugen
Hyme
Skarv
Heidrun
Marulk
Kristin
Norne
Tyrihans
Aasta Hansteen6705/10-1
6407/2-5 S
6507/7-14 S 6507/7-13
6406/2-1 Lavrans
6506/12-3 Lysing
Yttergryta
6507/3-8
6407/2-6 S
6407/7-8
6406/3-2Trestakk
6506/11-2 Lange
6406/2-7 Erlend
6407/1-6 S
6507/3-7
6506/9-2 S
6407/9-96407/6-6 Mikkel Sør
6406/3-86507/11-6 Sigrid
6406/9-1 Linnorm
6506/6-1
Trondheim
Namsos
Brønnøysund
Sandnessjøen
Stjørdal
Kristiansund
Molde
63°
64°
65°
66°
67°67°
66°
65°
64°
63°
4°2° 6° 8° 10° 12°
4° 6° 8° 10° 12°
Nyhamna
Tjeldbergodden$
$
ÅSG
ARD
TRAN
SPO
RT
LANGELED
HALTENPIPE
NORN
E GAS TR
ANSP
ORT
DRAUGEN G AS EXPORT
Awarded area, february 2014
ORMEN LANGE PIPELINE
Figure 2.5 Fields and discoveries in the Norwegian Sea (Source: The Norwegian Petroleum Directorate)

FACTS 2014 • 2120 • FACTS 2014
0 50 100 km25
)È
)È
)È
)È
)È
)È
)È
)È
)È7220/7-2 S
7219/8-2
7120/1-3
Snøhvit
7120/2-3 S
Goliat
7222/11-1
7122/6-1
7120/12-2
7220/8-1 Johan Castberg
$
73°
72°
71°
71°
72°
73°
30°28°26°24°22°20°18°
20°18° 22° 24° 26° 28°
HammerfestMelkøya
SNØHVIT PIPELINE
Awarded area, february 2014
The Norwegian Sea
The Norwegian Sea is generally a less mature petroleum province compared to the North Sea. Draugen, which was the first field in the Norwegian Sea, came on stream in 1993. After Skarv, Skuld and Hyme came on stream in 2013, there are 16 fields producing in the Norwegian Sea. One field, Yttergryta, was shut down in 2013. The Aasta Hansteen gas field is under development. This is also the case for the Polarled gas pipeline, which will extend the Norwegian gas transport system north of the Arctic Circle for the first time. The Norwegian Sea has substantial gas reserves. Produced gas from the fields is transported via the Åsgard Transport pipeline to Kårstø in Rogaland county, and via Haltenpipe to Tjeldbergodden in Møre and Romsdal county. The gas from Ormen Lange is transported via pipeline to Nyhamna and onward to Easington in the UK. Oil from the fields in the Norwegian Sea is transported by tankers.
The Barents Sea
Most of the Barents Sea is considered a frontier petroleum province, although there has been exploration in the area for more than 30 years. Only one field has been developed in the area, Snøhvit, which came on stream in 2007. The gas from Snøhvit is transported via pipeline to Melkøya, where it is processed and cooled into LNG, which is transported to the market using special vessels. Goliat is under development. The licensees are considering development solutions for the 7220/7-1 and 7220/8-1 Johan Castberg discoveries.
Figure 2.6 Fields and discoveries in the Barents Sea (Source: The Norwegian Petroleum Directorate)

22 • FACTS 2014
Petroleum resources
Resources is a collective term for recoverable petroleum volumes. The resources are classified according to their maturity, see Figure 3b.2. The classification shows petroleum volumes that have been adopted or approved for development (reserves), resources that are contingent on clarification and resolution (contingent resources) and estimated resource volumes that have yet to be discovered (undiscovered resources). The main categories are thus reserves, contingent resources and undiscovered resources.
The Norwegian Petroleum Directorate’s basic projections for disco-vered and undiscovered petroleum resources on the Norwegian continental shelf amount to about 14.2 billion standard cubic metres of oil equivalents (billion Sm3 o.e.). Of this, a total of 6.2 billion Sm3 o.e., or 44 per cent of the overall resources, have been sold and delivered. Of the total remaining recoverable resources, 8 billion Sm3 o.e., 5.1 billion Sm3 o.e. have been discovered, while the projected undiscovered resources amount to 2.9 billion Sm3 o.e.
The total growth in discovered resources in 2013 has been estima-ted at 114 million Sm3 o.e. Twenty new discoveries were made in 45 exploration wells. Many of the discoveries have not been evaluated, and the estimates are therefore highly uncertain.
After production started on the Norwegian continental shelf in 1971, petroleum has been produced from a total of 91 fields. In 2013, production started from Jette in the North Sea and Hyme, Skarv and Skuld in the Norwegian Sea. Of the fields that were pro-ducing at the end of 2013, 60 are located in the North Sea, 16 in the Norwegian Sea and one in the Barents Sea.
Figure 3b.1 shows the estimates for recoverable resources on the Norwegian continental shelf. The volumes are classified according to the Norwegian Petroleum Directorate’s resource classification system and show total resources, both liquids and gas.
The detailed resource accounts as of 31 December 2013 are shown in Table 4b.1.
-6
-4
-2
0
2
4
6
8
10
12
Undiscovered resourcesContingent resources in discoveriesContingent resources in fieldsReservesSold and delivered
Tota
l
Gas
Liqu
id
4.1
1.9
3.0
5.8
3.9
4.3
2.5
5.6
Bill.
Sm
3 o.e
.
8.0
5.6
11.0
6.2
Total resources:14.2 billion Sm3 o.e.
44%
22%
6%
7%
21%
Figure 2.7 Petroleum resources and uncertainty in the estimates per 31.12.2013 (Source: The Norwegian Petroleum Directorate)

FACTS 2014 • 2322 • FACTS 2014
Reserves
Reserves include recoverable petroleum resources in deposits for which the authorities have approved the Plan for Development and Operation (PDO) or granted PDO exemption, and resources in depo-sits that the licensees have resolved to produce, but for which a PDO has not been approved by the authorities.
2013 saw resource growth on the Norwegian shelf totalling 102 million Sm3 o.e. At the same time, 215 million Sm3 o.e. were pro-duced, sold and delivered. The resource accounts therefore show a reduction of 113 million Sm3 o.e. in remaining reserves. This corre-sponds to a decline of about three per cent compared with 2012.
As regards oil reserves, only 29 million Sm3 of oil was recorded as new reserves in 2013. During the period from 2005 to 2013, the overall reserve growth has totalled 636 million Sm3 of oil. This means that it may be difficult to reach the authorities’ goal to mature 800 million Sm3 of oil to reserves before 2015.
Contingent resources
Contingent resources include proven petroleum volumes for which production has not yet been resolved. The volume of contingent resources in fields has hardly changed from 2012, while the resour-ces in discoveries have increased by 76 million Sm3 o.e., to 1056 million Sm3 o.e. in 2013. The increase can e.g. be explained by the fact that the resource estimate for the 16/2-6 Johan Sverdrup disco-very increased by 59 million Sm3 o.e. in 2013. This is in addition to the resource growth from new discoveries in 2013.
Undiscovered resources
Undiscovered resources include petroleum volumes that are presu-med to exist, but which have yet to be proven through drilling (Resource Categories 8 and 9).
The volume of undiscovered resources has been estimated at 2940 million Sm3 o.e., an increase of 350 million Sm3 o.e., compared with the 2012 accounts. This includes volumes from the new area in the Barents Sea South-East, totalling 300 million Sm3 o.e, and from the shelf around Jan Mayen, totalling 90 million Sm3 o.e. The estimated undiscovered resources in the North Sea, Norwegian Sea and Barents Sea have also been updated. The result of this work is that these resources were reduced by 40 million Sm3 o.e.
The North Sea
Changes in the accounts show that 143 million Sm3 o.e. have been sold and delivered from the North Sea in 2013, while the growth in gross reserves was 51 million Sm3 o.e. This means that the remai-ning reserves in the North Sea have been reduced by 92 million Sm3 o.e. Reserve growth from fields in operation provided the largest contribution to the increase in gross reserves. This growth comes e.g. from the drilling of additional wells, wells that exceed their pro-duction targets and extended lifetimes for several fields. Contingent resources in fields have increased by 16 million Sm3 o.e., in part due to new development plans for Gullfaks and Gullfaks Sør. A total of seven new discoveries were made in the North Sea in 2013. Contin-gent resources in discoveries have increased by 40 million Sm3 o.e. The most important reason for this is that the resource estimate for 16/2-6 Johan Sverdrup has been upgraded since last year. Develop-ment resolutions have been made for the 1/5-2 Flyndre, 15/3-9 Gudrun Øst, 34/8-13 A Titan phase 1 and 34/8-15 S Rhea discoveries, and they have therefore been classified as reserves. Undiscovered resources in the North Sea have been reduced by 35 million Sm3 o.e., compared with the 2012 accounts. The oil resources have declined, but the gas resources have increased.
The Norwegian Sea
Gross reserves in the Norwegian Sea have been reduced by 5 million Sm3 o.e., partly due to amended well plans for Njord. In 2013, 67 million Sm3 o.e. have been sold and delivered from the Norwegian Sea. The remaining reserves in the Norwegian Sea have therefore been reduced by a total of 72 million Sm3 o.e. Contingent resources in fields have increased by 24 million Sm3 o.e. due to project maturation and development. Eight new discoveries were made in the Norwegian Sea in 2013. The estimated contingent resources in discoveries have thus increased by 26 million Sm3 o.e., compared with the 2012 accounts. Undiscovered resources in the Norwegian Sea have been reduced by 20 million Sm3 o.e., compared with the 2012 accounts. Gas resources have been increased, while oil resources have been reduced. Including the resource estimate for Jan Mayen of 90 million Sm3 o.e., the undiscovered resources in the Norwegian Sea increase by 70 mill Sm3 o.e.

24 • FACTS 2014
The Barents Sea
Remaining reserves in the Barents Sea had a net increase of 52 mill Sm3 o.e. in 2013. Five million Sm3 o.e. were sold and delivered, while the increase in gross reserves was 57 million Sm3 o.e., as a result of the Snøhvit Offshore Compression and Snøhvit CO2 Injection pro-jects being matured into reserves. For the same reason, among others, contingent resources in fields have been reduced by 47 million Sm3 o.e. Five new discoveries were made in the Barents Sea in 2013, totalling 57 million Sm3 o.e. Nevertheless, contingent resources in discoveries have only increased by 9 million Sm3 o.e. The reason for this is e.g. that it is no longer deemed likely that the resources in 7225/3-1 Norvarg will be developed. Undiscovered resource estimates have increased for both oil and gas. Including the resource estimate for the Barents Sea South-East, the increase amounts to 315 million Sm3 o.e.
Figure 2.8 The Norwegian Petroleum Directorate’s resource classification (Source: The Norwegian Petroleum Directorate)
6 5F 4F 3F 2F
5A 4A 3A 2A
1 0
7A
7F
8
NPD's resource classification
Contingent resources
Reserves Historical production
Undiscovered resources
Recoverynot very
likely
Recoverylikely,
but notclarified
In theplanning
phase
Possible futuremeasures to improve
recovery
New discoveries that have not
been evaluated
Prospects Leads and unmappedresources
Decidedby the
licensees
Approvedplan for
development and operation
Inproduction
Sold anddelivered
petroleum

FACTS 2014 • 2524 • FACTS 2014
Table 2.1 Resource accounts as of 31 December 2013
Total recoverable potential
Project status category
Resource accounts per 31.12.2013 Changes from 2012
Oilmill Sm3
Gasbill Sm3
NGLmill tonnes
Condmill Sm3
Totalmill Sm3
o.e.
Oilmill Sm3
Gasbill Sm3
NGLmill tonnes
Condmill Sm3
Totalmill Sm3 o.e.
Produced 3897 1874 160 108 6183 84 108 9 4 214
Remaining reserves* 834 2049 129 40 3167 -55 -41 -10 3 -112
Contingent resources in fields 337 185 22 3 567 5 -18 5 -3 -7
Contingent resources in discoveries 679 330 14 20 1056 90 -14 0 0 76
Potential from improved recovery** 155 90 245 25 40 0 0 65
Undiscovered 1330 1490 120 2940 35 300 0 15 350
Total 7232 6018 325 290 14158 185 375 4 19 586
North Sea
Produced 3364 1516 118 73 5178 66 64 5 2 142
Remaining reserves* 676 1366 83 6 2205 -36 -50 -2 -2 -91
Contingent resources in fields 296 113 12 0 433 4 8 2 0 16
Contingent resources in discoveries 508 138 9 13 676 52 -7 -2 -1 40
Undiscovered 540 250 25 815 -55 15 0 5 -35
Total 5384 3383 222 117 9306 31 31 4 3 72
Norwegian Sea
Produced 533 334 41 31 975 18 40 4 2 67
Remaining reserves* 128 475 39 9 686 -19 -36 -9 -1 -72
Contingent resources in fields 41 60 9 1 119 1 17 3 0 24
Contingent resources in discoveries 53 141 5 6 209 7 14 2 3 26
Undiscovered 340 475 35 850 40 30 0 0 70
Total 1095 1484 94 81 2839 48 65 -1 4 115
Barents Sea
Produced 0 24 1 4 31 0 4 0 1 5
Remaining reserves* 30 208 6 25 276 0 44 1 6 51
Contingent resources in fields 0 12 1 2 15 0 -43 -1 -3 -47
Contingent resources in discoveries 118 51 1 1 171 31 -21 0 -1 9
Undiscovered 450 765 60 1275 50 255 0 10 315
Total 598 1061 9 92 1768 82 240 0 12 334
* Includes resource categories 1, 2 and 3** Resources from future measures for improved recovery are calculated for the total recoverable potential and have not been broken down by area

26 • FACTS 2014

FACTS 2014 • 27PB • FACTS 2014
fRAME WORk ANd ORGANISATION
The Norwegian regulatory framework requires oil and gas companies to submit core samples from the drilling of wildcat wells on the Norwegian continental shelf to the Norwegian Petroleum Directorate (NPD). The NPD stores 140 kilometres of core samples and drill cuttings from exploration
and production wells in their core store. The industry uses these samples to learn more about the subsurface. (Photo: The Norwegian Petroleum Directorate)
3

28 • FACTS 2014
A predictable and transparent framework is required to enable the oil companies to make good decisions. The organisation of the acti-vities and the allocation of roles and responsibilities must safeguard important social considerations and ensure that the value created benefits society as a whole. This includes consideration for the external environment, health, working environment and safety. Everyone benefits from a framework that gives the petroleum industry an incentive to fulfil the State’s goals, while at the same time maximising the companies’ own returns.
Legal framework
The Petroleum Act (Act No. 72 of 29 November 1996 relating to petroleum activities) provides the general legal basis for the licensing system that governs Norwegian petroleum activities.
Pursuant to the Act and the Petroleum Regulations (Regulation No. 653 of 27 June 1997), licences can be awarded for exploration, pro-duction and transport of petroleum. The Petroleum Act confirms that the State owns the petroleum deposits on the Norwegian con-tinental shelf. Official approvals and permits are necessary in all phases of the petroleum activities, from award of exploration and production licences, in connection with acquisition of seismic data and exploration drilling1, to plans for development and operation, and plans for field cessation.
Before a production licence is awarded for exploration or pro-duction, the area where the activity will take place must be opened for petroleum activities. In this connection, an impact assessment must be prepared that considers factors such as the financial, social and environmental impacts the activity may have. Impact assess-ments and opening of new areas are governed by Chapter 3 of the Petroleum Act and Chapter 2a of the Petroleum Regulations.
Production licences are normally awarded through licensing rounds. Each year, the Government announces a certain number of blocks for which production licences can be applied for. The announcement is governed in detail by Chapter 3 of the Petroleum Act, and Chapter 3 of the Petroleum Regulations. Applicants can apply individually or as a group. The content of the application and the procedure for applying for production licences is governed by Chapter 3 of the Petroleum Act and Chapter 3 of the Petroleum Regulations. The Nor-wegian Petroleum Directorate has prepared guidelines on how to formulate the application. These are available on the NPD’s website. Based on the applications received, the Ministry of Petroleum and Energy awards production licences to a group of companies. Rele-vant, objective, non-discriminatory and announced criteria form the
1 Chapter 4 discusses development and operations. Gas resource management is discussed in Chapter 4.
basis for these awards. The Ministry designates an operator for the joint venture which will be responsible for the operational activities authorised by the licence. The licensee group also functions as an internal control system in the production licence, where each licensee’s role is to monitor the work done by the operator.
The production licence regulates the rights and obligations of the companies vis-à-vis the Norwegian State. The document supple-ments the requirements in the Petroleum Act and stipulates detai-led terms and conditions. It grants companies exclusive rights to surveys, exploration drilling and production of petroleum within the geographical area covered by the licence. The licensees become the owners of the petroleum that is produced. A standard production licence with appendices is available on the MPE’s website. More details regarding production licences can be found in Chapter 3 of the Petroleum Act and Chapter 3 of the Petroleum Regulations.
The production licence is valid for an initial period (exploration period) that can last for up to ten years. During this period, a work commitment must be carried out in the form of e.g. geological/geophysical preliminary work and/or exploration drilling. If all the licensees agree, the production licence can be relinquished when the work commitment has been fulfilled. If the licensees want to continue the work in the production licence, the license will enter the extension period, which is the period for development and operation. The exploration period is governed in detail by Chapter 3 of the Petroleum Act and Chapter 3 of the Petroleum Regulations.
If the companies determine that it is commercially viable to develop a field, they are required to carry out prudent development and pro-duction of proven petroleum deposits. This means that the compa-nies are responsible for promoting and implementing new projects, while the authorities grant the final approval to start the process. When a new deposit is to be developed, the company must submit a Plan for Development and Operation (PDO) to the Ministry for approval. The impact assessment, which is submitted for consulta-tion to various entities that could be affected by the specific deve-lopment, is an important part of the development plan. The impact assessment shows how the development is expected to affect the environment, fisheries, and Norwegian society. The processing of this assessment and the development plan itself, ensure that the projects’ resource management is prudent, and that the consequen-ces for other general public interests are acceptable. The licensee can, if appropriate, document that the development is covered by an appropriate existing impact assessment. The Ministry has drawn up a guide for Plans for Development and Operation and for Plans for Installation and Operation. The main objective of the guide is to clarify the regulations and the authorities’ expectations for develo-pers on the Norwegian shelf. The guidelines can be found on the Norwegian Petroleum Directorate’s website.

FACTS 2014 • 2928 • FACTS 2014
Development and operation are governed in detail by Chapter 4 of both the Petroleum Act and the Petroleum Regulations.
As a main rule, the Petroleum Act requires licensees to submit a ces-sation plan to the Ministry two to five years before the licence expires or is relinquished, or before the use of a facility ceases. The cessation plan must have two main sections; an impact assessment and a dis-posal section. The impact assessment provides an overview of the expected consequences of the disposal for the environment and other factors. The disposal section must include proposals for how cessation of petroleum activities on a field can be accomplished.
Chapter 5 of the Petroleum Act and Chapter 6 of the Petroleum Regulations govern disposal or decommissioning of facilities. In addition to the Petroleum Act, the OSPAR convention (Conven-tion for the protection of the marine environment of the North-East Atlantic) also governs the disposal of our facilities. Under this Con-vention, only a small number of facilities can be abandoned on-site.
Liability for pollution damage is governed by Chapter 7 of the Petro-leum Act. The licensees are responsible for pollution damage, without regard for fault. This is referred to as strict liability.
Safety aspects associated with the petroleum activities are governed by Chapters 9 and 10 of the Petroleum Act, with appurtenant regula-tions. The petroleum activities shall be conducted in a prudent manner to ensure that a high level of safety can be maintained and developed throughout all phases, in line with the continuous tech-nological and organisational development.
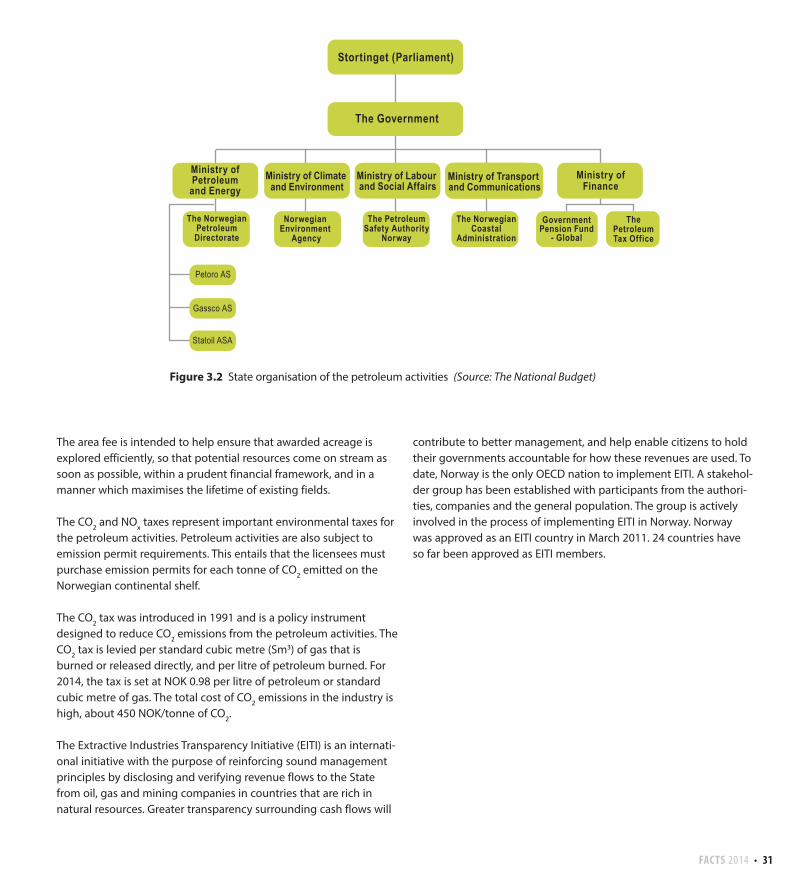
State organisation
The Storting (Norwegian Parliament) sets the framework for the petroleum activities in Norway, in part by adopting legislation. Major development projects and issues involving fundamental prin-ciples must be deliberated in the Storting. The Storting also reviews the Government and public administration.
The Government exercises executive authority over petroleum policy, and answers to the Storting as regards policies. To carry out its policies, the Government is assisted by the ministries, underlying directorates and supervisory authorities. Responsibility for the various roles in Norwegian petroleum policy is distributed as follows:• The Ministry of Petroleum and Energy – responsible for resource
management and the sector as a whole, as well as the State’s ownership in Statoil and Petoro AS, which is the steward of the State’s Direct Financial Interest (SDFI)
• The Ministry of Labour and Social Affairs – responsible for working environment and safety
• The Ministry of Finance – responsible for petroleum taxation• The Ministry of Transport and Communications – responsible for
oil spill preparedness• The Ministry of Climate and Environment – responsible for safe-
guarding the external environment
The Norwegian Petroleum Directorate is subordinate to the Ministry of Petroleum and Energy. The Norwegian Petroleum Directorate plays a key role in the petroleum management system, and is an important advisory body for the Ministry of Petroleum and Energy. The NPD exercises administrative authority in connection with the exploration for and production of petroleum deposits on the Nor-wegian continental shelf. This also includes the authority to stipu-late regulations and make decisions pursuant to the petroleum acti-vities regulations.
Gassco AS is a State-owned enterprise responsible for transport of gas from the Norwegian continental shelf. The company is the ope-rator of Gassled. Gassco has no ownership interest in Gassled, but supervises its operatorship in a neutral, efficient manner in relation to both owners and users.
Petoro AS is a State-owned enterprise that handles the commercial aspects of the State’s Direct Financial Interest (SDFI) on the State’s behalf. Statoil ASA is an international company with activities in 35 countries. The company is listed on the Oslo and New York stock exchanges. The State owns 67 per cent of the shares in the company.
The Ministry of Labour has overall responsibility for regulating and supervising the working environment, as well as safety and emer-gency preparedness in connection with the petroleum activities. The Petroleum Safety Authority Norway (PSA) is responsible for technical and operational safety, including emergency prepared-ness and working environment in the petroleum activities.
The Ministry of Finance has the overall responsibility for taxation and fees from petroleum activities. The Petroleum Tax Office is part of the Norwegian Tax Administration, which is subordinate to the Ministry of Finance. The primary task of the Petroleum Tax Office is to ensure correct stipulation and payment of taxes and fees adopted by the political authorities. The Directorate of Customs and Excise ensures correct stipulation and payment of NOx tax. The Ministry of Finance is also responsible for managing the Govern-ment Pension Fund – Global. Responsibility for the operative mana-gement has been delegated to the Norwegian central bank.

30 • FACTS 2014
The Ministry of Transport and Communications is responsible for acute pollution preparedness in Norwegian waters. The Norwegian Coastal Administration is responsible for the State’s oil spill prepared ness.
The Ministry of Climate and Environment has overall responsibility for managing environmental protection and the external environ-ment in Norway. The Norwegian Environment Agency is e.g. respon-sible for following up the Pollution Control Act.
The State’s revenues from petroleum activitiesNorway has a special system for State revenues from the petroleum activities. The main reason for this system is the extraordinary returns associated with producing these resources. Ownership of the petroleum resources belongs to the Norwegian society. The State secures a large share of the created values through taxation and direct SDFI ownership.
The petroleum taxation system is based on the rules for ordinary corporate taxation, but specified in a separate Petroleum Taxation Act (Act No. 35 of 13 June 1975 relating to the taxation of subsea petroleum deposits, etc.). Due to the extraordinary profit associated with recovering the petroleum resources, an additional special tax is levied on this type of commercial activity. The ordinary tax rate is 27 per cent. The special tax rate is 51 per cent. When the basis for ordi-nary tax and special tax is calculated, investments are subject to straight-line depreciation over six years from the year they are incur-red. Deductions are allowed for all relevant costs, including costs associated with exploration, research and development, financing, operations and removal. Consolidation between fields is allowed. To shield normal returns from special tax, an extra deduction is allowed in the basis for special tax, called uplift. This amounts to 22 per cent of the investments (5.5 per cent per year for four years, from and including the investment year).
Companies that are not in a tax position can carry forward deficits and uplift with interest. These rights follow the ownership interest and can be transferred. Companies can also apply for a refund of the tax value of exploration expenses in connection with the tax assessment.
The petroleum taxation system is designed to be neutral, so that an investment project which is profitable for an investor before tax will also be profitable after tax. This characteristic enables both sub-stantial revenues for the Norwegian society, and encourages com-panies to implement all profitable projects.
In many instances, petroleum produced on the Norwegian conti-nental shelf is sold to affiliated companies. It is important for the State’s revenues that oil and gas sold from Norway is taxed at market prices. To assess whether the prices set between affiliated companies are comparable to what would have been agreed between two independent parties, norm prices can be stipulated for use when calculating taxable income for the tax assessment. The Petroleum Price Council (PPR) sets the norm price. The Council recei-ves information from and meets with companies before setting the final norm price. The norm price system applies for various types and qualities of petroleum. For gas, the actual sales price is used as the basis.
The State’s Direct Financial Interest (SDFI) is a system in which the State owns a share of many oil and gas fields, pipelines and onshore facilities. The ownership interest in the oil and gas fields is set in con-nection with award of the production licences, and the size of the interest varies from field to field. As one of several owners, the State covers its share of the investments and costs, and receives a corre-sponding portion of the income from the production licence. SDFI was established with effect from 1 January 1985. Until then, the State only had ownership in production licences through Statoil, where the State was the sole owner. In 1985, Statoil’s participating interest was divided into a State Direct Financial Interest share (SDFI) and Statoil’s share. When Statoil was listed on the stock exchange in 2001, mana-gement of the SDFI portfolio was transferred to the State-owned management company Petoro. As of 1 January 2014, the State had direct financial interests in 179 production licences, as well as inte-rests in 15 joint ventures in pipelines and onshore facilities.
As a majority owner of Statoil, the State receives dividends which are part of the petroleum activity revenues. The dividend paid to the Norwegian State in 2013 was NOK 14.42 billion.
Operating income (norm price)- Operating expenses- Linear depreciation for investments (6 years)- Exploration expences, R&D and decom.- CO2-tax, NOX-tax and area fee- Net financial costs = Corporation tax base (27 %)– Uplift (5.5 % of investment for 4 years)= Special tax base (51 %)
Figure 4.2 Calculating petroleum tax(Source: Ministry of Petroleum and Energy)
Figure 3.1 Calculation of petroleum tax (Source: The Ministry of Petroleum and Energy)
FACTS 2014 • 3130 • FACTS 2014
The area fee is intended to help ensure that awarded acreage is explored efficiently, so that potential resources come on stream as soon as possible, within a prudent financial framework, and in a manner which maximises the lifetime of existing fields.
The CO2 and NOx taxes represent important environmental taxes for the petroleum activities. Petroleum activities are also subject to emission permit requirements. This entails that the licensees must purchase emission permits for each tonne of CO2 emitted on the Norwegian continental shelf.
The CO2 tax was introduced in 1991 and is a policy instrument designed to reduce CO2 emissions from the petroleum activities. The CO2 tax is levied per standard cubic metre (Sm3) of gas that is burned or released directly, and per litre of petroleum burned. For 2014, the tax is set at NOK 0.98 per litre of petroleum or standard cubic metre of gas. The total cost of CO2 emissions in the industry is high, about 450 NOK/tonne of CO2.
The Extractive Industries Transparency Initiative (EITI) is an internati-onal initiative with the purpose of reinforcing sound management principles by disclosing and verifying revenue flows to the State from oil, gas and mining companies in countries that are rich in natural resources. Greater transparency surrounding cash flows will
contribute to better management, and help enable citizens to hold their governments accountable for how these revenues are used. To date, Norway is the only OECD nation to implement EITI. A stakehol-der group has been established with participants from the authori-ties, companies and the general population. The group is actively involved in the process of implementing EITI in Norway. Norway was approved as an EITI country in March 2011. 24 countries have so far been approved as EITI members.
Stortinget (Parliament)
The Government
The NorwegianPetroleumDirectorate
Ministry of Climate and Environment
Norwegian Environment
Agency
Ministry of Labour and Social Affairs
The Petroleum Safety Authority
Norway
Ministry of Finance
GovernmentPension Fund
- Global
The Petroleum Tax Office
Petoro AS
Gassco AS
Ministry of Transport and Communications
The NorwegianCoastal
Administration
Ministry of Petroleum
and Energy
Statoil ASA
Figure 2.3 State organisation of the petroleum sector(Source: Ministry of Petroleum and Energy)
Figure 3.2 State organisation of the petroleum activities (Source: The National Budget)

32 • FACTS 2014

FACTS 2014 • 33PB • FACTS 2014
THE NORWEGIAN PETROLEUM INdUSTRy – fROM WELL TO MARkET
From the Kollsnes gas processing plant in Hordaland County. Gas from a number of fields, including Troll, is processed here(Photo: Øyvind Sætre/Gassco)
4

34 • FACTS 2014
To ensure that the resources on the Norwegian shelf are efficiently exploited, the process from when a discovery is made until it is developed and production starts, is both long and meticulous. At the same time, the industry must continuously adapt to new infor-mation, new technology, changing requirements and market condi-tions. This chapter briefly describes the cycle from when a field is first discovered until the field is decommissioned. The most impor-tant market conditions are also described, and the chapter is con-cluded with climate and environmental considerations.
Exploration activity
In order to extract the petroleum resources located on the Norwegian continental shelf, the resources must be proven through exploration. Exploration policy is therefore an important part of Norway’s long-term resource management and the Government wants to give the companies access to attractive exploration acreage.
The Norwegian Parliament (Storting) has opened most of the North Sea, the Norwegian Sea and the southern Barents Sea for petroleum activities. The Norwegian Petroleum Directorate’s estimate of undis-covered resources in areas on the shelf, is approx. 3 billion Sm3 of recoverable oil equivalents. Undiscovered resources are distributed as follows between the different ocean areas: 28 per cent in the North Sea, 29 per cent in the Norwegian Sea and 43 per cent in the Barents Sea (see Figure 4.2).
A period of low exploration activity was followed by a surge in 2006, see Figure 4.1. A new record was set in 2009 with 65 spudded explo-ration wells. Fifty-nine exploration wells were spudded in 2013, resulting in 20 discoveries. Recent years have also seen major disco-veries such as Johan Sverdrup in the North Sea and Johan Castberg in the Barents Sea.
Exploration policy in mature and frontier areas
Licensing system The Norwegian licensing system consists of two types of equal licensing rounds. The first type is the numbered licensing round which comprise less mature parts of the shelf. These rounds have been used since 1965, and have been held every second year in recent years. Numbered licensing rounds start with inviting the oil companies to nominate blocks they want to be announced. Based on this and the authorities’ own assessments, a proposed announce-ment is submitted for public consultation. The Government finally announces the round.
The second type is the Awards in Pre-defined Areas (APA), which was introduced for mature parts of the shelf in 2003. This system entails the establishment of pre-defined exploration areas compri-sing all of the mature acreage on the shelf. Companies can apply for acreage within this defined area. As new areas mature, the areas will be expanded, but not reduced. A regular, fixed cycle is planned for licensing rounds in mature areas. So far, eleven annual rounds have been held (APA 2003–2013).
Applicants in the licensing rounds can apply as joint ventures or individually. Impartial, objective, non-discriminatory and pre-announced criteria form the basis for award of production licences. Based on the applications received, the Ministry of Petroleum and Energy awards production licences to a group of companies. The Ministry designates an operator for the joint venture, to be respon-sible for the operational activities authorised under the licence.
The production licence applies for an initial period (exploration period) that can last up to ten years.
Mature areasPetroleum activities on the Norwegian continental shelf started in the North Sea and have gradually moved north, based on the prin-ciple of stepwise exploration. This means that large parts of the North Sea are now considered mature from an exploration perspec-tive. The same applies to the Halten Bank and the area around the Ormen Lange field in the Norwegian Sea, as well as the area sur-rounding Snøhvit and Goliat in the Barents Sea.
Mature areas are characterised by known geology and well-develo-ped or planned infrastructure. Discoveries in these areas are likely, but new, large discoveries are less likely. It is important to prove and recover the area’s resources before the area infrastructure is shut down. If this cannot be done, profitable resources could potentially be left behind if the discoveries are too small to justify independent infrastructure development. Additional resources from the area sur-rounding a producing or planned field may also increase the field’s
0
10
20
30
40
50
60
70
1970 1975 1980 1985 1990 1995 2000 2005 2010
Num
ber o
f exp
lora
tion
wel
ls sp
udde
d Appraisal wellsWildcat wells
Figure 4.1 Spudded exploration wells on the Norwegian continental shelf 1970–2013 (Source: The Norwegian Petroleum Directorate)

FACTS 2014 • 3534 • FACTS 2014
565
250
375475
510
765
0
400
800
1600
1200
0
400
800
1600
1200
0
400
800
1600
1200
Mill
. Sm
3 o.e
.
Mill
. Sm
3 o.e
.
Mill
. Sm
3 o.e
.
The Barents Sea
The Norwegian Sea
The North Sea
LiquidGas
Figure 4.2 Undiscovered resources by area. The figures in each column show expected recoverable volumes and the uncertainty in the estimate is shown in the slanted line; low estimate on the left, high estimate on the right (Source: The Norwegian Petroleum Directorate)

36 • FACTS 2014
70°
65°
60°
55°
70°
65°
60°
75°
80°
-50° -40° -30° -20° -10° 0° 10° 20° 30° 40° 50° 60° 70°
20°10°0° 30°
Shetland
Jan Mayen
Svalbard
Finland
Norway
Sweden
BARENTS SEA SOUTH
BARENTS SEA NORTH
NORWEGIAN SEA
NORTHSEA
Russia
Greenland
Iceland
Great Britain
Denmark
ARCTIC OCEAN
Faeroe Islands
Open for petroleum activity
Open, see White Paper no 36/41 (2012-13)
Open, special schemes, see WP no 28 (2010-11)
Opening process Jan Mayen
Limits of the NCS according to the UN Conventionon the Law of the Sea
Awards in prede�ned areas (APA)
Assumed maximum extent of sedimentaryrocks which may contain petroleum
Figure 4.3 Area status for the Norwegian continental shelf as of March 2014 (Source: The Ministry of Petroleum and Energy)

FACTS 2014 • 3736 • FACTS 2014
profitability by e.g. extending the lifetime of main fields in order to produce more of the resources in place.
In the mature parts of the Norwegian Shelf, the authorities have adapted the licensing policy to facilitate optimal production of time-critical resources. This led to the introduction of Awards in Pre-defined Areas (APA). Figure 4.3 shows the area made available for awards in APA 2014. The APA area is a pre-defined area that cannot be reduced, and will expand as new areas mature. Annual awards are held within the APA area.
It is important for the authorities that licensed area is actively worked with. The area comprised by the production licence to be awarded is tailored so that companies are awarded only those areas for which they have tangible exploration plans. If a group of licen-sees no longer wants to explore the area covered by the production licence, the acreage must be relinquished. Relinquished acreage can be applied for by new companies that may have a different view of its prospectivity. This leads to faster circulation of acreage and more efficient exploration of the mature areas.
Frontier areasThe areas currently regarded as frontier areas on the Norwegian continental shelf include large parts of the Barents Sea and the Nor-wegian Sea, as well as minor areas in the North Sea. As regards to the Norwegian Sea, this applies particularly to deepwater areas and the northernmost areas.
Frontier area characteristics include limited geological information, significant technical challenges and lack of infrastructure. Geologi-cal uncertainty is greater here, as is the possibility of making major new discoveries. Players that want to explore frontier areas must have broad experience, technical and geological expertise, as well as a solid financial foundation.
In the 18th licensing round in 2004, the principles of relinquishment in frontier areas were amended to make them identical to the prin-ciples that apply for mature areas. Exploring for resources in frontier areas is time-consuming. Not all companies that have been awarded production licences in frontier areas are able to submit a develop-ment plan at the end of the initial period. The main rule of relinqu-ishment in these areas is linked to delineation of resources proven through drilling. Otherwise, the same changes have been made in frontier areas as in mature areas as regards customising the area and work programmes to be awarded.
Licences in the 22nd licensing round were awarded in the spring of 2013, comprising 24 licences in the Barents Sea and the Norwegian Sea. Ownership interests were offered to 29 oil and gas companies. The 23rd licensing round was started in August 2013 with invitations
to nominate areas on the shelf. A licensing round normally lasts 2–3 years. This licensing round will most likely focus on the Barents Sea.
Unopened areas and opening processesLarge areas of the Norwegian continental shelf have yet to be opened for petroleum activities by the Storting. This e.g. includes the entire northern Barents Sea, the north-eastern Norwegian Sea (Troms II, Nordland VII and parts of Nordland IV, V and VI), Skagerrak and the area surrounding Jan Mayen. The general rule for unopened areas is that the Storting must resolve to open an area for petro-leum activities before a licensing round can be announced. Part of the basis for such resolutions is an assessment of factors such as the activities’ potential financial and social impacts, as well as environ-mental impact.
The composition of companies The number and composition of the oil companies that conduct petroleum activities on the Norwegian continental shelf is called the player scenario. The largest international players have central roles, a natural consequence of the extensive, demanding tasks on the shelf. As the area has matured and the challenges have changed and become more diversified, it has been important to adapt the composition of companies to this altered situation. (see Figure 4.6). A system for prequalifying new operators and licensees has been introduced to better pave the way for new players. The new compa-nies currently make significant contributions to exploration and resource growth on the Norwegian shelf, see Figures 4.4 and 4.5.
Figure 4.4 Exploration costs in North Sea production licences by size of company (Source: The Norwegian Petroleum Directorate)
0
10
20
30
40
50
60
0 2 4 6 8
10 12 14 16 18 20
2000 2002 2004 2006 2008 2010 2012
Num
ber o
f com
pani
es
Expl
orat
ion
cost
s bi
ll. 2
013-
NO
K
UtilitiesSmall-sized companiesMedium-sized companiesMajorsLarge Norwegian companiesNumber of companies

38 • FACTS 2014
Development and operation
The authorities have set up a framework for development and operation that aims to ensure sound, long-term management of the petroleum resources, while also safeguarding other public considerations. Long-term, comprehensive and effective solutions must be in focus from field development to decommissioning.
In 2013, the authorities approved the Plans for Development and Operation (PDOs) for the Gina Krog, Ivar Aasen, Aasta Hansteen and Oseberg Delta 2 fields. The Plan for Installation and Operation (PIO) of the Polarled gas pipeline was approved alongside Aasta Hansteen. The development plan for Flyndre has been submitted to the autho-rities for approval. Submissions of development plans for e.g. Zidane and Maria are also expected in 2014.
Efficient production of petroleum resources
In consideration of the public interest associated with development and operation of oil and gas fields, the authorities have established a framework for these activities. The authorities have created a model characterised by both competition and cooperation between the players. The objective is to create a climate for good decisions that benefit society at large, as well as the companies. See Chapter 3 for more information regarding organisation and framework.
Good resource utilisation in the familiar areas is important. This constitutes a significant potential that can generate substantial value for society if exploited prudently. The Norwegian Petroleum Directorate has assessed this potential and set an objective of reserve growth amounting to 800 million Sm³ of oil in the ten years leading up to 2015. Reserve growth as of 31 December 2013 was 638 million Sm3 of oil. This corresponds to about double the original oil resources in the entire Gullfaks field. This is a stretch goal for the industry and for the authorities.
Figure 4.7 shows the annual growth in oil reserves from 1993 to 2013. The 2013 accounts showed a growth of 155 million Sm³ of oil, recorded as new reserves. The largest increase in oil reserves comes from the Ekofisk, Troll and Gullfaks Sør fields and from the fact that development decisions have been made for resources in the Edvard Grieg, Martin Linge, Gina Krog and Ivar Aasen fields, which have thus matured from resources to reserves.
Figure 4.5 Resource growth. (Source: The Norwegian Petroleum Directorate)
Figure 4.7 Gross reserve growth, oil 1983–2013 (Source: The Norwegian Petroleum Directorate)
Figure 4.6 Rising oil prices and a broader composition of companies have contributed to high exploration activity. (Source: The Norwegian Petroleum Directorate)
0
10
20
30
40
50
60
70
80
0 50
100 150 200 250 300 350 400 450 500
2000 2002 2004 2006 2008 2010 2012
Num
ber o
f wel
ls
Mill
. Sm
³ o.e
. The Barents Sea project 1997
APA awards (including North Sea rounds)Numbered rounds Completed exploration wells
-50
0
50
100
150
200
250
300
350
400
1993 1997 2001 2005 2009 2013
Mill
. Sm
³
0
10
20
30
40
50
60
70
0
20
40
60
80
100
120
140
160
Jan. 00 Jan. 02 Jan. 04 Jan. 06 Jan. 08 Jan. 10 Jan. 12
Num
ber o
f exp
lora
tion
wel
ls /
Num
ber o
f pla
yers
Oil
pric
e (U
SD/b
arre
l)
Oil priceNumber of players on the shelfSpudded exploration wells
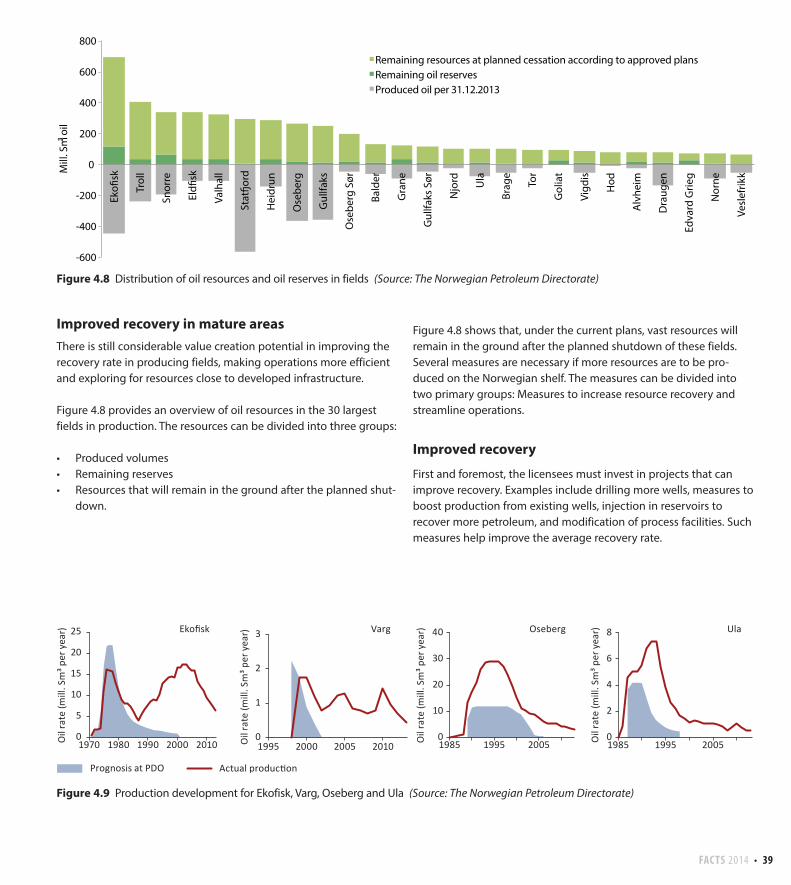
FACTS 2014 • 3938 • FACTS 2014
Improved recovery in mature areasThere is still considerable value creation potential in improving the recovery rate in producing fields, making operations more efficient and exploring for resources close to developed infrastructure.
Figure 4.8 provides an overview of oil resources in the 30 largest fields in production. The resources can be divided into three groups:
• Produced volumes• Remaining reserves• Resources that will remain in the ground after the planned shut-
down.
Figure 4.8 shows that, under the current plans, vast resources will remain in the ground after the planned shutdown of these fields. Several measures are necessary if more resources are to be pro-duced on the Norwegian shelf. The measures can be divided into two primary groups: Measures to increase resource recovery and streamline operations.
Improved recovery
First and foremost, the licensees must invest in projects that can improve recovery. Examples include drilling more wells, measures to boost production from existing wells, injection in reservoirs to recover more petroleum, and modification of process facilities. Such measures help improve the average recovery rate.
Figure 4.8 Distribution of oil resources and oil reserves in fields (Source: The Norwegian Petroleum Directorate)
-600
-400
-200
0
200
400
600
800
Eko�
sk
Trol
l
Snor
re
Eld�
sk
Valh
all
Stat
�ord
Hei
drun
Ose
berg
Gul
lfaks
Ose
berg
Sør
Bald
er
Gra
ne
Gul
lfaks
Sør
Njo
rd
Ula
Brag
e
Tor
Gol
iat
Vigd
is
Hod
Alv
heim
Dra
ugen
Edva
rd G
rieg
Nor
ne
Vesl
efrik
k Mill
. Sm³
oil
Remaining resources at planned cessation according to approved plansRemaining oil reservesProduced oil per 31.12.2013
Figure 4.9 Production development for Ekofisk, Varg, Oseberg and Ula (Source: The Norwegian Petroleum Directorate)
0
5
10
15
20
25
1970 1980 1990 2000 2010
Ekofisk Varg Oseberg Ula
0
1
2
3
1995 2000 2005 20100
10
20
30
40
1985 1995 20050
2
4
6
8
1985 1995 2005Oil
rate
(mill
. Sm
³ per
yea
r)
Oil
rate
(mill
. Sm
³ per
yea
r)
Oil
rate
(mill
. Sm
³ per
yea
r)
Oil
rate
(mill
. Sm
³ per
yea
r)
Prognosis at PDO Actual production

40 • FACTS 2014
There are significant differences in recovery rates between fields, which is partly due to geological conditions. Nevertheless, it may be interesting to examine the development of average recovery rates for all fields. In 1995, the expected average oil recovery rate for fields in production was about 40 per cent. Today, the correspon-ding rate is 46 per cent. The average recovery rate is expected to increase in the years to come. Development and application of new technology has been, and continues to be, highly important in order to improve recovery. Since many fields on the Norwegian shelf are in tail-end production, substantial benefits can be gained from improving recovery and extending operation from these fields. The actual production from fields such as Ekofisk, Varg, Oseberg and Ula has deviated significantly from what was assumed in the origi-nal development plans, see figure 4.9.
Longer lifetimes are a good thing: They allow us to produce more and implement improved recovery measures. It also entails that the infrastructure will remain in place for a longer period of time. This improves the likelihood of other discoveries being tied in to this infrastructure, thus extending field lifetimes beyond what was previ-ously assumed, see figure 4.10.
Improved oil recovery is defined as any increase in oil reserves com-pared with a reference point. The reference point will normally be the Plan for Development and Operation (PDO).
There are significant variations in reservoir and technical solutions between different oil fields. The chosen development solutions will determine which improved recovery measures are feasible at a later date. On certain oil fields, the chosen development solutions provide significant flexibility as regards implementing new improved reco-very measures, whereas other fields have chosen development solu-tions that make increasing recovery at a later date more expensive.
Fact box 4.1 IOR/EORMeasures to boost oil recovery are defined as any increase in oil reserves in relation to a reference point. The reference point will normally be the Plan for Development and Operation (PDO). These oil volumes have already been discovered, but need to mature e.g. through technology development, in order to be recovered. About half of the remaining oil resources that will be left in the reservoirs under current adopted plans consist of mobile oil. The rest is immobile oil that requires advanced floo-ding techniques to be recovered.
Measures to boost recovery are defined as Improved Oil Reco-very (IOR) and Enhanced Oil Recovery (EOR). IOR entails conven-tional and mechanical recovery methods aimed at the mobile oil, and is often called production optimisation. On the Norwegian shelf, the drilling of additional, more advanced wells has been the primary IOR measure.
EOR includes advanced flooding techniques where the proper-ties of existing or new injection fluids are altered. The surface tension between oil and water or the reservoir’s wettability properties can be altered in order to recover the immobile oil. Examples of such injection fluids include water with reduced salinity, CO2 and surfactants. Other chemical changes to the injection fluid, such as the addition of polymers, may help recover mobile oil that has not been exposed to injection.
1980 1990 2000 2010 2020 2030 2040 2050 2060
Brage
Draugen
Eko�sk
Gullfaks
Stat�ord
Varg
Veslefrikk
Latest year of reported production as of 2013Latest year of reported production as of 2002Latest year of reported production as of 1992-1995
Figure 4.10 Lifetime for selected fields (Source: The Norwegian Petroleum Directorate)
Efficient operationsThe most important factor for extending the useful life of a field is production profitable. Efficient operations help reduce and control production costs. Efficient operations also enable profitable pro-duction over a longer period of time. Maximum operations efficiency can make production of additional resources profitable. Many fields are in a situation where cost levels must be reduced in order to justify profitable operations and value creation. In spite of the high oil price in recent years, costs have also increased on the Norwegian shelf, leading the companies to focus intently on efficient operations. Effici-ent operations are also crucial for reducing emissions and discharges from activities on the Norwegian continental shelf.
New discoveries – efficient utilisation of infrastructure
Approximately NOK 173 billion was invested on the Norwegian con-tinental shelf in 2013, excluding exploration. Overall, more than NOK 2 600 billion in current NOK has been invested on the Nor-wegian shelf. These investments have led to the establishment of considerable infrastructure. This infrastructure makes it possible to

FACTS 2014 • 4140 • FACTS 2014
Right: The processing plant on the Skarv FPSO. The Skarv field off the coast of Helgeland came into production at the end of 2012 (Photo: BP)
Below: The jacket for the Edvard Grieg platform under construction at Kværner Verdal (Photo: Lundin)

42 • FACTS 2014
produce and transport petroleum, and also lays the foundation for developing additional resources in a cost-effective manner.
Declining production from a field will release infrastructure capacity. Such capacity can provide efficient exploitation of resources that can be tied into this infrastructure. In certain instances, the use of existing infrastructure is a precondition for profitable development and the production of new, smaller deposits. Exploration for and development of resources in the vicinity of existing infrastructure can generate significant value for the Norwegian society. The autho-rities encourage the players to collaborate, and e.g. follow the efforts of cooperation forums such as area forums, which are active in specific areas of the Norwegian shelf.
In 2005 effort to contribute to efficient use of existing infrastructure, including existing platforms and pipelines, the Ministry of Petro-leum and Energy drew up Regulations relating to the use of facilities by others, effective as of 2006. The objective of the Regulations is to ensure efficient use of infrastructure and thus provide licensees with incentives to carry out exploration and production activities. The objective is met by providing a framework for the negotiation process and formulating tariffs and general terms in agreements regarding the use of facilities by others. The Regulations entail no changes to the principle that commercial players must negotiate good solutions.
Decommissioning after production ends
The petroleum activities merely borrow the ocean, and all phases of the oil and gas activities must consider the environment and other users of the ocean. The point of departure is that the activities cease, the facilities must be removed and the area cleared.
When the authorities make decisions regarding how a facility on the Norwegian continental shelf shall be disposed of, both national and international regulations are applied. Reference is made to Chapter 3, Framework and organisation, for more details concerning the rules for disposal, but please also note in this connection the Petro-leum Act’s requirement whereby licensees, as a main rule, must present a cessation plan to the Ministry between two and five years before the licence expires or is relinquished, or the use of a facility ends.
So far, the Ministry of Petroleum and Energy has processed a few dozen cessation plans. In most instances, the final decision has been to remove disused facilities and transport them to land, with exam-ples of such facilities including Odin, Nordøst Frigg, Øst Frigg, Lille Frigg and Frøy. During processing of the cessation plans for Ekofisk I and Frigg, permission was given to leave the concrete substructure and protective wall on the Ekofisk tank in place, as well as the TCP2 concrete substructure on the Frigg field.
New discoveries and improved recovery measures have led to extended lifetimes for multiple fields, such as Statfjord A and Varg, thus postponing the submission of cessation plans.
The energy market
Secure access to energy is important to all countries. Increased use of energy can reduce the need for low-productive manual labour, freeing up labour resources for more productive activities. The correlation between energy consumption and GDP growth is therefore strong, particularly for emerging economies. Oil and gas are two of the most important commodities in the world and increased demand in Asia and increased supply from North America will lead to changes in future global trading patterns.
The most important drivers of increased energy consumption are population growth and economic growth. In the time ahead, the growth in demand will generally originate from countries outside the OECD. Emerging economies will account for about 90 per cent of the increase leading up to 2035, and economic growth in China is currently the primary engine. India is likely to take over China’s role in the future. Asia’s net import of oil and gas in 2012 is shown in figure 4.11.
Looking at the consumption of energy by source in 2012, oil accounts for the majority, followed by coal and gas. Overall, com-mercially traded fossil fuel sources cover about 87 per cent of global demand. Renewable energy shows strong growth, but from a low level. Demand for coal has substantially risen in recent years.
-1000 -500 0 500 1000
North America
S. & Cent. America
Asia
Middle East
Africa
Europe and Eurasia LiquidsGas
Mill. tonnes o.e
Figure 4.11 Difference between production and consumption for oil and gas by continent, 2012 (Source: BP Statistical Review 2013)

FACTS 2014 • 4342 • FACTS 2014
Price development
Continued growth in demand from Asia has contributed to strong growth in the price of oil and gas. This has been accompanied by a substantial price increase on input factors. Also, when the most accessible resources are produced first, the remaining resources will be more difficult to recover, or they will be located further from existing infrastructure and markets. This often leads to rising pro-duction and transportation costs. In isolation, this contributes to gradually rising prices. Geopolitical factors, such as war and political change, affect production patterns and have had a significant impact on price development in recent years.
The prospect of relatively high oil and gas prices and ever-improving technology lead to the production of resources that were previously not deemed to be commercially viable. Parts of this are unconventio-nal resources that have not previously been profitable to recover. Oil sands in Canada, heavy oil in Venezuela and shale oil and gas in the US are examples of such unconventional resources. Production from these new oil and gas resources will be important on the supply side going forward, although the largest share of production will conti-nue to come from the conventional oil and gas resources.
Economic growth in emerging Asian countries and reduced supply due to political unrest in the Middle East and North Africa in recent years have resulted in historically high prices. Economic growth in Asia, developments in the Middle East and production from new oil and gas resources will continue to be highly important for both supply and demand going forward.
Oil
The transport sector account for more than half of all oil consump-tion, in the form of fuel for motor vehicles. Oil is also used as a raw material in industrial processes and, to a certain extent, in heat and power production. Oil covered approx. 33 per cent of the global energy demand in 2012. Weak economic development in the OECD and high prices have resulted in slow growth in demand in recent years. Daily global consumption was 89.8 Mbbls in 2012. In compari-son, daily oil production on the Norwegian shelf was about 1.9 Mbbls.
The US, China, Japan, India, Russia and Saudi Arabia were the largest oil consumers in 2012, whereas the largest producers were Saudi Arabia, Russia, the US, China, Canada, Iran, the United Arab Emirates, Kuwait and Iraq. Norway was the 15th largest oil producer in 2012.
Much of the remaining oil resources are located in the Middle East. The largest producers in the Middle East, along with a few other producing countries, cooperate within OPEC – Organization of the Petroleum Exporting Countries . By increasing or reducing supply, OPEC member countries attempt to maintain a stable price level that is acceptable to them. The average price of crude oil (Brent blend) in 2012 was USD 111.7, and USD 108.7 per barrel in 2013. These are high levels in a historical perspective.
0
2
4
6
8
10
12
14
0
20
40
60
80
100
120
1985 1990 1995 2000 2005 2010
USD
/bb
l (Br
ent)
Oil Gas
USD
/mill
. Btu
(Ger
man
imp
. pric
es)
30%
33%
24%
4%
7%
2%
Coal
Oil
Natural gas
Nuclear
Hydro
Other renewables
Figure 4.12 World primary energy demand by commercially traded fuel, 2012 (Source: BP Statistical Review 2013)
Figure 4.13 Historical oil and gas prices (1985–2012) (Source: BP Statistical Review 2013)

44 • FACTS 2014
Natural gas
Natural gas accounts for about 24 per cent of the world’s total energy demand. Natural gas is generally used in the household sector for heating and cooking, in industry and for electricity generation. In the electricity generation field, gas primarily competes with coal. The most important markets for natural gas are Europe, Asia and North America. The US and Asia (especially China and Japan) accounted for the largest consumption growth in 2012. The largest producers are the US, Russia, Iran, Qatar, Canada and Norway, while the largest con-sumers are the US, Russia, Iran, China, Japan and Saudi Arabia.
Gas transport takes place either via pipeline or by ship, where the gas is pressurised and cooled to increase the amount of energy per transported volume unit. This is called LNG (liquefied natural gas). Transporting LNG is energy-intensive and expensive. Gas markets
Figure 4.15 Production and consumption by country, 2012 (Source: BP Statistical Review 2013)
0 100 200 300 400 500 600
547.0 526.2
394.9 207.5
182.6 174.9
154.1 152.5 152.4
143.9 87.5
Saudi Arabia Russian Federation
US China
Canada Iran
United Arab Emirates Kuwait
Iraq Mexico Norway
Mill. tonnes o.e
Oil production
0 100 200 300 400 500 600 700 800 900
819.9 483.7
218.2 171.6
147.5 129.7 125.6 111.5 108.8 104.3
10.8
US China Japan India
Russian Federation Saudi Arabia
Brazil Germany
South Korea Canada Norway
Mill. tonnes o.e
Oil consumption
0 100 200 300 400 500 600 700
619.2 533.0
144.5 141.3 140.9
103.4 96.5 92.5
73.4 64.0 58.7
USRussian Federation
IranQatar
CanadaNorway
ChinaSaudi Arabia
AlgeriaIndonesia
Malaysia
Mill. tonn o.e
Gas production
0 100 200 300 400 500 600 700
654.0 374.6
140.5 129.5
105.1 92.5 90.6
75.3 70.5 67.7
3.9
US Russian Federation
Iran China Japan
Saudi Arabia Canada Mexico
United Kingdom Germany Norway
Mill. tonnes o.e
Gas consumption
Figure 4.14 Proven oil and gas reserves by country, 2012 (Source: BP Statistical Review 2013)
0 10 20 30 40 50 60
VenezuelaIran
Saudi ArabiaRussian Federation
CanadaIraq
United Arab EmiratesKuwait
USNigeria
LibyaNorway Gas Oil
Bill. tonnes o.e

FACTS 2014 • 4544 • FACTS 2014
have therefore had a more regional character, as opposed to the oil market, which is an effective global market. Various players attempt to exploit price differences between regional markets through large investments in transport capacity, either in pipelines or the LNG chain. This makes the markets more integrated.
Increased demand from Asia, the supply of unconventional gas from the US, transport capacity for LNG and the gas price relative to coal are the most important factors that will impact the gas market in the years to come.
Gas exports from the Norwegian shelf
Norway is the third largest gas exporter in the world. Nearly all Norwegian gas is sold on the European market. A well-developed and efficient gas infrastructure and short transport distances make Norwegian gas competitive in the European market.
Gas production has increased in recent years, and therefore accounts for a larger share of petroleum production than before. Norwegian gas is exported to all the major consumer countries in Western Europe and is important for Europe’s energy supply. Gas exports in 2013 totalled approx. 107 BCM (bill. Sm3). Of this, 103 BCM was transported via pipelines and 4 BCM as LNG from the Snøhvit facility. In addition, about 1.5 BCM was delivered for domes-tic consumption. Some of the produced gas is reinjected; last year this accounted for about 30 BCM. The energy content of the gas production is about ten times the Norwegian normal production of electricity and covers about 20 per cent of European gas consump-tion. Most of the exports go to Germany, the UK, Belgium and France, where Norwegian gas accounts for between 20 and 40 per cent of total gas consumption.
All licensees on the Norwegian continental shelf are responsible for selling their own gas. Statoil sells oil and gas owned by the State, along with its own petroleum, in accordance with special instructions. Overall, Statoil sells about 80 per cent of all Norwegian gas. Upstream companies on the Norwegian Continental Shelf sell gas to buyers in e.g. Germany, France, the UK, Belgium, the Nether-lands, Italy, Spain and Denmark. The Snøhvit facility primarily deli-vers LNG to countries in Europe and Asia. Figure 4.16 shows histori-cal and forecast Norwegian gas sales. Gas sales are expected to reach a level between 105 and 130 billion Sm3 in 2020, and between 80 and 120 billion Sm3 in 2025.
Major investments in transport solutions are characteristic of gas production. The Norwegian pipeline system currently has a trans-port capacity of about 120 billion Sm3 per year. Three onshore gas facilities are integrated into the pipeline system - Kårstø, Kollsnes and Nyhamna – which receive rich gas from the fields. Dry gas is separated from the rich gas for further transport via pipeline to the receiving terminals. There are four receiving terminals for Nor-wegian gas on the Continent; two in Germany, one in Belgium and one in France. In addition, there are two receiving terminals in the UK. The Norwegian gas transport system includes a network of pipelines with a total length of more than 8000 km. This roughly corresponds to the distance from Oslo to Beijing. Treaties have been drawn up that govern rights and obligations between Norway and countries with landing points for gas from the Norwegian shelf. More detailed information on pipelines and onshore facilities can be found in Appendix 3.
FranceDunkerque
Terminal14.4 %
United KingdomEasington
Terminal15.7 %
United KingdomOther terminalars
11.5 %GermanyEuropipe 1 Terminal16.8 %
GermanyEuropipe 2 Terminal18.5 %
GermanyNorsea Gas Terminal5.5 %
DenmarkNybro0.4 %
BelgiumZeebrugge Terminal13.2 %
LNG4.0 %
0
40
80
120
202519951985 2005 2015
Sale
s gas
, bill
. Sm
3
Figure 4.16 Sales gas from Norwegian fields (Source: The Ministry of Petroleum and Energy / The Norwegian Petroleum Directorate)
Figure 4.17 Norwegian natural gas exports in 2013 by delivery point (Source: Gassco / The Norwegian Petroleum Directorate)
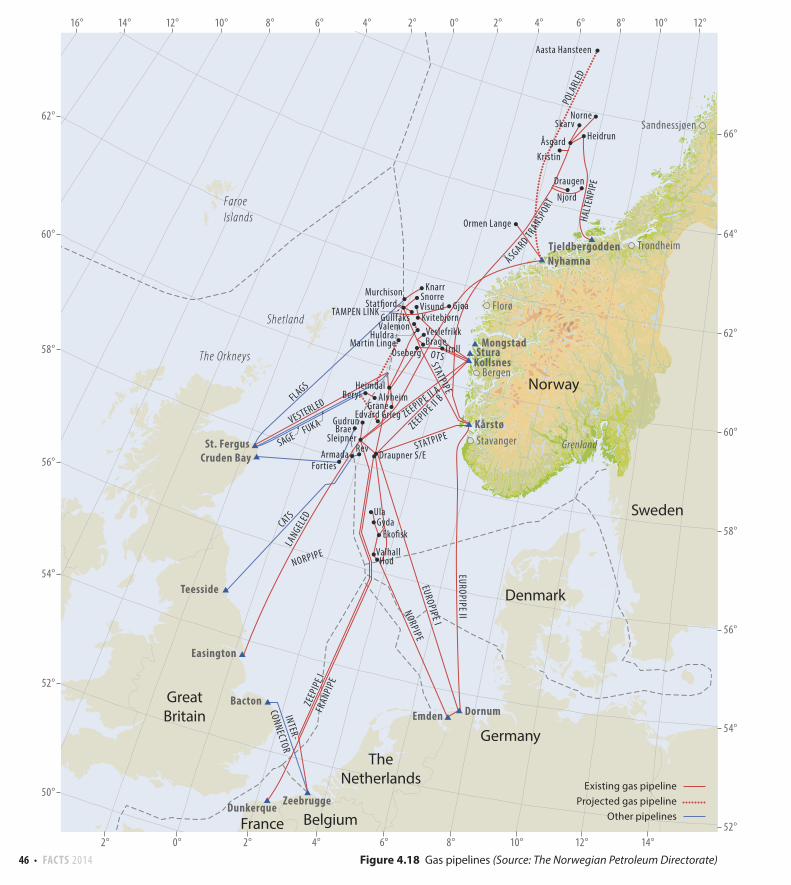
46 • FACTS 2014
GjøaMurchison Snorre
Kvitebjørn
OsebergBrage
Troll
Heimdal
Grane
BraeGudrun
Edvard Grieg
Sleipner
Armada Draupner S/EForties
Rev
UlaGyda
Eko�sk
ValhallHod
EUROPIPE ll
EUROPIPE l
NORPIPE
STATPIPE
STATPIPEOTS
HALT
ENPI
PE
ZEEPIPE ll B
ZEEPIPE ll A
FRAN
PIPE
ZEEP
IPE l
Veslefrikk
Stat�ordGullfaks
Visund
Knarr
Draugen
Njord
KristinÅsgard Heidrun
Norne
Aasta Hansteen
Martin Linge
Beryl Alvheim
Kårstø
KollsnesStura
Mongstad
Tjeldbergodden
St. FergusCruden Bay
Teesside
Bacton
Dunkerque Zeebrugge
Shetland
Stavanger
Bergen
Florø
Trondheim
Sandnessjøen
Ormen Lange
Nyhamna
LANGEL
ED
NORPIPE
CATS
Easington
Emden Dornum
TAMPEN LINK
FLAGS
POLA
RLED
VESTERLED
SAGE FUKA
INTER-
CONNECTOR
Skarv
Grenland
HuldraValemon
ÅSGARD TRANSPORT
12°14°16° 10° 8° 6° 4° 2° 0° 2° 4° 6° 12°10°8°
2° 0° 2° 4° 6° 8° 10° 12° 14°
60°
58°
56°
54°
52°
50°
62°
66°
64°
62°
60°
58°
56°
54°
52°
GreatBritain
TheNetherlands
Germany
Denmark
Sweden
Norway
The Orkneys
FaroeIslands
Existing gas pipelineProjected gas pipeline
Other pipelinesFrance Belgium
Figure 4.18 Gas pipelines (Source: The Norwegian Petroleum Directorate)

FACTS 2014 • 4746 • FACTS 2014
Organisation of the gas transport system
The authorities’ paramount goal is to achieve the greatest possible value for the Norwegian petroleum resources. Most fields contain both oil and gas, and securing an optimal balance between oil and gas production is key. The authorities take oil recovery into account when awarding gas production permits. The authorities play an important role to ensure that processing and transport capacities are adjusted to future needs. At the same time, it is important to ensure efficient operations in the Norwegian gas transport system. The authorities’ toolbox in this regard includes the operating company Gassco, the joint ownership of the Gassled system and regulated access to the transport system.
Gassco Gassco AS was established in 2001, and is wholly owned by the State. Gassco is a neutral and independent operator of the gas transport system and has both special and normal operatorship. The special operatorship is regulated through the Petroleum Act and regulations, and includes tasks such as developing new infra-structure, managing the gas transport system’s capacity and coor-dinating and managing the gas streams through the pipeline network and to the markets. Normal operatorship means carrying out facility management in pursuance of the Petroleum Act and the health, safety and environment (HSE) legislation. This activity is also regulated in the operator agreement with Gassled. Gassco’s role as the neutral and independent operator of the gas transport system is important in order to ensure that all users are treated equally.
Gassco studies transport solutions, and advises the authorities. Gassco shall contribute to a comprehensive further development of Norwegian gas infrastructure. In instances where major develop-ments are considered, this entails that other Norwegian gas beyond fields that trigger a gas transport need, must also be included in the assessments. Further development of the gas infrastructure must take place in a manner that is beneficial for the existing gas infra-structure.
GassledGassled is a joint venture that owns the majority of the gas infra-structure on the Norwegian continental shelf; pipelines, platforms, onshore process facilities and receiving terminals abroad. The infra-structure is used by anyone with a need to transport Norwegian gas. Gassled’s activities are regulated by the Petroleum Regulations and tariffs for the individual services are stipulated by the Ministry of Petroleum and Energy. The company has no employees, and is organised through various committees with specific tasks.
At year-end 2013, Gassled was owned by the following companies: Petoro AS, Solveig Gas Norway AS, Njord Gas Infrastructure AS, Silex
Gas Norway AS, Infragas Norge AS, Statoil Petroleum AS, Norsea Gas AS, ConocoPhillips Skandinavia AS, DONG E&P Norge AS, GDF SUEZ E&P Norge AS and RWE Dea Norge AS.
Regulated access to the transport system
The pipeline system is a natural monopoly, with significant infra-structure investments. This is why access to and tariffs for use of capacity are regulated by the authorities. In an effort to promote sound resource management, the tariffs are set such that returns from oil and gas production are derived from the fields, while at the same time providing reasonable return on investment for the infra-structure owners. The oil companies have access to capacity in the system based on the need for gas transport. To ensure good resource management, transport rights can be transferred between users when capacity needs change.
Joint ownership of the transport system ensures that the gas is transported as efficiently as possible and generates the greatest value creation, in part by avoiding conflicts of interest regarding which pipeline the gas will be transported through. Gassco also ensures efficient transport of gas in day-to-day operation of the faci-lities, as part of the special operator responsibility.
Emissions and discharges from the petroleum activitiesEnvironmental and climate considerations are an integrated part of the Norwegian petroleum activities. A comprehensive set of policy instruments safeguards environmental and climate consi-derations in all phases of the petroleum activities, from licensing rounds to exploration, development, operations and disposal.
Emissions from the petroleum sector are generally exhaust gases from combustion of natural gas in turbines, flaring of natural gas and combustion of diesel (see Figure 4.19). The flue gas contains e.g. CO2 and NOx. Other emissions include nmVOC, methane (CH4) and sulphur dioxide (SO2). Discharges to sea from the petroleum sector contain remnants of oil and chemicals used in the production processes. There are also discharges of drill cuttings with residue of water-based drilling fluids. There is a comprehensive overview of emissions and discharges; all operators on the Norwegian continen-tal shelf report emission and discharge data directly into a dedica-ted database, the so called Environmental Web.
Emissions and discharges to sea from the Norwegian petroleum activities are regulated through several acts, including the Petro-leum Act, the CO2 Tax Act, the Sales Tax Act, the Greenhouse Gas Emission Trading Act and the Pollution Control Act. The onshore petroleum facilities are subject to the same policy instruments as

48 • FACTS 2014
other land-based industry. The processes related to impact assess-ments and approval of new development plans (PDOs/PIOs) are cor-nerstones of the petroleum legislation. Onshore facilities or facilities within the baseline are also subject to the requirements of the Plan-ning and Building Act.
Norway, as one of the first countries in the world, introduced a CO2 tax in 1991. The tax has led to technological development and trig-gered measures that have yielded considerable emission reductions. The stringent restrictions on flaring under the Petroleum Act help keep the general flaring level on the Norwegian shelf low, compa-red with the rest of the world. The activities are also subject to the EU Emissions Trading System (ETS). The authorities and the petro-leum industry have worked together to reach the goal of zero harmful discharges to sea (the zero discharge goal). This goal is con-sidered to have been achieved for added chemicals. As a result of strong policy instruments and joint efforts between authorities and oil companies as regards research, technology and expertise development, the Norwegian petroleum activities main-tain a very high environmental standard compared with petroleum activities in other countries.
Greenhouse gas emissions
Due to the unique composition of the Norwegian economy and the fact that hydropower accounts for nearly all onshore power genera-tion, activities on the continental shelf represent a significant share
of the national greenhouse gas emissions. Petroleum activities accounted for about 26 per cent of greenhouse gas emissions in 2012. Based on updated information, emissions from the petroleum sector are expected to increase leading up to around 2017, and then gradually decline, cf. Figure 4.20. Energy consumption and emissions are closely linked. Developments on the Norwegian continental shelf in recent years have headed towards more mature fields and longer distances for gas transport. Reservoir pressure is also declining in gas fields, which means that more energy is needed.
A number of measures have been implemented in order to reduce emissions. Gas combustion is very low, as the facilities’ energy sup-plies have become more efficient, e.g. through the use of heat reco-very from turbines or combined cycle power solutions. The gas from certain fields contain a large amount of CO2 and the CO2 concentra-tion has to be reduced in order to meet the gas sales requirements on a larger scale. As a consequence, in 1996 Norway was the first country in the world to store large amounts of CO2 in geological formations under the seabed from the Sleipner Vest field. Currently, up to 1.7 million tonnes of CO2 from the Sleipner and Snøhvit fields are stored annually. The use of power from shore can reduce emis-sions on the continental shelf. A number of independent facilities currently receive some or all of their power supply from shore.
The companies operating on the Norwegian shelf are front runners when it comes to utilising environmentally friendly solutions that yield low greenhouse gas emissions. The petroleum activities have been subject to a CO2 tax since 1991. Norway is part of the EU Emis-sions Trading System. The third ETS period runs from 1 January 2013 until 2020. This entails that the companies can benefit greatly from reducing their emissions. Other policy instruments are also used, such as terms in PDOs/PIOs, emission permits and production licen-ces (covering e.g. flaring).
Turbine79,4 %
Engine8,0%
Boiler1,9 %
Flare9,6 %
Well test0,5 %
Other sources0,5 %
Figure 4.19 CO2 emissions from the petroleum activities in 2012 by source (Source: The Norwegian Petroleum Directorate)
0
2
4
6
8
10
12
14
16
1997 1999 2001 2003 2005 2007 2009 2011 2013 2015 2017 2019
Mill
. ton
nes
CO2
Forecast
History
Figure 4.20 CO2 emissions from the Norwegian petroleum sector (Source: The Norwegian Petroleum Directorate)

FACTS 2014 • 4948 • FACTS 2014
Gas flaring is only permitted when necessary for safety reasons. Such flaring must be approved by the Ministry of Petroleum and Energy. Flaring accounted for about 10 per cent of the CO2 emis-sions from the petroleum activities in 2012.
All Plans for Development and Operation of oil and gas fields (PDOs/PIOs) must contain a good and efficient energy solution, including an analysis of power supply from shore. This applies to both new field developments and major modifications on existing facilities.
Other emissions to air
NOx is a term used for a number of nitrogen compounds that contri-bute to acidification. The environmental effects of NOx include harm to fish and wildlife through acidification of river systems and soil, as well as damage to health, crops and buildings due to the formation of ground-level ozone. Under the Gothenburg Protocol, Norway has committed to reducing its NOx emissions.
The emissions of CO2 and NOx are closely related. As for CO2, gas combustion in turbines, flaring of gas and diesel consumption on the facilities are the main emission sources for NOx. The volume of emissions depends both on the combustion technology and how much fuel is used. For example, combustion in gas turbines results in lower emissions of NOx than combustion in diesel engines.
The petroleum activities account for about 30 per cent of Nor-wegian NOx emissions. The sector’s overall NOx emissions have increased from 1991 (see Figure 4.21), but have stabilised since the early 2000s. Emissions from permanent facilities have been reduced in recent years, while emissions from mobile rigs have increased. This is due to increased activity involving mobile facilities, which, in turn, is linked to the fact that several new developments are taking place on the seabed and in deep water.
NOx emissions linked to the operation of facilities on the continental shelf are regulated by conditions in the PDOs/PIOs. Emission permits pursuant to the Pollution Control Act also cover NOx-emis-sions. Finally, NOx-emissions are subject to a tax. As a result of an environmental agreement between the authorities and industry organisations, companies with activities subject to the NOx-tax may choose to contribute to a NOx-fund instead. The NOx-fund contribu-tes to cost effective NOx-emissions reduction measures.
NmVOC is a term used for volatile organic compounds, with the exception of methane, which evaporate from substances such as crude oil. The environmental effects of nmVOC include the forma-tion of ground-level ozone, which can result in health hazards and damage to crops and buildings. NmVOCs can also damage the airways in the event of direct exposure, and contributes indirectly to
the greenhouse effect through formation of CO2 and ozone when nmVOCs react with air in the atmosphere. The emissions of nmVOCs from the petroleum activities mainly originate from storage and loading of crude oil offshore. Minor emissions also occur at the gas terminals.
Norwegian nmVOC emissions in 2012 totalled 132 000 tonnes. These emissions have been more than halved since 1990. The petro-leum sector has traditionally been the primary source of nmVOC emissions; however, the sector has reduced its nmVOC emissions substantially since the early 2000s. The main cause of the decline in emissions is the implementation of emission-reducing technology that recovers the evaporated substances. The prognoses indicate that nmVOC emissions will remain low for years to come (see Figure 4.22).
0
10
20
30
40
50
60
1997 1999 2001 2003 2005 2007 2009 2011 2013 2015 2017 2019
Thou
sand
tonn
es N
Ox
History Forecast
0
100
200
300
1997 1999 2001 2003 2005 2007 2009 2011 2013 2015 2017 2019
Thou
sand
tonn
es n
mVO
C
History
Forecast
Figure 4.21 NOx emissions from the petroleum activities (Source: The Norwegian Petroleum Directorate)
Figure 4.22 NmVOC emissions from the petroleum activities (Source: The Norwegian Petroleum Directorate)

50 • FACTS 2014
The companies must apply for a discharge permit in order to dis-charge chemicals. The Norwegian Environment Agency issues dis-charge permits pursuant to the provisions of the Pollution Control Act.
Most of the chemical discharges are related to drilling activities (see Figure 4.23), and the discharge amounts vary according to the acti-vity level. The chemicals that are not discharged, either dissolve in the oil, are deposited underground or are treated as hazardous waste.
The total discharges of oil from the Norwegian petroleum activities account for a small share of total discharges to the North Sea. The primary discharges of oil to the North Sea are from shipping and from the mainland through rivers. It is assumed that about five per cent of the total discharges of oil to the North Sea are from the Nor-wegian petroleum activities.
In the same manner as for chemicals, companies must apply for a discharge permit to discharge oil. The Norwegian Environment Agency issues discharge permits pursuant to the provisions of the Pollution Control Act. See figure 4.24 regarding the total number of discharges of chemicals for Norwegian petroleum activities.
Operational discharges to sea
Discharges are mainly produced water, drill cuttings and remnants of chemicals and cement from drilling operations. These discharges are deposited in the subsurface or handled as hazardous waste, or treated before they are discharged.
Water produced along with oil and gas contains remnants of oil in droplet form (dispersed oil) and other organic components (inclu-ding loose oil fractions). The produced water is treated before being discharged or reinjected into the subsurface.
Oil and chemical discharges from produced water may have local effects close to the facilities, and are regulated nationally through discharge permits pursuant to the Pollution Control Act. The dischar-ges are also regulated internationally through the Convention for the Protection of the Marine Environment of the North-East Atlantic (the OSPAR Convention). The goal of zero environmentally harmful dis-charges from the petroleum activities was established in 1997. This is considered to have been achieved for added substances.
Chemicals are a collective term for all additives and excipients used in drilling and well operations, and in production of oil and gas. The main rule is that environmentally harmful substances shall not be discharged, regardless of whether they are added or naturally occurring. The contribution from the petroleum sector to the natio-nal discharges is less than three per cent of the environmental toxins on the Norwegian Environment Agency’s priority list.
Drilling and well70.4 %
Production12.1 %
Gas treatment10.0 %
Pipeline2.6 %
Other sources4.9 %
0
50 000
100 000
150 000
200 000
250 000
1990 1992 1994 1996 1998 2000 2002 2004 2006 2008 2010 2012
Tonn
es
Figure 4.23 Chemicals discharged from the Norwegian petroleum activities, by source, 2012 (Source: The Norwegian Petroleum Directorate)
Figure 4.24 Total discharge of chemicals from Norwegian petroleum activities (Source: The Norwegian Petroleum Directorate)

FACTS 2014 • 5150 • FACTS 2014
Fact box 4.2 Oil spill preparedness In Norway, the emergency preparedness against acute pollution is made up of private preparedness, municipal preparedness and State preparedness. The Ministry of Transport and Communica-tions, through the Norwegian Coastal Administration, is respon-sible for coordinating the collective national oil spill prepared-ness, as well as the State’s preparedness against acute pollution. The Ministry of Climate and Environment is responsible for stipu-lating requirements for emergency preparedness against acute pollution in municipal and private enterprises. The Norwegian Environment Agency approves preparedness plans and ensures compliance with the requirements. The oil companies, represented by the operator, are responsi-ble for handling acute incidents resulting from their own activi-ties, with appropriately dimensioned emergency preparedness. The Norwegian Clean Seas Association for Operating Companies (NOFO), which is owned by several companies that are licensees on the Norwegian shelf, has also established regional plans that take into account reinforcement of seagoing emergency prepa-redness and preparedness along the coast and in the beach zone. NOFO administers and maintains preparedness that inclu-des personnel, equipment and vessels. NOFO has five bases along the coast: Stavanger, Mongstad, Kristiansund, Træna and Hammerfest. In addition, some fields have permanently deployed NOFO equipment. NOFO has a total of 16 oil spill response systems and carries out joint exercises every year.
Acute discharges
The petroleum activities have not caused major acute discharges of oil that have led to environmental damage. In the 40 years of Nor-wegian petroleum production, discharges from the activities have never reached shore. In 2012, the total acute oil discharges to sea amounted to 16.3 m3.
Pursuant to the Pollution Control Act, the operators themselves are responsible for, and have a duty to establish, necessary emergency preparedness to respond to acute pollution. This is in addition to municipal and State emergency preparedness. All acute discharges from facilities on the continental shelf are reported to the Nor-wegian Coastal Administration, and the causes are investigated.
Acute oil discharges can harm fish, sea mammals, seabirds and beach zones. In Norway, the most serious acute discharges are from ships along the coast.

52 • FACTS 2014

FACTS 2014 • 53PB • FACTS 2014
THE SERvICE ANd SUPPLy INdUSTRy
The topside for the Gudrun field, ready for sail away from Aibel’s yard in Haugesund, July 2013 (Photo: Harald Nordbakken/Haugesunds Avis)
5
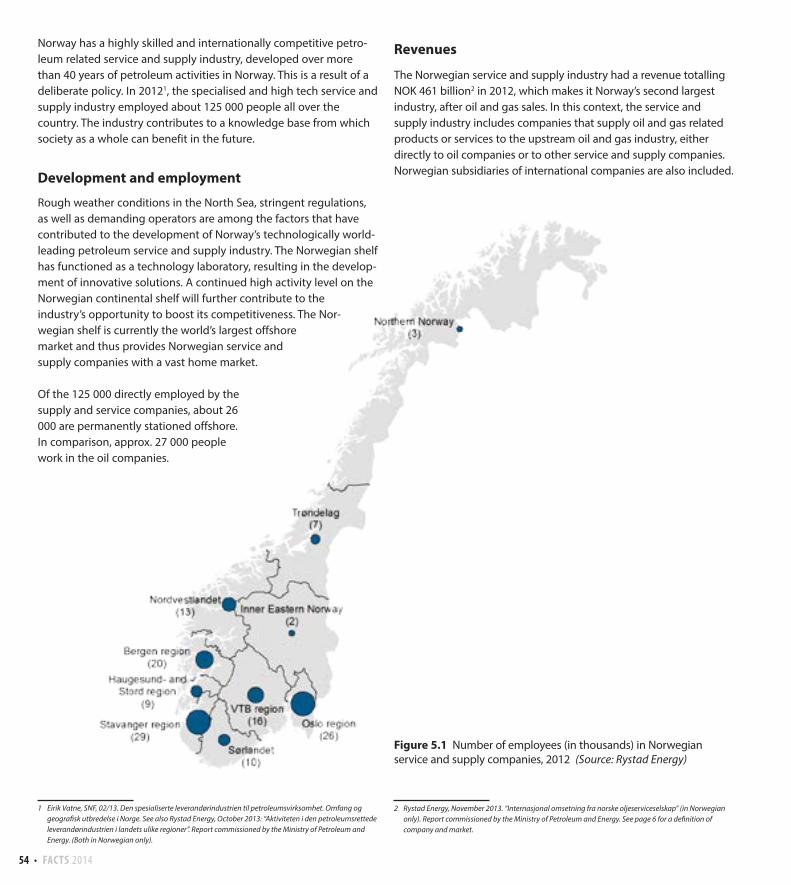
54 • FACTS 2014
Norway has a highly skilled and internationally competitive petro-leum related service and supply industry, developed over more than 40 years of petroleum activities in Norway. This is a result of a deliberate policy. In 20121, the specialised and high tech service and supply industry employed about 125 000 people all over the country. The industry contributes to a knowledge base from which society as a whole can benefit in the future.
Development and employment
Rough weather conditions in the North Sea, stringent regulations, as well as demanding operators are among the factors that have contributed to the development of Norway’s technologically world-leading petroleum service and supply industry. The Norwegian shelf has functioned as a technology laboratory, resulting in the develop-ment of innovative solutions. A continued high activity level on the Norwegian continental shelf will further contribute to the industry’s opportunity to boost its competitiveness. The Nor-wegian shelf is currently the world’s largest offshore market and thus provides Norwegian service and supply companies with a vast home market.
Of the 125 000 directly employed by the supply and service companies, about 26 000 are permanently stationed offshore. In comparison, approx. 27 000 people work in the oil companies.
1 Eirik Vatne, SNF, 02/13. Den spesialiserte leverandørindustrien til petroleumsvirksomhet. Omfang og geografisk utbredelse i Norge. See also Rystad Energy, October 2013: “Aktiviteten i den petroleumsrettede leverandørindustrien i landets ulike regioner”. Report commissioned by the Ministry of Petroleum and Energy. (Both in Norwegian only).
Revenues
The Norwegian service and supply industry had a revenue totalling NOK 461 billion2 in 2012, which makes it Norway’s second largest industry, after oil and gas sales. In this context, the service and supply industry includes companies that supply oil and gas related products or services to the upstream oil and gas industry, either directly to oil companies or to other service and supply companies. Norwegian subsidiaries of international companies are also included.
2 Rystad Energy, November 2013. “Internasjonal omsetning fra norske oljeserviceselskap” (in Norwegian only). Report commissioned by the Ministry of Petroleum and Energy. See page 6 for a definition of company and market.
Figure 5.1 Number of employees (in thousands) in Norwegian service and supply companies, 2012 (Source: Rystad Energy)

FACTS 2014 • 5554 • FACTS 2014
Deliveries throughout the value chain
The service and supply industry currently consists of more than 1300 companies across the entire value chain: From seismic and drilling rig equipment, through valves, nuts and hoses for the shipyard industry, to advanced offshore supply and service vessels and subsea techno-logy, cf. Figure 5.2.
The service and supply industry is present in virtually all parts of the country. In many ways, the Stavanger region is a reflection of Norway as a whole: This region employs the most people within oil and gas and represents a broad range of products and services for upstream activity. In other parts of the country, there are multiple companies within limited geographic areas and within the same segment. In the Oslo area, we find a cluster of seismic companies, in addition to a well-established engineering environment. Trondheim is a powerhouse as regards research and education, while the
Bergen region has become a centre for maintenance of platforms and subsea equipment.
Some geographic clusters have also been formalised through Innova-tion Norway’s cluster programme “Norwegian Centres of Expertise” (NCE): • NCE Systems Engineering in Kongsberg and NCE Subsea in
Bergen, which are both focused on the subsea segment. • NCE NODE in Southern Norway, which is a world leader in dril-
ling technology, was built on the foundation of expertise from ship cranes and hydraulics and has developed over decades.
• NCE Maritime in Møre og Romsdal County, which represents a complete shipbuilding and outfitting network for e.g. advanced offshore vessels.
Figure 5.2 The diversity of the Norwegian service and supply industry: Outline of a field in development and operation

56 • FACTS 2014
International success
About 40 per cent of the NOK 461 billion of revenues in the Nor-wegian service and supply industry originates in international markets, i.e. about NOK 186 billion. International revenues have grown by about 11 per cent annually since 2006. The rig and drilling services segment accounts for the largest share of international revenue. The topside and process equipment segment is a close second, followed by subsea equipment and installation.
The five most important markets in 2012 were South Korea, the UK, Brazil, the US and Singapore, cf. Figure 5.3. The 20 largest companies had international revenues totalling slightly more than NOK 143 billion in 2012; in other words, about three-quarters of the internati-onal revenues of all Norwegian service and supply companies. In
comparison, these 20 companies had revenues of about NOK 69 billion in Norway in 2012. In other words, 68 per cent of their revenues originate from international activities. The remaining com-panies’ Norwegian revenues totalled NOK 206 billion and their inter-national revenues therefore amount to 17 per cent.
In 1997 the government and the industry established INTSOK with the aim to promote Norwegian oil and gas industry in overseas markets.
Overall, the petroleum resources on the Norwegian Continental Shelf have laid the foundation for a highly competent and internationally competitive oil and gas supply and service industry. It is a great nati-onal advantage having such an outstanding, world class industry.
Figure 5.3 International revenues in 2012, 30 largest countries (Source: Rystad Energy)
0 5 10 15 20 25 30 35
South-KoreaThe United Kingdom
BrazilThe U.S.A.
Singapore Australia
ChinaAngola Nigeria
RussiaArgentina
FranceMalaysia
Mexico Ghana
Indonesia Thailand
India Denmark
Canada Vietnam Tanzania
Ivory CoastMozambiqueSaudi-Arabia
The NetherlandsArctic Sea
The Falkland islandsKazakhstan
Brunei
Bill. NOK
Fact box 5.1
South Korea, not considered a typical petroleum province, is the most important market, measured in revenues. This is due to Norwegian deliveries primarily consisting of platform decks and process equipment, including drilling packages, to Korean ship-yards.
Revenues in the UK are distributed across a larger range of the product segment, while Brazil is characterised by high revenues in relatively few segments: Rig and drilling services, transport and logistics (primarily vessel hire) and subsea equipment and installation.

FACTS 2014 • 57PB • FACTS 2014
THE fUTURE PETROLEUM INdUSTRy
Installation of subsea compression equipment on the Åsgard field in the Norwegian Sea. This is innovative technology that will contribute to a substantial increase in gas and condensate production from the field
(Photo: Øyvind Hagen, Statoil)
6

58 • FACTS 2014
With the prospect of rigorous activity on the Norwegian shelf, the petroleum industry will remain Norway’s largest and most impor-tant industry for years to come. Only 44 per cent of the projected total recoverable resources on the Norwegian continental shelf have been extracted. Development of the remaining resources will gene-rate substantial values in Norway. Continuous focus on know-how and technology will be key success criteria in these efforts. This chapter describes the significance of research and development, and the prospects for the Norway petroleum activities.
R&D in the oil and gas industry
Knowledge and technology are cornerstones in the management of Norway’s petroleum resources. Since the start of the petroleum activities, R&D, development and operations have been the primary tools used to find good solutions. Today, the Norwegian petroleum sector is founded on broad technical expertise, sub-stantial implementation of new technology, and is capable of handling large, complex challenges. Continued research and development is necessary in order to maintain and develop this expertise, and the Ministry stimulates this effort through research programmes and strategy networks.
New technology has played an important role in achieving an optimal and environmentally friendly recovery of the resources on the Norwegian continental shelf. Favourable framework conditions provided by the authorities have given the companies incentives to carry out research and technology development. Close collabora-tion between oil companies, the suppliers and research institutions has been a precondition for this development. Technology develo-ped on the Norwegian shelf has also given the Norwegian supplier industry a competitive advantage on the global stage.
The Norwegian shelf is facing several new challenges. There are fewer large discoveries and developments than before. It is more demanding to produce the fields’ remaining resources than it was to recover the resources that have already been produced. It is thus more difficult for individual projects to finance technological deve-lopment. A continued focus on research and development is needed from the players on the Norwegian shelf and the State as resource owner. Figure 7a.1 shows how the Ministry is involved in Norwegian petroleum research.
The Ministry of Petroleum and Energy established the strategy “Oil and Gas in the 21st Century” (OG21) in 2001 in an effort to resolve the challenges associated with efficient and prudent petroleum activities. OG21 has helped oil companies, universities, research institutions, the supplier industry and the authorities agree on a joint national technology strategy for oil and gas, cf. www.OG21.no. The strategy has been revised several times, most recently in 2012.
The State provides its incentives for research and technological development mainly through the regulatory framework and direct allocations to the Research Council of Norway. The allocations to the Research Council are mainly directed at the research programmes PETROMAKS 2 and DEMO 2000. These programmes and the two centres will contribute towards reaching the goals established through the OG21 strategy.
PETROMAKS 2
PETROMAKS 2 funds a broad range of projects, from basic research at universities to innovation projects in the industry. PETROMAKS 2 has comprehensive responsibility for research that leads to the best possible management of Norwegian petroleum resources and agile business development in the sector. At the start of 2014, there were 167 projects in the programme’s portfolio. The programme also funds a number of engineering projects carried out by small and medium-sized businesses in order to stimulate more innovation in the supplier industry. The programme has an annual budget of approx. NOK 260 million. PETROMAKS 2 is an important policy instrument used to promote long-term research and expertise deve-lopment, and with considerable focus on education in the pro-gramme period, e.g. by funding PhDs. The programme has a broad international interface, including North America, Russia and Brazil.
DEMO 2000
DEMO 2000 is an important policy instrument for testing new tech-nology solutions in the petroleum industry. The purpose of the pro-gramme is to reduce costs and risk for the industry by supporting pilot projects and demonstrations. DEMO 2000 functions as a colla-borative arena between the oil and supplier companies, and is parti-cularly important for the suppliers. The programme is open to all
PETROMAKS 2 DEMO 2000 Petrosenter
Figure 6.1 The Ministry of Petroleum and Energy’s involvement in petroleum research (Source: Research Council of Norway)

FACTS 2014 • 5958 • FACTS 2014
Norwegian businesses that supply technology to oil companies on the Norwegian shelf. The programme has two annual awards and funds projects that satisfy the requirements in the technology stra-tegy laid out by OG21. The annual project funding totals approx. NOK 60 million and accounts for 25 per cent of the projects’ total costs. At the start of 2014, the portfolio included 43 active projects.
PETROSENTER - Petroleum research centres
A research and expertise centre focusing on Arctic challenges was established at the University of Tromsø in 2013. The objective of this establishment was to build a high-quality research environment that is relevant for the oil industry in Northern Norway and the High North. The centre is funded by the Ministry of Petroleum and Energy and the Ministry of Foreign Affairs.
A research centre for improved recovery has also been established at the University of Stavanger. The new centre will contribute to industry-relevant research, researcher training and long-term exper-tise development for improved recovery on the Norwegian shelf. It will also facilitate cooperation between the industry and research communities in order to quickly apply new solutions. Improvement of existing and development of new recovery methodologies are key focus areas.
These centres will be in full operation for up to eight years, starting in 2014, and will be subject to evaluation after five years.
Other research programmes
Several other petroleum-relevant research programs receive public support. ProofNy, a sub-program under the Ocean and Coast, targets research on the long-term effects on the ocean as a result of the petroleum activities. PETROSAM 2 supports petroleum research within the social sciences. The Research Council of Norway has also established several Centres of Excellence (SFFs) and Centres for Research-driven Innovation (SFIs). Several of these centres are rele-vant for the petroleum industry, such as FACE within multi-phase research at Sintef/IFE, the Center for Integrated Operations in the Petroleum Industry at the Norwegian University of Science and Technology (NTNU), the Drilling and Well Center for Improved Reco-very (CDWR) at IRIS (in cooperation with Sintef ), the Centre for Sustainable Arctic Coastal and Marine Technology at NTNU, AMOS within regulation and marine technology at NTNU and CAGE within gas hydrates in Arctic regions at the University of Tromsø. The Centres for Research-driven Innovation can receive support for up to eight years, and the Centres of Excellence can receive support for up to ten years.
An industry geared towards the future
Over the next ten years, production on the Norwegian shelf is expected to remain relatively stable, and may potentially increase somewhat. The reason for this is that major fields such as Johan Sverdrup and Johan Castberg will come on stream, along with contributions from other smaller fields that will be developed. The production ratios for gas and oil, including NGL and conden-sate, are expected to remain relatively stable in the years to come. Long term production levels will depend on the number and the size of new discoveries.
Many of our old fields that are still in production have significant remaining reserves. The resource base also increases as new satellite fields are tied into these older fields. Activity on producing fields will therefore remain high and will account for the majority of pro-duction in the immediate future. It is also possible to improve resource utilisation from many of these fields, beyond what is cur-rently planned. About 165 projects are currently underway with the objective of improving resource exploitation. The fact that we are able to improve recovery from existing fields, streamline operations and make new commercial discoveries that can be tied in to exis-ting infrastructure will be crucial for whether we can exploit the resource potential in mature areas going forward. Thirteen fields are currently being developed on the Norwegian shelf and the authorities expect to receive Plans for Development and Operation (PDOs) for an additional 13 fields over the next few years. Beyond these projects, 75 discoveries are currently being con-sidered for development, most of which are small. Today, the majo-rity of discoveries with a potential for independent development have either been realised or are in the planning phase. New com-mercial discoveries are needed in order to ensure steady activity going forward. This means that the exploration activity must be maintained.
0
50
100
150
200
250
300
2007 2010 2013 2016 2019 2022 2025 2028
Mill
. Sm
³ o.
e. p
er y
ear
Undiscovered resources
Resources in discoveries
Resources in fields
Reserves
Figure 6.2 Production forecast for oil and gas (The Norwegian Petroleum Directorate / The Ministry of Petroleum and Energy)

60 • FACTS 2014
The largest single project on the Norwegian shelf in the immediate future is the Johan Sverdrup field, which is located on the Utsira High in the North Sea. This is the fifth largest field ever discovered on the Norwegian shelf. Within ten years, the Sverdrup discovery is expected to account for approx. 25 per cent of Norwegian oil pro-duction. The Utsira High is also home to other significant disco-veries; the Ivar Aasen and Edvard Grieg fields are currently under development. Based on current development plans, total resources being developed in these fields amount to 365 million Sm3 o.e.
The Sverdrup discovery and the other fields show that the mature areas on the Norwegian shelf contain significant undiscovered assets. This has helped to maintain substantial interest in the APA rounds. Awards in the most recent APA round were at record levels, with a total of 65 new production licences distributed among 48 companies. Thirty-eight of the awards are in the North Sea, 19 in the Norwegian Sea and eight in the Barents Sea.
A large share of the remaining resources on the Norwegian shelf are located in frontier areas. Frontier areas are characterised by factors such as sparse or undeveloped infrastructure and unknown geology. New production facilities and new infrastructure both onshore and offshore require substantial reserves in order to justify the major investments required to develop discoveries. Minor fields will remain undeveloped until infrastructure is in place in frontier areas. In order for this to take place, exploration must be facilitated, the industry must have good framework conditions and sufficient
commercial discoveries must be made. The most exciting discovery in frontier areas in recent years is the Johan Castberg discovery in the Barents Sea, which is still in the planning phase.
A total of 59 exploration wells were spudded in 2013, which is a his-torically high level. These wells resulted in twenty discoveries in total. Total exploration costs amounted to approx. NOK 37 billion in 2013, and future exploration costs are expected to be around NOK 34 billion, measured in 2013 NOK. A high number of discoveries in recent years, as well as generally healthy interest from the compa-nies in both mature and frontier areas will result in continuity and a stable activity level in the years to come.
Future investment costs will remain relatively stable. Excluding exploration, investment costs will total about NOK 170–180 billion leading up to 2018. The investment linked to Johan Sverdrup will account for a significant share of these costs in the immediate future.
In conclusion, the industry will be characterised by a combination of major new fields coming on stream, new profitable development of old discoveries and extended production on existing fields. This will take place alongside substantial exploration in new, interesting areas and with continuous focus on R&D. With the prospect of a sustained high activity level, the petroleum activities will remain Norway’s largest and most important industry for the foreseeable future.

FACTS 2014 • 61PB • FACTS 2014
APPENdIx
Vestbase, Kristiansund(Photo: Harald Pettersen – Statoil)

62 • FACTS 2014
Year Ordinary
taxSpecial
taxProduction
feeArea
feeEnvironmental
taxesNet cash flow
from SDFIDividend
Statoil1971 141972 421973 691974 1211975 2081976 1 143 4 712 991977 1694 725 646 571978 1 828 727 1 213 511979 3 399 1 492 1 608 531980 9 912 4 955 3 639 631981 13 804 8 062 5 308 69 0.0571982 15 036 9 014 5 757 76 3681983 14 232 8 870 7 663 75 3531984 18 333 11 078 9 718 84 7951985 21 809 13 013 11 626 219 -8 343 7091986 17 308 9 996 8 172 198 -11 960 1 2451987 7 137 3 184 7 517 243 -10 711 8711988 5 129 1 072 5 481 184 -9 133 01989 4 832 1 547 7 288 223 755 01990 12 366 4 963 8 471 258 7 344 8001991 15021 6 739 8 940 582 810 5 879 1 5001992 7 558 7 265 8 129 614 1 916 3 623 1 4001993 6 411 9 528 7 852 553 2 271 159 1 2501994 6 238 8 967 6 595 139 2 557 5 1 0751995 7 854 10 789 5 884 552 2 559 9 259 1 6141996 9 940 12 890 6 301 1 159 2 787 34 959 1 8501997 15 489 19 582 6 220 617 3 043 40 404 1 6001998 9 089 11 001 3 755 527 3 229 14 572 2 9401999 5 540 6 151 3 222 561 3 261 25 769 1352000 21 921 32 901 3 463 122 3 047 98 219 1 7022001 41 465 64 316 2 481 983 2 862 125 439 5 7462002 32 512 52 410 1 320 447 3 012 74 785 5 0452003 36 819 60 280 766 460 3 056 67 482 5 1332004 43 177 70 443 717 496 3 309 80 166 5 2222005 61 589 103 294 360 224 3 351 98 602 8 1392006 78 015 133 492 42 2 308 3 405 125 523 12 5932007 70 281 116 233 0 764 3 876 111 235 14 0062008 88 802 150 839 0 1 842 3 684 153 759 16 9402009 61 501 103 733 0 1 470 2 262 95 339 15 4892010 58 830 96 779 0 1 373 2 186 104 053 12 8182011 78 243 127 693 0 1 517 2 225 127 775 13 3502012 85 803 142 868 0 1 781 2 255 148 889 13 887(Source: Norwegian Public Accounts)
Table 1.1 The State’s revenue from petroleum activity (mill. NOK)
APPENdIx 1 Historical statistics

FACTS 2014 • 6362 • FACTS 2014
Total petroleum production(Source: The Norwegian Petroleum Directorate)
Year Oil Gas Condensate NGL Total production1971 0.4 0.0 0.0 0.0 0.41972 1.9 0.0 0.0 0.0 1.91973 1.9 0.0 0.0 0.0 1.91974 2.0 0.0 0.0 0.0 2.01975 11.0 0.0 0.0 0.0 11.01976 16.2 0.0 0.0 0.0 16.21977 16.6 2.7 0.0 0.0 19.41978 20.6 14.6 0.0 0.0 35.31979 22.5 21.1 0.0 1.1 44.81980 28.2 25.6 0.0 2.4 56.31981 27.5 25.3 0.0 2.2 55.01982 28.5 24.1 0.0 2.3 54.91983 35.6 23.2 0.0 2.7 61.51984 41.1 25.6 0.1 2.6 69.41985 44.8 25.5 0.1 3.0 73.31986 48.8 26.1 0.1 3.8 78.81987 57.0 28.4 0.1 4.1 89.51988 64.7 28.6 0.0 4.8 98.21989 86.0 29.1 0.1 4.9 120.01990 94.5 26.0 0.0 5.0 125.61991 108.5 25.6 0.1 4.9 139.01992 124.0 26.5 0.1 5.0 155.51993 131.8 25.6 0.5 5.5 163.41994 146.3 27.9 2.4 7.1 183.71995 156.8 29.1 3.2 7.9 197.01996 175.5 38.7 3.8 8.2 226.31997 175.9 44.4 5.4 8.1 233.71998 168.7 47.1 5.0 7.4 228.21999 168.7 48.7 5.5 7.0 229.92000 181.2 47.4 5.4 7.2 241.22001 180.9 54.1 5.7 10.9 251.62002 173.6 65.5 7.3 11.8 258.32003 165.5 72.9 10.3 12.9 261.62004 162.8 79.1 8.7 13.6 264.22005 148.1 85.7 8.0 15.7 257.52006 136.6 88.2 7.6 16.7 249.12007 128.3 89.5 3.1 17.3 238.22008 122.7 99.5 3.9 16.0 242.12009 114.9 103.7 4.4 16.9 239.92010 104.4 106.5 4.1 16.3 231.32011 97.5 100.3 4.6 16.3 218.62012 89.2 113.1 4.5 17.8 224.62013 84.9 107.1 4.0 17.7 213.7(Source: The Norwegian Petroleum Directorate)
Table 1.2 Petroleum production on the Norwegian continental shelf, millions standard cubic meter oil equivelents
0
50
100
150
200
250
300
1971 1976 1981 1986 1991 1996 2001 2006 2011
Mill
. Sm
³ o.e
.per
yea
r
NGLCondensateGasOil

64 • FACTS 2014
Macroeconomic indicators for the petroleum sector(Source: Statistics Norway, Ministry of Finance)
* Preliminary numbers.** The number of employees does not include all
petroleum related industries.
YearGross domestic
product (mill. NOK)Export value
(mill. NOK)Number of
employees**Total investments
(mill. NOK)Exploration costs
(mill. NOK)1971 12 119 - 704 1972 207 366 300 1 274 1973 258 553 400 2 457 1974 1 056 1 221 1 000 5 313 1975 4 218 4 022 2 400 7 227 1976 6 896 7 231 3 000 10 421 1977 8 617 8 567 4 400 12 621 1978 14 835 14 108 6 900 6 912 1979 23 494 23 113 8 800 10 792 1980 44 285 42 492 10 900 11 000 1981 55 189 49 906 13 700 12 262 4 133 1982 61 891 55 224 14 600 16 148 5 519 1983 73 298 65 768 15 100 28 883 5 884 1984 90 092 80 274 17 300 34 029 7 491 1985 97 347 87 574 19 600 32 730 7 831 1986 59 988 54 844 19 800 33 302 6 716 1987 59 574 55 799 19 700 34 247 4 951 1988 49 966 50 548 20 700 29 522 4 152 1989 76 768 75 776 20 700 31 777 5 008 1990 95 400 91 808 21 300 31 976 5 136 1991 101 346 99 777 21 800 42 634 8 137 1992 102 578 100 238 23 100 49 196 7 679 1993 107 542 107 357 24 700 57 168 5 433 1994 112 623 111 567 24 900 54 189 5 010 1995 120 198 119 671 24 000 48 583 4 647 1996 165 444 164 806 24 500 47 878 5 456 1997 180 594 175 025 26 700 62 495 8 300 1998 129 098 124 896 27 500 79 216 7 576 1999 176 591 168 693 27 300 69 096 4 992 2000 340 640 321 216 25 700 53 590 5 272 2001 325 333 315 139 29 400 57 144 6 815 2002 283 462 275 041 32 400 54 000 4 475 2003 295 356 281 054 32 200 64 362 4 135 2004 361 262 337 468 32 700 71 473 4 010 2005 465 341 428 265 34 800 88 478 7 536 2006 548 837 498 585 36 900 95 750 11 718 2007 519 174 480 210 44 300 109 895 16 854 2008 666 391 622 230 47 500 124 242 23 314 2009 481 380 440 808 50 500 135 825 27 269 2010 528 968 471 179 52 800 125 421 24 926 2011 630 888 568 428 55 700 146 290 26 769 2012 681 059 610 794 59 000 172 465 24 480 2013 684 972* 564 3678* 209 575* 35 200* (Source: Statistics Norway)
Table 1.3 Value creation, exports, employment, investments and exploration costs
0
10
20
30
40
50
60
1971 1976 1981 1986 1991 1996 2001 2006 2011
Per c
ent
Share of GDP
Share of investments
Share of exports
Share of state revenues

FACTS 2014 • 6564 • FACTS 2014
FieldOil
mill. Sm3
Gasbill. Sm3
NGLmill. tonnes
Condensatemill. Sm3
Oil equiv.1)
mill Sm3 o.e.Year of
discovery2)
Albuskjell 7.4 15.5 1.0 0.0 24.8 1972Cod 2.9 7.3 0.5 11.2 1968Edda 4.8 2.0 0.2 7.2 1972Frigg 116.2 0.5 116.6 1971Frøy 5.6 1.6 0.1 7.3 1987Glitne 8.9 0.0 0.0 0.0 8.9 1995Lille-Frigg 1.3 2.2 0.0 3.5 1975Mime 0.4 0.1 0.0 0.5 1982Nordøst Frigg 11.6 0.1 11.7 1974Odin 27.3 0.2 27.5 1974Tommeliten Gamma 3.9 9.7 0.6 14.6 1978Vest Ekofisk 12.2 26.0 1.4 40.8 1970Yttergryta 0.3 1.7 0.3 0.0 2.6 2007Øst Frigg 9.2 0.1 9.3 1973Sold and delivered from fields where production has ceased 47.5 230.3 4.0 0.9 286.4
33/9-6 Delta3) 0.1 0.0 0.1 1976ALVE 1.2 3.3 0.6 5.6 1990ALVHEIM 23.2 2.7 25.9 1998ATLA 0.1 0.1 0.2 2010BALDER 57.8 1.4 59.2 1967BLANE 0.6 0.0 0.0 0.6 1989BRAGE 55.8 3.3 1.2 61.5 1980DRAUGEN 133.3 1.6 2.5 139.6 1984EKOFISK 445.8 142.5 13.0 613.1 1969ELDFISK 102.5 39.6 3.9 149.6 1970EMBLA 10.4 3.9 0.4 15.2 1988ENOCH 0.3 0.0 0.3 1991FRAM 27.2 3.1 0.3 30.8 1992GAUPE 0.2 0.3 0.0 0.0 0.5 1985GIMLE 2.7 0.7 0.1 3.7 2004GJØA 7.1 8.8 1.9 0.4 20.0 1989GRANE 94.0 94.0 1991GULLFAKS 356.5 23.1 2.8 384.9 1978GULLFAKS SØR 44.5 35.7 4.5 88.9 1978GUNGNE 14.1 2.0 4.4 22.2 1982GYDA 35.8 6.2 1.9 45.6 1980HEIDRUN4) 145.5 15.5 0.6 162.0 1985HEIMDAL 6.5 45.2 51.8 1972HOD 9.5 1.6 0.3 11.7 1974HULDRA 5.2 17.1 0.1 22.5 1982HYME 0.4 0.0 0.0 0.4 2009ISLAY 0.0 0.1 0.0 0.1 2008JETTE 0.2 0.0 0.2 2009JOTUN 22.9 0.9 23.8 1994KRISTIN 17.7 20.1 4.3 2.1 48.0 1997KVITEBJØRN 19.6 46.2 4.0 73.4 1994
Table 2.1 Sold and delivered volumes from fields in production and fields where production has ceased
APPENdIx 2 The petroleum resources (per 31.12.2013)

66 • FACTS 2014
FieldOil
mill. Sm3
Gasbill. Sm3
NGLmill. tonnes
Condensatemill. Sm3
Oil equiv.1)
mill Sm3 o.e. Year of
discovery2)
MARULK 0.1 0.8 0.1 1.0 1992MIKKEL 3.5 16.9 4.5 2.2 31.2 1987MORVIN 5.0 1.2 0.2 6.6 2001MURCHISON 13.9 0.3 0.3 0.0 14.8 1975NJORD 25.8 8.4 1.9 37.8 1986NORNE 87.8 6.7 0.8 96.0 1992ORMEN LANGE 120.1 9.2 129.3 1997OSEBERG 364.9 38.6 8.1 419.0 1979OSEBERG SØR 46.3 8.9 0.7 56.5 1984OSEBERG ØST 19.1 0.3 0.2 19.8 1981OSELVAR 0.3 0.1 0.0 0.4 1991REV 0.7 2.6 0.0 3.4 2001RINGHORNE ØST 10.0 0.2 10.2 2003SIGYN 6.4 2.5 6.0 17.2 1982SKARV 2.1 3.0 0.4 5.8 1998SKIRNE 1.8 9.4 11.2 1990SKULD 0.5 0.1 0.0 0.7 2008SLEIPNER VEST 118.9 8.4 29.4 164.3 1974SLEIPNER ØST 66.7 13.1 26.8 118.4 1981SNORRE 190.4 6.3 4.6 205.5 1979SNØHVIT 24.1 1.2 4.2 30.7 1984STATFJORD 567.7 67.5 17.3 0.6 668.7 1974STATFJORD NORD 36.7 2.3 0.8 40.5 1977STATFJORD ØST 36.4 4.0 1.4 42.9 1976SYGNA 9.9 9.9 1996TAMBAR 9.1 2.0 0.2 11.6 1983TAMBAR ØST 0.3 0.0 0.0 0.3 2007TOR 24.1 10.9 1.2 37.2 1970TORDIS 55.8 4.3 1.6 63.0 1987TROLL5) 234.9 477.5 7.2 4.3 730.3 1979TRYM 0.9 1.5 2.4 1990TUNE 3.5 18.9 0.1 22.7 1996TYRIHANS 19.4 1.1 0.2 20.9 1983ULA 72.8 3.9 2.6 81.7 1976URD 5.3 0.2 0.0 5.5 2000VALE 1.5 1.3 2.8 1991VALHALL 107.7 20.8 3.3 134.8 1975VARG 15.5 15.5 1984VEGA 2.5 3.3 0.8 0.2 7.5 1981VESLEFRIKK 52.8 2.5 1.3 57.8 1987VIGDIS 53.5 1.8 1.0 57.2 1981VILJE 8.7 0.4 9.1 1986VISUND 23.5 7.6 0.5 32.0 2003VISUND SØR 0.5 0.5 0.1 1.1 1986VOLUND 6.5 0.6 7.1 1994VOLVE 8.2 0.8 0.2 0.1 9.3 1993YME 7.9 7.9 1987ÅSGARD 85.0 133.3 24.4 17.1 281.7 1981Producing fields 3849.2 1643.9 155.8 107.2 5896.4Total sold and delivered 3896.7 1874.2 159.9 108.2 6182.81) The conversion factor for NGL tonnes to Sm³ is 1.92) The year the first discovery well was drilled3) 33/9-6 Delta has test production4) Heidrun also includes Tjeldbergodden5) Troll also includes TOGI

FACTS 2014 • 6766 • FACTS 2014
Field
Original reserves
mill. Sm3 o.e.Year of
discovery2) Operator per 31.12.2013Production licence/
unit areaAASTA HANSTEEN1) 46.0 1997 Statoil Petroleum AS 218ALVE 9.0 1990 Statoil Petroleum AS 159 BALVHEIM 48.5 1998 Marathon Oil Norge AS 203ATLA 1.5 2010 Total E&P Norge AS 102 CBALDER 70.7 1967 ExxonMobil Exploration & Production Norway AS 001BLANE 0.9 1989 Talisman Energy Norge AS BLANEBRAGE 65.7 1980 Wintershall Norge AS BRAGEBRYNHILD1) 3.6 1992 Lundin Norway AS 148BØYLA1) 3.6 2009 Marathon Oil Norge AS 340DRAUGEN 155.3 1984 A/S Norske Shell 093EDVARD GRIEG1) 29.2 2007 Lundin Norway AS 338EKOFISK 753.4 1969 ConocoPhillips Skandinavia AS 018ELDFISK 188.6 1970 ConocoPhillips Skandinavia AS 018EMBLA 20.4 1988 ConocoPhillips Skandinavia AS 018ENOCH 0.4 1991 Talisman North Sea Limited ENOCHFRAM 42.7 1990 Statoil Petroleum AS 090FRAM H-NORD1) 1.7 2007 Statoil Petroleum AS FRAM H-NORDGAUPE 0.6 1985 BG Norge AS 292GIMLE 5.0 2004 Statoil Petroleum AS GIMLEGINA KROG1) 35.7 1978 Statoil Petroleum AS GINA KROGGJØA 63.1 1989 GDF SUEZ E&P Norge AS 153GOLIAT1) 38.1 2000 Eni Norge AS 229GRANE 131.8 1991 Statoil Petroleum AS GRANEGUDRUN1) 28.9 1975 Statoil Petroleum AS 025GULLFAKS 398.3 1978 Statoil Petroleum AS 050GULLFAKS SØR 148.0 1978 Statoil Petroleum AS 050GUNGNE 23.3 1982 Statoil Petroleum AS 046GYDA 46.5 1980 Talisman Energy Norge AS 019 BHEIDRUN 234.9 1985 Statoil Petroleum AS HEIDRUNHEIMDAL 51.8 1972 Statoil Petroleum AS 036 BSHOD 12.8 1974 BP Norge AS 033HULDRA 22.5 1982 Statoil Petroleum AS HULDRAHYME 4.4 2009 Statoil Petroleum AS 348ISLAY 0.1 2008 Total E&P UK PLC 043 CS. 043 DSIVAR AASEN1) 25.0 2008 Det norske oljeselskap ASA 001 BJETTE 1.5 2009 Det norske oljeselskap ASA JETTEJOTUN 24.6 1994 ExxonMobil Exploration & Production Norway AS JOTUNKNARR1) 13.7 2008 BG Norge AS 373 SKRISTIN 65.1 1997 Statoil Petroleum AS HALTENBANKEN VESTKVITEBJØRN 141.2 1994 Statoil Petroleum AS 193MARTIN LINGE1) 30.0 1978 TOTAL E & P Norge AS MARTIN LINGEMARULK 9.0 1992 Eni Norge AS 122MIKKEL 55.2 1987 Statoil Petroleum AS MIKKELMORVIN 17.9 2001 Statoil Petroleum AS 134 BMURCHISON 14.2 1975 CNR International (UK) Limited MURCHISONNJORD 47.1 1986 Statoil Petroleum AS NJORDNORNE 105.0 1992 Statoil Petroleum AS NORNEORMEN LANGE 332.0 1997 A/S Norske Shell ORMEN LANGEOSEBERG 523.8 1979 Statoil Petroleum AS OSEBERGOSEBERG SØR 83.8 1984 Statoil Petroleum AS OSEBERGOSEBERG ØST 26.6 1981 Statoil Petroleum AS OSEBERG
Table 2.2 Reserves in fields in production and fields with approved plans for development and operation

68 • FACTS 2014
Field
Original reserves
mill. Sm3 o.e.Year of
discovery2) Operator per 31.12.2012Production licence/
unit areaOSELVAR 4.2 1991 DONG E&P Norge AS 274REV 3.5 2001 Talisman Energy Norge AS 038 CRINGHORNE ØST 14.2 2003 ExxonMobil Exploration & Production Norway AS RINGHORNE ØSTSIGYN 18.4 1982 ExxonMobil Exploration & Production Norway AS 072SKARV 68.6 1998 BP Norge AS SKARV SKIRNE 12.5 1990 Total E&P Norge AS 102SKULD 10.4 2008 Statoil Petroleum AS 128SLEIPNER VEST 184.9 1974 Statoil Petroleum AS SLEIPNER VESTSLEIPNER ØST 120.3 1981 Statoil Petroleum AS SLEIPNER ØSTSNORRE 272.8 1979 Statoil Petroleum AS SNORRESNØHVIT 268.2 1984 Statoil Petroleum AS SNØHVITSTATFJORD 699.4 1974 Statoil Petroleum AS STATFJORDSTATFJORD NORD 43.8 1977 Statoil Petroleum AS 037STATFJORD ØST 44.9 1976 Statoil Petroleum AS STATFJORD ØSTSVALIN1) 12.3 1992 Statoil Petroleum AS 169SYGNA 11.2 1996 Statoil Petroleum AS SYGNATAMBAR 12.4 1983 BP Norge AS 065TAMBAR ØST 0.3 2007 BP Norge AS TAMBAR ØSTTOR 37.9 1970 ConocoPhillips Skandinavia AS TORTORDIS 71.5 1987 Statoil Petroleum AS 089TROLL 1755.7 1979 Statoil Petroleum AS TROLLTRYM 5.8 1990 DONG E&P Norge AS 147TUNE 22.2 1996 Statoil Petroleum AS 190TYRIHANS 91.8 1983 Statoil Petroleum AS TYRIHANSULA 94.1 1976 BP Norge AS 019URD 7.0 2000 Statoil Petroleum AS 128VALE 5.0 1991 Centrica Resources (Norge) AS 036VALEMON1) 30.4 1985 Statoil Petroleum AS VALEMONVALHALL 184.5 1975 BP Norge AS VALHALLVARG 17.6 1984 Talisman Energy Norge AS 038VEGA 32.4 1981 Statoil Petroleum AS VEGAVESLEFRIKK 63.0 1981 Statoil Petroleum AS 052VIGDIS 73.7 1986 Statoil Petroleum AS 089VILJE 13.4 2003 Marathon Oil Norge AS 036 DVISUND 99.0 1986 Statoil Petroleum AS VISUND INSIDEVISUND SØR 12.2 2008 Statoil Petroleum AS VISUND INSIDEVOLUND 10.8 1994 Marathon Petroleum Norge AS 150VOLVE 10.8 1993 Statoil Petroleum AS 046 BSYME1) 18.5 1987 Talisman Energy Norge AS 316ÅSGARD 398.8 1981 Statoil Petroleum AS ÅSGARD1) Fields with approved development plans where production had not started per 31.12.20132) The year the first discovery well was drilled

FACTS 2014 • 6968 • FACTS 2014
Field
Original reserves1) Remaining reserves4)
Oilmill. Sm3
Gasbill. Sm3
NGLmill. tonnes
Condensatemill. Sm3
Oil equiv. 2)
mill Sm3 o.e.Oil
mill. Sm3
Gasbill. Sm3
NGLmill. tonnes
Condensatemill. Sm3
Oil equiv. 2)
mill. Sm3 o.e.
AASTA HANSTEEN3) 0.0 45.1 0.0 0.9 46.0 0.0 45.1 0.0 0.9 46.0ALVE 1.7 5.4 1.0 0.0 9.0 0.5 2.1 0.4 0.0 3.4ALVHEIM 41.2 7.3 0.0 0.0 48.5 18.0 4.6 0.0 0.0 22.6ATLA 0.3 1.2 0.0 0.0 1.5 0.2 1.1 0.0 0.0 1.3BALDER 68.9 1.8 0.0 0.0 70.7 11.1 0.4 0.0 0.0 11.5BLANE 0.9 0.0 0.0 0.0 0.9 0.3 0.0 0.0 0.0 0.3BRAGE 58.9 4.2 1.4 0.0 65.7 3.0 0.9 0.2 0.0 4.2BRYNHILD3) 3.6 0.0 0.0 0.0 3.6 3.6 0.0 0.0 0.0 3.6BØYLA3) 3.4 0.2 0.0 0.0 3.6 3.4 0.2 0.0 0.0 3.6DRAUGEN 148.2 1.7 2.8 0.0 155.3 14.9 0.1 0.4 0.0 15.7EDVARD GRIEG3) 26.2 1.8 0.6 0.0 29.2 26.2 1.8 0.6 0.0 29.2EKOFISK 563.3 161.6 15.0 0.0 753.4 117.5 19.1 1.9 0.0 140.3ELDFISK 135.6 45.4 4.0 0.0 188.6 33.2 5.7 0.1 0.0 39.1EMBLA 12.0 7.3 0.6 0.0 20.4 1.5 3.4 0.1 0.0 5.2ENOCH 0.4 0.0 0.0 0.0 0.4 0.1 0.0 0.0 0.0 0.1FRAM 32.5 8.8 0.8 0.0 42.7 5.3 5.7 0.5 0.0 11.9FRAM H-NORD3) 1.7 0.0 0.0 0.0 1.7 1.7 0.0 0.0 0.0 1.7GAUPE 0.2 0.4 0.0 0.0 0.6 0.0 0.1 0.0 0.0 0.1GIMLE 3.0 1.4 0.3 0.0 5.0 0.3 0.7 0.2 0.0 1.3GINA KROG3) 15.3 12.5 3.3 1.6 35.7 15.3 12.5 3.3 1.6 35.7GJØA 11.8 34.1 9.0 0.0 63.1 4.8 25.3 7.1 0.0 43.6GOLIAT3) 30.2 7.3 0.3 0.0 38.1 30.2 7.3 0.3 0.0 38.1GRANE 131.8 0.0 0.0 0.0 131.8 37.7 0.0 0.0 0.0 37.7GUDRUN3) 14.5 10.9 1.9 0.0 28.9 14.5 10.9 1.9 0.0 28.9GULLFAKS 369.9 23.1 2.8 0.0 398.3 13.4 0.0 0.0 0.0 13.4GULLFAKS SØR 61.0 68.6 9.7 0.0 148.0 16.5 32.9 5.2 0.0 59.1GUNGNE 0.0 14.7 2.1 4.6 23.3 0.0 0.6 0.1 0.2 1.1GYDA 36.4 6.4 1.9 0.0 46.5 0.6 0.2 0.0 0.0 0.9HEIDRUN 183.3 47.3 2.2 0.0 234.9 37.8 31.8 1.7 0.0 72.9HEIMDAL 6.5 45.2 0.0 0.0 51.8 0.0 0.0 0.0 0.0 0.0HOD 10.3 1.8 0.4 0.0 12.8 0.7 0.1 0.1 0.0 1.2HULDRA 5.1 17.2 0.1 0.0 22.5 0.0 0.1 0.0 0.0 0.1HYME 3.5 0.6 0.1 0.0 4.4 3.2 0.5 0.1 0.0 4.0ISLAY 0.0 0.1 0.0 0.0 0.1 0.0 0.0 0.0 0.0 0.0IVAR AASEN3) 18.3 4.7 1.1 0.0 25.0 18.3 4.7 1.1 0.0 25.0JETTE 1.5 0.0 0.0 0.0 1.5 1.3 0.0 0.0 0.0 1.3JOTUN 23.6 1.1 0.0 0.0 24.6 0.7 0.2 0.0 0.0 0.9KNARR3) 11.2 0.4 1.1 0.0 13.7 11.2 0.4 1.1 0.0 13.7KRISTIN 22.9 28.8 6.0 2.1 65.1 5.2 8.7 1.7 0.0 17.2KVITEBJØRN 27.8 90.7 12.0 0.0 141.2 8.2 44.5 7.9 0.0 67.9MARTIN LINGE3) 6.0 19.7 0.7 3.0 30.0 6.0 19.7 0.7 3.0 30.0MARULK 0.5 7.2 0.7 0.0 9.0 0.5 6.4 0.6 0.0 8.0MIKKEL 5.9 31.0 8.4 2.2 55.2 2.4 14.1 3.9 0.0 23.9MORVIN 10.5 4.7 1.4 0.0 17.9 5.5 3.5 1.2 0.0 11.3MURCHISON 13.9 0.4 0.0 0.0 14.2 0.0 0.0 0.0 0.0 0.0NJORD 27.5 13.8 3.1 0.0 47.1 1.7 5.4 1.2 0.0 9.4NORNE 91.0 11.3 1.5 0.0 105.0 3.2 4.6 0.7 0.0 9.1ORMEN LANGE 0.0 314.6 0.0 17.4 332.0 0.0 194.5 0.0 8.2 202.7
Table 2.3 Original and remaining reserves in fields

70 • FACTS 2014
Field
Original reserves1) Remaining reserves 4)
Oilmill. Sm3
Gasbill. Sm3
NGLmill. tonnes
Condensatemill. Sm3
Oil equiv. 2)
mill Sm3 o.e.Oil
mill. Sm3
Gasbill. Sm3
NGLmill. tonnes
Condensatemill. Sm3
Oil equiv. 2)
mill. Sm3 o.e.
OSEBERG 389.1 111.9 12.0 0.0 523.8 24.2 73.3 3.9 0.0 104.8OSEBERG SØR 64.1 16.7 1.6 0.0 83.8 17.7 7.7 0.9 0.0 27.3OSEBERG ØST 25.7 0.4 0.3 0.0 26.6 6.6 0.1 0.1 0.0 6.8OSELVAR 2.6 1.7 0.0 0.0 4.2 2.3 1.5 0.0 0.0 3.8REV 0.7 2.7 0.0 0.0 3.5 0.0 0.1 0.0 0.0 0.1RINGHORNE ØST 13.9 0.3 0.0 0.0 14.2 4.0 0.1 0.0 0.0 4.0SIGYN 0.0 6.5 3.1 6.0 18.4 0.0 0.1 0.6 0.0 1.2SKARV 13.9 44.5 5.4 0.0 68.6 11.7 41.5 5.0 0.0 62.8SKIRNE 2.3 10.3 0.0 0.0 12.5 0.5 0.9 0.0 0.0 1.4SKULD 9.5 0.8 0.1 0.0 10.4 8.9 0.7 0.1 0.0 9.8SLEIPNER VEST 0.0 133.5 9.7 32.9 184.9 0.0 14.7 1.3 3.4 20.5SLEIPNER ØST 0.0 67.7 13.5 26.9 120.3 0.0 1.0 0.4 0.1 1.9SNORRE 257.2 6.6 4.7 0.0 272.8 66.9 0.3 0.1 0.0 67.3SNØHVIT 0.0 225.1 7.3 29.1 268.2 0.0 201.0 6.1 24.9 237.5STATFJORD 573.0 79.5 24.0 1.3 699.4 5.3 12.1 6.7 0.6 30.7STATFJORD NORD 39.6 2.1 1.1 0.0 43.8 3.0 0.0 0.3 0.0 3.6STATFJORD ØST 36.6 4.1 2.2 0.0 44.9 0.2 0.2 0.8 0.0 1.9SVALIN3) 12.3 0.0 0.0 0.0 12.3 12.3 0.0 0.0 0.0 12.3SYGNA 11.2 0.0 0.0 0.0 11.2 1.3 0.0 0.0 0.0 1.3TAMBAR 9.5 2.0 0.5 0.0 12.4 0.4 0.0 0.2 0.0 0.9TAMBAR ØST 0.3 0.0 0.0 0.0 0.3 0.0 0.0 0.0 0.0 0.0TOR 24.4 11.3 1.2 0.0 37.9 0.3 0.4 0.0 0.0 0.7TORDIS 63.2 4.8 1.8 0.0 71.5 7.5 0.5 0.2 0.0 8.4TROLL 269.4 1432.8 27.4 1.5 1755.7 34.5 955.3 20.2 -2.8 1025.4TRYM 1.7 4.0 0.0 0.0 5.8 0.8 2.6 0.0 0.0 3.4TUNE 3.3 18.5 0.2 0.0 22.2 0.0 0.0 0.0 0.0 0.1TYRIHANS 33.1 42.5 8.5 0.0 91.8 13.7 41.4 8.3 0.0 71.0ULA 84.2 3.9 3.2 0.0 94.1 11.4 0.0 0.6 0.0 12.5URD 6.9 0.1 0.0 0.0 7.0 1.6 0.0 0.0 0.0 1.5VALE 2.6 2.4 0.0 0.0 5.0 1.1 1.2 0.0 0.0 2.3VALEMON3) 4.6 23.6 1.2 0.0 30.4 4.6 23.6 1.2 0.0 30.4VALHALL 146.7 27.4 5.5 0.0 184.5 39.0 6.6 2.2 0.0 49.7VARG 16.1 1.0 0.3 0.0 17.6 0.6 1.0 0.3 0.0 2.1VEGA 7.9 15.6 4.7 0.0 32.4 5.4 12.3 3.9 0.0 25.1VESLEFRIKK 54.4 5.2 1.8 0.0 63.0 1.5 2.8 0.5 0.0 5.2VIGDIS 69.4 1.9 1.2 0.0 73.7 15.9 0.2 0.3 0.0 16.5VILJE 13.4 0.0 0.0 0.0 13.4 4.7 0.0 0.0 0.0 4.7VISUND 34.9 52.3 6.2 0.0 99.0 11.5 44.7 5.7 0.0 67.0VISUND SØR 2.7 7.7 0.9 0.0 12.2 2.3 7.2 0.9 0.0 11.1VOLUND 9.9 0.9 0.0 0.0 10.8 3.3 0.3 0.0 0.0 3.6VOLVE 9.5 0.9 0.2 0.1 10.8 1.3 0.1 0.0 0.0 1.5YME3) 18.5 0.0 0.0 0.0 18.5 10.6 0.0 0.0 0.0 10.6ÅSGARD 102.4 206.7 38.1 17.1 398.8 17.5 73.5 13.7 0.0 117.1Total 4683.0 3691.7 284.3 146.8 9061.7 834.0 2048.9 128.8 40.2 3167.81) The table shows expected value, the estimates are subject to uncertainty.2) The conversion factor for NGL tonnes to Sm³ is 1.9.3) Fields with approved development plans where production had not started per 31.12.2013.4) A negative remaining reserves figure for a field is a result of the product not being reported under original reserves.
This applies to produced NGL and condensate.

FACTS 2014 • 7170 • FACTS 2014
DiscoveryOil
mill. Sm3
Gasbill. Sm3
NGLmill. tonnes
Condensatemill. Sm3
Oil equiv.1)
mill. Sm3 o.e.Year of
discovery2)
1/5-2 FLYNDRE 0.4 0.1 0.0 0.0 0.5 197433/9-6 DELTA 0.1 0.0 0.0 0.0 0.1 1976Total 0.5 0.1 0.0 0.0 0.61) The conversion factor for NGL tonnes to Sm³ is 1.9.2) The year the first discovery well was drilled.
Table 2.5 Resources in fields and discoveries in the planning phase
DiscoveryOil
mill. Sm3
Gasbill. Sm3
NGLmill. tonnes
Condensatemill. Sm3
Oil equiv.2) mill. Sm3 o.e.
Year ofdiscovery3)
FRØY4) 8.7 0.0 0.0 0.0 8.7 19871/9-1 TOMMELITEN ALPHA 6.2 13.7 0.5 0.0 20.8 19778/10-4 S (Butch) 7.5 0.7 0.0 0.0 8.2 201115/8-1 (Alpha) 0.0 2.3 0.5 1.6 4.8 198216/2-6 JOHAN SVERDRUP 354.1 10.6 4.8 0.0 373.8 201017/12-1 BREAM 6.4 0.0 0.0 0.0 6.4 197218/10-1 (Mackerel) 2.1 0.0 0.0 0.0 2.1 198024/6-1 PEIK 0.6 2.0 0.0 0.0 2.5 198525/2-10 S (Frigg-GammaDelta)5) 12.5 3.5 0.0 0.0 16.0 198630/11-7 (Fulla) 0.9 5.5 0.0 0.0 6.3 200930/11-8 S (Krafla)6) 8.5 5.3 0.6 0.0 14.9 201131/2-N-11 H 0.6 0.0 0.0 0.0 0.6 200535/11-13 (Astero) 3.4 0.6 0.0 0.0 4.1 20056406/2-7 ERLEND 0.9 1.0 0.2 0.0 2.3 19996406/3-2 TRESTAKK 7.9 1.8 0.4 0.0 10.5 19866406/3-8 (Maria) 19.5 2.1 1.0 0.0 23.6 20106407/6-6 MIKKEL SØR7) 0.6 2.2 0.5 0.0 3.8 20086506/9-2 S (Fogelberg) 1.4 8.1 0.8 0.0 11.0 20106507/7-14 S (Zidane)8) 0.0 17.9 0.2 0.4 18.8 20106705/10-1 (Asterix) 0.0 17.8 0.0 0.3 18.1 20097122/6-1 (Tornerose) 0.0 3.7 0.0 0.2 3.9 19877220/8-1 JOHAN CASTBERG9) 78.1 9.7 0.0 0.0 87.7 2011Total 511.2 108.3 9.6 2.5 640.31) Names in brackets are not official discovery names2) The conversion factor for NGL tonnes to Sm³ is 1.93) The year the first discovery well was drilled4) The licensees consider a re-development of the field. The volume is included in category 4A for fields5) 25/2-10 S (FriggGammaDelta) includes 25/2-17 - discovery year 20096) 30/11-8 S (Krafla) includes 30/11-8 A - discovery year 2011. Resources in RC 4F and RC 7F7) 6407/6-6 Mikkel Sør includes 6407/6-7 S - discovery year 20098) 6507/7-14 S (Zidane) includes 6507/7-15 S - discovery year 20129) 7220/8-1 Johan Castberg includes 7220/7-1 - discovery year 2012.The resources include gas resources in RC 7F
Table 2.4 Reserves in discoveries the licensees have decided to develop

72 • FACTS 2014
Discovery1Oil
mill. Sm3
Gasbill. Sm3
NGLmill. tonnes
Condensatemill. Sm3
Oil equiv.2
mill. Sm3 o.e.Year of
discovery3
15/12-21 (Grevling) 7.7 0.1 0.0 0.0 7.8 200915/5-2 EIRIN 0.0 7.0 0.1 0.4 7.6 197816/1-12 (Edvard Grieg Sør) 5.1 0.5 0.2 0.0 5.9 200916/1-14 (Apollo) 5.2 0.2 0.1 0.0 5.5 20102/12-1 MJØLNER 3.0 0.8 0.1 0.0 4.0 19872/5-3 SØRØST TOR 3.1 0.9 0.0 0.0 3.9 197224/9-10 S (Caterpillar) 1.0 0.1 0.0 0.0 1.0 201125/1-11 R (Storklakken) 1.5 0.0 0.0 0.0 1.5 201025/2-5 LILLE FRØY 3.0 1.6 0.0 0.0 4.6 197625/4-3 GEKKO 0.5 4.2 0.0 0.0 4.7 197425/8-4 (D-struktur) 1.0 0.0 0.0 0.0 1.0 19923/7-8 S (Trym Sør) 0.2 0.8 0.0 0.0 1.0 201330/5-3 S (Corvus) 0.4 5.5 0.0 0.0 5.9 200933/12-9 S (Skinfaks Sør) 0.6 0.5 0.1 0.0 1.2 201234/10-52 A 0.0 0.2 0.0 0.0 0.3 201134/10-52 B 0.1 0.2 0.0 0.0 0.3 201134/11-2 S NØKKEN 1.8 4.0 0.5 0.0 6.7 199634/4-11 (Beta) 12.2 1.4 0.0 0.0 13.6 201035/2-1 (Peon) 0.0 19.5 0.0 0.0 19.5 200535/8-3 (Aurora) 0.6 2.7 0.0 0.0 3.2 198835/9-6 S (Titan) 5.4 4.0 0.0 2.5 12.0 20106406/2-1 LAVRANS 2.4 9.3 0.8 0.0 13.2 19956406/9-1 LINNORM 0.0 24.4 0.0 0.6 24.9 20056407/7-8 (Noatun) 0.5 2.0 0.3 0.0 3.0 20086407/9-9 (Hasselmus)4) 0.0 0.0 0.0 0.0 0.0 19996506/11-2 LANGE 0.5 0.2 0.1 0.0 0.9 19916506/12-3 LYSING 1.2 0.2 0.0 0.0 1.4 19856506/6-1 (Victoria) 0.0 26.8 0.0 0.0 26.8 20006507/11-6 SIGRID 0.4 1.9 0.3 0.0 2.9 20016507/3-8 (Gjøk) 0.0 1.4 0.2 0.1 1.9 20096507/7-13 0.9 0.0 0.0 0.0 1.0 20016607/12-2 S (Alve Nord) 0.9 4.9 0.0 1.3 7.0 20117120/12-2 (Alke)5) 0.0 11.4 0.6 0.4 12.9 1981Total 59.0 136.5 3.4 5.2 207.31) Names in brackets are not official discovery names2) The conversion factor for NGL tonnes to Sm³ is 1.93) The year the first discovery well was drilled4) The discovery has no salable resources. Produced gas will be used as fuel on Draugen5) 7120/12-2 Alke includes 7120/12-3 - discovery year 1983
Table 2.6 Resources in discoveries where development is likely but not clarified

FACTS 2014 • 7372 • FACTS 2014
Discovery1)Oil
mill. Sm3
Gasbill. Sm3
NGLmill. tonnes
Condensatemill. Sm3
Oil equiv.mill. Sm3 o.e.2)
Year ofdiscovery3)
7/12-5 (Ula Nord) 0.8 0.2 0.0 0.0 1.0 198116/2-18 S (Cliffhanger Nord) 2.6 0.4 0.0 0.0 3.0 201316/2-3 (Ragnarrock) 2.9 0.4 0.0 0.0 3.3 200716/2-4 0.0 1.9 0.0 0.3 2.2 200716/2-5 0.0 1.9 0.0 0.2 2.1 200916/4-6 S (Luno II) 10.5 3.0 0.0 0.0 13.5 20132/3-1 0.0 1.8 0.0 0.0 1.8 19692/4-17 TJALVE 0.6 0.8 0.0 0.0 1.4 19922/4-21 (King Lear) 0.0 8.1 0.0 5.5 13.6 201225/4-2 (Heimdal Øst) 0.8 0.1 0.0 0.0 0.9 197325/11-27 3.3 0.0 0.0 0.0 3.3 201330/11-9 S (Askja West) 0.0 2.2 0.0 0.5 2.7 201334/12-1 (Afrodite) 0.0 9.2 0.9 1.2 12.1 200834/4-10 4.8 0.7 0.0 0.0 5.5 200034/6-2 S (Garantiana) 6.0 0.2 0.0 0.0 6.2 201234/7-H-2 (Ørneskate) 0.3 0.0 0.0 0.0 0.3 201335/10-2 0.0 2.8 0.3 0.5 3.9 199635/12-2 (Grosbeak) 4.8 0.7 0.0 0.0 5.5 200935/9-7 (Skarfjell) 16.2 5.3 0.0 0.0 21.5 20126406/6-3 (Mjøsa Sør) 0.0 0.2 0.0 0.0 0.2 20136407/1-6 S 0.0 7.6 0.0 1.9 9.5 20136407/2-5 S (Nona) 2.9 1.3 0.0 0.1 4.3 20096407/2-6 S (Flyndre-tind) 0.0 1.9 0.0 0.5 2.4 20106407/8-6 (Snilehorn) 9.3 3.1 0.0 0.0 12.4 20136506/9-3 (Smørbukk Nord) 0.0 3.6 0.0 1.1 4.7 20136507/3-7 (Idun N) 0.0 0.8 0.0 0.0 0.8 20096507/3-10 (Klara) 1.3 0.2 0.0 0.0 1.5 20136608/10-15 (Svale) 2.3 0.1 0.0 0.0 2.4 20137120/1-3 (Gotha) 15.7 11.9 0.0 0.0 27.5 20137120/2-3 S (Skalle) 0.0 5.0 0.0 0.0 5.0 20117219/8-2 (Iskrystall) 0.0 2.3 0.0 0.2 2.5 20137220/7-2 S (Skavl) 6.1 0.9 0.0 0.0 7.0 20137222/11-1 (Langli-tinden) 0.0 6.0 0.0 0.0 6.0 20087324/8-1 (Wisting Central) 17.9 0.7 0.0 0.0 18.6 2013Total 109.0 85.4 1.2 12.0 208.61) Names in brackets are not official discovery names2) The conversion factor for NGL tonnes to Sm³ is 1.93) The year the first discovery well was drilled
Table 2.7 Resources in discoveries that have not been evaluated

74 • FACTS 2014
APPENdIx 3Pipelines and onshore facilities
Table 3.1 Gas pipelines
Pipeline Operator From – toStart-up
(year)Capacity
(mill. Sm3/d)Dimension
(inches) Length (km)
Investment Billion NOK
2013Europipe Gassco AS Draupner E–Emden
in Germany 1995 46 40 620 24,3Europipe II Gassco AS Kårstø–Dornum in
Germany 1999 71 42 658 10,9Franpipe Gassco AS Draupner E–
Dunkerque in France 1998 55 42 840 11,4Norpipe Gassco AS Ekofisk–Norsea Gas
Terminal in Germany 1977 32 36 440 30,1Oseberg Gas Transport (OGT)
Gassco AS Oseberg–Heimdal2000 35 36 109 2,3
Statpipe (rich gas) Gassco AS Statfjord–Kårstø 25 30 308Statpipe (dry gas) Gassco AS Kårstø–Draupner S 21 28 228Statpipe (dry gas) Gassco AS Heimdal–Draupner S 31 36 155Statpipe (dry gas) Gassco AS Draupner S–Ekofisk 30 36 203Statpipe (all) Gassco AS 1985 52,0Tampen Link Gassco AS Statfjord–FLAGS-
pipeline in the UK 2007 10–27 32 23 2,3Vesterled Gassco AS Heimdal–St. Fergus
in the UK 1978 39 32 360 36,8Zeepipe Gassco AS Sleipner–Draupner S 55 30 30Zeepipe Gassco AS Sleipner–Zeebrugge
im Belgium 1993 42 40 813Zeepipe IIA Gassco AS Kollsnes–Sleipner 1996 74 40 299Zeepipe IIB Gassco AS Kollsnes–Draupner E 1997 73 40 301Zeepipe (all) Gassco AS 27,4Åsgard Transport Gassco AS Åsgard–Kårstø 2000 70 42 707 12,0Langeled (northern pipeline)
Gassco AS Nyhamna–Sleipner2007 75 42 627
Langeled (southern pipeline)
Gassco AS Sleipner–Easington in the UK 2006 72 44 543
Langeled (both) Gassco AS 19,4Norne Gas Transport System (NGTS)
Gassco AS Norne–Åsgard Transport 2001 7 16 128 1,4
Kvitebjørn Gas Pipeline
Gassco AS Kvitebjørn–Kollsnes2004 27 30 147 1,3
Gjøa Gas Pipeline Gjøa–FLAGS in the UK 2010 17 29 131 2,0
Draugen Gas Export
AS Norske Shell
Draugen–Åsgard Transport 2000
2 bn. Sm3/yr. 16 78 1,3
Grane Gas Pipeline Statoil Petroleum AS
Heimdal–Grane2003
3,6 bn. Sm3/yr. 18 50 0,3
Haltenpipe Gassco AS Heidrun–Tjeldbergodden 1996
2 bn. Sm3/yr. 16 250 3,3
Heidrun Gas Export
Statoil Petroleum AS
Heidrun–Åsgard Transport 2001
4 bn. Sm3/yr. 16 37 1,0

FACTS 2014 • 7574 • FACTS 2014
Tabell 3.2 Oil and condensate pipelines
Pipeline Operator From – toStart-up
(year)Capacity
(Sm3/d)Dimension
(inches) Length (km)
Investment Billion NOK
2013Grane Oil Pipeline Statoil
Petroleum ASGrane–Sture Terminal 2003 34 000 29 220 1,8
Kvitebjørn Oil Pipeline
Statoil Petroleum AS
Kvitebjørn–Mongstad (connected to the Y-connection on Troll Oil Pipeline II) 2004 10 000 16 90 0,5
Norpipe Oil Norpipe Oil AS Ekofisk–Teeside in the UK 1975
53 mill. Sm3/yr. 34 354 18,5
Oseberg Transport System
Statoil Petroleum AS
Oseberg A–Sture Terminal 1988 121 000 28 115 10,9
Sleipner Øst Condensate Pipeline
Statoil Petroleum AS
Sleipner A–Kårstø1993 32 000 20 245 1,8
Troll Oil Pipeline I Statoil Petroleum AS
Troll B–Mongstad1995 42 500 16 86 1,4
Troll Oil Pipeline II Statoil Petroleum AS
Troll C–Mongstad1999 40 000 20 80 1,3
Huldra Condensate Statoil Huldra-Veslefrikk 2001 7900 8 16 0,4Gjøa Oil Pipeline GDF SUEZ E&P
Norge ASGjøa – Troll Oil Pipeline II 2010
5,4 mill. Sm3/yr. 16 55

76 • FACTS 2014
Onshore facility Location Description and productsKollsnes gas treatment facility
Øygarden municipality in Hordaland
The gas treatment plant at Kollsnes is part of Gassled. At Kollsnes, the wellstream is separated into gas and condensate. The gas is dehydrated and compressed before it is shipped to the Continent through two pipelines to Sleipner and Draupner. The capacity is 143 million Sm3 of dry gas per day and 9780 Sm3 of condensate per day.
Kårstø gas processing and condensate facility
Tysvær municipality in Rogaland
Rich gas and unstabilised condensate arrive at Kårstø. In the process facility, these raw materials are separated into dry gas which is transported via two pipelines from Kårstø to Europe and six different liquid products which are stored and shipped out from Kårstø. The gas processing facility can handle 88 million Sm3 of rich gas per day. The condensate facility has a capacity of about 5.5 million tonnes of non-stabilised condensate per year. The capacity for ethane recovery at Kårstø is 950 000 tonnes per year.
Mongstad Terminal Lindås and Austrheim municipalities in Hordaland
Three quay facilities for ships up to 400 000 tonnes. 3 mountain caverns totalling 1.5 million m3 of crude oil. Receives crude oil by ship from e.g. Gullfaks, Statfjord, Draugen, Norne, Åsgard and Heidrun and is the landing terminal for the oil pipelines from Troll B, Troll C, Fram, Kvitebjørn, Gjøa, Vega and Vega Sør.
Nyhamna gas treatment facility
Aukra municipality in Møre og Romsdal
The process facility for Ormen Lange at Nyhamna is a conventional facility for gas dehydration, compression, gas export, condensate separation/stabilisation/storage as well as fiscal metering of gas and condensate. The facility has a capacity of 70 million Sm3 of dry gas per day at a receiving pressure of 90 bar.
Melkøya LNG facility Hammerfest municipality in Finnmark
The untreated wellstream from the Snøhvit field is routed through a 143-kilometre long pipeline to the facility on Melkøya for processing and ship transport. At the onshore facility, condensate, water and CO2 are separated from the wellstream before the natural gas is cooled to liquid form (LNG) and stored in dedicated tanks. The pipeline has an available technical capacity of 7.7 million Sm3 per year. The CO2 that is separated from the natural gas is returned to the Snøhvit field where it is injected into a separate formation under the oil and gas.
Sture Terminal Øygarden municipality in Hordaland
The Sture terminal receives oil and condensate through the pipeline from Oseberg A, from the Oseberg, Veslefrikk, Brage, Oseberg Sør, Oseberg Øst, Tune and Huldra fields. The terminal also receives oil from the Grane field through the Grane oil pipeline. The Sture facility includes two quay facilities that can receive oil tankers up to 300 000 tonnes, five crude caverns with a capacity of 1 million Sm3, an LPG cavern holding 60 000 Sm3 and a ballast water cavern holding 200 000 m3. A fractionation plant processes unstabilised crude from the Oseberg field into stable crude oil and LPG blend.
Tjeldbergodden Aure municipality in Møre og Romsdal
Methanol plant. The gas deliveries through Haltenpipe amount to about 0.7 billion Sm3 per year, which yields 830 000 tonnes of methanol. An air gas plant has been built in connection with the methanol plant. Tjeldbergodden Luftgassfabrikk DA also has a smaller fractionation and LNG facility with a capacity of 35 million Sm3 per year.
Vestprosess Lindås municipality in Hordaland
The Vestprosess DA company owns and operates a transport system and separation facility for wet gas (NGL). Through a 56-kilometre long pipeline, unstabilised NGL is shipped from the gas terminal at Kollsnes via the oil terminal at Sture and on to Mongstad. At Mongstad, naphtha and LPG are separated first. The naphtha is used as a raw material in the refinery, while the LPG is fractionated in a separate process facility. The fractionation products, propane and butane, are stored in caverns for subsequent export.
Tabell 3.3 Onshore facilities in Norway

FACTS 2014 • 7776 • FACTS 2014
1 Sm3 oil = 1.0 Sm3 o.e.1 Sm3 condensate = 1.0 Sm3 o.e..1000 Sm3 gas = 1.0 Sm3 o.e.1 tonne NGL = 1.9 Sm3 o.e.
Gas 1 cubic foot 1 000.00 Btu1 cubic metre 9 000.00 kcal1 cubic metre 35.30 cubic feet
Crude oil 1 Sm3 6.29 barrels1 Sm3 0.84 toe1 tonne 7.49 barrels1 barrel 159.00 litres1 barrel per day 48.80 tonnes per year1 barrel per day 58.00 Sm3 per year
Approximate energy contentMJ
1 Sm³ natural gas 401 Sm³ crude oil 35 5001 tonne coal equivalent 29 300
Conversion factors for volume1 Sm3 crude oil = 6.29 barrels1 Sm3 crude oil = 0.84 tonnes crude oil
= (average for oil from the Norwegian continental shelf )
1 Sm3 gas = 35.314 cubic feet
Conversion factors between various units of energy
MJ kWh BTU1 MJ Megajoule 1 0.2778 947.801 kWh kilowatt hour 3.6 1 3412.101 BTU British thermal unit 0.001055 0.000293 1
Oil equivalents (abbreviated o.e.) is a term used to sum up volumes of oil, gas, NGL and condensate. Such a total can be arrived at by applying a common property, such as energy, mass, volume or sales value. The Norwegian Petroleum Directorate uses a volumetric conversion
of NGL to liquid and an energy conversion factor for gas, based on typical properties (*) on the Norwegian continental shelf.
* The properties of oil, gas and NGL vary from field to field and over time, but a common and constant conversion factor is used in the resource accounts for all discoveries and fields.
APPENdIx 4Conversion factors

What do you think about Facts 2014? Please send your comments to [email protected]

New native apps for Android and Windows Phone are now available
• All the fields • All the wells • All the production • All the operators • All the licenses • News, maps and more
www.oilfacts.no
Akersgata 59P. O. Box 8148 Dep. NO-0033 OsloTelephone: +47 22 24 90 90
www.regjeringen.no/oedwww.faktaheftet.noe-mail: [email protected]
Professor Olav Hanssens vei 10P. O. Box 600, NO-4003 StavangerTelephone: +47 51 87 60 00
www.npd.noe-mail: [email protected]
2014