Embed Size (px)
Citation preview

1
1
58
% 43
%
37
%
17
%
0%
50%
100%
Sports/recreation
The Arts Religiousactivities
Clubs
2011-12 Student & Parent Census ISSUE 11, June 2015
TDSB Students (Grades 7-12): Out-of-school Experiences
This Fact Sheet highlights the TDSB’s 2011-12 Student and Parent Census findings on students’ experiences outside of
school including extra-curricular activities, screen/internet and leisure time, home responsibilities, and part-time work.
There were noticeable differences in students’ experiences outside of school according to age, gender, family socio-
economic status (SES), and self-identified racialized background and sexual orientation.
FACTS
1/4
General Population
Sports, arts, and music were common out-of-school extra-
curricular activities for students. However, the older the students,
the lower their level of participation in these activities.
According to the TDSB’s 2012 Parent Census, over half (58%) of
students in Kindergarten to Grade 6 participated in sports and
recreational activities regularly (weekly or monthly) outside of
school, 43% in arts activities (including music, visual arts, drama
or dance), and lower percentages in other activities.
Extra-curricular Activities Outside of School
Differences by Demographic Groupings
Students’ patterns and rates of participation in out-of-school extra-curricular activities varied by gender, SES,
and self-identified ethno-racial background and sexual orientation.
Outside of school, male students were more likely
than their female counterparts to join athletic
activities, especially team sports, on a weekly or
monthly basis. The reverse pattern is true in arts
and music activities. However, gender differences
were small in religious or cultural activities.
The out-of-school extra-curricular participation rates
declined when students got older. While about half of
the students in Grades 7-8 participated in sports reg-
ularly outside of school, the proportion dropped to
about a third among secondary school students. The
relative percentages in arts and music also de-
creased from about a third to about a quarter. How-
ever, the percentages of middle and high school stu-
dents who regularly attended religious or cultural ac-
tivities were somewhat similar.
50
%
45
%
37
%
34
%
30
%
20
%
37
%
34
%
28
%
25
%
27
%
16
%
0%
50%
100%
Individualsports
Teamsports
Music Arts Religiousactivities
Culturalactivities
Extra-curricular activities, Grades 7-8 and 9-12
(% reporting “weekly” or “monthly”)
Grades 7-8 Grades 9-12
45
%
48
% 28
%
20
%
27
%
16
%
36
%
25
%
33
%
36
%
29
%
19
%
0%
50%
100%
Individualsports
Teamsports
Music Arts Religiousactivities
Culturalactivities
Extra-curricular activities, Grades 7-12, by Gender
(% reporting “weekly” or “monthly”)
45
%
48
%
28
%
20
%
36
%
25
%
33
%
36
%
0%
50%
100%
Individualsports
Team sports Music Arts
Male Female
Crop
Extra-curricular activities, JK-Grade 6
(% reporting “weekly” or “monthly”)

2
2
TDSB Students (Grades 7-12): Out-of-school Experiences
Extra-curricular Activities Outside of School (Cont’d)
2/4
Students from SES groups with higher family incomes had greater opportunities than those from the lower income bracket
groups to participate in extra-curricular activities outside of school - especially in sports and recreation, arts and music, and
club activities. However, the reverse is true in religious activities.
Out-of-school extra-curricular
activities
Group most likely to participate
Group least likely
to participate Overall
Individual sports White (45%)
Middle Eastern (44%) Aboriginal (30%) 41%
Team sports White (45%)
Black (43%) East Asian (24%) 37%
Music East Asian (37%) Aboriginal (22%)
Middle Eastern (23%) 30%
Arts White (32%) Middle Eastern (24%)
South Asian (24%) 28%
Religious activities
South Asian (43%)
Black (39%) White (15%) 28%
Cultural activities
Aboriginal (31%)
South Asian (28%) White (11%) 17%
Screen and Internet Activities General Population
While similar proportions of middle and secondary school students spent over two hours per day watching TV and/
or playing computer games, older students also tended to spend more time on other internet activities after school.
Similar proportions of middle and secondary school
students spent over two hours per day watching TV or
videos, and/or playing computer games after school.
Regarding accessing the internet for personal use or
social networking or texting, secondary school students
were more likely than students in Grades 7-8 to spend
over two hours per day on social media.
87
%
59
% 24
%
23
%
68
% 49
% 34
%
18
%
54
% 42
%
39
%
15
%
44
%
36
%
44
%
13
%
38
%
32
%
43
%
13
%
0%
50%
100%
Sports/ recreation The Arts Religious activities Clubs
87
%
54
%
44
%
60
%
85
%
49
%
43
%
43
%
83
%
46
%
41
%
33
%
82
%
44
%
39
%
28
%
78
%
43
%
40
%
24
%
0%50%
100%
Attend parent/ teacher interviewsAttend meetings and events at schoolCommunicate with teachersVolunteer at school (includes "Sometimes")
$100,000+ $75,000 to $99,999 $50,000 to $74,999 $30,000 to $49,999 Less than $30,000
Crop below
Extra-curricular activities, JK-Grade 6, by Family Income
(% reporting “weekly” or “monthly”)
There seems to be an association between the types
of extra-curricular activities students tended to
participate in outside of school and their ethno-racial
backgrounds. For instance, while Aboriginal students
were the least likely to participate in out-of-school
music activities, they were the most likely to be
involved in cultural activities. On the other hand, White
students were the most likely to be active in sports
outside of school, but they were the least likely to
attend religious or cultural activities. (see table for the
participation patterns of other racialized groups.)
Among students in Grades 9-12, LGBTQ students,
compared to their heterosexual counterparts, were
more actively involved in arts and music (24% versus
41%, and 27% versus 32% respectively), but much
less active in either individual sports (38% versus
30%) or team sports (35% versus 23%), and religious
activities (27% versus 18%).
Extra-curricular activities, Grades 7-12 , by Ethno-racial Background
(% “most” or “least” likely to participate)
28
% 24
%
21
%
23
%
31
% 24
%
35
%
32
%
0%
25%
50%
Watching TVor videos
Playingcomputer/
video games
Spendingtime on theinternet for
personal use
Socialnetworking/
texting
Daily screen time, by Grade
(% reporting more than 2 hours)
Grades 7-8 Grades 9-12

3
3
TDSB Students (Grades 7-12): Out-of-school Experiences
3/4
Screen and Internet Activities (Cont’d)
Differences by Demographic Groupings
The types of screen and internet activities and the amount of time spent on these activities varied according to
gender, SES, racialized grouping, and sexual orientation.
While there was no gender difference in terms of the amount of time spent on watching TV or videos, males were much
more likely than females to spend over two hours per day on computer games (33% versus 14%). The reverse is,
however, true in terms of social networking or texting (35% of females versus 25% of males).
More girls than boys spent over two hours after school on
various leisure activities (39% versus 31%).
Students with parents from lower SES job sectors were more
likely than those from the higher SES sectors (38% versus
31%) to spend time on leisure activities after school.
More Aboriginal, Latin American, Black, and Southeast Asian
students spent time on leisure activities than students from
other racialized groups.
Nearly half (47%) of LGBTQ students in secondary school
spent over two hours each school day on leisure activities; the
proportion among heterosexual students was lower (35%).
Over a third of students in Grades 7-8 and Grades 9-12 spent more than two hours per day after school on such leisure
activities as going to the movies, listening to music, going to the mall, hanging out with friends, or reading for leisure.
General Population
Over a third of students in Grades 7-12 spent over two hours per school day on different leisure activities.
Differences by Demographic Groupings
The amount of time students spent on leisure activities differed according to their socio-demographic characteristics.
Other Leisure Activities
Daily screen time, Grades 7-12, by SES
(% reporting more than 2 hours)
Other leisure activities, Grades 7-12, by Ethno-racial Background
(% reporting more than 2 hours)
24
%
17
%
25
%
24
%
29
%
21
%
29
%
29
%
32
%
25
%
32
%
33
%
33
%
25
%
30
%
32
%
32
%
25
%
32
%
30
%
0%50%
100%
Watching TV or videosPlaying computer/ video gamesSpending time on the internet for personal useSocial networking/ texting
Professional and senior managementSemi-professional and middle managementSkilled/semi- skilled clerical and tradesUnskilled clerical and tradesNon-remunerative
Crop below2
4% 17
%
25
%
24
%
29
% 21
%
29
%
29
%
32
% 25
%
32
%
33
%
33
% 25
%
30
%
32
%
32
% 25
%
32
%
30
%
0%
25%
50%
Watching TVor videos
Playing computer/video games
Spending timeon the internetfor personal use
Socialnetworking/
texting
Compared to their heterosexual counterparts in secondary school, LGBTQ students spent more time after school on
screen activities (watching TV/videos and computer games) and especially social media.
Students from lower SES backgrounds based on parent
occupations (e.g., unskilled), were more likely than
those from higher SES sectors (i.e., professional/
managerial) to spend time watching TV/videos, playing
computer games, and on social media after school.
Among different ethno-racial groups, Aboriginal, Black,
and Southeast Asian students were most likely to spend
over two hours per day after school watching TV/videos
compared to the general student population (41%, 40%,
and 38% versus 30%). Southeast Asian and Aboriginal
students were also more likely than others to spend
time on computer/video games (34% and 31% versus
24%). These two groups of students, plus Latin
American students, also spent more time on social
networking and texting compared to others (from 37%
to 45% versus 30%).
10
%
20
%
30
%
40
%
50
%
60
%
70
%
80
%
90
%
0%50%
100%
Aboriginal Black East Asian
Latin American Middle Eastern Mixed
South Asian Southeast Asian White
Crop
53
% 46
%
45
%
44
%
43
%
35
%
34
%
30
%
28
%
0%
50%
100%
Other leisure activities
4
4
Differences by Demographic Groupings
More girls than boys spent over an hour each day on household
chores (26% versus 20%), or looking after siblings or family
members (23% versus 19%).
Students from lower SES job sectors were more likely than those
from higher SES sectors to spend time on household chores (24%
versus 19%), or looking after someone at home (23% versus 18%).
Students from certain racialized groups seemed to have more
household responsibilities than others (see figure).
Among secondary students, LGBTQ were more likely than
heterosexual students to spend time on household chores (31%
versus 24% ) and looking after family members (26% versus 20%).
TDSB Students (Grades 7-12): Out-of-school Experiences
4/4
Responsibilities at Home General Population
Between a fifth and a quarter of students in Grades 7-12 spent over an hour each day on various home responsibili-
ties. Students from certain demographic backgrounds seemed to have more responsibilities at home than others.
10
%
20
%
30
%
40
%
50
%
60
%
70
%
80
%
90
%
0%
50%
100%
Aboriginal Black East Asian Latin American Middle Eastern Mixed South Asian Southeast Asian White
Crop below
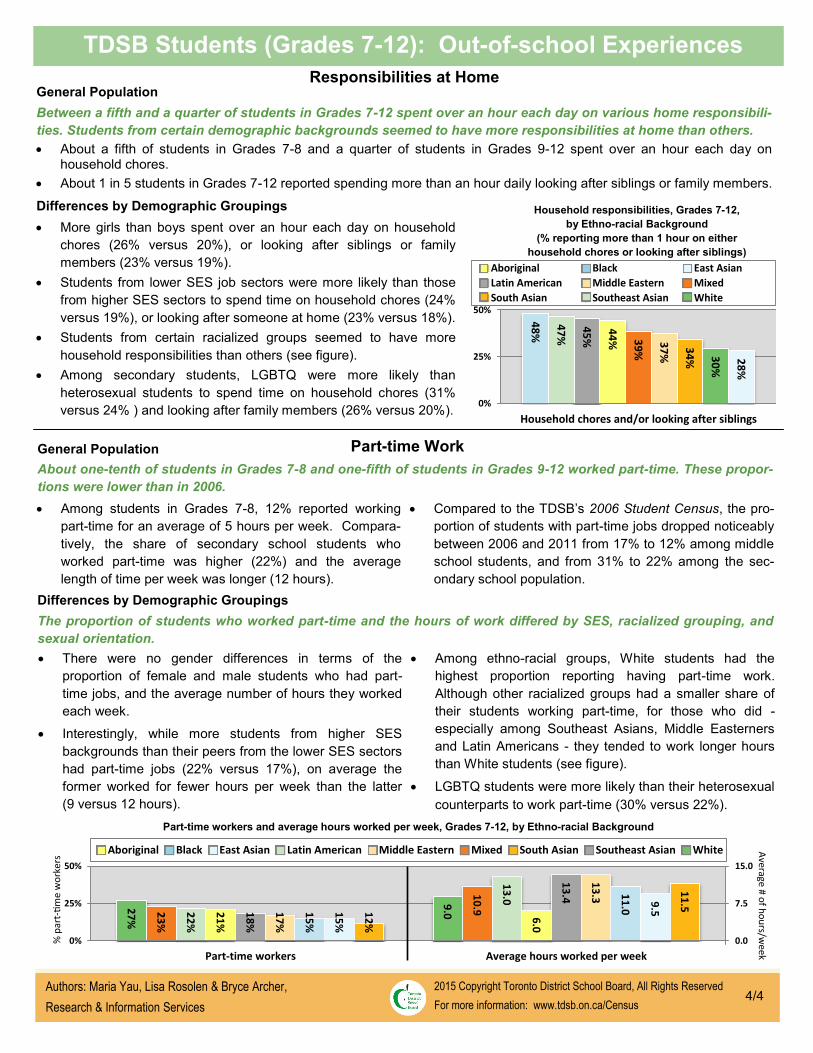
Part-time workers and average hours worked per week, Grades 7-12, by Ethno-racial Background
2015 Copyright Toronto District School Board, All Rights Reserved
For more information: www.tdsb.on.ca/Census
Authors: Maria Yau, Lisa Rosolen & Bryce Archer,
Research & Information Services
General Population
About one-tenth of students in Grades 7-8 and one-fifth of students in Grades 9-12 worked part-time. These propor-
tions were lower than in 2006.
Among students in Grades 7-8, 12% reported working
part-time for an average of 5 hours per week. Compara-
tively, the share of secondary school students who
worked part-time was higher (22%) and the average
length of time per week was longer (12 hours).
Compared to the TDSB’s 2006 Student Census, the pro-
portion of students with part-time jobs dropped noticeably
between 2006 and 2011 from 17% to 12% among middle
school students, and from 31% to 22% among the sec-
ondary school population.
Differences by Demographic Groupings
The proportion of students who worked part-time and the hours of work differed by SES, racialized grouping, and
sexual orientation.
10
%
20
%
30
%
40
%
50
%
60
%
70
%
80
%
90
%
0%50%
100%
Aboriginal Black East Asian
Latin American Middle Eastern Mixed
South Asian Southeast Asian White
Crop
Household responsibilities, Grades 7-12,
by Ethno-racial Background
(% reporting more than 1 hour on either
household chores or looking after siblings)
About a fifth of students in Grades 7-8 and a quarter of students in Grades 9-12 spent over an hour each day on household chores.
About 1 in 5 students in Grades 7-12 reported spending more than an hour daily looking after siblings or family members.
48
%
47
%
45
%
44
% 39
%
37
%
34
% 30
%
28
%
0%
25%
50%
Household chores and/or looking after siblings
Part-time Work
% p
art-
tim
e w
ork
ers
Average # o
f ho
urs/w
eek
11
.59.5
11
.0
13
.3
13
.4
6.0
13
.010
.99.0
0.0
7.5
15.0
Average hours worked per week
27
%
23
%
22
%
21
%
18
%
17
%
15
%
15
%
12
%
0%
25%
50%
Part-time workers
There were no gender differences in terms of the
proportion of female and male students who had part-
time jobs, and the average number of hours they worked
each week.
Interestingly, while more students from higher SES
backgrounds than their peers from the lower SES sectors
had part-time jobs (22% versus 17%), on average the
former worked for fewer hours per week than the latter
(9 versus 12 hours).
Among ethno-racial groups, White students had the
highest proportion reporting having part-time work.
Although other racialized groups had a smaller share of
their students working part-time, for those who did -
especially among Southeast Asians, Middle Easterners
and Latin Americans - they tended to work longer hours
than White students (see figure).
LGBTQ students were more likely than their heterosexual
counterparts to work part-time (30% versus 22%).