Embed Size (px)
Citation preview

Journal of International Development
J. Int. Dev. 15, 675–692 (2003)
Published online in Wiley InterScience (www.interscience.wiley.com). DOI: 10.1002/jid.1017
FACTORS THAT INFLUENCE THEEXPANSION OF THE MICROENTERPRISE
SECTOR: RESULTS FROM THREENATIONAL SURVEYS IN ZIMBABWE
LISA DANIELS*
Department of Economics, Washington College, Chestertown, MD, USA
Abstract: Using panel data from three nationwide surveys in Zimbabwe, an error
components model is estimated to explore the factors that drive the small-enterprise sector.
Among labour-intensive industries in urban areas, entry of new enterprises appears to be
driven by surplus labour. This is supported by low barriers to entry and the negative
relationship between economic growth and entry rates. In contrast, entry in capital-intensive
industries is unrelated to economic growth and it is characterized by significant barriers to
entry, including capital, working capital, and proprietor experience. With the exception of
labour-intensive industries in rural areas, entry in all other small-enterprise industries is
positively correlated with agricultural income. Copyright # 2003 John Wiley & Sons, Ltd.
1 INTRODUCTION
Limited opportunities in the formal sector and high unemployment rates in many African
countries have led to increased attention on the micro- and small-enterprise (MSE) sector.
This is not surprising given the relatively high proportion of the population that is engaged
in MSEs in many countries. For example, the MSE sector employs 22 per cent on average
of the adult population in five southern African countries compared to only 15 per cent in
the formal sector.1 Furthermore, Mead (1993) reports that over 40 per cent of the increase
in the labour force in the 1980s was absorbed by the MSE sector in five countries in
southern and eastern Africa.
Copyright # 2003 John Wiley & Sons, Ltd.
*Correspondence to: Dr Lisa Daniels, Department of Economics, Washington College, 300 Washington Avenue,Chestertown, MD 21620, USA. E-mail: [email protected] MSE is defined as a business activity that employs 50 or fewer workers and markets at least 50 per cent of itsoutput. The adult population is defined as 15 years or older. The five countries include: Zimbabwe (Daniels,1994), Botswana (Daniels and Fisseha, 1992), Malawi (Daniels and Ngwira, 1992), Lesotho (Fisseha, 1991), andSwaziland (Fisseha and McPherson, 1991). The formal sector is defined as the set of businesses that is registered.

Because of the growing numbers of MSEs and limited employment opportunities in the
formal sector, many policy makers have turned to the MSE sector as a source of
employment creation and economic growth. The sustainability of employment in the
MSE sector, however, is uncertain. Furthermore, the relationship between economic
growth and the MSE sector is not well understood.
The lack of information on employment creation and economic growth arises from
methodological limitations of previous studies. For example, many studies have focused
on a set of firms at one point in time.2 While these studies provide valuable information on
the existing industrial structure, they do not examine entry and exit of MSEs. Furthermore,
these studies cannot document the relationship between economic growth and changes in
the MSE sector. Studies that follow a set of firms over time improve the ability to examine
changes within firms, however, they do not examine entry of new MSEs. Despite these
limitations, a limited number of studies have provided rough estimates of entry rates in
developing countries (Liedholm, 1990; Cortes et al., 1987). Liedholm estimated entry
based on existing MSEs for a one-year period in Sierra Leone. Because the estimates did
not include firms that opened and folded during the time period under examination, the
estimates had a downward bias. Cortes et al. estimated entry rates based on government
statistics for two cities in Colombia. These rates also had a downward bias, however,
because they did not include small establishments and may not have included firms that
opened and closed within the time period. Although both studies estimate entry rates, they
do not explore the factors that influence entry.
This paper addresses the limitations mentioned above by using information from three
nationwide surveys conducted in 1991, 1993 and 1998, which covered a total of 17 551
existing MSEs and 2556 closed MSEs in Zimbabwe. First, a more accurate measure of
entry is estimated based on existing and closed MSEs. Second, the determinants of entry
are explored using industrial organization theory as a conceptual framework. While this
framework has been used extensively to examine entry in industrialized countries, the
factors that drive MSE entry have not been systematically explored in developing
countries. Finally, unlike previous studies, this study measures the relationship between
MSE entry and economic growth. With this improved data set, expanded conceptual
framework, and incorporation of economic growth, an error components model is
estimated to examine the determinants of MSE entry over the ten-year period from
1988 to 1997.3 Several questions will be addressed. What is the relationship between
economic growth and the entry of MSEs? Are MSEs driven by surplus labour or market
demand? For example, do people turn to the MSE sector as a means of survival during
difficult economic times or are new firms driven by consumer demand for MSE products?
The results suggest that both labour surplus and market demand play a role in firm entry.
Among labour-intensive industries in urban areas, entry appears to be driven by an excess
supply of labour, as indicated by the negative relationship between economic growth and
entry rates.4 Furthermore, the low barriers to entry in these industries suggests that
2These studies include but are not limited to: Daniels, 1994; Daniels and Fisseha, 1992; Daniels and Ngwira, 1992;Fisseha, 1991; Fisseha and McPherson, 1991; McPherson, 1991, 1998; Parker with Torres, 1994; Daniels et al., 1995.3The microenterprises included in the three surveys comprise all business activities that employ 50 or fewerworkers and market at least 50 per cent of their output. There is no distinction made between formal or informalenterprises. Although both registered and unregistered enterprises are included in the survey, the majority ofenterprises included were not registered at the time of the survey.4An industry is defined as ‘the set of firms that produce products that are viewed as close substitutes byconsumers’ (Varian, 1987). In particular, industries within the MSE sectoer will be categorized by the standardindustrial classification four-digit codes.
676 L. Daniels
Copyright # 2003 John Wiley & Sons, Ltd. J. Int. Dev. 15, 675–692 (2003)

they provide an alternative source of income for unskilled labour with limited access to
capital. In contrast, entry in capital-intensive industries is characterized by significant
barriers to entry, including capital (i.e., expenditures on buildings and equipment),
working capital (i.e., cash needed for weekly operating expenses) and proprietor
experience. Although entry into capital-intensive industries is not related to economic
growth, it does not appear to be driven by surplus labour. Finally, entry into all industries,
with the exception of labour-intensive industries in rural areas, is positively correlated
with agricultural income.
This paper begins with hypotheses related to MSE entry in Section 2 followed by the
sampling methods used for this study in Section 3. Section 4 describes the ten-year period
under review, including the impact of the drought and the major components of the
structural adjustment program introduced in 1991. Changes in the MSE sector from 1988
to 1997 are described in Section 5 followed by the results of the entry model in Section 6.
Finally, Section 7 offers brief conclusions.
2 HYPOTHESES RELATED TO MSE ENTRY
There are two conflicting views about the factors that drive firm entry: the market-demand
hypothesis and the labour-supply hypothesis. The market-demand hypothesis assumes that
firm entry is primarily driven by consumer demand. This hypothesis has been supported by
several studies that have shown that the demand for MSE products increases as rural
household income increases (Deb and Hossain, 1984; Hazell and Roell, 1983; King and
Byerlee, 1978). Alternatively, the labour-supply hypothesis holds that firm entry is driven
by an excess supply of labour. In this case, people enter MSE industries in search of
alternative income sources regardless of demand. Proponents of this hypothesis believe
that MSEs contribute little to the economy. While many people believe that both
hypotheses are relevant, some articles suggested a more polarized view. For example,
Biggs et al. (1988) report that ‘as agents of economic development, very small enterprises
are, to put it bluntly, of little interest’. Although the labour-supply hypothesis has not been
empirically supported, Daniels (1994) shows that the majority of MSEs in Zimbabwe are
in low-profit industries that require little skill or capital.
This paper argues that both hypotheses may be correct, but that they may apply to
different MSE industries. In particular, some industries within the MSE sector may be
driven primarily by supply factors while others may be more affected by demand factors.
Firms that are driven primarily by supply factors would most likely include labour-
intensive MSE industries that are characterized by low costs of entry. These include
industries such as basket making, vending farm products, and crocheting as illustrated in
Table 1. Limited capital, skills, or experience would be necessary to enter these industries.
Alternatively, firms driven by demand factors may would most likely include capital-
intensive industries that require large expenditures on capital and high levels of skills or
experience.5 These include industries such as general traders, grocers, auto works, and
electrical repairs.
5The chow test, which tests the hypothesis that some or all of the regression coefficients are different in subsets ofthe model, is used in the entry model presented later in the paper. The results reject the null hypothesis that thecoefficients are the same within labour- and capital-intensive industries. This suggests that entry of capital- andlabour-intensive firms is driven by different factors.
The Expansion of the Microenterprise Sector 677
Copyright # 2003 John Wiley & Sons, Ltd. J. Int. Dev. 15, 675–692 (2003)

Within the industrial organization literature, the factors that influence entry are
separated into two categories: barriers to entry and entry-inducing factors. Barriers to
entry are expected to be negatively correlated with entry. Studies in the US, Canada and
Europe indicate that significant barriers to entry include market concentration, advertising,
economies of scale, capital expenditures, human capital requirements, and government
policies (Acs and Audretsch, 1989; Duetsch, 1985; Duetsch, 1975; Gorecki, 1975;
Hamilton, 1985; Hause and Du Rietz, 1984; Khemani and Shapiro, 1986; MacDonald,
1986; Mansfield, 1962; Orr, 1974). If it is true that capital-intensive MSEs are driven by
market demand, these factors should be significant barriers to entry. Among labour-
intensive MSEs, however, barriers to entry may not exist.
Entry-inducing factors are expected to be positively correlated with entry. The primary
entry-inducing factor is high profits. Economic theory predicts that potential entrepreneurs
will be attracted to industries with high profits. The ability to enter an industry with high
profits may, however, be affected by an individual’s experience or their access to capital.
Although MSEs within capital-intensive industries generate higher profits as illustrated in
Table 1, many individuals are forced to choose labour-intensive industries that require low
start-up capital, low working capital, and can be opened within their towns or at their home.
In addition to growth within individual MSE industries, growth within the economy
should also affect entry. As the gross domestic product increases, proprietors within
labour-intensive industries may leave the MSE sector in search of formal sector jobs.
Alternatively, within capital-intensive industries, an increase in GDP may lead to higher
entry rates if these MSEs are driven by market demand.
Table 1. Capital expenditures is based on initial expenses for building and equipment
Sector Average capital expenditures Average annual profits(US dollars) (US dollars)
Capital-intensive industries
General trader 3532 5678
Grocery 876 19 250
Auto works 872 4173
Electrical repair 560 1438
Welding 315 1372
Hairdresser/barber 230 2428
Construction 161 4692
Carpentry 78 794
Tailor/dressmaker 75 599
Average 744 4491
Labour-intensive industries
Knitting 71 600
Vending drinks 63 365
Shoework/repairs 47 111
Weaving 44 736
Vending hardware 21 5063
Vending wood-based products 21 797
Vending garments 20 734
Vending food 13 386
Crocheting 6 272
Vending farm products 4 282
Grass/cane/bamboo 0 219
Average 28 870
Source: 1993 and 1998 Survey Data.
678 L. Daniels
Copyright # 2003 John Wiley & Sons, Ltd. J. Int. Dev. 15, 675–692 (2003)

3 SAMPLING METHODS6
The data for this study were collected by three nationwide surveys of MSEs in Zimbabwe
funded by the United States Agency for International Development (McPherson, 1991;
Daniels, 1994; McPherson, 1998). An MSE was defined as any business activity that
employed 50 or fewer employees and marketed at least 50 per cent of its product.7
The sample for the 1991 survey was selected by using a stratified, one-stage cluster
sampling technique. This involved three steps. First, the country was divided into eight
strata based on population density and commercial activities. Urban areas were defined as
cities with more than 20 000 inhabitants as estimated by the 1982 census. Within the urban
areas, four strata were used: high-density areas, low-density areas, commercial districts
and industrial areas. The four strata in rural areas were small towns, growth points, district
councils, and rural councils.8 Second, a random sample of enumeration areas (EAs) within
each stratum was selected. Finally, all households, businesses, and mobile vendors in each
selected EA were interviewed. Individuals at households were also asked if they had
operated a business in the past that had folded.
In the 1993 and 1998 surveys, a subset of EAs from the 1991 study was revisited. The
reduction in the number of EAs was based on an ex-post analysis of the sample size in
1991 that indicated over-sampling in low-density areas, commercial districts, industrial
areas, and growth points and under-sampling in the remaining strata (McPherson and
Parker, 1993). A total of 17 551 proprietors from existing MSEs and 2556 folded MSEs
were interviewed in the three surveys combined.
4 DESCRIPTION OF THE TEN-YEAR PERIOD UNDER REVIEW
As described above, this paper is based on three national surveys of microenterprises
conducted in 1991, 1993 and 1998. Because the surveys also included retrospective
questions and questions about enterprises that folded prior to each survey, annual data on
entry and exit of MSEs from 1988 to 1997 can be constructed. During this period, the
growth rate of the real GDP fluctuated from a high of 7.3 per cent in 1996 to a decrease of
nine per cent in 1992 as illustrated in Table 2. These large fluctuations in real GDP growth
can be partially explained by two major events that affected not only the microenterprise
sector, but the economy as a whole: the introduction of the Economic Structural
Adjustment Program (ESAP) and the drought of the 1991–92 agricultural season. Each
of these and their potential impact on the microenterprise sector are described in this
section.
ESAP was introduced in 1991 to promote higher medium- and long-term growth and to
reduce poverty in Zimbabwe (Government of Zimbabwe, 1991). There were four primary
components of the programme: deregulation, trade liberalization, fiscal policy reforms and
monetary policy reforms. The first component, deregulation, deals with the removal of
6A complete description of the methodology used to collect this data can be found in McPherson (1991), Daniels(1994) and McPherson (1998).7Although 50 employess is high for a definition of micro and small enterprises, only 1.6 per cent of all enterpriseshad more than 10 employees. The results of the model primarily reflect, therefore, smaller enterprises with ten orfewer employees.8Growth points are towns designated by the government to promote rural development. Incentives are provided inthese towns to promote the establishment and growth of businesses. District and rural councils are administrativeareas with low population densities.
The Expansion of the Microenterprise Sector 679
Copyright # 2003 John Wiley & Sons, Ltd. J. Int. Dev. 15, 675–692 (2003)

many of the regulations controlling business activities. For example, zoning, licensing,
labour market regulations and price and marketing controls have often been cited as
impediments to MSE activities (Hess, 1993; UNIDO, 1988; Jasset and Jirira, 1987). Under
ESAP, plans to change these regulations were intended to ease the operating environment
for MSEs in Zimbabwe.
Trade liberalization, the second component of ESAP, also has implications for MSEs.
Foreign exchange allocation changes and removal of import restrictions under ESAP
could have both a positive and negative impact on MSEs. For example, foreign exchange
liberalization and removal of import restrictions should alleviate input or raw material
shortages frequently identified as a major constraint to MSE activity (Mead and Kunjeku,
1993; Zimconsult, 1992; McPherson, 1991; IMANI, 1990). Greater availability of
imported goods, however, could increase MSE failure rates.
The third component of ESAP, fiscal policy reforms, includes tax and expenditure
reductions. Corporate tax rates were 45 per cent while individual taxes were as high as 60
per cent at the beginning of ESAP. Although this tax structure has been cited repeatedly as
an impediment to MSE activity (Human Resources, 1990; USAID, 1990), tax reductions
do not have a large direct impact on the MSE community because 95 per cent of firms
report that they do not pay taxes. Furthermore, the nationwide survey in 1993 showed that
three-quarters of all firms made less than Z$4801, which was the minimum individual
taxable income in the 1992–93 tax year (Daniels, 1994). The indirect effect of high taxes
may be that firms remain unregistered in order to avoid taxes.
Under the fourth component, monetary policy reforms, interest rates were liberalized
and now play a greater role in allocating credit. Previously banks had a strong incentive to
limit credit to larger, well-established firms. With higher interest rates, investment by
larger firms may decline, but credit is now available to a wider range of firms. The
beneficiaries of this policy are more likely to be medium-sized firms rather than MSEs.
The MSE operating environment was also affected by the drought of the 1991–92
agricultural season. During this period, the southern African region experienced the worst
drought of the century. Rainfall in Zimbabwe was only 43 per cent of the average annual
rainfall from 1970 to 1991. Furthermore, the World Bank estimated that the external debt
increased to more than Z$50 billion in 1992 because of the drought (The Herald, 12 March
Table 2. Changes in the growth rate of real gross domesticproduct in Zimbabwe
Year Percentage change inreal gross domestic product(Constant 1995 US dollars)
1988 7.6
1989 5.2
1990 7.0
1991 5.5
1992 �9.0
1993 1.3
1994 6.8
1995 �0.7
1996 7.3
1997 3.2
Source: World Development Indicators.
680 L. Daniels
Copyright # 2003 John Wiley & Sons, Ltd. J. Int. Dev. 15, 675–692 (2003)
1992). This was partly due to an 80 per cent reduction in the maize harvest and a 35 per
cent reduction in agricultural output compared with the previous year.
The MSE sector was affected by the drought through decreased income levels and
corresponding lower demand for MSE products. For example, results from the 1993
national survey showed that 76 per cent of proprietors in both urban and rural areas
reported that the volume of their business decreased because of the drought. The sector
was also affected by decreased availability of inputs in sectors tied to agriculture and a
corresponding increase in the prices of agricultural raw materials. The results from the
1993 survey showed, for example, that one quarter of all firms closed in 1992 because of
input problems, compared with only eight per cent in 1991 (Daniels, 1994).
In addition to the drought of 1992, Zimbabwe experienced a second drought in 1995.
Unlike the 1992 drought when GDP growth was a negative nine per cent, the growth rate
was negative 0.7 per cent in 1995. Because the second drought had a much smaller impact,
the economy recovered much more quickly over the following year.
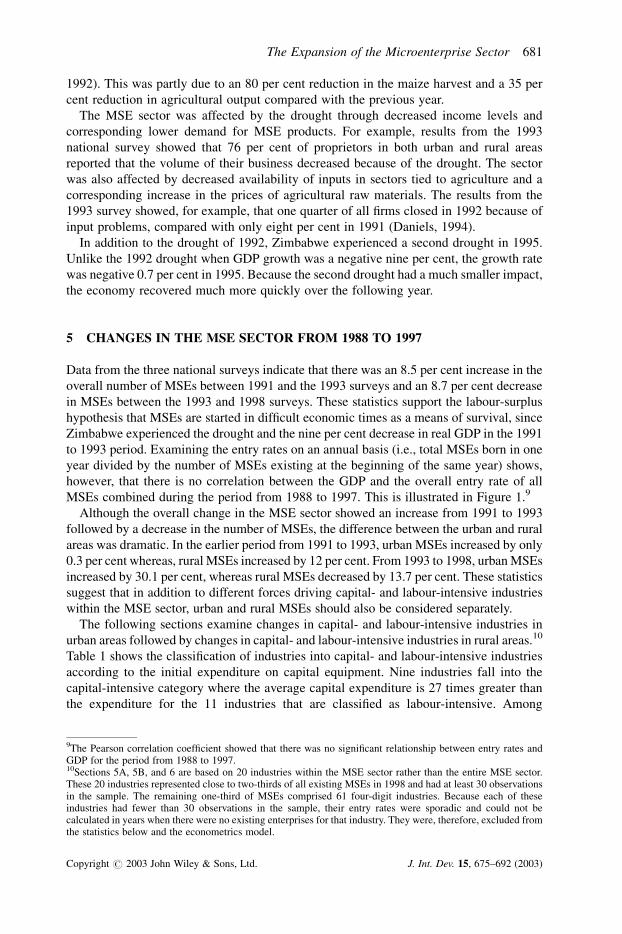
5 CHANGES IN THE MSE SECTOR FROM 1988 TO 1997
Data from the three national surveys indicate that there was an 8.5 per cent increase in the
overall number of MSEs between 1991 and the 1993 surveys and an 8.7 per cent decrease
in MSEs between the 1993 and 1998 surveys. These statistics support the labour-surplus
hypothesis that MSEs are started in difficult economic times as a means of survival, since
Zimbabwe experienced the drought and the nine per cent decrease in real GDP in the 1991
to 1993 period. Examining the entry rates on an annual basis (i.e., total MSEs born in one
year divided by the number of MSEs existing at the beginning of the same year) shows,
however, that there is no correlation between the GDP and the overall entry rate of all
MSEs combined during the period from 1988 to 1997. This is illustrated in Figure 1.9
Although the overall change in the MSE sector showed an increase from 1991 to 1993
followed by a decrease in the number of MSEs, the difference between the urban and rural
areas was dramatic. In the earlier period from 1991 to 1993, urban MSEs increased by only
0.3 per cent whereas, rural MSEs increased by 12 per cent. From 1993 to 1998, urban MSEs
increased by 30.1 per cent, whereas rural MSEs decreased by 13.7 per cent. These statistics
suggest that in addition to different forces driving capital- and labour-intensive industries
within the MSE sector, urban and rural MSEs should also be considered separately.
The following sections examine changes in capital- and labour-intensive industries in
urban areas followed by changes in capital- and labour-intensive industries in rural areas.10
Table 1 shows the classification of industries into capital- and labour-intensive industries
according to the initial expenditure on capital equipment. Nine industries fall into the
capital-intensive category where the average capital expenditure is 27 times greater than
the expenditure for the 11 industries that are classified as labour-intensive. Among
9The Pearson correlation coefficient showed that there was no significant relationship between entry rates andGDP for the period from 1988 to 1997.10Sections 5A, 5B, and 6 are based on 20 industries within the MSE sector rather than the entire MSE sector.These 20 industries represented close to two-thirds of all existing MSEs in 1998 and had at least 30 observationsin the sample. The remaining one-third of MSEs comprised 61 four-digit industries. Because each of theseindustries had fewer than 30 observations in the sample, their entry rates were sporadic and could not becalculated in years when there were no existing enterprises for that industry. They were, therefore, excluded fromthe statistics below and the econometrics model.
The Expansion of the Microenterprise Sector 681
Copyright # 2003 John Wiley & Sons, Ltd. J. Int. Dev. 15, 675–692 (2003)
the MSEs within these industries, 68 per cent were in labour-intensive industries and
32 per cent were in capital-intensive industries.
5.1 Changes in Capital- and Labour-Intensive Industries in Urban Areas
Table 3 shows the percentage change in the number of MSEs in capital- and labour-
intensive industries between 1991 and 1993 and between 1993 and 1998 along with the
average GDP growth rate in these two time periods. In the early period from 1991 to 1993
when the average GDP growth rate was negative 0.73 per cent, the number of MSEs in
capital-intensive industries declined in urban areas, whereas MSEs in labour-intensive
industries increased. From 1993 to 1998 when the GDP growth rate was much higher,
the reverse occurred. Microenterprises in capital-intensive industries increased dramati-
cally, while the number of MSEs in labour-intensive industries declined. These results
support both the market-demand hypothesis and the labour-surplus hypothesis. The
Figure 1. MSE birth rates and GDP growth rate
Table 3. Changes in capital- and labour-intensive industries between the three surveys
Percentage change in number of MSEs and averageGDP growth rate
1991 to 1993 1993 to 1998
Urban MSEs
Capital-intensive �22 54
Labour-intensive 1 �10
Rural MSEs
Capital-intensive 3 0
Labour-intensive 13 �26
Average GDP growth rate �0.73 4.15
682 L. Daniels
Copyright # 2003 John Wiley & Sons, Ltd. J. Int. Dev. 15, 675–692 (2003)

capital-intensive industries appear to expand in good economic times, which is consistent
with the market-demand hypothesis. Alternatively, labour-intensive industries expand
during poor economic times, which is consistent with the labour-surplus hypothesis.
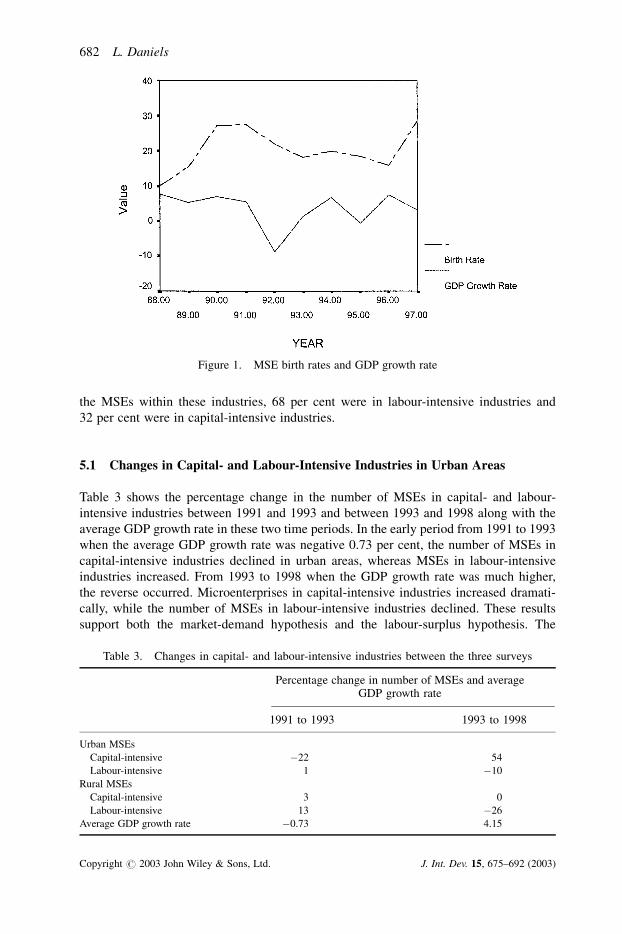
Figure 2 shows the annual entry rates from 1988 to 1997 for capital- and labour-
intensive industries in urban areas. While the patterns are quite similar, Figure 2 shows that
the entry rates of labour-intensive firms were much higher than capital-intensive
industries, particularly during the early 1990s, which coincides with both the drought
and the introduction of ESAP.
5.2 Changes in Capital- and Labour-Intensive Industries in Rural Areas
The percentage change in capital- and labour-intensive industries in rural areas between
1991 and 1993 and between 1993 and 1998 are shown in Table 3. The changes in the
capital-intensive industries do not follow the same patterns as the capital-intensive
industries in urban areas. Instead, capital-intensive industries grew by three per cent in
the early period from 1991 to 1993 and experienced no change in the latter period from
1993 to 1998. These results suggest that the capital-intensive industries in rural areas are
not as closely tied to overall changes in the economy as their urban counterparts.
Labour-intensive industries in rural areas followed the exact same pattern as their urban
counterparts. They expanded during poor economic times and contracted during better
economic times, consistent with the labour-surplus hypothesis.
Figure 3 shows the annual entry rates from 1988 to 1997 for capital- and labour-
intensive industries in rural areas. Unlike the urban entry rates in Figure 2, the entry rates
of capital- and labour-intensive industries in Figure 3 follow almost exact opposite
patterns. Again, the labour-intensive industries appear to expand dramatically during
Figure 2. MSE birth rates in urban areas
The Expansion of the Microenterprise Sector 683
Copyright # 2003 John Wiley & Sons, Ltd. J. Int. Dev. 15, 675–692 (2003)
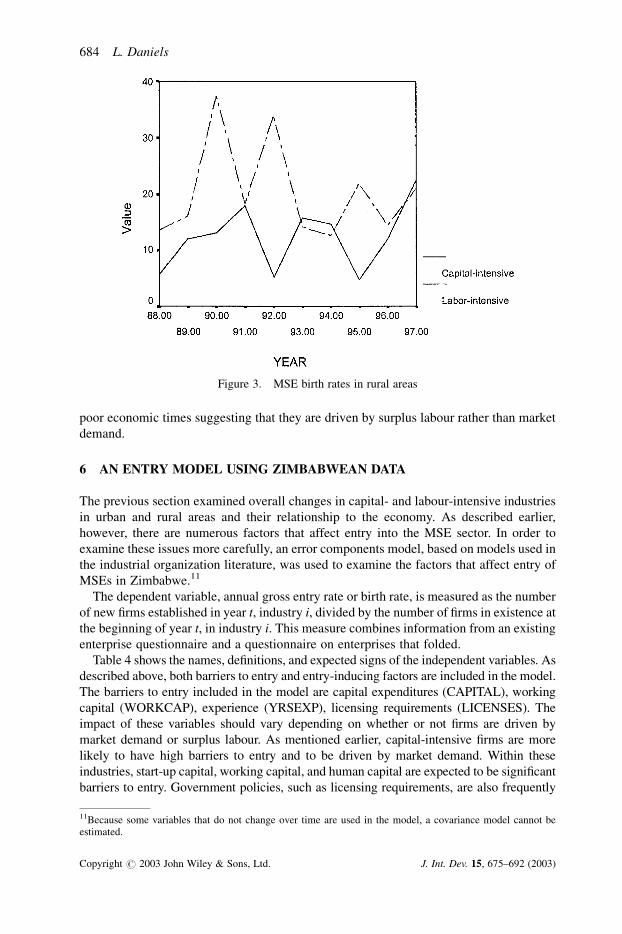
poor economic times suggesting that they are driven by surplus labour rather than market
demand.
6 AN ENTRY MODEL USING ZIMBABWEAN DATA
The previous section examined overall changes in capital- and labour-intensive industries
in urban and rural areas and their relationship to the economy. As described earlier,
however, there are numerous factors that affect entry into the MSE sector. In order to
examine these issues more carefully, an error components model, based on models used in
the industrial organization literature, was used to examine the factors that affect entry of
MSEs in Zimbabwe.11
The dependent variable, annual gross entry rate or birth rate, is measured as the number
of new firms established in year t, industry i, divided by the number of firms in existence at
the beginning of year t, in industry i. This measure combines information from an existing
enterprise questionnaire and a questionnaire on enterprises that folded.
Table 4 shows the names, definitions, and expected signs of the independent variables. As
described above, both barriers to entry and entry-inducing factors are included in the model.
The barriers to entry included in the model are capital expenditures (CAPITAL), working
capital (WORKCAP), experience (YRSEXP), licensing requirements (LICENSES). The
impact of these variables should vary depending on whether or not firms are driven by
market demand or surplus labour. As mentioned earlier, capital-intensive firms are more
likely to have high barriers to entry and to be driven by market demand. Within these
industries, start-up capital, working capital, and human capital are expected to be significant
barriers to entry. Government policies, such as licensing requirements, are also frequently
Figure 3. MSE birth rates in rural areas
11Because some variables that do not change over time are used in the model, a covariance model cannot beestimated.
684 L. Daniels
Copyright # 2003 John Wiley & Sons, Ltd. J. Int. Dev. 15, 675–692 (2003)
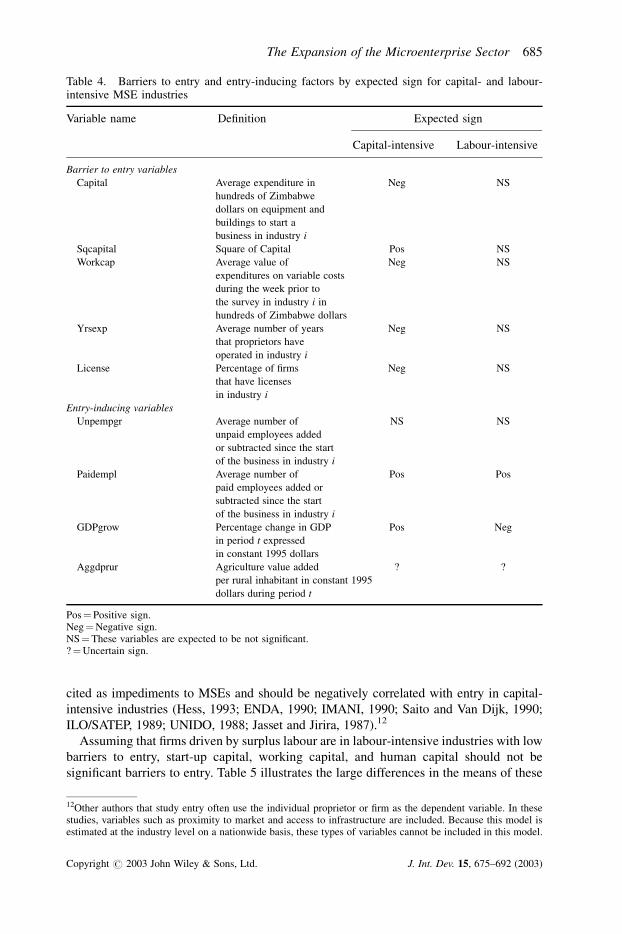
cited as impediments to MSEs and should be negatively correlated with entry in capital-
intensive industries (Hess, 1993; ENDA, 1990; IMANI, 1990; Saito and Van Dijk, 1990;
ILO/SATEP, 1989; UNIDO, 1988; Jasset and Jirira, 1987).12
Assuming that firms driven by surplus labour are in labour-intensive industries with low
barriers to entry, start-up capital, working capital, and human capital should not be
significant barriers to entry. Table 5 illustrates the large differences in the means of these
Table 4. Barriers to entry and entry-inducing factors by expected sign for capital- and labour-intensive MSE industries
Variable name Definition Expected sign
Capital-intensive Labour-intensive
Barrier to entry variables
Capital Average expenditure in Neg NS
hundreds of Zimbabwe
dollars on equipment and
buildings to start a
business in industry i
Sqcapital Square of Capital Pos NS
Workcap Average value of Neg NS
expenditures on variable costs
during the week prior to
the survey in industry i in
hundreds of Zimbabwe dollars
Yrsexp Average number of years Neg NS
that proprietors have
operated in industry i
License Percentage of firms Neg NS
that have licenses
in industry i
Entry-inducing variables
Unpempgr Average number of NS NS
unpaid employees added
or subtracted since the start
of the business in industry i
Paidempl Average number of Pos Pos
paid employees added or
subtracted since the start
of the business in industry i
GDPgrow Percentage change in GDP Pos Neg
in period t expressed
in constant 1995 dollars
Aggdprur Agriculture value added ? ?
per rural inhabitant in constant 1995
dollars during period t
Pos¼Positive sign.Neg¼Negative sign.NS¼These variables are expected to be not significant.?¼Uncertain sign.
12Other authors that study entry often use the individual proprietor or firm as the dependent variable. In thesestudies, variables such as proximity to market and access to infrastructure are included. Because this model isestimated at the industry level on a nationwide basis, these types of variables cannot be included in this model.
The Expansion of the Microenterprise Sector 685
Copyright # 2003 John Wiley & Sons, Ltd. J. Int. Dev. 15, 675–692 (2003)
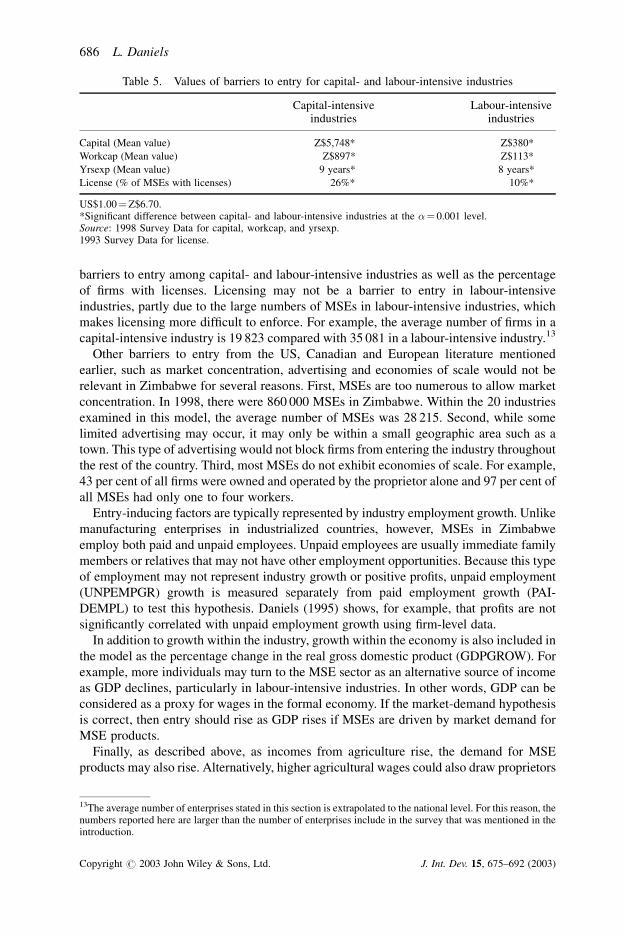
barriers to entry among capital- and labour-intensive industries as well as the percentage
of firms with licenses. Licensing may not be a barrier to entry in labour-intensive
industries, partly due to the large numbers of MSEs in labour-intensive industries, which
makes licensing more difficult to enforce. For example, the average number of firms in a
capital-intensive industry is 19 823 compared with 35 081 in a labour-intensive industry.13
Other barriers to entry from the US, Canadian and European literature mentioned
earlier, such as market concentration, advertising and economies of scale would not be
relevant in Zimbabwe for several reasons. First, MSEs are too numerous to allow market
concentration. In 1998, there were 860 000 MSEs in Zimbabwe. Within the 20 industries
examined in this model, the average number of MSEs was 28 215. Second, while some
limited advertising may occur, it may only be within a small geographic area such as a
town. This type of advertising would not block firms from entering the industry throughout
the rest of the country. Third, most MSEs do not exhibit economies of scale. For example,
43 per cent of all firms were owned and operated by the proprietor alone and 97 per cent of
all MSEs had only one to four workers.
Entry-inducing factors are typically represented by industry employment growth. Unlike
manufacturing enterprises in industrialized countries, however, MSEs in Zimbabwe
employ both paid and unpaid employees. Unpaid employees are usually immediate family
members or relatives that may not have other employment opportunities. Because this type
of employment may not represent industry growth or positive profits, unpaid employment
(UNPEMPGR) growth is measured separately from paid employment growth (PAI-
DEMPL) to test this hypothesis. Daniels (1995) shows, for example, that profits are not
significantly correlated with unpaid employment growth using firm-level data.
In addition to growth within the industry, growth within the economy is also included in
the model as the percentage change in the real gross domestic product (GDPGROW). For
example, more individuals may turn to the MSE sector as an alternative source of income
as GDP declines, particularly in labour-intensive industries. In other words, GDP can be
considered as a proxy for wages in the formal economy. If the market-demand hypothesis
is correct, then entry should rise as GDP rises if MSEs are driven by market demand for
MSE products.
Finally, as described above, as incomes from agriculture rise, the demand for MSE
products may also rise. Alternatively, higher agricultural wages could also draw proprietors
Table 5. Values of barriers to entry for capital- and labour-intensive industries
Capital-intensive Labour-intensiveindustries industries
Capital (Mean value) Z$5,748* Z$380*
Workcap (Mean value) Z$897* Z$113*
Yrsexp (Mean value) 9 years* 8 years*
License (% of MSEs with licenses) 26%* 10%*
US$1.00¼Z$6.70.*Significant difference between capital- and labour-intensive industries at the �¼ 0.001 level.Source: 1998 Survey Data for capital, workcap, and yrsexp.1993 Survey Data for license.
13The average number of enterprises stated in this section is extrapolated to the national level. For this reason, thenumbers reported here are larger than the number of enterprises include in the survey that was mentioned in theintroduction.
686 L. Daniels
Copyright # 2003 John Wiley & Sons, Ltd. J. Int. Dev. 15, 675–692 (2003)

away from the MSE sector. The agriculture value added per rural inhabitant (AGGDPRUR)
is therefore included in the model to test these hypotheses.
7 RESULTS
Table 6 presents the results of the entry model for capital- and labour-intensive industries
in urban and rural areas. As expected, the forces that drive entry are different for the
labour- and capital-intensive industries as well as for the same industries in the urban and
rural areas. The results are reported for the four models below.
7.1 Capital-Intensive Industries in Urban Areas
Among capital-intensive industries in urban areas, industries with higher capital expen-
ditures and working capital needs have lower entry rates. This suggests that both capital
and working capital are barriers to entry. These results are not surprising given the heavy
capital requirements of these industries. As mentioned earlier, the average capital
expenditure is 27 times greater among the capital-intensive industries compared with
the labour-intensive industries.
Despite all of the studies mentioned earlier that cite licensing in Zimbabwe as a barrier
to entry, industries with greater percentages of firms with licenses did not have lower entry
rates. Licensing may not, therefore, be a strong barrier to entry as is commonly believed.
As described earlier, human capital requirements are found to be significant barriers to
entry in much of the US, Canadian and European literature. Among capital-intensive
industries in Zimbabwean urban areas, higher levels of average proprietor experience
levels did not lead to lower entry rates. This may be due to the small range of average
Table 6. Entry model results for capital- and labour-intensive industries in urban and rural areas
Urban industries Rural industries
Capital-intensive Labour-intensive Capital-intensive Labour-intensive
Variable Coefficient Coefficient Coefficient Coefficient(t-statistic) (t-statistic) (t-statistic) (t-statistic)
Capital �0.00* (�1.77) �0.00 (�0.84) �0.00* (�1.74) �0.13 (�0.53)
Sqcapital 0.00** (1.94) 0.00 (0.57) 0.00 (1.59) 0.00 (1.07)
Workcap �0.00** (�2.13) �0.01 (�0.07) 0.00 (0.45) 0.17 (0.34)
Yrsexp �1.89 (�1.22) �7.12** (�2.05) �3.58** (�2.64) 21.51 (0.88)
License 0.01 (0.47) 0.23 (0.58) �0.14 (�0.75) 0.65 (0.10)
Paidemp 5.35 (1.01) 31.58 (1.44) 2.37 (0.54) 327.55 (0.35)
Unpempgr 13.41 (0.75) �54.55 (�1.34) �19.14 (�0.25) �33.71 (�0.11)
GDP �0.16 (�0.33) �0.81* (�1.84) �1.18 (�1.25) �8.70 (�1.27)
Aggdprur 0.37** (1.96) 0.64** (3.46) 1.07** (2.85) 0.06 (0.02)
Constant �10.12 (�0.37) 1.58 (0.05) �71.29 (�1.45) �191.15 (�0.47)
No. of observations 90 110 90 110
R-square 0.26 0.18 0.24 0.07
**¼ Significant at the �¼ 0.05 level.Source: 1991, 1993 and 1998 Survey Data.
The Expansion of the Microenterprise Sector 687
Copyright # 2003 John Wiley & Sons, Ltd. J. Int. Dev. 15, 675–692 (2003)
experience levels within the majority of these industries. For example, hair dressing and
welding have the lowest levels of proprietor experience with four to five years,
respectively. The highest level of proprietor experience is in construction with 17 years
on average. The remainder of the capital-intensive industries have experience levels that
range from eight to 12 years.
Among the entry-inducing factors, capital-intensive industries in urban areas do not
respond to the overall economy. As GDP rises, there is no impact on entry levels. If GDP
growth represents opportunities in the formal sector, these results suggest that proprietors
in capital-intensive industries in urban areas will not necessarily leave the MSE sector for
the formal sector. It also suggests that the these industries are not driven by surplus labour
as predicted by the labour-supply hypothesis. Alternatively, they may be driven by market
demand as indicated by the increased entry levels as agricultural income rises. These
results coincide with other studies that have shown that the demand for MSE products
increases as rural household income increases (Deb and Hossain, 1984; Hazell and Roell,
1983; King and Byerlee, 1978).
7.2 Labour-Intensive Industries in Urban Areas
Among the labour-intensive industries in urban areas, higher capital and working capital
needs do not lead to lower entry rates. Again, given the low capital requirements within
these industries, ranging from zero to US$71 on average, these results are not surprising. It
is surprising, however, that higher levels of proprietor experience do lead to lower entry
rates. This suggests that experience is a barrier to entry. The average level of experience
within these industries is eight years with a range of five years in vending wood-based
products, hardware, and drinks to a high of 12 years in shoe work/repairs.
Similar to capital-intensive industries in urban areas, licensing does not appear to be a
barrier to entry among labour-intensive industries. Again, this is contrary to assertions
found in numerous studies about the Zimbabwean MSE sector (Hess, 1993; ENDA, 1990;
IMANI, 1990; Saito and Van Dijk, 1990; ILO/SATEP, 1989; UNIDO, 1988; Jasset and
Jirira, 1987). In general, however, licensing would more likely be a barrier to entry among
capital-intensive industries where 26 per cent of all firms have licenses compared with
only ten per cent among labour-intensive industries.
Considering the entry-inducing factors, the entry rates of labour-intensive industries in
urban areas are negatively correlated with the growth of the GDP as predicted by the
labour-surplus theory. As the economy declines, more businesses are started, whereas
growth in the economy leads to a decline in the entry rate. Again, GDP can be considered
as proxy for wages in the formal economy. In other words, as the formal sector expands,
there is no need for individuals to turn to the MSE sector as a source of income. The
agricultural value added per rural inhabitant was positively correlated with MSE entry.
As suggested by previous studies, this indicates increases in agricultural income lead to a
greater demand for MSE products. It is not surprising that entry is negatively correlated
with GDP growth and positively correlated with agricultural value added since agriculture
represents a low proportion of GDP compared to other sub-Saharan countries. Seventy
per cent of all other sub-Saharan countries have a higher agriculture value added than
Zimbabwe with a range from 23 to 58 per cent compared to 19 per cent in Zimbabwe
(World Bank, 2000).
688 L. Daniels
Copyright # 2003 John Wiley & Sons, Ltd. J. Int. Dev. 15, 675–692 (2003)

7.3 Capital-Intensive Industries in Rural Areas
Within the capital-intensive industries in rural areas, the model showed that capital is a
barrier to entry. Again, this is not surprising since firms within these industries require
larger capital investments than the labour-intensive industries. Considering only firms
within rural areas, the average capital expenditure among capital-intensive industries is 40
times greater than the average capital expenditure among labour-intensive industries.
Greater proprietor experience was also associated with lower entry rates suggesting that
experience is a barrier to entry. As in the urban industries, a greater proportion of firms
with licenses was not associated with lower entry rates.
Among the entry-inducing factors, the entry rates of capital-intensive industries in rural
areas are not affected by growth in GDP. Again, this suggests that these industries are not
driven by surplus labour since the entry rates do not rise as GDP falls. The entry rates are
affected, however, by changes in agricultural income. As agriculture value added rises, the
entry rates of these industries also rises. Again, this supports previous studies that show
that demand for microenterprise products rise as agricultural incomes rise.
7.4 Labour-Intensive Industries in Rural Areas
Among the labour-intensive industries in rural areas, none of the coefficients of the
independent variables was significant. This suggests that there are no significant barriers to
entry or entry-inducing factors. This is not surprising since the labour-surplus theory
suggests that proprietors can enter these industries easily. It is surprising, however, that the
entry rates of these industries are not affected by changes in the economy. The labour-
surplus hypothesis indicates that proprietors turn to these industries during difficult times,
which is illustrated only in the model for labour-intensive industries in the urban areas.
These results may reflect the fact that rural households are not as connected to the overall
economy and rely more on self employment through agriculture rather than formal or
informal sector jobs.
8 CONCLUSIONS
The labour-surplus hypothesis suggests that the number of MSEs rises and falls as a
function of labour availability. Under this hypothesis, the MSE sector should increase
during difficult times. Considering labour-intensive industries in urban and rural areas, the
number of MSEs increased from 1991 to 1993 during more difficult economic times and
decreased dramatically as the economy improved from 1993 to 1998 suggesting that these
industries are driven by surplus labour. Alternatively, capital-intensive industries in urban
areas followed the exact opposite pattern suggesting that they are not driven by surplus
labour. Instead, the change in the overall number of MSEs within these industries supports
the market-demand hypothesis, which suggests that industries are driven by market
demand for microenterprise products. Although the overall change in the number of
MSEs gives some indication of the impact of the economy on the MSE sector, the four
entry models presented in this paper provide a more detailed analysis of the forces that
drive the sector. This is done by examining individual industries within the MSE sector
and the barriers to entry and entry-inducing factors that affect each industry.
The Expansion of the Microenterprise Sector 689
Copyright # 2003 John Wiley & Sons, Ltd. J. Int. Dev. 15, 675–692 (2003)
Considering the four models, the labour-supply hypothesis is supported only by the entry
rates within labour-intensive industries in urban areas, which increase during difficult
economic times. The assumption that there are limited barriers to entry in the MSE sector
is supported only by entry rates of labour-intensive industries in rural areas. Among the
remaining categories of industries, however, there are significant barriers to entry
including capital, working capital, and experience. The relative weight of these barriers
will probably vary across industries, but they are all significant.
The market-demand hypothesis is supported in all urban-area industries and capital-
intensive industries in rural areas by the positive correlation between entry rates and
increases in agricultural incomes. None of the four models showed, however, that entry
rates are positively correlated with changes in gross domestic product. This suggests that
most industries are more closely tied to agricultural incomes rather than changes in the
overall economy.
Overall, the combined results indicate that the microenterprise sector is heterogeneous.
The forces that drive the sector vary from urban to rural areas and within capital- and
labour-intensive industries. Government and donor policies towards the MSE sector
should, therefore, reflect this heterogeneity. For example, if the government wants to
promote capital-intensive industries, it should address the barriers to entry faced by these
industries, such as capital and working capital, through credit programmes. Alternatively,
if the government wants to support labour-intensive industries where individuals may
depend on MSE income for survival, then technical training may be more appropriate
since experience was a barrier to entry, but capital was not a constraint. For example,
training in business skills or technical skills may assist proprietors to enter these industries
and improve their businesses.
Again, the results from the four models should highlight the heterogeneity of the MSE
sector and its diverse needs. The results also show the need for research that breaks down
the MSE sector into different categories based on the location of the MSEs and the level of
capital and skills requirements rather than analyzing the sector as a whole.
ACKNOWLEDGEMENTS
The funding for this work was provided by the United States Agency for International
Development through a buy-in to the Growth and Equity through Microenterprise and
Institutions (GEMINI) Project, contract number DHR-5448-Q-65-9081-00.
I am grateful for the comments of Carl Eicher, Carl Liedholm, Les Manderscheid, and
Tom Reardon on an earlier version of this paper that used the first two national data sets. I
also owe special thanks to Donald Mead for his comments on the earlier paper as well as
his participation and comments during the field research for this work. Nicholas Minot
also deserves credit for his excellent comments on both versions of this paper. The funding
for this research was provided by the United States Agency for International Development
through a buy-in to the Growth and Equity through Microenterprise and Institutions
(GEMINI) Project. Any errors in this paper should be attributed to the author.
REFERENCES
Acs Z, Audretsch D. 1989. Small-firm entry in U.S. manufacturing. Economica 56(222): 255–266.
690 L. Daniels
Copyright # 2003 John Wiley & Sons, Ltd. J. Int. Dev. 15, 675–692 (2003)

Biggs T, Grindle M, Snodgrass D. 1988. The informal sector, policy roeform, and structural
transforamtion. In Beyond the Informal Sector: Including the Excluded in Developing Countires,
Jenkins J (ed.). Institute for Contemporary Studies Press: San Francisco.
Corte M, Berry A, Ishaq A. 1987. Success in Small and Medium-Scale Enterprises: The Evidence
from Colombia. Oxford University Press: New York.
Daniels L. 1995. Entry, exit, and growth among small-scale enterprises in Zimbabwe. Ph.D.
dissertation. Michigan State University: East Lansing, MI.
Daniels L. 1994. Changes in the small-scale enterprise sector from 1991 to 1993: results of a second
nationwide survey in Zimbabwe. GEMINI Technical Report No. 71. Development Alternatives,
Inc.: Bethesda, MD.
Daniels L, Fisseha Y. 1992. Micro- and small-scale enterprises in Botswana: results of a nationwide
survey. GEMINI Technical Report No. 46. Development Alternatives, Inc.: Bethesda, MD.
Daniels L, Mead D, Musinga M. 1995. Employment and income in micro and small enterprises in
Kenya: results of a 1995 survey. GEMINI Technical Report No. 92. Development Alternatives,
Inc.: Bethesda, MD.
Daniels L, Ngwira A. 1992. Results of a nation-wide survey on micro, small, and medium enterprises
in Malawi. GEMINI Technical Report No. 53. Development Alternatives, Inc.: Bethesda, MD.
Deb NC, Hossain M. 1984. Demand for rural industries products in Bangladesh. The Bangladesh
Development Studies XII(182): 81–99.
Duetsch L. 1975. Structure, performance, and the net rate of entry into manufacturing industries.
Southern Economic Journal 41: 450–456.
Duetsch L. 1984. Entry and the extent of multiplant operations. Journal of Industrial Economics 32:
477–487.
Environmental and Developmental Activities. 1990. Women in the informal sector: a Zimbabwean
study. ENDA: Harare, Zimbabwe.
Fisseha Y. 1991. Small-scale enterprises in Lesotho: summary of a country-wide survey. GEMINI
Technical Report No. 14. Development Alternatives, Inc.: Bethesda, MD.
Fisseha Y, McPherson M. 1991. A country-wide study of small-scale enterprises in Swaziland.
GEMINI Technical Report No. 24. Development Alternatives, Inc.: Bethesda, MD.
Gorecki PK. 1976. The determinants of entry by new and diversifying enterprises in the U.K.
Manufacturing Sector, 1958–1963: some tentative results. Applied Econometrics 7(2): 139–147.
Government of Zimbabwe. 1991. Zimbabwe, a framework for economic reform (1991–95).
Government of Zimbabwe: Harare, Zimbabwe.
Hamilton RT. 1985. Interindustry variation in gross entry rates of ‘independent’ and ‘dependent’
businesses. Applied Economics 17: 271–280.
Hause JC, Du Rietz G. 1984. Entry, industry growth, and the microdynamics of industry supply.
Journal of Political Economy 92(4): 733–757.
Hazell P, Roell A. 1983. Rural growth linkages: household expenditure patterns in Malaysia and
Nigeria. International Food Policy Research Institute (IFPRI) Research Report #41. IFPRI:
Washington, DC.
Hess R. 1993. Cost of business compliance in small scale garment and textile sector. Paper presented
at the Conference on Deregulation, Nyanga, Zimbabwe, 16–18 May, 1993.
Human Resources (PVT) Ltd. 1990. Small Business Needs Survey for the Friedrich Naumann
Foundation.
ILO/SATEP. 1989. The promotion of economic development and equity in Zimbabwe. Report to the
Government of Zimbabwe. ILO: Harare, Zimbabwe.
IMANI Development. 1990. Impediments confronting the informal sector enterprise in Zimbabwe.
IMANI: Harare, Zimbabwe.
The Expansion of the Microenterprise Sector 691
Copyright # 2003 John Wiley & Sons, Ltd. J. Int. Dev. 15, 675–692 (2003)

Jassat EM, Jirira KO. 1987. Industrial development in Zimbabwe: the case of women in manufactur-
ing activities. Zimbabwe Institute of Development Studies: Harare, Zimbabwe (mimeo).
Khemani RS, Shapiro D. 1986. The determinants of new plant entry in Canada. Applied Economics
60(2): 1243–1257.
King RP, Byerlee D. 1978. Factor intensities and locational linkages of rural consumption patterns in
Sierra Leone. American Journal of Agricultural Economics 60(2): 197–206.
Liedholm C. 1990. The dynamics of small-scale industry in Africa and the role of policy. GEMINI
Working Paper No. 2. Development Alternatives, Inc.: Bethesda, MD.
MacDonald JM. 1986. Entry and exit on the competitive fringe. Southern Economic Journal 52:
640–652.
Mansfield E. 1962. Entry, Gibrat’s law, innovation and the growth of firms. American Economic
Review 52: 1023–1050.
McPherson M. 1991. Micro and small-scale enterprises in Zimbabwe: results of a country-wide
survey. GEMINI Technical Report 25. Development Alternatives, Inc.: Bethesda, MD.
McPherson M. 1998. Changes in Zimbabwe’s micro and small enterprise sector, 1991–1998:
evidence from a third country-wide survey. Development Alternatives, Inc.: Bethesda, MD.
McPherson M, Parker J. 1993. A manual for conducting baseline surveys of micro- and small-scale
enterprises. GEMINI Technical Note. Development Alternatives, Inc.: Bethesda, MD.
Mead D. 1993. The contribution of small enterprises to employment growth in southern Africa.
Paper presented at the African Studies Association, December, 1993.
Mead D, Kunjeku P. 1993. Business linkages and enterprise development in Zimbabwe. GEMINI
Technical Report No. 55. Development Alternatives, Inc.: Bethesda, MD.
Orr D. 1974. The determinants of entry: a study of the Canadian manufacturing industries. Review of
Economics and Statistics 56(1): 58–67.
Parker J, Torres TR. 1994. Micro- and small-scale enterprises in Kenya: results of the 1993 national
baseline survey. GEMINI Technical Report No. 75. Development Alternatives, Inc.: Bethesda,
MD.
Saito K, Van Dijk MP. 1990. The informal sector in Zimbabwe: the role of women. Environmental
and Development Activities. ENDA: Harare, Zimbabwe.
UNIDO. 1988. Human resources in Zimbabwe’s development, the current and prospective
contribution of women. UNIDO: Harare, Zimbabwe.
USAID. 1990. Country training strategy and private sector Training needs assessment: USAID/
Zimbabwe. USAID: Harare, Zimbabwe.
Varian HR. 1987. Intermediate microeconomics, a modern approach. W.W. Norton and Company:
New York.
World Bank. 2001. World Development Report 2000/2001, Attacking Poverty. World Bank:
Washington, DC.
Zimconsult. 1992. Support to Small-Scale Industries and the Enhancement of Indigenous Ownership
in Zimbabwe. UNIDO: Vienna, Austria.
692 L. Daniels
Copyright # 2003 John Wiley & Sons, Ltd. J. Int. Dev. 15, 675–692 (2003)