Embed Size (px)
Citation preview

Factors that contribute to customer satisfaction in guesthouses in Gauteng Province
By
Margarita Popova (809529820)
A dissertation submitted to the Faculty of Management, University of Johannesburg in fulfilment for a Masters of
Technology in Business Administration
March 2006
Supervisor: Dr NC Bresler Co- supervisor: Prof. J Spowart

1
Acknowledgements I wish to pay tribute to and acknowledge the contribution of the following people
who made this thesis possible:
• Friends and family who supported and inspired me.
• Doctor NC Bresler and Professor J Spowart, my academic supervisors for
guiding me and giving me invaluable advise.
• Alison Chambers for proofreading my work.
• Guest house owners and their customers who participated in the survey.

2
Title of the thesis: Factors that contribute to customer satisfaction in guest
houses in Gauteng Province
Summary: Guest houses operate in a highly competitive arena and aim to satisfy the
customer needs and to differentiate their product from the ones of competitors. In
order for these establishments to provide a product which satisfies the patrons,
guest house owners have to know everything they can about the customers –
what they want, what they think, how they make decisions, what influences their
decisions. To gain a better understanding of these influences on customers’
satisfaction, the study included information collected by primary and secondary
data. The secondary data provided literature on the notion and significance of
customer satisfaction, analysed the guest house product, customer behaviour
and service quality. It also provided guidelines on the type of primary data that
had to be acquired. The primary data was obtained in the form of questionnaires
completed by 65 managers and 169 customers of guest houses in the province.
The questionnaires were distributed during December 2004 and February to May
2005. The findings indicated that the factors that contribute to customers’
satisfaction in guest houses in Gauteng Province are: the warm and friendly
hospitality of the host and staff; the friendly environment; the feeling of being
home away from home; the neatness, comfort and hygiene; the great service;
walking the extra mile to meet the customer needs; attention to detail; complete
package; value for money and best security. In other words it is the personalised
service offered at the guest houses that customers choose over other types of
available accommodation.

3
Declaration
I, Margarita N. Popova, hereby declare that:
I understand that plagiarism means presenting the ideas and words of someone
else as my own, without appropriate recognition of the source.
I confirm that the work that I submit for assessment is my own, except where I
explicitly indicate otherwise.
I have fully acknowledged all words, ideas and results from other sources that I
have used in this research study through a generally accepted style of quotes,
references and bibliography.
I am aware that the University views plagiarism as a serious offence punishable
by a disciplinary committee.
Margarita N. Popova

4
Table of Content
LIST OF FIGURES 8
LIST OF TABLES 9
LIST OF ABBREVIATIONS 11
1. INTRODUCTION, STATEMENT OF PROBLEM, OBJECTIVES AND .......12
1.1 Background to problem.........................................................................12
1.2 Statement of problem ............................................................................14
1.3 Research objectives ..............................................................................14
1.4 Review of related literature ...................................................................15
1.5 Limitations ..............................................................................................18
1.6 Significance and contribution of the study..........................................19
1.7 Research design and methodology......................................................19
1.8 Outline of the proposed study ..............................................................20
1.9 Preview of the following chapters ........................................................21
2. LITERATURE REVIEW – THE GUEST HOUSE PRODUCT ......................23
2.1 Introduction ............................................................................................23
2.2 International tourism .............................................................................24
2.3 Tourism in South Africa.........................................................................27
2.4 The accommodation industry in South Africa.....................................32
2.5 The guest house sector in South Africa...............................................34 2.5.1 Historical background........................................................................35 2.5.2 Guest house management................................................................36
2.6 The guest house product offering ........................................................38 2.6.1 The guest house product offering characteristics..............................39 2.6.2 Differentiating the guest house offerings...........................................42
5
2.6.3 Guest house grading schemes – method of differentiating ...............43 guest houses...................................................................................................43 2.6.4 The guest house marketing mix ........................................................44
2.7 Hospitality management........................................................................45 2.7.1 Objectives of managers ....................................................................45 2.7.2 Unique challenges in accommodation management.........................46
2.8 Summary.................................................................................................49
3. LITERATURE REVIEW – CUSTOMER BEHAVIOUR ................................50
3.1 Introduction ............................................................................................50
3.2 The customer as an individual..............................................................51 3.2.1 Customer needs and motivation .......................................................51 3.2.2 Personality and self-concept .............................................................54 3.2.3 Perception.........................................................................................55 3.2.4 Learning process ..............................................................................57 3.2.5 Involvement theory............................................................................58 3.2.6 Attitudes ............................................................................................59 3.2.7 Customer expectations .....................................................................60 3.2.8 Customer satisfaction and loyalty .....................................................62
3.3 Social and cultural dimensions of consumer behaviour ....................63 3.3.1 Reference groups .............................................................................63 3.3.2 Family influence ................................................................................64 3.3.3 Social class .......................................................................................66 3.3.4 Culture ..............................................................................................66
3.4 Decision-making ....................................................................................67 3.4.1 Need recognition...............................................................................68 3.4.2 Information search ............................................................................68 3.4.3 Evaluation of service alternatives......................................................69 3.4.4 Service purchase and consumption ..................................................69 3.4.5 Post purchase evaluation..................................................................71
3.5 Summary.................................................................................................72
4 LITERATURE REVIEW – SERVICE QUALITY...........................................73
4.1 Introduction to service quality ..............................................................73
4.2 Customer satisfaction and service quality ..........................................73
4.3 Service quality dimensions...................................................................75

6
4.4 Measuring service quality .....................................................................77
4.5 Service quality gaps ..............................................................................78
4.6 Summary.................................................................................................82
5. RESEARCH METHODOLOGY ...................................................................83
5.1 Introduction ............................................................................................83
5.2 Statement of the problem......................................................................83
5.3 Research objectives ..............................................................................83
5.4 Collection of data ...................................................................................84
5.5 The sample .............................................................................................85
5.6 Distribution and response rate .............................................................86
5.7 Analysis method ....................................................................................87
5.8 Problems experienced during the collection of data ..........................88
5.9 Reliability and validity of the research data.........................................89
5.10 Significance and contribution of the study..........................................90
5.11 Summary.................................................................................................90
6. REPORT ON DATA AND ANALYSIS.........................................................91
6.1 Introduction ............................................................................................91
6.2 Management questionnaires.................................................................92 6.2.1 The guest houses .............................................................................92 6.2.2 Demand ..........................................................................................100 6.2.3 Target market..................................................................................103 6.2.4 Services offered by the guest houses .............................................105 6.2.5 Meals ..............................................................................................107 6.2.6 Advertising ......................................................................................108 6.2.7 Management comments..................................................................110
6.3 Customer questionnaires ....................................................................112 6.3.1 How customers perceive the guest houses.....................................112 6.3.2 Satisfaction with the overall experience ..........................................118 6.3.3 Uniqueness of guest houses...........................................................120 6.3.4 Matters to be improved upon ..........................................................123

7
6.3.5 Nationality profile of customers .......................................................126 6.3.6 Business versus leisure profile........................................................135 6.3.7 How the customers evaluated the questionnaire ............................144
6.4 Summary...............................................................................................145
7. SUMMARY OF FINDINGS, CONCLUSIONS AND RECOMMENDATIONS 146
7.1 Introduction ..........................................................................................146
7.2 Summary of findings from management questionnaires .................146
7.3 Summary of findings from customer questionnaires .......................151 7.3.1 How customers perceive the guest houses.....................................151 7.3.2 South African residents versus foreigners.......................................155 7.3.3 Business versus leisure profile........................................................157
7.4 Conclusion............................................................................................158
7.4 Recommendations ...............................................................................165
BIBLIOGRAPHY 168
ANNEXURE 1 178
MANAGEMENT QUESTIONNAIRE.................................................................178
ANNEXURE 2 181
CUSTOMER QUESTIONNAIRE.......................................................................181
ANNEXURE 3 184
LIST OF GUEST HOUSES THAT PARTICIPATED IN THE STUDY...............184

8
List of Figures Figure 6.1 Years of operation of guest houses 93
Figure 6.2 Number of staff employed by guest house 94
Figure 6.3 Staff turnover 95
Figure 6.4 Number of managers in a guest house 96
Figure 6.5 Profitability of guest houses 98
Figure 6.6 Months of high demand 101
Figure 6.7 Average weekly occupancy rates in high demand season 102
Figure 6.8 Average weekly occupancy rates in percentage during low
demand season 102
Figure 6.9 Types of guests in the guest houses 103
Figure 6.10 Nationality of market targeted by guest house owners 105
Figure 6.11 Business services offered at guest houses 106
Figure 6.12 Meals offered at guest houses 107
Figure 6.13 Advertising media 109
Figure 6.14 Return rates of customers as perceived by management 110
Figure 6.15 Matters that managers/ owners feel are not
covered in the questionnaire 111
Figure 6.16 Most important aspects/ characteristics of service 113
Figure 6.17 Most important aspects/ characteristics of the guest house 114
Figure 6.18 Most important aspects/ characteristics of atmosphere 115
Figure 6.19 Most important aspects/ characteristics of the room 117
Figure 6.20 How satisfied are customers with whole experience 118
Figure 6.21 Would customers come back to guest house? 119
Figure 6.22 Would customers recommend the guest house? 119
Figure 6.23 What impressed customers the most? 121
Figure 6.24 Matters to be improved in the guest house 124
Figure 6.25 Nationality of customers 126
Figure 6.26 Reasons for stay in the guest house 135
Figure 6.27 Customer comments 145
9
List of Tables
Table 6.1 Price categories of guest houses 93
Table 6.2 Years of operation versus number of staff employed 95
Table 6.3 Years of operation versus number of managers in a
guest house 96
Table 6.4 Number of staff employed by guest house versus
number of managers in a guest house 97
Table 6.5 Working in alliance with other guest houses versus
profitability 97
Table 6.6 Years of operation versus profitability of guest houses 99
Table 6.7 Single room rates versus years of operation of guest house 100
Table 6.8 Years of operation versus types of guests in the
guest houses 104
Table 6.9 Types of guests in the guest house versus business
services offered at the guest houses 106
Table 6.10 How did customers’ experience meet with their
expectations regarding the service? 113
Table 6.11 How did customers’ experience meet with their
expectations regarding the guest house? 115
Table 6.12 How did customers’ experience meet with their
expectations regarding the atmosphere? 116
Table 6.13 How did customers’ experience meet with their
expectations regarding the room? 117
Table 6.14 Nationality of customers versus reason for stay in the
guest house 127
Table 6.15 Nationality of customers versus first time stay in
the guest house or not 127
Table 6.16 Number of times stayed in the guest house versus
nationality of customers 128

10
Table 6.17 How customers heard of particular guest house versus
nationality of customers 130
Table 6.18 Nationality of customers versus most important aspects/
characteristics of the service 131
Table 6.19 Nationality of customers versus most important aspects/
characteristics of the guest house 132
Table 6.20 Nationality of customers versus most important aspects/
characteristics of the atmosphere 133
Table 6.21 Nationality of customers versus most important aspects/
characteristics of the room 134
Table 6.22 Nationality of customers versus age group 134
Table 6.23 Reasons for stay in the guest house versus nationality
of customers 136
Table 6.24 Years of operation of guest house versus reason for
stay in the guest house 137
Table 6.25 How did customers hear about the guest house versus
reason for stay at the guest house 139
Table 6.26 Reason for stay at the guest house versus most important
aspects/ characteristics of the service 140
Table 6.27 Reason for stay at the guest house versus most important
aspects/ characteristics of the guest house 141
Table 6.28 Reason for stay at the guest house versus most important
aspects/ characteristics of the atmosphere 142
Table 6.29 Reason for stay at the guest house versus most important
aspects/ characteristics of the room 143
Table 6.30 Reason for stay at the guest house versus age group 143

11
List of Abbreviations AA Automobile Association ANC African National Congress B & B Bed and Breakfast establishment BEE Black Economic Empowerment CBD Central Business District DSTV Digital Satelite Television DVD Digital Video Disc Four Ps Product, Price, Promotion, Place GHASA Guest House Association of South Africa GP Gauteng Province GSA General Sales Agent Km Kilometres PC Personal Computer SA South African SAA South African Airways SADC Southern African Developing Countries SERVQUAL Service Quality model of Parasuraman, Zeithaml and Berry (1988)SQGs Service Quality Gaps TGCSA Tourism Grading Council of South Africa TV Television WTO World Tourism Organisation

12
1. INTRODUCTION, STATEMENT OF PROBLEM, OBJECTIVES AND
METHODOLOGY OF THE STUDY
1.1 Background to problem The tourism industry in South Africa has been growing in the past few years
(Henning & Willemse, 1999b: 11). Several well-known international hotel chains
have established successful accommodation premises in the country and
dominate the tourism markets. However, many tourists choose the services
offered by small, privately run accommodation providers, rather than those
offered by the recognised hotels. This led to the creation of the guest house
sector of the Tourism Industry in South Africa, which has been growing since
1995 (Jordaan, 2001: 171).
The guest house business is considered a home business, as people generally
start one in their homes by either restoring or altering the existing facilities to suit
their needs, or alternatively building one from scratch. Beginning such an activity
could be for the purpose of acquiring a primary income or a second income,
when retiring and needing something to fill the quiet times. Guest houses are run
by a family or a manager with a few staff members. The owners do not
necessarily have any experience in the hospitality industry, and the success and
survival depends on their good business sense, managerial skills and expertise
(Henning & Willemse, 1999a: 4).
As mentioned by the Guest House Association South Africa (GHASA), a small
number of guest houses are listed with their association while the majority of
these establishments operate independently from GHASA. Only in recent years,
guest houses were taken into consideration when statistical data, financial or
trading reports were prepared for the hospitality industry.

13
The guest house concept originated in Europe. In South Africa it started as far
back as 1991, but the real growth has taken place only since 1995 (Jordaan,
2001: 171). The guest house industry today is highly competitive (Henning &
Willemse, 1999a: v) in terms of services and quality offered to its customers. The
customers’ overall satisfaction with the service of the organisation is based on all
their encounters/ experiences with that organisation (Sureshchandar, Rajendran
& Anantharaman, 2002: 364). The continued and profitable existence of a guest
house and any other business depends on how effectively it is marketed.
Marketing a product or a service entails making sure that the potential customer
has sufficient information to make an informed decision. It is necessary for guest
house owners to appreciate the needs of their guests and direct their marketing
efforts towards satisfying those needs, so that maximum customer satisfaction
and service quality can be obtained.
Customer satisfaction is considered a prerequisite for customer retention and
loyalty (Sureshchandar, Rajendran & Anantharaman, 2002: 364). Loyal
customers help to promote the establishment; they provide strong word of mouth
advertising and become a marketing force by recommending the guest house to
other customers (Bowen & Chen, 2001: 213). Positive word of mouth is regarded
to be the best advertising a company can get (Bowen & Chen, 2001: 213).
The criteria that count in evaluating service quality are defined by customers.
Service quality is more difficult for customers to evaluate than goods quality.
Therefore, the criteria customers use to evaluate service quality might be more
difficult for the marketer, and especially for a guest house owner with no previous
experience in the hospitality services, to comprehend (Zeithaml, Parasuraman &
Berry, 1999: 16). It is therefore important for guest house owners to have a good
knowledge of customers’ expectations and perceptions of the service offered at
the establishments. From these a need is generated to determine what makes
visitors stay at guest houses and to identify the specific elements that contribute
to their satisfaction in order to provide them with the quality desired.

14
1.2 Statement of problem
The primary objective of service providers and marketers is to develop and
provide products and services that satisfy customers’ needs and expectations,
thereby ensuring their own economic survival. To achieve this objective, service
providers need to understand how consumers choose and evaluate their service
offering (Zeithaml & Bitner, 2003: 35). Owing to the fact that the guest house
sector in South Africa only came into existence in the past decade there is a
limited amount of literature published on customer satisfaction in guest houses.
There are, except for generic SERVQUAL dimensions by Zeithaml, Parasuraman
and Berry (1990), no clear criteria of what factors contribute to customer
satisfaction in guest houses. Thus there is a need to establish:
• what are customers looking for when selecting a guest house in order to
be satisfied;
• the customers’ specific needs; and
• the level of quality offered in guest houses
in order to help managers/ owners of guest houses provide the quality of services
that their customers expect.
1.3 Research objectives
In the past few years the guest house sector has grown rapidly, which can be
associated with high demand for the services of such establishments (Henning &
Willemse, 1999a: v). Many owners of guest houses are not equipped with the
necessary skills and experience to adequately interpret customers’ expectations
and perceptions in order to provide the quality of services required and to ensure
that the customers will return to or promote their establishment. Therefore the
research aims to:

15
• describe the notion and significance of customer satisfaction;
• establish what attracts customers to guest houses;
• establish the guest houses’ customers’ needs;
• analyse the quality of services in the guest houses;
• determine the rate of return of customers;
• analyse occupancy reports of the individual guest houses; and
• develop a framework of criteria that are associated with customers’
choices of guest house accommodation to ensure their satisfaction.
1.4 Review of related literature
The South African hotel industry is recognised as one of the most important
sectors of the domestic economy, said Jordaan (2001: 151). It is characterised
by the presence of many of the world’s most well-known brands including Holiday
Inn, Sheraton, Hyatt, Hilton, Inter- Continental and Radison (Jordaan, 2001: 151).
The author adds that home grown brands such as Southern Sun, Protea Hotels
& Inns, City Lodge, Sun International and others offer a further glimpse of the
diversity available in South Africa. While hotels have traditionally offered a full
range of services to the travelling public, the industry now provides for all types of
needs and expectations (Jordaan, 2001: 156).
The nature of accommodation supplied at a destination is mainly a function of
demand – in other words, it is tourists who determine what type of
accommodation will be established at the destination area. Some prefer the full-
amenity type of accommodation, whilst others are content with the bare
essentials (Jordaan, 2001: 36).
In the past decade a growing trend towards guest house type of accommodation
has been noted, as it was mentioned in Paragraph 1.1. Many foreign guests
prefer to stay in a guest house, because it gives them an opportunity to meet the
local people and talk to them about various aspects, whereas in larger,
16
commercial operations they feel they do not get to know the country’s people,
Jordaan (2001: 173) stated. The author added that travellers seek the homely
environment, where they can walk on the grounds, or have a braai outside;
because it is something they would have done if they were at home (Jordaan,
2001: 173).
Customer satisfaction has an important role in the hospitality industry. It has a
direct influence on the existence, survival and success of the hospitality service
providers, and on a larger scale, has an impact on the economy of a country.
Customer satisfaction is the extent to which a firm fulfils a consumer’s needs,
desires, and expectations. Customers find it satisfactory – and even desirable –
to permit businesses to cater to them and even to stimulate wants (Perreault, Jr.
& McCarthy, 1999: 640). Businesses exist at the discretion of the consumers – if
the products and services offered satisfy the customers, then the firms will
continue to operate.
Satisfied customers are those who have received an excellent service. Excellent
service might seem like an intangible goal, because service can only be
assessed to be good or bad according to the personal satisfaction of the guest.
There are, however tangible means by which it can be achieved. People can see,
taste and appreciate the effects of good service (Henning & Willemse, 1999b:
11). Excellent service pays off because it creates true customers – customers
who are glad they selected a firm after the service they experienced; customers
who will use the firm again and sing the firm’s praises to others (Zeithaml,
Parasuraman & Berry, 1990: 9). Positive word of mouth increases the
accommodation establishment’s reliability and decreases customer’s perceived
risk (Bowen & Chen, 2001: 216). When a product is complex and difficult to
evaluate, and there is risk involved in the decision to buy it – as is the case with
many services – consumers most often look to others for advice on which
provider to consider (Zeithaml & Bitner, 2003: 162). A small increase in customer
satisfaction boosts customer loyalty dramatically, and in addition to benefiting

17
from the extremely satisfied customers’ repeat patronage, the hotel managers
can save their marketing expenses, because of the extremely satisfied
customers’ marketing power (Bowen & Chen, 2001: 215).
Establishing the level of customer satisfaction in the tourism industry is a
challenging process. This is due to the classification of customers into several
categories. A tourist can be, amongst others:
• a business person;
• a holiday maker;
• someone visiting friends and family; and
• someone pursuing special interests.
All of the above could be domestic or international tourists, who travel for
different purposes and have different expectations and behaviours. Consumer
behaviour as defined by Wilkie (in Williams, 2002: 8) is, the mental, emotional
and physical activities that people engage in when selecting, purchasing, using
and disposing of products and services so as to satisfy needs and desires.
In order to determine what factors contribute to a customer’s satisfaction, it is
necessary to examine the different needs, tastes, expectations and behaviours of
customers. At the same time the quality of the services offered should be
assessed, so that a clearer picture of what makes the customer select a specific
tourist establishment can be formulated.
In assessing the services offered, management must consider that there could
be service quality gaps, or discrepancies between the expectations of the guests
and the actual services provided (Zeithaml & Bitner, 2003: 113). For that to be
possible one would have to identify and relate those key elements that require
systematic management attention (Candido & Morris, 2000: 464). The elements
include: management perceptions of customer expectations; the vision, the

18
mission and the service strategy; the quality specifications and service design;
the financial and human resources; the external communication system and the
service delivery system, as stated by Candido and Morris (2000: 464).
The service quality approach starts with the assumption that the level of service
quality experienced by customers is critically determined by the gap between
their expectations of service and their perceptions of what they actually receive
from a specific service provider (Donnelly & Shiu, 1999: 500). Their perceptions
are based on dimensions, which are used to evaluate the service quality, and
include:
• tangibles - the physical appearances;
• reliability of the staff;
• responsiveness of the staff;
• assurance that the employees convey; and
• the empathy that the company provides.
It is important for any business to be able to develop a quality service strategy
that balances all the above elements and dimensions successfully. Formulation
and implementation of such, requires understanding and elimination of the
service quality gaps and commitment at all times to become a “customer-driven”
or a “customer-centred organisation” (Massnick, 1997: 9).
1.5 Limitations Acquiring of information about the topic has proven to be difficult due to the
limited statistical data about guest houses. The research will be conducted
amongst visitors to and managers of guest houses in Gauteng Province;
therefore the findings will be relevant only to guest houses in the province.
19
1.6 Significance and contribution of the study
This research will provide a framework of criteria associated with the factors that
contribute to customer satisfaction in guest houses in the Gauteng Province.
Information will be distributed to guest house owners to assist them in
understanding the expectations and perceptions of customers in order to provide
the quality of services required.
1.7 Research design and methodology
The research design and methodology will be the following:
• The term guest houses in this research will represent guest houses and Bed
and Breakfast establishments, due to the similarity of these two
accommodation providers. Their alike characteristics are further discussed in
Paragraph 2.5.
• Secondary research will include review of national and international literature and articles related to the topic. The review of literature will provide a
guideline on what primary data should be collected.
• Collection of primary data will be in the form of a two-phased study. The first
phase will be the pilot stage and will include interviews with five guest house
owners and their customers, which will help to acquire useful information on
which the questionnaires for the second phase will be based. A qualitative
approach will be used to establish the right questions for the questionnaires
and to create a perspective needed for interpreting the data. The second
phase will be obtaining information through self-administered questionnaires
from guest house owners and their customers. A quantitative approach will be

20
used with the purpose to quantify customer satisfaction, the extent of service
quality gaps and the perception of value.
• This research will be an exploratory and descriptive study, which will not
include correlation analysis. The analytical methods used will be cross-
tabulations, bar charts, pie charts, intervals and descriptive measures like
mode for most frequently occurring values, range for difference between the
largest and smallest observations and mean for average values.
• The population (universe) in the study will include guest houses in Gauteng
Province. The sampling unit is 65 guest houses and the respondents will be
65 owners/ managers of the guest houses and 325 guests if guest house
owners allow and succeed to interest five of their guests to complete the
questionnaires.
• The parameters of the research will cover guest houses located within a 70
kilometres (km) radius from the Johannesburg Central Business District
(CBD).
• Guest houses serving different target markets will be included in the sample,
such as those with different pricing categories.
1.8 Outline of the proposed study
The outline of the chapters is a generic one and details will unfold as the
research progresses.
Chapter 1 Introduction
Chapter 2 Literature review – The guest house product
Chapter 3 Literature review – Consumer behaviour
Chapter 4 Literature review – Service quality
Chapter 5 Research methodology

21
Chapter 6 Report on data and analysis
Chapter 7 Summary of findings, conclusion and recommendations
1.9 Preview of the following chapters
Chapter two, Literature review – The guest house product, presents a description
of international tourism, a brief historic background of the development of South
African tourism and some current tourism trends and developments. It then
presents information about guest houses in the country and their product
offering, followed by a section on hospitality management.
Chapter three, Literature review – Customer behaviour, presents why it is
important for marketers to study and understand customer behaviour. It then
describes characteristics of the behaviour of the customer as an individual, the
social and cultural dimensions of consumer behaviour and the decision-making
process that customers follow.
Chapter four, Literature review – Service quality, presents a brief overview of
what is quality in the service industry and how it is related to customer
satisfaction. It then explains what factors contribute to the evaluation of service
quality, how the service quality could be measured and what discrepancies could
arise between customers’ expectations and their perceptions of the service they
receive from the service provider.
Chapter five, Research methodology, is a chapter that describes the steps taken
during the execution of the research study.
Chapter six, Report on data and analysis, provides an analysis of the collected
data from the questionnaires. The results are illustrated in the form of figures and
tables and represent the answers of the owners/ managers of the guest houses
in Gauteng Province and some of their guests.
22
Chapter seven, Summary of findings, conclusion and recommendations, provides
a statement of the main points established in Chapter six. It then presents the
final conclusion of the research, based on the literature reviewed and all the data
collected during the study; and some recommendations for guest house owners.

23
2. LITERATURE REVIEW – THE GUEST HOUSE PRODUCT
2.1 Introduction
The guest house sector in South Africa is a relatively new one in the hospitality
industry. It only became prominent in the nineties. Guest houses are privately run
accommodation establishments and their exact contribution to the hospitality
industry is difficult to assess. However, they are participants in the tourism
industry and in order to portray a clearer picture of them, the following issues are
discussed in this chapter: International tourism, tourism in South Africa, the
accommodation industry in South Africa, the guest house sector in South Africa
and hospitality management.
The discussion on international tourism presents an overview of tourism on a
global scale. It includes reasons why people travel, role players in the tourism
industry and the effect of globalisation on tourism.
The section on tourism in South Africa provides a brief history of the
development of tourism in the country. It introduces current tourist trends and
current developments in the domestic market.
The section on the accommodation industry in South Africa presents the various
types of accommodation available to tourists. It also describes customer trends
and statistical figures related to accommodation in recent years.
The section on the guest house sector in South Africa provides general
information about guest houses. It also includes a detailed analysis of the guest
house product. Further information about guest houses will be obtained through
questionnaires and reported on at a later stage in the study.

24
The section on hospitality management defines the process of hospitality
management and explains the role of managers in the industry.
2.2 International tourism
Tourism is the term given to the activity that occurs when tourists travel. This
encompasses everything from the planning of the trip, the travelling to the place,
and the stay itself, to the return, and the reminiscences afterwards. It includes the
activities the traveller undertakes as part of the trip, the purchases made and the
interactions that occur between guest and host. In summary, it is all the activities
and impacts that occur when a visitor travels (Mill & Morrison, 1992: 9).
Tourism has grown enormously in the last half century and has become the
world’s largest industry (Wahab & Cooper, 2001:70). This growth can be
associated with the increase of the world’s population, the increase in individuals’
earnings, changes in society, emerging technologies and widely available
information, changes in political and legal environments, the increase in
international investments and the global economy. Globalisation has offered
endless opportunities and at the same time has made the world a highly
competitive arena. People are changing their life styles in order to survive or be
successful in this competitive environment. They are becoming more aware of
their limited time and are looking for both value for time and value for money
(Wahab & Cooper, 2001:70). This indicates that the tourism demand is
undergoing a transformation from holiday products, which were “mass,
standardised and rigidly packaged”, at reasonable prices due to economies of
scale, towards “independent or semi – independent trips” (Wahab & Cooper,
2001: 77; Keyser, 2002: 109-111). In other words, people are moving away from
perceived mass tourism destinations.
Travellers are motivated by a wide range of desires. The World Tourism
Organisation (WTO) recognises six main purposes for travelling (Keyser, 2002:
45):

25
• Leisure, recreation and holidays – these include sightseeing, shopping,
attending sport events, recreational and cultural activities, cruises, gambling,
relaxing and honeymooning.
• Visiting friends or relatives – such as visiting family and friends, weddings,
funerals, care for invalids or ill members of the family.
• Business – includes meetings, sales for foreign enterprises, conferences,
educational courses, giving lectures or concerts and government missions.
• Health – for example health treatments, spas, fitness and other medical
treatments.
• Religion – involves attending religious events.
• Other – like transit activities or other unknown activities.
Tourism is about people: tourists interacting with other people, undergoing
experiences that may influence their own or the host community’s attitudes,
expectations, opinions and, ultimately, lifestyles. Tourism being such a diverse
activity makes it difficult for individual tourist outlets to satisfy the needs and
desires of all travellers. Wahab and Cooper (2001: 70) suggest that the 4S
framework for urban tourism is shifting from “Sightseeing – Shopping – Shows –
Short breaks” to “Segmentation – Specialisation – Sophistication – Satisfaction”.
This framework guides tourism managers in the interpretation of the demand
trends and in the development of products that will best satisfy the chosen
segment of the market. The advantage of accommodation establishments, such
as guest houses, is that the management and staff are in constant interaction
with their customers. This interaction provides a better opportunity for guest
house managers to acquire customer knowledge, than any researcher or

26
database could provide (Middleton & Clarke, 2001: 183). This also helps guest
house owners to identify which segment of the market is most likely to be
attracted to their product offering so that they can concentrate their marketing
efforts on that specific market segment. Ultimately, these processes of
segmenting the market and meeting customers needs through customised
service, lead to satisfied customers.
The demand for tourism is met by the concentrated marketing efforts of a wide
variety of tourist services. Together, these services form the world’s largest and
fastest growing industry (Holloway, 1998: 67). The travel and tourism industry
comprises of the tourist and the producers of the tourism product, which are the
transport providers; the accommodation providers, such as hotels, guest houses,
lodges and so forth; and attractions and support services. The producers could
be from the private sector or the public sector, and the success of the industry
depends on the close working partnership between the two sectors. Additionally,
there are other factors that influence travel and tourism. The World Tourism
Organisation has identified the most important ones as economic and political
factors, the influence of technology, demographics, the effect of globalisation,
localisation, growing socio-environmental awareness, living and working
environment, a change from “service” to “experience” economy, advances in
marketing and travel and personal safety (Lubbe, 2003: 64).
Globalisation of the media and easy access to information has contributed to the
fact that people are becoming more educated and their interests are shifting to
different destinations. They seek to experience more adventurous and enriching
tourist products and also more personal service, such as the service that a guest
house could offer them. The sophistication in their needs, leads to the necessity
to develop sophisticated products, which are to be delivered at the appropriate
time and price (Wahab & Cooper, 2001: 85). This requires a specialisation of the
products and destinations. Tourism enterprises are in a situation where they
have to identify their competitive advantage and market the products to the

27
consumers in the best possible way. Since tourists no longer have single,
standardised and rigidly packaged wants, segmentation offers the opportunity to
provide appealing tourism products to well-defined markets (Wahab & Cooper,
2001: 88). The powerful immediacy of customer contact in guest houses,
provides a knowledge not only of what customers want and expect from the
product offering, but also of what type of customers are looking for that offering.
Appropriate segmentation ensures that the right type of consumer is attracted to
the destination and ultimately it has an impact on the experience of the tourists
and their perception of the product. The tourist experience is a complex amalgam
of factors, which shape the tourist’s feelings and attitudes towards his or her visit
(Page, 1995: 24; Bennett, Joste & Strydom, 2005: 91). If the consumers are
satisfied with their experience it means that their needs and expectations were
met. It also suggests that they will probably return to the destination and/ or will
share their experience with friends and family. Then these friends and family may
become potential customers, because the place was recommended by
somebody that has been there. Word of mouth advertising is considered to be a
very powerful marketing tool in the service industry, especially when dealing with
international markets.
2.3 Tourism in South Africa
In South Africa, the historical background of the country has played an important
part in the development of the tourism industry. In the 19th century, owing to its
climate conditions, South Africa became famous as a health destination and it
was marketed in Britain as the ”health resort of Europe”. Domestic tourism also
occurred at this time as the farming community went on holidays by ox-wagon
(Lubbe, 2003: 26). Many attractions were established and opened their doors to
welcome the tourists.
During the First and Second World wars, South Africa experienced difficulties in
promoting tourism to the country. In the late sixties, the World Bank established a
Tourism Projects Department to help finance the development of tourism.

28
“However, in the seventies and eighties the apartheid regime slowed down the
growth of tourism. South Africa became isolated from the rest of the world. Harsh
economic and other sanctions were imposed, including measures to discourage
citizens of foreign countries from visiting South Africa. South Africans were also
denied the opportunity to visit some foreign countries. This resulted in major
restrictions on the activities of the South African Tourism Board. Offices in some
countries had to be closed, and South Africa was regarded as an undesirable
and unmarketable destination. Some newspapers refused to accept
advertisements that promoted South Africa. To counter this, the Tourism Board
was obliged to expand on the use of direct marketing campaigns. Local tourism
was also encouraged to help ensure the survival of the industry. Discriminatory
legislation was gradually abolished and new markets and marketing opportunities
opened up. However, South Africa remained isolated from the rest of the world”
(Bresler, 2005: 120).
On 2 February 1990, President F.W. de Klerk announced the unbanning of the
African National Congress (ANC) and other freedom organisations, and also the
release of all political prisoners, amongst them the ANC leader, Mr Nelson
Mandela (Bresler, 2005: 120). The sanctions were lifted and many opportunities
opened up for South Africa. The country was positively marketed internationally
as a tourist destination, more airlines started flying to South Africa and co-
operation between the Southern African countries increased (Lubbe, 2003: 27).
South Africa was exposed again to international markets. Overseas tourists were
once again encouraged to visit South Africa, and South African citizens were free
to visit overseas destinations that had previously been closed to them. The first
democratic elections held in April 1994 also impacted profoundly on the tourist
industry. Although many foreign tourists avoided the country at the time of the
elections, thousands of international journalists and observers injected millions of
rand into the local tourist industry (Bresler, 2005: 120).

29
After 1994 tourist activity increased considerably. The figures of total foreign
visitors, as recorded by South African Tourism (2005b), prove the tourism growth
experienced in the country and they are as follows:
Year – Total foreign visitors
1994 – 3 896 547
1995 – 4 684 064
1996 – 5 186 221
1997 – 5 170 096
1998 – 5 898 236
1999 – 6 026 086
2000 – 6 000 538
2001 – 5 908 024
2002 – 6 549 916
2003 – 6 504 890
2004 – 6 677 839
In the past eleven years tourism in South Africa has been expanding and working
towards optimising its potential. Today, South Africa probably has the best
accommodation facilities and transport infrastructure in all of Africa (Bresler,
2005: 117). The tourist arrival statistics for 2002 confirmed that South Africa is
the fastest growing tourist destination in the world (South African Tourism, 2003)
and that the country has a lot to offer in terms of genuine warmth and hospitality,
diverse cultures and heritages, wildlife, scenic beauty and adventurous
opportunities, conference facilities and eco-tourism.
Recently, a new tourist trend has become evident in the country. A company,
Master Currency, undertook a survey, which established that 69 percent of airline
passengers to Johannesburg are either returning emigrants or people coming to
shop (South Africa Travel Guide Online 2004). Puk, chief executive officer of
Sure Travel, stated in the South African Travel Guide Online that many people

30
that used to go to Dubai to shop in bulk quantities are now coming to South
Africa instead. Shopping is the second most common reason amongst
foreigners, after holiday reasons, for coming to Gauteng (South African Tourism,
2005c: 12). This has further contributed to increasing the popularity of the
country. Another event that needs to be mentioned is South Africa winning the
bid for the 2010 Soccer World Cup. This means that the tourism industry of the
country will benefit enormously from all the opportunities that will arise from
hosting such an event and South Africa stands a good chance of becoming an
even more popular tourist destination.
Perceptions of high crime rates in South Africa and other Southern African
countries have, however, significantly deterred international tourists from visiting
(George, 2001: 44). Tourists could be particularly sensitive towards travelling to
destinations that might put them at risk. That is why ensuring safety and security
has become very important for all tourism service providers.
The domestic tourist market plays an important role in the South African
economy. It was valued at R47 billion for the period 2002/3, as opposed to the
international market value of R53.9 billion, and research indicates that there is
opportunity for further growth (Department of Environmental Affairs and Tourism,
2004). In 2003 South Africans undertook over 49 million domestic trips, of which
64 percent was to visit friends and family, 16 percent for holiday, almost 11
percent for religious purposes, 6.2 percent for business and 16 percent for
medical reasons (South African Tourism, 2004b: 1). Domestic tourism is driven
by school holidays with the largest number of trips taken in December (summer
holiday), then in July (winter holiday) and April (Easter holiday). In terms of
provincial popularity, Kwazulu- Natal received the biggest share of domestic trips
– 13,9 million trips, followed by Gauteng – 8.6 million, Eastern Cape – 7.5 million,
Western Cape – 5.2 million, Limpopo – 4.6 million, Free State – 3.3 million,
Northwest – 3 million, Mpumalanga – 2.5 million and Northern Cape – 0.8 million
trips (South African Tourism, 2004b: 4).

31
Tourism in South Africa is currently undergoing transformation. A lot of emphasis
is being placed on internal marketing. Internal marketing is promotion of the firm
and its products to the firm’s employees. Through it the company’s staff become
educated, aligned and motivated in achieving the company’s objectives, said
Crick (2003: 161). The author added that on a larger scale, the successful
implementation of a tourism programme depends on the internal marketing of
tourism to the community. In other words, internal marketing of tourism is in fact
development of domestic tourism. The government is putting programmes in
place to assist the emerging entrepreneurs in the tourism sector. An emphasis is
placed on educating and involving local communities and previously
disadvantaged groups to participate in the tourism value chain. The
transformation of the industry is also involved in encouraging local South Africans
to travel more and see the country. Currently, only 30 percent (14 million) of the
population of the country take trips for holiday purposes (Department of
Environmental Affairs and Tourism, 2004) and the majority of domestic travellers
stay with friends and family, rather than using the services of guest houses,
hotels or other accommodation providers (South African Tourism, 2005d: 9).
High importance is placed on capturing a bigger share of the black market.
Abrahamse in Ludski (2001) identified a need to develop an understanding of the
needs of the local tourists in order to draw black South Africans into the market. It
is critical that all people of a country support the tourism industry, because
growth in the domestic market will increase the value of the market and will help
combat issues of seasonality, geographic spread and limited trip expenditure.
Further development of domestic tourism will lead to improvement in the quality
of the products and services, will increase the confidence of international tourists
about coming to South Africa, will secure stable occupancy levels and will create
job opportunities (Department of Environmental Affairs and Tourism, 2004).
32
2.4 The accommodation industry in South Africa
The nature of accommodation supplied at a destination is mainly a function of
demand – in other words, it is tourists who determine what type of
accommodation will be established at the destination area. Some prefer the full-
amenity type of accommodation, whilst others are content with the bare
essentials (Jordaan, 2001: 36).
Tourist accommodation includes all establishments offering overnight
accommodation on a commercial basis. Accommodation is part of the tourism
product that provides a support service for a wider motivation, which has brought
a visitor to a specific destination (Bresler, 2005: 198). For business travellers,
accommodation is a necessary facility that makes it possible, convenient and
comfortable to engage in the primary reason for travel – i.e. business. For leisure
travellers, accommodation is integrally related to the attractions of a destination
and it is also a part of the facilities (Middleton & Clarke, 2001: 390). When
selecting a holiday destination, the image and quality of the accommodation
might have a strong influence on the choice.
In South Africa the list of types of accommodation that the travellers can choose
from is considerably long. It includes: hotels, motels, B&Bs, guest houses,
cottages, lodges, mountain huts, flats, rooms, rondavels, caravan parks, time
share accommodation, accommodation for back packers, resorts and others. In
Paragraph 1.4 it was established that the South African hotel industry is
recognised as one of the most important sectors of the domestic economy. It is
characterised by the presence of many of the world’s best-known brands
including Holiday Inn, Sheraton, Hyatt, Hilton, Inter- Continental, Radison and
home grown brands such as Southern Sun, Protea Hotels & Inns, City Lodge,
Sun International and others (Jordaan, 2001: 151). While hotels have traditionally

33
offered a full range of services to the travelling public, the industry now provides
for all types of needs and expectations (Jordaan, 2001: 156).
In 2000 and 2001, the accommodation industry of South Africa had relatively
stable occupancy rates. In 2002 and 2003 the country received increased global
exposure due to the United Nations World Summit (in 2002) and the Cricket
World Cup (in 2003), which were held in South Africa. This resulted in a sharp
increase of the occupancy rates for these two years (Koumelis, 2004). Foreign
travellers perceived the country as a value-for-money destination, because in the
past years the weaker rand made it possible for tourists to enjoy high-class
holidays for less money, as compared to prices in other countries. Recently,
however, South African hotels’ occupancy rates have been falling and Koumelis
(2004) attributes it to the stronger South African currency that the country has
been experiencing since the beginning of 2004. Today the stronger rand implies
that foreigners will have to pay more, in terms of their home currency, in order to
come to South Africa for a holiday. This resulted in a decline of over two million
bed nights sold in 2004 as compared to 2003 (South African Tourism, 2005a:
62), and over six billion rand decline of Total Foreign Direct Spent in South Africa
(South African Tourism, 2005b: cover page). There was a further decrease in
bed nights sold in 2005, as the figures for the second quarter are 11.9 percent
less than the first quarter (Statistics South Africa, 2005b: 2). Additionally, the
most common length of stay of domestic tourists for the first quarter of 2005 was
only two nights (South African Tourism, 2005d: 9) and for foreigners in 2004 was
also only two nights (South African Tourism, 2005b: 83).
The country has also been experiencing airline capacity problems for the past
few years. South African Airways (SAA) has been criticised by the government
for not keeping pace with the growing tourism demand (Hicks, 2003). However,
the Tourism Authorities are committed to increasing the air access to the country
(Koumelis, 2004). This will help to bring more people to the country and through
increased availability of flights to South Africa, the cost of travel to the country
34
could be decreased. This would contribute positively to restoring the value-for-
money perception of tourists and would also favour tourism growth and
accommodation providers.
The stronger rand creates an advantageous situation for small establishments
like guest houses. In general guest houses are more cost effective for tourists as
compared to hotels. The average cost of hotel accommodation tends to be
around R400 a night, while an average guest house charges between R200 and
R250 a night (Gillingham, 2004). The hotel charge may or may not include
breakfast, while almost all guest houses include breakfast in their tariff. In other
words, by using guest houses, organisations or travellers can cut their
accommodation bills almost in half (Gillingham, 2004). However, guest house
managers/ owners should take into consideration that the hotels generally have
more financial resources available and could use tactical price cuts in the form of
sales promotions in order to attract as many tourists as possible. Guest houses
on the other hand, might not be in a financial position to reduce their prices, and
this might lead to hotels and guest houses offering accommodation at similar
prices. In such a situation of increased competition, it would be of great
importance to guest houses and other small-scale operation establishments to
know what their customers expect from the service provider. Having this
knowledge, guest houses would be able to provide a satisfactory service offering
to their customers and would be able to attract and retain customers.
2.5 The guest house sector in South Africa
A guest house, as defined by the Tourism Grading Council of South Africa
(TGCSA, 2002), is either a converted house adapted to accommodate overnight
guests or it may be a purpose-built facility. A guest house is run as a commercial
operation and it is often owner-managed. It has public areas, which are for the
exclusive use of the guests. The owner/ manager either lives off-site, or in a
separate area on the property.

35
Guest houses generally compete for a share of the tourist market with all kinds of
accommodation providers, however, they are in direct competition with Bed and
Breakfast (B&B) establishments, which offer similar services. Owing to the
similarity of the two, B&Bs will be included in the study and when the term guest
house is used it would represent guest houses and B&B establishments. Bed
and Breakfast accommodation, according to TGCSA, is usually provided in a
family (private) home and the owner/ manager lives in the house or on the
property. Breakfast is usually served. Bathroom facilities may or may not be en-
suite and/ or private. In general, the guests share the public areas with the host
family.
2.5.1 Historical background
In this section, the information provided on guest houses explains how they came
about, what they are and what they offer to their guests.
In the past decade a growing trend towards guest and country house type of
accommodation has emerged. The guest house concept originated in Europe. In
South Africa the first guest houses became evident in 1991, but the real growth
only took place since 1995 (Jordaan, 2001: 171). In Gauteng there are 115
registered guest houses and 203 registered B&B establishments and they
provide 1774 rooms and 3648 beds for travellers (City of Johannesburg official
website, 2005).
The guest house industry today is highly competitive, as it was previously
discussed in Paragraph 1.1, and the different guest houses compete in terms of
the services and quality offered to their customers. Initially guest houses started
as a source of second income and in some instances as the only income. Until
recently the guest house sector was regarded as dominated by white people, but
today more and more black people are following the same example and are
offering to their customers the experience of traditional customs and cuisine
(South African Tourism, 2004a). Many foreign guests feel that in large

36
commercial operations they do not have enough contact with the country’s
people, therefore they choose to stay in a guest house, where they are in a
homely atmosphere and in close interaction with the guest house owners and
their staff and where they can learn more about the traditions and the customs of
the country (Paragraph 1.4). From the foreigners that make use of the services of
guest houses, European tourists seem to be frequenting those establishments
much more than their African, Indian and Australian counterparts (South African
Tourism, 2005b: 91). However, South African Tourism (2005b: 14) established
that the largest share of foreign tourists to South Africa is land-based travel from
neighbouring Southern African Developing Countries (SADC). Short haul visitors
to SA from SADC, Central and East Africa made up 69 percent of visitors to the
country in 2004 and long haul visitors from overseas and North Africa made up
31 percent (South African Tourism, 2005b: 14). It was also established that
tourists from these countries stay mostly at hotels or with friend and family.
Therefore these customers represent an opportunity for a target market for guest
houses.
2.5.2 Guest house management
The management of the guest houses is usually done by the owners or,
alternatively, they employ a manager. The owners do not necessarily have any
experience in the hospitality industry, but the success and survival of their
establishments depend on their good business sense, managerial skills and
expertise (Henning & Willemse, 1999a: 4). It is important to recognise that a
distinct and significant range of management issues confront small hospitality
firms (Morrison & Thomas, 1999: 149). Managers are challenged with balancing
and satisfying needs of consumers, owners or operating companies and
employees (Jayawardena & Haywood, 2003: 195). Marketing an establishment
involves some kind of research into customer needs, a marketing plan and
choosing the correct promotional methods in order to reach the target market.
Advertising is also expensive for small companies (Misner, 1994: 37) and guest

37
houses might not have surplus funds to employ in order to reach their customers.
Guest house owners, as mentioned in paragraph 2.2, have the advantage of
being in contact with their guests, which allows them to detect customer needs,
behaviour and satisfaction or complaints (Middleton & Clarke, 2001: 183). Their
customer knowledge is better than hotel’s customer knowledge, because they
receive customer feedback on a daily basis and this is why guest houses could
satisfy customers better. This is also why guest house owners who have some
management and marketing knowledge and know how to use the feedback from
the customers would successfully reach their target market.
Quality management is also an issue by means of which, if addressed efficiently
and effectively by the manager, a guest house could gain advantages over its
competitors and achieve a more secure financial future. The owner/ manager
should be able to promote a preventative system of quality control. Furthermore,
the owner/ manager should be an entrepreneur. As Morrison and Thomas (1999:
153) state, many of the management challenges confronting small hospitality
firms have the potential to be addressed through entrepreneurial practices.
“Because tourism is a relatively new industry, communications and access to
information is the major obstacle to growth and development,” said Abrahamse in
Koumelis (2003: 1). She also stated that many entrepreneurs recognise the
opportunity to become involved in tourism, but are having difficulty in
understanding what they need to have in place in order to be a player in the
industry. Additionally, small, family-run accommodation establishments rarely
take steps to acquire information and skills that do not have immediate
application to the solution of a specific technical or managerial problem (Bresler,
2005: 200). This is why the study could provide useful guidelines on customer
expectations, perceptions and behaviour, which would help guest house
managers/ owners to satisfy customer needs and would contribute to successful
operation of their business.
38
Some guest houses have started to work together and form their own guest
house networks. They are also building relationships with other suppliers, like car
rental companies, tour operators, travel agents and tourist information centres.
Networking helps to reach a broader field of clients, to ensure more stable
occupancy rates and also to save on marketing costs.
High crime figures in any country represent a threat to the hospitality industry. In
South Africa tourists and travellers are encouraged to be aware and cautious
when exploring the attractions offered at destinations. Hospitality services
providers are also urged to ensure the safety of their patrons. Guest houses are
small establishments, therefore it is easier to control the safety and security of
their guests. It is more difficult for an intruder to walk unnoticed into a small
establishment than a large one, where the front office staff is often busy (Callan
& Fearon, 1997: 170).
2.6 The guest house product offering
The product offering of a guest house is part of its marketing mix. For an
organisation to be successful with its marketing mix, it has to develop a
differential advantage, which will distinguish the organisation’s product offering
from that of the competitors (Cooper, Fletcher, Gilbert, Shepherd & Wanhill,
1998: 411). A differential advantage could only be achieved in certain areas of
the hospitality product. What is the guest house product? A product, as defined
by Kotler, Bowen and Makens (1996: 274), is anything that can be offered to a
market for attention, use or consumption that might satisfy a want or a need. It
includes physical objects, services, places, organisations and ideas. In terms of
hospitality and tourism, the product is a combination of the core product, the
facilitating product, the supporting product and the augmented product.
The core product is the basic need function served by the generic product
(Seaton & Bennett, 1996: 121). For guest houses the core benefits offered are
shelter and rest. The facilitating products are those services or goods that must

39
be present for the guest to use the core product (Kotler et al., 1996: 275). A
guest house, for example, has a reception area where the guests can check in
and out, telephones, a dining room where breakfast and dinner are served, and
parking facilities as facilitating products. Core products require facilitating
products, but do not always require supporting products. Supporting products are
those that add extra value to the core product and help to differentiate it from the
competition. Examples of supporting products in guest houses are: shampoo and
shower gel in the bathroom or a bottle of mineral water in the room. An example
of a supporting service is the opportunity for foreign guests to communicate in
their home language with the owners. Many guest house owners speak German
or French or Italian or languages other than English. This facilitates foreign
travellers and provides added benefits to the product. The distinction between
supporting and facilitating products is not always clear. Sometimes, depending
on their personal needs, customers could see the supporting product as
facilitating and vice versa. Seaton and Bennett (1996: 121) grouped the
facilitating and supporting products in one and called them the tangible/formal
products. The authors have further defined them as the specific features and
benefits residing in the product itself – like styling, quality, brand name, design
and others. The augmented products are the add-ons that are extrinsic to the
product itself, but which may influence the decision to purchase. They include
accessibility, atmosphere, customer interaction with the service organisation,
customer participation and customers’ interaction with each other (Kotler et al.,
1996:276). In other words the augmented service offering combines what is
offered and how it is delivered.
2.6.1 The guest house product offering characteristics
Quality is an important contributor to a differential advantage of a guest house. A
customer who receives quality for his money would leave the establishment
satisfied and would talk to friends and family about his experience. He will
promote the guest house to others by word of mouth, which is a powerful

40
marketing tool. A satisfied customer would bring repeat business for the guest
house and would help to generate new customers. Word-of-mouth advertising
could be more effective than any paid advertising the firm might use (Zeithaml &
Bitner, 2003: 162).
Quality, as Fontaine stated (in Hall, 1990: viii), means each person doing his or
her job correctly each and every time. Defining quality in the service industry is
not straightforward and obvious owing to the fact that human interaction is more
complex compared to the other industries, where the products are physical
goods rather than services. In the manufacturing industry, the customers
evaluate the quality provided by evaluating the goods purchased, on the basis of
whether they work as effectively as advertised. The contact with the seller is
limited to obtaining information about the product and then selecting to purchase
it, or not. The quality is then evaluated on the properties of the actual goods. The
service offering or the guest house offering in this case, however, has unique
characteristics. They are:
• Intangibility
Hospitality services cannot be seen, tasted, felt, heard or smelled before
being bought – they are intangible. That means that customers are unsure of
what exactly they are purchasing and an element of risk is present, because
they cannot evaluate or test the service beforehand. That is why customers
rely on word of mouth communication from people that have experienced the
service offering (George, 2001: 20).
• Inseparability
The guest house offering is sold first, then produced and consumed at the
same time. Therefore the way that the offering is delivered is crucial and the
service providers, the staff, become part of the offering. Additionally, other
consumers also become part of the offering, as they can affect the overall
experience in a positive or a negative way.
41
• Variability (Heterogeneity)
Tourism offerings and experiences vary according to a given situation. The
service providers are not all the same, they are human beings, and they
deliver different levels of service. Similarly, no two consumers are precisely
the same – they have different demands, expectations, tastes, moods,
perceptions and emotions (George, 2001: 21).
• Perishability
The guest house offering cannot be saved, stored, resold or returned – the
product is perishable. If a hotel room is not sold, the revenue for that day is
lost and cannot be recovered.
In the service industry the products are intangible and the evaluation of the
quality is based on the continuous interaction of people with people. The quality
of the interaction can rarely be standardised to ensure uniformity. The process
starts from the point of acquiring information about a destination, then making a
reservation, travelling, arriving, the actual stay and then getting back home.
Throughout the process the customer forms subconscious expectations, which
are compared with the actual experience. These are used as criteria when
evaluating the quality of the performance received. The criteria to evaluate the
performance are complex and depend on each individual’s perception and
expectation. At the same time the performance varies from producer to producer,
from customer to customer, from day to day and from situation to situation.
It is imperative that guest houses deliver to their customers the highest standard
of quality desired. Guest house owners/ managers should learn how customers
evaluate and what they expect from the service offering, so that they can ensure
that their product will generate the ultimate customer satisfaction. They must also
use this knowledge to attract similar customers to their establishment. Customers
42
with similar needs would have more in common and this would enhance their
experience at the guest house.
2.6.2 Differentiating the guest house offerings
It is considered that in highly competitive markets, suppliers are unlikely to
develop an advantage in the core benefit. That is because most guest houses
offer the same rest capacity. Differentiation, however, could be achieved in the
tangible/ formal product (otherwise known as facilitating and supporting products)
and in the augmented product (Seaton & Bennett, 1996: 121). An easy
accessibility to the guest house and a good location in relation to major routes is
beneficial to many guests and it is not something that can be copied by
competitors, except the ones that are situated in the same area. The atmosphere
and the physical environment are also elements which are specific to each guest
house. Each guest house owner has his/ her personal style of décor, colour
scheme and design which create the unique atmosphere of the guest house. The
individual style of décor and atmosphere compliment the core product and at the
same time differentiate the particular guest house from others. The customer
interaction with the service delivery system of the guest house is one of building
relationship through close contact with the owner and staff. By allowing
customers to participate in the delivery of services, guest houses provide a
personalised offering to their guests. Serving breakfast and dinner on request is
a standard offering for guest houses, but allowing the guests to choose their
meals suggests that their individual needs are met. This contributes to the
customer satisfaction and at the same time the owner eliminates leftovers and
reduces costs. Additionally the guest house management also provides other
services like organising transport facilities for their guests, suggesting places of
interest in the area, organising tours, booking restaurants and others.
Guest houses are small establishments with fewer staff to attend to the guests’
needs. That gives them a good opportunity to build relationships with the guests

43
and to learn what they like and dislike. With the knowledge managers acquire,
they can work towards providing an enhanced quality experience for tourists,
which would lead to return patronage, referrals and ultimately increased profits.
Profitability in the tourism industry is essential for the sustainability of the sector
and for the private sector’s ability to spread benefits (Gauteng Tourism
Development Authority, 2002: 2). Investing in developing long-term bonds with
individual customers provides a sustainable competitive advantage to the firm,
because the intangible aspects of a relationship are not easily duplicated by
competitors (Roberts, Varski & Brodie, 2003: 169). Guest houses also have
public areas on their premises where the guests could interact with one another.
For example, the guests could meet at the breakfast table, at the braai area, at
the pool or in the garden. The variety of public areas is another factor that would
differentiate one guest house from another.
2.6.3 Guest house grading schemes – method of differentiating
guest houses
South African Tourism Authorities have developed a way of officially
differentiating accommodation establishments. They have developed a grading
scheme for the hospitality industry, which is administered by TGCSA. This is a
voluntary scheme for accommodation establishments of the following categories:
Self Catering, B&B, Guest House, Lodge, Country House and Hotel. Anyone
from the mentioned categories can register and be graded, according to the
TGCSA requirements, on a scale of one to five stars. If one uses the Automobile
Association (AA) Guide (2001-2002), one would be able to classify
accommodation establishments, including guest houses, into price categories
starting from R100 to R2999 per person sharing. Further to the TGCSA and AA
classifications, Portfolio South Africa have established in their Bed and Breakfast
Collection 2003-2004 additional categories for B&Bs, guest houses and similar
establishments. Their collection of homes is ranked in the categories of Luxury,

44
Great Comfort and Comfortable after annual assessments and visits to the
establishments by the Portfolio team.
2.6.4 The guest house marketing mix
Guest houses provide a variety of services and products. That means that guest
house owners are faced with making marketing decisions on the mix of products
which they propose to offer to their customers (Holloway & Plant, 1992: 69). It is
customary to accept that the marketing mix is within the control of management
and refers to decisions made in relation to the four Ps (Cooper et al., 1998: 392).
The four Ps are: Product, Price, Promotion and Place. The decisions about the
marketing mix are focused around the target market, as it is the target market
that dictates the different ways in which the mix is used.
The four Ps have been successfully applied by marketers in the manufacturing
industries. In the service industries, however, it has been argued that the four Ps
are not comprehensive enough (Cooper et al., 1998: 410), and an additional
three Ps have been added. They are: People, Physical evidence and Process.
People include personnel and personnel-related matters, like training, discretion,
commitment, incentives, appearance, attitudes and behaviour. It also covers the
customers, their degree of involvement, and their contact with other customers.
In guest houses, interaction with people (staff, customers, management) helps
management to identify what is needed to improve people’s experiences. The
Physical evidence is the environment – the furnishings, colour, lay out, noise
levels, facilitating goods and tangible clues, which enhance the experience. The
Process covers the policies, procedures, mechanisation, employee discretion,
customer involvement, customer direction and flow of activities. In a guest house
the processes are more simple, as it is a small-scale operation establishment
and does not have a large vertical structure. The processes are also more
customised, as they are co-ordinated with customer needs.

45
2.7 Hospitality management
Management can refer to a set of roles that people perform, and it can refer to
the functions pursued in those roles. The functions are often listed as a
condensed set of four: planning, directing, organising (which includes co-
ordinating) and controlling. Managers in guest houses must perform these
functions and run a productive operation, within certain limitations. As mentioned
earlier in paragraph 2.5.2, guest house owners or managers generally have little
experience in the hospitality industry and limited managerial skills, however,
through their abilities they have to be able to relate successfully to employees
and customers.
2.7.1 Objectives of managers
Powers and Burrows (2003: 6) suggest that there are three kinds of objectives
that managers make their concern:
• Make the guest feel welcome – it involves dealing with the customer in a
friendly and professional way, and at the same time ensuring that the
employees are motivated and treat the guests with the same friendly and
professional approach.
• Make things work for the guest – this involves ensuring that the whole system
of the hospitality organisation functions optimally and consistently and
delivers quality on time.
• Make sure that the operations will continue to provide service while also
making a profit – it involves the ability to recover operational costs, make
enough additional income to pay back borrowed resources and provide a
return to the investor.

46
Management is an indispensable component for the successful functioning of a
hospitality organisation. It directs the resources of the organisation towards
achieving the goals set, and attains or maintains the purpose of existence of the
organisation.
In today’s world of global competition, managers are not only directing the
operations of the organisation in order to stay in the market, but they are leading
their staff in the path to achieve excellence in their services. Managers work with
employees and through those employees, the objectives of the organisation are
achieved. Therefore, keeping everyone motivated in the organisation is crucial
for the success of the company. People, however, are different from each other
and are motivated by different factors. That means that the manager should
create a motivating environment that would satisfy different needs (Bresler, 2005:
181). People in service work need a vision in which they can believe, an
achievement culture that challenges them to be the best they can be, a sense of
team that nurtures and supports them, and role models that show them the way
(Zeithaml, Parasuraman & Berry, 1990: 5). Through leadership, employees’ full
voluntary co-operation is involved in establishing a direction for the organisation
– a common vision for everyone, in aligning people and forming support for the
direction chosen, and in keeping everybody motivated and inspired.
2.7.2 Unique challenges in accommodation management
Middleton and Clarke (2001: 391) have identified five characteristics of any
accommodation business, which have an influence on the management and
marketing of an establishment. They are:
• choice of location;
• existence of peaks and troughs in demand;
• influence of room sales on profits;
• high fixed costs of operation; and
47
• focus on “bookers” (defined in the text below), not occupancy levels.
Location determines the customer mix a guest house can achieve and directs the
marketing strategy that could be used to attract the customers. Owing to the fact
that location is fixed, if there are any problems or difficulties that arise during the
time of operation, related to the location, managers have to use marketing skills
to overcome them.
Customer demand is not constant in the accommodation business. Guest houses
and other accommodation establishments could have high occupancy during
some days of the week or some months of the year, and during others they could
have low occupancy. Marketing efforts could lessen the difference between high
and low demand. This could be achieved by increasing sales through targeting a
new segment of the market, or through developing a new product for the target
market.
The profits of a guest house are directly related to rooms’ night sales or bed
occupancy. The more customers stay at a guest house, more revenue will be
generated to cover total costs of operations and to make a profit. Managers’
efforts have to be directed to achieving high bed occupancy and also ensuring
the quality of the service provided.
Accommodation establishments usually have high fixed costs of operation. They
have to pay, regardless of how many visitors they accommodate per month,
expenses related to premises, rent, leases, rates and taxes, equipment, energy
and water costs, insurances, wages and salaries of staff, management
overheads, administrative costs and marketing costs. Once the fixed costs are
covered, managers have to concentrate on making additional or marginal sales
in order to generate more revenue at little cost.

48
Additionally, managers of accommodation establishments must target not only
individual customers, but “bookers” as well. A “booker”, as defined by Middleton
and Clarke (2001: 393), is a customer or an agent of the customer, who makes
reservation for accommodation for one or more people. Therefore, managers
must be able to market their establishment successfully to people who have not
experienced the service offered and probably will not experience it, but will attract
other people to experience it.
In today’s fast-changing environment, a growing number of competitors offer their
products to the same consumer groups. Travellers also have a wider range of
choices than ever before for matching an accommodation with their particular
travel needs. These needs change according to the travel purpose. In order to
ensure the survival of the guest house, management must understand these
changing needs and deliver a quality product and services appropriately targeted
to specific customers’ needs, wants and expectations (Bresler, 2005: 199).
Managers must be able to differentiate and brand their products with particular
identities that could be communicated to the target market (Middleton & Clarke,
2001: 397). They must also find ways to encourage and reward their regular or
loyal customers, who will in return attract new customers to the establishment.
Managers must engage in direct marketing of their establishments to agents,
transport companies and anybody who could bring new customers to the
business.
In the guest house sector it is important that nobody is exposed to or experiences
poor quality. Quality gaps need to be identified and eliminated and that implies
that consumer behaviour and consumer expectations are areas that require
detailed analysis (Marx, 2003). For this purpose, this study will provide more
insight on customer expectations, perceptions and behaviour, so that guest
house managers can better understand their customers and provide them with
the quality of service desired.

49
2.8 Summary From this chapter it can be seen that tourism is a fast-changing industry, that
consists of a whole range of individuals, businesses, organisations and places,
which interact in some way to deliver a tourism experience. The accommodation
sector is the one that provides a location where the tourists can rest and revive
during their travel. There is great variety of accommodation facilities available
and one of the types of accommodation is supplied by guest houses. The guest
houses bring together a number of different operations with the common
characteristics of offering accommodation, plus some food and beverage in a
small, family-style environment. They operate in a highly competitive arena and
aim to satisfy the customer needs and to differentiate their product from the ones
of competitors. In order to satisfy consumers, it is the managers’ or guest house
owners’ responsibility to understand the customers’ needs and to ensure that
they are met. Managers must also train and maintain their employees’
motivation, and must ensure that the guest house is functioning successfully and
that it is providing the quality desired by the patrons.

50
3. LITERATURE REVIEW – CUSTOMER BEHAVIOUR
3.1 Introduction
Customer satisfaction, according to the World Tourism Organisation, is a
psychological concept that involves the feeling of well-being and pleasure that
results from obtaining what one hopes for and expects from an appealing product
and/ or service (Pizam & Ellis, 1999: 328). Satisfaction is the result of the
customers’ assessment of a service based on a comparison of their perceptions
of service delivery with their prior expectations (Johnson & Clark, 2001: 178). In
order for marketers to persuade their customers to purchase and enjoy the
products and services, they have to know everything they can about the
customers – what they want, what they think, how they make decisions, what
influences their decisions. In other words, marketers have to study the consumer
behaviour in order to provide products and services that customers need, and to
provide them at the highest level of quality so that customers are satisfied.
Consumer behaviour refers to the process of acquiring and organising
information in the direction of a purchase decision and of using and evaluating
products and services. This process includes the stages of searching for,
purchasing, using, evaluating, and disposing of products and services (Schiffman
& Kanuk: 2000: 5). Consumers are not alike and they prefer services and
products that reflect their own special needs, personalities and lifestyles
(Schiffman & Kanuk, 1991: 8). That is why, when studying consumer behaviour,
marketers should consider the customer as an individual, the social and cultural
dimensions of customer behaviour and the decision-making process.
Organisations must deliver long-term customer value, if they are to survive and
succeed in today’s competitive environment. This can be achieved if they retain
customers by satisfying their needs, adopt the marketing concept, and become
focused on the customer (Cant, Brink & Brijball, 2002: 5).
51
3.2 The customer as an individual
Understanding consumer behaviour involves looking at two distinct groups of
influences – individual and group influences. The topic of the consumer as an
individual discussed below covers the individual factors, which are determinants
for the individual perspectives of consumers.
3.2.1 Customer needs and motivation
The process of buying a service begins with the recognition that a need or a want
exists. Schiffman and Kanuk (2000: 64) classify needs in two categories: innate
and acquired needs. The innate needs (also called physiological or biogenic) are
needed to sustain biological life and are considered as primary needs or motives.
These are food, water, air, shelter and clothing. The acquired needs, however,
are generally psychological or psychogenic and are considered as secondary
needs or motives. They result from the individual’s subjective psychological state,
from relationships with others, from the culture or environment and include needs
of esteem, prestige, affection, power and learning (Schiffman & Kanuk, 2000:
64).
Understanding customer needs is very important for the survival of any company.
Businesses are supported by society because they serve society’s members by
catering to their needs and so satisfying them (Cant, Brink & Brijball, 2002: 6).
Many psychologists and others interested in human behaviour have developed
lists of consumer needs and motives, which are often too long to be of practical
use to marketers. For this reason, Maslow’s hierarchy of needs theory, by
Schiffman and Kanuk (2000: 83) should be mentioned, as it is a widely accepted
theory of human motivation. The theory includes five basic needs, which are
ranked in order of importance from low- level to higher level needs. The
hierarchical approach implies that one level must be attained first, before the
next, higher level is activated.
52
• Level one – Physiological needs – they are biological needs like food, water
and sleep.
• Level two – Safety and security needs – such as needs for shelter, protection
and security.
• Level three – Social needs – for example affection, friendship, acceptance
and belonging.
• Level four – Ego needs – which may include needs for prestige, success,
accomplishment and self-esteem.
• Level five – Self-actualisation – such as for self-fulfilment and enriching
experiences.
Maslow’s hierarchy is a useful tool for understanding consumer motivation and it
is readily adaptable to a marketing strategy, because consumer products and
services often satisfy each of the need levels (Schiffman & Kanuk, 2000: 84).
Most people have different needs, but individuals are not at all times aware of
their specific needs, as they (the needs) could be dormant. The arousal of
specific needs at a specific point in time may be caused by internal stimuli found
in the individual’s psychological condition, emotional or cognitive processes, or
by external stimuli in the outside environment (Schiffman & Kanuk, 2000: 75).
Physiological arousal of needs implies that the stimulus that causes the
recognition of a need comes from inside the customer. For example hunger
would make the individual aware that he/ she wants to eat. Emotional arousal is
related to stimulation of unconscious needs when people engage themselves in
daydreaming, because they are bored or frustrated. This usually happens when
people imagine themselves in all sorts of desirable situations. Cognitive arousal
or awareness of needs could be triggered by random thoughts or a personal
achievement. An individual who has been working on a tight schedule for several
months might have random thoughts that it is time to take a holiday. An
advertisement on the television about an exotic holiday destination might trigger
the cognitive need of that individual to visit a similar destination. In the case of
53
environmental arousal, the needs activated at a specific time are often
determined by specific cues in the environment, and without these cues, the
needs would remain dormant (Schiffman & Kanuk, 2000: 75; Cant et al., 2002).
For example, a tourist who is driving around while exploring Johannesburg sees
from the street a bright wall with an inviting sign indicating that it is a guest
house. The combination of the bright colour of the wall with the sign triggers his
curiosity and urges him to go inside and have a look at the offering. Once inside
he favours the homely environment and decides that he would like to be
accommodated in that guest house.
Once individuals become aware of their need, they must also feel that they want
to do something about it. When they want to satisfy a need they experience
motivation. Motivation refers to a state of need, a condition that exerts a “push”
on the individual towards certain types of action, that are seen as likely to bring
satisfaction (Moutinho, 1987: 16). People feel an uncomfortable tension when
there is a need that is not satisfied. This uncomfortable tension creates a driving
force within the individual, which urges him/ her to take action, to behave in a
way that will satisfy the need. All behaviour is goal oriented, because goals are
the sought-after result of motivated behaviour (Schiffman & Kanuk, 1991: 70).
The specific goals that customers select and the patterns of action they
undertake to achieve their goals are a result of individual thinking and learning
(Cant et al., 2002: 118).
For any need that an individual experiences, there are different goals. The goals
that individuals choose depend on their personal experiences, physical
capacities, cultural norms and values, the goals’ accessibility in the physical and
social environment and also on the individuals’ own perception of himself/ herself
(Schiffman & Kanuk, 2000: 65).
54
3.2.2 Personality and self-concept
Moutinho (1987: 9) defines personality as the configuration of a person’s
characteristics and ways of behaving, which determine that person’s adjustment
to the environment in a unique way. Generally people are all affected by
economic, social and cultural influences, however, each person has a unique
predisposition to react to these influences and to internalise them, which is a
result of the influence of their family, upbringing, education and peers (Williams,
2002: 79). Therefore, each person has a unique set of characteristics, which
influence him/ her to behave in a certain way, and identify his/ her particular
personality. That is why there is a variety of accommodation establishments for
different people from which to choose when travelling for leisure, business or
other purposes.
The concept of self is seen as a component of personality and it is considered
important to the understanding of hospitality consumption, because of its
subjective nature (Williams, 2002: 79). The self-concept states (Williams, 2002:
81) that individuals have a concept of who they are (the actual self) and who they
would like to be (the ideal self). Depending on the expectations that the
consumers hold about themselves, they exhibit specific behaviour, make
decisions accordingly and select destinations and hospitality services that match
their self-image. For example, a tourist might see himself best accommodated
during his holidays in South Africa in a traditional farm-style guest house, rather
than any other type of accommodation. Moutinho (1987: 10) also suggests that
there is another concept of self-image, which is the “other’s self-image”, which
entails how an individual thinks others see him or her. This may lead to a trial of
different destinations and hospitality services and in general may lead to a
different behaviour than if he/ she is satisfying the needs of his/her actual or ideal
self. The same tourist who, as mentioned earlier, would prefer to stay in a farm-
style guest house, might actually book into a luxurious five star establishment,
because his colleagues back home see him as a high status executive. In other

55
words, he would not do what he wants to, but would rather do what he perceives
his peers would expect him to do.
3.2.3 Perception
People have the tendency to view the world in their unique way. Different people
might interpret the same event in many different ways, because each perceives
the same event in a different way from the other. Perception is the process by
which an individual selects, organises and interprets stimuli in a meaningful and
coherent way (Moutinho, 1987: 11).
Customers make decisions and take actions based on what they perceive to be
reality. Therefore it is important for marketers to understand what customers
think is reality, as opposed to what the actual reality is (Schiffman & Kanuk,
2000: 122). This study provides guest house owners with information on the
perceptions of their customers. That will equip them with a more defined
knowledge of what influences customers to buy and will make the process of
providing products and services that satisfy consumers easier.
Perception is the result of two different kinds of inputs that interact to form the
personal pictures – the perceptions – that each individual experiences (Schiffman
& Kanuk, 2000: 131). The one type of input is physical stimuli from the outside
environment, like odours, shapes, people, sounds, television/ radio
advertisements and others. The other type of input is provided by the individuals
in the form of a certain predisposition based on previous experiences,
expectations, motives and learning. For example a customer might prefer to stay
in a specific guest house over and over again, because he/ she perceives that
the décor, the atmosphere and the approach by the staff are best suited for
his/her needs.

56
Customers are bombarded with stimuli from everywhere in their lives. In order to
cope with all the stimuli thrown at them, customers pay attention to some
information and ignore others. That is why it is acknowledged that perception is
selective – customers choose to notice a small number of stimuli; subjective –
customers only notice stimuli that they want to notice, based on their personality,
beliefs and needs; and perception could also be based on the individual’s frame
of reference and personal experiences (Cant et al., 2002: 100). For example,
when looking in a tourism guide to plan a holiday, a tourist would selectively read
about the area of interest, in which he/ she would consider accommodation
establishments within a specific price range. From previous experiences, the
customer has concluded that he/ she would like to stay in a guest house,
because these best suit his/ her needs and requirements. Therefore he/ she
would further select a few guest houses, from which he/ she would ultimately
choose one in which to stay.
When customers are thinking of purchasing products or services, they usually
consider a number of specific brands or service providers, which are known as
the evoked set. For example a traveller planning his stay in Johannesburg might
consider staying at Courtyard, Don Apartments, Mercure Hotel or at Villa
Domenico Bed and Breakfast/ Guest house. He/ she might not consider any
other options of accommodation, because he/ she might perceive that the
alternative options do not offer any particular advantage, or because he/ she is
indifferent to them, or because other options are unacceptable. He/ she might
also not consider other options, because he/ she does not know of any. Usually,
the consumer’s evoked set tends to be quite small. On average it includes only
three to five brands, with which he/ she is familiar, or remembers, or finds
acceptable (Schiffman & Kanuk, 2000: 448). Then the consumer would choose
one option from the few. Guest house owners should aim for their establishments
to be in the customers’ evoked set of accommodation providers. To achieve this
guest house owners have to be able to identify what their customers need, what
they expect from the service offering and how they perceive the actual service.
57
With this knowledge they will be able to provide a service that meets customers’
expectations and customers will remember and possibly revisit or recommend
the establishment. The evoked set is further elaborated on in Paragraph 3.4.3.
3.2.4 Learning process
All aspects of the individual – perception, needs, motives and attitudes – are
either directly or indirectly determined and influenced by the ability of the
customer to learn (Cant et al., 2002: 108). Learning is a change in a person’s
thought process caused by a prior experience, or also refers to the establishment
of new responses to the environment.
Consumers learn about a hospitality offering when they consume it. They also
gain experience through a variety of other sources such as listening to others. If
a guest house offers good quality service, the people that visit it will be satisfied
and they will tell others about it. Consumers build up a mental inventory of
offerings and good or bad experiences. This information is then stored and it is
recalled and taken into account when future holiday or travel decisions need to
be made (George, 2001: 133).
Communication plays an important role in the learning process of consumers.
For example, when information is provided about a tourist destination (could be
through an advertisement in a magazine, newspaper, television, radio or by word
of mouth), that information allows the potential customer to acquire knowledge
about the offering and to form an image about the destination. That might lead to
the arousal of needs and wants, and the creation of interest towards the offering
and might initiate an action to satisfy those needs. Consumers use information to
evaluate alternatives when making a choice; to reinforce past choices; to resolve
a conflict between buying and postponing; to remind when to buy and to acquire
general knowledge (Moutinho, 1987: 15).
58
3.2.5 Involvement theory
Satisfying the needs implies that customers have to make a choice from the
many alternative ways that are available to meet their needs. Williams (2002: 44)
points out that the decision is in fact the end state of a complex dynamic process,
and that the decision is the final definitive solution in a problem solving process.
Depending on the complexity of the decision-making, the consumer’s
involvement with the purchase and the frequency of purchase, three types of
decision-making processes are identified (Williams, 2002: 45):
• Extensive problem solving – requires significant effort and involvement from
the consumer, takes time and is complex. Consumers undertake extensive
information searches. They need to understand the features and attributes of
a particular hospitality offering, carefully compare the different alternatives
and develop criteria for selection in order to select the offering that best
satisfies their needs. Generally, the more involved the customer is in the
specifics of the purchase, the more loyal he/ she becomes (Oliva, Richard &
MacMillan, 1992: 85), provided that the customer has experienced
satisfaction with the overall service purchased. Extensive problem solving is
usually applied to a completely new or important need (Perreault & McCarthy,
1999: 171). For example, choosing an annual holiday may involve extensive
problem solving, because the customer does not know the destination.
Choosing a guest house to stay at during the holiday would also contribute to
the complexity of the problem-solving, because the tourist has never been at
the destination and does not know what accommodation is available there.
• Limited problem solving – is a process, where the consumer has some
information about the offerings, but is unfamiliar with specific brands, styles,
options or choices. Limited problem solving is typical when the consumer has
some previous experience solving the problem, but is not certain which
choice is best at the current time. His or her involvement is considerably less

59
here than in extensive problem solving. For example, a foreign tourist is
planning to come to Johannesburg, where he has been once before. The
previous time he stayed at a guest house in Rosebank, but this time he is not
sure that he would like to stay at the same guest house. Therefore, he will
have to acquire some information on other accommodation establishments in
order to select a suitable one.
• Routine behaviour is the least complex form of decision-making. It is used by
customers when they regularly select a particular way of satisfying a need
when it occurs. It involves limited information searches and decisions are
reached quickly. For example, a customer who regularly stays at a specific
guest house would use routine decision-making every time he/ she chooses
the services of that particular guest house.
3.2.6 Attitudes
In the context of tourism, attitudes are predispositions of feelings towards a
vacation destination or service, based on multiple perceived product attributes
(Moutinho, 1987: 19). In forming attitudes, the consumer’s cognitive system
seems to be answering questions such as: What does this concept/ destination/
service have to do with me? Is it a good or a bad thing for me? Do I like it or
dislike it? In summary, an attitude is a person’s overall evaluation of a concept
(Peter & Olson, 1987: 191) or, in the context of tourism; it is the overall
evaluation of a destination or a service.
Attitudes are learned because they are formed as a result of the following: a
direct experience with the product or service, information acquired from others
and exposure to mass media. Attitudes also tend to be consistent with the
behaviour that they reflect even though they are not always permanent and can
change (Cant et al., 2002: 136). Additionally, attitudes vary from situation to
situation. For example a business traveller, who comes regularly to

60
Johannesburg on business, always stays in a specific guest house. He has
developed a positive attitude towards the services offered at that guest house
and he is satisfied with his choice of accommodation. The same traveller, when
he brings his wife and children to Johannesburg for a weekend of leisure,
chooses the services of self-catering apartments, which best satisfy the needs of
his family members.
Learning about customers’ attitudes gives a good indication to hospitality service
providers of what customers like and dislike about the service offerings. By
knowing their customers’ attitudes, marketers can anticipate their values, life
styles and outlooks more skilfully and can reflect these characteristics in the
products and services.
3.2.7 Customer expectations
Customer expectations are beliefs about service delivery that function as
standards or reference points against which performance is judged, as defined
by Zeithaml and Bitner (2003: 60). The first and possibly the most critical step in
delivering service quality is knowing what customers expect. Not knowing what
they want, leads to losing business or giving it to the competitors or not surviving
in the fiercely competitive market. In order to avoid that happening, this study
provides information to help guest house owners to interpret customers’
expectations.
It has been suggested, that expectations exist somewhere on a range of a
continuum, between ideal and intolerable and Zeithaml, Berry and Parasuraman
(1993) defines the points on the continuum as follows:
• ideal – the best possible, ideal expectations or desires;
• ideal feasible – what should happen given, for example, the price or the
industry standards;

61
• desirable – the standard that the consumer wants to receive;
• deserved – the level of performance that the consumer ought to receive given
the perceived cost;
• minimum tolerable – the minimum tolerable standards, those that must be
achieved; and
• intolerable – the standards the customers should not receive.
Services are heterogeneous and non-standardised and this indicates that the
performances of different service providers vary. The extent to which customers
recognise and are willing to accept these variations, is called by Zeithaml and
Bitner (2003: 63) the zone of tolerance – which is the range between the
adequate service (the minimum level of service considered acceptable) and the
desired service. The zone of tolerance is the range in which customers do not
particularly notice service performance. When the performance falls outside that
range, meaning that it is either very low or very high, the customers notice the
service performance in either a positive or negative way.
Customers are satisfied when their perception of the service and the experience
as a whole, matches their expectations. If their perception of the service exceeds
their expectations, then they will be more than satisfied, they will be delighted,
and if their perceptions do not meet their expectations, they will be dissatisfied
(Johnson & Clark, 2001: 78). Pizam and Ellis (1999: 329) note that both what is
perceived (outcome) and what is expected are subjective and therefore are
psychological phenomena – not reality. That means that both perception and
expectations are susceptible to external influences and manipulation.
Expectations of customers are influenced by many things (Johnston & Clark,
2001: 86) and some of these key influences are: price, alternative services
available, marketing, word of mouth, previous experience, customer’s mood and
attitude. As customers experience services continuously, their expectations
continuously change. That is why it is important for guest house owners to study

62
what customers want and expect at all times and to provide them with the service
quality desired.
Understanding the customers’ expectations, according to Johnson and Clark
(2001: 78), leads to:
• specifying, designing and then delivering the appropriate service at the
appropriate cost;
• encouraging the marketers to try to influence customers prior expectations, so
that they can be delivered; and
• understanding how to manage, indeed manipulate, customer perceptions
during the service, to achieve the desired level of satisfaction.
Ideally organisations should aim to exceed the customers’ expectations, so that
they can delight their customers on a continuous basis. That implies that services
should be continuously assessed, developed and improved. The benefits of such
a process are that those organisations will be ahead of the competition and they
will maintain loyal customers.
3.2.8 Customer satisfaction and loyalty
According to Bowen and Chen (2001: 213), it is commonly known that there is a
positive relationship between customer loyalty and profitability. The increased
profit from loyalty comes from reduced marketing costs, increased sales and
reduced operating costs. Loyal customers help to promote one’s establishment,
by providing strong word of mouth advertising and by creating business referrals
and providing references. Therefore they save marketing expenses to the
establishment and increase sales. Loyal customers also increase sales, as it has
been established by Bowen and Shoemaker (1998), by purchasing a wider
variety of hotel’s products and making more frequent purchases than first time
customers or customers who have not experienced satisfaction with the service

63
offering. Loyal customers also cost less to serve, as they have a better
knowledge of the products and require less information.
The results of the study that Bowen and Chen (2001: 214) undertook in the
Lenox Hotel in Boston, with an aim of establishing the relationship between
customer loyalty and customer satisfaction, indicated a non-linear and
asymmetric relationship between the two components. They were also consistent
with Oliva et al.’s (1992: 88) study and they verified that a minor change in
satisfaction could lead to a substantial change in loyalty increment. These
indicate that in order for hospitality service providers to benefit from their
customers repeat patronage and marketing power, they should aim and work
toward having not only satisfied customers, but extremely satisfied customers.
This emphasises the great significance for guest house owners to know what
factors contribute to customer satisfaction
3.3 Social and cultural dimensions of consumer behaviour
In paragraph 3.2 the individual influences of consumer behaviour were
discussed. However, people live in societies, communities and groups and the
pattern of social networks through which they develop, influence their tastes,
habits and values (Seaton & Bennett, 1996: 59). For this reason it is important to
look at group influences or the social and cultural dimensions of consumer
behaviour. These are inter alia the influences exerted by reference groups, family
members, the social class and the culture one belongs to.
3.3.1 Reference groups
A reference group is any person, real or imaginary, that serves as a point of
reference for an individual and exerts a key influence on the individual’s beliefs,
attitudes and choices (Moutinho, 1987: 8; Schiffman & Kanuk, 2000: 264).
Reference groups influence an individual’s behaviour by providing information
about destinations and hospitality services, by:

64
• giving an opportunity to compare one’s beliefs, attitudes and behaviour
against those of the group, and
• persuading the individual to conform to the norms of the group.
The tendency of people is that even when they take a decision without
communicating with others, they tend to turn to group members or other
individuals for more information on the attributes of the service offering.
Reference groups influence consumers through word of mouth communication,
which is the single most powerful influence on consumer behaviour (Assael,
1993: 279). For guest houses, word of mouth marketing plays an important role
in the marketing of the establishments, as it is not only a powerful method of
marketing, but it is also the least expensive one. Guest house owners have to
ensure that their customers are satisfied with the service they receive, because
those customers are the reference groups which will market the guest house to
other potential customers.
3.3.2 Family influence
Relationships with other family members influence many aspects of consumer
behaviour. Family members usually share values and attitudes, consider each
other’s opinions and make joint decisions (Perreault & McCarthy, 1999: 165). For
that reason the family is considered a customer unit. In the customer unit, the
person that purchases a product or a service is not always the decision maker or
the end user. Therefore, different members of the customer unit carry out
different tasks in the buying process. For example, when a family decides on a
guest house accommodation for their holiday, they firstly ensure that the guest
house of their choice can accommodate all members of the family. If the children
are small, it is likely that the parents would prefer adjoining rooms, so that they
can be as close as possible to the children. They would also make sure that in
the proximity of the guest house, there is an entertainment area for children.
65
Family life style commitments, including the allocation of time influences
consumption patterns. Income, marital status, age, number and age of children
and overall, the stage of the family cycle in which the consumer unit is, determine
how people spend money. A family passes through the following stages in their
life cycle (Cant et al., 2002: 195):
Stage 1: Bachelorhood – young single adult living apart from parents;
Stage 2: Honeymooners – a young married couple;
Stage 3: Parenthood – a married couple with at least one child living at home;
Stage 4: Post-parenthood – an older married couple with no children living at
Home;
Stage 5: Dissolution – one surviving spouse.
Young single adults and young married couples in general have more disposable
income than couples with children, as they have fewer members in the family and
fewer responsibilities. They are more likely to experiment with new products, look
for entertainment and travel more often. Once there are children in the family, the
discretionary income decreases as necessities like food, education, medical-aid,
security and others increase. When children leave the home and start supporting
themselves, the parents are left with more free time, less expenditure and the
opportunity to become regular travellers during their leisure time. In the later
stages of the cycle – older married couples or widows and widowers –
discretionary income decreases, as these individuals begin to live off fixed
income pensions and annuities. Their expenditure increases for medications and
medical services, hobby-related items, and leisure products (Assael, 1993: 282).
It is necessary to take into consideration that dynamic socio demographic
changes in society have resulted in many non-traditional stages that a family
might pass through, like childless couples, couples marrying later in life, single
parents, unmarried couples or single-person households and so forth.

66
3.3.3 Social class
Social class plays an important influence on consumer behaviour. Social classes
define broad consumer groupings according to their degree of prestige and
power within a society (Assael, 1993: 275). The society is divided into classes
(upper, middle and lower) and individuals in a given social class share similar
values, lifestyles and behaviour standards. These shared elements act
sometimes to provide or reinforce the motivation and sometimes as constraints
upon purchase decisions (Middleton & Clarke, 2001: 77). Therefore one can
speculate that individuals from the upper social class would prefer going to
upmarket hospitality establishments, which would best satisfy the needs
generated by their lifestyle. The middle and lower social class would be more
price conscious and would prefer going to places which are affordable for them.
3.3.4 Culture
In the context of consumer behaviour, Moutinho (1987: 7) describes culture as
the total of learned beliefs, values and customs, including the material elements,
which serve to regulate the consumption patterns of members of a particular
society. Those elements are transmitted from generation to generation and serve
to shape common or similar patterns of behaviour.
Culture plays an important role in services marketing, because cultural belonging
and heritage not only affect the way customers experience and interpret services/
goods supplied to them in tourism, but they are also likely to influence decisions
regarding choices of vacations and destinations (Weiermair, 2000: 399).
Manners and customs represent a cultural understanding of appropriate ways of
behaving. It is important to monitor differences in manners and customs,
because they can have a direct influence on the service encounter (Zeithaml &
Bitner, 2003: 51). For example, friendliness in some countries is regarded as
disrespect and formality is preferred in services. In other countries friendliness is
67
expected. Understanding cultures is pivotal to being evaluated as an effective
service provider. Providing the same service experience offered in the home
country may not be successful when a service is extended to other cultural
groups (Winsted, 1997). Marketers must try and understand the customs and
behaviours of consumers from different countries. Tourism offerings have to be
adapted to suit their needs, especially in the current competitive global
environment. This is particularly important for service levels, as many
international tourists have higher expectations than the local tourists.
In the literature reviewed in this chapter, it can be seen that there are individual
and group influences, which play a role in the consumer behaviour. In the
paragraph below, the two sets of influences are integrated into a theory that
explains how customers make tourism related decisions.
3.4 Decision-making
For companies to be effective in the highly competitive marketing environment
that includes the contemporary hospitality industry, it is imperative that they
understand contemporary consumers and consumer decision-making (Williams,
2002: 39). In order to achieve this, marketers have to understand how
consumers choose and evaluate the service offerings. Consumers have a more
difficult time evaluating and choosing services than goods, partly because
services are intangible and non-standardised and partly because consumption is
very closely intertwined with production (Zeithaml & Bitner, 2003:36). Zeithaml
and Bitner (2003: 38) recognise that customers do not always make their
decisions in a standard way, but the authors choose the traditional process of
decision-making to discuss the consumer behaviour in services. The same
process is applicable to guest houses, as they are accommodation
establishments that offer services to their customers. The process includes five
steps:
68
3.4.1 Need recognition
This is the state when the consumer recognises that he or she has a need/ a
want that needs to be fulfilled.
3.4.2 Information search
This is the process of acquiring information in order to weigh up the available
alternatives and select the most favourable way to satisfy their needs.
Information about services and products can be obtained from personal sources
(friends and experts) and from non-personal sources (mass or selective media).
When selecting services, which are more complex than products, customers rely
to a greater extent on personal sources, because they can communicate more
information about experience qualities. When someone has done business with a
service or product provider, that person will then recommend the professional to
other customers with confidence. Misner (1994: 43) states that people want
referrals, because referrals reduce the risk of the quality of service they will
receive. There is some degree of perceived risk with all purchase transactions,
but there appears to be more risk involved in the purchase of services than in the
purchase of goods, because services are intangible, non-standardised, and
usually are sold without guarantees or warranties.
In the case of non-personal sources of information about services, the sources
can communicate little about experience qualities. They (the sources) might not
be available at all, or they may disclose only a few attributes of the service
offering, which will cause customers to feel a greater risk in selecting a little-
known alternative (Zeithaml & Bitner, 2003: 40).
69
3.4.3 Evaluation of service alternatives
The group of services and products, which the consumer considers acceptable
options to satisfy his/ her need, is known as the evoked set of alternatives (refer
to paragraph 3.2.3). The evoked set of alternatives is likely to be smaller with
services than with goods. Goods that consumers can purchase in a shop, can be
selected from an extensive display of alternative brands and can be physically
seen and evaluated. Services, being intangible and non- standardised, cannot be
displayed on a shelf as products for the customer to evaluate. Consumers rely on
collecting and evaluating experience qualities from referrals. That makes it
difficult to obtain enough pre-purchase information about many alternatives and
they often select the first acceptable solution.
3.4.4 Service purchase and consumption
Any service characterised by human interaction is strongly dependant on the
moods and emotions of the service provider, the customer and other customers
receiving the service at the same time (Zeithaml & Bitner, 2003: 44). Moods and
emotions according to Zeithaml and Bitner (2003) enhance and amplify
experiences, making them either more positive or more negative than they might
seem in the absence of moods and emotions. They also affect the way
information about services is absorbed and retrieved. Positive moods and
emotions lead to positive evaluation of the service establishment. Additionally the
physical setting (the scenery, the smell, movement, freshness, the use of space,
the style, the décor and comfort, furnishings, cleanliness) and the service
performance have to be in line with the expectations of customers, so that
customers can evaluate the services positively.
Servicescape or the physical facilities of the service provider have a relatively
consistent and strong effect on the length of time consumers desire to stay in the

70
leisure service setting and on their repatronage intentions (Wakefield & Blodgett,
1996: 49). Bitner (1992) identified three primary dimensions that influence
customers’ perceptions of servicescape (i.e. perceived quality) and their
subsequent internal (i.e. satisfaction with services) and external responses (i.e.
approach/ avoidance, staying, repatronage). The dimensions are ambient
conditions (weather, temperature, air quality, noise, music, odours); spatial layout
and functionality (the way in which equipment and furnishings are arranged and
the ability of those items to facilitate consumers’ enjoyment); and signs, symbols
and artefacts (signage and décor used to communicate and enhance a certain
image or mood, or to direct customers to desired destinations).
An effective layout provides easy entry and exit and greater accessibility to
ancillary services, like rest rooms, souvenir stands and others. By making
ancillary services more accessible, customers are able to spend more time
enjoying the primary service offering. The facility aesthetics are a function of
architectural design, interior design and décor (Wakefield & Blodgett, 1996: 48).
Customers observe and evaluate the exterior and the interior of the facilities and
these evaluations influence their attitude towards the place. The seating and
sleeping comfort also play a role in the perceived quality of the servicescape.
Electronic equipment and displays of signs, symbols and artefacts are used to
enhance the leisure experience. Cleanliness is an important part of the
servicescape and customers implicitly associate it with the quality of the
servicescape.
Bitner (1992) suggests that positive responses (satisfaction) to overall
perceptions of servicescapes (perceived quality) will result in approach
behaviour, like attraction, stay/ explore, spend money and return. It is important
how long consumers will desire to stay in the establishment once they enter and
whether they will want to return in the future. If customers are not satisfied with
the physical surroundings of the leisure setting they may not return (Wakefield &

71
Blodgett, 1996: 48), that is why management has to create and maintain a
satisfying environment.
3.4.5 Post purchase evaluation
The quality of many services depends on the information the customer brings to
the service encounter (Zeithaml & Bitner, 2003: 48). In the case of the hospitality
industry the customers have to communicate their needs clearly. For example,
the customer has to communicate that accommodation for a certain number of
people is required, the desired dates, if there are any special requests and so
forth. Consumers participate in the production process, therefore dissatisfaction
with certain services cannot be blamed completely on the producer. On many
occasions the consumers attribute some of their dissatisfaction to their own
inability to specify or perform their part of the service (Zeithaml & Bitner, 2003:
48).
Unfortunately no service is perfect all the time and things can go wrong. Service
failures can be due to unprompted employee actions (e.g. rudeness), failure to
respond to specific customer needs or preferences, or core service failure, e.g.
unavailable or unreasonably slow service (Bitner et al., 1990). The failures can
vary in severity, but at the end the result is dissatisfied customers.
The overall evaluation of the customer will greatly depend on whether there were
any service failures. If there were service failures, what would be important is
whether the situation was recovered. If there were no service failures, what
would contribute to the overall evaluation is whether the service encounter was
everything that the customer expected it to be. Many companies have recognised
that their customers are valuable assets and take steps to ensure that when
service failures do occur, there are processes in place to respond. A good
service recovery enhances customers’ perceptions of the firm’s competence, the
services already purchased, and the value of the organisation’s other offerings

72
(Swanson & Kelley, 2001: 194). Guest houses are in an advantageous position in
relation to service failures, because the owner could due to the close contact with
customers, identify a failure and take a corrective measure immediately. In a
hotel, for example, consumers usually would report a service failure to the
reception staff. The reception staff has to report it to management and only then
management takes action to recover the failure. In other words it takes some
time before action is taken to correct the failure and this could further contribute
to customer dissatisfaction.
A positive post purchase evaluation would ensure satisfied customers. Satisfied
customers are likely to become long-term customers by repeating patronage.
They are also likely to praise and recommend the services of the company,
through word of mouth communication, to a wide range of potential future
customers.
3.5 Summary Organisations must deliver long-term customer value, if they are to survive and
succeed in today’s competitive environment. This can be achieved if they retain
customers by satisfying their needs. To learn what customers want, marketers
must focus their attention on consumer behaviour. There are two main influences
on consumer behaviour – the individual and the group influences. The individual
influences give an indication of the consumer’s general state of mind towards a
product or a service and provide some personal characteristics. They include the
customer’s needs, motivation, perceptions, attitudes, personality, expectations
and loyalty. The group influences on consumer behaviour are the social and
cultural environments. They include a face-to-face influence by reference groups
and family, and a broader influence by culture and the social class of the society
in which the customer lives. The two influences (individual and group) integrate
into the theory of consumer decision-making and explain how customers make
decisions regarding what, where and when to purchase tourism products and
services such as accommodation in a guest house.

73
4 LITERATURE REVIEW – SERVICE QUALITY
4.1 Introduction to service quality
In the service industry the production and consumption of services are in most
cases inseparable and the quality in services occurs during service delivery.
Therefore quality excellence requires that the behaviour be modified at every
level of the organisation. Quality is a new way of looking at one’s self, one’s work
and one’s fellow workers (Hall, 1990: 12). Quality is not a straightforward concept
in the service industry; therefore various issues are discussed in this chapter with
the aim to acquire a better understanding of the importance of quality.
The section on customer satisfaction and service quality compares the two
constructs and describes the similarity and the inseparability of both. The section
on service quality dimensions goes deeper in the service quality topic and gives
an indication of what factors contribute to the evaluation of service quality. The
section on measuring service quality indicates how quality can be measured by
taking into consideration customers’ expectations and customers’ perceptions of
the service. The section on service quality gaps introduces the concept of
discrepancies in what customers expect and what they perceive of the service
they have received. It also explains the various gaps that could be encountered
in the quality of services.
4.2 Customer satisfaction and service quality
In today’s world of intense competition, the key to sustainable competitive
advantage lies in delivering high quality service that will in turn result in satisfied
customers (Sureshchandar, Rajendran & Anantharaman, 2002: 363).
Satisfaction creates positive attitudes towards the brand or, in the services
industry, towards the services provided by a specific service provider. Satisfied
customers are more likely to repeat purchases and also to recommend the
products and services to others. That means that customer satisfaction is one of

74
the most important criteria for determining the quality that is actually delivered to
customers and it is also essential for corporate survival (Pizam & Ellis, 1999:
326).
Customer satisfaction and service quality are inarguably the two core concepts
that are at the crux of marketing theory and practice (Spreng & Mackoy, 1996).
Customer satisfaction is considered a prerequisite for customer retention and
loyalty, and it obviously helps in realising economic goals like profitability, market
share and return on investment (Sureshchandar et al., 2002: 364). Bitner and
Hubbert (1994) define service quality as the consumers’ overall impression of the
relative inferiority/ superiority of the organisation and its services. Other authors
like Parasuraman et al. (1988) and Zeithaml (1988), describe service quality as a
form of attitude – a long run overall evaluation, and the two constructs (service
quality and attitude) are viewed as similar. Perceptions of service quality could
occur at many levels in an organisation – e.g. with the core service, physical
environment, or interaction with the service providers (Bitner & Hubbert, 1994;
Zeithaml & Bitner, 2003). Customer perceived service quality portrays a general,
overall appraisal of service, i.e. a global value judgement on the superiority of the
overall service, (Sureshchandar et al., 2002: 363). Similar to service quality,
customer satisfaction can occur at multiple levels of the organisation, and the
overall satisfaction with the services of an organisation is based on all the
encounters and experiences with that organisation (Sureshchandar et al., 2002:
364).
The two constructs are not only similar, but they are also closely related. If for
example, a customer perceives that he/ she has received a higher service quality
than usual, he/ she will be more satisfied than usual and vice versa
(Sureshchandar et al., 2002: 363). Therefore, there is no doubt that the
attainment of service quality and customer satisfaction are the ultimate goals of
service providers.
75
4.3 Service quality dimensions
Zeithaml et al. (1990: 20) suggested key factors that influence customer
expectation, and they are: word-of-mouth communications, personal needs, past
experiences, and communications by the service provider to the user. They also
identified general dimensions that represent the evaluation criteria customers use
to assess service quality. The service quality dimensions were first mentioned in
the SERVQUAL model of Parasuraman, Zeithaml and Berry (1988) and are as
follows:
• reliability – that is the ability to perform the promised service dependably and
accurately;
• responsiveness – the willingness to help customers and provide prompt
service;
• assurance – refers to employees’ knowledge and courtesy and their ability to
inspire trust and confidence;
• empathy – encapsulates caring, individualised attention given to customers;
and
• tangibles – includes appearance of physical facilities, equipment, personnel,
and written materials.
Zeithaml and Bitner (2003: 93) point out that the above dimensions are relevant
and applicable for a wide range of service industries. They also explain that
sometimes the customers will use all of the dimensions to determine service
quality perceptions and at other times, depending on the actual service, not all
five will be used.
The SERVQUAL model forms the foundation on which other literature of service
quality is based. It has a 22-item scale, which measures service quality, and the
items are considered to be reasonably good predictors of service quality in its
wholeness (Sureshchandar et al., 2002: 364). The model has, however,
76
undergone a lot of criticism (Buttle, 1996). A careful scrutiny of the 22 items
reveals that the items at large deal with the element of human interaction/
intervention in the service delivery and the rest on the tangible factors of service
such as the effect of atmospherics, design and décor elements, appearance of
equipment, and employees’ appearance, said Sureshchandar et al., 2002: 364.
However, the authors state that the SERVQUAL instrument has overlooked
important factors of service quality. In order to conceptualise service quality they
identified five factors of service quality as being critical from the customers’ point
of view. The authors have taken into account aspects of customer perceived
service quality, which have been already addressed in existing instruments and
have also included aspects that have not been mentioned previously. The five
factors are:
• Core service or service product – that is the “content” of a service, which
portrays the “what” of a service. In other words, the service product is
whatever features are offered in a service.
• Human element of service delivery – it refers to all aspects that will fall under
the domain of the human element in the service delivery. Those elements
may be reliability, responsiveness, assurance, empathy, moments of truth,
critical incident and recovery.
• Systematisation of service delivery (non-human element) – it includes the
processes, procedures, systems and technology that would make a service a
seamless one. Customers would always like and expect the service delivery
process to be standardised, streamlined and simplified so that they can
receive the service without problems or undesired/ inordinate questioning by
the service providers.

77
• Tangibles of service (servicescapes) – it covers the tangible facets of the
service facility (equipment, machinery, signage, employee appearance) or the
man-made physical environment, popularly known as “servicescapes”. The
servicescape has already been discussed in paragraph 3.4.4. The factor of
tangibles of service is not a new one. Sureshchandar et al. (2002) have
adopted it from the SERVQUAL model (see beginning of paragraph 4.3).
• Social responsibility - social responsibility helps the organisation to lead as a
corporate citizen in encouraging ethical behaviour in everything it does.
These subtle, but nevertheless forceful, elements send strong signals towards
improving the organisation’s image and goodwill and consequently influence
the customers’ overall evaluation of service quality and their loyalty to the
organisation.
4.4 Measuring service quality
As mentioned earlier (paragraph 4.1), quality must be the concern of all
employees in the organisation. That means that management must have quality
standards in place, which are communicated to all the staff. Then quality could
be assessed by doing visual inspections against the set standards and
consistency, by management walking about, by quality control feedback and by
inspection of competitors’ offers and assessment of own company’s offer
(Cooper et al, 1998: 361). In order to do that, establishments must define their
concept of quality. Quality should not be based on an internal organisational
understanding of quality (Cooper et al., 1998: 359). It should rather be based on
how satisfied the customers are with the quality of the service they receive.
Sureshchandar et al. (2002) point out that customer satisfaction cannot be
assessed by simply asking for the customer’s overall feelings towards the service
provider. Customer satisfaction reflects customers’ feelings about the many
encounters and experiences with the service provider. Every interaction between
the firm and the customer is a service encounter. Every service encounter

78
provides an opportunity to distinguish the firm from its competitors – either by
providing a superior service or by providing a poorer service than the competitors
(Oliva et al., 1992: 91).
Customers’ expressions of what they want are revealed by their expectations and
their perceptions of what they think they are getting from the service provider (Pitt
& Watson, 1995:176). Parasuraman and his colleagues (Parasuraman et al.,
1985, 1988, 1991; Zeithaml et al., 1990) suggest that service quality can be
assessed by measuring customers’ expectations and perceptions of performance
levels for a range of service attributes. Then the difference between expectations
and perceptions of actual performance can be calculated and averaged across
attributes. As a result, the gap between expectations and perceptions can be
measured and management can conclude what changes in the quality of
services need to be implemented.
4.5 Service quality gaps
The competitive nature of tourism has contributed to tourists looking for higher
standards of comfort, reliability and quality. Developing a definition or concept of
quality is difficult because of the intangible nature of services as products, which
are purchased and consumed (Page, 1995: 234). When a destination is
marketed with a certain image, the customers who are at the stage of planning
their trip create an expectation about the place on the basis of the information
they have obtained. Their evaluation of the quality of the services and products
provided is a function of the difference (gap) between the expected and
perceived service (Parasuraman et al., 1985). In order to eliminate the gap
between the expected and perceived services, management should focus their
attention on the already identified service quality gaps (SQGs) and on
understanding customers’ expectations and perceptions. Many authors have
written about concepts of service quality gaps. In 1988, Parasuraman, Zeithaml
and Berry, published the SERVQUAL model, which was to measure the
79
perceived quality of a service situation (Carman, 1990: 33). It included five
service quality gaps (Cooper et al., 1998: 365). They are the gaps between:
• consumer expectations and management perceptions;
• management perceptions and service quality specifications;
• service quality specifications and service delivery;
• service delivery and external communications; and
• perceived service and delivered service.
The model has made a valuable contribution to the area of perceived service
quality measurement; however, it has been critically argued that the model may
not be the most valid approach to defining the quality of service concept (Fick &
Ritchie, 1991). For the purpose of this research, the model of Candido and Morris
(2000) on service quality gaps will be discussed, owing to the fact that it covers
gaps that have not been considered previously. The following gaps provide
information on matters, which have an impact on customer satisfaction:
• Gap 1: Management perceptions – the gap defines the managements’ lack of
understanding of customers’ expectations and perceptions of the service. The
lack of understanding is motivated by lack of initiative to listen to customers,
by a lack of correct understanding when these initiatives are taken, and lack
of understanding external information.
• Gap 2: Service quality strategy – this includes a failure to forge and
communicate a coherent service quality strategy, which states the
organisation’s competitive scope and its concept of quality and provides
orientation in the company.
• Gap 3: Service design and service quality specifications in terms of
customers’ expectations – it is a gap that defines a lack of analysis, design
and definition of service quality specifications. Alternatively, it defines that
80
when specifications exist, there is an inconsistency between those
specifications and the strategy content or, there is an inconsistency between
the specifications and the perceptions management holds of customers’
expectations.
• Gap 4: Quality supportive financial function – it includes the fact that financial
management has been seen mainly as a constraint and an obstacle to other
functions. It is not considered that it contributes to strategic planning, costing
systems, personnel motivation, quality control, continued solvency, and
keeping outsiders’ confidence in management.
• Gap 5: Internal communications – it involves communicating the service
strategy repeatedly to everyone in the organisation. It involves managers
listening to the employees and their perceptions of the organisation’s
performance, managers exchanging knowledge and experience with other
managers, doing appraisals and maintaining a horizontal and vertical
communication at all times. Failure in the internal communications could lead
to poor quality of services.
• Gap 6: Integration/ co-ordination – states that the entity must function as a
whole in order to achieve quality in the service it offers. An organisation is
divided into different sectors, which perform functions and jobs that are
different from one another. A gap arises when the different sectors cannot
integrate themselves due to the differentiation in the tasks performed and that
ultimately leads to delivery of poor quality to customers.
• Gap 7: Co-ordination of other people and/ or organisations in the value
system – it involves a lack of external co-ordination with groups or sectors
normally regarded as separate, but which are part of the system. This could
result in poor customers’ perceptions.

81
• Gap 8: Selection, training and adequate levels of autonomy, power and
rewards to personnel – these are important management functions. Poorly
performed Human Resources Management leads to demotivated employees,
poorly performed services and unsatisfied customers. Inability or
unwillingness to manage personnel coherently constitutes a significant SQG.
• Gap 9: Service delivery – the gap implies an inconsistency between service
design/ service quality specifications and the service quality actually delivered
by the service delivery system. The inconsistency may be related to technical
quality and/ or process quality.
• Gap 10: External communication - It is an inconsistency between what is
promised or communicated to the customers and what is actually delivered.
• Gap 11: Contact personnel’s perceptions of customers’ expectations – it is a
discrepancy between the contact personnel perceptions of customers’
expectations and customers’ real expectations.
• Gap 12: Contact personnel’s perceptions of customers’ experiences – it is a
discrepancy between the contact personnel’s perceptions of customers’
experiences and customers’ real experiences.
• Gap 13: Consumer perception – the gap arises when there is a difference
between what customers expect from the service and what they actually
perceive of it once received. It is very important for managers to do constant
assessment of customers’ expectations and their perceptions of the quality
provided. The gap of consumer perceptions in guest houses will be measured
later in this report, in order to find out what factors contribute to customer
satisfaction.
82
• Gap 14: Service quality evaluation – it is a process of evaluation based on
quality standards set by the company. Organisations set quality standards
according to essential strategy elements. Setting standards, however, is not
enough to ensure quality. In order to ensure that quality service is being
offered, measures for monitoring and observation have to be implemented,
which correspond to the quality strategy of the company.
SQGs occur during day-to-day activities and some may occur during strategy
formulation and the implementation process (Candido & Morris, 2000). It is
crucial for managers to identify those gaps in the operations of their
establishments and work toward eliminating them. This will ensure that quality is
offered in the services provided and that customers are satisfied. Customer
satisfaction in return would enhance the company’s reputation through word of
mouth, would improve customer loyalty and would increase repeat business.
4.6 Summary
Superior quality and high levels of customer satisfaction are seen as two major
goals by service providers in order to enhance their business performance. The
two constructs are independent, but are closely related, and an increase in
service quality is likely to lead to an increase in customer satisfaction and vice
versa. It has been suggested that customers base their evaluation of service
quality on various service quality dimensions. At the same time service providers
strive to provide consistent service quality through a process of defining it and
measuring it. The difficulty of ensuring quality stems from the fact that quality is
based on what the individual customer expects it to be, and not on what the
organisation might believe that it is. For that reason service quality gaps have
been identified, which might lead to unsuccessful service delivery. Service quality
gaps happen when the customer’s perception of service differs from the
expectations. Elimination of the gaps will contribute to the satisfaction of
customers.

83
5. RESEARCH METHODOLOGY
5.1 Introduction
This chapter deals with the steps of the research process that were taken in
order to obtain the data on the matter researched. It includes a statement of the
problem and the objectives of the research. It then explains how the data was
obtained; the formulation of the sample; distribution of the questionnaires and
analysis; problems experienced during the study; and the reliability and
contribution of the study.
5.2 Statement of the problem
The guest house sector in South Africa only came into existence during the past
decade and ever since 1995 has been developing and growing. However, there
is limited information published on customer satisfaction in guest houses. There
are no clear criteria of what factors contribute to customer satisfaction and this
generated the need to establish:
• what are the customers looking for when selecting a guest house;
• what are customers’ specific needs; and
• what is the level of quality in guest houses
in order to help managers/ owners of guest houses to provide the quality of
service that their customers expect.
5.3 Research objectives
The study aims to establish what factors contribute to customer satisfaction in
guest houses and to achieve this, research objectives were set. The objectives
are to:
84
• describe the notion and significance of customer satisfaction;
• establish what attracts customers to guest houses;
• establish what are the guest house customers’ needs;
• analyse the quality of service in the guest houses;
• determine the rate of return of customers;
• analyse occupancy figures of the individual guest houses; and
• develop a framework of criteria that are associated with customers’
choices of guest house accommodation to ensure their satisfaction.
Statement of the problem and the research objectives provide guidelines to the
researcher in terms of what information needs to be collected (Malhotra, 2004:
49).
5.4 Collection of data
The notion and significance of customer satisfaction is described in chapters two,
three and four. The information is obtained from national and international
literature, which is otherwise known as secondary data. Secondary data is data
that already exists and can be accessed (Sudman & Blair, 1998: 74). However
the data has to be evaluated as it is generally collected for various purposes and
not necessarily for the specific issues that are being researched. The secondary
data selected for this document was chosen because it was considered as
relevant to the topic, impartial, valid and reliable as it was obtained from
accredited journals and publications.
If the secondary sources of data do not provide sufficient information, primary
data is collected. In this survey, primary data was collected from guest house
managers/ owners and their customers by means of survey research. Survey
research is the most common method for collecting primary data to define and
explain a research question. It involves systematic gathering of information from
respondents for the purpose of understanding and/ or predicting some aspects of

85
behaviour of the population of interest (Huysamen, 2000: 61). In this survey
research, questionnaires were used in order to obtain information on the return
rate of customers, their needs, how they evaluate the quality of service, how
guest houses advertise and other aspects of the guest house sector. The
questionnaires were self-administered, which allowed the respondents to
complete the answers at a time convenient for them.
Two questionnaires were used – the one was used to obtain information from
management, and the other from customers. Both questionnaires followed a
qualitative and quantitative approach. The quantitative questions were used to
obtain more general information about the guest house management and their
customers. The qualitative questions were used to present greater clarity on
customer satisfaction. The types of questions used in the questionnaires were
structured questions with structured answers for the purpose of obtaining and
rating specific information; and open-ended questions for the purpose of
understanding how customers evaluated the offering of the guest houses. The
majority of the questions were adapted from questionnaires used by
H.C.Kleynhans for completion of a Master in Consumer Science at the University
of Pretoria in 2003. The layout of the questions was modified through a software
programme Pin Point so that the results could later be analysed with the help of
the same software programme. The use of the programme ensured faster
processing and easier and more accurate analysis of the data. Copies of the
questionnaires are in annexure one (management) and annexure two
(customers).
5.5 The sample
In Gauteng there are 115 guest houses and 203 bed and breakfast
establishments (City of Johannesburg official website, 2005). Owing to the
similarity of guest houses and bed and breakfast establishments, both types of
establishments were included in the study, as it was stated in paragraph 2.5, and
86
the term guest house used in this research represents both. The population
covered in the study includes guest houses in Gauteng Province. The sample
consists of 65 guest houses from a possible 318 (115+203). They were selected
from the AA Hotels, Lodges, Guest Houses and B&Bs Guide, The Portfolio B&B
Collection, Internet, brochures of the B&Bs Association of Pretoria,
Accommodation in Pretoria/ Tshwane, Johannesburg International Guest House
Association, Midrand B&B Association, Accommodation and Visitor’s Guide
Gauteng and General Sales Agent (GSA) Travel Marketing magazine. The
sample included guest houses that serve different target markets and have
different price categories and these were located within a radius of 70 km from
Johannesburg Central Business District (CBD). The respondents in the sample
were 65 guest house managers/ owners and 177 guest house customers.
Initially it was decided that the sample would be randomly selected. However,
owing to poor response rate during pilot study, convenience sampling was used
and respondents were selected on the basis of willingness to respond.
5.6 Distribution and response rate
The questionnaires were distributed personally. During the distribution of the pilot
questionnaires, the researcher encountered a lot of scepticism and unwillingness
to participate from the guest house owners. Therefore, any other method of
distribution like e-mail or post most likely would have been unsuccessful. For the
purpose of the pilot study it was planned to obtain responses from 15 guest
houses. However no responses were achieved from the first 15 establishments
approached and the researcher had to visit 40 guest houses in total in order to
collect responses from 18 guest house managers and 44 customers. The
completed questionnaires were inspected for any problems of misunderstanding
experienced by the respondents. None were encountered and the same
questionnaire forms were used for further distribution. Owing to the poor
response rate in general, questionnaires were distributed in December 2004, as

87
well as in February, March, April and the beginning of May 2005. Initially the
researcher felt that one week was sufficient time for the guest house owners and
their guests to complete the questionnaires. However, after a week hardly any of
the establishments, and in most instances none, had completed their
questionnaires. Therefore the researcher had to allow more time for completion.
Structured interviews were not carried out, owing to the general unwillingness of
managers of guest houses to participate, however, additional information was
obtained from owners who were willing to spare a few minutes to meet the
researcher.
In total 203 guest houses were visited, of which 99 agreed to participate in the
survey. That meant that 99 management questionnaires and 487 customer
questionnaires were distributed (the aim was an average of five customer
questionnaires per guest house). Of the 99 management questionnaires, 65 were
returned completed which constitutes 66 percent return rate. Of the 487
customer questionnaires, 177 were completed and this constitutes a 36 percent
return rate for customer questionnaires. From the 177, there were 169 useable
for analysis. The eight questionnaires which were not considered for analysis
were completed by guests of a guest house who were at the establishment for a
conference. The guests had only spent a few hours at the establishment and had
not been exposed to the majority of services offered, therefore could not make an
experienced evaluation of the guest house offering.
5.7 Analysis method
For the purpose of analysing the data collected during the survey, the software
programme Pin Point was used. This software was made available to the
researcher by the University of Johannesburg. This research is an exploratory
and descriptive study, and did not include co relational analysis. The analytical
methods used were cross-tabulations which provide information on two variables
at a time, bar charts and pie charts for comparing responses across groups,
88
intervals and descriptive measures like mode for most frequently occurring
values, range for difference between the largest and smallest observations and
mean for average values (Dillon, Madden & Firtle, 1987: 432-436).
5.8 Problems experienced during the collection of data
The collection of primary information depended on the willingness of managers/
owners of guest houses to participate in the study and also to approach their
customers to complete the specific questionnaires. Many guest house owners
were not co-operative and refused to participate in the survey. Other guest house
owners said that they would not benefit in any way by participating in the survey
and were not willing to engage in a conversation with the researcher. Many also
perceived that approaching their customers to complete questionnaires would be
bothering them. Some owners were away, which made it impossible for them to
participate. This difficulty of obtain primary data is confirmed by Keyser (2002:
37) who stated that quality data and information collected by the private sector is
commercially sensitive and generally unavailable.
During the survey, it came to the attention of the researcher that many of the
guest house owners were unsure and worried about the future of the guest
house sector in Gauteng Province (GP), because of Black Economic
Empowerment (BEE) legislation. Some guest house owners expressed their
opinion that BEE compliance would not benefit the guest house industry and
many guest house owners felt threatened. This situation could have contributed
to the reluctance of some guest house owners to participate in the survey.
Another problem experienced during the survey was that some of the available
information about guest houses was incorrect. Guest houses were advertised on
the Internet or in recent publications and when the researcher went to the
physical address indicated in those sources, it was found that they no longer
existed or that they no longer operated as guest houses.
89
The managers of guest houses that agreed to participate took a long time to
complete the questionnaires; on average three weeks. The researcher reduced
the intended collection time, which was initially one week, to four days with the
aim to get the questionnaires in faster, but it proved unsuccessful. The result was
that the questionnaires were not filled in and the collection period had to be
extended. The delay in the completion of the questionnaires resulted in an
extension of the research process.
5.9 Reliability and validity of the research data
The research data includes information collected from guest houses in Gauteng
Province. Therefore, it reflects particulars about these establishments in the
province in question and it may not necessarily be applicable on a larger scale.
The reliability of the responses of guest house managers and their customers is
based on their integrity and the researcher’s good faith. The sample is
representative of the population as it comprises 20 percent of all guest houses in
the province.
The primary information collected by the researcher was tested for its validity, by
asking participants of the study whether the questionnaires had covered all
aspects of the researched topic. Managers and customers confirmed the
construct validity and therefore the internal validity of the information. Research
is valid if it observes, identifies or measures what it says it is doing (Bresler,
2001: 223). External validity is also called generalizability, because it reflects the
extent to which findings of the study generalize the market place (Sudman &
Blair, 1998: 214). In this study, the findings of the primary research correspond
with the obtained theory from secondary research, which was information
obtained from accredited journals and publications. Therefore, all these reflect
the validity of the information. Additionally, the researcher presented the findings
of the study to a guest house owner and she expressed her opinion that the
findings reflect the reality of the guest houses in Gauteng.
90
5.10 Significance and contribution of the study
The research will provide a framework of criteria associated with the factors that
contribute to customer satisfaction in guest houses in GP. In Chapter 1 –
Introduction, it was mentioned that information would be distributed to guest
house owners to assist them in understanding the expectations and perceptions
of customers in order to provide the quality of service required. Guest house
owners, however, requested that the findings and conclusion of the research
document be sent to them electronically (by e-mail). Therefore, Chapter 7 –
Summary of findings, conclusion and recommendations will be distributed to the
guest house owners, which includes the above mentioned information.
5.11 Summary
This chapter describes what steps the researcher undertook in order to execute
the research study. It is explained that information on the topic was obtained
through secondary and primary research. The secondary research is presented
in chapters two to four and it is collected from existing publications. The primary
research data was obtained directly from guest house owners and their
customers by means of questionnaires. The responses were then processed with
the help of a computer software programme in order to ensure accuracy in the
analysis. The findings of the study corresponded with the generic theory on
customer satisfaction and this confirmed the validity of the study.

91
6. REPORT ON DATA AND ANALYSIS
6.1 Introduction
During December 2004, as well as February, March, April and May 2005, two
hundred and three guest houses were visited and approached to participate in
the survey. Their participation involved completion of separate questionnaires by
management and their customers. In total 99 management and 487 customer
questionnaires were distributed. About half (99) of the establishments agreed to
participate and at the end 65 management and 169 customers completed
questionnaires were collected. The completion rate is therefore 66 percent return
rate for the management and 36 percent for the customer questionnaires.
The data from the management questionnaires is reported on and analysed in
order to obtain a profile of the guest house sector in Gauteng Province (GP).
Topics such as the guest houses, demand, target market, services, meals and
advertising are covered from the point of view of managers/ owners of guest
houses.
The data from the customer questionnaires gives information on two major
customer profiles – the Nationality profile, which provides a comparison between
South African (SA) customers and non-South African customers (foreigners), and
a Purpose of visit profile, which compares the business and leisure customers.
Additionally, topics such as how customers perceive the guest houses, what
impressed them and what needs to be improved are discussed. All the data was
used to establish what attracts customers to guest houses, what their needs are
and to analyse the quality of service.
No literature study is included in this chapter and the responses of the
participants are presented in the form of cross-tables, bar charts and a pie chart,
which were generated with Pin Point software. However, Pin Point is not Word
compatible and does not allow for certain changes or corrections to be made to

92
the tables, like for example Figure 6.6 “Mnts High demand”, Figure 6.13
“Advertising med”, Figure 6.16 “Service most imp” and so forth.
6.2 Management questionnaires
6.2.1 The guest houses
During the survey 203 guest houses were approached to participate in the study,
of which 99 took questionnaires to complete. Not all of them, however, were
willing and able to participate. Only 65 eventually completed the questionnaires
and these 65 establishments constituted the sample of the study. A copy of the
questionnaire appears in annexure one.
The managers/ owners of these guest houses were asked in the questionnaire to
indicate how long their establishments have been in operation by selecting one of
the five given options. Their responses are reflected In Figure 6.1. Figures, which
illustrate the responses of management, are coloured in blue in order to
differentiate them from the responses of customers, which are coloured in red. It
became evident that the sample consisted of guest houses which have been in
operation from two years and less to nine and more years. For the purpose of
analysis, the researcher categorised the guest houses, based on the answers,
into two groups of establishments – fairly new establishments (up to four years in
operation) and well-established guest houses (five years and more in operation).
The majority (41 or 63.1%) of the establishments that participated in the survey
have been in existence for five years and more and can therefore be categorised
as well-established operations. The other 24 (36.9%) of the guest houses have
been in operation for up to four years and can consequently be categorised as
fairly new establishments. The distinction between well-established and fairly
new establishments provides an opportunity to describe the guest house sector
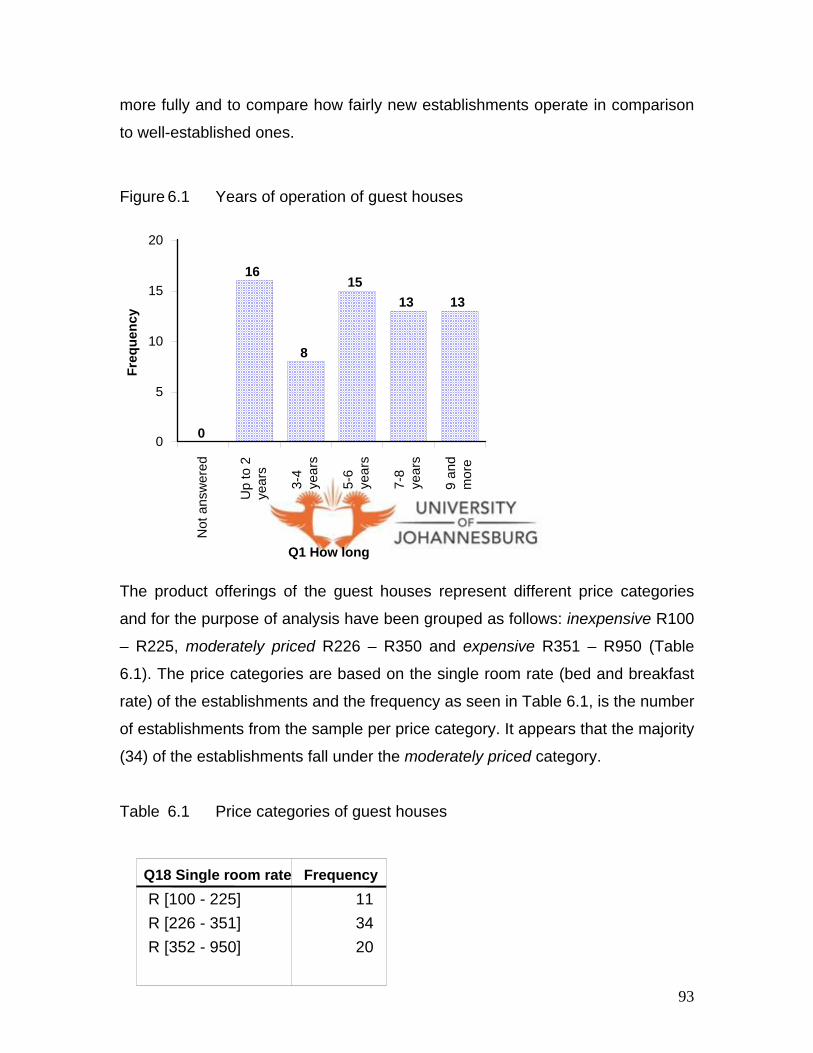
93
more fully and to compare how fairly new establishments operate in comparison
to well-established ones.
Figure 6.1 Years of operation of guest houses
The product offerings of the guest houses represent different price categories
and for the purpose of analysis have been grouped as follows: inexpensive R100
– R225, moderately priced R226 – R350 and expensive R351 – R950 (Table
6.1). The price categories are based on the single room rate (bed and breakfast
rate) of the establishments and the frequency as seen in Table 6.1, is the number
of establishments from the sample per price category. It appears that the majority
(34) of the establishments fall under the moderately priced category.
Table 6.1 Price categories of guest houses
0
16
8
1513 13
0
5
10
15
20
Not
ans
wer
ed
Up
to 2
year
s
3-4
year
s
5-6
year
s
7-8
year
s
9 an
dm
ore
Q1 How long
Freq
uenc
y
Q18 Single room rate R [100 - 225] R [226 - 351] R [352 - 950]
Frequency113420
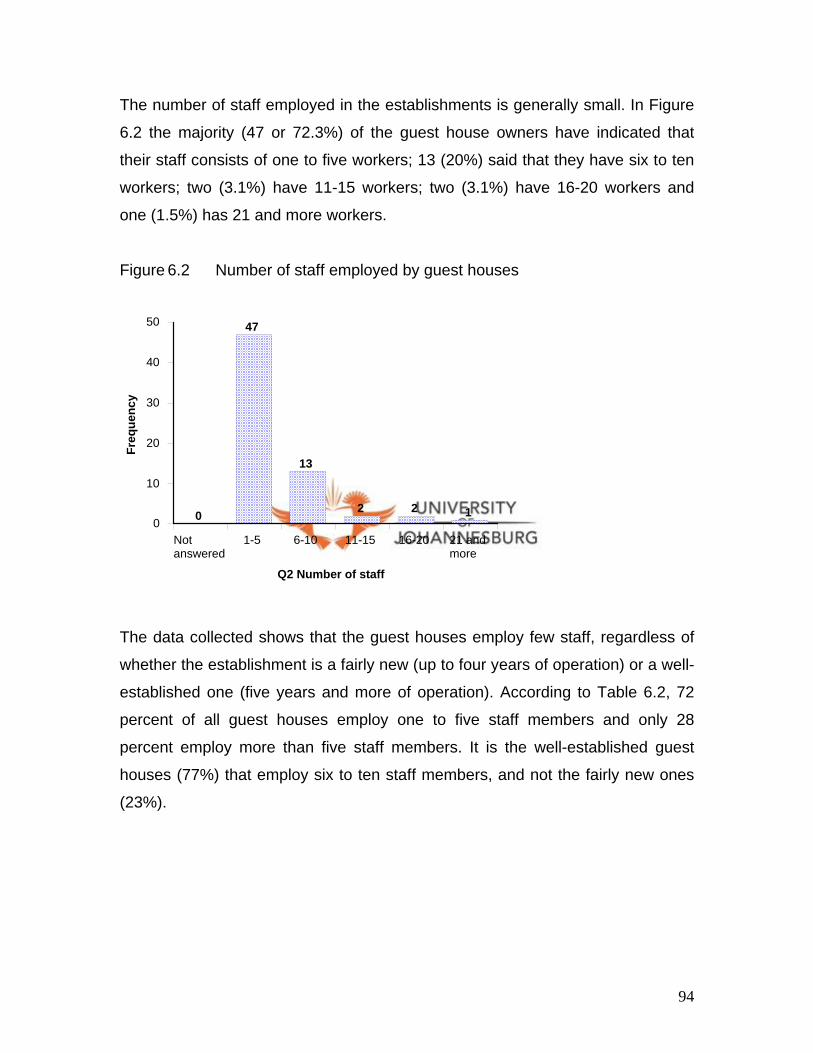
94
The number of staff employed in the establishments is generally small. In Figure
6.2 the majority (47 or 72.3%) of the guest house owners have indicated that
their staff consists of one to five workers; 13 (20%) said that they have six to ten
workers; two (3.1%) have 11-15 workers; two (3.1%) have 16-20 workers and
one (1.5%) has 21 and more workers.
Figure 6.2 Number of staff employed by guest houses
The data collected shows that the guest houses employ few staff, regardless of
whether the establishment is a fairly new (up to four years of operation) or a well-
established one (five years and more of operation). According to Table 6.2, 72
percent of all guest houses employ one to five staff members and only 28
percent employ more than five staff members. It is the well-established guest
houses (77%) that employ six to ten staff members, and not the fairly new ones
(23%).
0
47
13
2 2 10
10
20
30
40
50
Notanswered
1-5 6-10 11-15 16-20 21 andmore
Q2 Number of staff
Freq
uenc
y

95
Table 6.2 Years of operation versus number of staff employed
Managers/ owners were asked to classify their staff turnover as high, average or
low, according to their own perception of whatever constitutes a high, average or
low turnover. The majority of 47 managers (72%) indicated that they have a low
staff turnover, 15 (23%) said theirs is average and three (5%) considered theirs
as high (Figure 6.3).
Figure 6.3 Staff turnover
03
15
47
0
10
20
30
40
50
Notanswered
High Average Low
Q4 Staff turnover
Freq
uenc
y
Q1 How long counts %columns %rows Up to 4 years of operation
5 years and more operation
Total
Q2 Number of staff
1-5 19 40% 79% 28 60% 68% 47 72%
6-103
23%12%1077%24%1320%
11-151
50%4%1
50%2%23%
16-201
50%4%1
50%2%23%
21 and more
0 0% 0% 1
100% 2% 1 2%
Total2437%
4163%
65

96
Figure 6.4 illustrates how many managers work in each guest house. Thirty eight
(58.5%) guest house owners have answered that there is only one manager; 22
(33.8%) have two managers and five (7.7%) have three managers on their
premises. Irrespective of whether it is a fairly new establishment or an
established guest house, the majority have only one manager (Table 6.3). Two
managers are more prevalent in well-established guest houses (68%) than in
newly established ones (32%).
Figure 6.4 Number of managers in a guest house
Table 6.3 Years of operation versus number of managers in a guest house
0
38
22
5
0 00
10
20
30
40
Notanswered
1 2 3 4 5 andmore
Q3 No of managers
Freq
uenc
y
Q1 How long counts %columns %rows Up to 4 years operation
5 years and more operation
Total
Q3 No of managers
115 39%62%23 61%56%38 58%
27
32%29%1568%37%2234%
32
40%8%3
60%7%58%
Total2437%
4163%
65
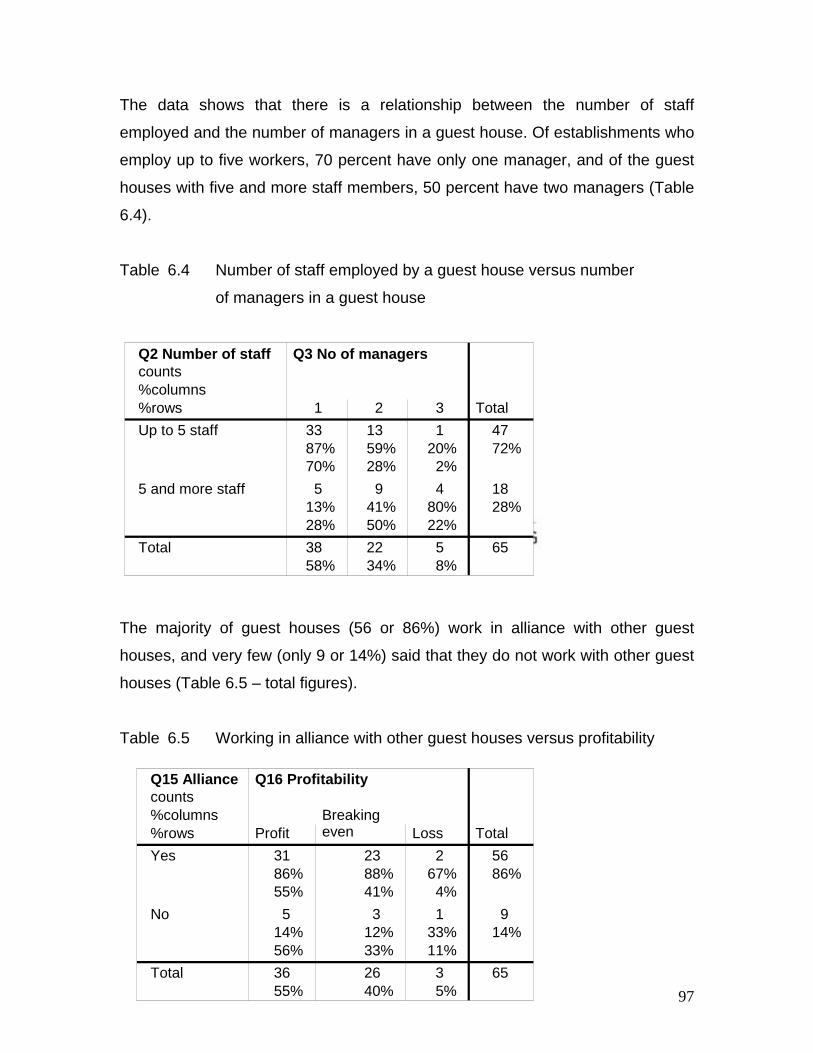
97
The data shows that there is a relationship between the number of staff
employed and the number of managers in a guest house. Of establishments who
employ up to five workers, 70 percent have only one manager, and of the guest
houses with five and more staff members, 50 percent have two managers (Table
6.4).
Table 6.4 Number of staff employed by a guest house versus number
of managers in a guest house
The majority of guest houses (56 or 86%) work in alliance with other guest
houses, and very few (only 9 or 14%) said that they do not work with other guest
houses (Table 6.5 – total figures).
Table 6.5 Working in alliance with other guest houses versus profitability
Q2 Number of staff counts %columns %rows Up to 5 staff
5 and more staff
Total
Q3 No of managers
1 33 87%70%
5 13%28%38 58%
21359%28%
941%50%2234%
31
20%2%4
80%22%
58%
Total4772%
1828%
65
Q15 Alliance counts %columns %rows Yes
No
Total
Q16 Profitability
Profit 31 86% 55%
5 14% 56% 36 55%
Breakingeven
2388%41%3
12%33%2640%
Loss2
67%4%1
33%11%35%
Total5686%
914%
65
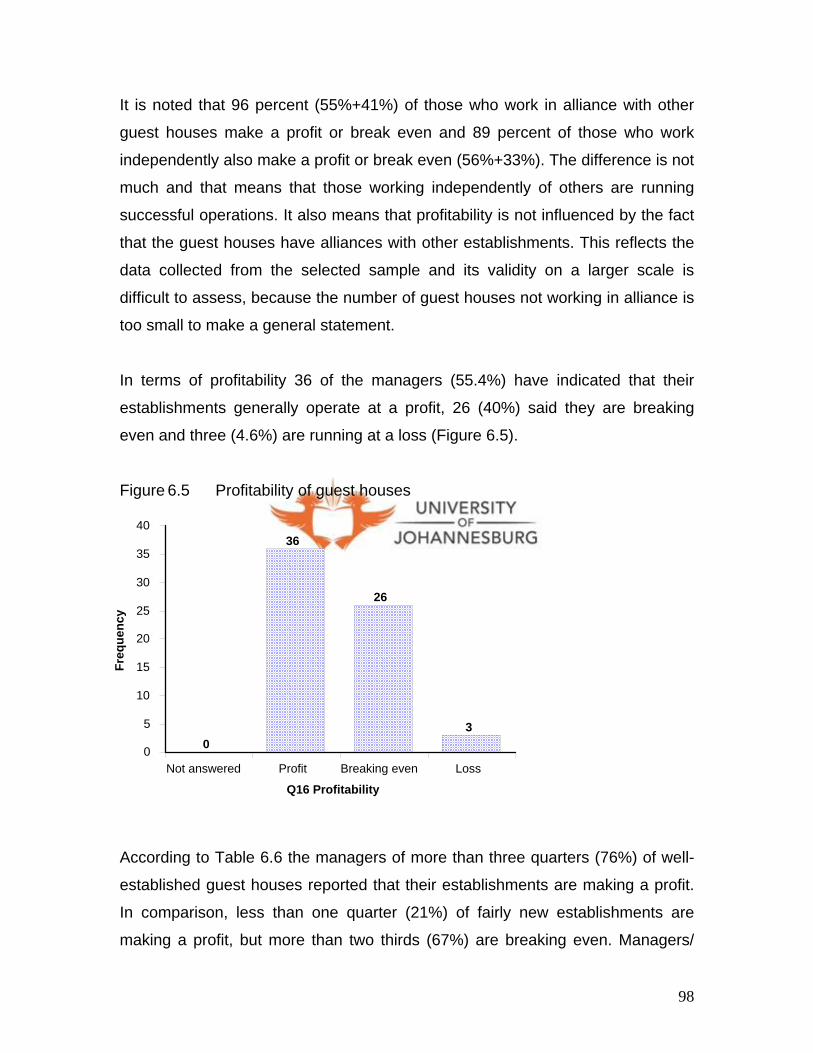
98
It is noted that 96 percent (55%+41%) of those who work in alliance with other
guest houses make a profit or break even and 89 percent of those who work
independently also make a profit or break even (56%+33%). The difference is not
much and that means that those working independently of others are running
successful operations. It also means that profitability is not influenced by the fact
that the guest houses have alliances with other establishments. This reflects the
data collected from the selected sample and its validity on a larger scale is
difficult to assess, because the number of guest houses not working in alliance is
too small to make a general statement.
In terms of profitability 36 of the managers (55.4%) have indicated that their
establishments generally operate at a profit, 26 (40%) said they are breaking
even and three (4.6%) are running at a loss (Figure 6.5).
Figure 6.5 Profitability of guest houses
According to Table 6.6 the managers of more than three quarters (76%) of well-
established guest houses reported that their establishments are making a profit.
In comparison, less than one quarter (21%) of fairly new establishments are
making a profit, but more than two thirds (67%) are breaking even. Managers/
0
36
26
3
0
5
10
15
20
25
30
35
40
Not answered Profit Breaking even Loss
Q16 Profitability
Freq
uenc
y
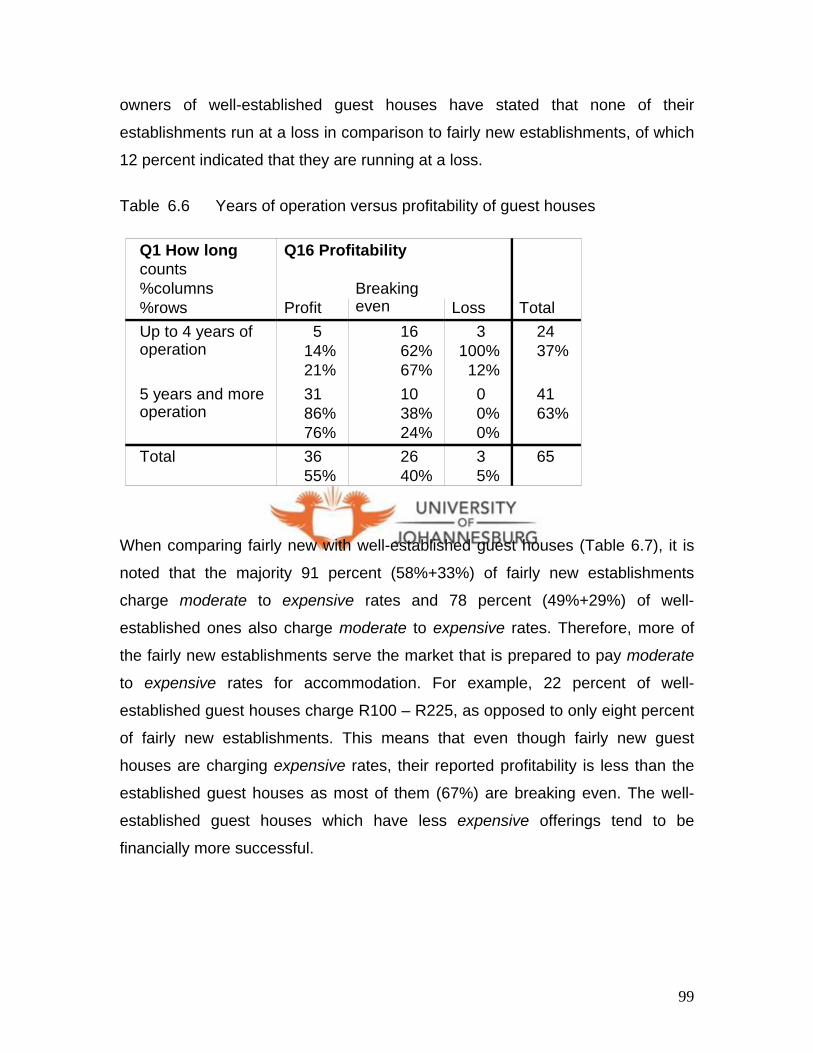
99
owners of well-established guest houses have stated that none of their
establishments run at a loss in comparison to fairly new establishments, of which
12 percent indicated that they are running at a loss.
Table 6.6 Years of operation versus profitability of guest houses
When comparing fairly new with well-established guest houses (Table 6.7), it is
noted that the majority 91 percent (58%+33%) of fairly new establishments
charge moderate to expensive rates and 78 percent (49%+29%) of well-
established ones also charge moderate to expensive rates. Therefore, more of
the fairly new establishments serve the market that is prepared to pay moderate
to expensive rates for accommodation. For example, 22 percent of well-
established guest houses charge R100 – R225, as opposed to only eight percent
of fairly new establishments. This means that even though fairly new guest
houses are charging expensive rates, their reported profitability is less than the
established guest houses as most of them (67%) are breaking even. The well-
established guest houses which have less expensive offerings tend to be
financially more successful.
Q1 How long counts %columns %rows Up to 4 years of operation
5 years and more operation
Total
Q16 Profitability
Profit 5
14% 21% 31 86% 76% 36 55%
Breaking even
16 62% 67% 10 38% 24% 26 40%
Loss 3
100% 12% 0 0% 0% 3 5%
Total 24 37%
41 63%
65

100
Table 6.7 Single room rates versus years of operation of guest house
6.2.2 Demand
It is evident from the managers’ responses that most guest houses experience
peak demand during the months of September, October, March and August (in
this order). The months with the lowest demand are December and January. To
determine periods of peak demand, the managers had to select the months that
they feel their establishment experienced high demand. They could select any
number of the months of the year. In Figure 6.6 the frequency represents the
number of guest houses that have selected the particular month as one of high
demand and September scored 53 guest house counts, October – 48 guest
house counts, March and August – 47 guest house counts each.
Q18 Single room rate counts %columns %rows R 100..225
R 226..350
R 351..950
Total
Q1 How long Up to 4years of operation
2 8%
18% 14 58% 41% 8
33% 40% 24 37%
5 years and moreoperation
9 22% 82% 20 49% 59% 12 29% 60% 41 63%
Total11 17%
34 52%
20 31%
65

101
Figure 6.6 Months of high demand
When asked to indicate the average weekly occupancy rate in percentages
during high demand season, 20 managers responded that they experience
almost full occupancy, which ranges between 81-100 percent (Figure 6.7).
Almost half of the respondents (32 or 49.2%) said that their average weekly
occupancy ranged between 61-80 percent. The managers of the remaining 13
guest houses have stated that their average weekly occupancy during high
demand season is 60 percent and less, which can not be considered as a high
occupancy rate, but rather an average to low occupancy rate.
0
14
39
47
29
38 3835
47
53
48
40
11
0
10
20
30
40
50
60
Not
ans
wer
ed Jan
Feb
Mar Apr
May
June
July
Aug
Sept
Oct
Nov
Dec
Q5 Mnts High demand
Freq
uenc
y

102
Figure 6.7 Average weekly occupancy rates in high demand season
From the data collected it also became apparent that the guest houses are
seldom empty. Figure 6.8 represents the average weekly occupancy that the
establishments experience during low demand season. More than half (35 or
54%) of the guest houses run operations at 21-40 percent occupancy during low
demand, nine (14%) at 41-60 percent and 11 (17%) at 0-20 percent. The other
nine (14%) guest houses have stated that their occupancy rate during low
demand season ranges between 61-80 percent and one has given 81-100
percent as low demand season occupancy rate. The occupancy rates of these
ten guest houses are actually high for a low demand season, therefore it could
mean that they do not experience low demand, or alternatively, the guest house
owners have not answered the question correctly.
Figure 6.8 Average weekly occupancy in percentage (%) during low demand
season
0 1 1
11
32
20
0
5
10
15
20
25
30
35
Notanswered
0-20% 21-40% 41-60% 61-80% 81-100%
Q6 Occupancy High
Freq
uenc
y
0
11
35
9 9
10
5
10
15
20
25
30
35
Notanswered
0-20% 21-40% 41-60% 61-80% 81-100%
Q7 Occupancy Low
Freq
uenc
y
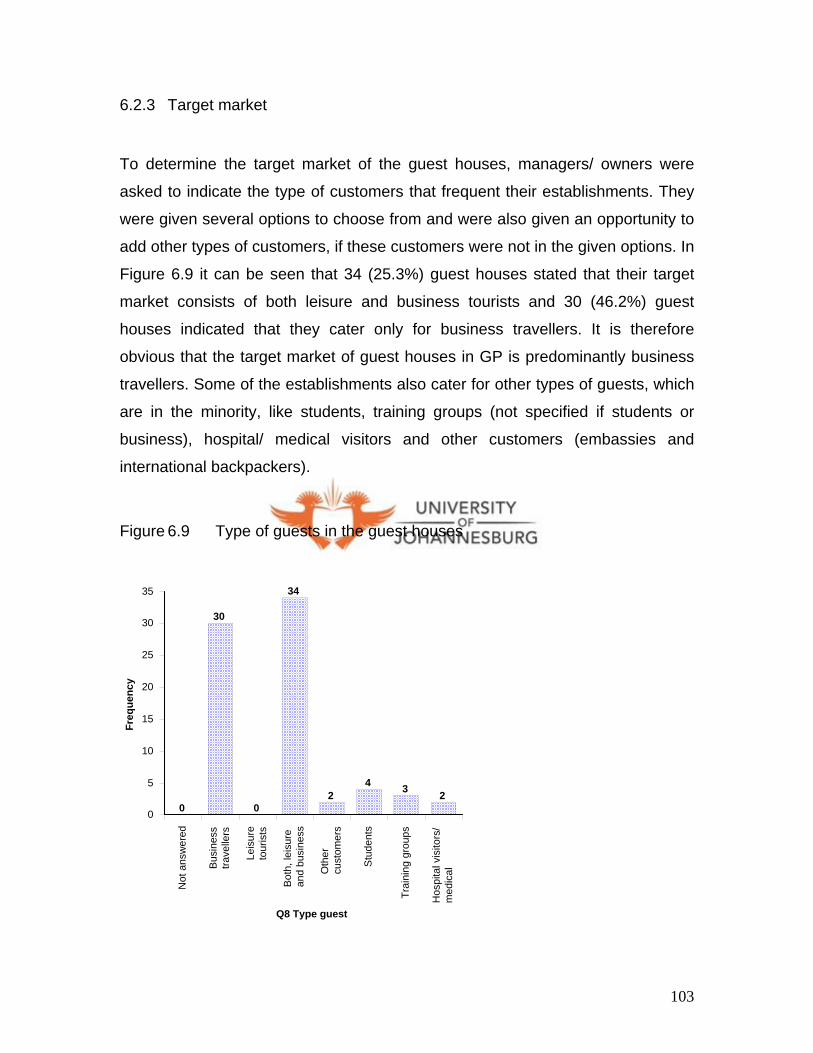
103
6.2.3 Target market
To determine the target market of the guest houses, managers/ owners were
asked to indicate the type of customers that frequent their establishments. They
were given several options to choose from and were also given an opportunity to
add other types of customers, if these customers were not in the given options. In
Figure 6.9 it can be seen that 34 (25.3%) guest houses stated that their target
market consists of both leisure and business tourists and 30 (46.2%) guest
houses indicated that they cater only for business travellers. It is therefore
obvious that the target market of guest houses in GP is predominantly business
travellers. Some of the establishments also cater for other types of guests, which
are in the minority, like students, training groups (not specified if students or
business), hospital/ medical visitors and other customers (embassies and
international backpackers).
Figure 6.9 Type of guests in the guest houses
0
30
0
34
24 3 2
0
5
10
15
20
25
30
35
Not
ans
wer
ed
Bus
ines
stra
velle
rs
Leis
ure
tour
ists
Bot
h, le
isur
ean
d bu
sine
ss
Oth
ercu
stom
ers
Stu
dent
s
Trai
ning
gro
ups
Hos
pita
l vis
itors
/m
edic
al
Q8 Type guest
Freq
uenc
y
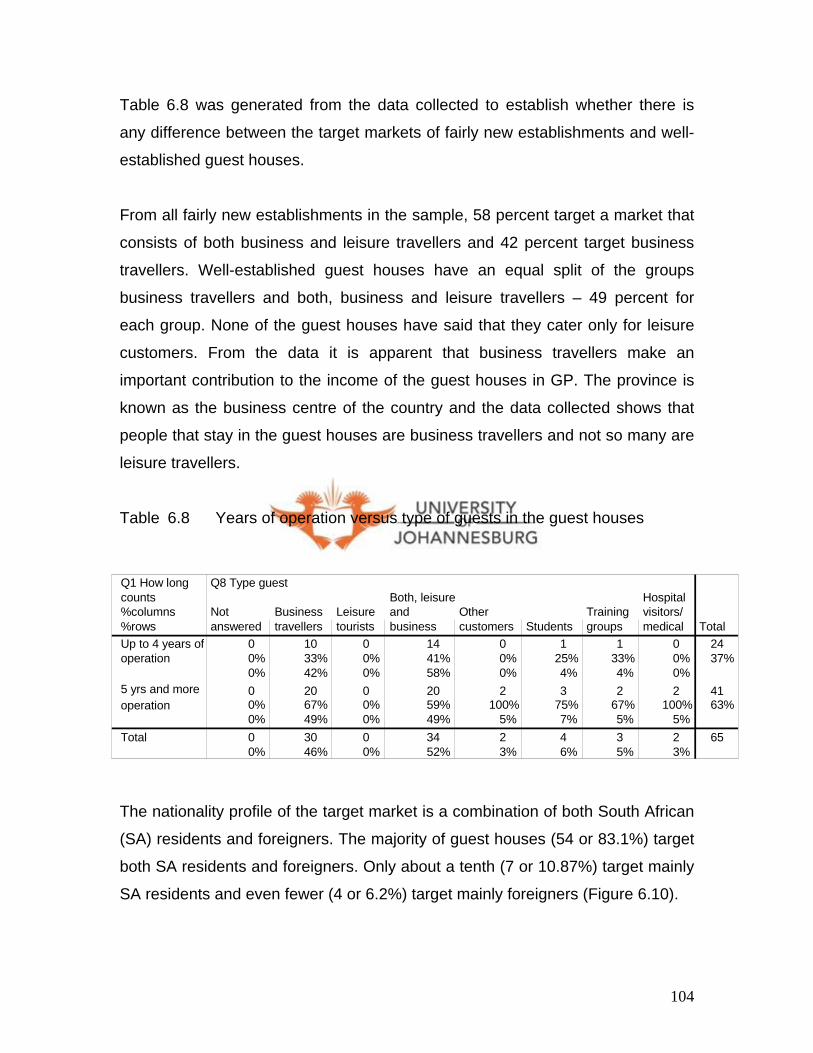
104
Table 6.8 was generated from the data collected to establish whether there is
any difference between the target markets of fairly new establishments and well-
established guest houses.
From all fairly new establishments in the sample, 58 percent target a market that
consists of both business and leisure travellers and 42 percent target business
travellers. Well-established guest houses have an equal split of the groups
business travellers and both, business and leisure travellers – 49 percent for
each group. None of the guest houses have said that they cater only for leisure
customers. From the data it is apparent that business travellers make an
important contribution to the income of the guest houses in GP. The province is
known as the business centre of the country and the data collected shows that
people that stay in the guest houses are business travellers and not so many are
leisure travellers.
Table 6.8 Years of operation versus type of guests in the guest houses
The nationality profile of the target market is a combination of both South African
(SA) residents and foreigners. The majority of guest houses (54 or 83.1%) target
both SA residents and foreigners. Only about a tenth (7 or 10.87%) target mainly
SA residents and even fewer (4 or 6.2%) target mainly foreigners (Figure 6.10).
Q1 How long counts %columns %rows Up to 4 years ofoperation
5 yrs and more operation
Total
Q8 Type guest
Not answered
0 0% 0% 0 0% 0% 0 0%
Business travellers
10 33%42%20 67%49%30 46%
Leisuretourists
00%0%00%0%00%
Both, leisureandbusiness
1441%58%2059%49%3452%
Othercustomers
00%0%2
100%5%23%
Students 1
25% 4% 3
75% 7% 46%
Training groups
1 33% 4% 2
67% 5% 3 5%
Hospitalvisitors/medical
00%0%2
100%5%23%
Total2437%
4163%
65

105
Figure 6.10 Nationality of market targeted by guest house owners
6.2.4 Services offered by the guest houses
Guest houses offer a variety of services such as accommodation, breakfast,
other meals, information about places of interest in the area. In the questionnaire,
managers/ owners were asked what services they offer to their business
customers, and were given answers to choose from and/ or to add other services
not mentioned on the list. The respondents indicated, as illustrated in Figure
6.11, that the most common services offered by the guest houses are personal
computer (PC) sockets and modem sockets for the travellers to connect their
personal computers (31 and 17 counts respectively). Then there are Internet/ e-
mail (11), typing (11), fax (6), phone (4) and other services (5), which include
shuttle, laundry, secretarial service, international plug adaptors and peace and
quiet. Quite a number of guest houses (16 or 24.6%) did not answer the question
and five (7.7%) guest houses stated that they do not offer any of the above
services.
0 0
7
54
04
0
10
20
30
40
50
60
Notanswered
Only SAresidents
Mainly SAresidents
Both SAresidentsandforeigners
Onlyforeigners
Mainlyforeigners
Q10 Customer nation
Freq
uenc
y

106
Figure 6.11 Business services offered at guest houses
When comparing guest houses that target only business travellers with guest
houses that target both business and leisure, it is noted that guest houses that
target only business travellers seem to offer more services than guest houses
that target both leisure and business travellers. The percentages are given in
Table 6.9.
Table 6.9 Types of guests in the guest house versus business services
offered at the guest houses
0
31
17
11
5
11
64 5
16
0
5
10
15
20
25
30
35
Not
ans
wer
ed
PC sock
ets
Mod
emso
cket
s
Typi
ng s
ervi
ces
Oth
er s
ervi
ces
Inte
rnet
/ e-m
ail
Fax
Pho
ne
No
serv
ices
No
answ
er
Q9 Business service
Freq
uenc
y
Q8 Type guest counts %columns %rows Business travellers
Both leisure and business
Others
Total
Q9 Business services
PC sockets
15 48% 50% 15 48% 44%
3 10% 27% 31 48%
Modem sockets
10 59%33%
7 41%21%
2 12%18%
17 26%
Typingservices
545%17%
655%18%
327%27%
1117%
Otherservices
120%
3%3
60%9%1
20%9%
58%
Internet/e-mail
764%23%
436%12%
327%27%
1117%
Fax4
67% 13%
233%
6% 1
17% 9% 69%
Phone 3
75% 10%
1 25%
3% 1
25% 9% 4 6%
Noservices
360%10%
240%
6%1
20%9%
58%
Noanswer
425%13%1275%35%
425%36%
1625%
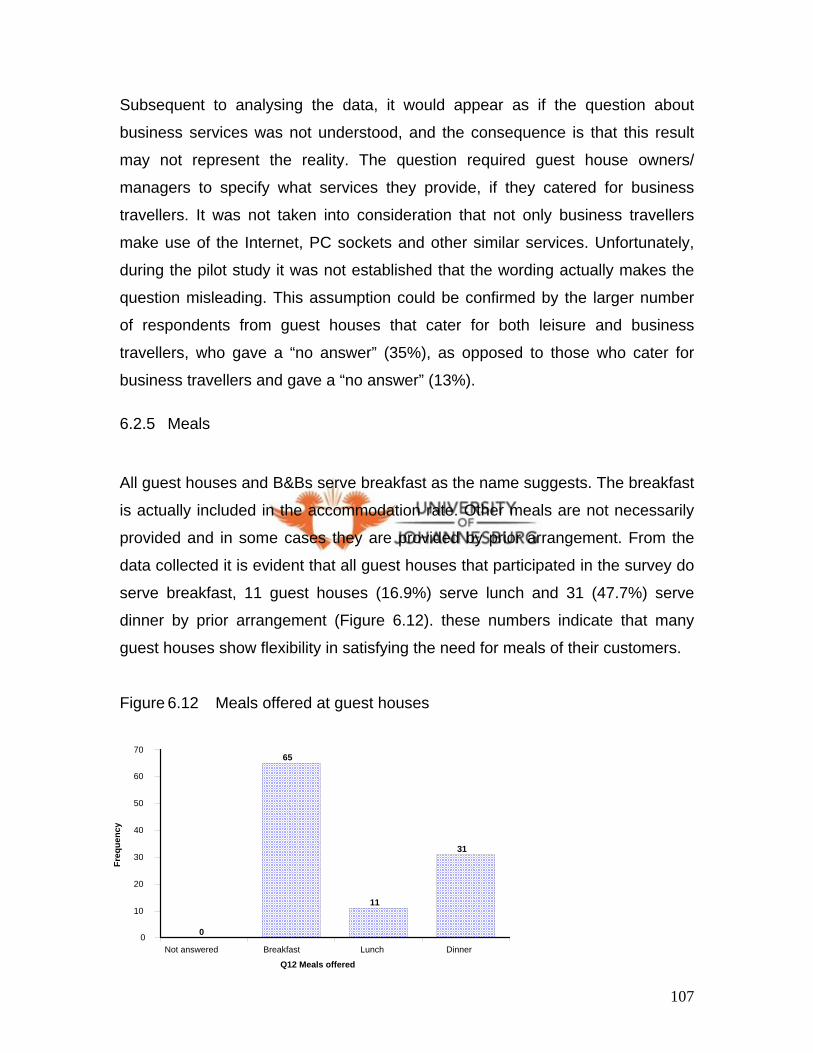
107
Subsequent to analysing the data, it would appear as if the question about
business services was not understood, and the consequence is that this result
may not represent the reality. The question required guest house owners/
managers to specify what services they provide, if they catered for business
travellers. It was not taken into consideration that not only business travellers
make use of the Internet, PC sockets and other similar services. Unfortunately,
during the pilot study it was not established that the wording actually makes the
question misleading. This assumption could be confirmed by the larger number
of respondents from guest houses that cater for both leisure and business
travellers, who gave a “no answer” (35%), as opposed to those who cater for
business travellers and gave a “no answer” (13%).
6.2.5 Meals
All guest houses and B&Bs serve breakfast as the name suggests. The breakfast
is actually included in the accommodation rate. Other meals are not necessarily
provided and in some cases they are provided by prior arrangement. From the
data collected it is evident that all guest houses that participated in the survey do
serve breakfast, 11 guest houses (16.9%) serve lunch and 31 (47.7%) serve
dinner by prior arrangement (Figure 6.12). these numbers indicate that many
guest houses show flexibility in satisfying the need for meals of their customers.
Figure 6.12 Meals offered at guest houses
0
65
11
31
0
10
20
30
40
50
60
70
Not answered Breakfast Lunch Dinner
Q12 Meals offered
Freq
uenc
y
108
Managers were also asked to indicate how they decide on the menu items – if
they use a set menu for each day of the week or if they pre-arrange with guests
individually. If they have a different arrangement, they were asked to specify the
arrangement. The respondents gave the following information:
• 36 (55.4%) stated that they pre-arrange with guests individually;
• 27 (41.5%) have a set menu for each day of the week;
• three (4.6%) change the menu every day; and
• three (4.6%) have other arrangements like “set breakfast lay out and cook on
request”; “standard breakfast (quite wide) and other meals individual” and “set
menu with four options”.
By pre-arranging individually the menu with the guests, the managers are
learning more about what meal would satisfy the patrons. They are also including
the guests into the service delivery and that contributes to less service errors.
6.2.6 Advertising
When asked how they advertise the guest house, the managers/ owners were
given several options from which to choose, like magazines, newspapers,
Internet, distribution of pamphlets and dedicated publications. They were also
given the option to add any other methods of advertising they use, and were
allowed to give more than one answer. The results are captured in Figure 6.13
and are summarised as follows:
• 54 (83.1%) guest houses said they use Internet;
• 28 (43.1%) use dedicated publications;
• 13 (20%) distribute pamphlets;
• 11 (16.95) rely on word of mouth;
• nine (13.8%) advertise in magazines;
• seven (10.8%) advertise in an association booklet;

109
• five (7.7%) advertise in tourism guides;
• three (4.6%) rely on street advertising, signs and posters;
• three (4.6%) use other sources like: teleguide/ airport, overseas publications,
one-on-one marketing;
• one (1.5%) advertises in newspapers; and
• one (1.5%) does not advertise at all.
The most popular means of communicating with prospective customers are thus
via the Internet (54 or 83.1%), via dedicated publications (28 or 43.1%) and via
distributing pamphlets.
Figure 6.13 Advertising media
0
9
1
54
13
28
3
117
53
10
10
20
30
40
50
60
Not
ans
wer
ed
Mag
azin
es
New
spap
ers
Inte
rnet
Dis
tribu
te p
amph
lets
Ded
icat
ed p
ublic
atio
ns
e.g
. Por
tfolio
Oth
ers
Wor
d of
mou
th
Asso
ciat
ion
book
let
Tour
ism
gui
de
Stre
et a
dds,
sig
ns, p
oste
rs
Do
not a
dver
tise
Q14 Advertising med
Freq
uenc
y
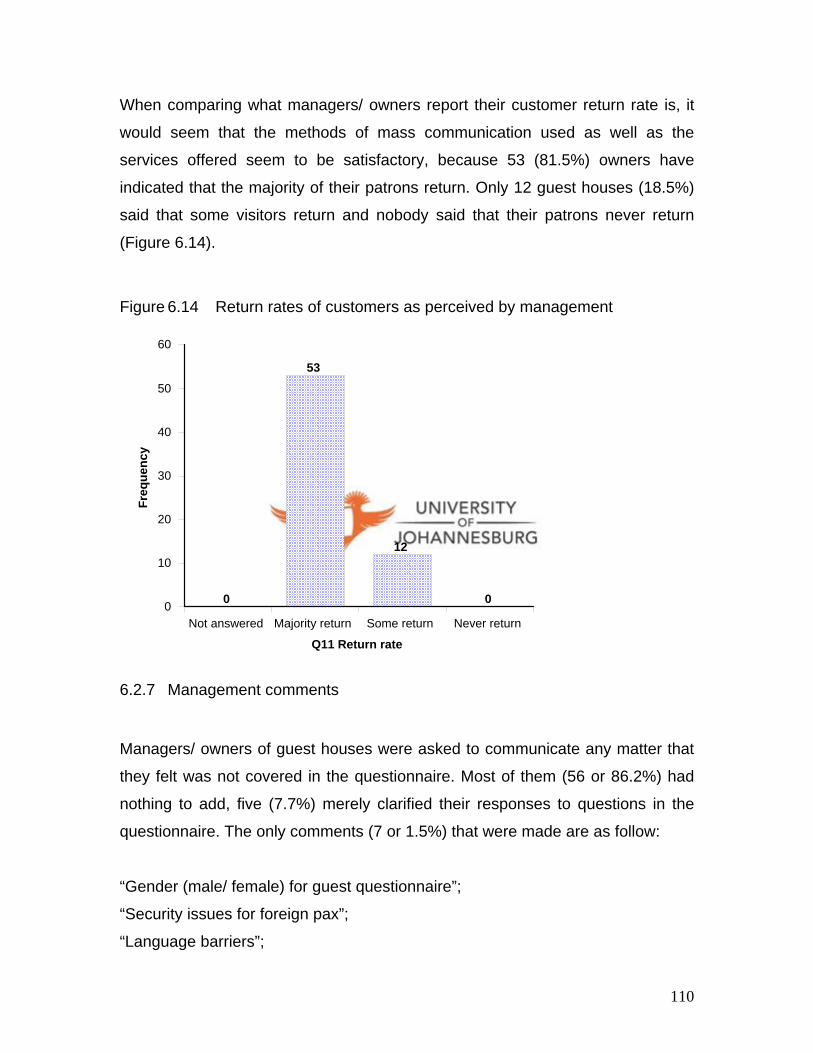
110
When comparing what managers/ owners report their customer return rate is, it
would seem that the methods of mass communication used as well as the
services offered seem to be satisfactory, because 53 (81.5%) owners have
indicated that the majority of their patrons return. Only 12 guest houses (18.5%)
said that some visitors return and nobody said that their patrons never return
(Figure 6.14).
Figure 6.14 Return rates of customers as perceived by management
6.2.7 Management comments
Managers/ owners of guest houses were asked to communicate any matter that
they felt was not covered in the questionnaire. Most of them (56 or 86.2%) had
nothing to add, five (7.7%) merely clarified their responses to questions in the
questionnaire. The only comments (7 or 1.5%) that were made are as follow:
“Gender (male/ female) for guest questionnaire”;
“Security issues for foreign pax”;
“Language barriers”;
0
53
12
00
10
20
30
40
50
60
Not answered Majority return Some return Never return
Q11 Return rate
Freq
uenc
y

111
“Specific services for tourism industry”;
“Must include new entrants in the market”;
“Most questions did not suit my needs”; and
“What percentage of income is needed to cover overheads”.
Unfortunately the above statements are not that useful as it is not clear to the
researcher what is meant by them. The fact that 56 guest houses out of a total of
65 did not have anything to add, could be interpreted that the questionnaire was
well formulated and covered almost everything, thus satisfies construct validity.
The data is captured in Figure 6.15.
Figure 6.15 Matters that managers/ owners feel are not covered in the questionnaire
0 1 1 1 1 1 1 1
56
5
0
10
20
30
40
50
60
Not
ans
wer
ed
Gen
der (
mal
e/fe
mal
e)fo
r gue
st q
uest
ionn
aire
Sec
urity
issu
esfo
r for
eign
pax
Lang
uage
barr
iers
Spe
cific
ser
vice
s fo
rto
uris
m in
dust
ry
Mus
t inc
lude
new
entra
nts
in th
e m
arke
t
Mos
t que
stio
ns d
id n
otsu
it m
y ne
eds
Wha
t % o
f inc
ome
is n
eede
d to
cove
r ove
rhea
ds
No
Ans
wer
Oth
er in
form
atio
n cl
arify
ing
abov
e an
swer
s
Q17 Comments
Freq
uenc
y

112
6.3 Customer questionnaires
During the survey 177 customer questionnaires were completed by the
customers of 51 guest houses. Sixteen guest houses did not manage to convince
their customers to complete questionnaires. Of the 177 completed, 169
questionnaires were useable for analysis. The other eight questionnaires were
not used, because they were completed by guests who were at a guest house for
a conference. The guests had only spent a few hours at the establishment,
therefore could not evaluate the offering of the guest house. Many of the
respondents were staying for the first time in the particular establishment (59.8%)
and many had stayed there several times (40.2%). From the answers given,
information was obtained on how customers evaluate the performance of the
guest houses. The researcher also developed customer profiles in order to better
understand customer needs.
6.3.1 How customers perceive the guest houses
In order to determine how customers perceive the guest houses they visit, they
were asked a number of questions which involved rating the service of the
particular guest house, certain characteristics of the guest house, such as the
atmosphere, the room and their experience as a whole. Then they were asked
which characteristic of the above-mentioned topics is the most important to them.
In terms of the service the customers determined in order of importance (Figure
6.16):
• Friendly and polite staff with 77 responses (45.6%);
• Efficient service with 64 responses (37.9%);
• Helpful staff with 19 responses (11.2%);
• Ability of staff to suggest additional services and information with seven
responses (4.1%); and
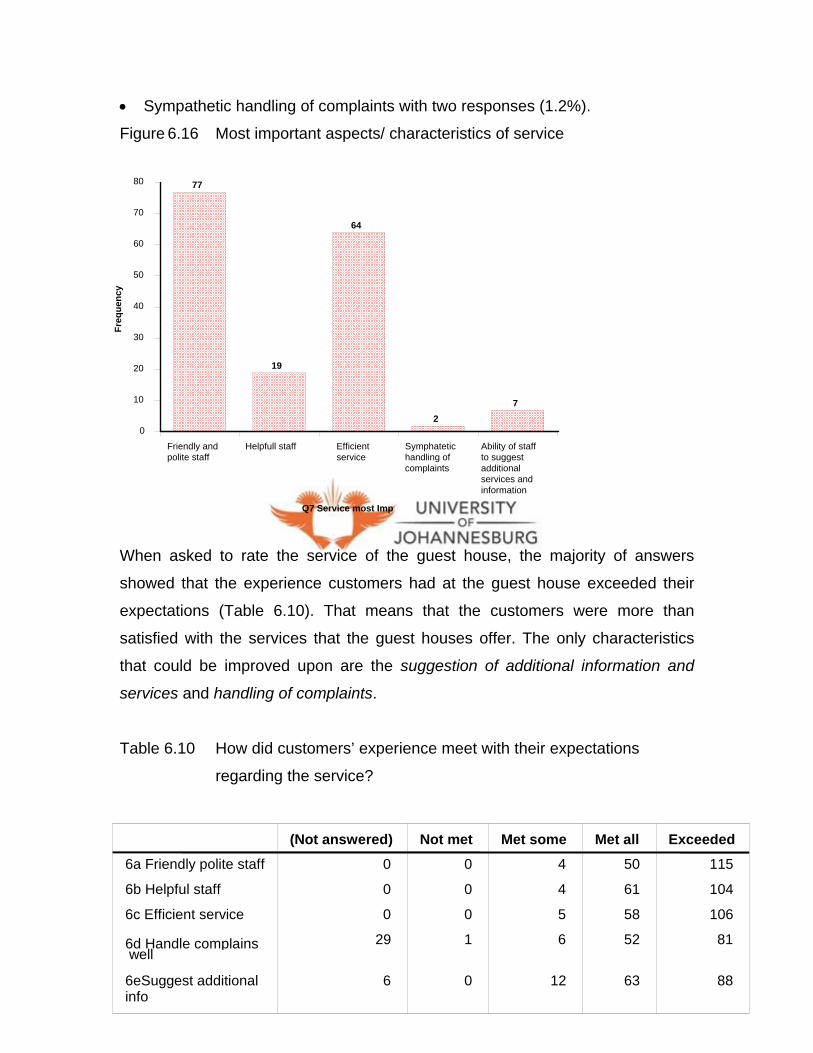
113
• Sympathetic handling of complaints with two responses (1.2%).
Figure 6.16 Most important aspects/ characteristics of service
When asked to rate the service of the guest house, the majority of answers
showed that the experience customers had at the guest house exceeded their
expectations (Table 6.10). That means that the customers were more than
satisfied with the services that the guest houses offer. The only characteristics
that could be improved upon are the suggestion of additional information and
services and handling of complaints.
Table 6.10 How did customers’ experience meet with their expectations
regarding the service?
6a Friendly polite staff
6b Helpful staff
6c Efficient service
6d Handle complains well
6eSuggest additional info
(Not answered)
0
0
0
29
6
Not met
0
0
0
1
0
Met some
4
4
5
6
12
Met all
50
61
58
52
63
Exceeded
115
104
106
81
88
77
19
64
27
0
10
20
30
40
50
60
70
80
Friendly andpolite staff
Helpfull staff Efficientservice
Symphatetichandling ofcomplaints
Ability of staffto suggestadditionalservices andinformation
Q7 Service most Imp
Freq
uenc
y

114
The most important characteristics of the guest houses (Figure 6.17) were rated
in order of preference as follows:
• Safety and security with 50 responses (29.6%);
• Satisfies your needs with 32 responses (18.9%),
• Value for money with 30 (17.8%),
• Location with 29 (17.2%),
• Suits your lifestyle with 14 (8.3%),
• Suits your personality with ten (5.9%) and
• Quality of meals with four responses (2.4%).
Figure 6.17 Most important aspects/ characteristics of the guest house
When evaluating their experience against their expectations regarding the guest
house, most customers pointed out that location, safety and security and suits
your lifestyle met all their expectations. That means that they were satisfied with
29
50
32
10
14
4
30
0
5
10
15
20
25
30
35
40
45
50
Location Safety and security Satisfies
your needs
Suits yourpersonality
Suits yourlifestyle
Quality ofmeals
Value formoney
Q9 gh- most importa
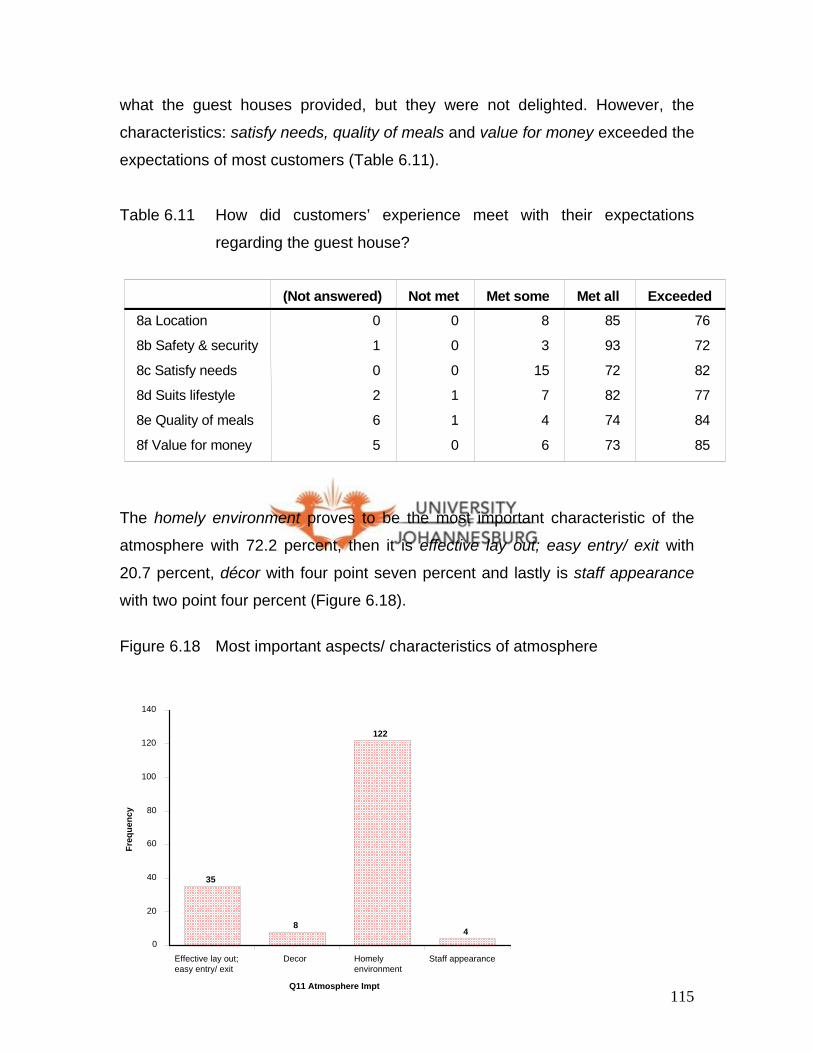
115
what the guest houses provided, but they were not delighted. However, the
characteristics: satisfy needs, quality of meals and value for money exceeded the
expectations of most customers (Table 6.11).
Table 6.11 How did customers’ experience meet with their expectations
regarding the guest house?
The homely environment proves to be the most important characteristic of the
atmosphere with 72.2 percent, then it is effective lay out; easy entry/ exit with
20.7 percent, décor with four point seven percent and lastly is staff appearance
with two point four percent (Figure 6.18).
Figure 6.18 Most important aspects/ characteristics of atmosphere
35
8
122
40
20
40
60
80
100
120
140
Effective lay out;easy entry/ exit
Decor Homelyenvironment
Staff appearance
Q11 Atmosphere Impt
Freq
uenc
y
8a Location
8b Safety & security
8c Satisfy needs
8d Suits lifestyle
8e Quality of meals
8f Value for money
(Not answered)0
1
0
2
6
5
Not met0
0
0
1
1
0
Met some8
3
15
7
4
6
Met all
85
93
72
82
74
73
Exceeded76
72
82
77
84
85
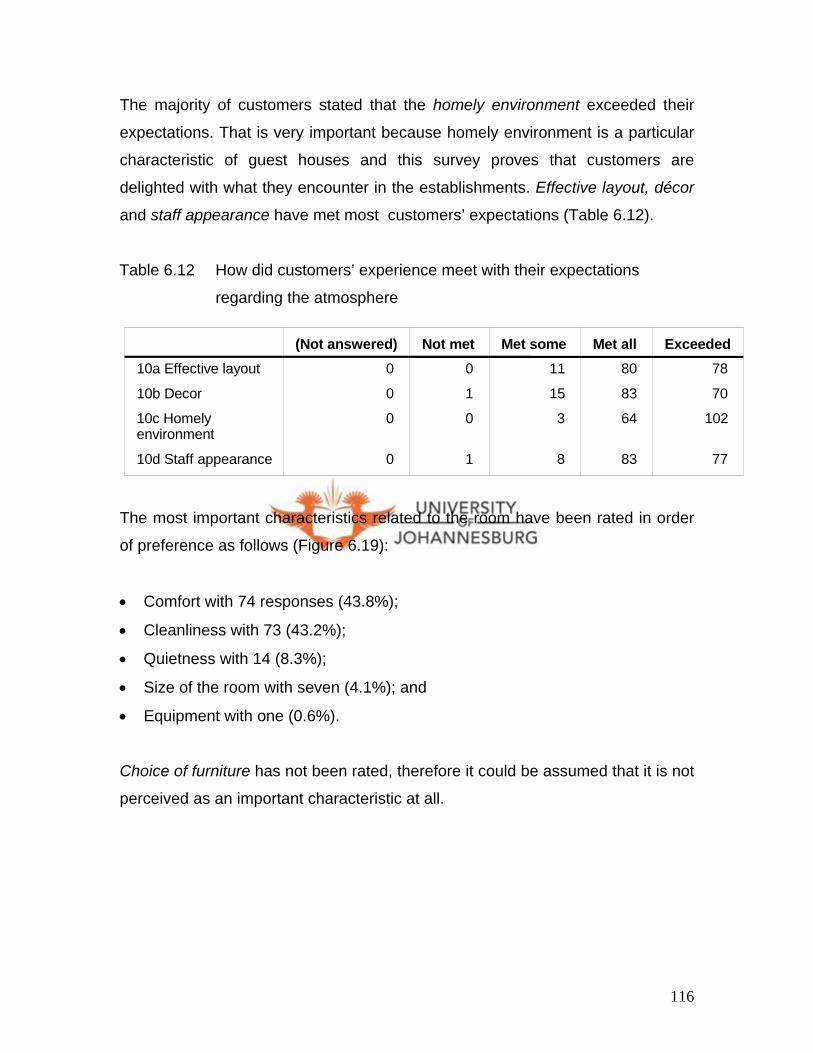
116
The majority of customers stated that the homely environment exceeded their
expectations. That is very important because homely environment is a particular
characteristic of guest houses and this survey proves that customers are
delighted with what they encounter in the establishments. Effective layout, décor
and staff appearance have met most customers’ expectations (Table 6.12).
Table 6.12 How did customers’ experience meet with their expectations
regarding the atmosphere
The most important characteristics related to the room have been rated in order
of preference as follows (Figure 6.19):
• Comfort with 74 responses (43.8%);
• Cleanliness with 73 (43.2%);
• Quietness with 14 (8.3%);
• Size of the room with seven (4.1%); and
• Equipment with one (0.6%).
Choice of furniture has not been rated, therefore it could be assumed that it is not
perceived as an important characteristic at all.
10a Effective layout
10b Decor
10c Homely environment
10d Staff appearance
(Not answered) 0
0
0
0
Not met 0
1
0
1
Met some
11
15
3
8
Met all 80
83
64
83
Exceeded
78
70
102
77

117
Figure 6.19 Most important aspects/ characteristics of the room
Evaluating the experience of the room against the customers’ expectations, once
again the majority of answers are “met all” and “exceeded” the expectations.
Regarding cleanliness and size of the room, most customers indicated that the
experience exceeded their expectations (92 and 82 responses respectively) and
regarding the rest of the characteristics, customers’ experiences at the guest
houses have mostly met all their expectations (Table 6.13).
Table 6.13 How did customers’ experience meet with their expectations
regarding the room?
73 74
14
1 0
7
0
10
20
30
40
50
60
70
80
Cleanliness Comfort Quietness Equipment Choice offurniture
Size of theroom
Q13 important-room
Freq
uenc
y
12a Cleanliness
12b Comfort
12c Quietness
12d Equipment
12e Choice furniture
12f Size of the room
(Not answered)
0
0
1
2
0
4
Not met
0
0
1
1
2
0
Met some
2
10
16
22
18
10
Met all 75
80
78
77
91
73
Exceeded
92
79
73
67
58
82

118
In summary, the characteristics which exceeded the expectations of customers
were: friendly and polite staff, helpful staff, efficient service, satisfied needs,
quality of meals, value for money, homely environment, cleanliness and size of
the rooms. These characteristics describe the product offering of the guest
houses and it appears from the data collected that the patrons of these
establishments are highly satisfied and delighted with the service they receive.
6.3.2 Satisfaction with the overall experience
The results of the overall evaluation of the combined experiences against
expectations were very positive. Almost four fifths of the respondents (131 or
77.5%) stated that they were totally satisfied, 30 respondents (20.7%) said they
were satisfied, one (0.6%) was dissatisfied and two (1.2%) were totally
dissatisfied (Figure 6.20). Both customers who said they were totally dissatisfied,
stated that they would come back to the guest house and that they would
recommend it to friends and family. They also did not make any comments on
what they thought should be improved in the guest house. Therefore, it could be
assumed that they were not at all dissatisfied, but rather, by mistake, selected
the wrong answer. The customer who said that he/ she was dissatisfied, stated
that he/she would not come back or recommend the establishment. He/she also
mentioned that he/ she found the establishment to be “too expensive”.
Figure 6.20 How satisfied are customers with whole experience
2 1
35
131
0
20
40
60
80
100
120
140
Totally dissatisfied Dissatisfied Satisfied Totally satisfied
Q14 Whole experienc
Freq
uenc
y

119
Almost all the respondents (167 or 98.8%) stated that they would return to the
guest house. Only two (1.2%) customers have stated they would not come back
(Figure 6.21).
Figure 6.21 Would customers come back to guest house?
When asked if they would recommend the guest house, 166 (98.2%) have stated
that they would recommend it to friends and family and only three (1.8%) have
said that they would not recommend it (Figure 6.22). This proves that good or
excellent service leads to satisfied or delighted customers who would gladly
recommend a guest house to other people.
Figure 6.22 Would customers recommend the guest house?
167
20
20
40
60
80
100
120
140
160
180
Yes No
Q15 Come back
Freq
uenc
y
166
30
20
40
60
80
100
120
140
160
180
Yes No
Q16 Would u recomen
Freq
uenc
y
120
6.3.3 Uniqueness of guest houses
Having discussed how customers have evaluated the guest houses it is
important to look at what impressed them and what suggestions they made for
improvements. To the question what impressed them, customers made a number
of statements, which the researcher grouped in terms of similarity (Figure 6.23).
It was then noted that those groups fall under the service quality dimensions,
which were discussed in paragraph 4.3 and they are:
• Reliability – ability to perform the promised service dependably and
accurately;
• Responsiveness – willingness to help customers and provide prompt service;
• Assurance – employees’ knowledge and courtesy and their ability to inspire
trust and confidence;
• Empathy – caring individualised attention given to customers and
• Tangibles – appearance of physical facilities, equipment, personnel and
written materials.
From customers’ answers to this question, one can deduct that they rated
Empathy as the most outstanding characteristic of a guest house. It was
mentioned by 105 respondents. Physical evidence (tangibles) is the second most
important characteristic and was described by 59 respondents. Responsiveness
was mentioned by 32 respondents and that places it in third place of importance,
followed by Reliability in fourth with comments by 20 respondents and Assurance
on fifth place with 16 statements by respondents. There were 31 people that did
not answer the question and there were 6 comments, which could not be
categorised under the service quality dimensions. Figure 6.25 represents the
customers’ answers, which are organised into sub-groups of the service quality
dimensions. In this paragraph no percentage figures are presented, because
customers gave more than one answer, therefore the number of answers does

121
not coincide with the number of customers, which constitute a 100 percent in the
software program.
Figure 6.23 What impressed customers the most?
Empathy was the characteristic of the service offering of the guest house that
was mentioned most by respondents and confirms the reliability of the findings
from the structured part of the questionnaire. Empathy was mentioned 105 times
and in 23 cases the comments referred to the empathic disposition of the owner.
Customers said the manageress was caring and very pleasant, that the
interaction was warm without being overbearing. Empathy experienced from staff
members was mentioned 17 times by customers. Sixteen customers said it really
felt like home away from home. The more general comments (49) covered
aspects such as privacy, people skills, generosity, positive attitude, politeness,
23
17 16
49
32
16
20 21
15
8
15
6
31
0
5
10
15
20
25
30
35
40
45
50
Em
path
yof
ow
ner
Em
path
y - F
riend
lyst
aff
Em
path
y - H
ome
from
hom
eE
mpa
thy
- Gen
eral
Res
pons
iven
ess
Ass
uran
ce
Rel
iabi
lity
Phy
sica
l evi
denc
e -
Gen
eral
Phy
sica
l evi
denc
e -
Goo
d m
eals
Phy
sica
l evi
denc
e -
Hyg
iene
Phy
sica
l evi
denc
e -
Am
bien
ceO
ther
thin
gs th
atim
pres
sed N
oA
nsw
er
Q18 What impressed
Freq
uenc
y

122
service with a smile, great hospitality where friends were welcomed and children
catered for.
Many comments were made about tangible aspects (physical evidence) of the
guest house product. To facilitate interpretation these were split into categories of
facilities namely those that relate to food, ambience, hygiene and general. Fifteen
comments on meals were made and 15 on ambience that was created by the
physical environment. These include statements such as a peaceful and happy
guest house, quietness, harmony and a relaxing atmosphere. Eight statements
were made about how customers experienced the guest houses as very clean
and hygienic. Then there were 21 more general statements about tangibles such
as a nice room, sauna and swimming pool, nice layout and tennis court. Space,
comfort, neatness and gardens were also mentioned.
Responsiveness was rated as the third most impressive aspect of the guest
house offering. Customers made 32 statements about how impressed they were
with the effort that was made to meet their needs, how everyone walked the extra
mile to ensure satisfaction, nothing was too much of a trouble, the staff was
helpful and all business facilities were available on the premises. Customers
were also impressed with the support, promptness and a great service that they
received.
Reliability was the fourth most impressive aspect of the guest house product. It
described 20 customers’ statements about how they perceive the guest house as
a perfect, complete package, excellent, fantastic place, divine and value for
money.
The aspect of Assurance was rated last in terms of impressiveness. Customers
made 16 comments about best security, well organised, attention to detail, total
efficiency, courtesy, ability to be independent.
123
There were also other comments, which could not be grouped under the quality
service dimensions. These are called other things that impressed (6 responses)
and include:
• Loved the resident dog;
• Easy use of communication equipment;
• Will recommend the guest houses and
• Interesting other guests.
6.3.4 Matters to be improved upon
Customers were requested to indicate some things that they feel should be
improved or added to the services of the guest houses (Figure 6.24). From the
responses of the customers it could be concluded that the guest houses in GP do
not have many weaknesses in that 68 (40.2%) customers did not feel the desire
to answer the question and another 35 (20.7%) stipulated that there is nothing
that requires improvement. The comments received were categorised as follows:
those related to the room (19), the facilities (11), the services (10), the bathroom
(9), DSTV and other improvements (8 each), meals (5), heating/ cooling system
and television comments (4 each), parking (3) and cleanliness (2).
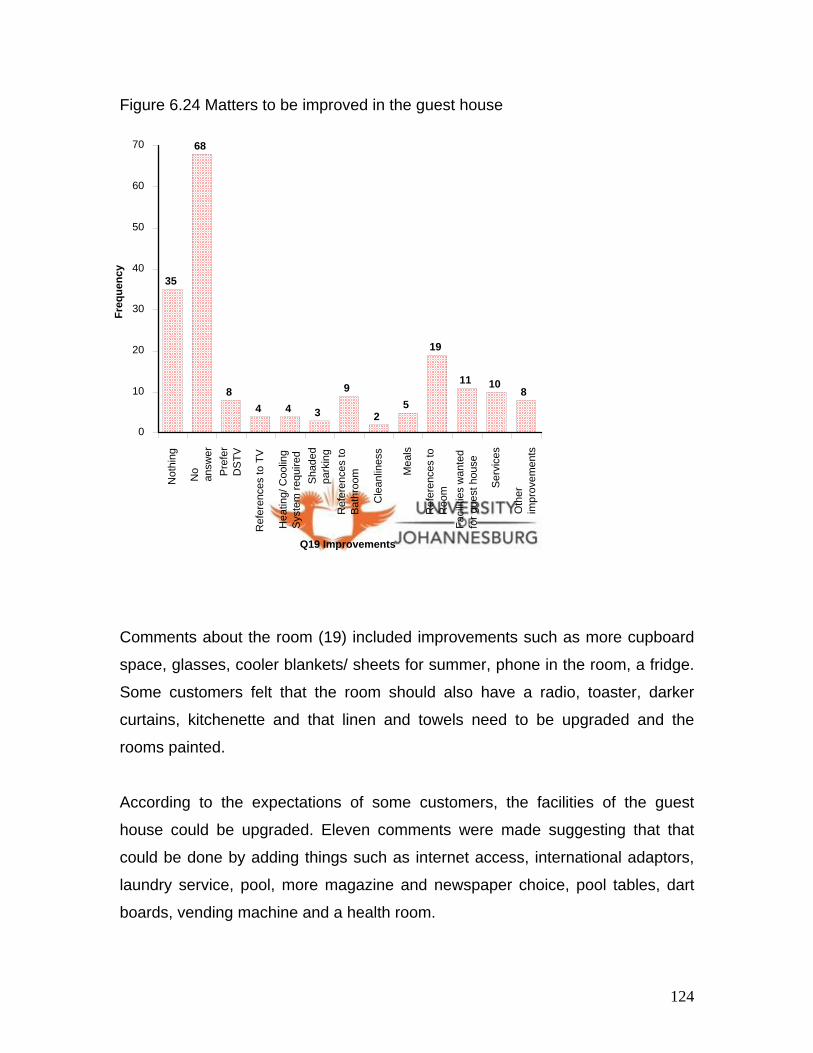
124
Figure 6.24 Matters to be improved in the guest house
Comments about the room (19) included improvements such as more cupboard
space, glasses, cooler blankets/ sheets for summer, phone in the room, a fridge.
Some customers felt that the room should also have a radio, toaster, darker
curtains, kitchenette and that linen and towels need to be upgraded and the
rooms painted.
According to the expectations of some customers, the facilities of the guest
house could be upgraded. Eleven comments were made suggesting that that
could be done by adding things such as internet access, international adaptors,
laundry service, pool, more magazine and newspaper choice, pool tables, dart
boards, vending machine and a health room.
35
68
84 4 3
9
25
19
11 108
0
10
20
30
40
50
60
70
Not
hing
No
answ
erP
refe
rD
STV
Ref
eren
ces
to T
V
Hea
ting/
Coo
ling
Sys
tem
requ
ired
Sha
ded
park
ing
Ref
eren
ces
toB
athr
oom
Cle
anlin
ess
Mea
ls
Ref
eren
ces
toR
oom
Faci
litie
s w
ante
dfo
r gue
st h
ouse
Ser
vice
s
Oth
erim
prov
emen
tsQ19 Improvements
Freq
uenc
y
125
Ten customers expressed opinions about service shortcomings. Two were
concerned about security and two mentioned that communication with guests
could be improved. Others felt that a midnight snack bar or self-catering could be
added, better street signage was required and the plumbing needed attention.
Nine comments were made about the bathroom. Customers indicated that the
showerheads needed to be changed, windows were too public, shelves in the
bathroom and more choice of soaps and shampoos were needed.
Eight requests were made about DSTV and eight other improvements were
mentioned relating to transport, price of internet/ phone, pre-paid phone facility,
décor, better pay for staff and street noises.
The five comments on the meals included requests for dinner by arrangement.
Four customers requested heating/ cooling system and another four made
comments about the television sets and programmes. Three customers
requested shaded parking and two felt that there is a need to attend to
cleanliness.
It is interesting to note that even though customers did not consider décor (Figure
6.18) equipment and size of room (Figure 6.19) as very important, the majority of
the above statements can be related to Physical evidence or Tangibles, which
contributes to comfortable accommodation that customers seek in the guest
houses. No references have been made about the other four dimensions of
service quality, except two comments “Customer service” and “Communication
with guests” which could be related to Responsiveness and another comment on
“Security” which could be classified under Assurance.
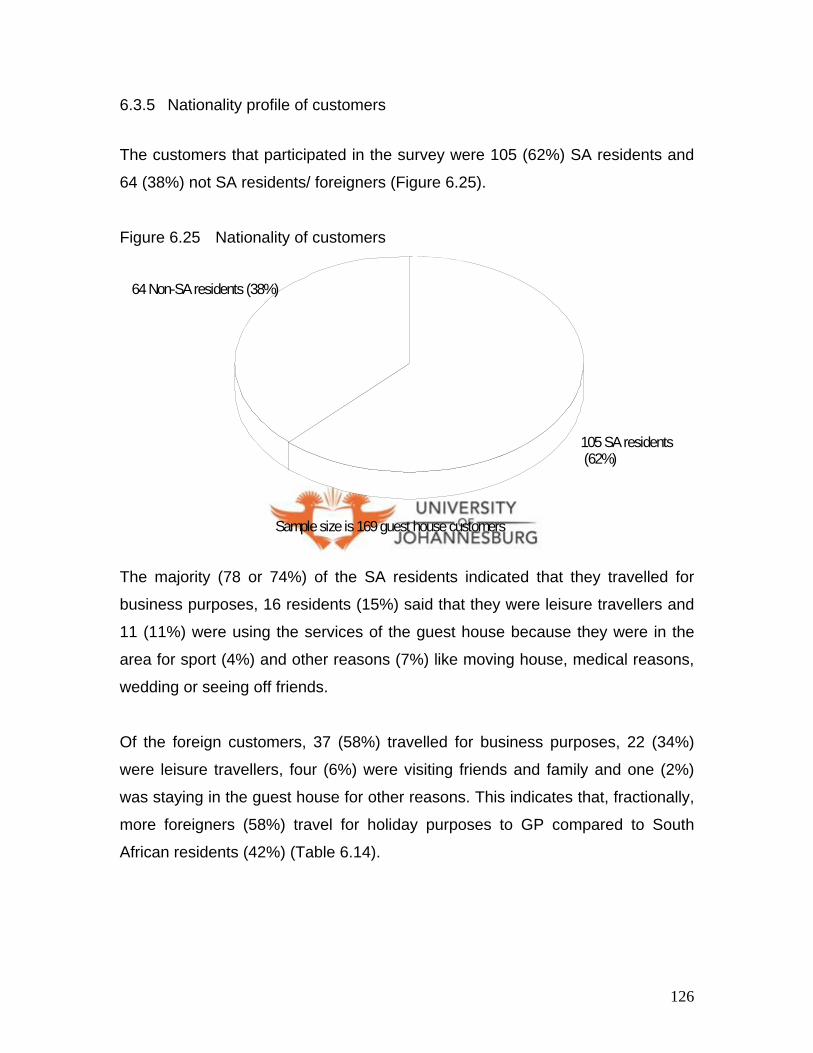
126
6.3.5 Nationality profile of customers
The customers that participated in the survey were 105 (62%) SA residents and
64 (38%) not SA residents/ foreigners (Figure 6.25).
Figure 6.25 Nationality of customers
The majority (78 or 74%) of the SA residents indicated that they travelled for
business purposes, 16 residents (15%) said that they were leisure travellers and
11 (11%) were using the services of the guest house because they were in the
area for sport (4%) and other reasons (7%) like moving house, medical reasons,
wedding or seeing off friends.
Of the foreign customers, 37 (58%) travelled for business purposes, 22 (34%)
were leisure travellers, four (6%) were visiting friends and family and one (2%)
was staying in the guest house for other reasons. This indicates that, fractionally,
more foreigners (58%) travel for holiday purposes to GP compared to South
African residents (42%) (Table 6.14).
Sample size is 169 guest house customers
105 SA residents (62%)
64 Non-SA residents (38%)
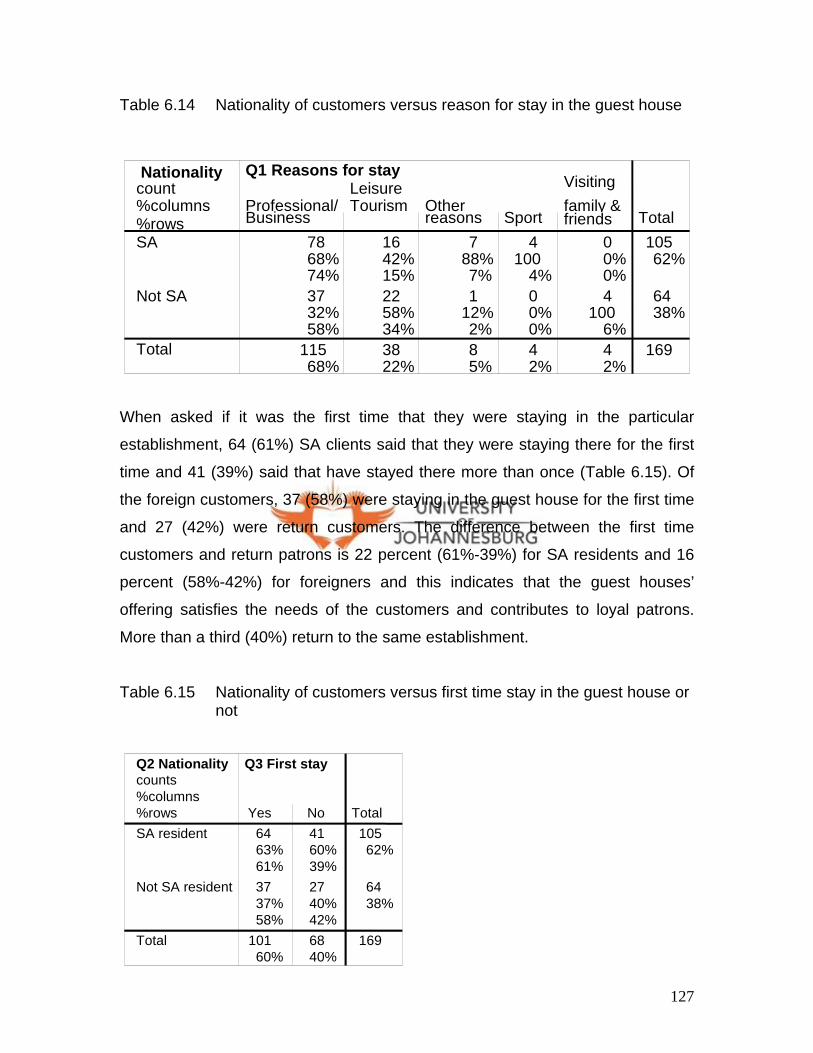
127
Table 6.14 Nationality of customers versus reason for stay in the guest house
When asked if it was the first time that they were staying in the particular
establishment, 64 (61%) SA clients said that they were staying there for the first
time and 41 (39%) said that have stayed there more than once (Table 6.15). Of
the foreign customers, 37 (58%) were staying in the guest house for the first time
and 27 (42%) were return customers. The difference between the first time
customers and return patrons is 22 percent (61%-39%) for SA residents and 16
percent (58%-42%) for foreigners and this indicates that the guest houses’
offering satisfies the needs of the customers and contributes to loyal patrons.
More than a third (40%) return to the same establishment.
Table 6.15 Nationality of customers versus first time stay in the guest house or not
Nationality count%columns %rows SA
Not SA
Total
Q1 Reasons for stay
Professional/Business
78 68%74%37 32%58%
115 68%
LeisureTourism
1642%15%2258%34%3822%
Otherreasons
788%7%1
12%2%85%
Sport 4
1004%00%0%42%
Visiting family & friends
0 0% 0% 4
1006% 4 2%
Total 10562%
6438%
169
Q2 Nationality counts %columns %rows SA resident
Not SA resident
Total
Q3 First stay
Yes 64 63% 61% 37 37% 58%
101 60%
No 41 60% 39% 27 40% 42% 68 40%
Total105 62%
64 38%
169

128
The customers who had stayed in the particular establishment before were asked
how many times they had visited it (Table 6.16). The results were as follows:
• 27 percent of return customers had stayed one to five times, of which 29 were
SA residents and 17 foreigners;
• 8 percent had stayed six to ten times in the particular guest house, of which
ten were SA residents and three foreigners; and
• 6 percent had stayed 11 and more times, of which three were SA residents
and seven foreigners.
Table 6.16 Number of times stayed in guest house versus nationality of customers
NV* stands for respondents who have not given any response to the question (No Value)
The good service of the guest house managers is reflected in the ways that the
customers heard about the establishments. The three main sources of
information about guest houses were the Internet, friends and a company and
these are reflected in Table 6.17. The customers were given several options in
Q4 Times stayed counts % columns % rows NV*
1..5
6..10
11..119
Total
Q2 Nationality
SA resident
63 60% 63% 29 28% 63% 10 10% 77%
3 3%
30% 105
62%
Not SAresident
3758%37%1727%37%
35%
23%7
11%70%6438%
Total100
59%
4627%
138%
106%
169

129
the questionnaire of sources of information about the guest house. They could
also add other than the given sources and company was one of those sources.
However, customers did not explain what they meant by company, therefore the
researcher assumed that they were referred by the company they work for.
For the SA visitors the Internet is the most important source of information with
28 respondents’ counts (27%). Information supplied by a friend is the second
most important source with 27 respondents’ counts (26%) and information
provided by their company is in third place with 25 respondents’ counts (24%).
The three sources of information are almost of equal importance for SA
customers.
With respect to foreign visitors, information supplied by a friend (21 or 33%) is
used more than information obtained from the Internet (16 or 25%) and a
company (13 or 20%). Information readily available on the Internet plus word of
mouth are two sources of information about guest houses that clearly play a very
important role when communicating with prospective customers. Even though
management reported that they work in alliance with other guest houses, very
few customers confirmed this. Only two percent (Table 6.17) of customers
reported that they were referred to the establishment by another guest house.

130
Table 6.17 How customers heard of particular guest house versus nationality of customers
It is interesting to compare this information with that supplied by managers of
guest houses. They have indicated the marketing media most frequently used to
advertise their establishments are the Internet, dedicated publications and
distribution of pamphlets (Figure 6.13). They are definitely reaching their
customers through the Internet. The distribution of pamphlets could be
considered successful if it is assumed that they are distributing them through
Q 5 H o w h eard coun ts % colum ns % row s F rom a friend
F rom a m agazine
In te rne t
O thers sources o f in fo rm ation
C om pany
O ther peop le
S ign board
P ub lica tions
A gent
R eferra l - o ther gues t house
T ota l
Q 2 N atio n ality
S A res iden t
27 26%56%
4 4%
100%
28 27%64%
1 1%
100%
25 24%66%
8 8%
57%
7 7%
88%
3 3%
75%
0 0%0%
2 2%
67%
105 62%
N ot S Ares iden t
2133%44%
00%0%
1625%36%
00%0%
1320%34%
69%
43%
12%
12%
12%
25%
58%
100%
12%
33%
6438%
T ota l
4828%
42%
4426%
11%
3822%
148%
85%
42%
53%
32%
169

131
companies. Publications on the other hand, seem to play an insignificant role.
Only four customers had read about the guest house of their choice in
publications. Therefore, guest houses are not reaching many customers through
publications. Word of mouth advertising however, proves to be the most effective
way of advertising, as 48 (28%) customers have selected a friend as a source of
information, 14 (8%) have selected other people, five (3%) have selected an
agent and three (2%) have selected referrals from other guest houses. These
figures indicate that 41 percent of all customers have selected the guest house
based on referral by someone else.
Customers were asked to identify which aspects or characteristics of the service
they considered to be the most important and were given options from which to
choose (Table 6.18). The characteristics of service that SA and foreign
customers have chosen as the most important in a guest house are friendly and
polite staff (SA customers – 47%, non-SA residents – 44%) and efficient service
(SA customers 44%, not-SA residents – 28%). Even though the other
characteristics were not considered as very important, it is interesting to note that
more foreign customers find helpful staff (63%) and ability of staff to suggest
additional services and information (71%) important, as compared to SA
customers (37% and 29% respectively).
Table 6.18 Nationality of customers versus most important aspects/
characteristics of service
Q2 Nationality counts %columns %rows SA resident
Not SA resident
Total
Q7 Service most Important Friendly and polite staff
49 64% 47% 28 36% 44% 77 46%
Helpful staff
7 37% 7%
12 63% 19% 19 11%
Efficient service
46 72% 44% 18 28% 28% 64 38%
Sympathetic handling ofcomplaints
150% 1% 1
50% 2% 21%
Ability of staff to suggest additionalservices and...
2 29% 2% 5
71% 8% 7 4%

132
When asked to indicate the characteristics of the guest house that customers find
most important, the SA customers stated the following (Table 6.19):
• Safety and security 25 (24%);
• Satisfies needs 24 (23%);
• Location 21 (20%) and
• Value for money 19 (18%).
Foreigners indicated that for them the most important are:
• Safety and security 25 (39%);
• Value for money 11 (17%);
• Satisfies needs 8 (12%); and
• Location 8 (12%).
Table 6.19 Nationality of customers versus most important aspects/
characteristics of the guest house
Safety and security, therefore, proves to be the main concern for travellers to GP.
Considering that foreigners have indicated that value for money is the second
Q2 Nationality counts %columns %rows SA resident
Not SA resident
Total
Q9 gh- most important
Location 21 72% 20% 8
28% 12% 29 17%
Safetyandsecurity
2550%24%2550%39%5030%
Satisfiesyour needs
2475%23%8
25%12%3219%
Suits yourpersonality
660%6%4
40%6%
106%
Suits your lifestyle
8 57% 8% 6
43% 9%
14 8%
Qualityof meals
250%2%2
50%3%42%
Valueformoney
1963%18%1137%17%3018%

133
most important characteristic of the guest house and the fact that 37.9 percent of
all customers are foreigners, it could be assumed that foreigners perceive that
guest houses in SA offer value for money. It must also be taken into
consideration that many foreigners are holidaymakers who pay for their own
accommodation, which might not be the same for most of SA residents of the
sample, who travel for business purposes and their expenses are carried by their
organisations.
In terms of what characteristics of the atmosphere customers consider as most
important, 72 percent of all customers have stated that a homely environment is
the most important, followed by effective layout; easy entry/ exit (21%). It
appears that staff appearances and décor play an insignificant role (2% and 5%
respectively) in creating an atmosphere (Table 6.20).
Table 6.20 Nationality of customers versus most important aspects/
characteristics of the atmosphere
When asked which characteristic of the room customers consider to be the most
important, comfort (44%) and cleanliness (43%) appear to have the highest
importance to visitors, regardless of the customers’ nationality. Size of the room
and equipment have scored very low – seven percent and one percent
respectively, which means that customers do not see them as very important.
Nationality counts %column%rows SA
Not SA
Total
Q11 Atmosphere Effective lay out; easyentry/ exit
27 77% 26% 8
23% 12% 35 21%
Decor
788%7%1
12%2%85%
Homely environment
6957%66%5343%83%
12272%
Staffappearance
250%2%2
50%3%42%
Total 105 62%
64 38%
169

134
These two characteristics could also be reclassified because they could
contribute to the category comfort. It is surprising that quietness has only scored
eight percent and that not many business people regard it as important (Table
6.21).
Table 6.21 Nationality of customers versus most important aspects/
characteristics of the room
The predominant age group for both SA clients and foreigners that participated in
the study is 35-49 years old with 35 percent and 38 percent respectively (Table
6.22). For SA customers the second largest group is between 25-34 years of age
with 29 counts (28%) and the third is between 50-64 years old with 23 counts
(22%).
Table 6.22 Nationality of customers versus age group
Q2 Nationality counts %columns %rows SA resident
Not SA resident
Total
Q13 important-room
Cleanliness 48 66% 46% 25 34% 39% 73 43%
Comfort
4662%44%
2838%44%
7444%
Quietness
750%
7%
750%11%
148%
Equipment
1100%
1%
00%0%
11%
Size of the room
3 43%
3% 4
57% 6% 7 4%
Total
10562%
6438%
169
Q2 Nationality counts %columns %rows SA residents
Not SA residents
Total
Q17 Age group 16-24 years old
11 61% 10% 7
39% 11% 18 11%
25-34 years old
29 72% 28% 11 28% 17% 40 24%
35-49 years old
37 61% 35% 24 39% 38% 61 36%
50-64 years old
23 56% 22% 18 44% 28% 41 24%
65+ years old
5 56% 5% 4
44% 6% 9 5%
Total 105 62%
64 38%
169

135
For foreign customers the second biggest group is 50-64 years old with 18
counts (28%). This figure could be explained with the fact that more foreigners
than South Africans come for leisure purposes to GP as it was established earlier
in this chapter (Table 6.14). This age group is generally people whose children
have left home, therefore they have more time and funds to spend on leisure
activities. The third largest group is 25-34 years old with 11 representatives
(17%).
6.3.6 Business versus leisure profile
The business and leisure customer profile is examined below as these two
groups represent the majority of the guest house customers. According to Figure
6.26, 115 (68%) customers have indicated that they are staying in the guest
house for business reasons, 38 (22.5%) for leisure and 16 (9.5%) for other
reasons, sport or visiting family and friends.
Figure 6.26 Reasons for stay in the guest house
115
38
84 4
0
20
40
60
80
100
120
Professional/Business
Leisure/Tourism
Other reasons. Sport Visiting family& friends
Q1 Reasons for stay
Freq
uenc
y

136
The business customers consist of 78 SA residents (68%) and 37 foreigners
(32%). The leisure customers consist of 16 SA residents (42%) and 22 (58%)
foreigners (Table 6.23). This means that more business customers are SA
residents and more leisure customers are foreigners. For the purpose of this
profile the figures compared are for business customers and leisure customers
only.
Table 6.23 Reasons for stay in the guest house versus nationality of customers
It has been noted that generally the business travellers are the biggest customer
group in the guest house sector in GP, regardless of whether the establishment
is fairly new or well-established (Table 6.24). However, it appears that leisure
travellers frequent well-established guest houses as 71 percent of all leisure
respondents were accommodated in such establishments. Business travellers
however seem to be almost evenly distributed among fairly new establishments
(47%) and well-established guest houses (53%).
Q1 Reasons for stay counts %columns %rows
Professional/ Business
Leisure/ Tourism
Other reasons
Sport
Visiting family & friends
Total
Q2 Nationality
SA resident
78 74% 68%
16 15% 42%
7 7%
88%
4 4%
100%
0 0% 0%
105 62%
Not SA resident
37 58% 32%
22 34% 58%
1 2%
12%
0 0% 0%
4 6%
100%
64 38%
Total
115 68%
38 22%
8 5%
4 2%
4 2%
169

137
Table 6.24 Years of operation of guest house versus reason for stay in the the guest house
When asked how did they come to hear about the particular guest house the
business travellers said:
• 37 (32%) heard about it from their company;
• 30 (26%) found it on the Internet;
• 22 (19%) heard about it from a friend;
• ten (9%) heard from other people;
• six (5%) saw the guest house advertised on a sign board;
• four (3%) read about it in publications/ magazine ;
• three (3%) were told by an agent; and
• three (3%) were referred by other guest houses.
The leisure travellers responded as follows:
• 16 (42%) heard about the guest house from a friend;
• 11 (29%) found it on the Internet;
• three (8%) heard about it from other people;
• three (8%) read about it in a magazine;
• two (5%) were told by an agent;
Q1 How long counts %columns %rows Up to 4 years
5 years and more
Total
Q1 Reasons for stay
Professional/ Business
54 47%82%61 53%59%
115 68%
Leisure/Tourism
1129%17%2771%26%3822%
Otherreasons
112%2%7
88%7%85%
Sport00%0%4
100%4%42%
Visiting family & friends
0 0% 0% 4
100% 4% 4 2%
Total6639%
10361%
169
138
• one (3%) heard about it from a company;
• one (3%) used other sources of information; and
• one (3%) saw the guest house advertised on a sign board.
Therefore the three main sources of information are friends, the Internet and
companies. It is interesting to note in Table 6.25, that many more business
customers became aware of the particular guest house from the Internet (68%) in
comparison to only 25 percent leisure customers. More business customers
(71%) have indicated that other people are a source of information in comparison
to 21 percent leisure customers. Also, 75 percent of business travellers read
about the establishment in publications in comparison to zero percent leisure
tourists and 60 percent business customers obtained information from an agent
compared to 40 percent leisure customers. It seems that guest house owners are
reaching their customers mostly by word of mouth, the Internet and companies.
Publications prove to be a source of information for business customers,
however, it is still a weak source of information, as was established in section
6.3.1, because only three business travellers (75%) listed it.
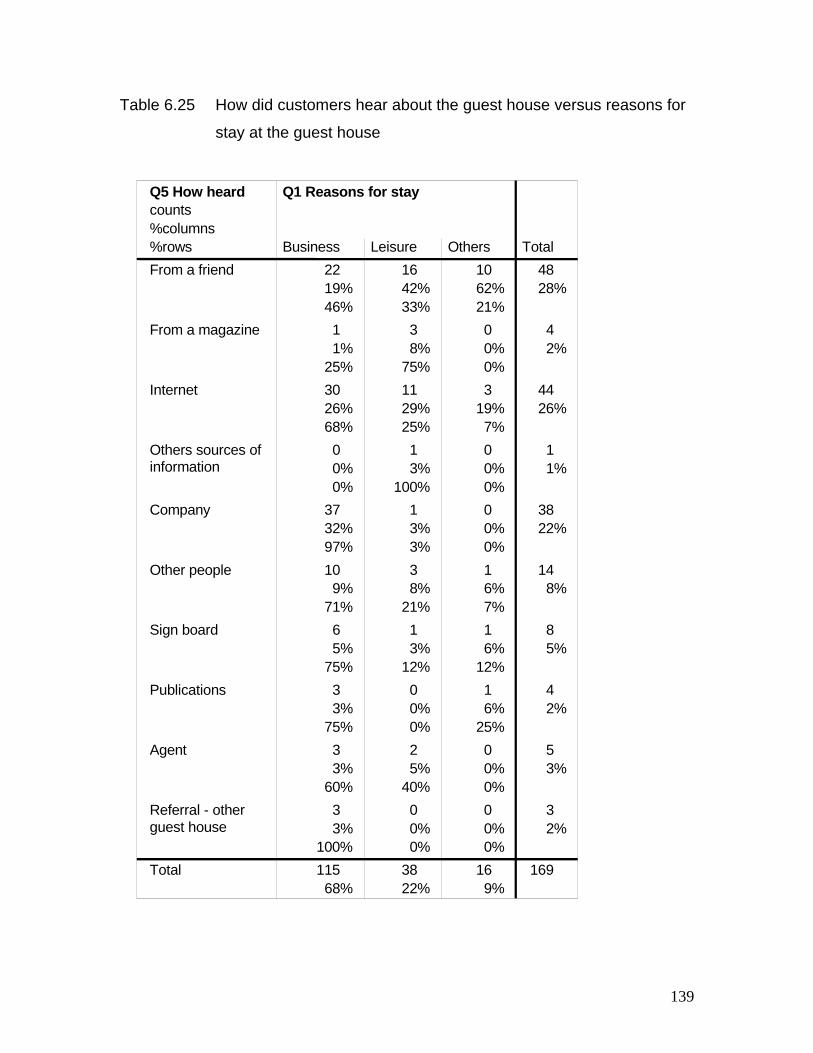
139
Table 6.25 How did customers hear about the guest house versus reasons for
stay at the guest house
Q5 How heard counts %columns %rows
From a friend
From a magazine
Internet
Others sources of information
Company
Other people
Sign board
Publications
Agent
Referral - other guest house
Total
Q1 Reasons for stay
Business
22 19% 46%
1 1%
25%
30 26% 68%
0 0% 0%
37 32% 97%
10 9%
71%
6 5%
75%
3 3%
75%
3 3%
60%
3 3%
100%
115 68%
Leisure
16 42% 33%
3 8%
75%
11 29% 25%
1 3%
100%
1 3% 3%
3 8%
21%
1 3%
12%
0 0% 0%
2 5%
40%
0 0% 0%
38 22%
Others
10 62% 21%
0 0% 0%
3 19% 7%
0 0% 0%
0 0% 0%
1 6% 7%
1 6%
12%
1 6%
25%
0 0% 0%
0 0% 0%
16 9%
Total 48 28%
4 2%
44 26%
1 1%
38 22%
14 8%
8 5%
4 2%
5 3%
3 2%
169

140
The characteristics of service that both business and leisure customers find most
important for the guest houses are: in the first place, friendly and polite staff with
52 responses (45%) for business and 16 (42%) for leisure customers and in
second place, efficient service with 45 (39%) for business and 14 (37%) for
leisure customers. The other services namely sympathetic handling of complaints
and ability to suggest additional services and information have not been selected
by customers as very important, as 7 customers (4%) and 2 customers (1%)
respectively chose these options. Helpful staff, was considered by only 18
percent of leisure and only 9% of business customers as important (Table 6.26).
Table 6.26 Reason for stay in a guest houses versus most important aspects/
characteristics of service
Safety and security have been identified as the most important characteristic of
the guest house by both business and leisure customers (Table 6.27). The
business travellers rate the characteristics in order of importance as follows:
• Safety and security with 34 responses (30%);
• Location with 23 responses (20%);
Q1 Reasons for stay counts %columns %rows Business
Leisure
Others
Total
Q7 Service most ImportantFriendly and politestaff
5268%45%1621%42%9
12%56%7746%
Helpfulstaff
1053%9%7
37%18%2
11%12%1911%
Efficientservice
4570%39%1422%37%58%
31%6438%
Sympathetic handling ofcomplaints
1 50% 1% 1
50% 3% 0 0% 0% 2 1%
Ability of staff tosuggest additionalservices and...
7100%
6%00%0%00%0%74%

141
• Satisfy needs with 20 responses (17%);
• Value for money with 19 responses (17%);
• Suits your personality with eight responses (7%);
• Suits your lifestyle with seven responses (6%); and
• Quality of meals with four responses (3%).
Leisure customers rate the most important characteristics of the guest house in
order of preferences as follows:
• Safety and security with 12 responses (32%);
• Value for money with 11 responses (29%);
• Suit your lifestyle with 7 responses (18%);
• Location and satisfy your needs with 3 responses (8%) each;
• Suits your personality with 2 (5%).
It is interesting to note that characteristics such as: suits your personality, suit
your lifestyle and quality of meals do not seem to be very important.
Table 6.27 Reason for stay in the guest house versus most important aspects/
characteristics of the guest house
Q1 Reasons for stay counts %columns %rows Business
Leisure
Others
Total
Q9 gh- most important
Location 23 79% 20% 3
10% 8% 3
10% 19% 29 17%
Safetyandsecurity
3468%30%1224%32%48%
25%5030%
Satisfiesyour needs
2062%17%39%8%9
28%56%3219%
Suits yourpersonality
880%7%2
20%5%00%0%
106%
Suits your lifestyle
7 50% 6% 7
50% 18% 0 0% 0%
14 8%
Quality of meals
4 100%
3%0 0%0%0 0%0%4 2%
Valueformoney
1963%17%1137%29%00%0%
3018%

142
In Table 6.28 it can be seen that the most important characteristic of the
atmosphere of a guest house is indisputably the homely environment (72%).
Business customers rate it in first place with 77 responses (67%). In second
place they put effective layout; easy entry/ exit with 31 (27%). Décor and staff
appearance do not seem to be very important, as they have scored only 6 (5%)
and 1 (1%) responses.
Leisure customers also rank a homely environment as the most important
characteristic with 32 responses (84%). The other six responses (16%) are
equally distributed between effective layout; easy entry/ exit and staff
appearance. It is interesting to note that décor is of no importance to leisure
customers as no leisure customer (0%) has chosen this option.
Table 6.28 Reason for stay in the guest house versus most important
aspects/ characteristics of atmosphere
With respect to important characteristics in the room, 44 percent of business
travellers and 45 percent of leisure travellers rated cleanliness and comfort as
most important characteristics in the room. Quietness, equipment and size of the
Q1 Reasons for counts %column%rows Busines
Leisure
Other
Total
Q11 Atmosphere Effective lay out; entry/ exit
3189%27%39%8%13%6%
3521%
Decor6
75%5%00%0%2
25%12%85%
Homely environment
7763%67%3226%84%1311%81%
12272%
Staffappearance
1 25% 1% 3
75% 8% 0 0% 0% 4 2%
Total115 68%
38 22%
16 9%
169

143
room received low scores (8%, 1% and 4% respectively), and are not considered
as important (Table 6.29).
Table 6.29 Reasons for stay in the guest house versus most important
aspects/ characteristics of the room
The majority of business travellers (42%) are between the ages of 35-49 years
old and the majority of leisure tourists (37%) are between 50-64 years of age
(Table 6.30).
Table 6.30 Reason for stay in the guest houses versus age group
Q1 Reasons for staycounts %columns %rows Business
Leisure
Others
Total
Q13 important-room
Cleanliness 51 70%44%
17 23%45%
5 7%
31%
73 43%
Comfort
5169%44%
1723%45%
68%
38%
7444%
Quietness
964%
8%
214%
5%
321%19%
148%
Equipment
1100%
1%
00%0%
00%0%
11%
Size of the room
3 43%
3% 2
29% 5% 2
29% 12%
7 4%
Total
11568%
3822%
169%
169
Q1 Reasons for stay counts %columns %rows Business
Leisure
Others
Total
Q17 Age group 16-24 years old
11 61% 10%
7 39% 18%
0 0% 0%
18 11%
25-34 years old
32 80% 28%
7 18% 18%
1 2% 6%
40 24%
35-49 years old
48 79% 42%
8 13% 21%
5 8%
31% 61 36%
50-64 years old
22 54% 19% 14 34% 37%
5 12% 31% 41 24%
65+ years old
2 22%
2% 2
22% 5% 5
56% 31%
9 5%
Total 115
68%
38 22%
16 9%
169
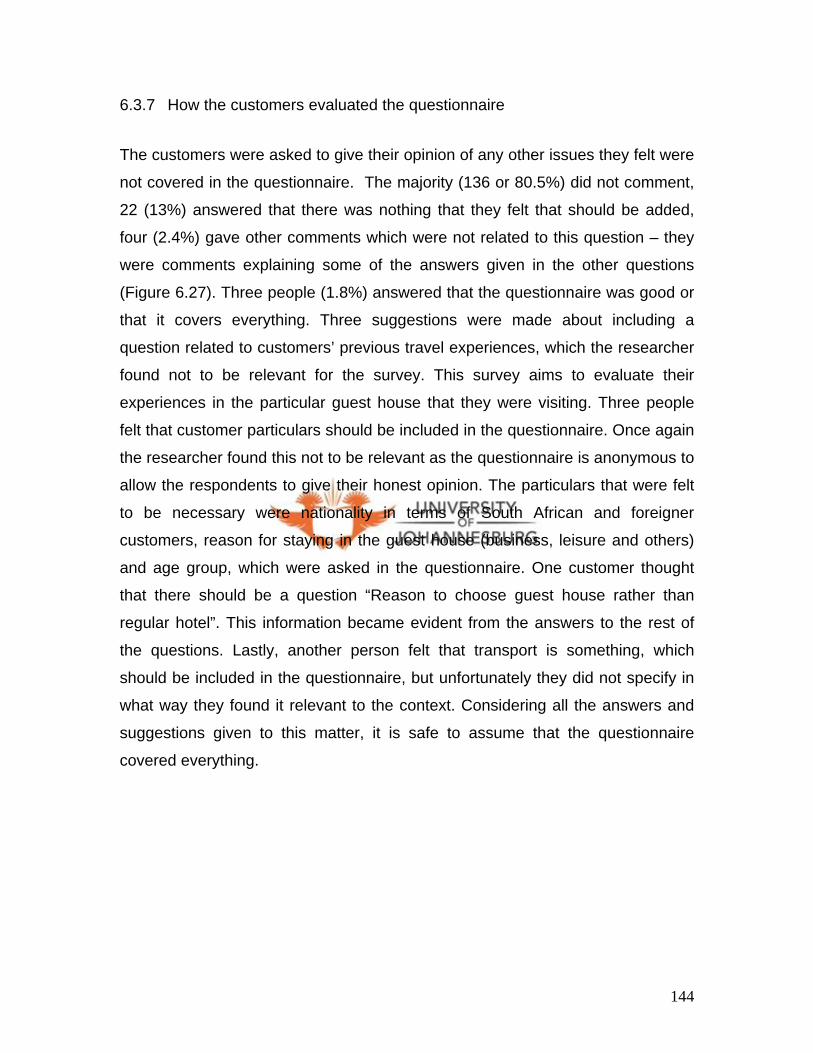
144
6.3.7 How the customers evaluated the questionnaire
The customers were asked to give their opinion of any other issues they felt were
not covered in the questionnaire. The majority (136 or 80.5%) did not comment,
22 (13%) answered that there was nothing that they felt that should be added,
four (2.4%) gave other comments which were not related to this question – they
were comments explaining some of the answers given in the other questions
(Figure 6.27). Three people (1.8%) answered that the questionnaire was good or
that it covers everything. Three suggestions were made about including a
question related to customers’ previous travel experiences, which the researcher
found not to be relevant for the survey. This survey aims to evaluate their
experiences in the particular guest house that they were visiting. Three people
felt that customer particulars should be included in the questionnaire. Once again
the researcher found this not to be relevant as the questionnaire is anonymous to
allow the respondents to give their honest opinion. The particulars that were felt
to be necessary were nationality in terms of South African and foreigner
customers, reason for staying in the guest house (business, leisure and others)
and age group, which were asked in the questionnaire. One customer thought
that there should be a question “Reason to choose guest house rather than
regular hotel”. This information became evident from the answers to the rest of
the questions. Lastly, another person felt that transport is something, which
should be included in the questionnaire, but unfortunately they did not specify in
what way they found it relevant to the context. Considering all the answers and
suggestions given to this matter, it is safe to assume that the questionnaire
covered everything.
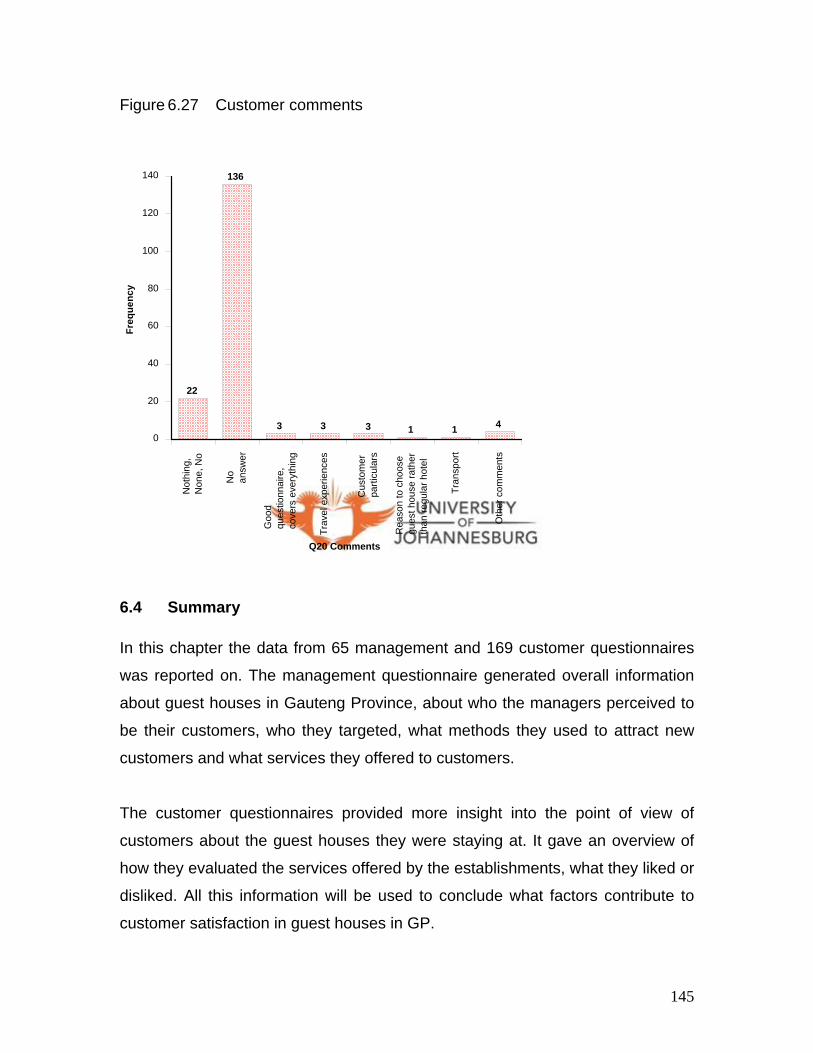
145
Figure 6.27 Customer comments
6.4 Summary In this chapter the data from 65 management and 169 customer questionnaires
was reported on. The management questionnaire generated overall information
about guest houses in Gauteng Province, about who the managers perceived to
be their customers, who they targeted, what methods they used to attract new
customers and what services they offered to customers.
The customer questionnaires provided more insight into the point of view of
customers about the guest houses they were staying at. It gave an overview of
how they evaluated the services offered by the establishments, what they liked or
disliked. All this information will be used to conclude what factors contribute to
customer satisfaction in guest houses in GP.
22
136
3 3 3 1 1 40
20
40
60
80
100
120
140N
othi
ng,
Non
e, N
o
No
answ
er
Goo
d qu
estio
nnai
re,
cove
rs e
very
thin
g
Trav
el e
xper
ienc
es
Cus
tom
erpa
rticu
lars
Rea
son
to c
hoos
egu
est h
ouse
rath
erth
an re
gula
r hot
el
Tran
spor
t
Oth
er c
omm
ents
Q20 Comments
Freq
uenc
y
146
7. SUMMARY OF FINDINGS, CONCLUSIONS AND RECOMMENDATIONS
7.1 Introduction In this final chapter, a summary of the findings from the primary data collected
from the questionnaires integrated with the literature study is presented. The
primary data was obtained with the purpose of analysing the quality offered at
guest houses and establishing what attracts customers to guest houses, what
are their needs, what is the significance of customer satisfaction and what should
be done to ensure customer satisfaction. The collected information is divided into
summary of findings from the management questionnaires which provides the
feedback received by guest house owners/ managers and summary of findings
from the customer questionnaires which provides the responses by the
customers. The final conclusions are then made based on the primary and
secondary data collected during the research. Chapter 7 forms a document,
which will be electronically distributed to all guest houses that participated in the
study.
7.2 Summary of findings from management questionnaires
During the survey, 99 management questionnaires were given to guest house
owners/ managers. However, not all guest house owners were willing or able to
participate, and only 65 completed questionnaires were returned. The guest
houses that participated in the study could be divided in two groups – well-
established guest houses and fairly new establishments. The establishments that
were in operation for five years and more were classified as well-established
guest houses and they were in the majority (63%). The guest houses that
existed for four years and less (27%) were classified as fairly new
establishments.
Over half of the establishments charge prices ranging from R226 to R350 for a
single person with breakfast. Thirty percent could be considered more expensive
147
as their prices vary between R351 and R950 and only 17 percent have rates
ranging between R100 and R225.
From the data it has become apparent that 72 percent of all the establishments
that participated in the study employ only one to five staff members. The
advantages of having fewer staff members are firstly keeping the expenses low,
and secondly, if there are few staff they are likely to have contact with the guests
and get to know them better. That could result in improved service and a homely
environment, provided that the staff members receive customer care training.
Additionally, owners considered their staff turnover to be predominantly low. This
could indicate that because there are fewer staff members on the premises, they
have a better opportunity to receive appropriate training from management and
thus perform well. Good performance from staff contributes to customer
satisfaction. People like to work for companies, whose customers are happy and
loyal and they end up working for a company longer, therefore contributing to a
low staff turnover (Zeithaml & Bitner, 2003: 162). The creation of memorable
experiences where both staff and customers are satisfied leads to return visits
and improved return on investment.
The data collected revealed a relationship between the number of staff and
number of managers employed in a guest houses. Most establishments that
have up to five employees, have one manager and most establishments that
have five and more employees, have two managers. It has also been noted that
of the guest houses that employ more than five members of staff, the well
established ones are in the majority.
The majority of guest houses (86%) in the sample work in alliance with other
guest houses. Their profitability does not seem to be affected by whether they
work in alliance with other establishments or not. It was established that both
guest houses who work in alliance and on their own run successful operations.
This could be said only for the respondents of the chosen sample and whether all

148
guest houses that operate on their own are successful is difficult to assess. The
number of guest houses in the sample that work on their own is too small to
claim that that is generally the case. Theoretically, it is considered that by
working in alliance with other establishments, more customers get referred to and
get to know about the guest house. Ultimately this would lead to increased sales,
provided the guest house satisfies its customers’ needs, and it would contribute
positively to profitability. It would also help to reduce marketing costs.
In general, more than half of the establishments operate at a profit and only five
percent operate at a loss. The others break even. Most well-established guest
houses make a profit and none run at a loss. Most of the fairly new
establishments break even. However, one can assume that the financial success
or stability are not necessarily applicable to all guest houses as one considers
the number of guest house mangers who were not willing to participate in the
study or the establishments that were no longer in operation (paragraph 5.8). The
more successful ones would be inclined to let their customers evaluate their
performance for inclusion in an academic study.
It is interesting to note that the majority of fairly new and well-established guest
houses charge bed and breakfast single rates ranging between R226 and R950.
It has also become apparent that more of the well-established guest houses
charge lower rates when compared to the prices asked by fairly new guest
houses. This means that even though fairly new guest houses charge higher
rates, their profitability is less and that is why most of them are breaking even.
This could be attributed to the fact that they initially have more fixed costs, such
as a bond on the property and also expenses related to establishing a new
business. They may also aim at the wrong target market, be less well known, or
have fewer repeat customers, so their occupation rate is lower. On the other
hand, the older establishments have already established their operations, their
expenses per visitor are less and they seem to be more financially secure and
profitable.

149
The months during which the guest houses experience the highest demand are
March, August, September and October. These months do not really coincide
with the school holidays, which confirms that not many people visit the guest
houses in GP for leisure, but rather for business purposes. The guest houses in
GP are less frequented during the months of December and January, which are
months of festivities and associated with travelling for leisure purposes.
In terms of occupancy rates, most managers experienced a weekly occupancy
percentage ranging from 61 to 100 during the high demand season, and a 21 to
40 percent weekly occupancy, during the low demand season. This means that
guest houses are seldom empty, which underpins their reported financial
success.
From the data collected it would appear that business travellers make an
important contribution to the income of guest houses in GP. The majority of guest
house owners have stated that their customers are business travellers or a
combination of both business and leisure travellers. None of them have stated
that their establishment caters only for leisure travellers. Once again, it confirms
that people that stay at guest houses in GP are mainly business travellers and
not so much leisure travellers. Most of the guest houses owners stated that they
cater for both SA residents and foreigners, which means that not only South
African travellers make use of the services of guest houses, but also foreign
travellers who come to GP for business and leisure.
The majority of guest house owners have stated that they offer additional
services to their customers like PC sockets, modem sockets, Internet/ e-mail,
typing services, fax, phone and so forth. All the establishments offer breakfast
and some offer lunch and dinner. The menu is mostly pre-arranged with guests
individually or there is a set menu for each day of the week. The quality of meals
was not considered by customers as an important characteristic of the guest
house, but nevertheless, most customers were delighted with the quality of meals
150
they received. These services represent the supporting and/ or facilitating
products of the guest house offering. There is no clear distinction between the
supporting and facilitating products, because they depend on how customers
perceive them. Generally, the supporting and facilitating products create a
differential advantage between one service offering and another. However, the
customers of the guest houses in GP, have not rated the characteristics of these
products as very important, therefore it could be assumed that they are not the
main differentiators of the guest house offering.
The guest house owners have indicated that the most popular means of
communicating with prospective customers in order to advertise their
establishments, are via the Internet, dedicated publications and via distributing
pamphlets. When comparing this information with the responses of customers to
the question how they heard about the particular establishment, interesting
findings have been noted. For customers, the most important sources of
information are a friend, the Internet and company. This means that guest
houses are reaching their patrons through the Internet. The Internet is a tool
used for direct marketing. It is cost-effective, based on knowledge of customers
and, as it proves for guest houses, it provides a direct successful communication.
The distribution of pamphlets could be considered successful if it is assumed that
they are distributed through companies. Publications on the other hand seem to
play an insignificant role, as only four business travellers indicated that they have
read about the guest house of their choice in a publication. Word of mouth
proves to be the most effective way of advertising as 41 percent of all customers
have selected a guest house, based on the referral by someone else. This
confirms that customers rely on referrals by other people, because the referrals
lessen the risk of purchasing a service offering that the customer has not yet
experienced.
The majority of guest house owners pointed out that most of their patrons return
to their establishments. To verify the response of management, customers were

151
asked how many of them have stayed in the same guest house previously and
40 percent stated that they are return patrons. This figure does not represent the
majority, however, it indicates that these customers were satisfied with the
services of the guest houses. Additionally 98.8 percent of customers have
indicated that they would return to the particular establishment, therefore there is
further indication that the guest house offering meets the needs of its customers.
7.3 Summary of findings from customer questionnaires
During the survey 177 customer questionnaires were completed by the guests of
the guest houses, of which, 169 were used for the purpose of analysis. The
responses were organised into information of how customers perceive the guest
houses, followed by two customer profiles. The first profile is according to the
residency of customers, done by drawing a comparison between the responses
of SA residents and foreigners. The second profile is according to purpose of visit
and a comparison is made between the answers of business travellers and
leisure travellers.
7.3.1 How customers perceive the guest houses
For the purpose of analysing how customers perceive the guest houses, they
were asked to rate the guest house offering under several topics, namely the
service, the guest house, the atmosphere, the room and the overall experience.
Customers have rated friendly and polite staff as the most important
characteristic of service, followed by efficient service. Helpful staff, ability of staff
to suggest additional services and information and sympathetic handling of
complaints have not been considered very important. When asked to rate the
services of the particular guest house they were staying at, the majority of
customers responded that the experience they had at the establishment
exceeded their expectations, which means that they were more than satisfied
with the services offered.

152
From the characteristics of the guest house in general, safety and security had
the highest importance for customers, followed by satisfy your needs, value for
money, location, suits your lifestyle, suits your personality and quality of meals.
When evaluating their experiences of the guest house against their expectation,
the majority of customers stated that location, safety and security and suits your
lifestyle have met their expectations, but satisfy your needs, quality of meals and
value for money exceeded their expectations.
Homely environment proves to be the most important characteristic of the
atmosphere for patrons. The majority of the respondents stated that their
experience of the homely environment exceeded their expectations, which
means that they were delighted with the experience they received. The homely
environment is part of the augmented product of the guest house and combines
what is offered and how it is offered. The other characteristics, such as effective
lay out; easy entry/ exit, décor and staff appearance, which could be classified as
the supporting and facilitating products (or tangible), were not considered by
customers as important. However, the majority of them indicated that their
experience of these characteristics met their expectations, therefore they were
satisfied. This indicates that the facilitating, supporting and augmented products
differentiate the guest house offering from other accommodation offerings. The
augmented product, however, proves to be a stronger differentiator than the
tangible product.
The most important characteristic of the room is comfort, followed by cleanliness.
They are indicators of the quality expected by guests. Quietness, size of the
room and equipment seem to have little importance to customers, and choice of
furniture seems to have no importance at all. When commenting on their
experiences, the majority of customers indicated that cleanliness and size of the
room exceeded their expectations and the rest of the characteristics met all their
expectations. One cannot neglect the aspects that customers selected as not so

153
important, because they are facilitating services that must be present for the
guests to use the core product and do not necessarily differentiate or add value.
From the responses of the customers, it appears that they were satisfied with the
offerings of the guest houses, as almost 80% percent stated that they were
totally satisfied with the whole experience they had in the particular guest house.
In addition almost all of the customers (98.8%) said that they would come back to
the establishment and (98%) would recommend it to friends and family.
In order to understand better how customers evaluate their experiences in the
guest house, they were asked what impressed them and what that they thought
should be improved. These were open questions, so customers could give their
own impressions, without having to follow specific guidelines, or to select from
given answers. A service or an experience is difficult to evaluate because of its
intangibility, non-standardisation and because of the fact that consumption is
closely intertwined with production (Zeithaml & Bitner, 2003: 36). The answers of
the customers proved that people do evaluate service on the basis of certain
criteria, which are the service quality dimensions. All the statements made by the
customers could be successfully grouped into the main dimensions:
• Reliability – ability to perform the promised service dependably and
accurately;
• Responsiveness – willingness to help customers and provide prompt service;
• Assurance – employees’ knowledge and courtesy and their ability to inspire
trust and confidence;
• Empathy – caring individualised attention given to customers and
• Tangibles – appearance of physical facilities, equipment, personnel and
written materials.
154
Customers’ responses on the question “what impressed them the most in the
guest house”, were grouped in the following way in order of importance of
responses:
• Empathy included positive comments about the owner, friendly staff, home
away from home and general comments on the personalised services
received at the guest house.
• Physical evidence (tangibles) included comments on good meals, hygiene,
ambiance and general physical evidence.
• Responsiveness included comments on the extra effort that staff and
management of the guest houses made when dealing with their guests.
• Reliability included statements about the fact that the guest house offering
was a complete package and that everything related to customers’
experiences was great.
• Assurance included the customers’ confirmation about how well organised the
guest houses are, how there is attention to detail and courtesy.
The customers also suggested some improvements to the offering of the guest
houses. It is interesting to note that even though customers did not consider
décor, equipment and size of room as very important in the structured questions,
most of their responses to the open ended questions could be related to Physical
evidence or Tangibles. Responses indicated that the following would improve the
offering of guest houses: a television, DSTV, heating/ cooling system, shaded
parking, references to bathroom, to room, cleanliness, meals, facilities wanted for
the guest house, services and other improvements. An emphasis should be
made on the way that equipment and furniture are arranged and the ability of
these items to facilitate consumers’ enjoyment. Physical surroundings can
155
influence customers’ decision to stay for longer or to come back to a guest
house. No references were made that could be categorised under the other four
dimensions of service quality, except the following comments: “Customer
service” and “Communication with guests” which could be categorised as
responsiveness and “Security” which falls under assurance. It should also be
mentioned that 40 percent of customers did not respond to the question, which
could be interpreted as if they considered that nothing needed to be improved in
the guest houses. Another 21 percent said that nothing should be improved.
7.3.2 South African residents versus foreigners
The customers were represented by 62 percent SA residents and 38 percent
foreigners. Most of them, regardless of nationality, were business travellers.
However, more foreign customers than SA customers have indicated that they
were leisure travellers, which means that more foreigners travel for holiday
purposes to GP than SA residents.
It seems that guest houses are succeeding in meeting the needs of their guests,
because 40 percent of patrons return to the same establishments. Word of mouth
is another indicator of how satisfied customers are with the services of a
particular guest house. Most customers have indicated that they heard about the
establishment from referrals by other people, being friends, acquaintances,
agents or other guest houses – therefore, through word of mouth. The other two
main sources of information are the Internet and the company where customers
work.
In terms of what customers consider to be an important characteristic of the
service, both SA residents and foreigners have stated that friendly and polite staff
is the most important one. This characteristic is a source for differentiating the
guest houses product from other types of accommodation. The second most
important characteristic is efficient service of the guest house. From the
characteristics of the guest house, safety and security proves to be the main

156
concern for travellers to GP, regardless of nationality. Considering that foreigners
have indicated that value for money is the second most important aspect of the
guest house and the fact that 37.9% of all customers of the sample are
foreigners, it could be assumed that foreigners perceive that guest houses in SA
offer value for money. It must also be taken into consideration that many
foreigners are holidaymakers who pay for their own accommodation. This might
not be the same for most of the SA residents in the sample. They travel mainly
for business purposes and their expenses are carried by their organisations. SA
residents have ranked the second most important characteristic of the guest
house as satisfy (your) needs.
The homely environment is the most important characteristic of the atmosphere
for both national and international tourists. Customers have not regarded the
décor, staff appearance and effective layout; easy entry/ exit as very important.
When considering the characteristics of the room, the most important are comfort
and cleanliness. Quietness, equipment and size of the room, have not been
regarded as important.
The predominant age group of customers that frequent guest houses in GP is 35-
49 years old, who are likely to be in the parenthood stage of the life cycle
referred to in paragraph 3.3.2. For SA residents the second largest group is
between 25-34 years of age and they would represent honeymooners, or young
individuals who have recently started their career. For foreigners, the second
largest group is 50-64 years old. This could be explained by the fact that more
foreigners than South Africans, who come for leisure purposes to GP are
accommodated at guest houses. This age group is generally people whose
children have left home, therefore they tend to have more time and funds to
spend on leisure activities. This age group represents the post parenthood stage
of the life cycle. The third largest group is 25-34 years old.

157
7.3.3 Business versus leisure profile
From the data collected, a profile comparing business and leisure customers was
developed. The reason for this is that these two types of customers represent the
majority of customers of guest houses in GP – 68 percent of the customers from
the sample are business travellers and 22.5 percent are leisure travellers. The
purposes of travel for the other 9.5 percent are sport, visiting family and friends
or other reasons. It was established in paragraph 7.3.2 that more business
customers who are SA residents, and more leisure visitors who are foreigners
are accommodated at guest houses in GP. In the province, in general, the
tourists are mostly holiday/ leisure tourists followed by tourists coming for
shopping, tourists visiting friends and family, tourists for business purposes and
other (South African Tourism, 2005c: 12).
It appears that leisure travellers rather frequent well-established guest houses as
71% of all leisure respondents were accommodated in such establishments.
Business travellers however seem to be almost evenly distributed among fairly
new establishments (47%) and well-established guest houses (53%). This may
indicate that guest houses start their operations by targeting business travellers,
and as they acquire more business customers, they become better known by
word of mouth. These guest houses then become frequented not only by
business travellers, but by leisure travellers as well.
In terms of the sources of information mostly used by customers to find out about
guest houses, the three most common ones for business and leisure customers
are friends, the Internet and company, with the Internet being the most popular
source used by business travellers. For both business and leisure customers,
friendly and polite staff, followed by efficient service, are the two characteristics
of the service considered as most important. They have also indicated that from
the characteristics of the guest house, safety and security are the most
important. Business customers place location in second place, which can be

158
associated with the fact that they go to a specific location because it is
convenient for business purposes. The leisure customers have placed value for
money in second place and that could be because they carry their own expenses
related to their leisure travelling. The homely environment is, once again,
considered by both business and leisure customers as the most important
characteristic of the atmosphere and comfort and cleanliness as the most
important characteristic of the room.
The majority of business travellers visiting guest houses in GP are between the
ages of 35-49 and the majority of leisure tourists are between 50-64 years of
age.
7.4 Conclusion
In Gauteng Province there are 115 guest houses and 203 Bed and Breakfast
registered establishments (City of Johannesburg, 2005). During December 2004,
and February, March, April and May 2005, 203 of these establishments were
approached to participate in a study aiming to establish what factors contribute to
customer satisfaction in guest houses in GP. At the end only 65 participated,
which represented a quarter of all registered guest houses and B&Bs in the
province. The participation of the guest houses involved completing a
questionnaire by management and another one by customers. The data from the
management questionnaires provided information of the guest houses in GP and
their management and the data from the customer questionnaires provided an
information on customer expectation of guest houses and on how they evaluate
the offering of the guest houses.
From the data collected it became evident that there were fairly new
establishments that were in operation for up to four years and there were well-
established ones that were in operation for five years and longer. The sample of
the study consisted of two thirds well-established guest houses and one third
fairly new guest houses. The term guest houses used in this document
159
represents guest houses and bed and breakfast establishments in Gauteng
Province.
The guest house product consists of three levels – core, tangible and augmented
(Middleton & Clarke, 2001: 129-131). The core product is the essential service or
benefit designed to satisfy the identified need of the target market, like relaxation
or rest. The guest houses offer a variety of services to their clients, such as
Internet, PC/modem sockets, fax, phone, which are all tangible products. The
tangible product, also known as the supporting and facilitating products, is the
specific offer for sale stating what the customer will receive for his money. The
tangible product of the guest houses is the physical setting where the service is
delivered or extra products offered to add value to the core product like comfort,
cleanliness, décor, staff appearance and safety and security. The augmented
product comprises of all forms of added value that producers build into their
formal product offers to differentiate them from competitors’ offers. The most
important augmented products in the guest houses are the homely environment,
the friendly/ helpful staff and friendly/ helpful manager which are stronger
differentiators of the guest house offering than the tangible products.
Statistical records illustrate that the number of bed nights spent in SA in 2004
were over 2 million less than in 2003. In the first quarter of 2005, the number of
stay units sold also decreased by 0.6 percent compared with the last quarter of
2004 (Statistics South Africa, 2005b). Gauteng, however, did not lose out on bed
nights in 2004. It actually increased its share by one percent (South African
Tourism, 2005b). Hotel accommodation has suffered the most during the third
quarter of 2004 as it sold almost a million bed nights less as compared to 2003
(South African Tourism, 2005c). On the other hand small gains were made by
guest houses, B&Bs and Game lodges (South African Tourism, 2005c: 5). The
weekly occupancy of the guest houses from the sample, for high demand season
ranges between 61 to 100 percent and for low demand season between 21 to 40
percent. These occupancy rates mean that guest houses have customers

160
throughout the year. However managers have indicated that the highest demand
is in March, August, September and October; and the quietest months are
December and January.
In terms of profitability, the owners of the majority of well-established guest
houses stated that they are making a profit and none of them reported to be
running at a loss. The fairly new establishments are mostly breaking even due to
high fixed costs and expenses related to establishing a business. Therefore, the
well-established ones are financially more secure.
In 2004 foreign tourists spent R13 billion in GP, which was the highest amount
spent per province for that year (South African Tourism, 2005b: 63). However,
the amount was R2.2 billion less than in 2003 (South African Tourism, 2005b:
63), even though there were more tourists in 2004 than in 2003. Tourists were
buying less than previous years due to higher prices explained with the
strengthening of the rand. Guest house owners should also take note that unit
nights sold in South Africa are continuously decreasing, as there was a further
decrease in the second quarter of 2005 by 11.9 percent compared to first
quarter. Occupancy rates and total income from accommodation have also
decreased in the second quarter of 2005 (Statistics South Africa, 2005a). These
decreases could be a threat to small private establishments, such as guest
houses, because they could result in fewer customers and less income. This
trend could also be used to the advantage of the guest houses, because they are
generally more cost-effective than hotels (Gillingham, 2004). Therefore guest
house owners should take the opportunity of having price wise more appealing
offerings to attract customers in order to increase sales.
Statistics show that the majority of foreign travellers come to GP for holiday
purposes, then for shopping, visiting friends and family, business and other
(South African Tourism, 2005c: 12). Guest houses in GP attract more business
travellers. In terms of nationality, they are SA residents and foreigners. From the

161
study it appears that there are more SA residents who are business travellers
and more foreigners who are leisure travellers in the guest houses. From
statistical reports of the tourism industry, it has become known that the largest
share of foreign tourists to SA is land-based travellers from neighbouring SADC
countries (Paragraph 2.5.1). From the responses of the customers of the guest
houses in GP it became evident that 62 percent were SA residents and 38
percent were foreigners. This research did not involve in differentiating the
various nationalities of customers.
Customers identified the most common sources of information about guest
houses as from a friend, the Internet and their company. Therefore, guest houses
are attracting customers on the Internet and by word of mouth, rather than from
publications, pamphlets or other sources. If tourists are finding their way to the
guest houses by word of mouth, it means that they were referred to the particular
guest house by satisfied customers of that establishment. This shows how
satisfied customers influence other customers’ behaviour.
Satisfaction is one of the most important criteria for determining the quality
delivered by the guest house. Customer satisfaction creates a positive attitude
towards the services of the service provider and leads to repeat purchase and
recommendation of the services to others. Customer satisfaction is also a
prerequisite for customer retention and loyalty and it helps achieving profitability,
market share and return on investment. In order to ensure satisfaction,
establishments have to meet customers’ needs. Customers identified certain
characteristics of the service, guest house, atmosphere and the room, as the
most important characteristics for them in the offerings of the guest houses.
These characteristics could be considered as customers’ needs, which are the
decision criteria for selecting a guest house accommodation. They are:
• Homely environment;
• Friendly and polite staff;

162
• Comfort;
• Cleanliness;
• Efficient service;
• Safety and security;
• Satisfy needs;
• Value for money; and
• Location.
Customers’ expressions of what they want are revealed by their expectations and
their perception of what they think they are getting from the service provider (Pit
& Watson, 1995: 176). That is why the first and most critical step in delivering
service quality is knowing what customers expect. Customer expectations, as
suggested by Zeithaml et al. (1990: 20), are influenced by word of mouth
communications, personal needs, past experiences and communications by the
service provider to the user. Perceptions are influenced by physical stimuli from
the outside environment and by the individuals’ predisposition, based on previous
experiences, expectations, motives and learning (Schiffman & Kanuk, 1991:
157). Through the customer questionnaires, customers were asked to do a global
appraisal on the offering of the guest house. They indicated that their
experiences of the service, the guest house in general, the atmosphere and the
room in most instances exceeded or met their expectations. This means that the
customers were satisfied and even delighted, and because customer satisfaction
is one of the most important criteria for determining the quality delivered to
customers, it indicates that the guest houses are offering good quality service
that does not appear to have quality gaps. Customers perceive the offering of the
guest house as good, therefore guest house owners actually have a knowledge
and understanding of the expectations and perceptions of their customers.
The open questions of the customer questionnaires were used to obtain
information on what impressed customers about the guest house or what they
thought should be improved. The information on what impressed them indicates

163
to the researcher what they would be looking for when choosing to stay in other
similar establishments. The reason for this statement is that people remember
when they have a good experience in a guest house and next time they choose
to stay in another guest house, their expectations are high, and based on the
previous good experience.
The comments of customers on what impressed them were grouped by similarity.
It was then noted that the categorisation corresponded with the services quality
dimensions (empathy, responsiveness, reliability, assurance and physical
evidence/ tangibles). The fact that the answers of customers corresponded with
the existing theory on service quality dimensions, pointed out that the current
service marketing theory is applicable to guest houses and can be used by guest
house owners for obtaining guidelines for customer behaviour and service
quality.
It was determined that what impresses customers in guest houses and what
could attract them to similar establishments are the following characteristics,
which are listed in order of importance:
• The warm and friendly hospitality of the host, the friendly environment, the
friendly and helpful staff, the feeling of being home away from home and
others related to empathy. Empathy clearly indicates why people choose the
accommodation of guest houses.
• Neatness, comfort, hygiene, easy atmosphere, big and tidy rooms, good food
and others related to physical evidence/ tangibles.
• Great service, everyone walked the extra mile to satisfy customers,
promptness, flexibility and others related to responsiveness.
• Value for money, everything great, complete package (reliability).

164
• Best security, well-organised, courtesy, attention to detail and others related
to assurance.
All these characteristics represent the personalised services that customers
receive in the guest houses, and these characteristics are in fact, the factors
which contribute for the customers’ satisfactory experience. All these
characteristics also indicate that it is the augmented product (atmosphere,
accessibility, customer interaction with the guest house staff and management,
customer participation and interaction with other guests, quality of service) and
the tangible product of the guest house offering that differentiate guest houses
from other accommodation establishments and influence customers’ decision to
purchase.
Customers also pointed out improvements that should be added to the services
of the particular guest house. Their comments were related to physical evidence/
tangibles, such as: television, DSTV, heating/ cooling system, shaded parking,
references to bathroom, references to room, cleanliness, meals and so forth. It is
important for guest house owners to pay attention to the physical elements of
their offering, because if customers are not satisfied with the physical
surroundings of the leisure setting, they may not return (Wakefield & Blodgett,
1996: 48). In total 61 percent of customers did not respond or did not express an
opinion on what should be improved. Additionally, the majority of customers who
took part in this study indicated that they were totally satisfied with the whole
experience in the particular guest house they stayed at, and further stated that
they would return and/ or recommend the establishment to friends and family. In
total, 40 percent of the customers wrote that they were return customers. All
these factors led to the assumption that the customers are satisfied, if not even
delighted with the offerings of the guest houses. This means that even though
guest house owners generally do not have formal hospitality backgrounds, they
are successfully providing good quality of service. A good service in a guest
house enhances the establishment’s reputation through word of mouth, improves
165
customer loyalty, which results in repeat business, increases the first-time
customers arising from personal recommendations and contributes to fewer
complaints (Seaton & Bennett, 1996: 454).
7.4 Recommendations
During the study it was established that guest houses in Gauteng Province run
successful operations. They are providing good service to their customers and
that is contributing to satisfied customers. However, the tourism statistics of the
country are presenting decreasing figures of tourist spending, unit nights sold,
rates of occupancy and income from accommodation. In order for guest houses
to avoid losing market share, they must attract more customers.
South African Tourism (2005b) stated, as mentioned in Paragraph 2.5.1 and 7.4
that the largest share of foreign tourists to South Africa is land-based travel from
neighbouring SADC countries. Surveys with the tourists from the African
countries indicated that these tourists stay mostly at hotels and with friends and
family. Very few of these tourists have said that they stay at guest houses or
B&Bs. Therefore, there could be an opportunity to attract more of these travellers
to the guest houses. In order to reach them, guest house owners could distribute
brochures of their establishments at toll gates at the main highways or at border
posts. By doing so, they will reach not only the foreign travellers, but domestic
travellers as well. Pamphlets could also be distributed at the airport, for those
who come by air. Customers from Australia and India could be targeted, as they
do not make much use of guest houses and B&Bs. The Internet could be used to
market the establishments in order to reach the foreign tourists in their own
countries.
Another way of increasing the market share is by targeting a different market and
in this case it is the leisure market. Guest house owners should advertise more
aggressively close to school holidays, so that visitors from other provinces could
get to know about the establishments. They could advertise on Internet sites of

166
Gauteng Tourism or could create links with frequently visited sites. This could
help to increase the occupancy during the months of December and January.
Guest house owners should also try to persuade their customers to stay for
longer at their establishments. Currently, the most common length of stay of
domestic tourists for the first quarter of 2005 was two nights and for foreign
tourists in 2004, it was also two nights, as it was mentioned in Paragraph 2.4.
Customers, who have come to the province by air, might be difficult to persuade
to stay an extra day, because it would involve changing reservations and
aeroplane tickets. Customers, who came by road and with their own transport,
could be more flexible with their travel arrangements. In order to persuade them
to stay longer, managers or guest house owners should be able to interest them
with exciting events happening in the province. Therefore guest house owners
should have a good knowledge of cultural events, theatre shows, shopping
specials for the customers that come to Gauteng for shopping and, in general,
anything interesting that customers might consider a good reason to spend an
extra night in the province. They can also target the tourists before they get to the
destination by advertising special offers like for example “spend three nights at
our guest house and get one night free” to transport companies or travel agents.
Unfortunately advertising means that the guest houses would have to spend
some financial resources, because marketing by pamphlets, adverts in
newspapers or flyers costs money. That is why guest house owners should
ensure that their establishments constantly provide quality service and maintain
satisfied customers who would inexpensively market the guest house by
recommending its services to other people.
Guest house owners should investigate the perceptions of their customers
regarding the physical element in their offering as the improvements mentioned
by guests were all related to physical aspects of the offering. Such investigation
would determine if there is a gap between the customers’ expectations and what
is delivered. Servicescapes have a relatively consistent and strong effect on the

167
length of time consumers desire to stay in the leisure service setting and on their
repatronage intentions (Wakefield & Blodgett, 1996: 49).
Customers should be allowed to participate in the delivery of service, because by
doing so, more personalised service is delivered to them (Bresler, 2001: 110).
Good communication with guests should be encouraged, so that if there is any
unsatisfactory matter that needs to be addressed, the guests would raise the
issue. In that way, problems could be identified and resolved in time without
leaving unhappy customers.
Guest house owners should also interact with as many people as possible in
order to form networks that would have a knowledge of the offering of the guest
house. Those people together with the satisfied customers will market the
establishment by word of mouth and that would contribute to increasing
business.

168
BIBLIOGRAPHY
AA Travel guide – Hotels, Lodges, Guest Houses, B&Bs. 2001/ 2002 edition.
Johannesburg: AA travel guides.
Abrahamse, T. in Ludski, H. 2001: Tourism boss looks everywhich way for
change. Sunday Times. 4 March 2001.
Abrahamse, T. in Koumelis, T. 2003: Dedicated tourism TV program launched.
Travel Daily News.com. Friday. 5 September 2003.
Assael, H. 1993: Marketing principles and strategies, 2nd edition. Orlando: The
Dryden Press.
Bennett, A., Jooste, C. & Strydom, L. 2005: Managing tourism services: a
Southern African perspective, 3rd edition. Pretoria: Van Schaik Publishers.
Bitner, M.J. 1992: Servicescapes: the impact of physical surroundings and
employee responses. Journal of Marketing, 56, 1992: 57-71.
Bitner, M.J. & Hubbert, A.R. 1994: Encounter satisfaction versus overall
satisfaction versus quality: the consumer’s choice. (In: Sureshchandar, G.S.,
Rajendran, C. & Anantharaman, R.N. 2002: The relationship between service
quality and customer satisfaction: a factor specific approach. Journal of Service
Marketing, 16 (4), 2002: 363 – 379.)
Bowen, J.T. & Chen, S-L. 2001: The relationship between customer loyalty and
customer satisfaction. International Journal of Contemporary Hospitality
Management, 13 (5), 2001: 213- 217.
169
Bowen, J.T. & Shoemaker, S. 1998: Loyalty: a strategic commitment. (In: Bowen,
J.T. & Chen, S-L. 2001: The relationship between customer loyalty and customer
satisfaction. International Journal of Contemporary Hospitality Management,
Vol.13 No.5, pp. 213- 217.)
Bresler, N.C. 2001: The experience of tourists on privately owned game lodges
and reserves in Mpumalanga and the Northern Province. Rand Afrikaans
University (D com thesis).
Bresler, N.C. 2005: In Bennett, A., Jooste, C. & Strydom, L. 2005: Managing
tourism services: a Southern African perspective, 3rd edition. South Africa: Van
Schaik Publishers.
Buttle, F. 1996: SERVQUAL: review, critique, research agenda. Journal of
Marketing, 30, 1996: 8-32.
Callan, R.J. & Fearon, R. 1997: Town house hotels – an emerging sector.
International Journal of Contemporary Hospitality Management, 9 (4), 1997:
168-175.
Candido, C.J.F. & Morris, D.S. 2000: Charting service quality gaps. Total Quality
Management, 11 (4- 6), 2000: 463- 473.
Cant, M.C., Brink, A. & Brijball, S. 2002: Customer behaviour: a Southern African
perspective. Landsdowne: Juta & Co. Ltd.
Carman, J.M. 1990: Consumer perceptions of service quality: an assessment of
the SERVQUAL dimensions. Journal of Retailing, 66, 1990: 33-55.

170
City of Johannesburg official website. Tourism Strategy. Chapter two:
Johannesburg tourism’s competitiveness.
www.joburg.org.za/unicity/tourism (27/10/05)
Cooper, C., Fletcher, J., Gilbert, D., Shepherd, R. & Wanhill, S. 1998: Tourism:
principles and practice, 2nd edition. New York: Addison Wesley Longman
Publishing.
Crick, A. 2003: Internal marketing of attitudes in Caribbean tourism. International
Journal of Contemporary Hospitality Management, 15 (3), 2003: 161-166.
Donnelly, M. & Shiu, E. 1999: Assessing service quality and its links with value
for money in UK local authority’s housing repairs service using the SERVQUAL
approach. Total Quality Management, 10 (4/ 5), 1999: 498-507.
Fick, G.R. & Ritchie, J.B.R. 1991: Measuring service quality in the travel and
tourism industry. Journal of Travel research, 30 (2), 1991: 2-9.
Gauteng Tourism Development Authority, 2002: National responsible tourism
development guidelines for the South African tourism sector: Second draft
guidelines 2 December 2002.
George, R. 2001: Marketing South African tourism and hospitality. Cape Town:
Oxford University Press Southern Africa.
Gillingham, A. 2004: Costs are cut but comfort maintained. Business Day.
Saturday 10 July 2004.
Hall, S.S.J. 1990: Quality Assurance in the hospitality industry. Wisconsin: ASQC
Quality Press.

171
Henning, R. & Willemse, C. 1999a: Effective Guest House Management. Cape
Town: Juta & Co. Ltd.
Henning, R. & Willemse, C. 1999b: Planning the guest house, 1st edition. Cape
Town: International College Group.
Hicks, R. 2003: SAA must drop its “protectionism”. Business Report. 19 August
2003.
Holloway, J.C. 1998: The business of tourism, 5th edition. Essex: Addison Wesley
Longman Limited.
Holloway, J.C. & Plant, R.V. 1992: Marketing for tourism, 2nd edition. London:
Pitman Publishing.
Huysamen, C.A. 2000: An evaluation of the role of knowledge transfer when
implementing best business practices. Rand Afrikaans University (M com thesis).
Jayawardena, C. & Haywood, K.M. 2003: International hotel managers and key
Caribbean challenges. International Journal of Contemporary Hospitality
Management, 15 (3), 2003: 195-198.
Johnson, R. & Clark, G. 2001: Service operations management. Essex: Pearson
Education Limited.
Jordaan, M.J.S. 2001: Tourism in South Africa, 2nd edition. Bloemfontein: M. J. S.
Jordaan.
Keyser, H. 2002: Tourism development. Cape Town: Oxford University Press
Southern Africa.

172
Kleynhans, H.C. 2003: Leisure tourists’ satisfaction regarding their meal
experience at Lesedi Cultural Village. University of Pretoria (M com thesis).
Kotler, P., Bowen, J. & Makens, J. 1996: Marketing for hospitality and tourism.
USA: Prentice-Hall, Inc.
Koumelis, T. 2004: Latest hotel performance trends in Australia, New Zealand
and South Africa. Travel Daily News.com. Friday 2 July 2004.
Lubbe, B.A. 2003: Tourism management in Southern Africa. Cape Town:
Maskew Miller Longman (Pty) Ltd.
Malhotra, N.K. 2004: Marketing research – an applied orientation, 4th edition.
New Jersey: Prentice-Hall, Inc.
Marx, M. 2003: Tourism benefits spread, but pace is slow. The Journal of
Southern African Tourism, June 2003.
Massnick, F. 1997: How to measure what customers want – and make sure they
get it. New York: AMACOM.
Middleton, V.T.C. & Clarke, J. 2001: Marketing in travel and tourism, 3rd edition.
Oxford: Butterworth-Heinemann publications.
Mill, R.C. & Morrison, A.M. 1992: The tourism system – an introductory text, 2nd
edition. London: Prentice Hall.
Misner, I.R. 1994: The world’s best-known marketing secret: building your
business with word of mouth marketing. Austin, Texas: Bard & Stephen.

173
Morrison, A. & Thomas, R. 1999: The future of small firms in the hospitality
industry. International Journal of Contemporary Hospitality Management, 11 (4),
1999: 148-154.
Moutinho, L. 1987: Consumer behaviour in tourism. European Journal of
Marketing, 21 (10), 1987: 1-44.
Oliva, T.A., Richard, L.O. & MacMillan, I.C. 1992: A catastrophe model for
developing service satisfaction strategies. Journal of Marketing, 56, July 1992:
83-95.
Page, S. 1995: Urban tourism. London: Routledge.
Parasuraman, A., Zeithaml, V.A. & Berry, L.L. 1985/88/91. (In Pit, L.F. & Watson,
R.T. 1995: Service quality: a measure of information system effectiveness. MIS
Quarterly, 19 (2), 1995: 173-187.)
Perreault, W.D. Jr. & McCarthy, E.J. 1999: Basic Marketing: a global managerial
approach, 13th edition. Boston: Irwin/ McGraw- Hill.
Peter, J.P. & Olson, J.C. 1987: Consumer behaviour – marketing strategy
perspective. USA: Richard D. Irwin, Inc.
Pit, L.F. & Watson, R.T. 1995: Service quality: a measure of information system
effectiveness. MIS Quarterly, 19 (2), 1995: 173-187.
Pizam, A. & Ellis, T. 1999: Customer satisfaction and its measurement in
hospitality enterprises. International Journal of Contemporary Hospitality
Management, 11 (7), 1999: 326-339.
174
Portfolio: Bed and Breakfast Collection 2003-2004. Cape Town: Portfolio South
Africa.
Powers, T. & Burrows, C.W. 2003: Introduction to management in the hospitality
industry, 7th edition. New York: John Wiley & Sons, Inc.
Roberts, K., Varski, S. & Brodie, R. 2003: Measuring the quality of relationships
in consumer services: an empirical study. European Journal of Marketing, 37
(1/2), 2003: 169-196.
Seaton, A.V. & Bennett, M.M. 1996: Marketing tourism products: concepts,
issues, cases. London: International Thomson Business Press.
Schiffman, L.G. & Kanuk, L.L. 1991: Consumer behaviour, 4th edition. New
Jersey: Prentice – Hall.
Schiffman, L.G. & Kanuk, L.L. 2000: Consumer behaviour, 7th edition. New
Jersey: Prentice – Hall.
South African Department of Environmental Affairs and Tourism. 2004: Domestic
Tourism Growth Strategy 2004 to 2007.
www.southafrica.net (31/05/04)
South African Tourism, 2003: It’s official – SA is world’s hottest destination.
www.southafrica.net (24/03/03)
South African Tourism, 2004a: Community tourism in South Africa.
www.southsfrica.net (31/5/04)

175
South African Tourism, 2004b: 2003 Domestic Tourism Report. Strategic
Research Unit.
www.southafrica.net/satourism/research/research.cfm (24/08/04)
South African Tourism, 2005a: News Releases: Tourism growth continues to
impress.
www.southafrica.net/newsrelease (29/10/05)
South African Tourism, 2005b: Annual Tourism Report 2004. Strategic Research
Unit.
South African Tourism, 2005c: Provincial Report – Gauteng (Q3 2004) July to
September. Strategic Research Unit.
South African Tourism, 2005d: Q1 2005 Domestic Quarterly Report January to
March 2005. Strategic Research Unit.
South African Travel Guide Online. Travel trends.
www.satravelguide.com/trnds.html (7/11/04)
Spreng, R.A. & Mackoy, R.D. 1996: An empirical examination of a model of
perceived service quality and satisfaction. Journal of Retailing, 72, 1996: 201-
214.
Statistics South Africa, 2005a: Statistical Release P6410 Tourist Accommodation
June 2005.
www.statssa.gov.za (29/10/05)
Statistics South Africa, 2005b: Where the numbers never stop.
www.statssa.gov.za/archive (29/10/05)

176
Sudman, S. & Blair, E. 1998: Marketing research: a problem solving approach.
Singapore: The McGraw-Hill.
Sureshchandar, G.S., Rajendran, C. & Anantharaman, R.N. 2002: The
relationship between service quality and customer satisfaction – a factor specific
approach. Journal of Service Marketing, 16 (4), 2002: 363 – 379.
Swanson, S.R. & Kelley, S.W. 2001: Service recovery attributions and word of
mouth intentions. European Journal of Marketing, 35 (1/2), 2001: 194-211.
Tourism Grading Council Of South Africa. Guest house minimum requirements.
www.tourismgrading.co.za/grading info (11/04/02)
Tourism Grading Council Of South Africa. B&B minimum requirements.
www.tourismgrading.co.za/ grading info (11/04/02)
Wahab, S. & Cooper, C. 2001: Tourism in the age of globalisation. London:
Routledge.
Wakefield, K.L. & Blodgett, J.G. 1996: The effect of the servicescape on
customers’ behavioural intentions in leisure service settings. Journal of Services
Marketing, 10 (6), 1996: 45-61.
Weiermair, K. 2000: Tourists’ perceptions towards and satisfaction with service
quality in the cross- cultural service encounters: implications for hospitality and
tourism management. Managing Service quality, 10 (6), 2000: 397-409.
Williams, A. 2002: Understanding the hospitality consumer. Oxford: Butterworth-
Heinemann.
177
Winsted, K.F. 1997: The service experience in two cultures. Journal of retailing,
73 (3), 1997: 337-360.
Zeithaml, V.A. 1988: Consumer perception of price, quality, and value : a means-
end model and synthesis of evidence. Journal of Marketing, 52, 1988: 2-22.
Zeithaml, V.A., Berry, L.L. & Parasuraman, A. 1993: The nature and
determinants of consumer expectations of service. Journal of the Academy of
Marketing Science, 21 (1), 1993: 1-12.
Zeithaml, V.A. & Bitner, M.J. 2003: Services marketing – integrating customer
focus across the firm, 3rd edition. New York: McGraw – Hill.
Zeithaml, V.A., Parasuraman, A. & Berry, L.L. 1990: Delivering Quality Service:
balancing customer perceptions and expectations. New York: The Free Press –
A Division of Macmillan, Inc.

178
ANNEXURE 1
Management Questionnaire

179

180

181
ANNEXURE 2
Customer Questionnaire

182
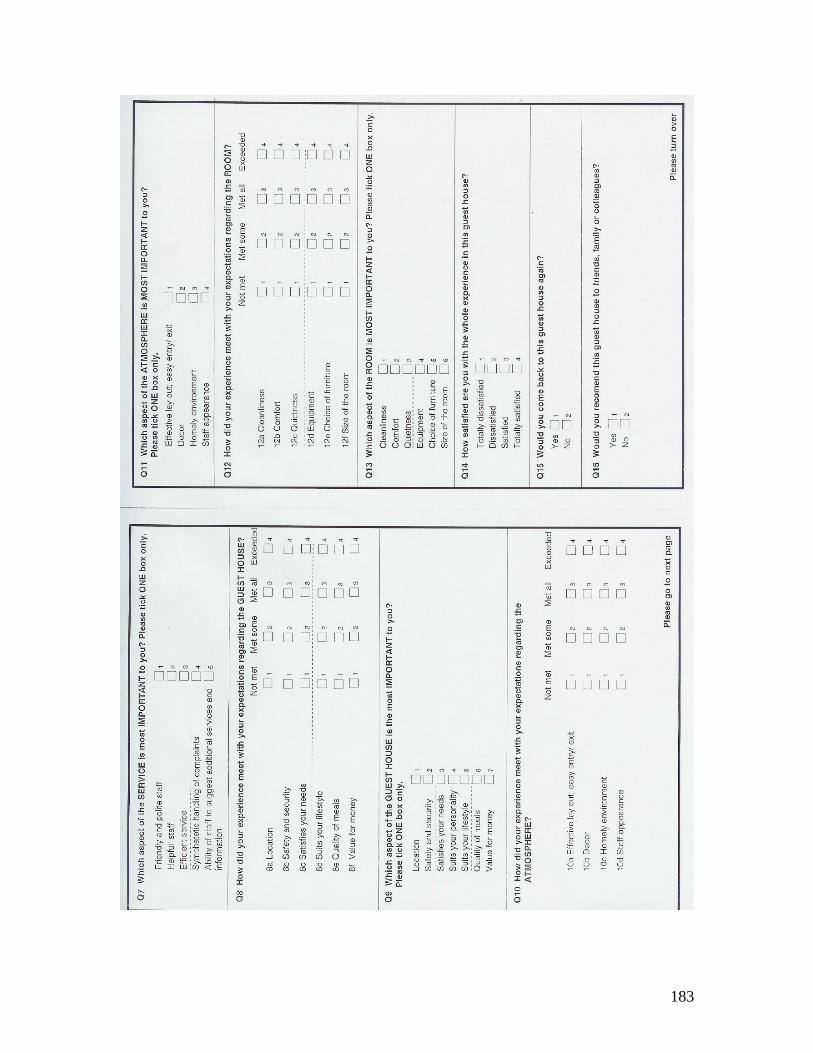
183

184
ANNEXURE 3
List of guest houses that participated in the study
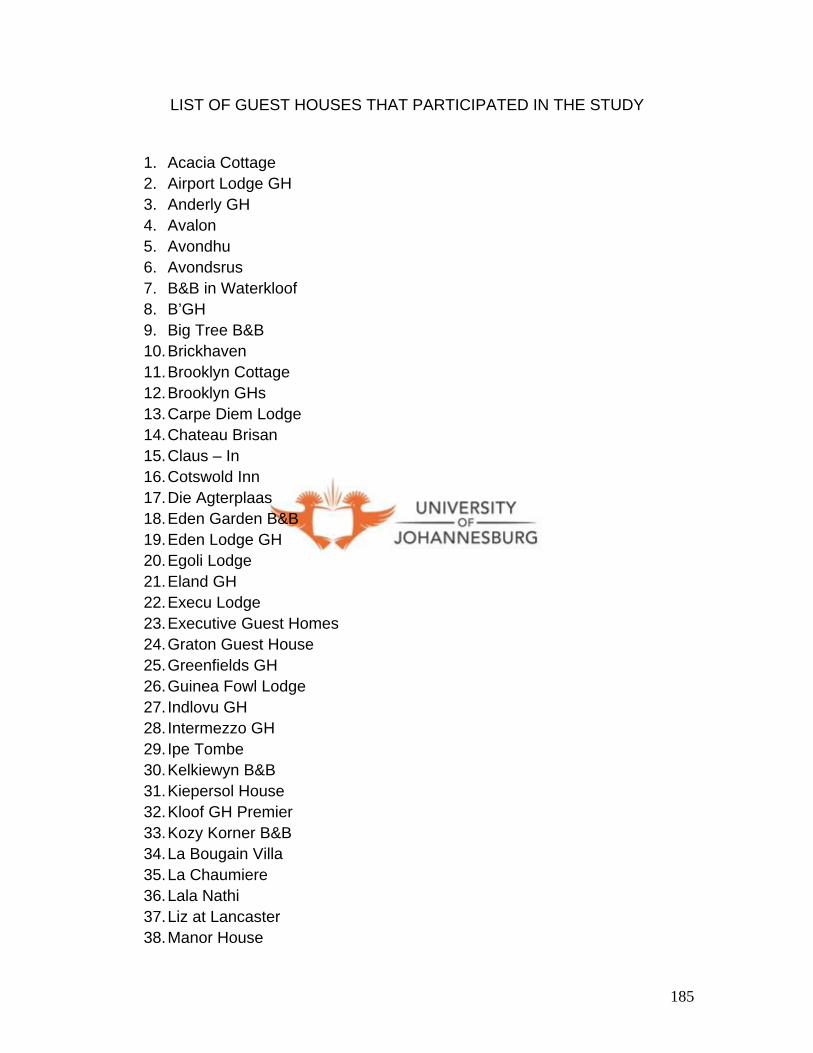
185
LIST OF GUEST HOUSES THAT PARTICIPATED IN THE STUDY
1. Acacia Cottage 2. Airport Lodge GH 3. Anderly GH 4. Avalon 5. Avondhu 6. Avondsrus 7. B&B in Waterkloof 8. B’GH 9. Big Tree B&B 10. Brickhaven 11. Brooklyn Cottage 12. Brooklyn GHs 13. Carpe Diem Lodge 14. Chateau Brisan 15. Claus – In 16. Cotswold Inn 17. Die Agterplaas 18. Eden Garden B&B 19. Eden Lodge GH 20. Egoli Lodge 21. Eland GH 22. Execu Lodge 23. Executive Guest Homes 24. Graton Guest House 25. Greenfields GH 26. Guinea Fowl Lodge 27. Indlovu GH 28. Intermezzo GH 29. Ipe Tombe 30. Kelkiewyn B&B 31. Kiepersol House 32. Kloof GH Premier 33. Kozy Korner B&B 34. La Bougain Villa 35. La Chaumiere 36. Lala Nathi 37. Liz at Lancaster 38. Manor House

186
39. Manor Inn B&B 40. Melrose Lodge 41. No 2 off Douglass B&B 42. Oak Tree Lodge 43. Ons Tuiate Lodge 44. Paddington Lane 45. Parson’s Place 46. Pigeon’s House 47. Place to Stay 48. Royal Ridge GH 49. Sari’s GH 50. Stay a While GH 51. Summerset GH 52. Ten Stirling 53. That’s it! Guest Home 54. The Celtis Manor 55. The Grooves GH 56. The Guesthouse B&B GH 57. The Melville Turret Guest House58. The Roosters Nest 59. The Rose GH 60. The Thatch Cottage 61. Villa Tuscana GH 62. Villas Latino 63. Vivrez Voux GH 64. Waterkloof GH 65. Willow Place