Embed Size (px)
Citation preview
FACTORS INFLUENCING THE CHOICE OF SCIENCE SUBJECTS IN KENYA’S
SECONDARY SCHOOLS: A CASE STUDY OF LANGATA HIGH SCHOOL IN
NAIROBI COUNTY
BY
OKUMU JOSHUA OMONDI
A PROJECT SUBMITTED IN PARTIAL FULFILMENT FOR THE REQUIREMENTS
OF AWARD OF POST GRADUATE DIPLOMA IN EDUCATION AT THE
UNIVERSITY OF NAIROBI
YEAR 2013

ii
STUDENTS’ DECLARATION
This research project is my original work and has not been presented for examination in any
other university.
Signature……………………………………………… Date……………………………….
OKUMU JOSHUA OMONDI
REG. NO. E40/60388/2010
SUPERVISOR’S DECLARATION
This research project has been submitted for examination with our approval as university
supervisors.
Signature …………………………………….. Date…………………………………
MR. ISAAC MUASYA
DEPARTMENT OF EDUCATION FOUNDATIONS
UNIVERSITY OF NAIROBI

iii
DEDICATION
I dedicate this research project to my family, for their understanding and support during my
entire period of study.
May God bless you.

iv
ACKNOWLEDGEMENT
I would like to take this opportunity to sincerely thank all the people who have played the most
crucial role in the conception and writing of this research proposal. My special thanks go to my
supervisor for his guidance, advice; encouragement and working tirelessly to mould this work.
My immense thanks go to the Almighty God for giving me peace and grace to finish this work.
Special thanks also go to the Principal, Teachers of Langata High School for their time and
resources during the period of this research.
My thanks also goes to the Teachers, The Head of Departments-Sciences, and Students for
having contributed greatly towards this project.
To my colleagues at the University of Nairobi, I sincerely thank you for your understanding,
support and prayers for the successful completion of this work.
May God bless you all.
Okumu Joshua Omondi
v
TABLE OF CONTENTS
DECLARATION ........................................................................................................................... iii
DEDICATION…………………………………………………………………………………...iii
ACKNOWLEDGEMENT………………………………………………………………………..iv
LIST OF TABLES ........................................................................................................................ vii
LIST OF FIGURES ..................................................................................................................... viii
ABSTRACT ................................................................................................................................... ix
CHAPTER ONE: INTRODUCTION ............................................................................................. 1
1.1 Background of the Study ...................................................................................................... 1
1.2 Statement of the Problem ...................................................................................................... 2
1.3 Purpose of the Study ............................................................................................................. 4
1.4 Specific Objectives of the Study ........................................................................................... 4
1.5 Research Questions ............................................................................................................... 4
1.6 Significance Of the Study ..................................................................................................... 5
1.7 Scope of the Study ................................................................................................................ 5
1.8 Limitation of the Study ......................................................................................................... 6
1.9 Assumptions of the Study ..................................................................................................... 6
1.10 Definition of significant terms ............................................................................................ 6
CHAPTER TWO: LITERATURE REVIEW ................................................................................. 8
2.1 Introduction ........................................................................................................................... 8
2.2 Factors influencing students’ choice of science subjects ..................................................... 8
2.2.1 Perception of the value of the subject .......................................................................... 11
2.2.2 The influence of the subject teacher on students’ choices of science subjects ............ 13
2.2.3 The influence of gender-difference on students’ choices of science subjects in
secondary schools ................................................................................................................. 13
2.2.4 Role of parents and teachers in students’ choices of science subjects in secondary
schools................................................................................................................................... 16
2.3 Summary and Gaps ............................................................................................................. 17
2.4 Conceptual Framework ....................................................................................................... 18

vi
CHAPTER THREE: RESEARCH METHODOLOGY ............................................................... 20
3.1 Introduction ......................................................................................................................... 20
3.2 Research Design.................................................................................................................. 20
3.3 Target Population ................................................................................................................ 20
3.4 Sampling Design and Procedure ......................................................................................... 21
3.5 Data Collection Technique ................................................................................................. 22
3.6 Data Analysis and presentation. .......................................................................................... 22
CHAPTER FOUR: DATA ANALYSIS AND INTERPRETATION .......................................... 23
4.0 Introduction ......................................................................................................................... 23
4.1 Response Rate ................................................................................................................ 23
4.2 General Information ............................................................................................................ 24
4.3 Students’ Perception on Science Subject ............................................................................ 27
4.4 Value of the Science Subject .............................................................................................. 30
4.5 Influence of the Subject Teacher ....................................................................................... 34
4.6 Influence of Gender Differences ......................................................................................... 36
4.7 Role of Parents and Teachers .............................................................................................. 38
CHAPTER FIVE: DISCUSSION, CONCLUSIONS, AND RECOMMENDATIONS .............. 42
5.1 Introduction ......................................................................................................................... 42
5.2 Summary of the findings ..................................................................................................... 42
5.3 Conclusions .................................................................................................................... 43
5.4 Recommendations ............................................................................................................... 44
5.4.1 Recommendations for Improvement .......................................................................... 44
5.4.2 Recommendations for Further Studies............................................................................. 45
REFERENCES ............................................................................................................................. 46
APPENDICES .............................................................................................................................. 51
Appendix: Introduction Letter .................................................................................................. 51
Appendix II: Students Questioner ............................................................................................. 51
Appendix II: Teachers’ Questioner ........................................................................................... 56
vii
LIST OF TABLES
Table 3. 1: Target population and the sample size........................................................................ 21
Table 4. 1: Age of the students ..................................................................................................... 24
Table 4. 2: Class of the students ................................................................................................... 26
Table 4. 3: Marks attained in the KCPE exams ............................................................................ 26
Table 4. 4: Science subject the teachers teach .............................................................................. 27
Table 4. 5: Teachers’ level of education ....................................................................................... 27
Table 4. 6: If the three science subjects were done in the School ................................................ 28
Table 4. 7: Students’ attitude towards the science subjects as rated by students.......................... 29
Table 4. 8: Students’ attitude towards the science subjects as rated by teachers .......................... 30
Table 4. 9: If science subjects were competitive in the job market .............................................. 32
Table 4. 10: Career choice of the students .................................................................................... 33
Table 4. 11: If there were enough science facilities in the school ................................................ 34
Table 4. 12: Students’ level of satisfaction on teacher’s methodology of handling the subject ... 36
Table 4. 13: How students perform in science subjects ................................................................ 36
Table 4. 14: Ratio of boys to girls who take up science subjects ................................................. 38
Table 4. 15: Whether parents influenced choice of science subjects ............................................ 38
Table 4. 16: Whether the school had a career counselor .............................................................. 40
Table 4. 17: If the school forced students to do certain science subjects ..................................... 41

viii
LIST OF FIGURES
Figure 4. 1: Gender of the students ............................................................................................... 24
Figure 4. 2: Religion/denomination of the students ...................................................................... 25
Figure 4. 3: If the school encouraged students to take up science subjects .................................. 27
Figure 4. 4: Whether there were values attached to subject choice in relation to career
development .................................................................................................................................. 31
Figure 4. 5: If the students had developed a career path that they strived to achieve/attain in life
....................................................................................................................................................... 32
Figure 4. 6: If the teacher influenced the subject choice .............................................................. 35
Figure 4. 7: If gender influenced choice of subject ...................................................................... 37
Figure 4. 8: If teachers influenced choice of science subjects ...................................................... 39
Figure 4. 9: If the career counselor advised students on subject choice ....................................... 40

ix
ABSTRACT
Students in Kenya’s secondary schools have been often faced with the problem of indecision
when they are about to choose the science subjects in their third form of the secondary school
education. With good background, students still need to develop themselves on the subject areas
they are keenly interested in and particularly that they have potentiality for. The overall aim of
this research was to gain a deeper understanding of the factors influencing the choice of science
subjects in Kenya’s secondary education schools, a case study of Langata High school in Nairobi
County. The study would be of great significance to the school management because it would
help the management fraternity in understanding the factors affecting the choice of science
subjects. The study adopted a descriptive survey design. The population for this study was all
students in Lang’ata High School in Nairobi. Sample size of 11 teachers and 150 students was
drawn from the teachers and the students from form two to four. Primary data was collected by
use of a questionnaire. The study generated both qualitative and quantitative data.
Quantitative data was coded and entered into Statistical Packages for Social Scientists
(SPSS Version 17.0) and analyzed using descriptive statistics. Qualitative data was analyzed
based on the content matter of the responses. The study found that that the school encouraged
students to take up science subjects. Science subjects were competitive in the job market.
Students had developed a career path that they strived to achieve/attain in life. The study
revealed that the teacher influenced the subject choice. The study found that gender did not
influence choice of subject. Teachers influenced choice of science subjects’. The study concludes
that when students are allowed to choose which classes to enroll in increased motivation and
independence which in turn increased a student's performance. Students had developed a career
path that they strived to achieve/attain in life. A student's attitude about a teacher has a large
x
impact on their attitude toward a class. Different perceptions men and women have in regards to
their ability and competency in those certain classes influenced choice of subject. School has a
great role to play in influencing students’ choice of science subjects. The study recommends
students to have good attitude towards science subjects. They need to consider their interests,
personal academic goals while choosing subjects. Competent and qualified teachers should teach
science subjects. Science teachers should strive to be enthusiastic, well spoken, knowledgeable,
caring, and helpful. Gender differences should be discouraged amongst students. Women should
be encouraged to change their perceptions in regards to their ability and competency. Parents
need to help students when making their study choices. The school should support subjects and
careers decision making.

1
CHAPTER ONE: INTRODUCTION
1.1 Background of the Study
Science is recognized widely as being of great importance internationally both for economic
well-being of nations and because of the need for scientifically literate citizens (Fraser and
Walberg, 1995). Knowledge of science and technology is therefore a requirement in all countries
and all people globally due to the many challenges that are facing them. These challenges
include emergences of new drug resistant diseases, effects of genetic experimentation and
engineering, ecological impact of modern technology, dangers of nuclear war and explosions and
global warming among others (Alsop & Hicks, 2001). As a result there are rapid changes taking
place in industry, communication, agriculture, and medicine. Science as an instrument of
development plays a dominant role in bringing about these changes by advancing technological
development, promoting national wealth, improving health and industrialization (Validya, 2003).
Weham, Dorlin, Snell and Taylor (1984) emphasized that sciences are and will remain the
fundamental subjects through the ages.
Statistics on international trends in science subjects selection in 46 countries shows that in the
US, among fourth graders in 2007, males continued to prefer science subjects to females in
where males scored significantly higher overall than females in science (Mullis, Martin and Foy,
2008).The 1986 National Assessment of Educational Progress (NAEP) carried out in the United
States earlier had reported that boys had outperformed girls in sciences achievement and the
gender gap increased as students progressed in school. A later assessment by NAEP in 2005
revealed that males preferred sciences subjects to females in grades 4, 8 and 12. Females at all

2
levels made relatively little gains in their average science scores since 1996. In most cases by
grade 11, the areas of largest male advantage were physics, chemistry, earth science and space
science (Kahle and Meece, 1994). In the final year of secondary school, males had a significantly
higher achievement in scientific literacy than females in all participating countries (European
Union Report, 2009).
In Kenya, in the third year of studies (form 3), students choose to study at least two science
subjects from biology, physics and chemistry and are assessed at the end of the fourth year. The
choice of which science subject to study in third and fourth forms has been an issue to many of
students; an issue that have since received varied interpretation among the students themselves
and the various stakeholders in the education fraternity. Studies have revealed that most students
will prefer chemistry and biology when allowed to choose science subjects (Waititu, 2004).
Moreover, female student have been noted to shy away from physics and chemistry citing the
reason being the tedious mathematical calculations involved in such subjects (Murithi, 1996)
Implementing Vision 2030 will require more knowledge based skills. This calls for more training
in science and technological related courses. If secondary school graduates are not realizing the
required grades in order to enroll in such courses, the vision remains just a mirage. There must
therefore be concerted effort among all stakeholders to address the problem of deplorable choice
and performance in science subjects.
1.2 Statement of the Problem
Students in Kenya’s secondary schools have been often faced with the problem of indecision
when they are about to choose the science subjects in their third form of the secondary school

3
education. This problem has plagued many Kenya’s secondary school students for quite
sometimes. It is such a problem that must be looked into, knowing fully well that the place of
sciences in secondary education cannot be over emphasized in the educational development of a
nation. With good background, students still need to develop themselves on the subject areas
they are keenly interested in and particularly that they have potentiality for. Many students have
been found choosing subjects for KenyaCertificate Secondary Examination without considering
the aspect of their potentiality and the directive of the school counselor where available.
In Kenya, secondary school ends with the Kenya Certificate of Secondary Education (KCSE)
examination. Students are expected to take two science subjects drawn from the cluster of
Chemistry, Biology and Physics. However, most schools treat Biology and Chemistry as compulsory
science subjects which must be taken by all the candidates. It is very important for students to be
proficient in these subjects because they play an important role in career choices and professional
development.
Dismal performance in the sciences limits individuals opportunities in competitive professional
courses that are science oriented. Furthermore, Kenya’s vision 2030 initiative aims at making the
country a newly industrializing middle income country providing high quality life for all its
citizens. The realization of this vision calls for the harnessing of the science ability of both men
and women in the country so that they can contribute to nation building. However, this vision is
not about to be realized for as long as students continue to underachieve in subjects that
determine their placement in science oriented fields which are expected to spur industrialization.
It is against this background that this study seeks to establish the factors that influence the choice
of science subjects in Kenya’s Secondary Schools.

4
1.3 Purpose of the Study.
The overall aim of this research was to gain a deeper understanding of the factors influencing the
choice of science subjects in Kenya’s secondary education schools, a case study of Langata High
school in Nairobi County. The researcher sought to analyze the effects of perception of the value
of the science subjects on students choices of subjects in Langata high school, The research’s
findings were achieved by assessing a number of indicators deemed best for the study and also
more importantly through the following specific research objectives;
1.4 Specific Objectives of the Study.
The study was guided by the following specific objectives:
i) To determine the effects of the value of the science subject on students’ choices of the
subject in Langata high school
ii) To find out the influence of the subject teacher on students’ choices of science subjects
in Langata high school
iii) To find out the influence of gender differences on students’ choices of science subjects in
Langata high school.
iv. To investigate the role of parents and teachers in students’ choices of science subjects in
Langata high school
1.5 Research Questions
The study was guided with the following Research Questions:
i. What are the effects of the value of the science subject on students’ choice of science subject
in Langata High School?

5
ii. How does the subject teacher influence students’ choices of science subjects in Langata High
School?
iii. How does gender difference influence affect students’ choices of science subjects in Langata
High School?
iv. What is the role of parents and teachers in students’ choices of science subjects in Langata
high school?
1.6 Significance Of the Study
The study would be of great significance to the school management because it would help the
management fraternity in understanding the factors affecting the choice of science subjects and
be able to initiate appropriate measures to improve on students’ performance in science subjects
The relevant government ministries would also benefit from the study findings and be able to
come up with policy issues touching on subject choice and later career choice at higher levels of
education in Kenya.
The study would add to the wide academic knowledge in the area of education which can be
used by other researchers as reference in future. Researchers and research institutes may use the
study to come up with other research studies.
1.7 Scope of the Study
The study investigated the factors that influence the choice of science subjects in Kenya’s
Secondary Schools. Specifically the study sought to investigate the factors that influence the
choice of science subjects in Lang’ata High School.

6
1.8 Limitation of the Study
The study faced various shortcomings that may affect effective research undertaking.
Respondents may be suspicious and fail to answer the questionnaire. The researcher intended to
overcome this by adopting objectivity approach (by asking general questions on the issues
pertaining to science subject selection) to the staff. Simple questions with answers to choose
from will be used.
The research study focused on four variables that were addressed by specific objectives; this may
deny an opportunity to explore further on other factors that influence the choice of science
subjects in Kenya’s Secondary Schools.
1.9 Assumptions of the Study
The assumptions of this study included the following: that the sample chosen respondents
represent the population; the data collection instrument to be used has validity and is measuring
the desired constructs.
1.10 Definition of significant terms
Science subjects: These involves subjects which are core to the examination board in Kenya
secondary Education and they includes such subjects as Biology, chemistry, physics and others,
for the purpose of this study the focus was on the factors influencing students choice on selecting
them.
Choice: Refers to the students’ preference over one science subject as compared to the other
science subjects the study focused on identifying the critical factors that influenced students’
choice on the subjects. The choice of subject can either be to great extent or to low extent.
Secondary schools: This is an education level in Kenya that precedes primary education in the

7
Kenya’s curriculum system which follows 8.4.4 systems where students sit for the KCSE to
signify transition to the next level after four years.
KCSE: Refers to the Kenya Certificate Of Secondary Education. This is the summative
evaluation exam given to the students at the end of form four.
Performance: The outcome or result of an exam which can be good or poor.
Value of science subject: Content and relevance of the subject as related to career aspirations.
Teacher influence: The way a teacher make students choose a subject or not choose it.
Gender influence: Perception of male or female while choosing subjects
Role of teacher in subject selection: what is required/the responsibility of the teachers when
students are choosing subjects.
Role of parent in subject selection: what is required/the responsibility of the parents when
students are choosing subjects.

8
CHAPTER TWO: LITERATURE REVIEW
2.1 Introduction
The chapter gives detailed information on effects of perception of the value of the science
subjects on students’ choices of subjects. It looks at the value of the science subject, influence of
the subject teacher, influence of gender differences and role of parents and teachers on students’
choices of science subjects. At the end of the chapter, there is a conceptual framework by the
researcher of the various variables used in the research and an explanation of their interrelation.
2.2 Factors Influencing Students’ Choice of Science Subjects
Students look forward to the opportunity to choose their academic plans and classes (Smith,
Feldwisch and bell, (2006). According to the enhanced cognitive engagement theory, allowing
students to choose which classes they enroll in increases motivation and independence which in
turn increases a student's cognitive processing and performance (Flowerday and Schraw, (2003).
However, the task of subjects is very complex with multiple considerations, most of which
overlap with one another. Students are influenced by the different academic portions of the class
such as the value of the content, the structure, and the workload. They also have to decide what
is important to them with regards to their interests, personal academic goals, and their schedule.
But students do not make these decisions alone because they do occasionally seek advice from
their family, faculty, and/or friends.
Not all of the different considerations of a course are as influential as others, but it is important
to know what students want from their classes, what they expect of themselves, and who they
will listen to. Educators and schools need to know this information; especially those of elective
courses so they can meet the needs of students and have them continue to enroll in their class.

9
More importantly though, if teachers can adapt their classes to better meet the needs of students
the students will be more engaged which will increase their comprehension and excitement for
the curriculum, which should be any teacher's ultimate goal (Flowerday &Schraw, (2003):. 214).
From the Kenya National Examinations Council KCSE Report (2008), Journal of Research in
Education and Society; Volume 4, April 2012, 15 percentage candidatures for physics for the
years 2009, 2010, and 2011 were 30.41%, 26.69% and 26.78% respectively. The other science
subjects had figure above 90%.In the same year physics was better performed than biology and
chemistry. This showed that although students have the ability to score high grades in physics,
other factors were hindering them. It may be that the attitude that students develop towards a
subject is dependent on their experiences in school. Furthermore, Waititu (2004) indicates that
although the link between performance and attitude is not very strong, what is very clear is the
strong relationship between attitude and the choice of a subject of study. A key property of
physics is that there are many mathematical concepts and processes.
The mathematical calculations in physics may make the subject a preserve of very few learners.
The high number of these concepts and processes do provide a background or have a high
utilitarian value in understanding scientific programs especially in physics. In this case,
calculations are very important in expressing physics content (Bassey, (2003). In contrast,
Murithi (1996) states that physics is taught to selected students who have knowledge of its
mathematical concepts and symbols.
This reveals that while some scholars value the contribution that mathematics has on the science
content, others view the interdependence as an obstacle to excellence in these science subjects.
Contributing on the issue, Knecht (1965) says that sciences and mathematics are closely linked

10
that their teachings overlap. The requirement of mathematical knowledge thus could be blocking
some students from venturing into chemistry and Physics. Wadsworth (1998) puts it that
underachievers who fail in mathematics remain passive and are often blocked out of sciences
such as physics and chemistry since the mathematical principals and applications lower their
morale in pursuing their agenda.
Statistics from the Imenti South District results reports revealed that in the years 2006, 2007 and
2008, the highest candidature registered for physics in the district was 23.31% in 2007. This
represents low candidature registration for the subject and predicts negative attitude towards
physics. Kungania (2006) conducted an investigation on the factors influencing attitude of
diploma teacher trainees towards science and mathematics in Kenya. The research findings
revealed that students have a positive attitude towards physics, perceive the physics' teachers as
competent and they perceive the physics laboratories as well equipped. Further, Waititu (2004)
explored students' perception of difficulty in topic areas of the Kenya secondary school science
syllabus. The research findings revealed that about half of the students found biology very
interesting or interesting, and about a quarter found it boring or very boring. In contrast, only
about a quarter of the students thought that physics was very interesting or interesting and about
half thought it boring or very boring. There was no significant difference in the responses of the
males and females to the closed-form item about biology, whereas statistically significantly
fewer females than males thought that physics was interesting. Thus, the results to this section of
the questionnaire support the contention that students find physics less interesting than a
comparator science subject, biology, and that fewer girls than boys find physics
interesting.Therefore from the perspective of the various thinkers as mentioned above its
11
undisputable that series of factors interplay in the students mind for the right choice of the
science lessons, a myriad of factors are deemed to influence students choice of the subjects of
their interest.
2.2.1 Perception Of the Value of the Subject
Students’ attitudes towards science subjects affect their choice of the subjects. Generally, a
negative attitude towards a given subject leads to lack of interest and when subjects are to be
selected, as in senior secondary schools, it leads to avoiding the subject or course. Furthermore, a
positive attitude towards science according to Simpson and Oliver (1990) leads to a positive
commitment to science that influences lifelong interest and learning of science. This is the reason
why major science education reform efforts in Africa have emphasized the improvement of
students’ attitudes towards science subjects.
The quality of a subject can have a tremendous effect on whether a student chooses to enroll in a
class because it covers a wide variety of factors. Quality of a subject means that the laboratories
for this subject are well equipped and the subject is taught by qualified teachers. A subject can be
interesting to a student but the class needs to be well executed for the content to actually be
understood and beneficial. Research has found that the majority of students will choose classes
based on its high quality of learning rather than the deciding based on the instructor and/or the
ease of the class (Babad Tayeb,( 2003) and Wilhelm, (2004). In fact, according to Wilhelm
(2004), students are four times more likely to choose a class where they have the opportunity to
learn a "great deal" of knowledge even if the class requires a lot of readings and assignments.
Students want to know how they will be assessed throughout a class and if aspects like effort and
improvement will play a role in that assessment (Ferrer-Caja Weiss, (2002). Therefore, classes

12
with set expectations and the ability to actually meet those expectations are very likely to
positively influence a student's choice in enrolling in a course (Curran Rosen, 2006).
The knowledge a student gains in a class can be beneficial and desired by a student because they
simply want to gain knowledge; however, students may also prefer quality of education because
of the relevancy and perceived value it can have on their life once they graduate, including their
search for employment. According to Nagy, Trautwein, Baumert, Koller, and Garrett (2006),
high school students are likely to enroll in subjects that will pertain to what they want to study in
college. Students in secondary schools are then greatly influenced by the potential for career
opportunities and advancement; therefore, the more valuable a subject is to a future career, the
greater the likelihood a student will enroll in it (Ackerman Gross, 2006). Students' enrollment of
subjects based on its relevancy to their future career aspirations becomes even more predominate
as the students get closer to graduation and they begin to search for jobs (Wilhelm, (2004).
Research findings have shown that the pattern of students’ interaction inside and outside the
classroom has significant effects on their interest and achievement in science (Fraser et al. 1999).
In terms of the classroom, the individual child is motivated not only by his basic needs and
drives, but also by the stimulation provided by his peer group.
Every student has their own perception of the values attached to the specific subjects that they
would wish to undertake, a series of factors play an important role on the value associated with
the subject lesson these can include the suitability in the job market, career choice etc.

13
2.2.2 The Influence of The Subject Teacher on Students’ Choices of Science Subjects
Although research has indicated that students have a larger preference for the knowledge that
they can receive from a class rather than the instructor, it is the instructor who has a significant
impact on how useful the subject can be (Wilhelm, 2004). Also, the preference of an instructor's
lecturing style is very close to being as important as the quality of the value of the content
(Babad and Taybe, 2003). A student's attitude about an instructor has a large impact on their
attitude toward a class (Curran and Rosen, 2006). Students prefer subjects that are taught by
teachers who are enthusiastic, well spoken, knowledgeable, caring, and helpful as opposed to
instructors who are dry, inflexible, and unclear (Curran and Rosen, 2003). If instructors are
inflexible and unclear, they are much more likely to be difficult to learn from, which is a major
concern for students (Smith et al., 2006). If students are concerned about a teacher they are less
likely to enrol in that class, and vice versa, according to the research done by Wilhelm (2004:
23).
Subject teachers play a crucial role in taming students choices over the science subject to go for
some teachers are perceived by the students to be good teachers they teacher and this will
influence students into his class while students perceive other teachers not to be the right
teachers for such subjects this will reduce the rate of the subject by the students.
2.2.3 The influence of Gender-difference on Students’ Choices of Science Subjects in
Secondary Schools
The gender of a student can often affect their enrollment in a class. Men and women can have
different values, and there are also certain standards or expectations that vary between genders.

14
Gender differences are especially apparent in high school aged students. Females are less likely
to enroll in science and math classes compared to men, but more likely to enroll in English
classes (Tenenbaum, 2008). One reason for this could be the different perceptions men and
women have in regards to their ability and competency in those certain classes because students
are more likely to enroll in classes where they think they can excel (Nagy et al., 2006).
According to Riegle-Crumb et al (2006), females often score better in science despite the fact
that men often think they are better in that subject. This could be explained because females
often expect more from their education than men do and therefore put forth more effort and have
high levels of school engagement (Grebennikon Skaines, 2009). But despite the scores indicating
that girls are capable, the gender gap still exists in classes like science and math. A main reason
for this could be that, according to Tenenbaum,( 2008), parents use double the amount of
discouraging comments towards daughters than they do sons when it comes to the subjects their
children take, which only enforces the stereotypes that already exist about gender differences
leading females to feel less secure in certain subjects and opting to take other classes.
However, as students go from high school to college, they often become more alike in the
choices they make in regards to what they study (Malgwi et al., 2005). Interest in the subject is
still one of the main factors of enrollment regardless of gender (Malgiw et al, 2005). However,
females find more importance in a subject that has clear assessment requirements, provides
constructive feedback, and has a fair amount of work throughout the study period (Grebennikon
and Skaines, (2009)

15
But despite some differences, research has indicated that the gender gap is closing between
college males and females' perception of their abilities. Zhao, Carini, and Kuh (2005) have found
that women in science, math, engineering and technology classes (SMET) are becoming either
equal to or more satisfied with their college experience than males which leads to their greater
academic success and the continuous closing of the gender gap in certain course enrollment.
A national indicator in Kenya of implicit gender-science stereotyping was related to a nation’s
sex differences in science achievement and by extension, to other markers of diverse scientific
leadership (Nosek, et al, 2006). Research thus attributes low enrolment of girls in science to
lower parental expectations and encouragement. Girls are socialized into characteristics of
dependence, nurturance and passivity. They therefore develop a set of attitudes and beliefs that do
not promote high levels of achievement and participation in science. Studies have found that females have more
negative attitude towards math and science (Wasanga, 1997). According to Wasanga (1997), the
majority of girls found science subjects difficult and they perceived science subjects to be more useful to boys.
.Aghenta, (1989) found that perceived difficulties of science occupations was a significant factor
preventing girls from entering Science, Technology and Mathematics (STM) fields. The attitude
that one holds towards science appears to be a powerful predictor of achievement in the
respective field. A poor attitude to STM was a barrier to access of STM related fields but
conversely, a good or positive attitude was one of the several factors that facilitated performance
in STM. Achievement differences are also influenced by single sex versus mixed sex schools.
According to Whitelaw et al. (2000), sex is probably the most important variable related to pupils’ attitudes to
science. Many studies for instance, Francis and Greer (1999), Jones et al. (2000), reported that males have more
positive attitudes toward science than females. Also, Osborne et al. (2003) stressed that there is still a bias against

16
physical sciences held by girls, suggesting that at an individual level the overwhelming majority of girls still choose
not to do physical science as soon as they can. In the same vein, Aigbomian (2002) observed that boys perform
better than girls in science, technical and mathematical subjects. It is generally believed that socio-cultural and
religious practices are at the root of this imbalance.
Gender difference differentiates the girls’ subject choice from boys. Girls tend to generally like
other subjects and hate other science subjects; there is also a variation between science subjects
for boys compared to the subject choice for the ladies.
2.2.4 Role of Parents and Teachers in Students’ Choices of Science Subjects in Secondary
Schools
Career advice by parents and teachers can influence students’ choice of science subjects
especially in Africa. In a related investigation Okeke (2000) revealed that parents have
significant effect on students’ choice of career and subjects. If we want to encourage more young
students into science, then students need rich opportunities to find out about the many ways
sciences can be used in interesting careers, most of the students have not been helped by their
parents when making their study choices.
Furthermore, the school has a great role to play in influencing students’ choice of science
subjects particularly in Africa. The school should support subjects and careers decision making.
This will go a long way to encourage students’ choice of science subjects. In addition, students
need information about the structure and content of the science subjects they want to study. This
will help to influence their choice of the subject.
17
According to (Malgwi et al., (2005)), Parents are more likely to influence students' decisions
than guidance counselors or teachers. Students are likely to enroll in more classes if they talk
with their parents first, which implies that parents do have an effect on their child's decisions
(Tenenbaum, 2008). Parents look forward to their children having new teachers and classes with
the end result of them getting good grades (Smith et al., 2006). Therefore, parents will encourage
their students to take a variety of classes where they think they can excel. Tenenbaum (2008)
further argued that fathers are more likely to discourage their children from taking certain
difficult classes, especially with daughters.
Teachers in the schools are supposed to provide assistance and guidance to their students on
subject, but research indicates that teachers are not as influential as family or peers in a student's
choice of courses (Malgwi et al., 2005). Consequently, teachers do have more influence over a
student's decision than guidance counselors (Malgwi et al, 2005). Either way, teachers and
guidance counselors are not likely to discourage students from enrolling in classes, but to
encourage the enrollment in certain classes (Anderson et al., 2008).
2.3 Summary and Gaps
Every school institution wants to be successful and have desire to get constant progress in
students’ performance. The current era is highly competitive and learning institutions are not
spared as the enrolment of form four graduates into higher institutions of learning and the
pursuant of courses thereof depend on their subject combinations from secondary schools. To
overcome the problem of selection of science subjects, there is a need to do an analysis of the
root causes of disparity in the subject choice among the learners in secondary schools a gap that
many writers have not since explored adequately.
18
Unless and until, the problem of science subjects choice is unearthed and the students are
motivated and made to understand the vital role the science subjects play in their future career
development, there will be in competition in the technological advancement across the world
whose major drive is science. It is in this light that the researcher aimed to fill this gap by
carrying out a research on the factors that influence the choice of science subjects in Kenya’s
Secondary Schools.
2.4 Conceptual Framework
A conceptual is defined as an element of the scientific research process in which a specific
concept is defined as a measurable occurrence or in measurable terms that basically gives a clear
meaning of the concept. Conceptual framework is a diagrammatic presentation of the
relationship between dependent and independent variables. In this study, the dependent variable
is the choice of science subjects while independent variables are: the perception of the value of
the subject, the subject teacher, students’ interests, influence of gender, and the role of parents
and teachers.

19
Figure1.1Perceived factors that influence the choice of science subjects by students in
secondary schools.
Independent Variables Dependent Variables
Source: Author, 2013
Choice of science subjects
The perception of the value
of the subject
The subject teacher
Students’ interest
The role of parents and
teachers
Influence of gender

20
CHAPTER THREE: RESEARCH METHODOLOGY
3.1 Introduction
This chapter presents the methodology, which was used to carry out the study. It further
describes the type and source of data, the target population and sampling methods and the
techniques that were used to select the sample size. It also describes how data was collected
and analyzed.
3.2 Research Design
The study adopted a descriptive survey design. Descriptive research is concerned with conditions
or relationships that exist, practices that prevail, processes that are going on, attitudes that are
held or trends that are developing (Best, 1970). The design facilitated the collection of
information on the current disparities on choice of science subjects. It yields information which
is analyzed using descriptive and inferential statistics. The design also permitted an assessment of the
factors influencing achievement in the two science subjects.
3.3 Target Population
A population is a well-defined or set of people, services, elements, and events, group of things or
households that are being investigated. This definition ensures that population of interest is
homogeneous. Population studies are more representative because everyone has equal chance to
be included in the final sample that is drawn. The population for this study was all students in
Lang’ata High School in Nairobi.
Target population is the specific population about which information is desired. The target
population of interest in this study consists of students in form two, three and four as they are the
21
one who make choices for the subjects to be taken from form three onwards. The target
populations from which the respondents were drawn from include 36 teachers and 500 students
from form two to four.
3.4 Sampling Design and Procedure
The sampling plan describes how the sampling unit, sampling frame, sampling procedures and
the sample size for the study. The sampling frame describes the list of all population units from
which the sample are selected. Sample size of 11 teachers and 150 students was drawn from the
teachers and the students from form two to four.
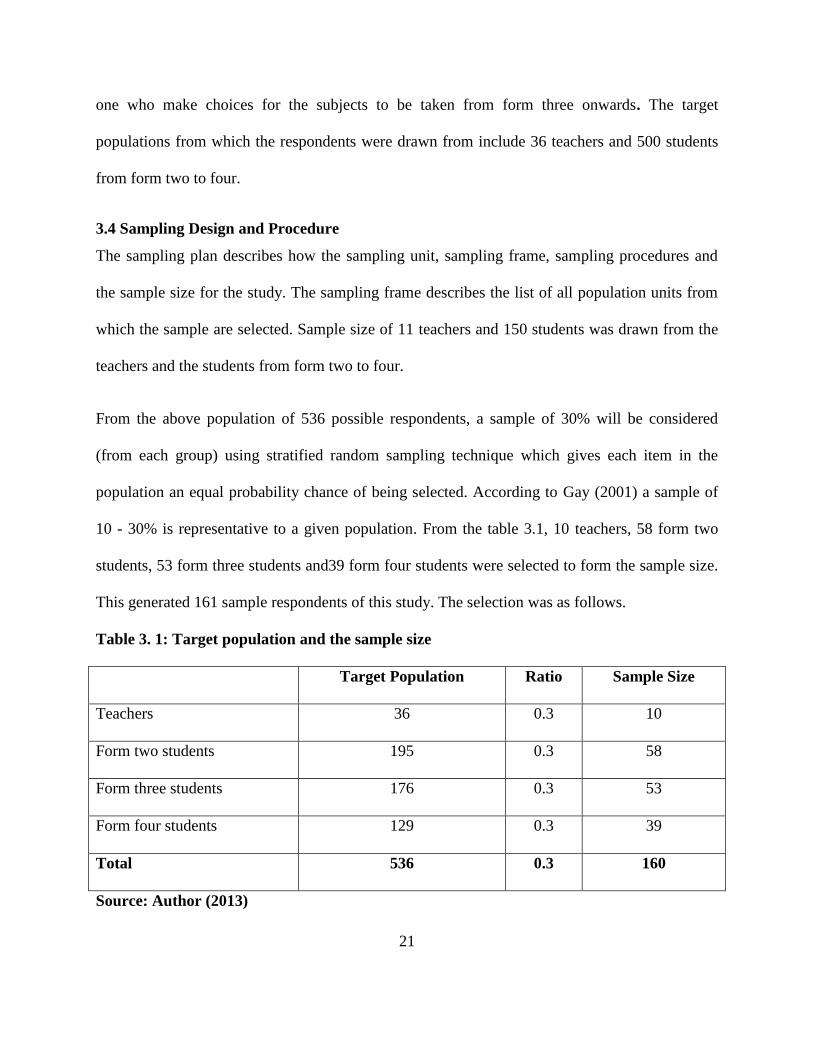
From the above population of 536 possible respondents, a sample of 30% will be considered
(from each group) using stratified random sampling technique which gives each item in the
population an equal probability chance of being selected. According to Gay (2001) a sample of
10 - 30% is representative to a given population. From the table 3.1, 10 teachers, 58 form two
students, 53 form three students and39 form four students were selected to form the sample size.
This generated 161 sample respondents of this study. The selection was as follows.
Table 3. 1: Target population and the sample size
Target Population Ratio Sample Size
Teachers 36 0.3 10
Form two students 195 0.3 58
Form three students 176 0.3 53
Form four students 129 0.3 39
Total 536 0.3 160
Source: Author (2013)
22
3.5 Data Collection Technique
The study used primary data. Primary data was collected by use of a questionnaire.
Questionnaires are appropriate for studies since they collect information that is not directly
observable as they inquire about feelings, motivations, attitudes, accomplishments as well as
experiences of individuals. The questionnaire comprised of both open and close-ended questions.
3.6 Data Analysis and Presentation.
The study generated both qualitative and quantitative data. Quantitative data was coded and
entered into Statistical Packages for Social Scientists (SPSS Version 17.0) and analyzed
using descriptive statistics. Qualitative data was analyzed based on the content matter of the
responses. Responses with common themes or patterns were grouped together into coherent
categories. Descriptive statistics involves the use of absolute and relative (percentages)
frequencies, measures of central tendency and dispersion (mean and standard deviation
respectively). Quantitative data was presented in tables and graphs while the explanation to
the same was presented in prose.

23
CHAPTER FOUR: DATA ANALYSIS AND INTERPRETATION
4.0 Introduction
This chapter presents analysis and findings of the study as set out in the research methodology.
The study findings are presented on factors influencing the choice of science subjects in Kenya’s
secondary education schools, a case study of Langata High school in Nairobi County. The data
was gathered exclusively from the questionnaire as the research instruments. The questionnaires
were designed in line with the objectives of the study.
4.1 Response Rate
The study targeted 11 teachers, 57 form two students, 53 form three students’ and 39 form four
students in collecting data with regard to the management and access of mobile schools in Tana
River County. From the study, 11 teachers, 57 form two students, 53 form three students’ and 39
form four students sample respondents filled-in and returned the questionnaires making a
response rate 100%. According to Mugenda and Mugenda (1999) a response rate of 50% is
adequate for analysis and reporting; a rate of 60% is good and a response rate of 70% and over is
excellent; therefore, this response rate is adequate for analysis and reporting.

24
4.2. Background Characteristics of Students
4.2.1 Distribution of Respondents by Gender
The respondents who were interviewed consisted of 46% females and 54%.These results are
shown in the figure 4:1 below.
Figure 4.1: Distribution of Respondents by Religion.
4.2.2 Distribution of Respondents by Age
The respondents who were interviewed according to the findings, 89.40% of the respondents
were aged 14-18 years, 7.95% of the respondents were aged above 18 years and 2.65% of the
respondents were aged below 14 years.
Table 4.1: Distribution of Respondents by Age
Frequency Percentage
14-18 years 135 89.40
Below 14 years 4 2.65
Above 18 years 12 7.95
Total 151 100.00

25
4.2.3 Distribution of Respondents by Religion
The respondents who were interviewed from the findings, 36.42% were Protestants, 26.49%
were Catholics, 21.19% were evangelists and 15.89% were Islam’s. This implies that the school
admitted students without considering denomination.
Figure 4.2: Distribution of Respondents by Religion
4.2.4 Respondents by Class
The study sought to find out class of the students. According to the findings, 38.41% of the
students were in form two, 35.10% of the students were in form three and 26.49% of the students
were in form four.

26
Table 4.2: Respondents by Class
Frequency Percentage
Form two 58 38.41
Form three 53 35.10
Form four 40 26.49
Total 151 100.00
4.2.5 Marks attained in the KCPE exams
The study sought to find out the marks attained in the KCPE exams. From the findings, 83.44%
of the students had 250-300 marks in the KCPE exams, 10.60% of the students had below 250 in
the KCPE exams, 5.30% of the students had 300-350 marks in the KCPE exams, 0.66% of the
students had 350-400 marks in the KCPE exams. This implies that the students were average
performers.
Table 4.3: Marks attained in the KCPE exams
Frequency Percentage
350-400 Marks 1 0.66
300-350 Marks 8 5.30
250-300 Marks 126 83.44
Below 250 16 10.60
Total 151 100.00
4.2.6 Science subject the teachers teach
The study sought to find out the science subject the teachers teach. According to the findings,
45.45% of the teachers taught biology, 36.36% of the teachers taught chemistry and 18.18% of
the teachers taught physics.

27
Table 4.4: Science subject the teachers teach
Frequency Percentage
Chemistry 4 36.36
Physics 2 18.18
Biology 5 45.45
Total 11 100.00
4.2.7 Teachers’ level of education
The study sought to find out the teachers’ level of education. From the findings, 63.64% of the
teachers had a Degree, 18.18% of the teachers had a Diploma and 18.18% of the teachers had a
Masters.
Table 4.5: Teachers’ level of education
Frequency Percentage
Diploma 2 18.18
Degree 7 63.64
Masters 2 18.18
Total 11 100.00
4.3 Respondent’s Perception on Science Subject
Students’ attitudes towards science subjects affect their choice of the subjects. Generally, a
negative attitude towards a given subject leads to lack of interest and when subjects are to be
selected, as in secondary schools, it leads to avoiding the subject.
The study sought to find out if the school encouraged students to take up science subjects. From
the findings, 64% of the teachers indicated that the school encouraged students to take up science

28
subjects while 36% of the teachers indicated that the school did not encourage students to take up
science subjects.
Figure 4.3: Responsibility of the school on the choice of the science subject
4.3.1 The sscience subjects done in the School
The study sought to find out if the three science subjects were done in the school. According to
the findings, all the students indicated that the three science subjects were done in the school.
Table 4.6: The science subjects done in the School
Frequency Percentage
Yes 151 100.00
Total 151 100

29
4.3.2 Students’ attitude towards the science subjects as rated by students
It was important to rate the students’ attitude towards the science subjects as rated by students. A
4-point Likert scale was used. 1-1.49 represented strongly negative, 1.5-2.49 represented fairly
negative, 2.50-3.49 represented fairly positive and 3.50-4.0 represented strongly positive. From
the findings, students’ attitude towards biology was fairly positive as shown by a mean of 3.325.
In addition, students’ attitude towards chemistry was fairly negative as shown by a mean of
2.461. More over, students’ attitude towards physics was strongly negative as shown by a mean
of 1.347. Knecht (1965) says that sciences and mathematics are closely linked that their
teachings overlap. The requirement of mathematical knowledge thus could be blocking some
students from venturing into chemistry and Physics. Waititu (2004) revealed that about half of
the students found biology very interesting or interesting, and about a quarter found it boring or
very boring.
Table 4.7: Students’ attitude towards the science subjects as rated by students
Subject Mean Stdev
Biology 3.325 0.104
Physics 1.347 0.291
Chemistry 2.461 0.173
4.3.2 Students’ attitude towards the science subjects as rated by teachers
The study sought to find out the students’ attitude towards the science subjects as rated by
teachers. A 4-point likert scale was used. 1-1.49 represented strongly negative, 1.5-2.49
represented fairly negative, 2.50-3.49 represented fairly positive and 3.50-4.0 represented
strongly positive. From the findings, students’ attitude towards biology was fairly positive as

30
shown by a mean of 3.278. In addition, students’ attitude towards chemistry was fairly negative
as shown by a mean of 2.214. More over, students’ attitude towards physics was strongly
negative as shown by a mean of 1.201. The mathematical calculations in physics may make the
subject a preserve of very few learners. The high number of these concepts and processes do
provide a background or have a high utilitarian value in understanding scientific programs
especially in physics. In this case, calculations are very important in expressing physics content
(Bassey, (2003).
Table 4.8: Students’ attitude towards the science subjects as rated by teachers
Subject Mean Stdev
Biology 3.278 0.381
Physics 1.201 0.471
Chemistry 2.214 0.835
4.4 Value of the Science Subject
Allowing students to choose which classes they enroll in increases motivation and independence
which in turn increases a student's cognitive processing and performance.
4.4.1 Values attached to subject choice in relation to career development
The study sought to find out whether there were values attached to subject choice in relation to
career development. According to the findings, 70% of the students indicated that there were
values attached to subject choice in relation to career development while 30% of the students
indicated that there were no values attached to subject choice in relation to career development.

31
According to Wilhelm (2004), students are four times more likely to choose a class where they
have the opportunity to learn a "great deal" of knowledge even if the class requires a lot of
readings and assignments.
Figure 4.4: Values attached to subject choice in relation to career development
4.4.2 Competitiveness of sciences in the job market
The study sought to find out if science subjects were competitive in the job market. From the
findings, 75.50% of the students indicated that science subjects were competitive in the job
market while 24.50% of the students indicated that science subjects were not competitive in the
job market. Students' enrollment of subjects based on its relevancy to their future career
aspirations becomes even more predominate as the students get closer to graduation and they
begin to search for jobs (Wilhelm, (2004).

32
Table 4.9: Competitiveness of sciences in the job market
Frequency Percentage
Yes 114 75.50
No 37 24.50
Total 151 100.00
4.4.3 Students Career Path that they Strive to Achieve/Attain in Life
The study sought to find out if the students had developed a career path that they strived to
achieve/attain in life. According to the findings, 87% of the students indicated that they had
developed a career path that they strived to achieve/attain in life while 13% of the students
indicated that they had not developed a career path that they strived to achieve/attain in life.
According to Nagy, Trautwein, Baumert, Koller, and Garrett (2006), high school students are
likely to enroll in subjects that will pertain to what they want to study in college.
Figure 4.5: students career path that they strive to achieve/attain in life

33
4.4.3 Career choice of the students
The study sought to find out the career choice of the students. From the findings, 27.15% of the
students indicated that their career path was lawyer, 25.83% of the students indicated that their
career path was accountant/banker, 21.19% of the students indicated that their career path was
doctor/physician/dentist, 17.22% of the students indicated that their career path was engineering,
5.30% of the students indicated that their career path was social scientist and 3.31% of the
students indicated that their career path was teaching.
Table 4.10: Career choice of the students
Frequency Percentage
Doctor/physician/Dentist 32 21.19
Accountant/Banker 39 25.83
Social scientist 8 5.30
Lawyer 41 27.15
Teaching 5 3.31
Engineering 26 17.22
Total 151 100.00
4.4.4 Availability of science facilities in the school
The study sought to find out if there were enough science facilities in the school. According to
the findings, 79.47% of the students indicated that there were enough science facilities in the
school and 20.53% of the students indicated that there were no enough science facilities in the
school. The facilities in the school were biology, chemistry and physics lab which were partially
equipped. The teachers were qualified and competent. Research has found that the majority of
students will choose classes based on its high quality of learning rather than the deciding based
on the instructor and/or the ease of the class (Babad Tayeb,( 2003) and Wilhelm, (2004).

34
Table 4.11: Availability of science facilities in the school
Frequency Percentage
Yes 120 79.47
No 31 20.53
Total 151 100.00
4.5 Influence of the Subject Teacher
The instructor has a significant impact on how useful the subject can be. A student's attitude
about an instructor has a large impact on their attitude toward a class (Curran and Rosen, 2006).
4.5.1 Teacher Influence on the Subject Choice
The study sought to find out if the teacher influenced the subject choice. From the findings, 97%
of the students indicated that the teacher influenced the subject choice while 3% of the students
indicated that the teacher did not influence the subject choice. The relationship between the
subject teacher and the student determined if the student chooses the subject. The method the
teacher used to teach determined how the students performed in the subject thus choice of
subject. Kungania (2006) conducted an investigation on the factors influencing attitude of
diploma teacher trainees towards science and mathematics in Kenya. The research findings
revealed that students have a positive attitude towards physics, perceive the physics' teachers as
competent and they perceive the physics laboratories as well equipped.

35
Figure 4.6: Teacher Influence on the Subject Choice
4.5.2 Students’ level of satisfaction on teacher’s methodology of handling the subject
The study sought to find out the students’ level of satisfaction on teacher’s methodology of
handling the subject. A 3-point likert scale was used where 1-1.49 represented less satisfied,
1.50-2.49 represented averagely satisfied and 2.50-3.0 represented highly satisfied. According to
the findings, students were averagely satisfied with teacher’s methodology of handling biology
as shown by a mean of 2.346. In addition, students were averagely satisfied with teacher’s
methodology of handling chemistry as shown by a mean of 1.651. More over, students were less
satisfied with teacher’s methodology of handling physics as shown by a mean of 1.193. Students
prefer subjects that are taught by teachers who are enthusiastic, well spoken, knowledgeable,
caring, and helpful as opposed to teachers who are inflexible, and unclear (Curran and Rosen,
2003). If instructors are inflexible and unclear, they are much more likely to be difficult to learn
from, which is a major concern for students (Smith et al., 2006).

36
Table 4.12: Students’ level of satisfaction on teacher’s methodology of handling the subject
Subject Mean Stdev
Biology 2.346 0.301
Physics 1.193 0.162
Chemistry 1.651 0.104
4.5.3 Performance of the students in the science subjects
The study sought to find out how students perform in science subjects. A 5-point likert scale was
used where 1-1.49 represented very poor, 1.50-2.49 represented poor, 2.50-3.49 represented
fairly, 3.50-4.49 represented good and 4.50-5.0 represented very good. From the findings,
students performed in biology fairly as shown by a mean of 3.436. In addition, students
performed in chemistry fairly as shown by a mean of 2.251. More over, students performed in
physics very poor as shown by a mean of 1.393. The preference of an instructor's lecturing style
is very close to being as important as the quality of the value of the content (Babad and Taybe,
2003).
Table 4.13: Performance of the students in the science subjects
Subject Mean Stdev
Biology 3.436 0.161
Physics 1.393 0.212
Chemistry 2.251 0.134
4.6 Influence of Gender Differences
Men and women can have different values, and there are also certain standards or expectations
that vary between genders. Gender differences are especially apparent in high school aged
students. Females are less likely to enroll in science and math classes compared to men, but more
likely to enroll in English classes (Tenenbaum, 2008).

37
4.6.1 Gender Differences in Choice of Science Subject
The study sought to find out if gender influenced choice of subject. From the findings, 66% of
the students indicated that gender did not influence choice of subject while 34% of the students
indicated that gender influenced choice of subject. Tenenbaum,( 2008), parents use double the
amount of discouraging comments towards daughters than they do sons when it comes to the
subjects their children take, which only enforces the stereotypes that already exist about gender
differences leading females to feel less secure in certain subjects and opting to take other classes.
Figure 4.7: Gender Differences in Choice of Science Subject
4.6.2 Ratio of boys to girls who take up science subjects
The study sought to find out the ratio of boys to girls who take up science subjects. According to
the findings, the ratio of boys to girls who take up biology was 1:1. In addition, the ratio of boys
to girls who take up physics was 4:1. More over, the ratio of boys to girls who take up chemistry
was 2:1. According to Wasanga (1997), the majority of girls found science subjects difficult and they

38
perceived science subjects to be more useful to boys. .Aghenta, (1989) found that perceived difficulties of
science occupations was a significant factor preventing girls from entering Science, Technology
and Mathematics (STM) fields. The attitude that one holds towards science appears to be a
powerful predictor of achievement in the respective field.
Table 4.14: Ratio of boys to girls who take up science subjects
Subject boys: girls
Biology 1:1
Physics 4:1
Chemistry 2:1
4.7 Role of Parents and Teachers
Career advice by parents and teachers can influence students’ choice of science subjects. The
school should support subjects and careers decision making.
4.7.1 Influence of Parents on Choice of Science Subjects
The study sought to find out whether parents influenced choice of science subjects. According to
the findings, 58.94% of the students indicated that parents influenced choice of science subjects
while 41.06% of the students indicated that parents did not influence choice of science subjects.
Okeke (2000) revealed that parents have significant effect on students’ choice of career and
subjects. According to (Malgwi et al., (2005)), Parents are more likely to influence students'
decisions than guidance counselors or teachers.
39
Table 4.15: Influence of Parents on Choice of Science Subjects
Frequency Percentage
Yes 89 58.94
No 62 41.06
Total 151 100.00
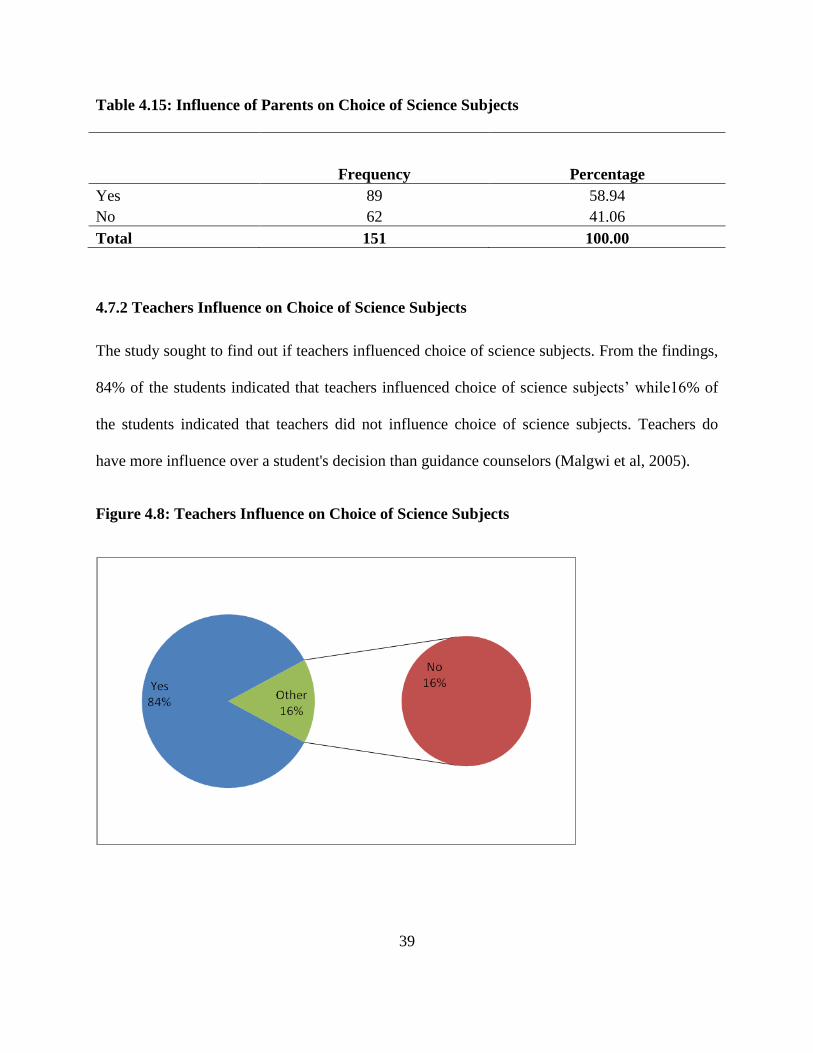
4.7.2 Teachers Influence on Choice of Science Subjects
The study sought to find out if teachers influenced choice of science subjects. From the findings,
84% of the students indicated that teachers influenced choice of science subjects’ while16% of
the students indicated that teachers did not influence choice of science subjects. Teachers do
have more influence over a student's decision than guidance counselors (Malgwi et al, 2005).
Figure 4.8: Teachers Influence on Choice of Science Subjects

40
4.7.3 Availability of Career Counselor in the School
The study sought to find out whether the school had a career counselor. According to the
findings, 91.39% of the students indicated that the school had a career counselor while 8.61% of
the students indicated that the school had no career counselor.
Table 4.16: Availability of Career Counselor in the School
Frequency Percentage
Yes 138 91.39
No 13 8.61
Total 151 100.00
4.7.4 Role of career counselor on subject choice
The study sought to find out if the career counselor advised students on subject choice. From the
findings, 79% of the students indicated that the career counselor did not advise students on
subject choice while 21% of the students indicated that the career counselor advised students on
subject choice. Teachers and guidance counselors are not likely to discourage students from
enrolling in classes, but to encourage the enrollment in certain classes (Anderson et al., 2008).
Figure 4.9: If the career counselor advised students on subject choice

41
4.7.5 Role of the school on choice of certain science subjects
The students were asked whether the school forced them to do certain science subjects.
According to the findings, all the teachers indicated that the school forced students to do certain
science subjects. This was ascertained by the fact that chemistry was compulsory in the school.
Table 4.17: Role of the school on choice of certain science subjects
Frequency Percentage
Yes 11 100.00
Total 11 100.00

42
CHAPTER FIVE: DISCUSSION, CONCLUSIONS, AND RECOMMENDATIONS
5.1 Introduction
This chapter provides the summary of the findings from chapter four, and also it gives the
conclusions and recommendations of the study based on the objectives of the study. The
objective of this study was to identify factors influencing the choice of science subjects in
Kenya’s secondary education schools, a case study of Langata High school in Nairobi County...
5.2 Summary of the findings
The study found that that the school encouraged students to take up science subjects. The three
science subjects were done in the school. Students’ attitude towards biology was fairly positive,
chemistry was fairly negative and physics was strongly negative.
The study established that there were values attached to subject choice in relation to career
development. Science subjects were competitive in the job market. Students had developed a
career path that they strived to achieve/attain in life. Few students had career paths which needed
science subjects. There were enough science facilities in the school
The study revealed that the teacher influenced the subject choice. Students were averagely
satisfied with teacher’s methodology of handling biology and chemistry. They were less satisfied
with teacher’s methodology of handling physics. Students performed in biology and chemistry
fairly. They performed in physics very poor.

43
The study found that gender did not influence choice of subject. The ratio of boys to girls who
take up biology was 1:1. In addition, the ratio of boys to girls who take up physics was 4:1. More
over, the ratio of boys to girls who take up chemistry was 2:1.
The study established that parents influenced choice of science subjects. Teachers influenced
choice of science subjects’. The school had a career counselor. The career counselor did not
advise students on subject choice. All the teachers indicated that the school forced students to do
certain science subjects.
5.3 Conclusions
The study concludes that when students are allowed to choose which classes to enroll in
increased motivation and independence which in turn increased a student's performance. Physics
was selected by students who had knowledge of its mathematical concepts and symbols. Students
view interdependence of science subjects with mathematics as an obstacle to excellence in these
science subjects. This had made them to perceive physics and chemistry negatively. They
perceived as fairly positive.
The study concludes that negative attitude towards a subject led to lack of interest. Quality of a
subject has tremendous effect on whether a student chooses to enroll in a class. Students had
developed a career path that they strived to achieve/attain in life. Students' enrollment of subjects
was to a moderate extent based on its relevancy to their future career aspirations.
The study concludes that students were averagely satisfied with teacher’s methodology of
handling biology and chemistry and less satisfied with teacher’s methodology of handling
44
physics. A student's attitude about a teacher has a large impact on their attitude toward a class.
Subject teachers play a crucial role in taming students’ choices over the science subject.
The study concludes that there existed gender differences in high school aged students. Gender
influenced choice of subject to some extent. Different perceptions men and women have in
regards to their ability and competency in those certain classes influenced choice of subject.
The study concludes that parents and teachers influenced students’ choice of science subjects’.
School has a great role to play in influencing students’ choice of science subjects.
5.4 Recommendations
5.4.1 Recommendations for Improvement
The study recommends students to have good attitude towards science subjects. They need to
consider their interests, personal academic goals while choosing subjects. Teachers need to adapt
their classes to better meet the needs of students. Curriculum developers need to ensure that
science subjects contain quality content and the workload be reduced.
Students should be encouraged to develop a positive commitment to science at a tender age.
Schools shoud have well equipped laboratories. Competent and qualified teachers should teach
science subjects. Examination council need to ensure that science subjects are assessed fairly.
Science teachers need to develop good relationship with students. Science teachers should strive
to be enthusiastic, well spoken, knowledgeable, caring, and helpful. Subject teachers need to try
to tame students choices over the science subject.

45
Gender differences should be discouraged amongst students. Women should be encouraged to
change their perceptions in regards to their ability and competency. Parents need to encourage
their daughters to take up sciences and show them that they can perform in any career.
Students need rich opportunities to find out about the many ways sciences can be used in
interesting careers. Parents need to help students when making their study choices. The school
should support subjects and careers decision making. Students need to be given information
about the structure and content of the science subjects.
5.4.2 Recommendations for Further Studies.
This study has explored factors influencing the choice of science subjects in Kenya’s secondary
education schools in Langata High school. There is need to research on challenges facing
students while choosing career. The study focused on Langata High school thus the same study
should be done in other schools in Nairobi County to enable generalization of results.

46
REFERENCES
Aghenta J. A. 1989 Educational planning: a turning point in Education and development in
Nigeria. Benin: NSEP.
Ackerman, D.S. & Gross, B.L. (2006). How many choices are good? Measurement of the effects
of course choice on perceptions of a marketing option. Journal of Marketing Education,
28(1), 69-80.
Aigbomian DO 2002. Science for All: Implication for the Teacher and National Development:
14th
Inaugural Lectures of the Ambrose Alli University, Ekpoma, Edo State, Nigeria,
Benin City: Ambik Press.
Alsop, S. & Hicks, K. (eds.), (2001) Teaching Science. London: Kogan Page.
Anderson, N., Lankshear, C., Timms, C., & Courtney, L. (2008). 'Because it's boring, irrelevant
and I don't like computers': Why high school girls avoid professionally-oriented ICT
subjects. Computers and Education, 50(4), 1304-1318.
Babad, E. &Tayeb, A. (2003).Experimental analysis of students' course selection.British
Journal of Education Psychology, 73(3), 373-393.
Bassey, M. (2003). School Science for Tomorrow's Citizen. New York: Pergamon Press.

47
Curran, J.M. & Rosen, D.E. (2006). Student attitudes toward college courses: An examination of
influences and intentions. Journal of Marketing Education, 28(2), 135-148.
Ferrer-Caja, E., & Weiss, M.R. (2002). Cross-validation of a model of intrinsic motivation with
students enrolled in high school elective courses. Journal of Experimental Education,
71(1), p. 41-65.
Flowerday, T., &Schraw, G. (2003).The effect of choice on cognitive and affective
engagement.Journal of Educational Research, 96 (4), 207-215.
Francis L, Greer J 1999. Measuring attitudes towards science among secondary school students:
The affective domain. Journal of Research in Science Teaching, 35(1): 877-896.
Fraser BJ, Docker JC, Fraser D 1999. Assessing and improving school climate. Evaluation and
Research in Education, 2(3): 109-122.
Fraser BJ and Walberg 1995. Twenty years of classroom environment work: Progress and
prospects. Journal of Curriculum Studies, 2(1): 307-327
Grebennikov, L. &Skaines, I. (2009). Gender and higher education experience. Higher
Education Research and Development, 28(1), 71-84.
Kenya National Examinations Council (2012). 2007 KCSE Examination Report. Nairobi:
KNEC.

48
Knecht, W. (1965). Teaching Physics Today. Paris: OECD
Kungania, M. (2006). Factors Influencing Attitude of Diploma Teachers Trainees towards
Mathematics and Science in Kenya, Nairobi. Unpublished Masters Thesis, Kenyatta
University.
Malgwi, C.A., Howe, M.A., & Burnaby, P.A. (2005).Influences on students' choice of college
major.Journal of Education for Business 80(5), 275-282.
Mullis, I.V.S., Martin, M.O. and Foy, P. with Olson, J.F., Preuschoff, C., Erberber, E., Arora, A.
and Galia, J. (2008). TIMSS 2007 International Mathematics Report: Findings from
IEA’s Trends in International Mathematics and Science Study at the Fourth and Eighth
Grades. Chestnut Hill, MA: Boston College, TIMSS and PIRLS International Study
Center [online]. Available: http://timss.bc.edu/timss2007/mathreport.html [4 December,
2012].
Murithi, E. M. (1996). Expectation of Handicapped Students and their Teachers in Learning and
Teaching of Science Subjects in Kenya Special Secondary School for the Physically
Handicapped. Unpublished Masters Thesis, Kenyatta University.
Nagy, G., Trautwein, U., Baumert, J., Koller, O., & Garrett, J. (2006). Gender and course
selection in upper secondary education: Effects of academic self-concept and intrinsic
value. Educational Research and Evaluation, 12(4), 323-345

49
Nosek, B. A. (2006). Moderators of the relationship between implicit and explicit evaluation.
Journal of Experimental Psychology: General, 134, 565–584.
Okeke AN 2000. The impact of school subjects on the choice of careers and profession. West
African Journal of Education, XVII(1): 5 – 11.
Osborne J, Simon S, Collins S 2003. Attitudes towards science: A review of the literature and its
implications. International Journal of Science Education, 25(1): 1049-1079.
Riegle-Crumb, C., Farkas, G., & Muller, C. (2006). The role of gender and friendship in
advanced course taking. Sociology of Education, 79(7), 206-228.
Smith, J.S., Feldwisch, R., &Abell, A. (2006).Similarities and differences in students' and
parents' perceptions of the transition from middle school to high school.Research in
Middle Level Education, 29(10), 1-9 (Anderson et al., 2008, p. 1316).
Tenenbaum, H. (2008). 'You'd be good at that': Gender patterns in parent-child talk about
courses. Social Development, 18(2), 447-463.
Vaidya, N. (2003). Science Teaching for 21st Century New Delhi: Deep & Deep Publication
PVT. Ltd.
Wadsworth, B. J. (1998). Piaget for the Classroom Teachers. New York: Longman.
Waititu, M. (2004). Exploring and Students Perception of Difficulty in Topics Areas of the
50
Kenya Secondary School Physics Syllabus. Unpublished Masters Thesis, Kenyatta
University.
Wasanga, C.M. (1997).The attitude towards science among primary and secondary school
students in Kenya: Academy of Science Publishers
Whitelaw S, Milosevic L, Daniels S 2000. Gender behaviour and achievement: A preliminary
study of pupil perceptions and attitudes. Gender and Education, 12(1): 87 – 113.
Wilhelm, W.B. (2004). The relative influence of published teaching evaluations and other
instructor attributes on course choice. Journal of Marketing Education, 26(1), 17-30.
Zhao, C.M., Carini, R.M., & Kuh, G.D. (2005).Searching for the peach blossom shangri-la:
Student engagement of men and women SMET majors. Review of Higher Education,
28(4), 503-52.

51
APPENDICES
Appendix: Introduction Letter
I am OKUMU JOSHUA OMONDI, a Postgraduate Diploma student at the University of
Nairobi. I am conducting an academic survey on the factors influencing the choice of
science subjects in Kenya’s Secondary schools: a case of Langata High schools in Nairobi
County. You have been randomly selected to participate in this survey. Your answers will
remain strictly confidential and they will be used only for research purposes on aggregate.
Your sincere assistance will help establish extent of the factors and fulfill the objectives of
this study. Information given will be used only for the purpose of this research and will be
accorded utmost confidentiality.
Please fill in the questionnaire as diligently as you can. Tick in the appropriate box where
the question requires you to do so, where the space is provided, and Please fill in your
answer.
Appendix II: Students Questionaire
Section A General Question
1. Gender : Male (1) Female (2)
2. Age (14-18) years (1) Below 14 years(2) Above 18 years (3)
3. What is your religion/denomination?
Catholic (1)
Protestant (2)
Evangelical (3)
Islam (4)
Hindu (5)
Other (specify)………………………………………………………………………….
4. Indicate your class

52
Form two (1)
Form three (2)
Form four (3)
5. Indicate the marks attained in the KCPE exams.
400 Marks and Above (1)
(350-400) Marks (2)
(300-350) Marks (3)
(250-300) Marks (4)
Below 250 (5)
SECTION B: STUDENTS’ PERCEPTION ON SCIENCE SUBJECT
1. Which science subjects are done in your School
Biology (1)
Physics (2)
Chemistry (3)
Others specify_________________________________________________________
2. What is your attitude towards the science subjects rate your feeling using the following
order scale.
Subject Strongly
negative
Fairly
negative
Fairly
positive
Strongly
positive
Biology
Physics
Chemistry
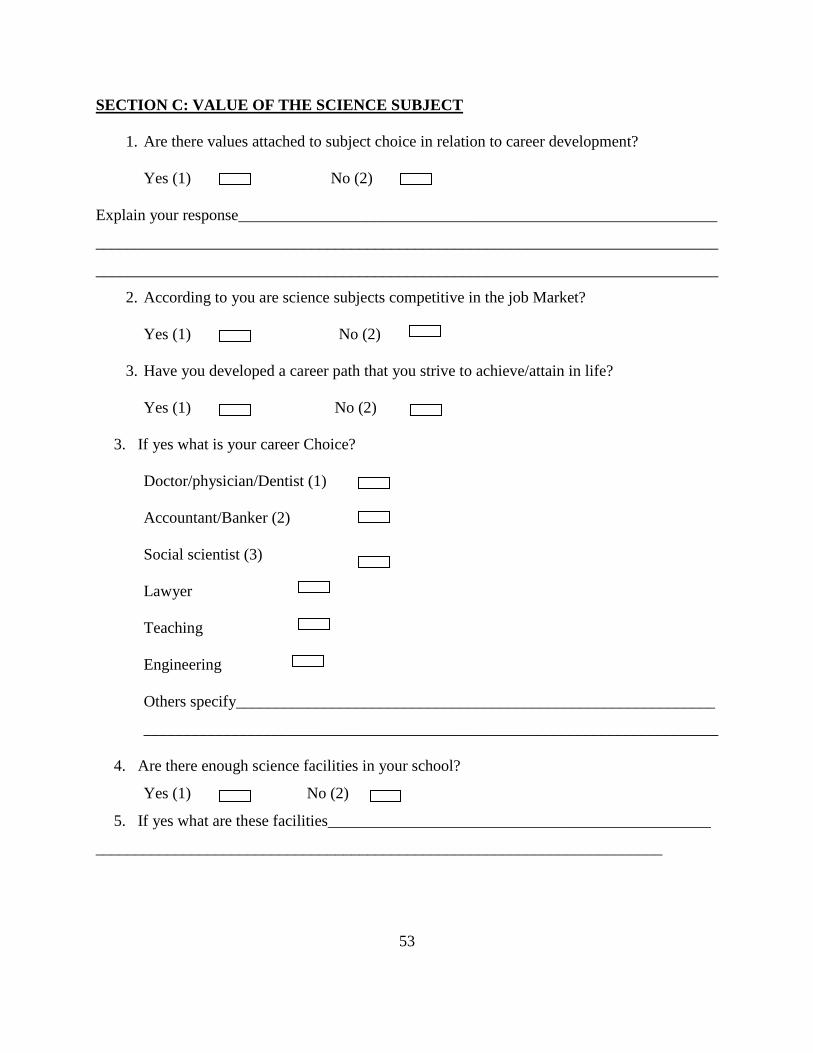
53
SECTION C: VALUE OF THE SCIENCE SUBJECT
1. Are there values attached to subject choice in relation to career development?
Yes (1) No (2)
Explain your response____________________________________________________________
______________________________________________________________________________
______________________________________________________________________________
2. According to you are science subjects competitive in the job Market?
Yes (1) No (2)
3. Have you developed a career path that you strive to achieve/attain in life?
Yes (1) No (2)
3. If yes what is your career Choice?
Doctor/physician/Dentist (1)
Accountant/Banker (2)
Social scientist (3)
Lawyer
Teaching
Engineering
Others specify____________________________________________________________
________________________________________________________________________
4. Are there enough science facilities in your school?
Yes (1) No (2)
5. If yes what are these facilities________________________________________________
_______________________________________________________________________

54
SECTION D: INFLUENCE OF THE SUBJECT TEACHER
Does the teacher teaching you influence your subject choice?
Yes (1) No (2)
If yes explain your argument_______________________________________________
______________________________________________________________________
Rate your level of satisfaction on your teacher’s methodology of handling the subject(which
subject – be specific)
Subject Less satisfied Averagely
satisfied
Highly
satisfied
Biology
Physics
Chemistry
SECTION E: INFLUENCE OF GENDER DIFFERENCES
Does your gender influence your choice of subject?
Yes (1) No (2)
SECTION F: ROLE OF PARENTS AND TEACHERS
Do parents influence on your choice of science subjects?
Yes (1) No (2)
Do teachers influence on your choice of science subjects?
Yes (1) No (2)
55
Does the school have a career counselor?
Yes (1) No (2)
Does the career counselor advice students on subject choice?
Yes (1) No (2)
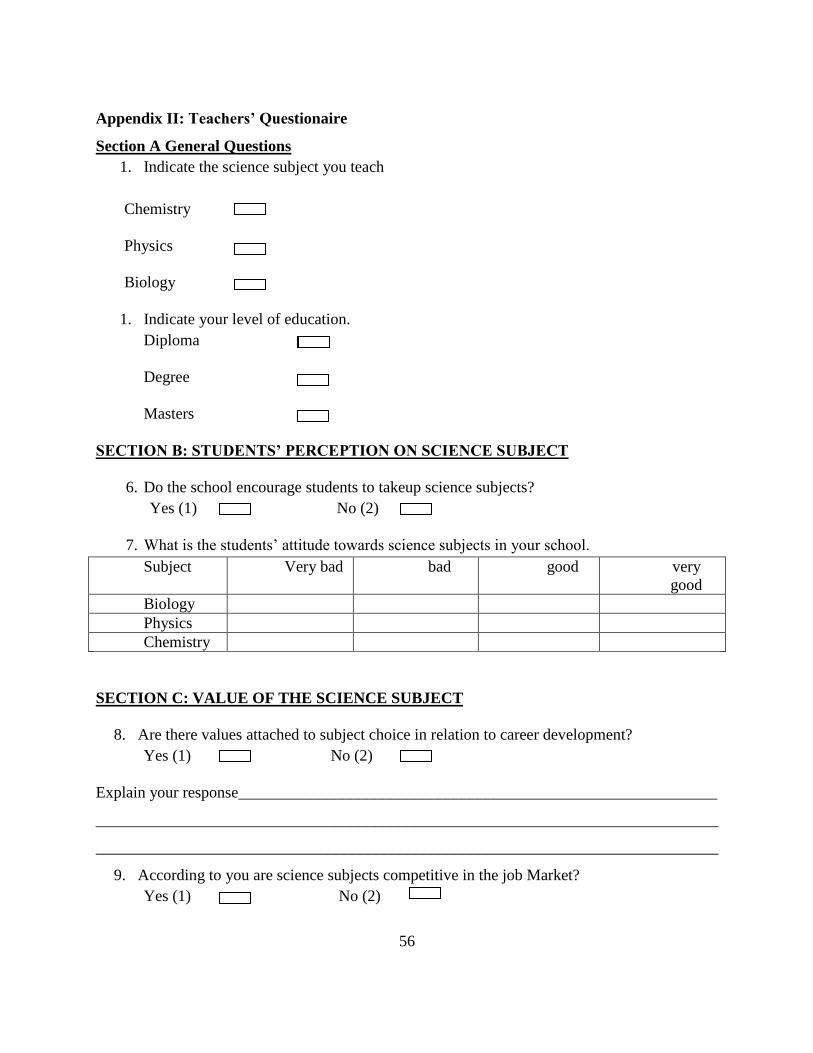
56
Appendix II: Teachers’ Questionaire
Section A General Questions
1. Indicate the science subject you teach
Chemistry
Physics
Biology
1. Indicate your level of education.
Diploma
Degree
Masters
SECTION B: STUDENTS’ PERCEPTION ON SCIENCE SUBJECT
6. Do the school encourage students to takeup science subjects?
Yes (1) No (2)
7. What is the students’ attitude towards science subjects in your school.
Subject Very bad bad good very
good
Biology
Physics
Chemistry
SECTION C: VALUE OF THE SCIENCE SUBJECT
8. Are there values attached to subject choice in relation to career development?
Yes (1) No (2)
Explain your response____________________________________________________________
______________________________________________________________________________
______________________________________________________________________________
9. According to you are science subjects competitive in the job Market?
Yes (1) No (2)
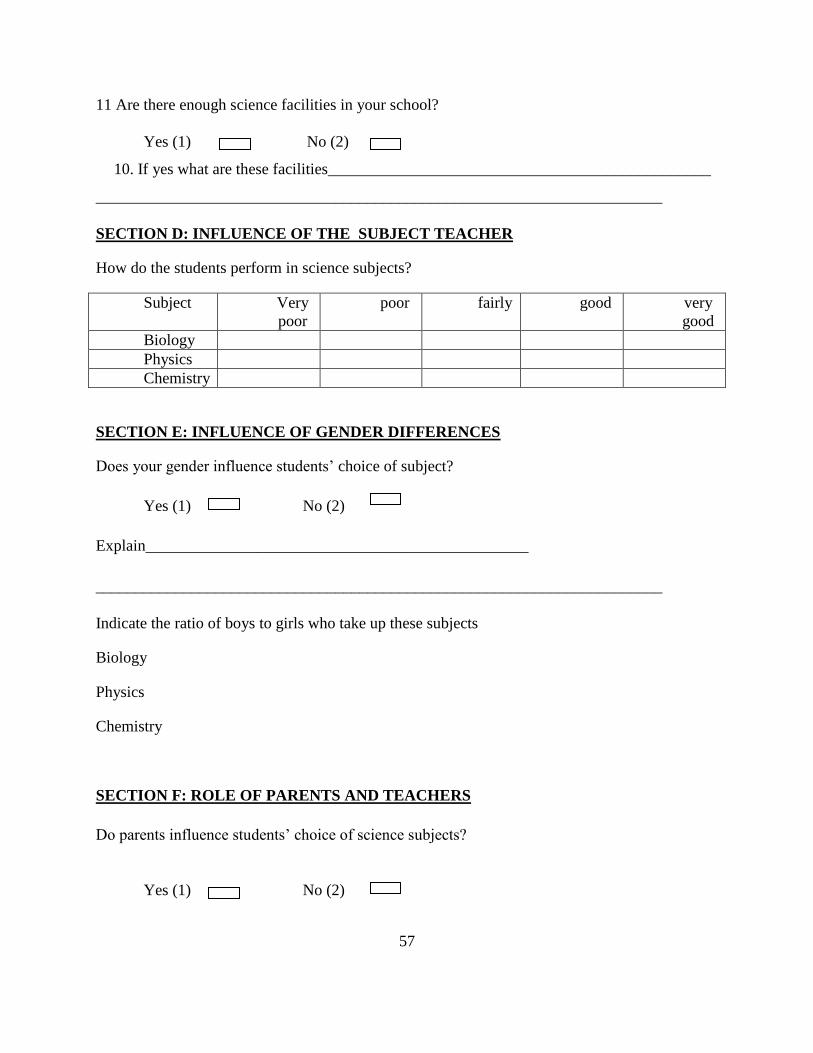
57
11 Are there enough science facilities in your school?
Yes (1) No (2)
10. If yes what are these facilities________________________________________________
_______________________________________________________________________
SECTION D: INFLUENCE OF THE SUBJECT TEACHER
How do the students perform in science subjects?
Subject Very
poor
poor fairly good very
good
Biology
Physics
Chemistry
SECTION E: INFLUENCE OF GENDER DIFFERENCES
Does your gender influence students’ choice of subject?
Yes (1) No (2)
Explain________________________________________________
_______________________________________________________________________
Indicate the ratio of boys to girls who take up these subjects
Biology
Physics
Chemistry
SECTION F: ROLE OF PARENTS AND TEACHERS
Do parents influence students’ choice of science subjects?
Yes (1) No (2)

58
Do teachers influence students’ choice of science subjects?
Yes (1) No (2)
Does you counsel students’ on subject choice?
Yes (1) No (2)
Does the school force students to do certain science subject?
Yes (1) No (2)