Embed Size (px)
Citation preview

Factors influencing quality of education: A case study of eighth
grade students’ mathematics learning achievement in Nepal
By
PANGENI Krishna Prasad
DISSERTATION
Submitted in Partial Fulfillment of the Requirements
for the Degree of
Doctor of Philosophy
in International Development
GRADUATE SCHOOL OF INTERNATIONAL DEVELOPMENT
NAGOYA UNIVERSITY
Approved by the Dissertation Committee
Shoko YAMADA (Chairperson)
Aya OKADA
Koichi USAMI
Approved by the GSID committee: November 19, 2014


i
Table of Contents
Acknowledgements ........................................................................................................ v
List of Tables ................................................................................................................. vi
List of Appendixes ........................................................................................................ ix
Abbreviations ................................................................................................................. x
Chapter 1 Introduction ................................................................................................. 1
1.1 Background ........................................................................................................................... 1
1.2 Statement of Problem ............................................................................................................ 3
1.3 Objective of Study ................................................................................................................ 5
1.4 Research Questions ............................................................................................................... 6
1.6 Organization of Dissertation ................................................................................................. 9
Chapter 2 Theoretical Framework of the Study ...................................................... 11
2.1 Introduction ......................................................................................................................... 11
2.3 Determining Factors for the Quality of Education ............................................................. 14
2.3.1 Family Characteristics and Learning Achievement .................................................... 20
2.3.2 Student Characteristics and Learning Achievement ................................................... 26
2.3.3 Parental Involvement and Learning Achievement ...................................................... 30
2.3.4 School Characteristics and Learning Achievement..................................................... 33
2.4 Assessment of Mathematics Learning Achievement .......................................................... 37
2.5 Assessment of Content and Cognitive Domains of Mathematics Learning ....................... 40
2.6 Chapter Summary ............................................................................................................... 43

ii
Chapter 3 Methodology .............................................................................................. 46
3.1 Introduction ......................................................................................................................... 46
3.2 Sampling ............................................................................................................................. 46
3.3 Data Collection Instruments Used for the Study ................................................................ 48
3.3.1 Mathematics Test......................................................................................................... 48
3.3.2 Survey Questionnaires for Students ............................................................................ 49
3.3.3 Survey Questionnaires for Head Teachers and Mathematics Teachers ....................... 50
3.4 Analytical Approaches ........................................................................................................ 50
3.5 Chapter Summary ............................................................................................................... 53
Chapter 4 Educational Development and Policies to Improve the Quality of
Education in Nepal ...................................................................................................... 54
4.1 Introduction ......................................................................................................................... 54
4.2 Socio-Economic Context of Country .................................................................................. 54
4.3 Educational Development in Nepal .................................................................................... 57
4.3.1 Quantitative Expansion of School Education in Nepal ............................................... 61
4.3.2 Qualitative Expansion of School Education in Nepal ................................................. 67
4.4 Educational Policies in Nepal ............................................................................................. 70
Chapter 5 Factors Determining Mathematics Learning Achievement of Eighth
Grade Students in Nepal ............................................................................................. 72
5. 1 Introduction ........................................................................................................................ 72
5.2 Data Analysis ...................................................................................................................... 72
5.2.1 Distribution of the Mathematics Test Scores .............................................................. 73
5.2.2 Differences in Learning Achievement in Mathematics between Groups of Students 75

iii
5.2.3 Multiple Regression Analysis ..................................................................................... 77
5.3 Factors Determining Students’ Mathematics Learning Achievement ................................ 81
5.3.1 Family Characteristics and Mathematics Learning Achievement ............................... 84
5.3.2 Student Characteristics and Mathematics Learning Achievement .............................. 88
5.3.3 Parental Involvement and Mathematics Learning Achievement ................................ 94
5.3.4 School Characteristics and Mathematics Learning Achievement ............................... 95
5.4 Conclusion .......................................................................................................................... 99
Chapter 6 An Assessment of Mathematics Learning Achievement of Eighth Grade
Students in Nepal....................................................................................................... 102
6.1 Introduction ....................................................................................................................... 102
6.2 Mathematics Test Design .................................................................................................. 105
6.3 Content Domains of Mathematics Test Items ................................................................... 107
6.4 Cognitive Domains of Mathematics Test Items ................................................................ 109
6.5 Methods for Mathematics Test Items Analysis ................................................................. 110
6.6 Assessment of Content Domains of Mathematics Learning ............................................. 111
6.7 Assessment of Cognitive Domains of Mathematics Learning .......................................... 113
6.8 Differential Attainment among Content Domains Compared by Gender, Ethnicity, Type of
school, and Location of School ............................................................................................... 114
6.9 Differential Attainment among Cognitive Domains Compared by Gender, Ethnicity, Type
of School and Location of School........................................................................................... 116
6.10 Relationships among Content Domains of Mathematics Test Items .............................. 118
6.11 Principle Component Analysis of Content Domain of Mathematics Test items ............. 121
6.12 Conclusion ...................................................................................................................... 132

iv
Chapter 7 Conclusion ............................................................................................... 135
7.1 Summary of Findings ........................................................................................................ 135
7.2 Policy Implications ........................................................................................................... 143
References .................................................................................................................. 147
Appendixes ................................................................................................................. 165

v
Acknowledgements
Though this dissertation is an individual work, I would never have been able to
complete it without the support of many people. My sincere gratitude goes to my academic
advisor and chairperson of dissertation committee, Professor Shoko YAMADA. I appreciate
the time and patience she devoted toward my study and the feedbacks she gave me on the
numerous drafts of this dissertation. Her continuous encouragement and support are the
primary sources of the success of this dissertation. I am also grateful to other members of the
dissertation committee, Professor Aya OKADA and Professor Koichi USAMI for their
constructive comments and suggestions on my dissertation.
My special thanks go to the District Education Officers (DEOs) of the Federal
Democratic Republic of Nepal who allowed me to conduct the necessary survey for their
respective schools. I would like to thank head teachers and mathematics teachers including
students who responded the questionnaires for this study.
I would like to thank Mr. Ram Balak Singh, former deputy director of Ministry of
Education, Nepal for his continuous encouragement and support. I would also like to express
my appreciation to friends for their support during my study. My special thanks go to Dr. Jing
Liu, Christian Otchia, and Yuki Shimazu and members of Education and Human Resource
Development program at GSID.
Similarly, I would like to thank my wife, Sharada Sigdel for her continuous support
throughout my study. Finally, even though my father could not observe the process of getting
my Ph. D. degree, I am grateful to him who always used to inspire me for study. I am sure, he
would be the happiest person seeing me getting this degree. Last but not least, my warm
regard goes to my mother for her continuous support.

vi
List of Tables
Table 1.1 Average learning Achievement in Mathematics of Eighth Grade Students in 1999
and 2008 in Nepal .......................................................................................................... 4
Table 3.1 Description of Samples ............................................................................................. 47
Table 4.1 Structure of Education System in Nepal ................................................................... 60
Table 4.2 Expansion of Schools in Various Years ..................................................................... 63
Table 4.3 Promotion, Repetition and Drop-Out Rate of Primary, Lower Secondary and
Secondary Levels of Education in 2012 ..................................................................... 68
Table 4.4 Average Learning Achievement in Various Subjects ................................................ 69
Table 5.1 Distribution of Scores in Mathematics Test by Gender ............................................ 73
Table 5.2 Mean and Standard deviation of Mathematics Learning Achievement by Gender,
Ethnicity, Types of School and School Location .......................................................... 75
Table 5.3 Variable Definitions and Descriptive Statistics (N=762) .......................................... 82
Table 5.4 Standardized regression coefficients for family background, student characteristics,
parental involvement, and school characteristics ....................................................... 83
Table 6.1 Content Domains of Mathematics .......................................................................... 107
Table 6.2 Cognitive Domains and Types of Mathematics Test Items ..................................... 109
Table 6.3 Average Mathematics Learning Achievement according to Content Domains ...... 111
Table 6.4 Average Mathematics Learning Achievement according to Cognitive Domains ... 113
Table 6.5 Average Mathematics Learning Achievement in Content Domains by Gender,
Ethnicity, Types of School and Location of School ................................................. 115
Table 6.6 Average Mathematics Learning Achievement in Cognitive Domains by Gender,

vii
Ethnicity, Types of School and Location .................................................................. 117
Table 6.7 Correlation Coefficient between Mathematics Test Items ...................................... 120
Table 6.8 Principal Component Analysis between Content Domains of Mathematics Test
Items………….. ..................................................................................................... 122
Table 6.9 Rotated Component Matrix of Mathematics Test Items ......................................... 124

viii
List of Figures
Figure 2.1 Conceptual Framework for Factors Affecting Learning Achievement ................... 19
Figure 2.2 Framework for Assessment of Learning Achievement ........................................... 40
Figure 2.3 Stages of Cognitive Learning .................................................................................. 42
Figure 4.1 Education Financing in Nepal ................................................................................. 62
Figure 4.2 Percentage of National Education Budget by Sub-Sector in 2009 .......................... 62
Figure 4.3 Number of Teachers at Primary, Lower Secondary and Secondary Level of
Education in Various Years (in thousands) .............................................................. 64
Figure 4.4 Number of Students in Various Years (in millions) ................................................. 65
Figure 4.5 Net Enrolment Ratio (NER) of Primary, Lower Secondary and Secondary Level of
Education in Various Years ......................................................................................... 66
Figure 5.1 Distribution of Scores in Mathematics Test (Cumulative Percentage) ................... 74
Figure 5.2 Average Learning Achievements in Mathematics by Type of School ..................... 76

ix
List of Appendixes
Appendixes 1: Survey Questionnaires for Students ............................................................... 165
Appendixes 2: Survey Questionnaires for Mathematics Teachers ......................................... 172
Appendixes 3: Survey Questionnaires for Head Teachers ...................................................... 175
Appendixes 4: Mathematics Test Items .................................................................................. 178
Appendixes 5: Marking Scheme for Mathematics Test Items ................................................ 181
Appendixes 6: Classification of Ethnicity by Caste ............................................................... 185
Appendixes 7: Correlation Coefficient of Family Characteristics, Student Characteristics,
Parental Involvement, and School Characteristics ........................................... 186

x
Abbreviations
ADB : Asian Development Bank
BPEP : Basic and Primary Education Project/Program
CBS : Central Bureau of Statistics
CDC : Curriculum Development Center
DEO : District Education Office
CERID : Center for Educational Research Innovation and Development
CIP : Core Investment Program
CPA : Comprehensive Peace Accord
CREATE : Consortium for Research on Educational Access, Transitions and Equity
DOE : Department of Education
ECD : Early Childhood Development
ECED : Early Childhood Education and Development
EDSC : Educational Development Service Center
EFA : Education for All
EFA NPA : Education For All National Plan of Action
EMIS : Educational Management Information System
ERDP : Education for Rural Development Project
EU : European Union
GDP : Gross Domestic Product
GPI : Gender Parity Index
HDI : Human Development Index
HPI : Human Poverty Index
IEA : International Association for the Evaluation of Educational Achievement
ILO : International Labor Organization

xi
JICA : Japan International Co-operation Agency
MOE : Ministry of Education
MOF : Ministry of Finance
NAEP : National Assessment of Educational Progress
NESP : National Education System Plan
NER : Net Enrollment Ratio
NFEC : Non- Formal Education center
NGO : Non-Governmental Organization
NLSS : Nepal Living Standard Survey
NPA : National Plan of Action
OECD : Organization for Economic Co-operation and Development
PCA : Principal Component Analysis
PEP : Primary Education Project
PISA : Programme for International Student Assessment
PTA : Parent Teacher Association
PTR : Pupil Teacher Ratio
RC : Resource Center
SACMEQ : The Southern and Eastern Africa Consortium for Monitoring Educational
Quality
SES : Socio-Economic Status
SESP : Secondary Education Support Program
SIP : School Improvement Plan
SIMPOC : Statistical Information and Monitoring Programme of Child Labour
SLC : School Leaving Certificate
SMC : School Management Committee
SSRP : School Sector Reform Plan

xii
TA : Technical Assistance
TEP : Teacher Education Program
TEVT : Technical Education and Vocational Training
TIMSS : Trends in International Mathematics and Science Studies
UMCE : Unit of Educational Quality Measurement
UNDP : United Nations Development Programme
UNICEF : United Nations Children’s Fund
UNESCO : United Nations Educational, Scientific and Cultural Organization
UPE : Universal Primary education
VDC : Village Development Committee
VEC : Village Education Committee
VIF : Variance Inflation Factor
WB : World Bank
1
Chapter 1 Introduction
1.1 Background
Improving the quality of education, which is generally measured by higher test scores
in examinations (Chapman, Weidman, Cohen, & Mercer, 2005), is a major policy concern,
particularly for developing countries. The benefit of providing education to individuals and
society is enhanced when the quality is higher (United Nations Educational, Scientific and
Cultural Organization [UNESCO], 2005). For example, better learning outcomes, as
represented by students’ test scores, are said to be closely related to higher earnings in the
labor market; thus, differences in the quality of education are likely to indicate differences in
individual worker’s productivity. Furthermore, substantial evidence shows that students who
do better in school, either in grades or standardized achievement tests, tend to have better
school attendance (Hanushek, 1996), which leads to better school completion and
continuation to higher education (Rivkin, 1995). Hence, improving the quality of education is
the core objective of most developing countries, as it benefits individuals and society as a
whole, which leads to higher earnings, higher productivity and higher economic growth
(Hanushek & Kimiko, 2000).
Since the international commitments made on Education for All1 (EFA) in 1990 at
Jomtien, Thailand and the Dakar World Education Forum in 20002, developing countries
1 Education for All is the global movement led by UNESCO, aiming to meet the learning needs of
children, youths and adults. The movement was launched in 1990 at the World Conference on
Education for All (EFA) in Jomtien, Thailand. It reaffirmed education as a fundamental human right
and adopted six goals: universal access to learning, a focus on equity, emphasis on learning outcomes,
broadening the means and the scope of basic education, enhancing the environment for learning and
strengthening partnerships by 2000. 2
In 2000, the target set by Education for All (EFA) was assessed at the World Education Forum at
Dakar, Senegal. The Forum agreed on the Framework of Action, which reaffirmed their commitment
to achieving Education for All by 2015 and set six measurable goals. The goals are to: 1) Expand early
childhood care and education; 2) Provide free and compulsory primary education for all; 3) Promote
learning and life skills for young people and adults; 4) Increase adult literacy by 50 percent; 5)
Achieve gender parity by 2005 and gender equality by 2015; and 6) Improve the quality of education.

2
especially have made remarkable progress in improving access at all levels of education.
However, millions of school age children are still out of school and most of them are in
sub-Saharan Africa and South Asia (UNESCO, 2010). Improving school participation is one
of the measures of overall progress towards universal primary education, but large numbers of
children drop out before completing a full cycle of primary education. Furthermore, many
children fail to master basic literacy and numeracy skills, even when they complete a full
cycle of primary education, which is a loss of human capital that undermines economic
growth and public health, deepens social division, and weakens the foundations of social
participation and democracy (UNESCO, 2010).
Nepal has made remarkable progress in improving access at all levels of school
education, particularly after the establishment of democratic government in 19903, which is
also the benchmark year for the commitment made in the EFA forum to provide quality basic
education to its entire people. This is demonstrated by the fact that the net enrolment ratio
(NER) at the primary level increased from 67% in 1990 to 95% in 2012 (Department of
Education, [DOE], 2012). However, the quality of education as measured by test scores in
examinations is still low, particularly in core subjects. So, in the context of low quality of
education, this dissertation examines the factors affecting the learning achievement in
mathematics of eighth grade students in Nepal. Learning achievement in mathematics is
examined because Nepalese students continuously perform poorly, even though it is the basis
for modern scientific and technological development and an important means of
communication (Cockcroft, 1982; Ndimbirwe, 1995).
3 In 1990, multiparty democracy was re-established by the people’s popular movement. It was a
multi-party movement that brought an end to an absolute monarchy and a beginning of constitutional
democracy. A new democratic constitution was drafted and came into effect in November 1990.

3
1.2 Statement of Problem
After the commitment made to EFA in 1990, the government in Nepal selected
education as a priority sector and increased its resources to provide a basic quality of
education for its people. The gross domestic product (GDP) allocated to the education sector
increased from 2.1% in 1990 to 3.3% in 2009, and during the same period, overall education
expenditures increased from 13% to 17.5%. With the support of internal and external
resources, various programs such as the Basic and Primary Education Project (BPEP I)
(1992-1998), the Basic and Primary Education Program (BPEP II) (1999-2004), Education
for All (EFA) (2004-2009), the Secondary Education Support Program (SESP) (2003-2008),
the Community School Support Program (CSSP), and the Teacher Education Program (TEP)
were implemented. Several innovative policies and programs were introduced, such as
expanding early childhood care and development, scholarships for girls and ethnic minorities
and vulnerable children, improving school physical facilities, performance-based grants to
schools, provision of additional teachers, curriculum reform, provision of textbooks and
instructional materials, the institutionalization of the technical support for teachers, and
improvements in the management of school education.
One of the key results of these initiatives has been greater participation of children and
students at all levels of school education, which is demonstrated by the fact that the net
enrolment ratio (NER) at the primary level increased from 67% in 1990 to 95% in 2012 and
gender parity has been almost achieved at all levels of school education (DOE, 2012). Despite
the substantial progress in expanding educational opportunities, considerable challenges still
remain. First, nearly six percent of primary school-aged children do not participate in
schooling and this proportion sharply increases for higher levels of school education. Internal
efficiency at all levels of school education continues to be poor, with nearly 16% of children
dropping out and 20% repeating grade 1. The survival rate for the primary education level is

4
65% and many students who complete grade five do not transit to grade six. Second,
improving the quality of education is a large daunting challenge. Many children and young
people leave school without developing their potential and without acquiring basic skills
which are necessary for raising their standards of living and the knowledge needed to
effectively function in society.
More importantly, systematic measurements of learning achievements of
internationally acceptable standards are still absent. However, Nepal has carried out national
assessments at regular intervals. An assessment conducted by the Research Center for
Educational Innovation and Development (CERID) in 1999 and another by the Educational
Development Service Center (EDSC) in 2008 revealed that the quality of education, which is
generally measured by higher levels of learning achievement in examinations, was low, and
inequalities between students, particularly with gender, ethnic minority, types of school and
locations, were common. Table 1.1 presents the average score of learning achievement in
mathematics of eighth grade students in 1999 and 2008.
Table 1.1 Average learning Achievement in Mathematics of Eighth Grade Students in
1999 and 2008 in Nepal
Subject 1999 2008
Mathematics 28.9 31.7
Source: Education Development Service Center, 2008, p. 8
Table 1.1 indicates the average learning achievement in mathematics of eighth grade
students in Nepal. It shows that out of possible 100 marks, the average mark in mathematics
of eighth grade students was 28.9 in 1999, and with a little increase it was 31.7 in 2008. In the
context of globalization and the knowledge-based economy, the low level of learning
achievement in Nepalese children is a serious concern for policy makers, teachers and other

5
stakeholders. Studies are carried out to assess the level of learning achievement, particularly
in core subjects; however, none of them have either examined the factors affecting learning
achievement or analyzed the mathematics test itself.
1.3 Objective of Study
Based on the problems mentioned above, I first examine the factors affecting the
quality of education with a specific focus on learning achievement in mathematics of eighth
grade students in Nepal. I particularly examine the effects of four sets of factors: family
characteristics, student characteristics, parental involvement, and school characteristics on
mathematics learning achievement of eighth grade students in Nepal. Second, I analyze the
areas of mathematics learning such as arithmetic, algebra, geometry, and data management
which is known as the content domain that students are expected to learn by the end of
academic year. Similarly, I analyze the knowledge and development of mathematical skills
which is considered as cognitive domain of learning. There are four types of cognitive domain
(knowledge, comprehension, application, and problem solving) which specify the domains or
thinking process to be assessed while students engage with mathematical content (Trends in
International Mathematics and Science Studies [TIMSS], 2011). I further examine the
mathematics knowledge and concepts that are associated with each-others.
It is of interest to examine the determining factors for learning achievement in
mathematics because it informs policy makers and teachers about various factors that affect
children’s performance. At the same time, analyzing mathematics test will provide useful
information to policy makers, curriculum developers, teachers, and other stakeholders to
identify areas, concepts and topics of mathematics that need more focus and effort to improve
the quality of education in Nepal. Similarly, policy makers and curriculum developers,
including teachers, will benefit from knowing what are the mathematical knowledge and

6
concepts associated with each other and which concept needs focus to improve mathematics
learning.
The objectives of this dissertation are as follows:
1. To examine factors affecting learning achievement in mathematics of eighth grade
students in Nepal.
2. To determine the extent to which differences in learning achievement in mathematics
are associated with family characteristics, student characteristics, parental involvement
and school characteristics.
3. To analyze the mathematics learning of eighth grade students by the areas of
knowledge and mathematical skills.
4. To examine the mutual relationships among mathematical knowledge, concepts and
skills to solve problems.
1.4 Research Questions
To fulfill the objectives stated above, this dissertation attempts to answer the following
research questions.
1) What are the factors affecting mathematics learning achievement of eighth grade
students in Nepal?
2) What are the mathematical knowledge/concepts and skills associated with each other,
and which are the knowledge and skills essential to develop further mathematical
knowledge onto them and, then, to improve the mathematics learning of eighth grade
students in Nepal?
7
As I mentioned in the statement of problem, Nepal has made remarkable progress in
improving access to education at all levels of school. However, improving quality of
education which is generally measured by higher test scores in examinations is a major
challenge for educational development of Nepal (Table 1.1). So, in the context of low quality
of education, I answer the first research question which examines the factors affecting
mathematics learning achievement of eighth grade students’ in Nepal. Answering the first
research question is not sufficient because it only explain the factors affecting overall scores
of mathematics tests. So in addition to examining the factors affecting mathematics test, I will
further examine the mathematics knowledge, concepts and skills that are associated one
another, and which knowledge and skills need to be developed primarily so that students can
build further mathematical learning onto them. Answering these two research questions are
important because the first research question will inform the factors associated with overall
mathematics learning achievement, while the second research question will identify specific
areas and skills of mathematics which are associated with one another which constitute
students’ mathematical learning.
1.5 Research Methodology
This study is quantitative in its data analysis because the purpose is to estimate the
relationship between a dependent variable (learning achievement in mathematics) and a set of
independent variables (family characteristics, student characteristics, parental involvement
and school characteristics), and to analyze the mathematics learning of eighth grade students
in Nepal. A multi-stage random stratified sampling method was used to select the samples.
Initially, two stages of sampling –ecological zones and districts –were identified. Based on
the proportion of students in three ecological zones –mountain, hill and lowland (Tarai) –nine
districts were selected: one mountain district, four hill districts, and four lowland (Tarai)
districts. Altogether, the samples consisted of 21 secondary schools with 762 eighth grade

8
students (400 girls). Out of the total 21 sample secondary schools, four secondary schools are
privately managed and 10 secondary schools are in urban areas. The urban area in the context
of Nepal also includes the district headquarters. One head teacher and one mathematics
teacher from each school participated in the study. Four types of instruments -mathematics
tests, and questionnaires for students, head teachers, and mathematics teachers -were
developed to collect the data for this dissertation.
Three types of methods were used to analyze the data for this study. First, multiple
regression analysis is used to answer the first question, which predict the relationship between
the dependent variable (mathematics score) and the independent variables (family
characteristics, student characteristics, parental involvement and school characteristics).
Second, before answering the second research question, by using the weighted mean, I
analyze the areas of mathematics learning (arithmetic, algebra, statistics, and geometry)
known as content domain, and cognitive domain (knowledge, comprehension, application,
and problem solving). Furthermore, I used one-way ANOVA to examine the differences in
areas of mathematics learning such as arithmetic, algebra, statistics, and geometry (content
domain) and cognitive domain (knowledge, comprehension, application, and problem
solving) by gender, ethnic background of students, types of school and location. Finally,
principal component analysis (PCA) is used to answer second research question which
examines the mutual relationships among the mathematics knowledge, concepts and skills for
students to answer test questions. This last analysis is expected also to contribute to identify
areas of mathematics which require to be focused to improve overall mathematics learning.
The details of methods are explained in Chapter 3.

9
1.6 Organization of Dissertation
This dissertation is organized in seven chapters. The introduction explains the
overview of this study. It explains the background of the study, the statement of problem, the
objective of the study, the research questions, and methodology that this study has adopted.
Chapter 2 presents the theoretical framework for this study. It explains how family
characteristics, student characteristics, parental involvement, and school characteristics are
associated with students’ learning achievement. Furthermore, it explains the theoretical
framework for assessments, particularly for mathematics learning.
Chapter 3 explains the methodology that this study has adopted for data analysis. It
describes the sampling strategy, development of instruments for data collection, and methods
for data analyze. It mainly explains the multiple regression analysis and principal component
analysis (PCA) which are the main methods used for data analysis of this study.
Chapter 4 presents an overview of educational development in Nepal, focusing
particularly on the period after the 1990s. It describes the history of educational development,
the current development status of school education, the educational structure, and current
educational policies in Nepal.
Chapter 5 answers the first question, which examine the determining factors for the
quality of education (learning achievement in mathematics). Using the multiple regression
analysis, it specifically examines the effects of family characteristics, student characteristics,
parental involvement, and school characteristics on eighth grade students’ learning
achievement in mathematics in Nepal. It further analyzes to what extent variances in learning
achievement in mathematics is associated with family characteristics, student characteristics,
parental involvement and school characteristics.

10
Chapter 6 answers the second research question. Before answering the second main
research question, it particularly analyzes the distribution of scores among sample students in
terms of the areas of mathematics knowledge such as arithmetic, algebra, statistics, and data
management (content domain) and development of mathematics skills such as knowledge,
comprehension, application, and problem solving (cognitive domain). It further examines the
differences in content and cognitive domains of mathematics learning by gender, ethnic
background of children, types of school, and location of school. Finally, it examines the
mathematical knowledge, concepts and skills that are associated with one another, and the
knowledge and skills which constitute the basis for further mathematical learning and require
more focus in teaching so as to improve the overall level of mathematics learning of eighth
grade students in Nepal. Based on the findings of Chapter 5 and 6, Chapter 7 concludes
findings of this study and implications are discussed, for educational development particularly
improving mathematics learning of eighth grade students in Nepal.

11
Chapter 2 Theoretical Framework of the Study
2.1 Introduction
Chapter 2 presents the theoretical framework for this study. There are three sections in
this chapter. The first section conceptualizes the quality of education. The second section
explains the factors that affect the quality of education, which is the first objective of this
study. It reviews the previous studies on the relationship between children’s learning
achievement and the four factors such as family characteristics, student characteristics,
parental involvement and school characteristics. Despite the fact that most of previous studies
focused on the cases of developed countries, it is still useful to know factors that are
associated with the learning achievement of children in order to conceptualize the framework
of the study in different contexts. The third section explains the assessment practices of
mathematics learning. It particularly focuses on assessment on areas of mathematics learning
(arithmetic, algebra, data management, and geometry) known as content domain and
cognitive domain (knowledge, comprehension, application, and problem solving).
2. 2 Dimension of the Quality of Education
After the Jomtien conference on Education for All in 1990, many countries have
experienced the expansion of educational opportunities, mainly in relation to universal access,
participation, retention, and the completion of basic education. However, improving the
quality of education is still a major challenge. The importance of the quality of education has
been increasingly recognized since it contributes to national development (Hanushek &
Woessman, 2007), sustainable livelihoods (Bangay & Blum, 2010), and individual
capabilities (Lanzi, 2007). However, discussions regarding the quality of education lack both
clarity and a common understanding of what is actually meant by the term quality (Tawil,

12
Akkari, & Macedo, 2011), as well as the determining factors for the quality of education.
Questions relative to the aspects of quality and the ways to measure them have been raised
since long in the past and are still widely debated.
In fact, the quality of education is a notion rather than an operational concept, which
implies that it cannot be captured through any single definition or approach. The
understanding of the quality of education differs according to the view point of people
(Motala, 2001). Different stakeholders such as policy makers, school principals, teachers,
parents, and students may have different understandings, although there is likely to be a
common core of interest in educational outcomes that is relevant for all (Scheerens, 2004).
Parents and communities may value outcomes such as school promotion and
employment as proof of the quality of education. Similarly, “national government officials,
employers and international aid agencies may view outcomes as socio-economic development
such as the increased productivity of workers, economic growth, poverty reduction, and
stronger integration of national economics in globalized knowledge societies and others may
value the civic and political outcomes in terms of greater freedom, strengthened social
cohesion, respect for cultural diversity, and the development of active and responsible
citizenship” (Tawil et al., 2011, p. 13).
Similarly, understanding of the quality of education also varies according to tradition,
such as the humanistic tradition that rejects prescribed standards and externally defined
curricula. Meanwhile, the behaviorist tradition is just the opposite of the humanistic tradition,
as it accepts tests and examinations as a major component of understanding and examining
the quality of learning and the performance of education systems. On the other hand, there are
multiple approaches based on different views about the notion of the quality of education and
how education should lead to change in society. The adult education approach emphasizes
experiences leading to critical thinking as an important aspect of the quality of education. An

13
indigenous approach to quality education focuses on the importance of education’s relevance
to the socio-cultural circumstances of the nation and learners (UNESCO, 2005).
The existing notions of the quality of education and their understanding can be
categorized into two traditions: the economic view of education and the progressive/humanist
tradition (Barrett, Chawla-Duggan, Lowe, Nikel, & Ukpo, 2006). The progressive/humanist
tradition emphasizes learning as the center of the quality of education. It focuses on the
educational processes. Judgments of the quality of education are based on what happens in
schools, and inside the classrooms. Learning of basic cognitive skills, literacy, and numeracy,
as well as general knowledge, are considered vital for the quality of education. This idea is
close to the objective of UNESCO and UNICEF, inspired by a human rights approach to
promote education for humanity, peace and security (Tawil et al., 2011).
The second, economic view of education emphasizes education as an investment for
the acquisition of knowledge and skills which will increase earnings or provide long term
benefits for individuals (Barrett et al., 2006). It examines the relationship among the different
school inputs and relates education as a production function of input-process and output. Input
generally refers to the investment in the salary of teachers and administrative staff as well as
non-salaried activities relating to the production of textbooks, school facilities, teaching and
learning materials, and so on. Process is usually interpreted as the forms of interaction
between teachers and students with a particular focus on classroom practices. Output typically
refers to changes in student achievement, especially in domains of knowledge and skills,
completion rates, certification, attitude and values. Outcome consists of long-term
consequences of education such as employment, earning, and changes in attitudes, values, and
behaviors (Barrett et al., 2006).
The economic view of education uses quantitative, measurable outputs as the indicator
of the quality of education, such as enrolment ratios, retention rates, completion rates,

14
learning achievements, and rates of return in terms of investment in education. This approach
is close to the idea of the World Bank that looks at education as an investment and calculates
the efficiency of the education system in terms of public services that are proficient in the use
of resources for the delivery of education as a public good.
2.3 Determining Factors for the Quality of Education
Empirical evidence clearly indicates that education is the foundation for the
development of individuals and society as a whole. Education is a key factor for the
improvement of people’s economic and social condition (Barro, 1996; Krueger & Lindhahl,
2001). According to human capital theory, “the investment in education leads to the formation
of human capital, which is an important factor for economic growth” (Tilak, 2002, p. 191).
Education and training enhance skills and productive knowledge, and transforms human
beings into more valuable human capital. The skills and productive knowledge imparted
through education increases the productivity of people, and thereby their earnings (Tilak,
2002).
In contrast to human capital theory, the basic needs approach during the mid-1970s
recognized education as a basic need. According to (International Labour Organization [ILO],
1977, p. 28) “Education is itself a basic need and equality of access to educational services,
particularly in rural areas, is therefore important ingredient of basic need strategy”. It supports
to fulfill other basic necessities for instance food and housing which helps to improve the
quality of life. This has the positive effect on women’s behaviors such as housing, use of
water and sanitation, and decisions on fertility, family welfare, and health (Lieras-Muney,
2005), which increases productivity and reduces poverty (Tilak, 2002).
Hence, providing access to education for all people has significant implications for the
development of individuals and society, but Vegas and Petrow (2008, p. xxii) argued that

15
“expansion of educational opportunity has not markedly reduced income inequalities,
underdevelopment and poverty, possibly because of the poor quality of education”. Similarly,
Hanushek and Woessman (2007, p. 21) concluded that “the quality of education as measured
by student achievement on standardized test scores, correlates more strongly with economic
growth than simply spent in school”.
Since the international commitment on Education for All in 1990, many developing
countries have made progress in improving the access and participation of children at all
levels of school education. However, improving the quality of education, which is generally
measured by the higher levels of learning achievement in examinations (Chapman et al.,
2005) is still low and inequalities between and within countries are wide. Differences in the
quality of schooling have a dramatic impact on productivity and national growth rates
(Hanushek & Kimiko, 2000). These authors found a very strong relationship between test
performance and national growth rate and a smaller relationship between the quantity of
education and national growth. Test score provides an important measure of how well the
curriculum is being learned and indicates an achievement at the exit point of the school
system. There is mounting evidence that the quality of education measured by test scores is
related to individual earning, productivity, and economic growth (Hanushek, 1992; Hanushek
& Kimiko, 2000; Hanushek & Woessman, 2007).
In addition to individual earning, productivity, and economic growth, the quality of
education is also associated with school continuation. There is a substantial evidence which
throws light on the fact that students who do better in school, either through grades or
standardized achievement tests, tend to stay longer (Manski & Wise, 1983). Rivkin (1995)
found that variations in test scores contribute to a considerable proportion of the systematic
variation in high school completion and in continuation to higher education, and that it is also
associated with the school attendance (Bishop, 1989; Hanushek, 1996).

16
For a long time educators and researchers have tried to explore what constitutes to the
quality of education. What are the determinants of educational quality? There is no consensus
or common understanding and the quest to better understand and examine the quality of
learning and the performance of education systems still continues. The school is a formal
institution where children and youth learn however, other informal institution such as families
and communities are equally important for children’s learning (Rothstein, 2000). Most of
the findings have highlighted the importance of family characteristics for children’s school
learning, whereas the effect of school characteristics have minimal on children’s learning
achievement (Brooks-Gunn & Duncan, 2000; Coleman et al., 1966). However, debates are
continued on the importance of home and school characteristics (Chevalier & Lanot, 2002;
Schiller, Khmelkov, & Wang, 2002). A significant number of studies have shown the
importance of both family and school characteristics responsible for the learning achievement
of children (Griffith, 1999; Mancebon & Mar Molinero, 2000).
Two influential research reports have initiated the debate on the importance of family
characteristics and school characteristics on children’s educational achievement. The first is
the “Equality of Educational Opportunity” by Coleman et al. (1966) in the United States, and
the second is the “Plowden Report” by Peaker (1971) in Great Britain. They examined the
aggregate effect of quality of school on learning achievement after controlling the children’s
socio-economic status (SES). Their common conclusion was that the amount of variance in
academic achievement accounted for by the socio-economic status of children and pre-school
experiences substantially exceeded the impact of all aspects of school quality taken together.
Although highly controversial, these studies have promoted the debate on the effects of school
characteristics and family socio-economic status on students’ academic achievement
(Gamoran & Long, 2006). Since then, many researchers have tried to argue against these
findings. Although many of these attempts have failed and reconfirmed the earlier conclusion,
few researchers found some counter-evidence in the context of developing countries.

17
Adopting a design similar to Coleman et al. (1966) in the United States, Heyneman
(1976) in his study called “Coleman Report for a Developing Country” looked at students
from 67 schools in Uganda and found a significant effect of school characteristics and weak
effects of family characteristics on students’ academic achievement. Furthermore, using the
data of International Association for the Evaluation of Educational Achievement (IEA)
Heyneman and Loxley (1983) conducted a research in 29 developing and developed countries,
which is commonly known as H-L effect, and advocated that the “proportion of variance in
achievement attributable to family background was generally much smaller and that [the part]
attributable to school quality [was] generally much larger in developing versus industrialized
countries” (p. 1172). They further mentioned that “the predominant influence on student
learning is the quality of schools and teachers to which children are exposed” (p. 1162) and
“the poorer the country, the greater the impact of school and teacher quality on achievement”
(p. 1180). The findings of other studies are in line with the findings of the H-L effect for
example, Fuller (1987) examined 60 multivariate studies of the effect of school resources in
developing countries and concluded that increasing school resources improves school
performance in poor countries. Fuller and Clark (1994, p. 122) concluded that “even when
family background is controlled, school factors such as infrastructure, class size, teachers’
experience and qualifications and the availability of instructional materials increase the
student performance”.
Challenging the H-L effect, other studies claimed that the impacts of school
characteristics do not vary according to the income or level of development of a country. For
example, Baker, Goesling, and Letendre (2002) and Hanushek and Luque (2003) didn’t find
any evidence of the H-L effect in the Third International Mathematics and Science Study
(TIMSS) among grade 8 students. They further mentioned that the finding of Heyneman and
Loxley 1983 with regard to weak effects of family background in less developed countries is
not consistent. They estimated the strong effect of family background on the school

18
performance of children but found that school performance declined with the increase in the
age of children. Similarly, using the data of 1790 students from 60 schools of the Cebu
Longitudinal Health and Nutrition Survey (CLHNS) in the Philippines, Huang (2010, p. 295)
criticized the H-L effect and mentioned that “the school level accounted for approximately
only three to five percent of the variance in overall student achievement”. The larger part of
the variance was at the student level, as other studies have found in developing countries.
Gamoran and Long (2006) criticized findings of TIMSS with regard to H-L effect.
They mentioned that the findings of TIMSS rely on teachers and school heads’ subjective
judgments about the level of school resources in different countries. They further mentioned
that school resources variables collected by the TIMSS “tell us little about objective
differences in levels of resources between different countries” (p. 11). Even though
Heneyman in 1976 found a weak effects of family background in less developed countries
however, there is a significant evidence that socio-economic status have considerable effects
on children’s mathematics and language achievement (Lockheed, Vail, & Fuller, 1986; Niles,
1981). Similarly other studies found significant disparities in enrolment and attainment
associated with socio-economic status: Sather and Lloid (1993) in Pakistan, Stash and
Hannum (2001) in Nepal, and Patrinos and Psacharopoulos (1995) in Bolivia and Guatemala.
In addition to the influence of the socio-economic status of children such as parental
education, occupation, and family income, the academic achievement of children is also
influenced by students’ characteristics. This includes gender, ethnicity, perception of the
school environment, school absenteeism, involvement in household chores, homework
completion and level of motivation (Keith, Reimers, Fehrmann, Pottebaum, & Aubey, 1986;
Konu & Rimpela, 2002; Ma, 1997; Veenstra & Kuyper, 2004). Similarly, parental
involvement in their children’s study to support and provide opportunities to explore and

19
express ideas were found to be vital for academic achievement (Astone & McLanahan, 1991;
Barnard, 2004 ; Fehrmann, Keith, & Reimers, 1987; Iverson & Walberg, 1982).
Finally, although several studies have highlighted the importance of various factors
that are associated with the academic achievement of children, Buchmann and Hannum
(2001) included family characteristics, student characteristics, and school characteristics as
the factor affecting students’ learning achievement. In addition to these three factors, previous
literature highlighted the importance of parental involvement in children’s learning
achievement. So, in the conceptual framework presented in Figure 2.1, I have included
parental involvement as another category of factors that affects students’ learning
achievement.
Figure 2.1 Conceptual Framework for Factors Affecting Learning Achievement
Source: Buchmann & Hannum, 2001, p. 79, author edited.
Family Characteristics
Culture
Student characteristics Learning
achievement
Macro Structural
Forces National policies Global Context
Parental Involvement
School Characteristics

20
2.3.1 Family Characteristics and Learning Achievement
The effect of SES of the family on the child’s learning achievement is one of the most
frequently examined factors. It is because family plays an important role in shaping a child’s
educational experiences and learning achievement (Buchmann, 2002), but this can differ in
several ways (Singh, 1995). A widely accepted view is that SES consists of the financial,
social and cultural capitals that are transmitted from one generation to the next (Buchmann,
2002). The concept of cultural capital generally refers to people’s knowledge, skills, and
education level that may influence the status of an individual in the community. Differences
in cultural capital indicate the differences in the socio-economic status of family between
different status groups (Bourdieu, 1986).
Similarly, family life styles and cultural resources establish the intellectual climate for
children’s educational aspirations and motivations for better performance in school. The
argument behind the relationship between SES and learning outcomes is that families with
higher SES are more likely to have greater access to a wide variety of economic and social
resources (family structure, home environment, and parent-child interaction) and invest more
in education (Becker, 1964). Children in these families are more likely to succeed in school
(Buchmann, 2002) and exhibit higher levels of performance (Veenstra & Kuyper, 2004)
because higher SES family can invest more in education (Behrman & Knowles, 1999).
Similarly, educated parents place high value on child’s education and be more capable and
also more willing to help their children.
Although SES has been at the core of the concept of family background, over time the
concept has expanded to include other aspects of family in order to explain the complex and
multi-dimensional relationship which influences the children’s learning outcome. Generally,
family socio-economic status (SES) comprises by three components- “parents’ education,
parent’s occupation and family income” (Buchmann, 2002, p. 153).

21
In the early 1970s, status attainment research in the United States set down the
foundation for the conceptualization of socio-economic status and methodology to investigate
the intergenerational transmission of status (Buchmann, 2002). The classic study by Balu and
Duncan (1967) presented a basic model for the stratification process, in which a father’s
education and occupational status explain his son’s educational outcome. In the University of
Wisconsin, Sewell and Hauser (1997) conducted a research on the impact of family
background and schooling on children’s educational and occupational attainment, which is
known as Wisconsin model. An important aspect of Wisconsin model is that it attempted to
specify mediating mechanisms by including factors such as aspirations and motivation, by
which family socio-economic status influenced individual educational and occupational
attainment. These classical models provided a framework for the study of family
socio-economic status and students learning outcomes in different contexts. However, the
recent studies have included reading habits at home, number of books at home, and home
environment as measures of cultural capital (Kingston, 2001).
White (1982) included parents’ occupation, education, and income as traditional
indicators of student’s SES. As a part of his meta-analysis, White examined the correlations
between the SES and scores on standardized mathematics tests from 143 studies. He found an
average correlation of .25 for all the studies. Yando, Seitz, and Zigier (1979) computed a
correlation between the SES and arithmetic achievement for 8-year-old students and obtained
a positive correlation of .029. Additional evidence of the positive relationship between the
SES and mathematics performance was found by Welch, Anderson, and Harris (1982), who
analyzed data from the National Assessment of Educational Progress (NAEP) Second
Mathematics Assessment and found that home and community characteristics responsible for
24% of variance in mathematics learning achievement of 17-year-old students. Even if several
studies have estimated the positive relationship between the SES and the school attainment
and achievement, Programme for International Student Assessment (PISA) results indicated

22
that “poor performance in school does not automatically follow from a disadvantaged
socio-economic status, despite the fact that socio-economic status does appear to be a
powerful influence on performance” (Organization for Economic Cooperation and
Development [OECD], 2003, p. 191) and it is not necessarily true that children from the
households with low SES perform worse in school than do children of families with high
SES; results vary by subjects, gender, age and other factors (Heyneman, 1980).
Earlier studies by Coleman et al. (1966) examined 650,000 students from 4,000
schools in the United States and found that family characteristics significantly influence
students educational attainment and achievement because these students had access to greater
economic and social resources to support academic success compared to families with lower
levels of parental education (Hanushek, 1992; McLanahan & Sandafur, 1994; Peters & Mullis,
1997). Most of the earlier studies on the relationship of SES and academic achievement are
concentrated in developed countries, so less is known about the relationship between SES and
children’s learning achievement in developing countries. Generally, in developing countries,
fathers’ occupations and level of education exhibit little variation because parental education
is uniformly low and occupations are predominantly in agriculture. In addition to
socio-economic status (SES), social class differences (e.g. land ownership, caste, and district
of residence) were strongly associated with school attendance in Nepal (Heyneman, 2002;
Stash & Hannum, 2001). Parents’ and grandparents’ social status and literacy were found to
be strongly related to children’s school attendance in Nepal (Jamison & Lockheed, 1987).
Among the factors of SES, parental education has been found to be most significantly
associated with children’s learning achievement (Chevalier & Lanot, 2002; Fuchs &
Woessmann, 2004; Guncer & Kose, 1993; Parcel & Menaghan, 1994; Willms & Somers,
2001; Yayan & Berberoglu, 2004). Using the Third International Mathematics and Science
Study (TIMSS) data from Turkey, Yayan and Berberoglu (2004) estimated the significant

23
relationship between parental education and mathematics learning achievement of eighth
grade students in Turkey. Fuchs and Woessmann (2004, p. 13) used the PISA data and
concluded that the “effects of parental education is larger in reading than math and science,
with the maximum performance difference between students whose parents did not complete
primary education and students whose parents have university degree 34.3 average point in
reading, 26.9 in math and 26.5 in science”. Prior to this, results of PISA in 2000 mentioned
that students whose mothers had completed upper secondary education achieved higher levels
of learning in reading than other students in all participating countries (OECD, 2000).
Similarly, Johnston and Thompson (2006, p. 15) analyzed the PISA data and found
that “students with the higher SES, as measured by parental level of education, number of
books at a student’s home, had a educational benefit over students with the lowest SES”.
However, the effect of fathers’ and mothers’ level of education on their children’s academic
achievement was found different. A research conducted by Engin-Demir (2009) in Turkey
estimated the higher effect of father’s level of education than mother’s level of education in
explaining variances in academic achievement. In most of the cases, mothers’ level of
education was estimated stronger than fathers’ level of education on their children’s academic
achievement. This is because generally mother spends more time and helps their children’s
study more than father.
Similarly, Hungi and Thuku (2010) in Kenya used the data of the SACMEQ II project
and concluded that socio-economic factors are more important to predict school outcomes.
They mentioned that “pupils from homes with better quality houses, many possessions, and
more educated parents were estimated to achieve better in mathematics and readings than
pupils from homes with low quality houses, few or no possessions, and less educated parents”
(p. 36). Similarly, Dincer and Uysal (2010, p. 596) in Turkey concluded that “students whose
24
fathers are at least high school graduates score 10-14 points higher but mother’s education
does not have a significant impact on the school performance of children”.
In addition to the parental education, several studies demonstrated that household
income is related with the student learning achievement (Hanushek, 1992). However, other
studies such as Ganzach (2000) and Chevalier and Lanot (2002) did not find the association
between fathers’ and mothers’ level of education and job status, and student achievement.
However, Lee and Lockheed (1990) in Nigeria found the positive relationship between
schools with a higher proportion of parents with professional jobs and their students’ average
scores of mathematics learning achievement.
In addition to parental education, occupation, and income, researchers have examined
how family structure and size influence learning achievement of children. Several studies
indicated that large number of children in the family is negatively related with children’s
school outcomes because resource are divided (Blake, 1989; Downey, 2001; Patrinos &
Psacharopoulos, 1995). It is obvious that parent can provide fewer resources when number of
children increases in a family. According to Coleman (1991), under such condition all forms
of family capital -financial, human and social -are spread among the children. Various studies’
findings approve these claims that families in larger number of children have less conducive
home environment and lower levels of verbal facility (Parcel & Menaghan, 1994) as well as
higher rates of behavior problems (Downey, 2001). Studies by Blake (1989) and Steelman
and Powell (1991) in United States found a negative effect of number of family members and
learning achievement of children. The negative effects of family size and learning
achievement of children were simulated not only in the United States but also in some other
developing countries including Thailand (Knodel & Wongsith, 1991) and Philippines
(Montgomery & Lloyd, 1997).

25
Even though several studies established the negative relationship between family size
and the learning achievement of children, it is not consistently observed. Shi Anh, Kondel,
Lam, and Friedman (1998) in Vietnam mentioned that the negative relationship between the
number of family members and school attainment disappeared when controls for
socio-economic status were added. Similarly, in Kenya, Buchmann (2000) didn’t find any
effects of the number of family members on children’s probability of school attainment. Not
only the negative effect, some studies reported the positive effect of number of children to
education. Studies by Gomes (1984) in Kenya and Chernichovsky and Meesook (1985) in
Botswana found the positive relationship of number of children to school enrolment and
attainment. These findings indicate that the effects of family size are not consistent across
societies.
It is not only the number of family members that influences the learning achievement
of children. The family structure is also associated with the learning achievement of children.
However, most of the studies were concentrated in the United States and other industrialized
countries. A study by Seltzer (1994) in the United States mentioned that children with a single
parent are more prone to school drop-out and lower learning achievement. Interestingly, in
some African contexts, family headed by female member has found related with greater
educational opportunities for children. For example, a study conducted by Fuller and Liang
(1999) in South Africa mentioned that the absence of father decreases the risk of girls’
dropping out from school. Lloyd and Blanc (1996) analyzed the effects of female headship on
children’s schooling in seven sub-Saharan African countries and found that “children from
female-headed households are consistently more likely to be enrolled in school and to have
completed grade four than children in households headed by men” (p. 270). It is because
female household heads are more likely to invest resources, including time, money and
emotional support, in facilitating the education of children living in their household.

26
2.3.2 Student Characteristics and Learning Achievement
In general, students bring their personality and self-esteem to their studies (Bandura,
1988). Research results have indicated that student characteristics such as gender, ethnicity,
motivation, involvement in household chores, time spent on study, school absenteeism, class
repetition, and pre-primary-education experiences have a association on learning achievement.
Other student characteristics such as students’ perception on teacher support and their
expectations have also been found positive relationship to learning achievement of children
(Verkuyten & Thijs, 2002). Similarly, many studies have investigated the relationship
between learning achievement and children’s motivation to study. Academic motivation
refers to the cognitive, psychomotor and affective psychological processes that influence
students’ learning (Slavin, 1997), guide and sustain study behavior (Schunk, 1990),
contributing to foster students’ engagement in academic activities. Motivated learners are
more likely to use higher cognitive processes to learn, absorb, and retain information and try
to improve their performance even if they face failure.
Gender is a variable frequently used to explain the variations in learning achievement.
By using SACMEQ data, Nguyen, Margaret, and Gillis (2005) in Botswana and Kulpoo
(1998) in Mauritius mentioned that generally girls perform better than boys but variation
appears according to the school’s average level of academic performance and subject if other
factors are held constant. Similarly, Engin-Demir (2009) in Turkey estimated higher scores of
girls than those of boys, which is consistent with the findings of Farkas, Sheehan, and Grobe
(1990) and Veenstra and Kuyper (2004). However, Berberog (2004) and Woßmann (2003)
found lower scores of girls than those of boys in mathematics and science scores though a
UNESCO report on Zimbabwe in 1994 didn’t find any significant gender differences in
learning achievement for reading subjects.

27
In addition to gender, several studies have found that the ethnicity of students is
associated with learning achievement. Generally, children from marginalized ethnic groups or
minority groups tend to have less parental education, fewer materials, and a less favorable
environment at home, which might lead to low performance in school. A study by McEwan
and Trowbridge (2007) in Guatemala found large gaps in learning achievement between
indigenous and non-indigenous children. They recorded the gap from .8 to 1 standard
deviation in Spanish and approximately half of that in mathematics. Similarly, Hungi (2008, p.
158) in Vietnam reported that “pupils who belonged to the Vietnamese ethnic majority group
(Kinh) were likely to achieve better in mathematics (-5.24, 1.79) and reading (-7.47, 1.93)
than pupils who belonged to other Vietnamese ethnic groups”.
Grade repetition is another characteristic that negatively affects students’ self-esteem
and academic motivation and is associated with long-term problems such as poor academic
performance, behavioral problems, and dropping out of school. There might be several
reasons for grade repetition, such as poverty, the high opportunity cost of schooling, and the
low quality of schools in developing countries (Lockheed et al. 1986). Research by Hungi and
Thuku (2010) using the data of SECMEQ in Kenya found a negative relationship between
grade repetition and learning achievement in mathematics and reading subjects.
Analyzing the data collected as a part of major survey that sought to examine the
quality of education offered in Vietnam, Hungi (2008, p. 159) found the similar result for
2010 and mentioned that “students who had never repeated a grade were estimated to achieve
better in mathematics (-10.89, 0.80) and reading (-13.69, 0.95) when compared to students
who had repeated a grade one or more times”. Using the data of the Unit of Education Quality
Measurement (UMCE) evaluation project of 1998 and 1999, Marshall (2003) in Honduras
reported that the first time grade repetition as well as repeating previous grade is associated
with lower marginal achievement in the UMCE exam.

28
It is easy to understand that regular attendance of school is crucial for learning, as it
affects academic success (Gray & Beresford, 2008; Gray & Partington, 2003). Several studies
have demonstrated that school absenteeism is negatively associated with the learning
achievement. There are multiple reasons for school absenteeism. Children who are
excessively absent from school might have the risks for various negative reasons and social
problems (Dube & Orpinas, 2009). However, the reasons might be different according to the
context and socio-economic background of family. Children from poor families are more
likely to provide support to their parents in household activities, particularly in developing
countries, which might be a possible reason for school absenteeism. Hungi (2008, p. 159) in
Vietnam found that “pupils who were never or rarely absent from school were estimated to
achieve better in mathematics (-2.58, 0.20) and reading (-2.33, 0.22) when compared to pupils
who were frequently absent from school”, and the similar result was found by Hungi and
Thuku (2010) in Kenya. It is obvious that pupils who are frequently absent from school
receive fewer hours of instruction and therefore are highly likely to have a lower score
compared to the rest of their classmates who go regularly and receive more hours of
instruction.
Similarly, involvement in household work or economic activities is also associated
with children’s learning achievement. Patrinos and Psacharopoulos (1995), Jensen and
Nielsen (1997), Psacharopoulos (1997), Ravallion and Wodon (2000), and Ray and Lancaster
(2003) are the part of a large literature that provides evidence on the trade-off between
children’s work and schooling. However, most studies focuses on the impact of children’s
labor participation rate rather than hours worked by children, on child schooling. This is
because collecting data on child labor hours is more difficult to obtain than that on child labor
participation rate.
29
Children work in a variety of settings, not only as wage workers but also as
domestic/informal workers. The implications of involvement of children in works differ
according to the context. Children’s involvement in economic activities or household chores
may reduce their study hours. However, it is not clear, theoretically and empirically, to what
extent the child work actually leads to the reduction of human capital development, especially
when children are engaged in household chores. Using the Human Resource Development
Survey Data of Tanzaniya in 1993, Akabayashi and Psacharopoulos (1999) investigated the
relationship between children’s involvement in work and learning achievement. They found
that factors that tend to increase children’s working hours generally tend to decrease their
hours of study with a negative correlation to their reading and mathematics skills. Likewise,
Heady (2003) in Ghana reported that involvement in work outside the household has a
substantial effect on learning achievement.
Using the data of Statistical Information and Monitoring Programme of Child Labour
(SIMPOC), Ray and Lancaster (2003) conducted a research on the involvement in household
chores and its effect on the school attendance and learning achievement of children of the
12-14 years age group in seven countries: Belize, Cambodia, Namibia, Panama, Philippines,
Portugal and Sri Lanka. They found a negative impact of hours spent at work on learning
achievement but with marginal impact. However, in the case of Sri Lanka, involvement in
work approximately 12-15 hours a week was found positively related to child’s schooling and
to his/her study time.
Several researchers have pointed out that the experience of pre-primary education has
a positive impact on learning achievement and low level of class repetition and dropping out.
A study by Save the Children in 2003 in the Siraha district in Nepal found that students with
pre-school experience had a 26% higher rate of promotion from grade 1 to grade 2 than
children who had not attended pre-school (UNESCO, 2003). Students having prescribed

30
textbook and reference materials also perform better than their counterparts with fewer
materials (Veenstra & Kuyper, 2004).
Similarly, students’ efforts in their studies, particularly the time spent on homework,
improve their learning achievement (Keith et al., 1986) and it is a means of communication
between parents, children and schools. Postlethwaite and Wiley (1992) conducted a study in
23 countries, and found higher score in science where students spent more time on homework.
The time spent on homework is associated with student’s motivation to achieve (Stenberg,
Lamborn, Dornbush, & Darling, 1992). However, a study conducted by Engin-Demir (2009)
in Turkey did not find the significant relationship of “homework completion” to children’s
learning achievement, which contradicts the findings of Postlethwaite and Wiley (1992),
Keith et al. (1986), Simmons and Alexander (1978) and Cooper (1989).
2.3.3 Parental Involvement and Learning Achievement
Expanding parental involvement in schooling and their children’s learning has been
viewed as an important strategy to advance the effectiveness and improve the quality of
education (Chrispeels, 1996; Scheerens & Bosker, 1997). Strengthening the relationship
between school and parents is critical because in the context of broader autonomy of schools,
parents can play an important role for the management of school and providing support for
their children’s study at home. However, the research on parental involvement shows
considerable variation to exist in the level of involvement and this variation largely depends
on the socio-economic position and ethnic background of parents (Boethel, 2003). Several
studies found a positive association between parental involvement and cognitive and social
development of children, however, which aspect of development remains unclear (Driessen,
Smit, & Sleegers, 2005).
31
A recent research by Vogels (2002) in Dutch showed parental involvement to be an
important strategy to improve learning achievement of children, although the parental
involvement in the primary education is much greater than in the secondary education. He
categorized four types of parents; partners, participants, delegators, and invisible parents. The
first two types of parents, who have middle to high socio-economic backgrounds, are closely
involved in their children’s schooling. The delegators and invisible parents from a low
socio-economic position participate less both in various activities organized by schools and
their children’s learning at home.
Comparable differences in involving active versus passive parents are evident in
related literature. A qualitative study in Cyprus by Phtiaka (1994) distinguished three types of
parents- strongly involved parents, an intermediate group and a fringe group. The parents in
the first group are primarily highly educated and actively involved in school activities and
their children’s learning at home. The second group of parents is well educated. These parents
make contact with schools when they need some feedback and information about their
children. The third group of parents consists of mostly poorly educated parents who have
considerable difficulties communicating with school and feel powerless in relation to the
school. These three groups of parents show a clear variation in parental involvement related to
the socio-economic position and ethnicity of parents.
The characteristics of parents such as level of parental support, parental level of
education and home environment are found to be positively associated with children’s
schooling. Using the data of a large-scale Dutch primary education cohort study by Driessen
et al. (2005), which contained information on more than 500 schools and 12,000 students and
their parents, parental involvement was examined and considerable parental involvement was
found, but a direct effect could not be demonstrated. There are two kinds of parental
involvement –school-initiated parental involvement and parent-initiated involvement. Most

32
studies have focused on parental involvement from the perspective of school, and only a
limited number of studies have looked at parental involvement from the perspective of
parents.
Whatever the parental socio-economic background and educational status, it is clear
that parents are the first teachers in a child’s life, and it can be initiated with the verbal
stimulation and supportive behavior by parents (Macbeth, 1994). Parents provide
opportunities to their children to explore, express and imagine (Center for Educational
Research and Social Development [CERCOD], 2005). Children learn by observing the
behaviors of parents and siblings, and they try to relate it to their learning. It means that
parents provide vital support for children’s learning while continuing to serve as role models
at home. Parents support their children’s schooling by monitoring whether children do
homework at home and complete it before they go to school. Parents’ support to their
children’s learning at home is important because love, respect, and other emotional support
are crucial aspects of learning and personality development.
Parents’ involvement in their children’s education fosters a positive attitude towards
school, increased homework completion, reduced absenteeism, lower levels of dropping out,
and enhanced learning achievement (Astone & McLanahan, 1991; Epstein, 1987; Fehrmann
et al., 1987; Keith et al., 1986; Stevenson & Baker, 1987). Children attend schools regularly
when their parents encourage them to and monitor their activities and progress because
parental involvement creates a good home environment for the higher attainment in school
(Epstein, 1986). However, parents with lower SES are less involved in their children’s
education than parents with higher SES (Sui-Chu & Willms, 1996).
Several researches in developed countries, such as Grau, Weinstein, and Walberg
(1983) in the United States, Iverson and Walberg (1982) in Australia, show that parental
support powerfully influences what children learn in and outside of the school. Macbeth

33
(1994), in his review of the parental dimension of schools, mentions that “most of the
children’s education happens outside of the school, especially at home, and if parents are the
co-educators of the child, then it seems logical to make the two elements of school learning
and home learning compatible, and for teachers to use home learning as a resource” (p. 303).
Parental involvement is not a new practice in Nepal. The education Act 2001 ensures
the representation of majority of parents in School Management Committee (SMC). They are
generally involved in school management activities. However, a study conducted by Center
for Educational Research and Social Development (CERSOD) in 2005 highlighted that the
involvement in their children’s study is less than in school management activities. About 68%
of students mentioned unfavorable home environment and they are involved more in
household activities than their study. It shows that despite the important role of parental
involvement in improving their children’s learning, a majority of parents are still not fully
aware of their roles in creating and supporting an encouraging learning environment for their
children.
2.3.4 School Characteristics and Learning Achievement
Schools are where teaching and learning activities take place. It is generally assumed
that schools do better if more resources are provided; however, evidences regarding the
relationship between school characteristics and learning achievement of student are
inconsistent. Researchers suggested that increased school resources do not guarantee the
improvement in children’s learning achievement (Hakkinen, Kirjavainen, & Uusitalo, 2003;
Hanushek, 1997; Hanushek & Luque, 2003), however, other researches such as Lockheed and
Verspoor (1991) and Card and Krueger (1996) found a significant relationship between
school characteristics and student outcomes.

34
Hanushek (2003) argued that the traditional approach of simply providing resources is
frequently insufficient and that differences in educational quality between schools are not due
to differences in expenditures, class size, and other commonly measured attributes of teachers.
He further mentioned that the relationship between input and output indicated that national
policies on tend to be very in efficient all around the world. However, conducting a research
in low income countries, Heyneman and Loxley (1983), Fuller and Clark (1994), and
Heyneman (2002) highlighted the importance of schools resources such as school facilities,
teacher-student ratio, teaching learning materials, teacher experience and qualifications in
achieving better student learning. Similarly, other researchers such as Parcel and Dufur (2001),
and Willms and Somers (2001) also found the positive significant effect of school
characteristics on students’ learning achievement. However, Bacolod and Tobias (2006) in the
Philippines estimated only six percent of variances in children’s learning achievement.
Similarly, Fuller (1986) viewed instructional time spent on particular subject,
assignment of homework, feedback from teachers, time on task and active role of students in
the classroom are the major conditions related to the quality of education. However,
Scheerens (2004) put emphasis on the process of education where educational inputs are used
effectively. He further mentioned that quality is not just the result of collision between subject
and object but it is the cause of subjects and objects. Not only the processes of teaching and
learning are important, teacher’s subject knowledge and qualification, teacher-student ratio,
school resources and its location have been found to influence students’ learning achievement
(World Bank, 2004).
Similarly, Dalin (1994) mentioned in-service teacher training, adoption of
locally-related and relevant teaching materials and curriculum, regular support and
supervision by the local communities, and motivated school leadership are the necessary
conditions for the success of every school. Verspoor (1989) suggested that teachers’

35
knowledge of subject matters, their experience with materials and high expectations for
students’ performance, pedagogical processes, teaching practices, and classroom organization
as well as students’ available time and time on task in the classroom are the factors associated
with the quality of education. However, Chapman and Adams (2002) mentioned that quality
inputs were important, but without effective processes, it would be hard to achieve improved
outputs.
Among various school characteristics, the teacher-student ratio has been a widely
examined variable, however, findings are inconsistent. Hanushek (1997) claimed that class
size was not important, but Woessmann (2003) claimed that smaller class size was beneficial
for low performing students in mathematics and science in 39 countries in 1994/1995,
whereas Lindhal (2005) found that the minority and economically disadvantaged children
benefited from smaller class sizes in Sweden. The findings that small class size was beneficial
for low performing and minority and disadvantaged children were consistent with the results
of Angrist and Lavy (1999) in Israel and (Krueger, 2003) in the United States. However,
Hoxby (2000) found that class size did not significantly influence students’ learning
achievement in the United States. Kingdon (1999) did not find a significant relationship but
found that class size was negatively associated with numeracy skills and positively related to
reading skills in India.
The quality of education depends upon various school factors, some of them are the
availability of school facilities, teaching and learning materials, and textbooks. Heyneman
(1980) mentioned that students in developing countries perform much lower than students
from developed countries because of poor school facilities. A research by Mwamwenda and
Mwamwenda (1989) in Botswana found that the performance of students who belonged to
schools with sufficient classrooms was significantly better than that of students who belonged
to schools with insufficient classrooms for mathematics and social studies.

36
Teachers are the people who directly interact with students in classrooms, and their
characteristics such as levels of education, years of experiences, status of training, job
satisfaction and motivation are frequently examined variables to illustrate the relationship to
students’ learning achievement. It is generally agreed that if teachers are motivated, they can
defy the other external effects such as the socio-economic status of students and so on.
Teacher training is one of the important strategies frequently used to improve children’s
learning achievement, but there is little evidence for the effects of teacher training on student
learning achievement. In a meta-analysis of 93 studies, Kennedy (1998) found that only 12
studies showed positive effects of teacher training on student learning achievement. Wiley
and Yoon (1995) and Choen and Hill (2000) are the other researchers who found a positive
effect of teacher training on students learning achievement.
Not only the characteristics of teachers and school facilities are associated with the
learning achievement of children, studies have also highlighted the role of school
management. Traditionally most governments used to keep their education systems under
their control. However, budgetary shortages encouraged many governments to re-examine the
role of private sector in education. A study conducted by Psacharopoulos (1987) in Colombia
and Tanzania found that, while controlling for student ability and socio-economic status,
private school students outperform their public school counterparts. Similarly, Govinda and
Varghese (1993) in India and Williams and Carpenter (1991) in Australia concluded that
private school students outperform their public school counterparts even after controlling for
students’ characteristics and family background.
In the above sections, I explained the factors that are associated to students’ learning
achievement. I particularly mentioned how the studies by earlier scholars suggest the effects
of the family characteristics, student characteristics, parental involvement, and school
characteristics on students learning achievement. Since this dissertation analyzes the learning

37
of mathematics, the section below explains assessment practices, particularly focusing on
areas of mathematics learning (arithmetic, algebra, data management, and geometry) which is
considered as content domain, and cognitive domains (knowledge, comprehension,
application, and problem solving) which specify the domains or thinking process to be
assessed while students engage with mathematical content.
2.4 Assessment of Mathematics Learning Achievement
Assessing the learning achievements of students is not a new practice. Earlier efforts
to assess learning achievement in mathematics began in late the 1950s under the auspices of
UNESCO, with implementation by the International Association for the Evaluation of
Education Achievement (IEA) project, aiming to measure learning achievement and identify
determinants of achievement in different participating countries (Postlethwaite, 2004). This
produced a large body of knowledge with regard to students’ learning achievement in
mathematics in different countries. Until the late 1980s, results of cross-countries studies were
shared mainly with researchers and educators, but after 1990, many governments, particularly
in developing countries, were interested in them because of the belief that the improvement of
learning achievement of students is for national economic development. Moreover, there was
growing public concern that government expenditures allocated to education needed to bring
about higher levels of learning achievement (Ross, Paviot, & Jurgnes-genevois, 2006).
Similarly, the World Conference on Education in Jometian, Thailand in 1990,
mentioned in its fourth article that the focus of basic education should be “…on actual
learning acquisition and outcomes rather than exclusively upon enrolment, continued
participation in organized programs and completion of certification requirements” (UNESCO,
1990, p. 5). Furthermore, the Dakar World Education Forum in Senegal in 2000 emphasized
that “to achieve EFA by 2015 would require, in addition to school participation in education,

38
all nations to improve all aspects of quality of education and ensure excellence so that
recognized and measurable learning outcomes are achieved by all” (UNESCO, 2000, p. 8).
Since then, policy makers and researchers have been interested in knowing whether
students acquire appropriate knowledge, skills, behaviors and attitudes as a result of their
exposure to schooling. International assessments, such as the Third International Mathematics
and Science Studies (TIMSS) organized by the International Association for the Evaluation of
Education Achievement (IEA), the Program for International Student Assessment (PISA)
organized by the Organization for Economic and Co-operation and Development (OECD),
and the Southern and Eastern Africa Consortium for Monitoring Educational Quality
(SECMEQ), with14 African countries participating, are attempting to assess mathematical
learning achievement. However, most previous studies have assessed narrow mathematical
performance and reported quantitative performance differences (differences in mean scores)
rather than qualitative performance differences (mathematical understanding) (Cai, 1995).
Just knowing the difference in overall score of tests is not enough, because it does not give the
information on areas of mathematics learning (arithmetic, algebra, data management, and
geometry), and development of mathematical thinking process (knowledge, comprehension,
application, and problem solving). It is important to know these aspects of mathematics
learning because policymakers and curriculum developers will be informed strong and weak
areas of students which will support to develop educational policies to improve the quality of
mathematics learning.
Generally, there are three types of practices to assess learning achievement: public
examinations, national assessments and cross-national assessments. Public examination is a
popular practice to determine whether an individual student possesses certain knowledge and
skills at the end of an academic year. Public examination of students’ learning outcomes is
used to make decisions about educational certification and job selection. National assessment

39
is a relatively new concept which can provide quantitative as well as qualitative information
about learning achievement. Kellaghan (2004, p. 6) defined “national assessment as an
exercise designed to describe the level of achievements, not of individual students, but also
the whole education system or a clearly defined part of it” and Murphy, Greaney, Lockheed,
and Rojas (1996, p. 2) explained it as a “systematic and regular measure of learning
achievement”. The purpose of national assessment is not primarily concerned with the
individual student performance; rather, its purpose is to find out what all students know and
do not know.
Cross-national assessment also shares common features with national assessment, but
according to Postlethwaite (1988), cross-national comparative studies are generally designed
to meet four objectives: identify what is happening in different countries that might help
improve educational systems and outcomes; describe similarities and differences in
educational phenomena between educational systems and interpret why these exist; estimate
the relative effects of variables that are thought to be determinants of educational outcomes
(both within and between systems of education); and identify general principles concerning
educational effects (p. xx). These four objectives have been implemented while designing
cross-countries studies, especially in the designs of the International Association for the
Evaluation of Education Achievement (IEA) research.
Similarly, (Cai, 1995, p. 4) mentioned that “cross-national studies provide
opportunities to identify effective ways of teaching and learning mathematics in a wider
cultural context”. Examining the outcomes of education in different cultures helps policy
makers to understand how subject matter is taught and is learned and performed by students
in different cultures and provides the framework to assess students’ learning achievement and
curriculum provision (Husen, 1967). Cross-country assessments give some indication of
where the students of a country stand relative to students in other countries. They also show

40
the extent to which the treatment of common curriculum areas differs across countries, and, in
particular, the extent to which the approach in a given country may be idiosyncratic.
According to the TIMSS assessment framework for 2011 (p. 10) (Figure 2.2), three
types of curriculums- intended curriculum, implemented curriculum, and attained curriculum
-are to be assessed. The intended curriculum describes what the national and social context
intends for students to learn, while implemented curriculum focuses on what is actually taught
in classrooms and the characteristics of teaching. Finally, attained curriculum focuses on what
students have learned against the intended and implemented curriculum. This dissertation
only focuses on attained curriculum because one of the purposes is to assess the level of
content and cognitive domain of learning mathematics among eighth grade students in Nepal.
Figure 2.2 Framework for Assessment of Learning Achievement
Source: Trends in International Mathematics and Science Studies, 2011, p. 10
2.5 Assessment of Content and Cognitive Domains of Mathematics Learning
Traditionally, competencies of mathematics were measured by the aggregate scores of
performance-test score of students, but not much investigation has been done regarding the
capacities of students to answer respective questions in the test. But contemporary views
emphasize the cognitive process in respect to how people mentally represent and process
information (Anderson, 1985; Simon, 1989). This emphasizes the importance of thinking,
Intended curriculum National, social and
educational context
Implemented curriculum School, teacher and
classroom context
Attained curriculum Student outcome

41
reasoning, conceptual understanding, problem solving, and communication (Cai, 1995).
Cognitive research revealed that “learning is not simply a matter of the accretion of subject
matter concepts and procedures; it consists rather of organizing and restructuring of this
information to enable skillful procedures and processes of problems representation and
solution" (Glaser, Lesgold, & Lajoie, 1985). According to Glaser et al. (1985), there are
different levels of knowledge organization and different degrees of cognitive processes and
procedural skills involved in different stages of learning. Examining the contemporary views
could explain similarities and differences in mathematics performance of students, help to
know their current status of developmental of mathematical thinking and reasoning, and
provide diagnostic and decision-making information to resolve learning difficulties.
In order to ensure alignment with the changed view of mathematics, the approaches of
assessing the learning outcomes has also changed. Generally, assessing learning outcomes is
undertaken in two dimensions –the content dimension and the cognitive dimension. First, the
content dimension includes the areas of mathematics or subject matters to be assessed, such as
arithmetic, algebra, statistics, and geometry, which gives information about performance
according to areas of mathematics and helps teachers to know which area/s they should focus
on more to effectively support students to achieve better.
Second, the cognitive dimension focuses on thinking and reasoning processes.
Learning does not happen as an event. It is a process which progresses continuously. An
influential work by Benjamin Bloom in 1956 developed a system of categories of learning
behavior known as “Bloom’s taxonomy” to assist in the design and assessment of educational
outcomes. He categorized the three domains of learning -cognitive, affective and psychomotor.
According to Bloom’s taxonomy, the cognitive domain focuses on knowledge and
development of intellectual skills, while the affective domain focuses on changing attitudes,
feelings, and emotions, and the psychomotor domain focuses on changing behavior or skills

42
of learners. Within each domain, there are multiple levels of learning that progress from basic
to complex or deeper levels of learning. I explain the cognitive domain of learning because
one of the objectives of this dissertation is to analyze the mathematics learning of eighth
grade students in Nepal. Cognitive domain involves the development of mental skills and the
acquisition of knowledge. It includes the recollection or recognition of specific facts,
procedural patterns and concepts that assist to develop the intellectual abilities and skills.
There are six categories arranged from the simplest behavior to the most complex. That is, the
first one must be mastered before the next one can take place (Figure 2.3).
Figure 2.3 Stages of Cognitive Learning
Evaluation
Synthesis
Analysis
Application
Comprehension
Knowledge
Source: Benjamin & Krathwohl, 1956, author edited
Knowledge is the first step, which is defined as the remembering of previously learned
information. This involves the recall or recognition of facts and procedures. Comprehension
focuses on the ability to understand the meaning of given information. This cognitive skill
goes one step beyond the first category which is to recall or recognize facts and procedures.
Application refers to the ability to use learned knowledge in the new situations. The cognitive
skills of application requires a higher level of understanding than those under comprehension.
Analysis, synthesis and evaluation are the higher levels of learning, which focus on
interpretation, creative thinking and assessing the effectiveness. Cognitive skills at these

43
levels require a higher intellectual capacities than the comprehension and application because
it requires an understanding of both the content and structural form of the material.
2.6 Chapter Summary
There are three sections in Chapter 2. The first section explains the concept of quality
of education. Quality of education is a notion rather than operational concept, which implies
that it cannot be captured by single definition or approach. The understanding of the quality of
education differs according to the viewpoints of people and their academic traditions. The
existing notion of quality of education can be categorized into two traditions: the
progressive/humanist, and the economic view of education. The progressive/humanist
tradition emphasizes acquisition of knowledge by students as the center of the quality of
education, while economic view of education emphasizes education as an investment for the
acquisition of knowledge and skills which will increase earnings or provide long-term
benefits for individuals.
Highlighting the importance of quality of education, the second section explained
determining factors for the quality of education. Empirical evidences indicate that education
is the fundamental factor for peoples’ economic and social development (Barro, 1996;
Krueger & Lindhahl, 2001). According to the human capital theory, the investment in
education leads to the formation of human capital, and is an important factor for economic
growth of a country. The skills and productive knowledge imparted through education
increases the productivity of people, and thereby their earnings. Education is itself a basic
need which supports to fulfill other basic necessities such as food and shelter which help to
improve the quality of life.
Hence, providing access to education for all people has significant implications for the
development of individuals and societies, but evidences indicated that expansion of
44
educational opportunity has not markedly reduced income inequalities, underdevelopment and
poverty, possibly because of the poor quality of education (Vegas & Petrow, 2008). Since
long time educationists and researchers have tried to answer the questions as follows: What
constitutes the quality of education? What are the determinants of education quality?
However, no consensus has been made and the quest for answers still continues.
School is a formal institution that educates children and youth, and learning is a
product of it, but the role of family, communities, and peers are also highly recognized.
However, there is a debate on the relative effects of home and school related factors on
students’ learning outcomes from education at school. The debate on the importance of family
and school factors on students’ learning achievement was initiated by the findings of Coleman
et al. (1966) in the United States. They examined the aggregate effect of school quality on
academic achievement after controlling the students’ socio-economic status. The conclusion
was that the amount of variance in learning achievement accounted by socio-economic status
of student is larger than the impact of all aspects of school quality. Since then, many
researchers have tried to reexamine the effect of home, and school factors on students’
learning achievement.
In addition to family socio-economic and school factors, students’ learning
achievement is also found influenced by their own characteristics. This includes gender,
ethnicity, school absenteeism, involvement in household chores, homework completion
(Keith et al., 1986; Konu & Rimpela, 2002; Veenstra & Kuyper, 2004). Similarly, parental
involvement in their children’s study to support and provide opportunities to explore and
express ideas were found to be vital for learning achievement (Astone & McLanahan, 1991;
Barnard, 2004 ; Fehrmann et al., 1987; Iverson & Walberg, 1982). Although several studies
have highlighted the importance of various factors that are associated with the learning
achievement of children, most of them appear to focus on four factors: family characteristics,

45
student characteristics, parental involvement, and school characteristics which is presented in
Figure 2.1 as the conceptual framework for this study.
The final section of Chapter 2, explains assessment practices, particularly assessment
of mathematics learning. Traditionally, competencies on attained curriculum were measured
by the aggregate test scores of students, but contemporary view emphasizes on cognitive
process which focuses on the development of knowledge and thinking processes. Generally,
assessment of attainted curriculum is assessed in two domains- content domain, and cognitive
domain. Content domain focuses on the areas of mathematics or subject matter (arithmetic,
algebra, data management, and geometry) that students are expected to learn by the end of the
academic year, while cognitive domain focuses on the development of mental skills and the
acquisition of knowledge in the process of learning.
As I have presented the conceptual framework in Chapter 2 (Figure 2.1), Chapter 5
examines the effect of family characteristics, student characteristics, parental involvement,
and school characteristics on eighth students’ mathematics learning achievement in Nepal.
Similarly, according to the conceptual framework (Figure 2.2), Chapter 6 analyzes
mathematics learning particularly focusing on areas of mathematics knowledge (content
domain) and the mental and cognitive skills applied in the process of learning (cognitive
domain). However, before presenting the research findings, Chapter 4 provides the
background information, especially educational development in Nepal. The following Chapter
3 explains the methodology that this study has adopted to analyze the data.

46
Chapter 3 Methodology
3.1 Introduction
Chapter 3 explains the methodology that this study adopted for data analysis. It
explains the development of data collection instruments, sampling, procedures of data
collection, and analytical approaches. There are three sections in Chapter 3. The first section
explains the sampling strategy, including the descriptions of samples. The second section
explains the development of instruments for data collection. It explains four types of data
collection instruments -mathematics test design by the author, survey questionnaires for
students, and survey questionnaires for head teachers and mathematics teachers. The final
section explains the analytical approaches. It particularly explains the multiple regression
analysis and principle component analysis (PCA). Multiple regression analysis is used to
examine the factors affecting learning achievement in mathematics, while PCA is used to
examine the relationships between mathematical items.
3.2 Sampling
This study is quantitative in its data analysis because the purposes are to estimate the
relationship between a dependent variable (mathematics test scores) and independent
variables (family characteristics, student characteristics, parental involvement, and school
characteristics), and to assess the mathematics learning achievement for eighth grade students
in Nepal. The survey of this study was carried out from May 2011 to July 2011 in nine
districts covering three geographical zones -mountain, hill and lowland (Tarai). The selection
of country has significance because Nepal has not participated in any international
assessments so far, and none of the studies have examined the determining factors for
learning achievement in mathematics focusing on the Nepalese cases.

47
A multi-stage random stratified sampling method was used to select the samples.
Initially, two stages –geographical zones and districts –were identified. Based on the
proportion of students from three zones –mountain, hill and lowland (Tarai) – nine districts
were selected: one mountain district, four hill districts and four lowland (Tarai) districts.
Altogether, the sample consisted of 21 secondary schools with 762 eighth grade students (400
girls). Schools within the districts were purposefully selected, taking into account
characteristics such as public, private, rural, urban and so on. To ensure the representation of
schools from all five regions of the country, three schools were selected from the far western
region, seven schools from the mid-western region, two schools from the western region,
seven schools from the central region and two schools from the eastern region. Different types
of school (public or private) and schools located in rural and urban areas were also included
because a current debate in Nepal concerns the extent to which differences in learning
achievement are related to school characteristics. Out of the total 21 sample schools, four
schools are privately managed and ten schools are from urban areas. Urban areas in the
context of Nepal also includes the district headquarter. One head teacher and one mathematics
teacher from each school participated in the study. The description of the sample is presented
in Table 3.1.
Table 3.1 Description of Samples
Location Districts Schools Location Student Mathematics
teacher
Head
teacher
s
Public Private Urban Rural
Mountain 1 1 1 34 1 1
Hill 4 8 2 5 4 328 10 10
Lowland (Tarai) 4 8 2 6 5 400 10 10
Total 9 17 4 11 10 762 21 21
Source: Survey conducted by the author

48
3.3 Data Collection Instruments Used for the Study
Four types of instruments -mathematics test, questionnaires for students,
questionnaires for head teachers, and questionnaires for mathematics teacher- were developed
to collect the data for this dissertation. The mathematics test was designed and conducted with
eighth grade students in Nepal to assess the level of learning, while student survey
questionnaires were developed to collect the data on students’ family characteristics, their
own characteristics, and their perception of parental involvement in their study. Similarly,
survey questionnaires for head teachers and teachers were distributed to collect the data on
school and mathematics teachers’ personal and professional characteristics. The details of
each instrument are explained below.
3.3.1 Mathematics Test
There were two purposes for designing the mathematics test for this study. The first
purpose was to measure the overall learning outcomes in mathematics of eighth grade
students in Nepal. The second purpose was to assess students’ capacity to answer questions in
different areas of mathematics learning such as arithmetic, algebra, data management, and
geometry which is regarded as content domain of learning, and cognitive skills students can
use in the process of solving problems which is regarded as cognitive domain of learning. The
mathematics test was designed in line with the national curriculum. Altogether, 20
mathematical test items were included in the test, with the maximum marks of 50.
Mathematics test items were categorized in three types of questions: objective questions, short
questions and long questions. The objective questions are related to mathematical facts where
students need to recall mathematical knowledge. The short questions measured the students’
ability to apply knowledge and conceptual understanding of mathematics. The long questions
measured the students’ ability to solve mathematical problems within relatively complex
contexts which require students to follow multiple steps.

49
The weightage of each type of question was assigned according to the teaching hours
weighted in national curriculum. Objective questions were assigned one mark each, short
questions were assigned two marks each, and long questions were assigned four marks each.
The mathematics test was conducted with grade 8 students at the end of academic year to
ensure the completion of teaching and learning of the curriculum designated for this grade of
education. Similarly, the marking scheme was developed in order to maintain the consistency
for correcting the answer sheet. The copy of marking scheme is included in Appendix 5. The
detailed explanation of the mathematics test is included in Chapter 4 and a copy of the test
used for this study is included in Appendix 4.
3.3.2 Survey Questionnaires for Students
The student survey questionnaires consisted of three sections. The first section
included the information of family characteristics such as number of family members, number
of siblings, father’s and mother’s level of education, occupation, income, traveling time to
school, number of books at home, and presence of certain items at home (radio, television,
telephone, bicycle, computers, cooking gas, and motorbike). The second section focused on
the personal characteristics of students such as gender, number of days absent from school,
grade repetition since admission to school, homework completion, number of hours spent
studying at home, number of hours spent on household chores, preschool experience,
perception of mathematics teachers’ teaching and learning, and academic motivation. The
final section related to students’ perception of their parents’ involvement in their education. It
included the information about parental support for their studies, particularly homework,
parental encouragement, parental monitoring of their children’s studies, and parental
relationship with school. To ensure the consistency of the student survey questionnaires, pilot
testing was conducted in one of the public secondary schools in the Bardiya district in the
mid-western region of Nepal, which was not included in the study sample. The schools were

50
selected by their characteristics such as combination of students’ of socio-economic
background, school types, and location.
3.3.3 Survey Questionnaires for Head Teachers and Mathematics Teachers
Questionnaires were also administered to head teachers and mathematics teachers. The
survey questionnaire for head teachers was designed to get data on schools’ physical
conditions and human resources management. The head teachers’ survey questionnaires
mainly included data such as location of the school (rural/urban), types of school
(public/private), number of teaching staff, number of students in total and in grade eight,
condition of the school facilities, and school days open in a year. Furthermore, it focused on
the head teachers’ personal and professional characteristics such as age, teaching experience
(years), academic qualifications, status of training (teachers’ training and management
training). Similarly, the survey questionnaires were distributed to mathematics teachers to get
personal and professional data, which included age, sex, teaching experience, training status,
academic qualifications and their perceptions about the relationships with the head teacher
and the community.
3.4 Analytical Approaches
Three types of approaches were used to analyze the data for this study. First, multiple
regression analysis was used to answer the first and second research questions, which intend
to investigate the relationship between the dependent variable (mathematics score) and the
explanatory variables (family characteristics, student characteristics, parental involvement and
school characteristics). The justification for adopting the multiple regression analysis is that
the nature of the dependent variable (marks in mathematics) of this study is a continuous type
of variable, and when a dependent variable is continuous, a standard practice is to assume a

51
linear functional relationship with the explanatory variables (Muijs, 2004) which is
represented by the following equation.
Yi = (b0 +b1X1 +b2X2+ ………+ bnXn) + ei
Yi is the outcome variable, b0 is the coefficient of the regression model, b1 is the
coefficient of the first predictor (X1), b2 is the coefficient of the second predictor (X2), bn is
the coefficient of the n-th predictor and ei is the difference between the predicted and observed
value of Y for the i th participant.
There are three techniques to enter independent variables into the regression equation.
They are simultaneous, stepwise, and hierarchical regression method. The simultaneous and
stepwise techniques are suitable for prediction, while the hierarchical regression is generally
used for the explanatory studies (Ma, 1997). The simultaneous entry approach was used to
enter the variables in the regression model because the goal of the study was predictive rather
than explanatory (Cohen & Cohen, 1983).
There were some qualitative or categorical variables which assigned numbers to
qualitative information for the sake of quantitative analysis. One of coding methods to turn
qualitative information into quantitative variable is a dummy coding. A dummy variable takes
the value 0 or 1 to indicate the absence or presence of some categorical effect. Some of the
variables, such as fathers’ and mothers’ occupation and income, were not included in the
regression model because the high degree of multi-collinearity among them. Generally, in
developing countries, if the parents have a high level of education, it is likely that he or she
will have an occupation, which means that they earn income. The education level of the
parents can explain the other two variables.
While conducting the multiple regression analysis, a casual priority of independent
variables in explaining the dependent variable is specified. (Cohen & Cohen, 1983). The

52
priorities of entering the independent variables were determined based on the conceptual
framework that was discussed in the literature review section. Their causal priority of set of
independent variables is determined as follows:
Family characteristics are related with student characteristics such as the time spent on
household chores, the time spent studying, homework completion, preschool experience
and academic motivation.
Family characteristics and student characteristics are related with parental involvement in
children’s schooling.
Family characteristics, student characteristics, and parental involvement are related with
school characteristics.
To predict the relationship between dependent variables (mathematics test score) and a
set of independent variables, four types of separate and combined models were developed.
The models suggested how students’ learning outcomes are affected by the combination of
factors such as family, student’s own characteristics, school characteristics and parental
involvement.
Second, the weighted mean was calculated to assess the content and cognitive
domains of mathematics learning. The weighted mean was used this way because different
mathematical items had different means. For example, within the arithmetic content domains,
the mean for whole number is 65 and the mean of profit and loss is 12. After assessing the
level of content and cognitive domains, one-way analysis of variances (abbreviated as
one-way ANOVA) was calculated to examine the differences in content and cognitive
domains of mathematics learning achievement by gender, the ethnic background of student,
types of school and location of school. Finally, I used principal component analysis (PCA)
which is a multivariate technique in which observations are described by several interrelated
variables. In other words I used PCA to examine how the mathematics test items are

53
interrelated with each others. PCA is a mathematical procedure that transforms a number of
(possibly) correlated variables into a smaller number of uncorrelated variables. Before
conducting the PCA, I examined the Pearson’s correlation analysis to examine strength of
relationships between mathematics test items included in this study (Table 6.7).
3.5 Chapter Summary
I conducted multiple regression analysis to examine the factors affecting mathematics
learning achievement of eighth grade students in Nepal. I particularly examined the
relationship between aggregate scores of mathematics test as the dependent variable and
family characteristics, student characteristics, parental involvement, and school characteristics
as independent variables which is explained in Chapter 5. Similarly, I calculated weighted
mean, one-way ANOVA, and PCA in Chapter 6. I used weighted mean to examine the
average score of content and cognitive domains of mathematics learning, while one-way
ANOVA and PCA were used to examine the differences in these domains by gender,
ethnicity, types of school and location of school, and to identify the relationship among
distribution patterns of students’ marks for respective questions of the mathematics test for
this study. However, before presenting the data analysis and research findings, the following
Chapter 4 provides the background information of this study particularly educational
development in Nepal.

54
Chapter 4 Educational Development and Policies to Improve the Quality of
Education in Nepal
4.1 Introduction
This chapter provides a brief introduction to the socio-economic context and status of
educational development in Nepal. There are two sections in this chapter. The first section
provides an introduction to the Nepalese socio-economic context, which includes culture and
tradition, geography and the current development status of the country. The second section
explains the educational development of the country, which includes the quantitative and
qualitative expansion of educational development in the country. Educational development
after 1990 is presented because after the commitment made to the goals of Education for All
in 1990, Nepal has made remarkable progress, particularly with school participation of all
levels of education. The final section explains the current educational policies to improve the
quality of education in Nepal.
4.2 Socio-Economic Context of Country
Nepal is a small landlocked country located in the south Asia, sandwiched between the
Republic of India in the east, west and south and the People’s Republic of China in the north.
It has a total land area of 147,181 square kilometers. The country has a total population of
26.6 million that consists of 92 different language groups, 125 caste/ethnic groups, and 10
religious groups (Central Bereau of Statistics [CBS], 2011). The official language is Nepali,
which is spoken as a first language by 44.6% of people, followed by Maithili with 11.7%,
Bhojpuri with 6%, and Tharu with 5.8%. There are ten religious groups reported in the
2011census. The majority in Nepalese people, more than 81%, are Hindus, followed by 9
percent Buddhists, 4.4 percent Muslims, and 3 percent Kirants (an indigenous religion).

55
Nepali society has deep roots with the Hindu caste system, with a hierarchy of different
groups of people within the system since ancient times. Caste-based exclusion and
discrimination are not only historical facts but also are constantly reinvented in the present
day through social institutions and relationships.
Geographically, the country is divided into three distinct ecological regions. The
mountain region, at an altitude between 4,877 and 8,848 meters, comprises 35% of the land
area; the hills, at an altitude between 610 to 4876 meters, comprises 42% of the land area; and
the lowland (Tarai) region, which is an extension of the Gangetic Plains, lies below an
elevation of 610 meters and comprises 23% of the land area. For administrative purposes,
there are 5 development regions, 14 zones, and 75 districts. Each district consists of a number
of Village Development Committees (VDCs) and municipalities, which are the lowest elected
bodies for the governance of the people within their defined area.
The present reality is that poverty is pervasive in Nepal. The Nepal Living Standards
Survey (NLSS), conducted by CBS in 2011 estimated that 25% of the total population is
below the poverty line. Moreover, there is an enormous disparity in rural-urban poverty, at
35% in rural areas compared to 10% in urban areas, and it is more unequal between social
groups and region. Despite some progress in poverty reduction in recent years, Nepal remains
one of the poorest countries in the world, with human development index (HDI) of 0.463 and
ranked 157th out of 187 countries in the year 2012 (UNDP, 2013). Agriculture makes a
contribution of about 35% to the gross domestic product (GDP), and about 80% of the total
population derives their livelihood from this sector. In recent years, besides agriculture and
other national income such as remittance has become one of the major income sources for the
country. The income from remittances has helped large numbers of people to come out of
poverty and improve their standards of living.

56
Nearly 80% of the total population lives in rural areas. Life expectancy at birth is
estimated to be 68 years (UNDP, 2013). According to the (CBS, 2011), the literacy among
Nepalese over six years of age has increased from 54.1% in 2001 to 65.9% in the 2011 census.
Disparities exist between gender, urban and rural areas and development regions. Male
literacy is 75.1% compared to female literacy at 57.4%. Literacy is substantially higher in
urban areas (77%) than in rural areas (57%). Similarly, the Western development region has
the highest literacy with 66%, and the lowest rate of literacy is in the Central region with 57%.
There are marked differences in literacy rates between consumption quintiles. While the
literacy rate of the richest consumption quintile in the population 6 years and above is 79.3%
(male 90.1% and female 70%), it is only 45.3% (male 55.8% and female 37.2%) in the
poorest consumption quintile (CBS, 2011). It shows that more women are illiterate than men,
displaying extreme gender disparity and inequality in education. With little time left to reduce
illiteracy by 50%, as set out in Dakar, Senegal for the Education for All goals, it seems highly
unlikely that women and the poorest will achieve universal literacy by 2015.
After the restoration of democracy in 1990, Nepalese people had high expectations for
the development of their society and improvement of their daily life. However, even basic
demands such as universal primary education and literacy for all that constitute a basic human
right have not been fulfilled, particularly in rural areas. Building upon the frustration of the
people, Nepal Communist Party (Maoist) organized people from rural and remote areas and
launched a revolution against the government of Nepal with the aim of overthrowing the
Nepalese monarchy and establishing a People’s Republic. Ten long years of armed conflict
ended with the 12-point Comprehensive Peace Accord (CPA) in 2006 between the
government and the Nepal Communist Party (Maoist), which transformed the country from a
constitutional monarchy to a democratic republic. In 2009 Constituent Assembly (CA)
election was conducted for 240 direct members and 361 proportional members. However,

57
after 4 years of extensive work, the new constitution could not be drafted and another election
for Constituent Assembly was conducted in November 2013.
4.3 Educational Development in Nepal
Nepal does not have a long educational development history. The history of modern
schooling began about 150 years ago, with the establishment of the first school in 1853
(Ministry of Education [MOE], 2003). Traditional schools were mainly focused on Hindu and
Buddhist religion and the aim was to prepare priests. A century ago the Rana regime
established the western-style of education in the country, which served only the interests of
the rulers, politicians, merchants, and the richer section of the society, not the mass of people.
After the end of the Rana regime, a democratic government was established in 1950, which
lasted only until 1961, but brought fundamental changes in the educational scenario and the
expansion of school facilities in the country.
Since then a number of initiatives were undertaken to expand educational
opportunities in Nepal. The creation of the Nepal National Education Planning Commission
in 1953 was the beginning of the systematic development of education in the country. The
commission recommended the universalization of the primary education. Similarly, the
National Education System Plan (NESP) in 1973 was another important milestone which
focused on the development of the primary education sub-sector and emphasized the role of
the government in planning, management, and financing. It recommended the free primary
education. This plan made significant achievements in terms of the expansion of primary
schooling opportunities and uniform curriculum and textbooks for a comprehensive school
education from grades one to ten, however, the role of local people in school affairs was
discouraged.

58
To expand the educational opportunities to people, using the external resources of the
United Nations Educational, Scientific and Cultural Organization (UNESCO), the United
Nations Development Programme (UNDP) and the United Nations International Children’s
Emergency Fund (UNICEF) for the first time in the educational history of Nepal in 1980, the
government initiated an innovative project called the Education for Rural Development
Project (ERDP), popularly known as the SETI project. The main thrust of the program was to
develop primary education as a vehicle for rural development (MOE, 1999). With the
successful experience of the SETI project, the Primary Education Project (PEP) was
implemented in 6 districts in 1984 with the assistance of the World Bank (WB) and the
UNICEF. Consequently, the number of schools increased, contributing to greater numbers of
children attending and completing primary school and making the transition to the secondary
education.
With the people’s popular movement in 1990, once again the democratic government
was restored, which adopted liberal education policies, opening the door for the involvement
of the private sector in education. Furthermore, participating in the World Education Forum in
1990, Nepal made a firm commitment on Education for All to provide the quality basic
education for all people. Thus, with the technical support of the United Nations Development
Programme (UNDP), the government developed the Basic and Primary Education (BPEP)
Master Plan (1991-2002) in 1991, which presented a broad picture of the primary education in
Nepal and provided a good framework for its future development. It also provided impetus for
both the government and the international agencies to work together in this effort.
Lesson learned from the past experiences, the Ministry of Education (MOE)
implemented the new program called Basic and Primary Education Project BPEP I
(1992-1997) with the financial support of the World Bank (WB), DANIDA, the Japan
International Co-operation Agency (JICA) and UNICEF. The main focuses were improving

59
the access to, and the quality and management of primary schools throughout the country. The
second phase of Basic and Primary Education Program II (1999-2004) was implemented as a
basket funding modality with the assistance of Denmark, Finland, Norway, the European
Union (EU), and the World Bank (WB) as a core investment program (CIP), and JICA and
United Nations International Children’s Emergency Fund (UNICEF) as a Non-Core
Investment Program.
Ten years after the EFA commitment made in 2001, the government developed a
long-term EFA National Plan of Action (EFA, NPA, 2001-2015), which provided a broader
framework for the educational development of Nepal. Within the overall framework of EFA
NPA, an Education for All Program (EFAP, 2004-2009) was implemented with the financial
assistance of the governments of Denmark, Finland, Norway, the United Kingdom (UK), the
Asian Development Bank (ADB) and the World Bank as pool donors and JICA, UNICEF and
United Nations Educational, Scientific and Cultural Organization (UNESCO) as non-pool
donors, which targeted the achievement of the six goals of EFA.
Currently, to respond to the public demand for educational quality and opportunity,
the School Sector Reform Plan (SSRP, 2009-2015) is in the fifth year of its implementation,
and aims to restructure school system. Grade 1 to 8 is considered basic education and Grade 9
to 12 is secondary education. A national level school leaving certificate (SLC) examination is
carried out at the end of grade 10, and the higher secondary education examinations are
conducted for grade 11 and 12. The higher education consists of a bachelor’s degree of three
to four years and a master’s degree of two years programs. The Doctor of Philosophy (Ph.D.)
is regarded as the highest degree offered by relevant universities. The structure of education
system is presented in Table 4.1.

60
Table 4.1 Structure of Education System in Nepal
Age Grade Previous School System Current School
System 16 12 Higher Secondary Education (Grade
11-12)
Secondary Education
(Grade 9-12) 15 11
14 10 Secondary Education (Grade 9-10)
13 9
12 8 Lower Secondary (Grade 6-8) Basic Education
(Grade 1-8) 11 7
10 6
9 5 Primary Education (Grade 1-5)
8 4
7 3
6 2
5 1
4 Pre-primary Education/Early Childhood Development Pre-primary Education
Source: World Bank, 2009, p. 28
The relevant age groups are 3-4 years for pre-primary/Early Childhood Education and
Development (ECED), 5-9 years for primary education, 10-12 years for upper primary
education/basic education and 13-16 years for secondary education.
The Ministry of Education (MOE) is the apex body for formulating education policies
and overall management of the education system in Nepal. The Department of Education
(DOE) is responsible for planning, budgeting, and monitoring school education. The
Curriculum Development Center (CDC), the Non Formal Education Center (NFEC), and the
National Center for Educational Development (NCED) are the specialized agencies
supporting the DOE at the central level and are responsible for the development of curriculum,

61
non-formal education, and teacher training respectively. There are five Regional Education
Directorates (REDs) responsible for monitoring the educational programs within their
respective regions. The District Education Offices (DEOs) are responsible for implementing
the educational programs and managing the school system at the district level. Below the
district level, the Resource Center (RC) is responsible to provide academic and technical
support to schools.
4.3.1 Quantitative Expansion of School Education in Nepal
Education is a key sector in which Nepal has made remarkable progress over the past
50 years. The rapid progress can be seen particularly after 1990 with the establishment of
democratic government that made a pledge in Dakar, Senegal in 2001 to achieve Education
for All (EFA) goals. The government of Nepal prioritized education as a vehicle to reduce
poverty and improve the livelihood of people. To universalize the quality basic education for
all, resources in the education sector increased and various programs such as BPEP I, BPEP II,
EFA program, SESP, a school construction program, the Teacher Education Project (TEP)
and the Community School Support Programme (CSSP) were implemented. Figure 4.1 shows
that per-child expenditure for school education in 2000 was $33 US, while in 2009 it
increased to $74 US. The national budget for the education sector was 15.3% in 2000, which
increased to 17.2% in 2009. Similarly, the allocation of percentage of GDP to the education
sector was 2.8% in 2000, increasing to 3.7% in 2009, which shows the commitment of the
government to provide the quality basic education for all.
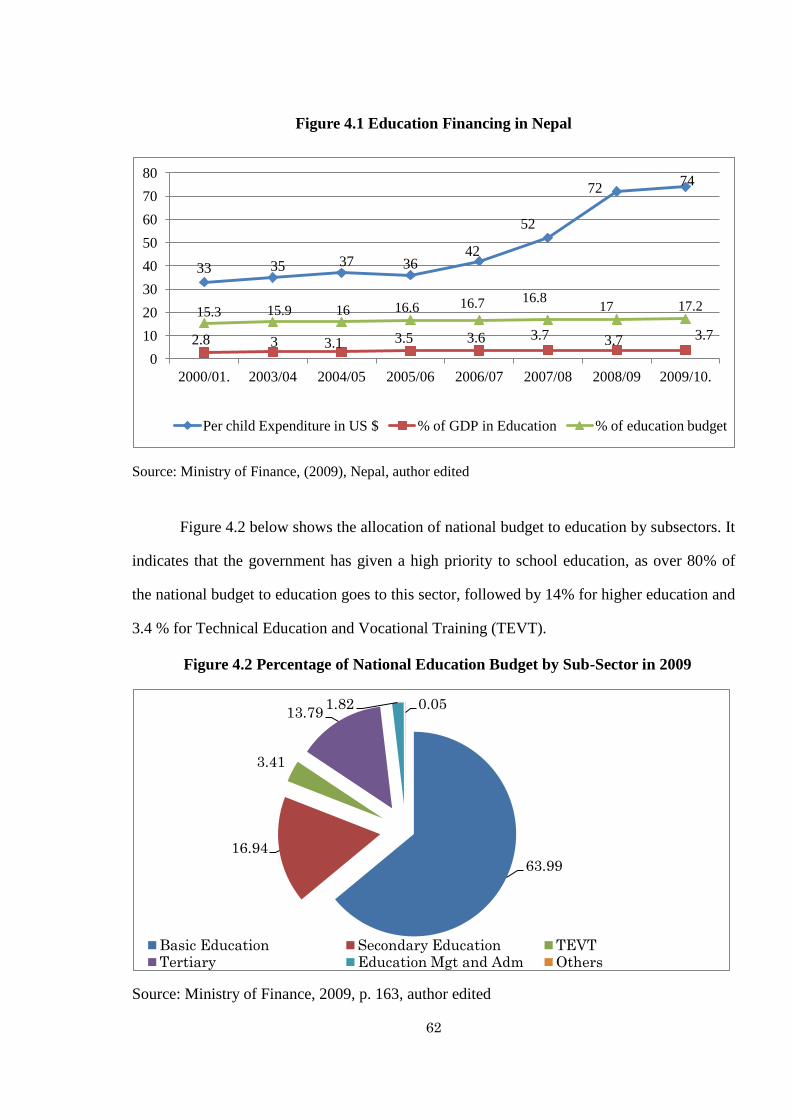
62
Figure 4.1 Education Financing in Nepal
Source: Ministry of Finance, (2009), Nepal, author edited
Figure 4.2 below shows the allocation of national budget to education by subsectors. It
indicates that the government has given a high priority to school education, as over 80% of
the national budget to education goes to this sector, followed by 14% for higher education and
3.4 % for Technical Education and Vocational Training (TEVT).
Figure 4.2 Percentage of National Education Budget by Sub-Sector in 2009
Source: Ministry of Finance, 2009, p. 163, author edited
33 35 37 36 42
52
72 74
2.8 3 3.1 3.5 3.6 3.7 3.7 3.7
15.3 15.9 16 16.6 16.7 16.8 17 17.2
0
10
20
30
40
50
60
70
80
2000/01. 2003/04 2004/05 2005/06 2006/07 2007/08 2008/09 2009/10.
Per child Expenditure in US $ % of GDP in Education % of education budget
63.99
16.94
3.41
13.79 1.82 0.05
Basic Education Secondary Education TEVT Tertiary Education Mgt and Adm Others

63
Financing education by sub-sector shows an increased investment in school education,
especially in basic education (grade 1-8), with a substantial impact on the impressive growth
in school enrollment and the reduction of the gender gap in both primary and secondary
education. The experiences of the last two decades illustrate that increasing the financing of
education can go a long way towards achieving the Education for All goals. Table 4.2 shows
the expansion of school education in different years.
Table 4.2 Expansion of Schools in Various Years
Level 1951 1990 1995 2000 2005 2012
Early Childhood Development
351
schools
NA 3852 4038 4069 34174
Primary (grade 1-5) 17842 21473 25927 27525 34782
Lower Secondary (grade 6-8) 3977 5041 7289 8471 14447
Secondary (grade 9-10) 1828 2654 4350 5039 8416
Source: Consortium for Research on Educational Access, Transitions and Equity, 2006, p. 5
and Department of Education, 2012, p. 15, author edited
Early Childhood Development (ECD), which is regarded instrumental for the social,
emotional, intellectual, and physical development of children, was introduced after 1995. It
also helps to improve the internal efficiency of school education. There are three types of
pre-primary classes: school-based ECD centers, community-based ECD centers, and privately
managed ECD centers. Table 4.2 indicates a steady increase in numbers of pre-primary
classes. Currently, there are more than thirty four thousand pre-primary classes, and almost
56% of children enroll for grade one with ECD experience. Furthermore, it shows that in
1951 there were altogether 351 schools, whereas in 2012 there were more than thirty four
thousand primary schools, fourteen thousand lower secondary schools, and eight thousand
secondary schools. Out of total schools, 15% of schools in the primary level are privately

64
managed, followed by 13% in the lower secondary and 11% in the secondary. Figure 4.3
shows the number of teachers in various years for school education in Nepal.
Figure 4.3 Number of Teachers at Primary, Lower Secondary and Secondary Level of
Education in Various Years (in thousands)
Source: Consortium for Research on Educational Access Transitions and Equity, 2006, p. 9
and Department of Education, 2012, p. 35, author edited
It shows that there were less than one hundred thousand teachers at all levels of school
education in 1990, which increased two times by 2012. Currently, around two hundred
thousand teachers are providing education at all levels of school education in Nepal.
According to (DOE, 2012), 21% of primary teachers are untrained, whereas in the lower
secondary education 42% and in the secondary 16% teachers are untrained. Because of the
expansion of school facilities, the number of students increased dramatically, which can be
seen in the Figure 4.4.
71.2 82.6
97.9
101.7
132.4
12.4 16.8
25.4 22.8
35.3
10.4 14.6 19.5 16.1
31.0
0.0
30.0
60.0
90.0
120.0
150.0
1990 1995 2000 2005 2012
Primary L. Secondary Secondary

65
Figure 4.4 Number of Students in Various Years (in millions)
Source: Consortium for Research on Educational Access Transitions and Equity, 2006, p. 6
and Department of Education, 2012, p. 19, author edited
Figure 4.4 shows the numbers of students at primary, lower secondary and secondary
levels of education in different years. It indicates that currently there are seven million
children receiving education through the network of thirty four thousand schools in Nepal.
Despite the significant increase in the number of schools, concerns are raised about the
equitable distribution of schools in different areas. Primary schools are more crowded than
lower secondary and secondary schools. According to Flash Report 2012, the average
school-student ratio for the basic education is 186, however; it depends on the location of
schools, namely the geographical zones (mountain, hill and lowland). The average teacher
-student ratio for the primary level was 29:1, whereas in the lower secondary level, it was
44:1, which again it depends on the geographical zones. Lowland (Tarai) had the highest
teacher-student ratio of 44:1 for the primary level and 61:1 for the lower secondary level.
Similarly, the average of teacher-student ratio for the secondary level was 31:1.
2.79
3.26 3.62
4.50 4.57
0.48 0.73 0.96
1.37
1.82
0.23 0.29 0.37
0.59 0.64
0
0.5
1
1.5
2
2.5
3
3.5
4
4.5
5
1,990 1,995 2,000 2,005 2012
Primary L. Secondary Secondary

66
Because of the noteworthy progress in the expansion of schools, access to school
education has enormously improved and gender inequality fell. However, thousands of
children, particularly those disadvantaged due to a variety of disabilities, caste and ethnicity,
income, remoteness, and so on, are still out of school. Among those out of school, some may
enter late, while many may never enroll. Among those who are in schools, more than 10%
will drop out, while others who continue throughout the cycle and complete school education
may lack competencies required for the job markets. The net enrolment ratio, which measures
the percentage of participation of children belonging to the official age in a given level of
education, is presented in Figure 4.5.
Figure 4.5 Net Enrolment Ratio (NER) of Primary, Lower Secondary and Secondary
Level of Education in Various Years
Source: Consortium for Research on Educational Access Transitions and Equity, 2006, p. 7
and Department of Education, 2012, p. 31, author edited
Figure 4.5 indicates that the net enrolment ratio of primary level in 1995 was 67.5%,
which increased to 95% in 2012. However, 5% children who are out of school comprise a
disproportionally large share of children from the historically, geographically, economically
67.5
80.4
86.8 95
26.1
33.3
46.5
72.2
17.3
20.0
32.4
52.1
0
10
20
30
40
50
60
70
80
90
100
1995 2000 2005 2012
Primary L. Secondary Secondary

67
and socially deprived and marginalized communities. Similarly, in lower secondary education
age group, 28% of children are out of school, while at the secondary level, 45% children are
out of school, raising serious concerns about the equitable development of comprehensive
school education. Those children who are out of school, most of them are from middle and
low ethnic background. Low ethnic children have highly deprived status causing extreme low
self-esteem and social exclusion (untouchability). The low ethnicity student occupied of
20.3% in primary enrolment in 2012. Similarly, middle ethnic are (Janjati groups) who have
their own language, tradition and culture. These groups occupied 35.4% in primary enrolment
in 2012 (DOE, 2012). The classification of middle and low ethnicity by caste is included in
Appendix 6. Generally, children from these categories belong to poor households enter school
late as they generally live far away, their health and nutritional condition is worse and their
parents are less aware of the significance of education for improved livelihood and enhanced
quality of life for their children.
4.3.2 Qualitative Expansion of School Education in Nepal
Despite the rapid expansion of school education, the efficiency of school, which is
generally measured in terms of promotion, repetition and drop-out rate, is a great challenge
for the educational development in Nepal. The term “efficiency” indicates the relationship
between input and output. A system is considered efficient if it produces maximum outputs
from given inputs. Table 4.3 shows the promotion, repetition and drop-out, and survival rate
of primary, lower secondary, and secondary education in 2012.

68
Table 4.3 Promotion, Repetition and Drop-Out Rate of Primary, Lower Secondary and
Secondary Levels of Education in 2012
Categories Primary Lower secondary Secondary
Promotion 84.2 88.7 89.8
Repetition 10.6 5.2 3.6
Drop-out 5.2 6.1 6.5
Survival rate 77 62 -
Source: Department of Education, 2012, p. 32, author edited
Table 4.3 shows that the promotion rate for primary, lower secondary and secondary
level is 84%, 89% and 90% respectively. It means that at the primary level 16% of children
could not be promoted to the next level. The situation of grade one is the most serious, as 30%
of children could not pass from grade one to grade two, implying that they either repeated or
dropped out (DOE, 2012). Even if the promotion rate of the secondary level is around 90%,
only 41% of students could pass the school leaving certificate examination, which cause a
serious debate about the efficiency and relevance of school education in Nepal. It is clear that
the increasing school participation doesn’t mean that children acquire basic knowledge, skills,
and behaviors which are necessary to function effectively in the world and society.
The quality of education, which is measured by the average test score in examinations,
particularly in core subjects, has not improved despite the increased resources and
implementation of various innovative programs. Table 4.4 presents the average learning
achievement in different subjects during various years.

69
Table 4.4 Average Learning Achievement in Various Subjects
Year Grade Mathematics Nepali Social Studies Science English
BPEP-1998 5 26.6 52.4 35.9 - -
PEDP-1998 5 33.7 40.6 39.5 - -
BPEP-1997 4 28.0 47.0 42.0 - -
EDSC-1997 3 43.8 45.7 50.4 - -
EDSC-1999 5 27.3 51.5 41.8 - -
EDSC-2001 3 47.0 44.5 63.6 - -
CERSOD 2001 5 30.1 45.3 34.4 - -
EDSC- 2003 5 33.3 55.8 61.1 - -
CERID 1999 6 44.4 56.4 - 39.6 43.6
CERID 1999 8 28.9 75.3 - 29.6 34.3
EDSC- 2008 8 31.7 44.4 53.4 48.8 36.6
Source: Education Development Service Center, 2008, p. 8
Table 4.4 indicates that Nepalese students are achieving relatively higher scores in
Nepali and Social Studies than in Mathematics, English, and Science. Studies of eighth grade
students by the Research Center for Educational Innovation and Development (CERID) in
1999 and the Educational Development Service Center (EDSC) in 2008 indicated little
improvement in learning achievement in core subjects. This indicates that the learning
achievement of eighth grade students in 1999 in mathematics was 28.9 out of possible 100
marks, which increased to 31.7 on average in 2008, demonstrating a marginal improvement of
only two percentage points after a decade. Similarly, with little improvement in learning
achievement, the average scores in Science and English were 48.8 and 36.6 respectively. The
above figures with reference to average scores indicate the underperformance of the school
education system in Nepal, demanding greater urgency and serious policy concern to ensuring
improved quality of education.

70
4.4 Educational Policies in Nepal
The MOE through its various organizations and institutes works to enhance the
sector-wide coherence of education policies with an explicit focus on cross-cutting issues
such as improving universal access and participation, the quality and relevance of schooling
and learning, and reaching marginalized populations. Education policies and strategies are
reflected in the legal provision and education plans and programs of the education sector. The
Constitution of 1990 and the Education Act (2001) included the right of every child to free
primary education with the choice of learning in his or her mother tongue. Similarly, the
Interim Constitution of 2007 ensures the right to get free education up to secondary level.
Based on the human rights approach to education and in accordance with the
principles and provisions of the EFA National Plan of Action (2001-2015), the School Sector
Reform Program (SSRP) (2009-2015) aims to achieve three key objectives: (i) ensuring
access and equity in school education; (ii) enhancing the quality and relevance of education;
and (iii) improving efficiency and institutional capacity. The Education Act (2001) and the
Education Regulation (2002) underpin provisions for pre-primary education in collaboration
with local bodies (VDCs and municipalities), free primary education with provision of free
textbooks to all children, and scholarships to girls and children with disabilities. Moreover, it
also includes scholarships and free secondary education to all, especially disadvantaged
children. Improved curriculum and textbooks, increased qualification and training for teachers,
the provision of female teachers, adequate and suitable physical facilities, pure drinking water,
separate toilets for girls, and empowerment of school management committees are some of
the key reform measures to ensure the quality school education for all eligible children in the
country.

71
4.5 Chapter Summary
This chapter provides the background information of this study. The first section
provides the brief introduction of socio-economic context of country, while the second section
explains the current status of educational development of Nepal. After the commitment to the
achievement of EFA in 1990, resources in education increased (Figure 3.1) and various
programs were implemented. By these initiatives, remarkable progress was seen in improving
school participation at all levels of school education (Figure 3.5) of Nepal. However, despite
the substantial progress in expanding educational opportunities, quality of education which is
generally measured by higher levels of learning outcomes in examinations is still low (Table
3.4), and inequality between students exist. So, the following Chapter 5 examines the factors
affecting mathematics learning achievement of eighth grade students in Nepal, while Chapter
6 assesses the content domains of mathematics learning achievement such as arithmetic,
algebra, data management, and geometry, and cognitive domains (knowledge, comprehension,
application, and problem solving).

72
Chapter 5 Factors Determining Mathematics Learning Achievement of
Eighth Grade Students in Nepal
5. 1 Introduction
The objective of this chapter is to examine the factors that are associated with the
learning achievement in mathematics of eighth grade students in Nepal. It examines the effect
of four set of factors on learning mathematics -family characteristics, student characteristics,
parental involvement, and school characteristics. More specifically, it focuses on three issues:
determining the various factors that influenced learning achievement in mathematics;
identifying the factors that primarily affected academic achievement; and determining to what
extent the differences in mathematics learning achievement are associated with family
characteristics, student characteristics, parental involvement and school characteristics. This
study is innovative in terms of examining four set of factors simultaneously and novel in the
context of Nepal because no studies have examined the factors that determine the quality of
education, particularly learning achievement in mathematics of eighth grade students.
5.2 Data Analysis
Three types of data analysis are used in this chapter. First, the distribution of
mathematics scores by gender (Table 5.1) and the cumulative percentage of scores (Figure
5.1) are presented to explain the general pattern of mathematics scores of eighth grade
students. Second, mean and standard deviation are calculated to examine the variances in
learning achievement in mathematics between students such as gender, location, types of
school and geographical zones (Table 5.2). Third, the multiple regression analysis is
conducted to determine the factors for learning achievement in mathematics. Four separate

73
and combined models are developed to examine the effect of the set of variables described
above (Table 5.4).
5.2.1 Distribution of the Mathematics Test Scores
Distribution of the mathematics scores is categorized into four groups. It is based on
the examination system in Nepal, where out of the 50 possible marks, less than 16 is
considered as a disqualified or a fail, 16 and above and less than 24 is considered the third
division, 24 and above and less than 30 is considered the second division, and 30 and above is
considered the first division. Table 5.1 below presents the distribution of mathematics scores
by gender. It indicates that out of the total sample of this study, 73% of students scored less
than 16 marks in mathematics, which is considered disqualified or a fail and which shows the
poor quality of education in Nepal. However, there are gender differences in learning
achievement in mathematics. 78% of the 400 girls and 67 of the 362 boys scored less than 16
marks and were considered disqualified. Similarly, 17% of students scored between 16 and
above and less than 24 (third division), 5.6% of students scored 24 and above and less than 30
(second division) and 5% of students scored above 30 (first division).
Table 5.1 Distribution of Scores in Mathematics Test by Gender
Descriptions
Gender
Total
% Girls
% Boys
Girls Boys
Less than 16 (fail) 312 241 553 (73%) 77.9 66.6
16 and above and less than 24 (Third division) 61 66 127 (17%) 15.3 18.2
24 and above and less than 30 (Second division) 15 28 43 (5.6%) 3.8 7.7
Above 30 (first division) 12 27 39 (5.1%) 3 7.5
Total 400 362 762
Source: Mathematics test conducted by the author

74
Figure 5.1 below illustrates the cumulative distribution of scores of mathematics test
of eighth grade students in Nepal. The average score was 11.55 out of the 50 possible marks
with the skewness of 0.96, indicating that the majority of students positively skewed in the
low left end.
Figure 5.1 Distribution of Scores in Mathematics Test (Cumulative Percentage)
Source: Mathematics test conducted by the author
Figure 5.1 explains that 31.3% of sample students scored less than 5 out of the
possible 50 marks. It further indicates that the majority of sample students (72.3%) scored
between 11 and 15 marks, which is considered disqualified for the purpose of promotion into
the next grade. Only 9.4% of sample students scored more than half of the possible 50 marks,
which is a policy concern for educational development in Nepal. However, there were
differences in the mathematics achievement between the groups of students, such as gender,
ethnicity, types of school, and location of school.
31.1
55.9
72.3
84.3
90.6 94.8 97.0 99.1 99.8 100.0
10.0
20.0
30.0
40.0
50.0
60.0
70.0
80.0
90.0
100.0
<5 6-10. 11-15. 16-20. 21-25 26-30 31-35 36-40 41-45 >45
Mean 11.55 Skewness 0.96
Score in mathematics test (out of 50 possible marks)

75
5.2.2 Differences in Learning Achievement in Mathematics between Groups of
Students
Table 5.2 presents the mean and standard deviation and one-way ANOVA. The Mean
and standard deviation is calculated to examine the average learning achievement, while one
way ANOVA is calculated to examine the differences between students such as gender,
location (rural and urban), geographical zones (mountain, hill and lowland), types of school
(public and private) and the ethnicity of students. It shows that the average learning
achievement in mathematics of eighth grade students in Nepal is 11.55 out of possible total 50
marks with the standard deviation of 9.28; however, there are differences in mathematics
performance based on gender, ethnic group, types of school and location.
Table 5.2 Mean and Standard deviation of Mathematics Learning Achievement by
Gender, Ethnicity, Types of School and School Location
Categories Mean Standard Deviation T statistics Significance
Gender Girls 10.08 8.53
6.08 000 Boys 13.13 9.74
Ethnicity
High ethnicity 15.54 10.27
41.73 000 Middle ethnicity 9.60 8.15
Low ethnicity 8.28 5.70
Type of
school
Private 22.31 10.29 31.38 000
Public 9.47 7.44
School
location
Urban 13.27 9.88 17.98 000
Rural 9.52 8.01
Ecological
zones
Mountain 5.32 5.13
8.81 000 Hill 11.42 7.54
Lowland (Tarai) 12.15 10.50
Mean 11.55 9.28
Source: Mathematics test conducted by the author

76
Boys were found to perform higher (M = 13.13, SD = 9.74) than girls (M = 10.08, SD
= 8.53), which is statistically significantly different (t = 6.08, p<0.01). Students from the high
ethnicity were found to perform higher than middle ethnic students, and middle ethnic
students performed higher than the low ethnic students, with a mean learning achievement of
15.54, 9.60 and 8.28 respectively, which is significantly different (t = 41.73, p<0.01). The
classification of middle and low ethnicity by caste is included in Appendix 6. Urban students
were found to score higher than rural students, with average scores of 13.27 and 9.52, which
is statistically significant (t=17.98, p<0.01). Similarly, students from lowland (Tarai) were
found to perform better than those from hill areas. Students from hill areas were found to
perform better than those from mountain areas, with average scores of 10.50, 7.54 and 5.13
respectively.
Differences in the quality of education between public and private school is a matter
of policy debate and concern for all the stakeholders in Nepal. This study found a large gap in
learning achievement in mathematics between private and public school. Figure 5.2 below
presents the average learning achievement in mathematics by type of schools.
Figure 5.2 Average Learning Achievements in Mathematics by Type of School
Source: Mathematics test conducted by the author
21.27
24.37
22.31
10.87
8.43
9.5
13.2
10.07
11.55
0 5 10 15 20 25 30
Boys
Girls
Total
Boys
Girls
Total
Boys
Girls
Total
Pri
vate
P
ubli
c T
ota
l
Mathematics score (out of maximum 50)

77
It shows that the average learning achievement in mathematics for public school is 9.5,
while that for private school is more than two times higher, with an average of 22.31.
However, the interesting result is that boys perform better in general, but in private schools,
girls perform better than boys, with an average learning achievement of 24.37 and 21.27
respectively. Table 5.2 and Figure 5.1 indicate that the learning achievement in mathematics
of eighth grade students is low and there are significant differences between students.
5.2.3 Multiple Regression Analysis
A multiple regression analysis was used to predict the relationship between the
dependent variable of mathematics score and the set of independent variables such as family
characteristics, student characteristics, parental involvement, and school characteristics.
Family characteristics consisted of number of family members, father’s level of education,
mother’s level of education, travel time to school, number of books at home and presence of
certain items at home such as bicycle, a radio, a television, a CD player, water taps, gas stove,
bio gas, motorbike, and computer. Travel time to school was also included because in Nepal
students in different zones have different commuting time to school that might influence
learning achievement.
Student characteristics are gender, ethnicity, absenteeism, grade repetition, homework
completion, time spent on studying, time spent on household chores, preschool experience,
perception of mathematics teacher, and academic motivation of student. Parental involvement
includes children’s perception of parental involvement in their schooling, which primarily
consisted of parental support for homework, students’ perception of parental support, and
parental monitoring. School characteristics which consisted of school type, school location,
teacher training, the number of operating days in the academic year, teacher-student ratios,
and school facilities (a library, separate rooms for the head teacher and teachers, a playground,

78
drinking water, toilets, electricity, and telephones). Variables examined in this study are
presented in Table 5.3.
To predict the relationship between the dependent variable of mathematics score and a
set of independent variables, 4 models were developed. The models suggest how academic
achievement is affected when family, student, school characteristics and parental involvement
variables are combined.
Model 1 Learning achievement in mathematics and family characteristics
LEARACHIVij = β0+(β1NUMFAMij+β2EDUFATHij + β3EDUMOTHij + β4 TRVLTIMESCHij
+β5 ADDBOOKHOMij +β6 MATERLHOMEij)
The first model explains the relationship of outcome variable (mathematics scores)
and the family characteristics variables. Six variables are examined for the characteristics of
family background, where NUMFAM = Number of family members, EDUFATH= Father’s
level of education, EDUMOTH = Mother’s level of education, TRVLTIMESCH = Travel time
to school, ADDBOOKHOM = Additional books at home, MATERLHOME = Materials at
home.
Model 2 Learning achievement in mathematics, family characteristics and student
characteristics
LEARACHIVij = β0+(β1NUMFAMij+β2EDUFATHij+β3EDUMOTHij + β4 TRVLTIMESCHij
+β5ADDBOOKHOMij+β6MATERLHOMEij)+(β7GENDERij+β8ETHNSTUij+β9REREPij+β10A
BSNTij+β11HOMEWORKij+β12STUTIMHOMij+β13STUPERTEACHij+β14HOUSWORKij+β15
EXPECDij + β16STUMOTIVAij )
The second model is the combination of a set of family characteristics variables and a
set of student characteristics variables. Student characteristics include GENDER =Sex of child,
ETHNSTU = Ethnicity, GREREP = Number of grade repetitions since school admission,

79
ABSENT = Number of days absent during the past month, HOMEWORK = Completion of
homework, STUTIMHOM = Number of hours spent studying, STUPERTEACH = student
perception of teacher, HOUSWORK = Number of hours spent on daily household chores,
EXPECD = Preschool experience and STUMOTIVA = Student motivation to study.
Model 3 Learning achievement in mathematics and family characteristics and student
characteristics and parental involvement
LEARACHIVij= β0+(β1NUMFAMij +β2EDUFATHij + β3EDUMOTHij + β4 TRVLTIMESCHij
+β5ADDBOOKHOMij+β6MATERLHOMEij)+(β7GENDERij+β8ETHNSTUij+β9GREREPij+β10
ABSNTij +β11HOMEWORKij+ β12STUTIMHOMij + β13STUPERTEACHij + β14HOUSWORKij
+β15EXPECDij+β16STUMOTIVAij)+(β17PARSUPHOMij+β18PARENCOURGij+β19PAREMONI
ij)
In the third model, a set of parental involvement variables is included with family and
student characteristics variables. The variables included in the model III are PARSUPHOM =
Parental support of homework, PARENCOURG = Parental encouragement for studying,
PAREMONI = Parental monitoring of studying.
Model 4 Learning achievement in mathematics and family characteristics, student
characteristics, parental involvement and school characteristics)
LEARACHIVij =β0+(β1NUMFAMij+β2EDUFATHij+β3EDUMOTHij+β4 TRVLTIMESCHij +β5
ADDBOOKHOMij+β6MATERLHOMEij) + (β7 GENDERij+β8 ETHNSTUij +β9 GREREPij+β10
ABSNTij +β11HOMEWORKij+ β12STUTIMHOMij + β13STUPERTEACHij + β14HOUSWORKij
+β15EXPECDij+β16STUMOTIVAij)+(β17PARSUPHOMij+β18PARENCOURGij+β19PAREMONI
ij)+(β20TYPSCHij + β21 LOCSCHij + β22GEOLOCSCHij + β23TEACTRINij + β24INSERVTRINij
+ β25TEACHDAYSij + β26STRij +β27 PHYFACILij)

80
The fourth model is the combination of a set of school characteristics variables with a
set of family characteristics variables, a set of student characteristics variables, and a set of
parental involvement variables. Where LEARACHIV is the outcome variable, learning
achievement of children j of school i, β0 is the intercept of the regression model and β1, β2, β3
and β4 are the slope of the set of explanatory variables - family characteristics, student
characteristics, parental involvement and school characteristics of child j of school i,
respectively. The set of variables included as school characteristics are TYPSCH = Type of
school, LOCSCH = School location, GEOLOCSCH = Geographical location of school,
TEACTRIN = Teacher training, INSERVTRIN = In-service teacher training, TEACHDAYS =
Number of school days in the academic year, STR = Student-teacher ratio and PHYFACIL=
School facilities.
Before conducting the data analysis, to ensure the reliability and internal consistency
of the instrument (student survey questionnaires), Cronbach’s alpha was checked, in which
the reliability of the overall student survey questionnaires was 0.72, which is acceptable for
research purposes (Muijs, 2004). However, the reliability of different categories such as
family characteristics, student characteristics, and parental involvement had different findings.
The Cronbach alpha for parental involvement questionnaires was found higher with 0.86,
followed by student characteristics (0.76) and family characteristics (0.73). Similarly, the
Cronbach alpha of the questionnaires related to school characteristics (questionnaires of head
teachers and mathematics teachers) was 0.70.
Furthermore, I checked the correlation analysis between the variables to avoid a
problem of multicollinearity, where zero order correlation coefficient among the variables
which explain direction of relationship and its strength (Muijs, 2004), were found to be less
than .50. The correlation coefficient of variables examined in the model is included in
Appendix 7. Similarly, I checked the value of variance inflation factors (VIF) and tolerance
statistics. The value of VIF was between 1.15 and 1.62 and tolerance statistics were all

81
above .3 which suggest that the final model is free from multicollinearity (Field, 2009). The
Durbin-Watson statistic was also between one and three (1.27), suggesting that the errors are
independent. Furthermore, I checked the standardized residuals where five cases were found
to have standardized residuals more than .3, however none of the cases had cook’s distance
greater than one which suggest that there is no undue influence on the regression model (Field,
2009). Furthermore, I checked the standardized scatterplots residuals to examine the
normality, linearity and homoscedasticity of the variables. It was found the straight line
relationship with the dependent variable.
5.3 Factors Determining Students’ Mathematics Learning Achievement
The variables used to examine the effects of family characteristics, student
characteristics, parental involvement and school characteristics on learning achievement in
mathematics is presented in Table 5.3 The variables were selected according to their
importance in the context of Nepal and the theoretical framework presented in Chapter 2. The
variables are categorized into four sets. The set of family characteristics includes the
variables- number of family member, father’s and mother’s level of education, additional
books at home, travelling time to school and available materials at home. The set of student
characteristics variables include- gender, ethnicity of student, days of school absenteeism,
number of times of grade repetition since the admission of school, experience of ECD,
homework completion, involvement in household chores and student motivation. The set of
parental involvement variables consisted of the three variables- parental support on
homework, parental encouragement and parental monitoring. Finally, school characteristics
includes the variables- types of school, location, teacher training, teacher-student ratio, school
opening days in a year and school physical facilities. The definition of variables and
descriptive statistics (percentage, mean and standard deviation) are presented in Table 5.3 and
the standardized regression coefficient of each set of independent variables is presented in
Table 5.4.

82
Table 5.3 Variable Definitions and Descriptive Statistics (N=762) Variables Definitions Percent Mean SD
LEARACHIV Children’s mathematics test score 11.55 9.28
NUMFAM Number of family members in the household 6.23 2.05
EDUFATH Father’s education, 1 = secondary and above, 0= otherwise 43.4
EDUMOTH Mother’s education, 1 = secondary and above, 0= otherwise 24.8
TRVLTIMESCH Traveling time to school 19.34 11.14
ADDBOOKHOM Number of books at home, 1= 1-5 books, 2= 6-10 books, 3= more than 10 books, 4= no books 2.74 1.17
MATERLHOMa Presence of certain items at the home, available =1, not available = 0 5.05 2.46
GENDER Child sex, 1 = Male, 0= Female 47.5
ETHNSTU Child ethnicity, 1= High caste, 2= middle caste and 3 = low caste
GREREP Number of grade repetitions since school admission 1.39 .62
ABSNT Number of days absent during the past month 2.83 2.66
HOMWORK Complete homework, 1= never do, 2= sometimes do, 3= everyday 2.71 .56
STUTIMHOM Number of hours spent studying 2.68 .85
STUPERTEACH Student perception of teacher, 1= difficult, 2= easy, 3 = very easy 1.97 .71
HOUSWORK Number of hours spent on daily household chores 2.34 .75
EXPECD Preschool experience, 1= yes, 0= otherwise 43
STUMOTIVA Student motivation to study, 1= strongly disagree to 5 = strongly agree 3.88 1.12
PARSUPHOM Parental support of homework, 1= yes, 0= otherwise 41
PARENCOURG Parental encouragement for studying, 1= strongly disagree- 5= strongly agree 4.08 1.08
PAREMONIT Parental monitoring of studying, 1= strongly disagree-5= strongly agree 3.59 1.27
TYPSCH Type of school, 1= public, 0= Private 84
LOCSCH School location, urban = 1, 0= rural 53.5
GEOLOCSCH Geographical location of school, lowland =1, hill = 2 and mountain = 3
TEACTRIN Teacher training, 1= Untrained, 2= partially trained, 3= Trained 2.42 .77
INSERVTRIN In-service teacher training, yes = 1, otherwise= 0 32.4
TEACHDAYS Number of school days in the academic year 181.7 4.3
STR Student-teacher ratio in a particular grade 60.5 10.9
PHYFACILb School facilities, available = 1, not available = 0 7.80 2.34
Source: Survey conducted to students, head teachers and mathematic teachers by the author
Note: a Bicycle, radio, television, CD player, water tap, gas stove, bio gas, motorbike, computer
b. Library, separate room for head teacher and teacher, playground, drinking water, toilets, electricity, telephone

83
Table 5.4 Standardized regression coefficients for family background, student
characteristics, parental involvement, and school characteristics
Variables Model I Model II Model III Model IV
t t t t
NUMFAM -.118*** -3.750 -.059** -2.126 -.056** -2.027 -.032 -1.24
EDUFATH .170*** 4.647 .067** 2.043 .034 1.032 .001 .032
EDUMOTH .220*** 5.916 .163*** 4.975 .139*** 4.289 .069** 2.17
TRVLTIMESCH -.048 -1.527 -.061** -2.191 -.058** -2.116 -.067* -2.63
ADDBOOKHOM .240*** 7.224 .133*** 4.492 .122*** 4.180 .106*** 3.97
MATERLHOM .090** 2.516 .040 1.271 .031 .989 .018 .59
GENDER .083** 3.044 .072** 2.666 .063* 2.47
ETHNSTU -.096*** -3.377 -.095*** -3.418 -.076** -2.94
GREREP -.050* -1.755 -.042** -1.497 -.047* -1.81
ABSNT -.185*** -6.514 -.169*** -6.037 -.153*** -5.97
HOMWORK .126*** 4.492 .099*** 3.539 .067* 2.56
STUTIMHOM .036 1.300 .023 .840 .006 .243
STUPERTEACH .153*** 5.252 .126*** 4.327 .090*** 3.31
HOUSWORK -.061** -2.106 -.056** -1.973 -.022 -.82
EXPECD .086** 3.098 .052* 1.843 .037 1.39
STUMOTIVA .135*** 4.645 .102*** 3.268 .068* 2.38
PARSUPHOM .131*** 3.991 .145*** 4.80
PARENCOURG .072** 2.040 .058* 1.79
PAREMONIT .083** 3.092 .049** 1.98
TYPSCH -.120** -2.77
LOCSCH .169*** 5.08
GEOLOCSCH -.152*** -4.93
TEACTRIN .130*** 3.65
INSERVTRIN .077** 2.80
TEACHDAYS .119*** 3.72
STR -.102** -2.45
PHYFACIL .089** 2.33
Multiple R 55.2 70.0 71.6 77.5
R2 30.5 49.0 51.3 60.1
Adjusted R2 29.9
47.9 50.0 58.6
Variance 29.9 18.0 2.1 8.6
Source: Survey conducted to students, head teachers and mathematics teacher by the author
Note: N = 762, *p <0.10, **p<0.05 and ***p<0.01

84
5.3.1 Family Characteristics and Mathematics Learning Achievement
As shown in Model I of Table 5.4, the set of family characteristics variables showed
significant relationships to children’s learning achievement in mathematics (R2
= .305,
adjusted R2 = .299; F(6,756) = 1.36; p<0.01). The result indicated that family characteristics
accounted for 29.9 % of the variances in children’s learning achievement in mathematics. The
correlation coefficient for the set of family characteristics was 55.2. It further suggested that
children from households with less family members, father’s and mother’s education at the
secondary level or above, and more books and more possessions at home were likely to
outperform their counterparts.
Family characteristics as measured by parents’ level of education were found to be
significantly related to the mathematics learning achievement of children. Among the sample
students of this study, nearly 44% of fathers have completed the secondary school or higher
level of education, whereas only 24% of mothers have completed the secondary school or
higher level of education. However, it varies according to the type and location of schools.
Almost 81% of mothers of students from private schools have completed the secondary
school or a higher level of education, whereas with students from public schools, only 14.4%
of mothers have completed the secondary school or a higher level of education. Similarly,
89.5% of fathers of students from private schools have completed the secondary school or a
higher level of education, whereas only 34.8% of fathers of students from public schools have
completed the secondary school or a higher level of education.
Model I (Table 5.4) indicated that students whose father and mother have the
secondary school or a higher level of education were found to perform higher than students
whose parents have less than the secondary level of education. However, the effect of fathers’

85
and mothers’ level of education is estimated different. The effect of mother’s education level
was greater than the effect of father’s education level, although fewer mothers (24%) had
completed the secondary education compared to fathers (44%). In Nepal, mothers are less
likely to be employed than fathers, regardless of their level of education, which might provide
mothers with more opportunities to spend time on their children’s schooling. Mothers who are
more educated are also likely to have the higher SES, which would benefit their children.
Furthermore, the higher effect of mothers’ level of education on their children’s learning
outcomes is because of their ownership of household resources, particularly land. This finding
is consistent with the findings of other studies in respect to the effects of family
socio-economic status on children’s educational outcomes (Fuchs & Woessmann, 2004;
Guncer & Kose, 1993; McEwan & Marshall, 2004; Schiller et al., 2002; Willms & Somers,
2001; Woessmann, 2003). The result indicated that an increase of one standard deviation in
mother’s education level increased the child’s academic achievement by .220 (p<0.01).
Correspondingly, an increase of one standard deviation in the father’s level of education
increased the children’s academic achievement by .170 (p<0.01), other things being held
constant.
There was a negative relationship between family size and students’ mathematics
learning achievement. Students in this study had a minimum of two and a maximum of 15
members in their family, and the average family size was 6.23 members. However, the
National Living Standard Survey (NLSS) 2011 reported that the average family size in
Nepalese households was 4.9. Family size varies according to the location and type of school.
Students from private schools have an average of 4.89 family members, whereas students
from public schools have an average of 6.49 family members. More than 75% of students in
this study were found to have four to seven family members. Students with smaller family

86
size (three to five family members) outperformed children in larger family size (-.118,
p<0.01). The effect of family size diminished for private school students compared to public
school students and was greater for students in rural schools compared to urban schools. The
possible reason for the reduced effect of family size for private and urban schools is that
parents have higher levels of education and more materials and books at home than the
parents with children in public and rural schools.
The resource dilution theory (Heer, 1985), which explains the effect of family
structure, claims that children benefit less from available resources in larger families.
Children in smaller families have greater access to resources and intellectual contexts that
provide academic motivation (Blake, 1989), such as economic resources (Olneck & Bills,
1979), and parental aspirations and parental support (Behrman & Taubman, 1886). However,
Buchmann and Hannum (2001) found that the number of siblings did not affect parents’ focus
on children’s schooling in developing countries.
Nepal is a diverse country in terms of geography. Students living in the mountain and
hill areas must spend more time travelling to school than students in lowland (Tarai) areas.
According to NLSS 2011, 88.8% of households are within a 30 minute walk of an Early
Childhood Development Center (ECDC), whereas for the primary, secondary and higher
secondary, it is 94.7%, 71.7% and 56.7% respectively. The average travelling time to school
for students in this study was 19 minutes. There was a negative relationship between traveling
time to school and children’s learning achievement in mathematics. However, the relationship
was not statistically significant. When this measure was combined with other family
characteristics measures in model IV, the model was significant and consistent with findings
of Hungi (2008) in Vietnam.

87
The finding that the number of books at home was significantly related to learning
achievement confirmed the finding reported in the sociological literature, which documented
that the number of books at home is a proxy for family educational SES. Out of the total
sample students, 35.6% of students do not have any kinds of book at home, which shows the
not meaningful culture of reading practice at home. However, it varies according to type and
location of school. Private school students have more books at home than students from
public schools. The analysis shows that 93% of students from private schools have additional
books at home, whereas in public schools, 59% of students have additional books at home.
Similarly, differences in availability of books at home relate to geographical zones in Nepal.
Students from the mountain region have fewer books (61%) than students from lowland
(Tarai) areas (41%) and students from hilly areas (27%). The result showed that increasing
the availability of books by 1 standard deviation increased students’ academic achievement
by .240 standard deviations. Regardless of the type of school, students from homes with more
than ten books outperformed students from homes with fewer than ten books or students in
homes without any books.
The presence of certain items at home –e.g., radio, bicycle, water tap, cassette player,
television, telephone, gas stove, computer and motorbike –reflected family SES and was
significantly related to students’ mathematics learning achievement. More than 60% students
lived in homes with radio, bicycle, water tap, television, and telephone. However, only 25%
of the students lived in homes with computers and motorbikes. Students in urban schools and
private schools were more likely to have a computer at home than students in rural schools or
public schools. For the various possessions identified in this study, family ownership of radio,
bicycle and computer was significantly related to mathematics performance. Among the
possessions included in this study, the availability of computer at home was found to be

88
significantly related (.214, p<0.01) to mathematics learning achievement compared to
availability of other items. This finding is consistent with the finding that facilities available
at home were positively related to student achievement in Jordan (Al-Nhar, 1999).
5.3.2 Student Characteristics and Mathematics Learning Achievement
In Model II (Table 5.4), student characteristics variables were combined to the set of
family characteristics variables. The result found a significant relationship with mathematics
learning achievement (R2 = .490, adjusted R
2 = .479; F(10,752) = 2.38; p<0.01). Student
characteristics explained for 18% of the variance in mathematics achievement, with a
correlation coefficient of .70. Standardized coefficients for the Model II indicated that
absenteeism, homework completion, students’ perception of their mathematics teacher, time
spent on household chores, preschool experience, academic motivation and gender –but not
time spent studying at home –were significantly related to mathematics learning achievement.
Among the student characteristics gender is a frequently examined factor for learning
achievement of children. The result found that gender was significantly related to
mathematics learning achievement (0.83, p<0.05). Overall, boys outperformed girls, with a
mean difference of -3.05 (Table 5.2). However, for students in private schools, girls (mean
score = 24.37) outperformed boys (mean score = 21.27). There might be several reasons for
the better performance of boys than girls. However, the available data of this study shows that
boys have high socio-economic status (SES) than girls measured by completion of fathers’
and mothers’ level of education, additional books at home, and materials at home.
The data shows that boys have less family members than girls, with an average of 6.00
persons and 6.44 persons respectively. Furthermore, 45% of boys’ fathers have completed the
secondary and above levels of education, while 42% of girls’ fathers have completed the

89
secondary and above levels of education. Similarly, 23% of girls’ mothers have completed
above the secondary level of education in comparison to 27% of boys mothers. Other possible
reasons for high mathematics achievement of boys than girls might be the availability of more
books at home. The data shows that 68% of boys have additional books at home, while 60%
of girls have additional books. Furthermore, in household chores girls are involved more than
boys and get less support from their parents, particularly for doing homework, than boys.
One of the interesting findings of this study is that in private school, girls
outperformed boys in mathematics. The data shows that mothers of girls have more education
than mothers of boys. It shows that 12% of girls in private schools have mothers with less
than secondary education, while 25% of boys in private schools have mothers with less than
the secondary education. Similarly, fathers of girls have higher education levels than fathers
of boys. Furthermore, girls have low levels of class repetition and low absenteeism and do
more homework, and more girls have the experience of early childhood care and development
than boys.
This result is consistent with findings of Farkas et al. (1990) that girls in the United
States outperformed boys in 12 subjects with a median difference of -4.5 points. But in
Vietnam, Hungi (2008) found that boys outperformed girls in mathematics (-3.91, 0.59),
while girls outperformed boys in reading (8.51, 0.63). Fuchs and Woessmann (2004) obtained
similar results using the PISA data. Sammons’ longitudinal analysis of student achievement
over the course of 9 years (1995) found that girls in the United Kingdom outperformed boys
in reading and mathematics. However, Veenstra and Kuyper (2004) found that in the
Netherlands student characteristics accounted for more variance than family characteristics
and that boys outperformed girls in mathematics but not in language skills.

90
Nepal is a diverse country in terms of culture, language, and ethnicity. The 2011
National Census reported more than 103 castes and ethnicities and 90 languages, and
inequality based on caste and ethnicity can be seen in school participation and learning
achievement. This study examined the effect of ethnic background on learning achievement in
mathematics and a negative relationship was found between ethnicity and learning
achievement in mathematics. It is estimated (Table 5.2) that boys with high ethnic
backgrounds outperformed children with middle and low ethnic backgrounds to a statistically
significant level (-0.96, p<0.05). Interestingly, girls with middle and low ethnic backgrounds
outperformed boys. However, different effects of ethnicity have been estimated between
schools. Private schools showed less effect of ethnic background than public schools. The
possible reason is that students who enroll in private schools tend to have higher
socio-economic status (SES) (landholdings, location of house) even if parents are not well
educated. This finding is consistent with Jamison and Lockheed (1987) that land ownership,
literacy level, caste membership and district of residence were strongly related to children’s
school attendance in Nepal.
Despite the improvements in school participation at all levels, grade repetition and
school absenteeism are major issues for educational development in Nepal. Poor quality of
education is one of the major reasons for grade repetition, because if the children could not
achieve a minimum level of learning in each subject, she/he cannot be promoted to the next
grade. To minimize grade repetition, targeted interventions such as teacher training, grants to
school, and school improvement plans have been used for a long time. However, nine percent
of children still repeat the eighth grade (DOE, 2010).
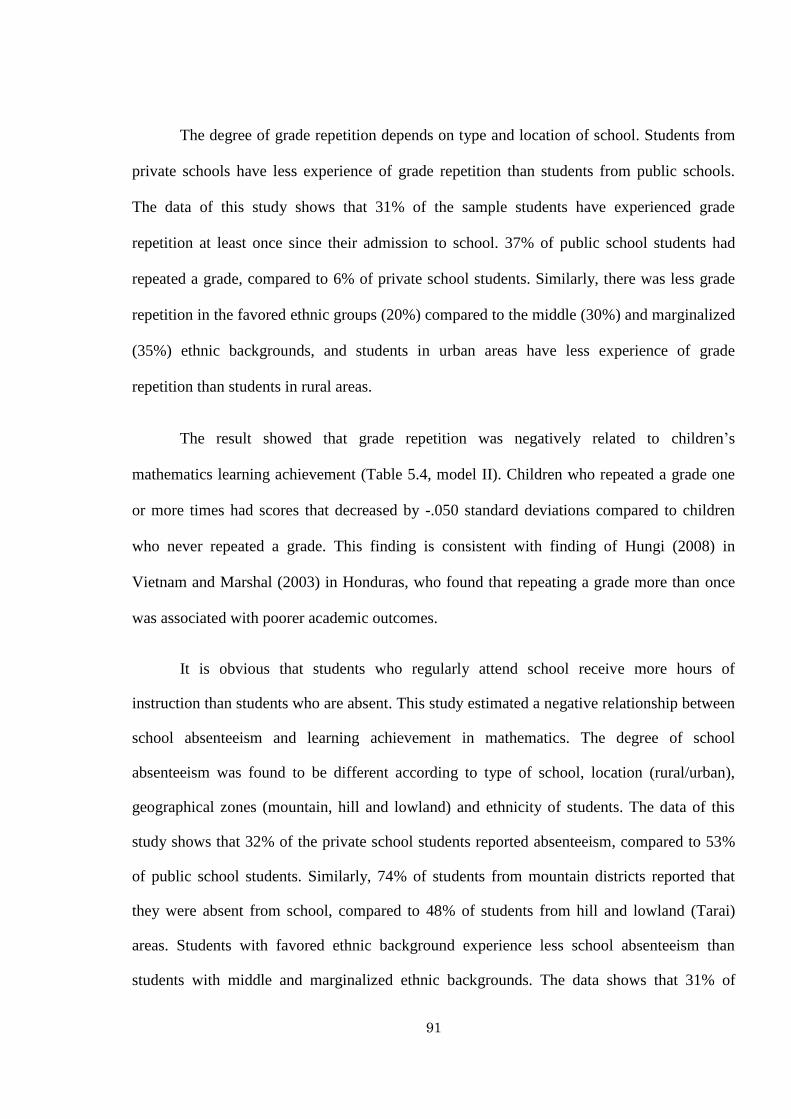
91
The degree of grade repetition depends on type and location of school. Students from
private schools have less experience of grade repetition than students from public schools.
The data of this study shows that 31% of the sample students have experienced grade
repetition at least once since their admission to school. 37% of public school students had
repeated a grade, compared to 6% of private school students. Similarly, there was less grade
repetition in the favored ethnic groups (20%) compared to the middle (30%) and marginalized
(35%) ethnic backgrounds, and students in urban areas have less experience of grade
repetition than students in rural areas.
The result showed that grade repetition was negatively related to children’s
mathematics learning achievement (Table 5.4, model II). Children who repeated a grade one
or more times had scores that decreased by -.050 standard deviations compared to children
who never repeated a grade. This finding is consistent with finding of Hungi (2008) in
Vietnam and Marshal (2003) in Honduras, who found that repeating a grade more than once
was associated with poorer academic outcomes.
It is obvious that students who regularly attend school receive more hours of
instruction than students who are absent. This study estimated a negative relationship between
school absenteeism and learning achievement in mathematics. The degree of school
absenteeism was found to be different according to type of school, location (rural/urban),
geographical zones (mountain, hill and lowland) and ethnicity of students. The data of this
study shows that 32% of the private school students reported absenteeism, compared to 53%
of public school students. Similarly, 74% of students from mountain districts reported that
they were absent from school, compared to 48% of students from hill and lowland (Tarai)
areas. Students with favored ethnic background experience less school absenteeism than
students with middle and marginalized ethnic backgrounds. The data shows that 31% of

92
students from favored ethnic backgrounds experienced school absenteeism, while 54% of
students from middle and 65% of students from marginalized ethnic backgrounds have
experienced school absenteeism. The result showed that decreasing school absenteeism by
one standard deviation increased students’ academic achievement by -.185 standard
deviations (-6.819, p<0.01). One of the reasons that was often mentioned by head teachers
and teachers for school absenteeism, particularly in Nepal, was children’s involvement in
household chores.
Homework, which is an important point of contact between parents, children and
schools, is one of the factors frequently examined in relation to school outcomes. This study
found a significant relationship between homework completion and mathematics learning
achievement among eighth grade students in Nepal. Descriptive statistics show that 90% of
private school students do homework every day, compared to 70% of public school student;
none of the private school children reported that they never do homework. It is estimated that
increasing student time on homework by 1 standard deviation increased academic
achievement by .126 standard deviations (model II, Table 5.4). However, this study
contrasted with findings of Engin-Demir (2009) in Turkey and Keith et al. (1986) in the
United States, although it supports Cooper (1989), who found that students who did
homework scored two-thirds of a standard deviation higher than those who did not.
Expanding early childhood education and development (ECED) programs for all
children is a policy priority designed to enhance children’s overall development and establish
a foundation for school success in Nepal. More than 50% of the sample students of this study
mentioned that they have experienced of early childhood education and development. Seventy
percent of private school students had preschool experience, compared to 40% of public
school students. This study estimated a positive significant, relationship between preschool

93
experience and academic achievement (.086, p<0.01), which was consistent with the Save the
Children (2003) finding that students with preschool experience were 26% more likely to be
promoted from grade 1 to grade 2 than children without preschool experience in Nepal
(UNESCO, 2003, p. 182).
Other student characteristics that were examined were students’ perception of their
mathematics teachers, academic motivation and involvement in household chores. In the
analysis, students who perceived that it was easy to understand their teacher’s instruction had
mathematics scores that were .153 standard deviations higher (p<0.01). Student motivation
also plays an important role in learning (Schunk, 1990) because it encourages students to
engage in learning activities. The result found a significant relationship between student
motivation and outcomes (.135, p<0.01). However, the number of hours spent on studying
was not significantly related to academic achievement, which contrasts with the finding of
Engin-Demir (2009) in Turkey.
Children often carry out household chores in Nepal. Increased involvement in
household chores was associated with fewer opportunities to study. In the result, increasing
children’s involvement in household chores by one standard deviation decreased academic
achievement by -0.6 standard deviations (p<0.05), which is consistent with the finding of
Akabayashi and Psacharopoulos (1999) in Tanzania. Children who spent only one hour on
daily household chores scored 3.53 points higher on average than children who spent two or
more hours per day. Private school students reported less time spent on household chores
(mean = 1.77 hours per day), compared to public school students (mean = 2.45 hours per day).
Involvement in household chores significantly affected mathematics learning achievement for
public school students but not private school students.

94
5.3.3 Parental Involvement and Mathematics Learning Achievement
The third model, the set of parental involvement variables were added to the model
that included the sets of variables for family and student characteristics. The set of family
characteristics, student characteristics and parental involvement variables were significantly
related to mathematics learning achievement (R2 = .513, adjusted R
2 = .50; F(3,759) = 2.39;
p<0.01). The correlation coefficient for model III was .71.6 and accounted for 2.1% of
variances in children’s mathematics learning achievement. Parental involvement in homework,
support and monitoring of their children’s study are significantly related to learning
achievement in mathematics.
Parents are considered to be children’s first teachers and children’s academic
performance is better when parents are involved in children’s schooling. However, measures
of parental involvement in children’s education vary across studies, and differences are
associated with SES and ethnic background (Boethel, 2003). The model III which
incorporated parental involvement as well as family and student characteristics, explained for
50% of the variance in students’ mathematics learning. However, parental involvement only
accounted for 2.1% of the variance in mathematics learning achievement (Table 5.4).
The result found a significant relationship between parental involvement in homework
and children’s mathematics performance (1.31, p<0.01). Mothers were found to help with
their children’s studies, particularly in homework, more than fathers. However, huge
differences in parental support were found between private and public schools. 72% of
students from private schools reported that they get help from their parents in their studies,
while it is 35% in the case of public schools.

95
Many studies that have investigated the effects of parental involvement in children’s
homework have found conflicting results. Some studies have found an association (Cooper,
1989; Fehrmann et al., 1987), and others have not (Engin-Demir, 2009; Epstein, 1986).
Hoover-Dempsey, Otto, Bassler, and Burow (1995) suggested that parental involvement
entails a multi-dimensional set of tasks that parents often felt ill-prepared for due to limited
knowledge and demands on their time and energy. Result showed that children who strongly
agreed that their parents encouraged them to study obtained scores that were 6.37 points
higher on average than children who strongly disagreed. The parental encouragement was
found significantly related with mathematics learning achievement (0.72, p<0.05). In addition
to encouragement to children’s to study, parents might also monitor their children’s efforts by
asking questions and observing their activities. The result found that parental monitoring was
positively related to children’s academic outcomes (0.83, p<0.05).
5.3.4 School Characteristics and Mathematics Learning Achievement
Schools are formal institutions, where teaching and learning practices happen, and
most of the resources are invested assuming that they will produce quality education.
However, this assumption came into doubt after the influential findings by Coleman et al.
(1966) in the United States, who estimated that more effects are home-related rather than
school factors. However, Heyneman and Loxley (1983) highlighted the importance of school
factors, particularly in developing countries. This study examined the set of school
characteristics represented by the variables of type of school (public or private), school
location (rural or urban), geographical location (mountain, hill, lowland), teacher training,
in-service teacher training, number of school days, teacher-student ratios and school facilities
and found that significantly related to students’ mathematics performance.

96
The model IV (Table 5.4), which is the combination of school characteristics variables
with family characteristics, student characteristics and parental involvement variables was
independently and linearly related to students’ mathematics performance (R2 = .601, adjusted
R2 = .586; F(8,754) = 5.93; p<0.01). The correlation coefficient for the model IV was .775,
which explained for 8.6% of the variance in students’ academic outcomes. It is important to
note that some of the student characteristics variables such as absenteeism, grade repetition
and homework completion, are closely related to school characteristics because they reflect
the quality of the school that the student attends, which might be a possible reason for the low
variance of school characteristics.
There were substantial differences in mathematics learning achievement associated
with school characteristics in Nepal. Traditionally, governments have preferred to retain the
control over the educational process to maintain the quality of public education. However,
budgetary shortfalls and increasing student enrolments have led many governments to
re-examine the role of the private sector in education (Kingdon, 1996). After the democracy
was restored in 1990, government of Nepal introduced liberal policies that emphasized the
role of the private sector, and currently 11% of students are enrolled in more than five
thousand private schools which are mainly in urban areas. According to NLSS III 2011,
71.9% of students attend public schools, while 26.8% attend private schools and 1.2%
attend other schools. The increasing access to private schools has raised a public
dissatisfaction due to differences in cost and quality of education between private and public
schools. The results presented in Table 5.2 revealed that private school students scored two
times higher (mean = 22.31 points) than public school students did (mean = 9.47 points).
This difference was significant (-.120, p <0.01).

97
This study found that students from private schools have higher SES measured by
parental education, availability of books and other materials. Similarly, students from private
schools were found to have the low levels of absenteeism and more homework completion,
which might be reasons for why they perform better than public school students. Private
schools were found to run more days in an academic year than public schools. There might be
several other reasons highlighted by literature, such as the management strategy of schools,
the motivation of teachers and principals, close monitoring from the school head, and better
relationship with parents. However, this study does not examine these factors.
Another possible reason might be the competitive nature of schools as they face
pressure to maximize a performance while using resources efficiently (Woessmann, 2003).
This finding is consistent with Psacharopoulos (1987) and Govinda and Varghese (1993),
who found that children in private schools in countries as diverse as the UK, Tanzania,
Australia, India, and Colombia performed better than their public school counterparts, even
after controlling for student and family characteristics.
Scarcity of resources in developing countries often leads to poorer academic
performance due to dilapidated schools, insufficient numbers of teachers, and crowded classes.
However, this situation can be mitigated by effective instructional processes and improvement
in equipment and instructional materials rather than smaller class size (Fuchs & Woessmann,
2004). In Nepal, after the progress made in improving access to all levels of education, classes
are crowded. However, even this relates to type of school, location of school, and level of
school education. The Educational Management Information System (EMIS) shows that
primary grades are more crowded than the lower secondary and the lower secondary grades
have more students than the secondary level. The average teacher-student ratio for the sample
schools in this study is 1:61. However, private schools were found to have fewer students and

98
maintain the teacher-student ratio at 1:43, which is close to the national standard. Public
schools were found to be much more crowded, with a teacher-student ratio of 1:64. Similarly,
wide variance in the teacher-student ratio was not found between the geographical zones. The
average teacher-student ratio for lowland (Tarai) and hill areas was 1:60, while for mountain
areas it was 1:64. For urban and rural areas, the teacher-student ratio was 55:1 and 67:1
respectively.
This study found teacher-student ratio negatively related with mathematics learning
achievement (-.102 <0.05), indicating that children in smaller classes outperformed children
in larger classes. In Nepal, schools lack instructional materials, and larger class sizes might
affect student learning due to less interaction between students and teachers, a noisier and
more disruptive class environment, and teachers’ inability to carry out activities or focus on
students’ individual needs. This result contradicts the finding of Hanushek (1997) but is
consistent with the finding of Woessmann (2003), where class size significantly associated to
the poor performance of students in mathematics and science on the TIMSS in 39
participating countries in 1994/1995. Kingdon (1999) found that smaller class size was
negatively associated with the acquisition of numeracy skills but positively associated with
reading skills in India. Similarly, Lindhal (2005) found that larger class size was detrimental
for minority and economically disadvantaged children in Sweden.
Although findings have not been consistent, teacher training is a widely used
intervention to improve instructional practices. The result of this study found a positive
association between teacher training and students’ academic achievement (0.77, p<0.05).
Children taught by trained teachers were likely to score ten points higher than children taught
by partially trained or untrained teachers. This result is consistent with Biniakunu (1982)
findings in the Democratic Republic of Congo (1982). However, Craig, Kraft, and Plessis

99
(1998) found that teacher training did not necessarily improve educational quality. An
academic year that includes a greater number of school days provides more opportunities for
learning to occur in the classroom. In Nepal, the Education Act and government regulation
requires a minimum of 220 school days in an academic year. This study found that schools
run less than the required minimum school days in an academic year. Schools were found to
run for 175 to 193 days. However, it varied according to type of school and location of school.
The result (model IV) suggests that the number of school days in an academic year was
significantly related to mathematics learning achievement (0.119, p<0.01).
5.4 Conclusion
By using the multiple regression analysis, I examined the factors associated with
learning achievement in mathematics of eighth grade students in Nepal. I developed the four
regression models to examine four sets of factors that would affect learning achievement.
The first multiple regression model examined the effect of family characteristics
variables. The first model (Table 5.4) shows that family characteristics variables are
significantly related to the learning achievement in mathematics (R2 = .305, adjusted R
2 =
29.9; F (6756) = 1.36; p<0.01). Standardized coefficients for the model I indicated that the
number of family members, father’s and mother’s education, the number of books in the
home and the presence of certain household items –but not travel time to school –were
significantly related to the learning achievement in mathematics.
In the second model (model II) in which, student characteristics variables were
combined to family characteristics, result found a significant relationship with the learning
achievement in mathematics (R2 = .490, adjusted R
2 = .479; F(10,752) = 2.38; p<0.01).
Student characteristics accounted for 18% of the variance in the learning achievement in

100
mathematics, with a correlation coefficient of .70. Standardized coefficients for model II
indicated that school absenteeism, homework completion, students’ perception of their
mathematics teacher, time spent on household chores, preschool experience, academic
motivation and gender are significantly related to the learning achievement in mathematics,
but time spent studying at home does not significantly relate to learning achievement in
mathematics.
In the third model (model III), the set of parental involvement variables was added to
the model II. The result showed that family characteristics, student characteristics and
parental involvement were significantly related to learning achievement in mathematics (R2
= .513, adjusted R2 = .50; F(3759) = 2.39; p<0.01). The correlation coefficient for the model
III was .71.6 and the parental involvement accounted for 2.1% of the variance in learning
achievement in mathematics. Parental homework involvement, support and monitoring were
significantly related to learning achievement in mathematics.
In the fourth model (model IV), school characteristics variables were combined with
family characteristics, student characteristics and parental involvement variables. The result
showed the significant relationship to learning achievement in mathematics (R2 = .601,
adjusted R2 = .586; F(8754) = 5.93; p<0.01). The correlation coefficient for model IV
was .775, and school characteristics variables were accounted for 8.6% of the variance in
students’ mathematics learning achievement. It is important to note that some of the student
characteristics variables included in model II such as school absenteeism, grade repetition,
and homework completion, are closely related to school characteristics because they reflect
the quality of school that students attend, which might be a possible reason for the low
variance of school characteristics. The type of school (public and private), school location
(rural or urban), geographical location (mountain, hill, and lowland), pre- and in-service

101
teacher training, number of school days, teacher-student ratios and school facilities were
significantly related to learning achievement in mathematics.
In conclusion, the findings of this chapter shows that average of mathematics learning
achievement of eighth grade students in Nepal is 11.55 out of the possible 50 marks with the
standard deviation of 9.28. However, there are differences in mathematics learning
achievement based on gender, ethnicity, type of school and school location. The analysis of
one-way ANOVA (Table 5.2) shows that boys performed higher (M = 13.2, SD = 9.47) than
girls (M = 10.7, SD = 8.53) which is statistically significantly different (t = 6.08, p<0.01).
Students from the high ethnicity are found to perform higher than middle ethnic students, and
middle ethnic students performed higher than the low ethnic students, with a mean learning
achievement of 15.54, 9.60 and 8.28 respectively, which is significantly different (t = 41.73,
p<0.01). Similarly, result shows a large gap in mathematics learning achievement between
private and public schools. The average mathematics learning achievement for students of
public school is 9.50, while mathematics learning achievement for private school students is
more than two times higher, with an average of 22.31. Similarly, there are differences in
mathematics learning achievement between students from urban and rural, and ecological
zones (mountain, hill, and lowland).
Similarly, multiple regression analysis shows that family characteristics accounted for
highest level of variance (29.9%) in the learning achievement in mathematics, followed by
student characteristics (18.0%), school characteristics (8.6%) and parental involvement
(2.1%). Variables such as parental education, particularly mother’s level of education, number
of books at home, school absenteeism, parental support for homework, school type and
location, teacher training, the number of school days in the academic year, and school
facilities were found to be significant factors related to the learning achievement in
mathematics.

102
Chapter 6 An Assessment of Mathematics Learning Achievement of Eighth
Grade Students in Nepal
6.1 Introduction
In Chapter 5, this dissertation examined the factors affecting the quality of education,
particularly mathematics learning achievement. Since the Chapter 5 indicated the low level of
learning achievement in mathematics, it is important to analyze mathematics test particularly
focusing on its areas such as arithmetic, algebra, statistics, and geometry, and cognitive and
mental skills to solve mathematical questions. Similarly, it is equally important to identify the
differential patterns of students’ capacities to solve mathematical questions by examining the
mutual relationships among cognitive and contents domains. These analyses are essential to
improve mathematics learning because it will provide useful information to policy makers,
curriculum developers, teachers, and other stakeholders to identify mathematical areas,
concepts and topics that need more focus and effort to improve the quality of education,
particularly mathematics learning in Nepal.
In this context, Chapter 6 first assesses the content domains of mathematics learning
such as arithmetic, algebra, statistics, and geometry. Content domains specify the subject
matters of mathematics that students are expected to learn by the end of the academic year
(TIMSS, 2011). Similarly, this chapter further assesses the cognitive and mental skills
students use in solving test questions according to the domains or thinking process, which, in
this study, is considered as cognitive domain of learning. Learning does not happen as an
one-time event. It is a process which progresses continuously. First we develop our cognitive
and mental skills, develop our attitudes and acquire new physical and cognitive skills to

103
perform certain activities. According to Bloom’ taxonomy (1956), there are three types of
domains of learning- cognitive, affective, and psychomotor. Cognitive domain involves the
development of our mental skills and the acquisition of knowledge, while affective domain
involves our feeling, emotions, and attitudes, and the psychomotor domain focuses on
changing behavior or skills of learner. Among these three, this dissertation focuses on the
cognitive domains of mathematics learning because one of the objectives of this dissertation
is to assess how much students attain the curricular contents which they are taught in school
and which kind of combination of cognitive skills and content knowledge are crucial for them
to achieve better learning.
Within each domain, there are multiple levels of learning that progress from basic to
complex or deeper levels of learning. There are six categories within the cognitive domain
arranged from the simplest behavior to the most complex. The first level of cognitive domain,
as I indicated in Figure 2.3, Knowledge is to recall or recognize mathematical facts, concepts
and procedures. Generally, it is believed that the more relevant knowledge of mathematics a
student is able to recall and the wider range of concepts he or she has understood, the greater
chances are to solve mathematical problems. The second level of the cognitive domain, which
is named Comprehension in Figure 2.3, focuses on students’ ability to apply knowledge and
conceptual understanding of mathematics to solve problems or answer questions. The third
cognitive domain, Application, focuses on the application of the knowledge and
understanding in a given context. Analysis, synthesis, and evaluation are the higher levels of
learning, which focus on interpretation, creative thinking and assessing effectiveness. This
dissertation does not include analysis, synthesis, and evaluation separately because eighth
grade students’ mathematics test does not include the complex stage of learning such as
synthesis and evaluation. The problem solving is the highest stage of learning for this study

104
which corresponds to analysis, synthesis, and evaluation. Problem solving goes beyond the
solution of routine problems to encompass unfamiliar situations, complex context and
multi-step problems.
Second, Chapter 6 examines the differences in areas of mathematics (content domain),
and mental and cognitive skills to solve mathematical problems (cognitive domains) by
gender, ethnicity, type of school and school location. Furthermore, it examines what are the
mathematical knowledge and concepts associated with each other and which mathematical
concept or cognitive skills have to be strengthened to improve learning achievement in other
areas of mathematics. By examining the differences in content and cognitive domains of
mathematics learning by gender, ethnic background, types of school and location reveal the
gap between groups of student, while examining the mathematics knowledge and cognitive
skills that need to be strengthened, policy makers will benefit to improve the quality of
education particularly mathematics learning in Nepal.
For more than five decades, the assessment of students’ learning achievement in
different subjects has been practiced, particularly in developed countries; however, it is a new
phenomenon in the context of Nepal because Nepal has not participated in any international
assessments so far. In recent years, Nepal has carried out national assessments to assess the
level of learning achievement, particularly in the core subjects of English, mathematics and
science in different grades. However, none of them have analyzed the content and cognitive
domains of mathematics learning or how the content domains are related to each other.
Therefore, the analysis in this chapter has significant implications for improving the quality of
education, particularly in mathematics learning in Nepal.

105
The structure of chapter 6 is as follows. The first section describes the mathematics
test design, including its reliability and validity. The second section assesses the content and
cognitive domains of learning mathematics for eighth grade students in Nepal. It further
examines the differences in content and cognitive domains of learning mathematics by gender,
ethnicity, type of school, and location of school. The third section examines the relationship
between mathematical items. The final section concludes findings.
6.2 Mathematics Test Design
The mathematics test for eighth grade students was designed for two purposes. The
first purpose was to assess the overall learning achievement in mathematics of eighth grade
students in Nepal. The second purpose was to assess the content (areas of mathematics such
as arithmetic, algebra, geometry, and statistics) and cognitive domains (knowledge,
comprehension, application and problem solving). Before designing the test, I analyzed the
national curriculum and mathematics textbooks in particular to examine knowledge, skills,
and areas of mathematics that eighth grade students are expected to learn. The test was
designed in line with the national curriculum for grade eight students in Nepal. Test items
were discussed with subject specialists, people in charge of mathematics curriculum
development in the Curriculum Development Center (CDC), and teachers who were currently
teaching grade eight mathematics to make the test more reliable and consistent.
Twenty mathematics items were included in the test with 50 possible marks. The
weight of each item was assigned according to the national curriculum. Out of a total of
twenty mathematics questions, four fall into the category of objective questions, nine are short
questions and the remaining seven belonged to the category of long questions. The objective
questions ask mathematical facts where students need to recall mathematical knowledge. The

106
short questions measured the students’ ability to apply knowledge and conceptual
understanding of mathematics. The long questions measured the students’ ability to solve
mathematical problems within relatively complex contexts which require students to follow
multiple steps. Different marks were assigned to each type of question. Objective types of
mathematics questions were assigned one mark each, short questions were assigned two
marks each and long questions were assigned four marks each. As the author will discuss later,
each question was designed to cover different content (arithmetic, algebra, geometry, and
statistics) and cognitive domains (knowledge, comprehension, application, and problem
solving) of learning, so that the test will provide comprehensive picture of the relationship
among these domains in a systematic manner.
Ensuring the reliability of the test is essential because it shows the degree to which a
test is consistent and stable in measuring what is intended to measure (Field, 2009). The
justification is that students should get similar scores even if the test is administrated in two
points in time. There are different methods for checking the reliability of tests, but the
common practice is to check the value of Cronbach’s alpha. The overall Cronbach’s alpha of
the mathematics test designed for this study was found to be .846, which indicate good
enough level of internal consistency among categories for an ability test like this one. The
value of Cronbach’s alpha between 0.6 and 0.7 is also considered acceptable because it is
mostly determined by the number of items in the scales (Field, 2009). It means that generally,
as the number of items in the scale increases, the value of Cronbach’s alpha will also increase.
Furthermore, the internal consistency of the categories employed for cognitive skills
(knowledge, comprehension, application, and problem solving) was also checked, where
Cronbach’s alpha for two domains of cognitive skills, namely comprehension and application,

107
were found to be fair, at .677 and .679. However, the internal consistency for the remaining
two domains of cognitive skills (knowledge and problem solving) was found to be relatively
low at .622 and .647.
6.3 Content Domains of Mathematics Test Items
Mathematics test items are categorized into four content domains -arithmetic, algebra,
geometry, and statistics. Out of twenty mathematics test items, six related to arithmetic, seven
to algebra, two to statistics, and five to geometry. According to the weight of teaching hours
given in the national curriculum, highest proportion of weight was given to algebra (32%),
followed by geometry and arithmetic (28% each), and statistics (12%). The number of
mathematics test items within the content domain, and its proportion of weight were assigned
according to mathematics national curriculum of grade eight in Nepal. Table 6.1 below
illustrates the content domains of mathematics test items included in this study.
Table 6.1 Content Domains of Mathematics
Content Items Marks
Arithmetic 6 14
Algebra and functions 7 16
Geometry 5 14
Statistics 2 6
Total 20 50
Source: Mathematics test conducted by the author

108
Arithmetic
The Arithmetic content domain included six items -whole numbers, ratios, simple interest,
significant figures, percentage, and profit and loss. Arithmetic test items mainly measured the
knowledge of numbers system and operations.
Algebra
Under the algebra content domain, students were expected to have the knowledge of algebraic
expressions, particularly factorization, multiplication and division, use and simplification of
algebraic equations, formulas and solving linear equations. Seven algebraic items -algebraic
expression (multiplication and division), indices, factorization, highest common factors
(HCF) and lowest common multiples (LCM), linear equations, and co-ordinate geometry
were included in the test for this study.
Geometry
There are five geometric items- measurements of angle and parallel lines, area of a circle,
prisms, and the construction of trapezium included in the test designed for this study. Within
the geometric skills students are supposed to be able to construct of two and three
dimensional geometric figures, angels, parallel lines, and circles. Furthermore, students are
supposed to be competent to measure geometric shapes using measuring instruments.
Statistics
Data and chance content includes knowledge of organizing data and its interpretation. This
content domain particularly measures the skills of data organization, representation, and
interpretation. Students should be able to calculate the mean and median of given data.

109
6.4 Cognitive Domains of Mathematics Test Items
As discussed earlier in this paper, according to the taxonomy provided by Bloom
(1956), there are six major categories of learning classified within the cognitive domains
listed from the simple to the complex stages of learning (Figure 2.3). In this study, the test
items were distributed according to these categories as presented in Table 6.2.
The stages of learning as presented in Chapter 2 (Figure 2.3) -analysis, synthesis and
evaluation -are not included separately in this study because eighth grade students’
mathematics test does not include the complex stage of data processing such as synthesis and
evaluation. However, the problem solving of cognitive domain is the highest stage of learning
for this study which corresponds to these three stages.
Table 6.2 Cognitive Domains and Types of Mathematics Test Items
Cognitive domains Number of items Total marks
Objective Short Long
Knowledge 4 4
Comprehension 4 8
Application 5 2 18
Problem Solving 5 20
Total 4 9 7 50
Source: Mathematics test conducted by the author
Out of total of twenty mathematics test items, four items were categorized to assess
students’ skills of Knowledge domain, four items to Comprehension domain, seven items to
Application domain, and five items to Problem solving domain. The highest proportion of
weight was given to the questions classified under the domain of Problem solving, followed
by Application, Comprehension, and Knowledge respectively. Similarly, four mathematics

110
test items were belonged to category of objective questions, nine are short questions and
remaining seven belonged to the category of long questions. The characteristic of each
category is explained in mathematics test design section 6.2.
6.5 Methods for Mathematics Test Items Analysis
In the above section, I explained the design of mathematics test with a particular focus
on the content and cognitive domains of learning. From here, I explain the techniques used for
the mathematics test items analysis. Three types of analysis have been carried out. First,
weighted means were calculated to assess the level of content and cognitive domains of
learning mathematics. The weighted means were used because some of the score points for
respective categories were not made to be the same. Therefore, the means need to be weighted
to make them comparable across categories. Second, one-way ANOVA is used to examine
the differences in students’ mathematics learning for respective content and cognitive
domains compared by gender, ethnicity, type of school, and location of school. In Chapter 5,
the differences between groups of students were examined for the overall score of
mathematics test (Table 5.2). So here in Chapter 6, the differences of learning outcomes were
examined according to the areas of mathematics knowledge (arithmetic, algebra, geometry
and statistics) and cognitive skills (knowledge, comprehension, application, and problem
solving). Finally, I conducted principal component analysis (PCA) to examine how the
students’ capacity to solve mathematics questions in different domains are mutually related.
PCA is a statistical procedure that transforms a number of possibly correlated variables into a
smaller number of uncorrelated variables. It is useful to find groups of variables which shares
common elements which are not anticipated but significant. Before conducting the PCA, I
examined the Pearson’s correlation analysis to examine strength of relationships between
mathematics test items included in this study (Table 6.7).
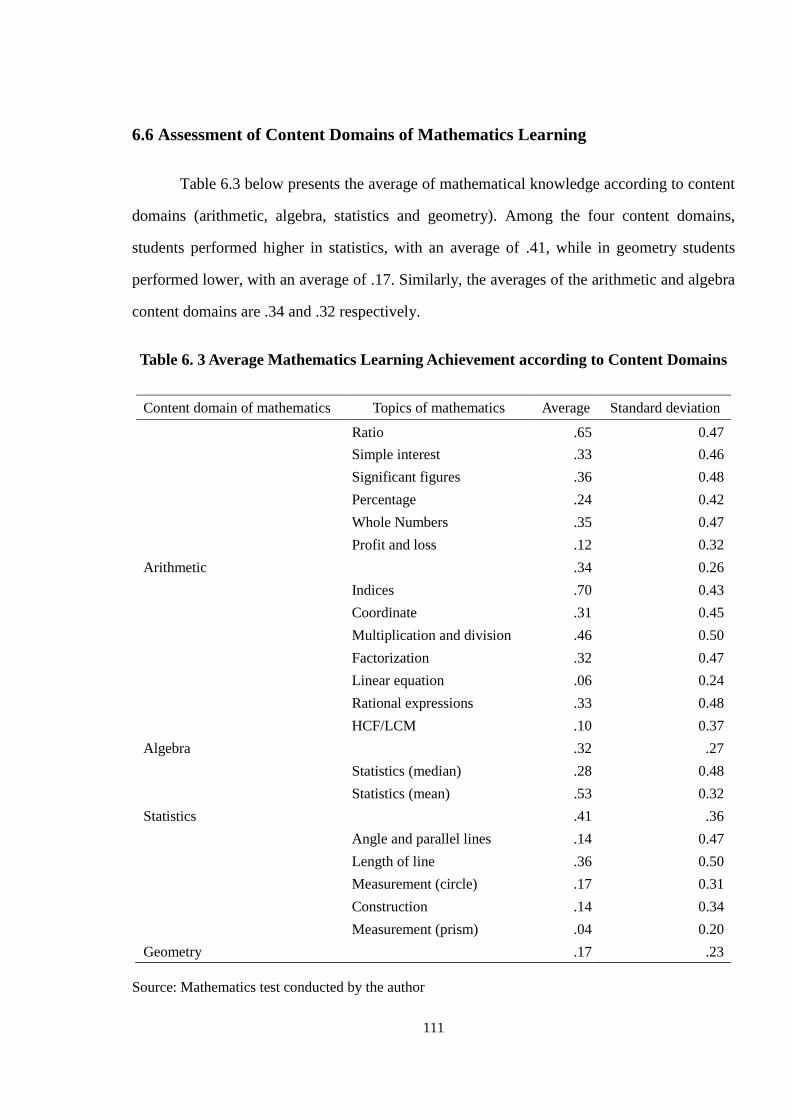
111
6.6 Assessment of Content Domains of Mathematics Learning
Table 6.3 below presents the average of mathematical knowledge according to content
domains (arithmetic, algebra, statistics and geometry). Among the four content domains,
students performed higher in statistics, with an average of .41, while in geometry students
performed lower, with an average of .17. Similarly, the averages of the arithmetic and algebra
content domains are .34 and .32 respectively.
Table 6. 3 Average Mathematics Learning Achievement according to Content Domains
Content domain of mathematics Topics of mathematics Average Standard deviation
Ratio .65 0.47
Simple interest .33 0.46
Significant figures .36 0.48
Percentage .24 0.42
Whole Numbers .35 0.47
Profit and loss .12 0.32
Arithmetic
.34 0.26
Indices .70 0.43
Coordinate .31 0.45
Multiplication and division .46 0.50
Factorization .32 0.47
Linear equation .06 0.24
Rational expressions .33 0.48
HCF/LCM .10 0.37
Algebra
.32 .27
Statistics (median) .28 0.48
Statistics (mean) .53 0.32
Statistics
.41 .36
Angle and parallel lines .14 0.47
Length of line .36 0.50
Measurement (circle) .17 0.31
Construction .14 0.34
Measurement (prism) .04 0.20
Geometry
.17 .23
Source: Mathematics test conducted by the author

112
Six mathematics topics-ratio, simple interest, significant figures, percentage, whole
number, and profit and loss -were examined within the arithmetic content domain, where
students performed the lowest in profit and loss with an average of .12. It shows that having a
low level of knowledge of percentage is one of the reasons for low performance in profit and
loss. It is estimated that students who are able to answer the questions about percentage are
likely (60%) to answer the questions on profit and loss.
Among arithmetic questions, students’ performance was higher in the area of ratio,
with an average of .65, and in algebra, the area of indices with an average of .70. The higher
performance in these two topics is because these questions were designed to require
Knowledge skill, which is to recall mathematical knowledge and the easiest stage of cognitive
skills as shown in Figure 2.3. Similarly, students were found to perform poorly particularly in
the content domain of geometry with an average of .17. There might be several reasons for the
particularly poor performance in geometry which this chapter is going to investigate. This
study also shows that students have a low level of correct marks for the measurement of
circles, triangles, and areas.
Within the content domain of algebra, students were found to perform poorly in
Highest Common Factor (HCF) and Lowest Common Multiple (LCM), with an average
of .10, and in linear equation with an average of .06. The relationship between HCF/LCM,
and geometric items, particularly measurement, is not clear. However, as will be discussed
later, according to the author’s principle component analysis (PCA) (Table 6.8), the algebraic
topic of HCF/LCM and geometric topics, particularly measurement, are related to each other.
It suggests that if the knowledge of geometric measurement is improved, the algebraic

113
knowledge of HCF/ LCM will also likely improve. Even though still not satisfactory, in
general, students performed higher in the content domain of statistics with an average of .41.
6.7 Assessment of Cognitive Domains of Mathematics Learning
Mathematics test items are categorized into four cognitive domains of learning, i.e.
knowledge, comprehension, application, and problem solving. Table 6.4 below presents the
means of cognitive domains. It also describes the contents of mathematical knowledge within
each cognitive domain.
Table 6.4 Average Mathematics Learning Achievement according to Cognitive Domains
Cognitive
Domains
Mathematical knowledge to be covered Mean
Knowledge Find ratio, intercept, write formula of principle, and indices 0.50
Comprehension Significant number, percentage, find median of data,
simplify algebraic equation, and find slope
0.35
Application Finding the area of triangle, circle, prism, and construction
of trapezium
0.17
Problem solving Simplifying algebraic equations , profit and loss, HCF and
LCM, and finding the mean of data
0.29
Note: (1= 100%)
Source: Mathematics test conducted by the author
Table 6.4 shows that students performed higher in the cognitive domain of Knowledge
with an average of .50. The Knowledge domain require students to recall knowledge and is
the first stage of learning. For the questions classified in this Knowledge domain, 50% of
students could find the ratio, write the formulae of percentage and find the indices. At the
second stage of cognitive stage, Comprehension of the mathematical concepts, students were
found to perform with average of .35. It means that 35% of sampled eighth grade students

114
could solve the mathematics items of significant figures, percentage, algebraic multiplication
and division and finding the median of data.
The cognitive domain, for which students were found to perform at a lower level was
Application domain, although theoretically the Problem solving is considered to be a higher
order of learning than the Application cognitive domains. Table 6.4 indicates that only 17% of
eighth grade students were able to find the area of a triangle and a circle, construct a
trapezium, and find the surface of a triangular prism. The result shows that (Table 6.7)
algebraic item HCF/LCM is the highly correlated with the geometric items which require
skills categorized as Application domain. It indicates that if students are able to solve the
algebraic questions about HCF/LCM, they are likely to answer questions related to other
questions which require Application skills.
The result (Table 6.4) shows that only 50% of eighth grade students were able to recall
the mathematical knowledge, while 35% of students could apply the knowledge and
conceptual understanding of mathematics to solve the problems. Similarly, 17% of Nepalese
students were able to apply the knowledge of mathematics, while 29% of students were able
to deal with complex or unfamiliar situations of mathematics.
6.8 Differential Attainment among Content Domains Compared by Gender,
Ethnicity, Type of school, and Location of School
In Chapter 5 (Table 5.2), I calculated the overall mathematics learning achievement,
and examined the differences of scores by gender, ethnicity, types of school, and location of
school. The result showed a significant gap in mathematics learning achievement between
these categories of students. However, it did not explain the differences of performance
among areas of knowledge (arithmetic, algebra, statistics, and geometry) considered as
content domain, and required cognitive skills to answer test questions which is considered as

115
cognitive domain. The Table 6.5 below shows the differences of attainment in areas of
mathematics learning (arithmetic, algebra, statistics, and geometry) by gender, ethnic
background of student, type of school, and location of school.
Table 6.5 Average Mathematics Learning Achievement in Content Domains by Gender,
Ethnicity, Types of School and Location of School
Categories
Arithmetic Algebra Statistics Geometry
Mean F Sig. Mean F Sig. Mean F Sig. Mean F Sig.
Gender
Female 0.23 32.08
.000
0.26 14.58
.000
0.42 4.07
0.39
0.15 2.01
0.156
Male 0.34 0.33 0.48 0.18
Types of school
Private 0.54 153.5
.000
0.54 176.6
.000
0.34 45.8
0.11
0.37 143 .000
Public 0.23 0.25 0.24 0.12
Location of school
Urban 0.32 18.9
.000
0.34 36.09
.000
0.5 16.8
.000
0.19 12.8
.000
Rural 0.24 0.24 0.39 0.13
Ecological zones
Lowland 0.26 4.99
.007 0.30 6.00
0.94 0.53 21.7
.000 0.2 11.2
.000
Hill 0.31 .336
0.30 .002
0.39 0.12
0.12 0.99
Mountain 0.19 0.15 0.18 0.11
Ethnicity
High ethnicity 0.4 44.59
.000 0.38 28.18
.000 0.52 6.46
.000 0.22 16.0
.000
Middle
ethnicity
0.21 0.324
0.25 0.16 0.42 0.75
0.14 0.26
Low ethnicity .26 0.19
0.38 .752
Source: Mathematics test conducted by the author

116
Table 6.5 shows the average mathematics learning by its content domain (arithmetic,
algebra, statistics, and geometry). It shows that boys perform higher than girls in arithmetic
and algebra content domain of mathematics with mean difference of 0.11 and 0.7 respectively,
which is statistically significant (p<0.01). However, in statistics and geometry, the gender
difference did not appear. As a large gap was found in overall mathematics scores between
private and public schools (Chapter 5, Table 5.2), similarly, a significant difference was found
between these categories of schools in most of contents domains, except for statistics (Table
6.5). The average score of students from private school in arithmetic, algebra, and geometry
are 0.54, 0.54 0.37 respectively, while for students form public school, they are 0.23, 0.25 and
0.12 respectively. Similarly, students from urban schools perform higher than those from rural
schools in all four areas of mathematics. Similarly, students from lowland (Tarai) areas
perform better in arithmetic, statistics and geometry, which was statistically significant at 1%
level. However, no significant differences were found in algebra. Furthermore, students from
high ethnic background perform better than students from other ethnic backgrounds, but no
statistically significant differences were found between students from middle and low ethnic
backgrounds.
6.9 Differential Attainment among Cognitive Domains Compared by Gender,
Ethnicity, Type of School and Location of School
I analyzed the differences in attainment of areas of mathematics learning (arithmetic,
algebra, statistics, and geometry) by gender, ethnicity, type of school, and location of school
in the above section. It showed the significant differences in areas of mathematics between
students. Table 6.6.below presents the differences in attainment of cognitive domain
(Knowledge, Comprehension, Application, and Problem solving) between students.

117
Table 6.6 Average Mathematics Learning Achievement in Cognitive Domains by Gender,
Ethnicity, Types of School and Location
Categories Knowledge Comprehension Application Problem solving
Mean F Sig. Mean F Sig. Mean F Sig. Mean F Sig.
Gender
Girl .446 28.60 .000 .308 23.87 .000 .126 13.25 .000 .261 10.14 .002
Boys .559 .428 .178 .320
Types of school
Private .762 131.7 .000 .713 185.4 .000 .357 194.6 .000
.509 123.3 .000
Public .450 .298 .111 .247
Location
Urban .527 7.40 .007 .421 24.15 0.00
.174 12.61 .000
.345
.225
43.80 .000
Rural .468 .300 .123
Eco-logical zones
Lowland
(Tarai)
.460 21.64 .000 .344 3.91 .074
.183 11.51 .000 .317 10.02 .000
Hill .569 0.12
.400 .394
.117 .797
.271 .411
Mountain .294 .265 .094 .129
Ethnicity of student
High ethnicity .619 36.88 .000 .513 40.60 .000 .214 23.14 .000 .364 19.59 .000
Middle
ethnicity
.428
.330
.286 .880
.123 .140
.258 .125
Low ethnicity .513 .307 .071 .189
Source: Mathematics test conducted by the author
Table 6.6 shows the average test scores classified by the cognitive domain assigned to
respective questions (knowledge, comprehension, application, and problem solving). It shows
that boys perform higher in all four cognitive domains of mathematics, which is statistically
significant at a level of 1%. Similarly, students from private schools and urban schools are
performing better than students from public and rural schools, which is statistically significant

118
(p<0.01). Furthermore, differences in cognitive domains of mathematics learning are
associated with ethnicity of student. Students of high ethnic background perform higher in all
cognitive domains of mathematics learning which is statistically significant (p<0.01).
However, no significant differences are found between middle and low ethnic students in all
categories of cognitive domains of mathematics learning. Furthermore, significant difference
is found between students of different eco-logical zones. Students from lowland (Tarai)
perform higher than students from hill and mountain which is statistically significant at 1%
level. However, significant difference does not exist between students from hill and mountain
in cognitive domains of mathematics learning.
In conclusion, the results show the significant differences in content domain and
cognitive domains of mathematics learning between gender, type of school, and location of
school and ethnicity of student. However, there is no significant difference exist between
students from middle and low ethnicity, and students from hill and mountain eco-logical
zones in all four types of cognitive domains.
6.10 Relationships among Content Domains of Mathematics Test Items
In the above section, I calculated the mean and standard deviations of mathematics
learning achievement by content and cognitive domains. Similarly, by using the one way
ANOVA, I examined the differences in content and cognitive domains by gender, ethnicity,
type of school, and location of school. In this section, I will examine how the mathematics
test items are inter-related. I conducted the Pearson’s correlation analysis to examine the
strength of relationship between mathematics test items. The correlation coefficient (Table
6.7) shows that fairly significant relationship among mathematics test items. It particularly
indicated that geometric items such as angle and parallel line, measurement of line, prism, and

119
construction of trapezium are highly correlated with each others. Similarly, the arithmetic
items ratio, simple interest and significant figures, and algebraic items- multiplication and
division, factorization are found correlated. Furthermore, arithmetic items, percentage, and
profit and loss are found strongly related with correlation coefficient of 43.3 which is
significant at a level of 1%.

120
Table 6.7 Correlation Coefficient between Mathematics Test Items
Mathematics items Ratio Simple
Interest
Perce
ntage
Signif
icant
Whole
number
Profit
loss
Indic
es
Coor
dinate
Multiplic
ation and
Factori
zation
Linea
r
Ratio
nal
HCF &
LCM
Statist
(median
Statist
(mean)
Angle
parall
Measure
(line)
Measure
(circle)
Const
(trapezi)
Measure
(prism)
Ratio 1
Simple Interest .206** 1
Percentage .232** .221** 1
Significant figure .235** .151** .278** 1
Whole Number .084* .171** .214** .233** 1
Profit Loss .200** .185** .433** .252** .294** 1
Indices .108** .153** .220** .130** .118** .155** 1
Coordinate .296** .255** .323** .389** .197** .266** .261** 1
Multiplication .326** .238** .290** .335** .255** .271** .177** .372** 1
Factorization .286** .249** .353** .316** .243** .290** .133** .360** .489** 1
Linear equation .129** .183** .211** .124** .118** .242** .074* .132** .104** .149** 1
Rational expression .222** .139** .184** .241** .285** .220** .194** .290** .322** .289** .108** 1
HCF_LCM .159** .082* .195** .204** .230** .191** .142** .248** .175** .257** .090* .185** 1
Statistics (Median) .075* .090* .245** .221** .241** .188** .153** .207** .167** .204** .097** .160** .238** 1
Statistics (Mean) .127** .071 .224** .142** .202** .130** .082* .212** .239** .164** .128** .231** .197** .156** 1
Angle parallel lines .272** .217** .349** .332** .277** .316** .177** .353** .353** .382** .122** .307** .365** .296** .151** 1
Measurement line .212** .186** .245** .230** .274** .331** .149** .260** .316** .305** .183** .381** .189** .178** .179** .312** 1
Measurement circle .190** .196** .333** .317** .298** .304** .109** .293** .271** .303** .121** .247** .297** .253** .186** .454** .336** 1
Const. (trapezium) .145** .107** .176** .160** .201** .125** .063 .201** .187** .198** .089* .157** .238** .130** .200** .279** .228** .296** 1
Measurement prism .114** .100** .270** .228** .274** .339** .140** .231** .154** .225** .133** .205** .369** .214** .145** .406** .244** .409** .329** 1
Source: Mathematics test conducted by the author
Note: ** and * correlation is significant at the 0.01 and 0.05 levels respectively (2 tailed).

121
6.11 Principle Component Analysis of Content Domain of Mathematics Test items
The correlation coefficient (Table 6.7) of mathematics test items indicated that they
are fairly related with each other. It further showed the clusters of mathematic test items
indicating the possible existence of some common underlying denominators. In such as case,
it is important to explore smaller components that are inter-related with each others. The
principle component analysis (PCA) is a multivariate technique, to explore the existence of
smaller components that are correlated with each others. This technique helps to understand
the structure of a set of variables by unearthening the underlying variables. It also contribute
to reduce the number of variables to a more manageable size by clustering those with similar
distributive patterns while retaining as much of the original information as possible. In this
analysis, PCA is used to understand the structure of the mathematics test items, or in other
words, it is used to understand how content of mathematics are mutually related in developing
students’ capacities to solve mathematical problems. Table 6.8 shows the results of the
principle component analysis with the variances of components.

122
Table 6.8 Principal Component Analysis between Content Domains of Mathematics Test
Items
Compo
nents
Initial Eigen Values
Rotation Sums of Squared Loadings
Total
percentage
of variance
cumulative
percentage
Total
Percentage
of variance
Cumulative
percentage
1 5.416 27.081 27.081 2.629 13.143 13.143
2 1.359 6.796 33.877 2.582 12.910 26.053
3 1.108 5.542 39.419 1.760 8.801 34.854
4 1.031 5.157 44.576 1.630 8.150 43.004
5 1.009 5.044 49.620 1.323 6.616 49.620
6 .937 4.683 54.302
7 .907 4.537 58.839
8 .847 4.235 63.074
9 .795 3.976 67.051
10 .761 3.805 70.856
11 .736 3.679 74.534
12 .702 3.512 78.047
13 .673 3.364 81.411
14 .607 3.034 84.445
15 .591 2.953 87.398
16 .550 2.748 90.146
17 .540 2.702 92.848
18 .506 2.532 95.380
19 .478 2.392 97.771
20 .446 2.229 100.00
Source: Mathematics test conducted by the author
In the principle component analysis, the number of analysis is equal to the numbers of
variables being analyzed. This study included twenty mathematics questions, so there are
twenty items extracted as initial eigenvalues. However, all of them might not have been
important. To determine the importance of factors, I looked at the magnitude of the associated

123
eigenvalues. By default, SPSS uses Kiaser’s criteria of retaining factors with eigenvalues
greater than 1. Table 6.8 shows the eigenvalues associated with each linear component before
extraction, and after rotation. Before extraction, there were twenty components; however,
there were only five components which had eigenvalues greater than 1. These five
components explained about 50% of total variability for the mathematics test items. The
eigenvalues associated with each factor represent the variance explained by that particular
linear component. The first factor can be expected to account for a fairly large amount of
variance. Table 6.8 shows that the first component explains the 27% of total variance for the
test items, whereas the subsequent four factors explain small amounts of variance. The second
group of factors explains 6.8% of variance, the third group of factors explain 5.5% of variance,
while the fourth and fifth group explain 5.1 and 5% of variance.
The final part of Table 6.8 (second column) shows the eigenvalues of the factors after
rotation. Factor rotation has the effect of optimizing the factor structure, and one consequence
of rotation is that the relative importance of these five factors is equalized. Before rotation, the
first factor accounted for considerably more variance (27%) than the remaining four variables;
however, after rotation, it accounts only for 13% of variance, while second, third, fourth and
fifth factors explain 12.9%, 8.8%, 8.1%, and 6.6% of variances of mathematics learning
respectively. It indicated that the first two factors are equally accountable for the variances
(13 %) for mathematics learning of eighth grade students in Nepal.
Table 6.9 below presents the rotated component matrix, which is a matrix of the factor
loadings for each variable onto each factor. It shows the factor loading of all the mathematics
items included for this study. However, for the purpose of analysis the factor loading above .4
is considered as a cut-off point (Stevens, 1992). It shows that the mathematics test items are

124
clustered in five components, with seven mathematics test items in the first component, five
items in the second, three items in the third, three items in the fourth and two items in the fifth.
The characteristics of the mathematics test items of each group and their relationships are
discussed below.
Table 6.9 Rotated Component Matrix of Mathematics Test Items
Mathematics test items
Components
Number
system
Geometric
skills
Data
management
Ratio and
percentage
Algebraic
expressions
Ratio .677 .063 .037 .102 -.123
Algebraic (Multiplication
and Division)
.667 .075 .347 .049 .076
Factorization .615 .226 .183 .150 .063
Coordinate .582 .196 .140 .069 .317
Significant figures .490 .285 .086 .053 .208
Simple interest .433 -.018 -.026 .319 .053
Whole number .406 .315 .120 .205 .175
Measurement (prism) .019 .735 .076 .208 .085
Measurement (circle) .251 .620 .148 .189 .037
HCF_LCM .122 .617 .120 -.060 .182
Angle and parallel line .311 .583 .085 .111 .169
Construction (trapezium) .144 .565 .246 -.005 -.259
Statistics (mean) .057 .101 .671 .028 .032
Statistics (median) .005 .361 .525 .064 .156
Measurement (line) .256 .201 .513 .290 -.011
Percentage .176 .279 .124 .752 .179
Profit and loss .310 .267 .046 .615 .294
Linear equation .009 -.008 .149 .486 -.069
Indices .161 -.037 .094 .076 .748
Rational expressions .303 .075 .152 .010 .652
Source: Mathematics test conducted by the author

125
Numbering System: the first component of mathematics test items
There are seven mathematics test items in the first component, where four items
belong to arithmetic and the remaining three items belong to algebra content domains. The
arithmetic items in first component measure the knowledge of mathematical facts such as
calculating a ratio, writing the formula of simple interest, and place value of number, while
algebraic items measure the knowledge of simplifying algebraic expressions, particularly
multiplication and division. The common characteristic of the mathematics test items in the
first component indicates that they are closely related with mathematical knowledge of
number system which explains 27% of variances on mathematics test items, however, after
rotation, it explains only 13% of variances (Table 6.8).
The first test item in the first component belongs to arithmetic content domain. It is to
assess the students’ knowledge of ratio. The question in the test was for student to find the
ratio of 25 and 55 (Question 1, Appendix 4). This arithmetic question assess the students’
knowledge of the number system and is the easiest mathematics question within the content
domain of arithmetic. The second question in the first component assesses the knowledge of
students on algebraic multiplication and division. The actual question in the test required
students to calculate the following: 3x2 + 5x (x-2) -8x
2 +5 (Question 8, Appendix 4). The third
algebraic question which was clustered in the first component is about co-ordinate geometry.
In the actual test, the question in the test required students to find the x- intercept of the line
AB in the graph given (Question 4, Appendix 4). Similarly, the fourth question which was
clustered in the first component assesses the knowledge of factorization. The actual question
was to simplify the following algebraic expressions. m2-4m / m
2- 6m (Question 7, Appendix
4).

126
Similarly, the fifth item assesses the knowledge of place value of number by asking
students to round off 0.35674 to two significant figures (Question 5, Appendix 4). The sixth
test item clustered in first component is to examine students’ knowledge about mathematical
fact, such as writing the formulae of principal. The question in the test was as follows: if
amount (A), rate (R) and time (T) are given, write the formula to calculate the principal (P)
(Question 2, Appendix 4). The seventh item in first component belongs to arithmetic item
which measure the knowledge of whole number. The question was to simplify 110112 +
100112 -11112 (Question 13, Appendix 4).
The common feature shared among questions clustered into the first component is that
they are related to the mathematics number system which is the basic requirement for the
development of other mathematics skills. It shows (Table 6.8) that before rotation the
mathematics items in the first component are accounted for 27% of variances however, after
rotation it is accounted for 13% of variances in mathematics learning which suggest that
improving the knowledge of number system is important for the improvement of other
mathematical concepts.
Geometric Skills: the second component of mathematics test items
There are five mathematics test items clustered in the second component. Four of them
belong to the content domain of geometry while the other item belongs to algebra. It shows a
high correlation between geometric items, particularly measurement and algebraic
factorization (HCF and LCM). The common characteristic of these five items can be
explained as geometric skills. It particularly assesses the students’ capacity to calculate
prism, angles and parallel lines and construction of a trapezium. The second component
explains 6.7 % of variances of the total test scores before rotation and 12.9% after rotation.
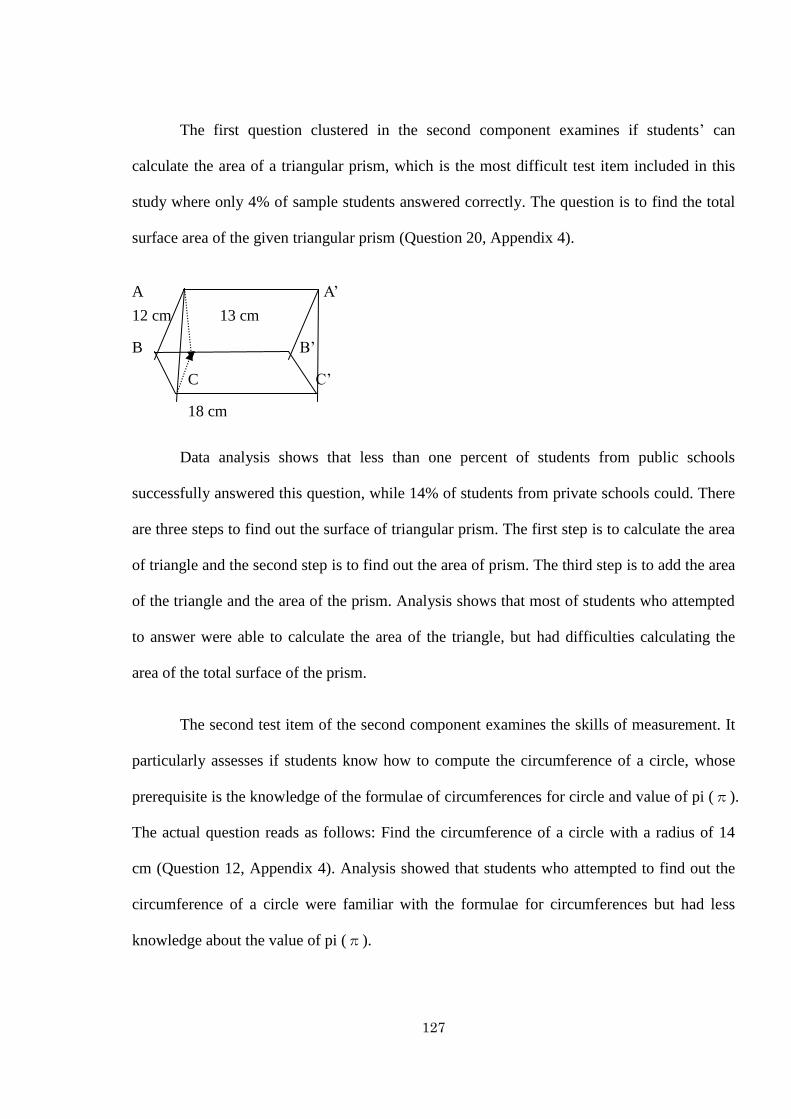
127
The first question clustered in the second component examines if students’ can
calculate the area of a triangular prism, which is the most difficult test item included in this
study where only 4% of sample students answered correctly. The question is to find the total
surface area of the given triangular prism (Question 20, Appendix 4).
A A’
12 cm 13 cm
B B’
C C’
18 cm
Data analysis shows that less than one percent of students from public schools
successfully answered this question, while 14% of students from private schools could. There
are three steps to find out the surface of triangular prism. The first step is to calculate the area
of triangle and the second step is to find out the area of prism. The third step is to add the area
of the triangle and the area of the prism. Analysis shows that most of students who attempted
to answer were able to calculate the area of the triangle, but had difficulties calculating the
area of the total surface of the prism.
The second test item of the second component examines the skills of measurement. It
particularly assesses if students know how to compute the circumference of a circle, whose
prerequisite is the knowledge of the formulae of circumferences for circle and value of pi (π).
The actual question reads as follows: Find the circumference of a circle with a radius of 14
cm (Question 12, Appendix 4). Analysis showed that students who attempted to find out the
circumference of a circle were familiar with the formulae for circumferences but had less
knowledge about the value of pi (π).

128
The third item in the second component also gauged skills of measurement. It
specifically measured the skill of constructing a trapezium, but only 14% of students
successfully constructed it.
The question in the test has read as follows (Question 19, Appendix 4): Construct a
trapezium from the given measurement AB= 7.5 cm; BC=4.9cm; BAD = 60; ABC = 90
and AB CD
D C
7.5 cm 4.9 cm
A 60° 90° B
Construction of a trapezium requires the skills of drawing angles and lines. The
analysis showed that students who attempted to answer but could not do so correctly had a
low level of knowledge of constructing angles rather than lines.
The fourth mathematics test item is related to the knowledge of angles and parallel
lines. The question was as follows (Question 10, Appendix 4): Find the value of X in the
figure.
x+60
2x
The fifth test item belongs to the content domain of algebra, which assesses whether
students can calculate the highest common factor (HCF) and lowest common multiple (LCM).

129
The test question was to find the highest common factor (HCF) and lowest common multiple
(LCM) of 8x3 – 27 and 4x
2-12x+9 (Question 17, Appendix 4). It was found that students had
more difficulties in finding the highest common factor than the lowest common multiple.
The test items in the second component can be represented as geometric skills because
out of five items, four items belong to the content domain of geometric. The knowledge of the
geometric skills is found to be important for students to improve their overall learning
outcomes of mathematics because it accounted for 12.9% of variances (after rotation) of
mathematics test items. The correlation analysis (Table 6.7) also shows that mathematics
skills, particularly those of geometry, are found highly correlated with other mathematics
items. Even though only 17% of sample students successfully answered all the geometric
items correctly, the analysis indicates that those students who could answer questions which
fell into this second cluster, namely measurement and construction, there is a 60% likelihood
that they can answer questions of other content domains correctly.
Data Management: the third component of mathematics test items
There are three mathematics test items clustered in the third component; two of them
belong to the content domain of statistics and the remaining belongs to geometry. Out of three
test items, two statistics items have the highest factor loading. It means that third component
can be characterizes as data management which is accounted for 8.8% of variances of overall
test scores. The first test item in the third component belongs to the content domain of
statistics which require students to calculate the mean. The question was to calculate the mean
of given following data (Question 15, Appendix 4).

130
Marks obtained
10 20 30 40 50 60
No. of students 2 3 5 4 3 3
Similarly, the second test item belongs to statistics, which is to find the median of
data. (Question 6, Appendix 4): find the median of the following data. 5, 6, 7, 8, 11, 10, 17,
11, 19, 6. The third item examines the knowledge of measurement of line. For example
Example: Find the length of AC
A
3 cm
B 4 cm C
The third component which consist of three mathematics items are characterized as
data management and accounted for 8.8% of variances of mathematics learning of eighth
grade students.
Ratio and percentage: the fourth component of mathematics test items
There are three mathematics test items clustered in the fourth component, where two
items belong to the content domain of arithmetic and the remaining item belongs to algebra.
The first arithmetic item is to calculate the profit and loss, which was the most difficult item
within the arithmetic content domain, with only 12% of students (boys 17% and girls 9%)
succeeded. The question has read as follows (Question 14, Appendix 4): A shopkeeper
marked the price of a radio as Rs. 5000. He sold it allowing a discount of 10% and made of
profit Rs. 500. Find the cost of the radio.

131
The second item on the arithmetic clustered in the fourth group was to assess the
knowledge of percentage and 24% of sample students answered correctly. The question has
read as follows (Question 5, Appendix 4): How much money should be added to an item
which costs Rs. 350 if the tax rate of 10%? As the arithmetic items percentage and profit and
loss are clustered in the same component indicates that if students’ knowledge of percentage
is improved, calculating profit and loss is also likely to improve. This is because both of these
mathematics items require the knowledge of percentage. The third item examines the
knowledge of algebraic linear equation where only 6% students (8% of boys and 4% of girls)
are able to answer correctly. The question has read (Question 9, Appendix 4): Find the slope
of line 3y-2x = 3
The characteristic of mathematics test items clustered in the fourth component are
those related to the knowledge of ratio and percentage, and explain 8% of the variances in the
overall score of the sample students.
Algebraic Expression: the fifth component of mathematics test items
There are two test items clustered in the fifth component. The first item assesses the
capacity of students to solve questions to calculate indices. The question included in the test
was: what power of x has the value 1? (Question 3, Appendix 4). Similarly, another question
in this component was about rational expressions. The question was to simplify the following
fractions (Question 16, Appendix 4).
The common characteristic of these two items is represented by the algebraic
expression which explains 6% of the variances in overall score of the sample students.

132
6.12 Conclusion
There are two main objectives of chapter 6. The first objective is to analyze the
content areas of mathematics knowledge (content domain) and cognitive skills required to
answer questions (cognitive domains), and to examine the differences in the level of students’
achievement for respective content and cognitive domains by gender, ethnicity, type of school
and location. The second objective is to examine the mutual relationship among mathematics
knowledge and skills in different domains, and to identify the areas of knowledge and
cognitive skills which are of primary importance for students to achieve further learning. It is
important to assess the content and cognitive domains of mathematics learning and to
examine the relationships between mathematical test items because it will indicate the areas
and concepts that need more focus and effort to improve the quality of education, particularly
mathematics education, in Nepal.
The analysis of students’ test outcomes according to the content domains (Table 6.3)
shows that the performance is generally low. Within the content domains of mathematics,
students perform lowest in geometry, with an average of 0.17, followed by arithmetic, algebra
and statistics, with averages of 0.29, 0.32 and 0.41 respectively. Similarly, students perform
low in the cognitive domain regarding the capacity to Apply basic mathematical knowledge to
the question in front, with an average of 0.17. The cognitive domain regarding the skills for
Problem solving is considered to be the highest level of skills according to the Bloom’s
taxonomy (Figure 2.3). In this cognitive domain, students were found to perform higher than
in the domain of the Applying skills, with an average of 0.29. In the other cognitive domains,
Knowledge and Comprehension, even if not encouraging, students perform relatively better,
with averages of 0.50 and 0.36 respectively.

133
Similarly, data analysis (Table 6.5 and Table 6.6) shows that there are significant
differences in the students’ capacity to solve questions for various content and cognitive
domains between gender, type of school, and location of school. However, no significant
differences are found between students from middle and marginalized ethnic backgrounds,
and students from hill and mountain eco-logical zones in content and cognitive domains of
mathematics.
Regarding the second objective, the result of principle component analysis (PCA)
(Table 6.9) shows the mutual relationship among number system within arithmetic and
algebraic items such as multiplication and division. This fact indicates that if the students’
ability in the content domain on the number system is improved, the knowledge of algebraic
multiplication and division is also likely to be improved. Similarly, geometric skills,
particularly measurement and algebraic factorization (HCF and LCM), percentage, and profit
and loss are found positively correlated with each other. Although this study does not explain
how these knowledge and skills influences each other, however, correlation coefficient (Table
6.7) and PCA (Table 6.9) of mathematics test items show that knowledge of geometric skills,
particularly the skills of measurement and knowledge of percentage, are important to improve
the knowledge of algebraic factorization and arithmetic knowledge of profit and loss
respectively.
Furthermore the result (Table 6.8) shows that mathematics test items are clustered in
five different components which have eigenvalue greater than 1. It indicates that the first
component, whose constituent items are all about the knowledge on the number system,
explain the variance in the test scores of sample population at the highest level (27%)
followed by geometric skill (7%), data management (5%), ratio, percentage and proportion
(5%), and algebraic expression (5%) respectively. The first component about the number

134
system indicates that improving basic mathematics (number system) skills is the precondition
for improving performance in others complicated domains such as geometry, data
management, and algebraic expressions.

135
Chapter 7 Conclusion
7.1 Summary of Findings
There are two main objectives of this dissertation. The first objective is to examine the
factors affecting the quality of education, particularly mathematics learning achievement of
eighth grade students in Nepal. It specifically examines the effect of family characteristics,
student characteristics, parental involvement, and school characteristics on mathematics
learning achievement of eighth grade students in Nepal. The second objective is to analyze
the mathematics test. It particularly analyzes areas of mathematics learning such as arithmetic,
algebra, statistics, and geometry which is known as content domain that students are expected
to learn by the end of the academic year. Similarly, it analyzes the knowledge and
development of mathematical skills, which is considered as cognitive domain of learning
(knowledge, comprehension, application, and problem solving). Furthermore, it examines the
knowledge, concepts and skills in mathematics that are associated with each other, and which
knowledge and skills need to be developed primarily so that students can build further
mathematical learning onto them.
It is of interest to examine the determining factors for learning achievement in
mathematics as it informs policy makers and teachers about various factors that influence
children’s performance. At the same time, analyzing mathematics test provides useful
information to policy makers, curriculum developers, teachers, and other stakeholders to
identify areas, concepts and topics of mathematics that need more focus and efforts to
improve the quality of education in Nepal. Similarly, policy makers and curriculum
developers, including teachers, benefit from knowing what and how mathematical knowledge

136
and concepts are associated with each other and which concept needs focus to improve
mathematics learning.
The discussions of the findings of this dissertation are presented in two sections. In
the first section, I discussed the findings of the study in relation to the research questions. In
the second section, I discuss the implications of the findings of this dissertation for
educational development in Nepal.
There are two research questions posited in chapter 1. The first research question that I
answered in chapter 5 was what are the factors affecting mathematics learning achievement
of eighth grade students in Nepal?
By using the multiple regression analysis, I examined the effect of family
characteristics, student characteristics, parental involvement and school characteristics on
eighth grade students’ mathematics learning achievement in Nepal. I developed four models.
The first model, the set of family characteristics variables, was significantly related to
students’ learning achievement in mathematics (R2 = 30.5, adjusted R
2 = 29.9). The
standardized coefficient from the model I indicated that numbers of family members, father’s
and mother’s education, numbers of books at home and presence of certain household items
were significantly related to students’ mathematics learning achievement in Nepal. However,
traveling time to school was not found significantly related to mathematics learning
achievement.
The effect of the level of mother’s education (.220, p<0.01) was estimated stronger
compared to the father’s level of education (.170, p<0.01) on their children’s learning
achievement in mathematics although fewer mothers (24%) have completed secondary
education compared to that of fathers (44%). There are two possible reasons for the higher

137
effect of mothers’ education level. The first reason is that mothers are less employed than
fathers, regardless of their level of education, which provides mothers more opportunities to
spend time with their children and on their schooling. Educated mothers are found more
supportive to their children’s schooling particularly with regard to homework completion.
Another specific reason for the higher effect of mother’s education is explainable by
ownership on household resources, particularly land. It is believed that the distribution of
resources is more effective when women participate in decision making about the use of
resources.
The findings indicated a negative relationship between family size and students’
mathematics learning achievement. Students with smaller families (three to five family
members) outperformed children in larger families (-.118, p<0.01). It is because children in
smaller families have greater access to resources and intellectual contexts that provide
academic motivation. The effect of family size diminished for private school students
compared to public school students and was greater for students in rural schools compared to
students in urban schools. The possible reason for the reduced effect of family size for private
and urban schools is that parents have higher levels of education and more materials and
books at home than the parents with children in public and rural schools. Similarly, the
availability of additional books at home and the possession of certain items e.g., radio, bicycle,
water tap, cassette player, television, telephone, gas stove, computer and motorbike, which
reflects a family SES is significantly related to students’ academic achievement with
standardized coefficient of (.240, p<0.01) and (.214, p<0.01) respectively.
The effect of student characteristics as measured by gender, ethnicity, absenteeism,
homework completion, perception of their mathematics teacher, time spent on household
chores, and preschool experience were examined in the second model (Table 5.4) and found a

138
significant relationship with mathematics achievement (R2 = 49.0, adjusted R
2 = 47.9).
However, the variable of time spent on studying at home was not significantly related to
students’ mathematics learning achievement. The finding of this study indicated that gender
was significantly related to mathematics achievement (0.83, p<0.05). Overall, boys
outperformed girls with a mean difference of -3.05 (Table 5.2). However, for students
attending private schools, girls (mean score = 24.37) outperformed boys (mean score = 21.27).
There might be several reasons for the better performance of boys than girls. However, the
available data of this study shows that boys have high socio-economic status (SES) than girls
measured by completion of fathers’ and mothers’ level of education, additional books at home,
and possessions at home. Furthermore, in household chores girls are involved more than boys
and get less support from their parents, particularly for doing homework, than boys. However,
in private schools, girls are found with a higher SES than boys, low level of school
absenteeism, and high home work completion.
The findings indicated that ethnic background of student is negatively associated to
student’ learning achievement in mathematics. It is estimated that boys with high ethnic
background outperformed children with middle and low ethnic background, which is
statistically significant (-0.96, p<0.05). However, the different effect is estimated between
types of schools. Private schools have found less effect of ethnic background of students than
public schools. The possible reason for less effect of ethnic background of students in private
school is that students who enroll at private schools tends to have higher socio-economic
status (SES) (land holdings, location of house) even if parents have less education.
Despite significant improvement in school participation at all levels of school
education, grade repetition and school absenteeism are still the major concern for educational
development of Nepal. This study found negative effect of grade repetition (-.50, p<0.10) on

139
students’ mathematics learning achievement. Similarly, school absenteeism was found having
strong negative (-.185, p<0.01) relationship with students’ mathematics learning achievement.
The average school absenteeism of sample students of this study is 2.83 days in a month.
However, the degree of school absenteeism is found different in view of the type of school,
location, and ethnicity of students. Similarly, the involvement in household chores is found
negatively associated to students’ mathematics learning achievement (-.60, p<0.05). Private
school students are found less involved in household chores (mean = 1.77 hours per day)
compared to public school students (mean = 2.45 hours per day). Other variables- home work
completion (.126, p<0.01) and experience of early childhood development (.086, p<0.01) are
also found significantly related to mathematics learning of eighth grade students of Nepal.
The effect of parental involvement is widely examined however, measures of parental
involvement in children’s education vary across studies, and differences are associated with
family SES and ethnic background. The findings of this study (Table 5.4, model III) indicated
significant relationship between parental involvement in homework and children’s school
performance (1.31, p<0.01). Mothers are found helping their children’s study more
particularly in homework than fathers. However, huge differences in parental support are
found between private and public schools. 72% of students from private schools reported that
they got help from their parents on their study while it is 35% in the case of public schools.
Similarly, parental support (0.72, p<0.05) and monitoring (0.83, p<0.05) are also found
important for children’s better school outcomes.
In addition to the effects of family characteristics, student characteristics, and parental
involvement, the variances of children’s learning outcomes are also associated with school
characteristics because teaching and learning activities occur in school. The fourth model,
which includes all these variables are found significantly related to students’ mathematics
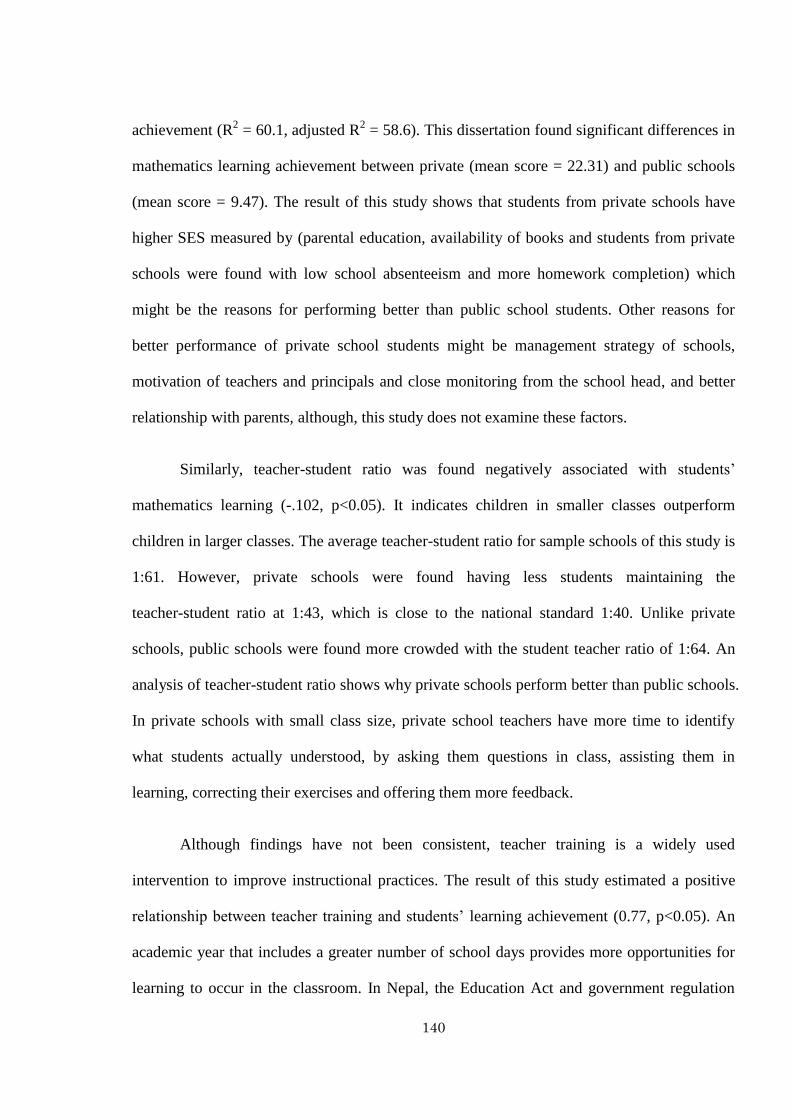
140
achievement (R2 = 60.1, adjusted R
2 = 58.6). This dissertation found significant differences in
mathematics learning achievement between private (mean score = 22.31) and public schools
(mean score = 9.47). The result of this study shows that students from private schools have
higher SES measured by (parental education, availability of books and students from private
schools were found with low school absenteeism and more homework completion) which
might be the reasons for performing better than public school students. Other reasons for
better performance of private school students might be management strategy of schools,
motivation of teachers and principals and close monitoring from the school head, and better
relationship with parents, although, this study does not examine these factors.
Similarly, teacher-student ratio was found negatively associated with students’
mathematics learning (-.102, p<0.05). It indicates children in smaller classes outperform
children in larger classes. The average teacher-student ratio for sample schools of this study is
1:61. However, private schools were found having less students maintaining the
teacher-student ratio at 1:43, which is close to the national standard 1:40. Unlike private
schools, public schools were found more crowded with the student teacher ratio of 1:64. An
analysis of teacher-student ratio shows why private schools perform better than public schools.
In private schools with small class size, private school teachers have more time to identify
what students actually understood, by asking them questions in class, assisting them in
learning, correcting their exercises and offering them more feedback.
Although findings have not been consistent, teacher training is a widely used
intervention to improve instructional practices. The result of this study estimated a positive
relationship between teacher training and students’ learning achievement (0.77, p<0.05). An
academic year that includes a greater number of school days provides more opportunities for
learning to occur in the classroom. In Nepal, the Education Act and government regulation

141
requires a minimum of 220 school days in an academic year. This study found that schools
run less than the required minimum school days (i.e. 220) in an academic year. Schools were
found running for 175 to 193 days. However, it varies according to type and location of
school. The result (model IV) suggests that number of school days in an academic year was
significantly related to students’ learning achievement (0.119, p<0.01).
Furthermore study findings (Table 5.4) indicated that family characteristics accounted
for the highest level of variance (29%) in mathematics achievement, followed by student
characteristics (18%), school characteristics (8%) and parental involvement (2%). It is
important to note that some of individual variables included within student characteristics,
such as absenteeism, grade repetition and homework completion, are closely related to school
characteristics because they reflect the quality of the school and might be a possible reason for
low variance of school characteristics.
After examining the factors affecting quality of education, particularly mathematics
learning achievement of eighth grade students in Nepal, I analyzed the mathematics test in
Chapter 6. I particularly answered the second research question as posited in Chapter I was,
What are the mathematical knowledge/concepts and skills associated with each other, and
which are the knowledge and skills essential to develop further mathematical knowledge onto
them and, then, to improve the mathematics learning of eighth grade students in Nepal?
Before answering the second research question, I analyzed the mathematics test
focusing on its content (arithmetic, algebra, statistics, and geometry), and cognitive domain
(knowledge, comprehension, application, and problem solving) of learning. The findings
suggested that students perform lowest in geometry, with an average of 0.17, followed by
arithmetic, algebra and statistics, with averages of 0.29, 0.32 and 0.41 respectively.

142
Similarly, students perform low in cognitive domain regarding the capacity to
applying basic mathematical knowledge, with the aggregate points of 0.17. The cognitive
domain regarding the skills for Problem solving is considered to be the highest level of skills
according to the Bloom’s taxonomy (Figure 2.3). In this cognitive domain, students were
found to perform higher than in the domain of the Applying skills, with an average of 0.29. In
the other cognitive domains, Knowledge and Comprehension, even if not encouraging,
students performed relatively better, with averages of 0.50 and 0.36 respectively.
Furthermore, I examined the differences in content and cognitive domain of
mathematics learning between students. Data analysis (Table 6.5 and Table 6.6) shows that
there are significant differences in the students’ capacity to solve questions for various
content and cognitive domains between gender, type of school, and location of school.
However, no significant differences are found between students from middle and
marginalized ethnic backgrounds, and students from hill and mountain eco-logical zones in
content and cognitive domains of mathematics learning.
I used principal component analysis (PCA) to answer the second research question.
The result of PCA (Table 6.9) shows the mutual relationship among number system within
arithmetic and algebraic items such as multiplication and division. This fact indicates that if
the students’ ability in the content domain on the number system is improved, the knowledge
of algebraic multiplication and division is also likely to be improved. Similarly, geometric
skills, particularly measurement and algebraic factorization (HCF and LCM), percentage, and
profit and loss are found positively correlated with each other. Although this study does not
explain how theses knowledge and skills influences each other, data analysis (correlation
coefficient) (Table 6.7) and PCA (Table 6.9) show that knowledge of geometric skills,
particularly the skills of measurement and knowledge of percentage, are important to improve

143
the knowledge of algebraic factorization and arithmetic knowledge of profit and loss
respectively.
Furthermore the result (Table 6.8) shows that mathematics test items are clustered in
five different components which have eigenvalue greater than 1. It indicates that the first
component, whose constituent items are all about the knowledge on the number system,
explains the variance in the test scores of sample population at the highest level (27%)
followed by geometric skill (7%), data management (5%), ratio, percentage and proportion
(5%), and algebraic expression (5%) respectively. The first component about the number
system indicates that improving basic mathematics (number system) skills is the precondition
for improving performance in other complicated domains such as geometry, data management,
and algebraic expressions.
7.2 Policy Implications
The finding of this dissertation that family characteristics are responsible for a large
proportion (29%) of the variance in students’ learning achievement has profound implications
for educational development in Nepal, where more than 40% of parents are still illiterate. The
study found that children with educated parents and homes with greater material resources
exhibited better academic performance. It suggests that educational policies should focus not
only on children but also their families and schools. In the short-term, few strategies can be
adopted to minimize the effects of family characteristics, but in the long-term much can be
done. To provide more opportunities for students from disadvantaged communities, incentives
programs such as conditional cash transfer could be introduced. Study findings revealed a
significant relationship between parental involvement and school outcomes, which indicates
that educational policies should promote the partnership of schools, local communities

144
non-governmental organizations and other social agencies to increase parents’ awareness of
their role in fostering their children’s academic achievement, particularly in disadvantaged
communities.
The finding that gender and ethnic background were differentially associated with
mathematics performance in Nepal raises another issue. In the current political climate, the
issue of equal opportunity in education must be addressed to maintain social equity and
harmony. This issue should be investigated further to determine the extent to which teacher
training promotes gender sensitivity and schools provide inclusive and gender-friendly as well
as gender-balanced curriculum and textbooks. Also, the study found significant differences in
mathematics learning achievement between public and private schools, which is a serious
concern for policy makers, teachers and parents. It means that the Nepalese government
should adopt policies to reduce learning gaps in both type of schools (private and public) they
are offering.
The results of this study indicate a strong negative relationship between student
absenteeism and mathematics performance. In the context of high absenteeism in both private
and public schools and its diverse reasons, further study is needed to thoroughly understand
this phenomenon. However, districts and schools with high levels of absenteeism should be
identified, and programs that foster school attendance such as day meals, scholarships and
conditional cash transfer could be introduced. Grade repetition, which was negatively related
to academic outcomes, was related to other issues, and schools that improve educational
quality will automatically reduce grade repetition. Student perception of teachers was
significantly related to learning outcomes, which suggests that teacher training should focus
not only on instructional knowledge and skills but also on attitudes that maintain a positive
atmosphere both inside and outside the classroom.
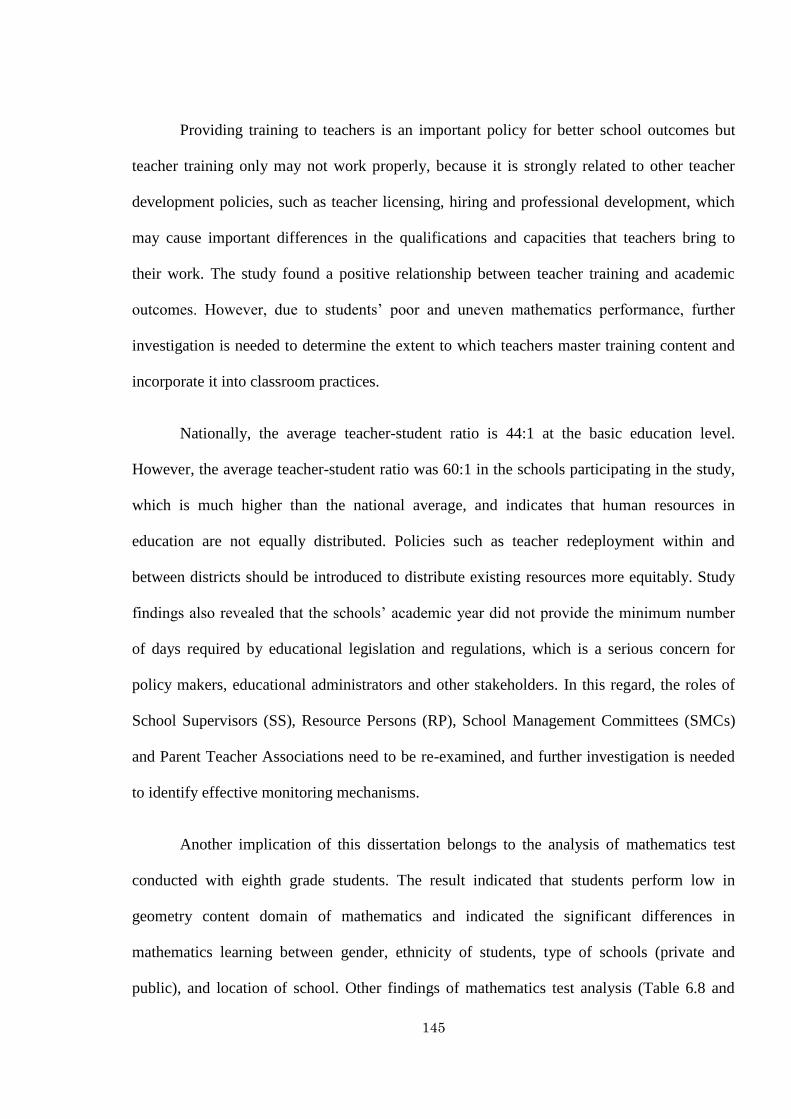
145
Providing training to teachers is an important policy for better school outcomes but
teacher training only may not work properly, because it is strongly related to other teacher
development policies, such as teacher licensing, hiring and professional development, which
may cause important differences in the qualifications and capacities that teachers bring to
their work. The study found a positive relationship between teacher training and academic
outcomes. However, due to students’ poor and uneven mathematics performance, further
investigation is needed to determine the extent to which teachers master training content and
incorporate it into classroom practices.
Nationally, the average teacher-student ratio is 44:1 at the basic education level.
However, the average teacher-student ratio was 60:1 in the schools participating in the study,
which is much higher than the national average, and indicates that human resources in
education are not equally distributed. Policies such as teacher redeployment within and
between districts should be introduced to distribute existing resources more equitably. Study
findings also revealed that the schools’ academic year did not provide the minimum number
of days required by educational legislation and regulations, which is a serious concern for
policy makers, educational administrators and other stakeholders. In this regard, the roles of
School Supervisors (SS), Resource Persons (RP), School Management Committees (SMCs)
and Parent Teacher Associations need to be re-examined, and further investigation is needed
to identify effective monitoring mechanisms.
Another implication of this dissertation belongs to the analysis of mathematics test
conducted with eighth grade students. The result indicated that students perform low in
geometry content domain of mathematics and indicated the significant differences in
mathematics learning between gender, ethnicity of students, type of schools (private and
public), and location of school. Other findings of mathematics test analysis (Table 6.8 and

146
Table 6.9) indicated that mathematics test items are clustered in five components. They are
number system, geometric skills, data management, ratio, proportion and percentage, and
algebraic expression. The first component number system is accounted for the highest
variances (27%) in mathematics learning which suggested that policy makers and teachers
should focus on improving basic mathematics skills (number system) for improving
performance in other complicated areas of mathematics such as geometric skills, data
management, ratio and percentage, and algebraic expressions. The analysis of mathematics
test (Table 6.3 and Table 6.4) also indicated that students performed low in higher domain of
mathematics learning such as skill and problem solving because many students fail to acquire
basic mathematics skills (number system).

147
References
Akabayashi, H., & Psacharopoulos, G. (1999). The trade-off between child labour and human
capital formation: a Tanzanian case study. The Journal of Development Studies, 35(5),
121-140.
Al-Nhar, T. (1999). Determinants of grade eight achievement in Jordan: a multilevel analysis
approach. Educational Psychology, 19(1), 37-45.
Anderson, J. R. (1985). Cognitive psychology and its implication. (2nd ed.). Freeman, New
York.
Angrist, J. D., & Lavy, V. (1999). Using Maimonides rule to estimate the effect of class size
on scholastic achievement. The Quarterly Journal of Economics, 114, 533–575.
Astone, N. M., & McLanahan, S. S. (1991). Family Structure, Parental Practices and High
school Completion. American Sociological Review, 56, 309-320.
Bacolod, M., & Tobias, J. L. (2006). Schools, school quality and academic achievement:
Evidence from the Philippines. Economics of Education Review, 25, 619-632.
Baker, D. P., Goesling, B., & Letendre, G. K. (2002). Socioeconomic status, school quality
and national economic development: a cross-national analysis of the
"Heyneman-Loxely effect" on mathematics and science achievement. Comparative
Education Review, 46(3), 291-312.
Balu, P. M., & Duncan, O. D. (1967). The Americian Occupational Structure. Wiely, New
York.
Bandura, A. (1988). Self-regulation of motivation and action through goal systems. Cognitive
perspectives on emotion and motivation, 37-61.
Bangay, C., & Blum, N. (2010). Education Responses to Climate Change and Quality: Two
Parts of the Same Agenda? International Journal of Educational Development, 30(4),

148
335-350.
Barnard, M. W. (2004 ). Parent involvement in elementary school and educational attainment.
Children and Youth Services Review, 26, 39-62.
Barrett, M. A., Chawla-Duggan, R., Lowe, J., Nikel, J., & Ukpo, E. (2006). The Concept of
Quality in Education: A Review of the International Literature on the Concept of
Quality in Education, Working paper no. 3, University of Bristol and University of
Bath, UK.
Barro, R. J. (1996). Determinants of Economic Growth: A Cross-country Empirical Study
(Working paper 5698). National Bureau of Economic Research, Cambridge, MA.
Becker, G. (1964). Human Capital. A Theoretical and Empirical Analysis, with special
reference to Education. (3rd ed.). The University of Chicago Press, USA.
Behrman, R. J., & Knowles, C. J. (1999). Household Income and Child Schooling in Vietnam.
Economic Review, 13(2), 211-256.
Behrman, R. J., & Taubman, P. (1886). Birth Order, Schooling, and Earnings. Journal of
Labor Economics, 4(3), 121-145.
Benjamin, S. B., & Krathwohl, R. D. (1956). Taxonomy of educational objectives: The
classification of educational goals, by a committee of college and university examiners.
Handbook I : Cognitive domain. Longmans, New York.
Berberog, l. G. (2004). Student Learning Achievement. Paper Commissioned for the Turkey
Education Sector Study. World Bank, Washington, DC.
Biniakunu, D. D. (1982). In-service teacher training improves eight grades' reading ability in
Zaire. Journal of Reading, 25, 662-665.
Bishop, J. (1989). Achievement, test scores, and relative wages (CAHRAS Working Paper
89-22), Cornell University, School of Industrial and Labor Relations, Center for
Advanced Human Resource Studies. Ithaca, New York.

149
Blake, J. (1989). Family Size and Achievement. University of California Press. Berkeley.
Boethel, M. (2003). Diversity: school, family and community connections. Annual synthesis.
Austin, TX, Southwest Educational Development Laboratory, Washington, DC.
Bourdieu, P. (1986). The forms of capital. Handbook of theory and research for the sociology
of education. Greenwood Press, New York.
Brooks-Gunn, J., & Duncan, J. G. (2000). Family Poverty, Welfare Reform, and Child
Development. Child Development, 71(1), 188-196.
Buchmann, C. (2000). Family structure, parental perceptions, and child labor in Kenya: What
factors determine who is enrolled in school. Social Forces, 78(4), 1349-1378.
Buchmann, C. (2002). Measuring Family Background in International Studies of Education:
Conceptual issues and Methodological Challanges. Methodological Advances in
Cross-National Surveys of Educational Achievement, 150-197.
Buchmann, C., & Hannum, E. (2001). Education and Stratification in Developing Countries:
A Review of Theory and Research. Annual Review of Sociology, 27, 77-102.
Cai, J. (1995). A Cognitive Analysis of U. S. and Chinese Students' Mathematical
Performance on Tasks Involving Computation, Simple Problem Solving, and Complex
Problem Solving. Journal for Research in Mathematics Education, 7, 1-155.
Card, D., & Krueger, A. (1996). School resources and student outcomes: an overview of the
literature and new evidence from North and South Carolina. Journal of Economic
Perspectives, 10, 31-40.
Carron, G., & Chau, T. N. (1996). The Quality of Primary Schools in Different Developing
Contexts. UNESCO Publishing, Paris.
Cental Bereau of Statistics (2011). Nepal Living Standard Survey, Kathmanu, Nepal
Central Bereau of Statistics. (2011). National Population and Housing Census, Volume II,
National Planning Commission Secretaraite, Kathmandu, Nepal.

150
Center for Educational research and Social Development (2005). Parental Support and
Students' Learning. A Report Submitted to Department of Education, Sanothimi,
Bhaktapur, Nepal.
Chapman, D. W., & Adams, D. (2002). The Quality of Education: Dimensions and Strategies.
The Asian Development Bank and Comparative Education Research Centre, The
University of Hong Kong.
Chapman, D. W., Weidman, J., Cohen, M., & Mercer, M. (2005). The search for quality: A
five study of national strategies to improve educational quality in Central Asia.
International Journal for Educational Development, 25, 514-530.
Chernichovsky, D., & Meesook, A. O. (1985). School Enrollment in Indonesia, Working
Paper, No. 746, World Bank, Washington, DC.
Chevalier, A., & Lanot, G. (2002). The relative effect of family characteristics and financial
situation on educational achievement. Education Economics, 10(2), 166-181.
Choen, K. D., & Hill, C. H. (2000). Instructional Policy and Classroom Performance: The
Mathematics Reform in California. Instructional Policy and Classroom Practices, 102
(2), 294-343.
Chrispeels, J. (1996). Effective schools and home-school-community partnership roles: a
framework for parent involvement. School Effectiveness and School Improvement,
7(297-324).
Cockcroft, W. H. (1982). Mathematics counts: Report of the Committee of Inquiry Into the
Teaching of Mathematics Under the Chairmanship of Dr. W. H. Cockcroft. London.
Cohen, J., & Cohen, P. (1983). Applied Multtple Regression/Correlation Analysis in
Behavioral Sciences (2nd ed.). Lawrence Erlbaum Hillsdale, NJ.
Coleman, J. S. (1991). Parental Involvement in Education: Policy Prespective, Office of
Educational Research and Improvement, Department of Education. United States

151
Coleman, J. S., Campbell, E. Q., Hobson, C. J., McPartland, J., Mood, A. M., Weinfield, F. D.,
& York, R. L. (1966). Equality of Educational Opportunity. National Centre for
Educational Statistics, Washington, D.C.
Consortium for Research on Educational Access, Transitions and Equity. (2006). Nepal
Country Review of Access and Equity in Primary Education. Kathmandu, Nepal
Cooper, H. (1989). Synthesis of Research on Homework. Educational Leadership.
Craig, H. J., Kraft, R. J., & Plessis, J. D. (1998). Teacher Development Making an Impact,
USAID, World Bank.
Dalin, P. (1994). How School Improve: An International Report, School Development Series.
Continuum International Publishing Group.
Department of Education. (2010). Flash Report, Sanothimi, Bhaktapur, Nepal
Department of Education. (2012). Flash Report, Sanothimi, Bhakatapur, Nepal.
Dincer, A. M., & Uysal, G. (2010). The determinants of student achievement in Turkey
International Journal for Educational Development, 30 592-598.
Downey, D. B. (2001). Number of siblings and intellectual development: the resource dilution
explanation. American Psychologist, 56(6), 497-504.
Driessen, G., Smit, F., & Sleegers, P. (2005). Parental Involvement and Educational
Achievement. British Educational Research Journal, 31(4), 509-532.
Dube, S. R., & Orpinas, P. (2009). Understanding excessive school absenteeism as school
refusal behavior. Children & Schools, 31(2), 87-95.
Education Development Service Center. (2008). National Assessment of Grdae 8 Student,
submitted to Department of Education, Sanothimi, Bhaktapur, Nepal.
Engin-Demir, C. (2009). Factors influencing the academic achievement of the Turkish urban
poor. International Journal of Educational Development, 29, 17-29.
Epstein, J. L. (1986). Parents' Reactions to Teacher Practices of Parent Involvement. The

152
Elementary School Journal, 86(3), 277-294.
Epstein, J. L. (1987). Parent involvement: what research says to administrators. Education
and Urban Sociology, 19, 277-294.
Farkas, G., Sheehan, D., & Grobe, R. P. (1990). Coursework mastery and school success:
gender, ethnicity, and poverty groups within an urban school district. American
Educational Research Journal, 27(4), 807-827.
Fehrmann, G. P., Keith, Z. T., & Reimers, M. T. (1987). Home Influence on School Learning:
Direct and Indirect Effect of Parental Involvement on High School Grades. Journal of
Educational Research, 806, 330-337.
Field, A. (2009). Discovering Statistics Using SPSS. (3rd ed.). SAGE Publication, New Delhi.
Fuchs, T., & Woessmann, L. (2004). What accounts for international differences for student
performance? A re-examination using PISA data, CESifo Working paper No. 135,
University of Munich, Germany.
Fuller, B. (1986). Is Primary School Quality Eoriding in the Third World? Comparative
Education Review, 30(4), 491-507.
Fuller, B. (1987). What school factors raise achievement in the third world? Review of
Educational Rresearch, 57(3), 255-292.
Fuller, B., & Clark, P. (1994). Raising school effects while ignoring culture? Local conditions,
and the influence of classroom tools, rules and pedagogy. Review of Educational
Research, 64(1), 119-157.
Fuller, B., & Liang, X. (1999). Which girls stay in school? The influence of family economy,
social demands, and ethnicity in South Africa. In Critical Perspectives on Schooling
and Fertility in the Developing World. National Academy Press, Washington, D.C.
Gamoran, A., & Long, D. A. (2006). Equality of Educational Opportunity: A 40-year
restropective, WCER Working paper 2006-09, Wisconsin Center for Education

153
Research, University of Wisconsin, United States.
Ganzach, Y. (2000). Parents' education, cognitive ability, educational expectations and
educational attainment: Interactive effects. British Journal of Educational Psychology,
70, 419-441.
Glaser, R., Lesgold, A. M., & Lajoie, S. (1985). Toward a cognitive theory for the
measurement of achievement. The Influence of Cognitive Psychology on Testing and
Measurement, 41-85.
Gomes, M. (1984). Family Size and Educational Attainment in Kenya. Population and
Development Review, 10(4), 647-660.
Govinda, R., & Varghese, V. N. (1993). Quality of Primary Schooling in India: A Case Study
of Madhya Pradesh, International Institute for Educational Planning, Paris and
National Institute of Educational Planning and Administration (NIEPA), New Delhi.
Grau, M. E., Weinstein, T., & Walberg, H. J. (1983). School-based home instruction and
learning: A quantitative syenthesis. Journal of Educational Research, 76, 351-360.
Gray, J., & Beresford, Q. (2008). Australia's quest for equity in indigenous education.
Australian Journal of Education, 52(2), 197-223.
Gray, J., & Partington, G. (2003). Attendance and non-attendance at school. Reform and
resistance in aboriginal education, 133-163, University of Western Australia Press.
Griffith, J. (1999). School Climate as "Social Order” and “Social Action”: A Multi-Level
Analysis of Public Elementary School Student Perceptions. Social Psychology of
Education, 2, 339-369.
Guncer, B., & Kose, R. (1993). Effects of family and school on Turkish students' academic
performance. Education and Society, 11(1), 51-63.
Hakkinen, I., Kirjavainen, T., & Uusitalo, R. (2003). School resources and student
achievement revisited: new evidence from panel data. Economics of Education Review,

154
22, 329-335.
Hanushek, E. A. (1992). The Trade-off between Child Quantity and Quality. The Journal of
Political Economy, 100(1), 84-117.
Hanushek, E. A. (1996). A more complete picture of school resource policies. Review of
Educational Research, 66(3), 397-409.
Hanushek, E. A. (1997). Assessing the effects of school resources on student performance: An
update. Educational Evaluation and Policy Analysis, 2, 141-164.
Hanushek, E. A., & Kimiko, D. D. (2000). Schooling Labor-Force Quality, and Growth of the
Nations. Americian Economic Review, 90(5), 1184-1208.
Hanushek, E. A. (2003). The Failure of Input-Based Schooling Policies. The Economic
Journal, 113, 64-98
Hanushek, E. A., & Luque, J. A. (2003). Efficiency and equity in schools around the world.
Economics Education Review, 22, 481-502.
Hanushek, E. A., & Woessman, L. (2007). The Role of Education Quality in Economic
Growth. Working Paper 4122, World Bank, Washington, DC.
Heady, C. (2003). The effect of child labour on learning achievement. World Development,
31(2), 385-398.
Heer, M. D. (1985). Effect of Sibling Number on Child Outcome. Annual Review of Sociology,
11, 27-47.
Heyneman, S. P. (1976). Influence on acedemic achievement : A comparision of result from
Uganda and more industralized socities. Sociology of Education, 49, 200-211.
Heyneman, S. P. (1980). Differences Between Developed and Developing Countries:
Comment on Simmon and Alexander's "Determinants of School Achievement"
Economic Development and Cultural Change, 28(2), 403-406.
Heyneman, S. P. (2002). Defining the Influence of Education on Social Cohesion.

155
International Journal of Educational Policy Research and Practice, 3, 73-97.
Heyneman, S. P., & Loxley, W. A. (1983). The effect of primary-school quality on
academic-achievement across 29 high-income and low-income countries. American
Journal of Sociology, 88(6), 1162-1194.
Hoover-Dempsey, V. K., Otto, C., Bassler, C. O., & Burow, R. (1995). Parents' Reported
Involvement in Students' Homework: Strategies and Practices. The Elementary School
Journal, 95(5), 435-450.
Hoxby, C. M. (2000). The effects of class size on student achievement: new evidence from
population variation. Quarterly Journal of Economics, 115(4), 1239-1285.
Huang, L. F. (2010). The role of socio-economic status and school quality in the Philippines:
Revisiting the Heyneman-Loxely effect. International Journal for Educational
Development, 30, 288-296.
Hungi, N. (2008). Examining differences in mathematics and reading achievement among
grade 5 pupils in Vietnam. Studies in Educational Evaluation, 34, 155-164.
Hungi, N., & Thuku, W. F. (2010). Differences in pupil achievement in Kenya: Implications
for policies and practice. International Journal for Educational Development, 30,
33-43.
Husen, T. (1967). International study of achievement in mathematics,Vol. 2. Wiley, New York.
International Labour Organization. (1977). Meeting Basic needs: Strategies for Eradicating
Mass Poverty and Unemployment. Geneva.
Iverson, B. K., & Walberg, H. J. (1982). Home environment and learning: A quantitative
synthesis. Journal of Experimental Education, 50, 144-151.
Jamison, D. T., & Lockheed, M. E. (1987). Participation in schooling: determinants and
learning outcomes in Nepal. Economic Development and Cultural Change, 35(2),
279-306.

156
Jensen, P., & Nielsen, S. H. (1997). Child Labour on School Attendance: Evidence from
Zambia. Journal of Population Economics, 10, 407-424.
Johnston, S. J., & Thompson, H. G. (2006). Variation in the Relationship Between Non-school
Factors and Student Achievement on International Assessments. Institute of Education
Sciences, Department of Education, United States.
Keith, T. Z., Reimers, T. M., Fehrmann, P. G., Pottebaum, S. M., & Aubey, L. W. (1986).
Parental involvement, homework, and TV time: direct and indirect effects on high
school achievement. Journal of Educational Psychology, 5, 373-380.
Kellaghan, T. (2004). Public Examinations, National and International Assessments, and
Educational Policy, Educational Research Centre, St Patrick's College, Dublin.
Kennedy, M. (1998). Form and Substance in Inservice Teacher Education, National Institute
for Science Education, University of Wisconsin, Madison.
Kingdon, G. G. (1996). The Quality and Efficiency of private and Public Education: A
Case-Study of Urban India. Oxford Bulletin of Economics and Statistics, 58(1), 57-82.
Kingdon, G. G. (1999). How much do school matters to pupil achievement in India? Institute
of Economic and Statistics, Univeristy of Oxford, UK.
Kingston, W. P. (2001). The Unfulfilled Promise of Cultural Capital Theory. Sociology of
Education, 74, 88-99.
Knodel, J., & Wongsith, M. (1991). Family Size and Children's Education in Thailand:
Evidence from a National Sample. Demography, 28(1), 119-131.
Konu, A., & Rimpela, M. (2002). Well-being in schools: a conceptual model. Health
Promotion International, 17(1).
Krueger, B. A. (2003). Economic Consideration and Class Size. The Economic Journal,
113-485.
Krueger, B. A., & Lindhahl, M. (2001). Education for growth: why and for whom? Journal of
157
Economic Literature, 39, 1101-1136.
Kulpoo, D. (1998). The quality of education: some policy suggestions based on a survey of
schools. SACMEQ Policy Research No.1. IIEP, Paris.
Lanzi, D. (2007). Capabilities, human capital and education. Journal of Socio-Economics,
36(3), 424-435.
Lee, V. E., & Lockheed, M. E. (1990). The Effects of Single-Sex Schooling on Achievement
and Attitudes in Nigeria. Comparative Education Review, 34(2), 209-231.
Lieras-Muney, A. (2005). The Relationship between Education and Adult Mortality in the
United States. The Review of Economic Studies, 72(1), 189-221.
Lindhal, M. (2005). Home versus School Learning: A New Approach to Estimating the Effect
of Class Size on Achievement. The Scandinavian Journal of Economics, 107(2),
375-394.
Lloyd, B. C., & Blanc, K. A. (1996). Children's Schooling in Sub-Saharan Africa: The Role of
Father, Mothers, and Others. Population and Development Review, 22(2), 265-298.
Lockheed, M. E., Vail, S., & Fuller, B. (1986). How textbooks affect achievement in
developing countries: evidence from Thailand. Educational Evaluation and Policy
Analysis, 8(4), 379-392.
Lockheed, M. E., & Verspoor, A. (1991). Improving Primary Education in Developing
Countries. World Bank.
Ma, X. (1997). A multiple regression analysis of mathematics achievement in the Dominican
Republic. International Journal of Educational Development, 17(3), 313-321.
Macbeth, A. (1994). Involving Parents. In Andrew Pollard and Jill Bourne edited Teaching
and Learning in the Primary school in association with open University, Routledge,
London and New York.
Mancebon, M. J., & Mar Molinero, C. (2000). Performance in primary schools. Journal of the

158
Operational Research Society, 51, 843-854.
Manski, C., & Wise, D. A. (1983). College Choice in America. Harvard University Press,
Cambridge, MA.
Marshall, H. J. (2003). Grade repetition in Hunduran primary schools. International Journal
for Educational Development, 23, 591-605.
McEwan, J. P., & Marshall, J. H. (2004). Why does academic achievement vary across
countries? Evidence from Cuba and Mexico. Education Economics, 12(3), 205-217.
McEwan, J. P., & Trowbridge, M. (2007). The achievement of indigenous students in
Guatemalan primary schools. International Journal for Educational Development, 27,
61-76.
McLanahan, S., & Sandafur, G. D. (1994). Growing up with a single parent: what hurts, what
helps, Harvard University Press, Cambridge, MA.
Ministry of Education. (1999). Programmme Implementation Plan, BPEP II, Kathmandu,
Nepal
Ministry of Education. (2003) Human Resource Development Plan, Vol. 1, Kathmandu, Nepal
Ministry of Finance. (2009). Economic Survey and Reb Book, Minsitry of Finance,
Kathmandu, Nepal.
Montgomery, M. R., & Lloyd, C. B. (1997). Excess fertility, unintended births and children's
schooling. The National Acedemics Press, Washington, DC.
Motala, S. (2001). Quality and indicators of quality in South African education: a critical
appraisal. International Journal of Educational Development, 21, 61-78.
Muijs, D. (2004). Doing quantitative research in Education with SPSS, SAGE publication,
New Delhi.
Murphy, P., Greaney, V., Lockheed, M. E., & Rojas, C. (1996). National Assessments Testing
the Systems, The World Bank, Washington DC.

159
Mwamwenda, T. S., & Mwamwenda, B. B. (1989). Teacher Characteristics and Pupils'
Academic Achievement in Botswana. International Journal of Educational
Development, 9(1), 31-42.
Ndimbirwe, J. B. (1995). Factors causing under-achievement in mathematics among
secondary schools girls in Zambia. Academy Science Publishers, Nairobi, Kenya.
Nguyen, C. K., Margaret, W., & Gillis, S. (2005). Factors Influencing Pupil Achievement in
SACMEQ II - Botswana: An Application of Structural Equation Modelling, Paper
presented to the International Invitational Educational Policy Research Conference,
Paris, France, 28 September- 2 October, 2005.
Niles, S. F. (1981). Social Class and Academic Achievement: A Third World Reinterpretation.
Comparative Education Review, 25(3), 419-430.
Organization for Economic Cooperation and Development. (2000). Literacy Skills for the
World of Tomorrow - Further results from PISA 2000.
Organization for Economic Cooperation and Development. (2003). Learning for Tomarrow's
World. First Result From PISA.
Parcel, T. L., & Dufur, J. M. (2001). Capital at home and at school: effects on student
achievement. Social Forces, 79(3), 881-911.
Parcel, T. L., & Menaghan, E. G. (1994). Early Parental Work, Family Social Capital, and
Early Childhood Outcomes. American Journal of Sociology, 99(4), 972-1009.
Patrinos, A. H., & Psacharopoulos, G. (1995). Educational performance and child labour in
Paraguay. International Journal of Educational Development, 15(1), 47-60.
Peaker, G. (1971). The Plowden children four years later. National Foundation for
Educational Research in England and Wales, London.
Peters, H. E., & Mullis, N. C. (1997). The role of family income and sources of income in
adolescent achievement. Russell Sage Foundation, New York, (340-381).

160
Phtiaka, H. (1994). Each to his own? Home-school relations in Cyprus, paper presented at the
annual British Education Research Association conference, Oxford.
Postlethwaite, T. N. (1988). International Encyclopedia of Comparative Education and
National Systems of Education (Ed.). Pergamon Press, Oxford.
Postlethwaite, T. N. (2004). Monitoring Educational Achievement. Fundamental of
Educational Planning. No. 81, IIEP, UNESCO, Paris
Postlethwaite, T. N., & Wiley, D. E. (1992). The IEA Study of Science II: Science
Achievement in Twenty-three Countries. Pergamon Press, Oxford.
Psacharopoulos, G. (1987). Public vs. Private Schools in Developing Countries: Evidence
from Colombia and Tanzania. International Journal of Educational Development, 7(1),
59-67.
Psacharopoulos, G. (1997). Child Labour versus Educational Attainment: Some Evidence
from Latin America. Journal of Population Economics, 10, 337-386.
Ravallion, M., & Wodon, Q. (2000). Does Child Labour displace Schooling? Evidence on
behavioural responses to an enrolment subsidy. The Economic Journal, 110(462),
158-175.
Ray, R., & Lancaster, G. (2003). Does Child Labour Affect School Attendance and School
Performance? Multi Country Evidence on SIMPOC Data. Unpublished Report.
ILO/IPEC.
Rivkin, S. G. (1995). Black/white differences in schooling and employment. Journal of
Human Resources, 30(4), 826-852.
Ross, N. K., Paviot, L., & Jurgnes-genevois, I. (2006). Cross-national studies of the quality of
education: planning their design and managing their impacts, UNESCO, Paris.
Rothstein, R. (2000). Finance Fungibility: Investing Relative Impacts of Investments in
Schools and Non-school Educational Institutions to Improve Student Achievement.

161
Centre on Educational Policy Publications, Washington, DC
Sather, Z., & Lloid, C. (1993). Who Gets Primary Schooling in Pakistan: Inequalities Among
and Within Families. The Population Council, Working Paper No. 52, New York.
Scheerens, J. (2004). The quality of education at beginning of the 21th century, A paper
commissioned for the Global Monitoring Report 2005, UNESCO, Paris.
Scheerens, J., & Bosker, R. (1997). The foundations of educational effectiveness. Elsevier
Science, Oxford.
Schiller, K. S., Khmelkov, V. T., & Wang, X. Q. (2002). Economic development and the
effects of family characteristics on mathematics achievement. Journal of Marriage
and Family, 64, 730-742.
Schunk, D. H. (1990). Goal Setting and Self-Efficacy During Self-Regulated Learning.
Educational Psychologist, 25, 71-86.
Seltzer, J. A. (1994). Consequences of marital dissolution for children. Annual review of
Sociology, 20, 235-266.
Sewell, W. H., & Hauser, R. M. (1997). Education, occupation and earnings: achievement in
the early career, Acedemic, New York.
Shi Anh, T., Kondel, J., Lam, D., & Friedman, J. (1998). Family size and children's education
in Vietnam. Demography, 35(1), 57-70.
Simmons, J., & Alexander, L. (1978). The determinants of school achievement in developing
countries: a review of the research. Economic Development and Cultural Change,
26(2), 341-357.
Simon, H. A. (1989). Models of thought (Vol. II). Yale University Press, New Haven, NZ.
Singh, K. A. (1995). The Cultural Construction of Home and School Knowledge in Tribal
India. Prospects, 25(4)735-747.
Slavin, E. R. (1997). Design Competitions: A Proposal for a New Federal Role in Educational

162
Research and Development. Educational Researchers, 26(1), 22-28.
Stash, S., & Hannum, E. (2001). Who Goes to School? Educational Stratification by Gender,
Caste, and Ethnicity in Nepal. Comparative Education Review, 45(3), 354-378.
Steelman, C. L., & Powell, B. (1991). Sponsoring the Next Generation: Parental Willingness
to Pay for Higher Education. American Journal of Sociology, 96(6), 1505-1529.
Stenberg, L., Lamborn, S. D., Dornbush, S. M., & Darling, N. (1992). Impact of parenting
practices on adolescent achievement: authoritative parenting, school involvement, and
encouragement to succeed. Child Development, 63, 1266-1281.
Stevens, J. P. (1992). Applied Multivariate Statistics for the Social Sciences (2nd ed.).
Erlbaum, Hillsdale, NJ.
Stevenson, D. L., & Baker, P. D. (1987). The Family-School Relation and the Child's School
Performance. Child Development, 58, 1348-1357.
Sui-Chu, E. H., & Willms, J. D. (1996). Effects of parental involvement on eight grade
achievement. Sociology of Education, 69(2), 126-141.
Tawil, S., Akkari, A., & Macedo, B. (2011). Beyond the conceptual maze: the notion of
quality in education, Discussion paper 2, UNESCO, Paris.
Tilak, J. B. G. (2002). Education and Poverty. Journal of Human Development, 3(2), 191-207.
Trends in International Mathematics and Science Studies (2011). Assessment Framework,
International Study Center, Lynch School of Education, Boston College.
United Nations Development Program. (2013). Human Development Report, Kathmandu,
Nepal.
United Nations Educational, Scientific and Cultural Organization. (1990). World Declaration
on Education for All, Framework of Action to Meet Basic Learning Needs, Jomtien,
Thailand.
_ . (2000). The Dakar Framework of Action, Education for All: Meeting our Collective

163
Commitments, Dakar, Senegal, 2000.
_ . (2003). Education for All, Global Monitoring Report, Why are girls held back? UNESCO,
Paris.
_ . (2005). Education for All, Global Monitoring Report, The quality imperative. UNESCO,
Paris.
_ . (2010). Education for All, Global Monitoring Report, Reaching the Marginalized,
UNESCO, Paris.
Veenstra, R., & Kuyper, H. (2004). Effective students and families: the importance of
individual characteristics for achievement in high school. Educational Research and
Evaluation, 10(1), 41-70.
Vegas, E., & Petrow, J. (2008). Raising Student Learning in Latin America, The challange for
the Twenty First Century. The World Bank, Washington, DC.
Verkuyten, M., & Thijs, J. (2002). School Satisfaction of Elementry School Children: The
Role of Performance, Peer relations, Ethnicity and Gender. Social Indicators Research,
59, 203-228.
Verspoor, A. (1989). Patheways to change: Improving quality of education in developing
countries. Discussion paper No. 53. World Bank, Washington, DC.
Vogels, R. (2002). Parents and School. Parental Involvement at School. Den Haag, SCP.
Welch, W. W., Anderson, E. R., & Harris, J. L. (1982). The Effects of Schooling on
Mathematics Achievement. American Educational Research Journal, 19(1), 141-153.
White, K. (1982). The relation between socioeconomic status and academic achievement.
Psychological Bulletin, 91(3), 461.
Wiley, D. E., & Yoon, B. (1995). Teacher Reports on Opportunity to Learn: Analyses of the
1993 California Learning Assessment System (CLAS). Educational Evaluation and
Ploicy Analysis. 17, 355-370.

164
Williams, T., & Carpenter, P. (1991). Private schooling and public achievement in Australia.
International Journal of Educational Research, 15(5), 411-431.
Willms, D. J., & Somers, M. A. (2001). Family, classroom, and school effects on children's
educational outcomes in Latin America. School Effectiveness and School Improvement,
12(4), 409-445.
Woessmann, L. (2003). Schooling resources, educational institutions and student
performance: the international evidence. Oxford Bulletin of Economics and Statistics,
65(2), 3305-9049.
World Bank. (2004). Vietnam, reading and mathematics assessment study, Volume II. Human
Development Sector Unit East Asia and Pacific Region. World Bank, Washigton, DC.
World Bank. (2009). Project Appraisal Document, School Sector Reform Program, Nepal.
Woßmann, L. (2003). Schooling resources, educational institutions and student performance:
the international evidence. Oxford Bulletin of Economics and Statistics, 65(2),
117-170.
Yando, R., Seitz, V., & Zigier, E. (1979). Intellectual and Personality Characteristics of
Children: Social Class and Ethnic Group Differences. Lawrence Erlbaum, Hillsdale
NJ.
Yayan, B., & Berberoglu, G. (2004). A re-analysis of the TIMSS 1999 mathematics
assessment data of the Turkish students. Studies in Educational Evaluation, 30,
87-104.
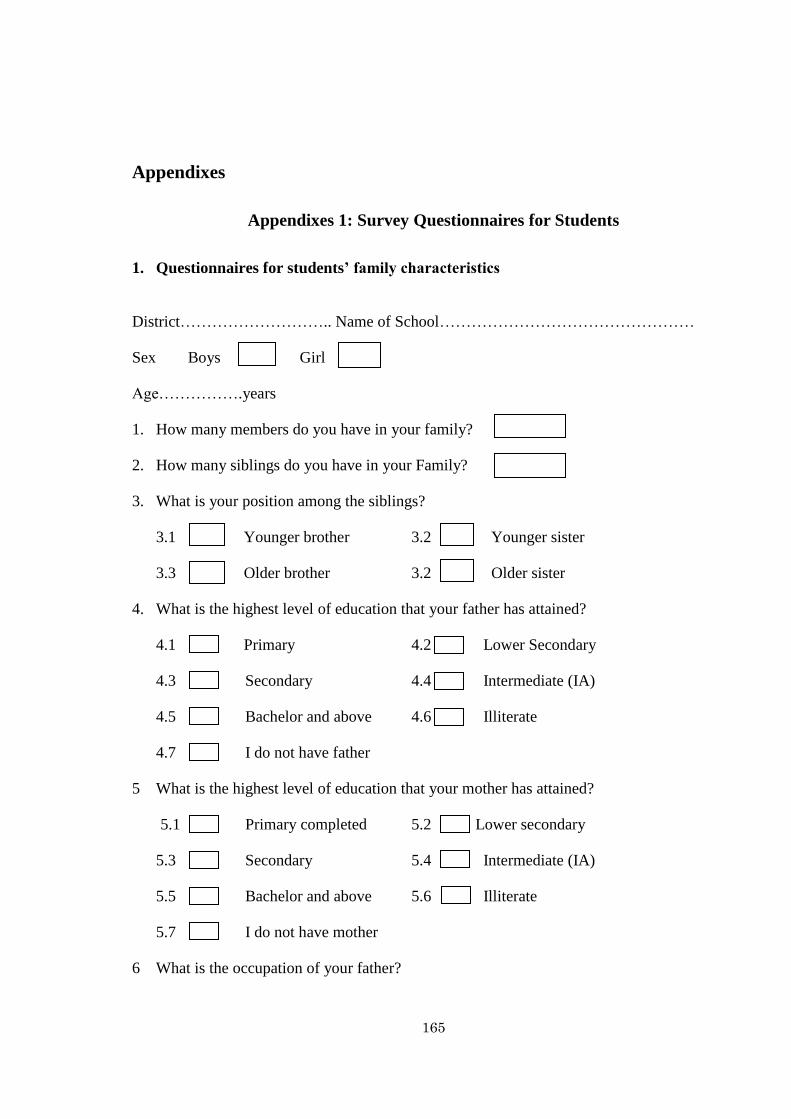
165
Appendixes
Appendixes 1: Survey Questionnaires for Students
1. Questionnaires for students’ family characteristics
District……………………….. Name of School…………………………………………
Sex Boys Girl
Age…………….years
1. How many members do you have in your family?
2. How many siblings do you have in your Family?
3. What is your position among the siblings?
3.1 Younger brother 3.2 Younger sister
3.3 Older brother 3.2 Older sister
4. What is the highest level of education that your father has attained?
4.1 Primary 4.2 Lower Secondary
4.3 Secondary 4.4 Intermediate (IA)
4.5 Bachelor and above 4.6 Illiterate
4.7 I do not have father
5 What is the highest level of education that your mother has attained?
5.1 Primary completed 5.2 Lower secondary
5.3 Secondary 5.4 Intermediate (IA)
5.5 Bachelor and above 5.6 Illiterate
5.7 I do not have mother
6 What is the occupation of your father?
166
6.7 Farmer 6.2 Business man
6.3 Government Employee 6.4 Social Worker
6.5 I do not have father 6.6 Others (specify)
7 What is the occupation of your mother?
7.7 Farmer 7.2 Business man
7.3 Government Employee 7.4 Social Worker
7.5 I do not have father 7.6 Others (specify)
8 What is the monthly income of your father?
8.7 Less than 3 thousands 8.2 3-5 thousands
8.8 6-7 thousands 8.4 8-10 thousands
8.5 Above 10 thousands 8.6 I do not have father
9 What is the monthly income of your mother?
9.7 Less than 3 thousands 9.2 3-5 thousands
9.3 6-7 thousands 9.4 8-10 thousands
9.5 Above 10 thousands 9.6 I do not have father
10 How is the structure of your house?
10.1 Concrete 10.2 Semi concrete 10.3 Huts
11 How much land do you have your own family?
…………………………………………………………………….
11.1 How owns the land in your family? Father Mother
12 Which of the following things can be found in the place (Home) where you stay?
12.1 Radio 12.2 Television
12.3 Bicycle 12.4 Cassette player
12.5 Refrigerator 12.6 Telephone
12.7 Electricity 12.8 Piped water

167
12.8 Gas stove 12.9 News paper
13. How long does it take to go to your school from your house?
13.3 Less than 10 minutes 13.2 10-20 minutes
13.4 Half an hours 13.4 More than half an hours
14. What language do you speak in your home?
14.1 Nepali 14.2 Tharu
14.3 Maithali 14.4 Newari
14.5 Others (Specify)……………………………
15 Do you have additional books at your home?
15.1 Yes 15.2 No
If your answer is positive, could you mention, how many additional books do you have
at your home
Less than 5 books 5-10 books More than 10 books
2 Questionnaires for Student Characteristics
How many of the following items do you have to work with this term? (Please write the
number in the boxes for each item. Please write ‘0’ if you do not have any.)
16.1 Exercise books 16.2 Full set of textbooks
16.3 Additional textbooks 16.4 Dictionary
16.2 16.5 Bags 16.6 Table to read and write
16.7 Geometry tool box 16.8 Files and folders
16.9 Calculators 16.10 Others (specify)
17. How many school days were you absent during last months of school? (Please write the
number in the boxes below. Please write ‘0’ if you were not absent.)

168
days
What was the main reason for your absence?.......................................
18. Have you ever repeated the grade since you are in school?
Yes No
If your answer is yes, could you mention how many times have you repeated?
18.1 I have repeated once 18.2 I have repeated twice
18.3 I have repeated three times 18.4 More than three times
Please read each of the sentences below about how you feel about school. Please ticks to
show how much you agree or disagree with each sentence. (1= Strongly agree…5 = Strongly
disagree)
19.1 I like the weekend when there is no school
19.2 I look forward to the first day of the school
19.3 I enjoy at school.
19.4 Learning at school is exciting.
19.5 Teachers give too much work at school.
19.6 School is boring.
19.7 Teachers and pupils have no fun together.
19.8 I am usually happy at school.
19.9 School makes you wise.
19.10 I like school because I learn.
19.11 I like school environment.
19.12 I like school because teachers are friendly.
19.13 I like school bs I like school environment.
1
1 2 3 4 5
2
1 2 3 4 5
3
1 2 3 4 5
4
1 2 3 4 5
5
1 2 3 4 5
1
1 2 3 4 5
2
1 2 3 4 5
3
1 2 3 4 5
4
1 2 3 4 5
5
1 2 3 4 5
1
1 2 3 4 5
2
1 2 3 4 5
3
1 2 3 4 5
4
1 2 3 4 5
5
1 2 3 4 5
1
1 2 3 4 5
2
1 2 3 4 5
3
1 2 3 4 5
4
1 2 3 4 5
5
1 2 3 4 5
1
1 2 3 4 5
2
1 2 3 4 5
3
1 2 3 4 5
4
1 2 3 4 5
5
1 2 3 4 5
1
1 2 3 4 5
2
1 2 3 4 5
3
1 2 3 4 5
4
1 2 3 4 5
5
1 2 3 4 5
1
1 2 3 4 5
2
1 2 3 4 5
3
1 2 3 4 5
4
1 2 3 4 5
5
1 2 3 4 5
1
1 2 3 4 5
2
1 2 3 4 5
3
1 2 3 4 5
4
1 2 3 4 5
5
1 2 3 4 5
1
1 2 3 4 5
2
1 2 3 4 5
3
1 2 3 4 5
4
1 2 3 4 5
5
1 2 3 4 5
1
1 2 3 4 5
2
1 2 3 4 5
3
1 2 3 4 5
4
1 2 3 4 5
5
1 2 3 4 5
1
1 2 3 4 5
2
1 2 3 4 5
3
1 2 3 4 5
4
1 2 3 4 5
5
1 2 3 4 5
1
1 2 3 4 5
2
1 2 3 4 5
3
1 2 3 4 5
4
1 2 3 4 5
5
1 2 3 4 5
1
1 2 3 4 5
2
1 2 3 4 5
3
1 2 3 4 5
4
1 2 3 4 5
5
1 2 3 4 5

169
20. How often your mathematics teacher does give you homework?
Always Sometimes Never gives homework
21 How often do you do your mathematics homework? (Please tick only one box.)
I donot do homework sometimes I do
I always do homework Teacher does not give
homework
22. How often does your math teacher correct your homework? (Please tick only one box.)
Do not get any homework Corrects most of homework
Never corrects homework Always corrects homework
Sometimes corrects homework
23. Is it easy to follow your mathematics teacher while he teaches?
Yes No
24. What kind of characteristics does your mathematics teacher holds?
Always Sometimes Rarely
24.1 Asks questions to all students
24.2 Makes classroom interesting by examples
24.3 Encourage student to learn
24.4 Gives homework
24.5 Corrects homework
24.6 Gives feedback
25. Do you take any kinds of extra classes/tuition for mathematics?
25.1 Yes 25.2 No
26. How much time do you spent on your studying outside school (at your home)?

170
26.1 One hour 26.2 Two hours
26.3 Three hours 26.4 More than three hours
27. Do you support to your family for household work?
27.1 Yes 27.2 No
If you support to your family for household work, could you mention how many hours do you
support?
One hour Two hours
Three hours More than three hours
28. Do you have experiences of per-primary education?
28.1 Yes 28.2 No
3 Questionnaires for parental involvement
29. Is there anyone who helps you in your study after school?
29.1 Yes 29.2 No
If your answer for question 29 is positive, please mention who helps on your study after
school?
Father Mother Others
(specify)…………………………….

171
1 2 3 4 5
1 2 3 4 5
1 2 3 4 5
1 2 3 4 5
1 2 3 4 5
1 2 3 4 5
1 2 3 4 5
1 2 3 4 5
1 2 3 4 5
1 2 3 4 5
1 2 3 4 5
1 2 3 4 5
1 2 3 4 5
1 2 3 4 5
30. Please read each of the sentences and how do you feel about your parents support. Please
ticks to show how much you agree or disagree with each sentence. (1= Strongly agree…5 =
Strongly disagree)
Parental encouragement
30.1 My parents encourage me to study
30.2 My parents ask me about progress of study
30.3 My parents visit my school frequently
Parental Support
30.4 My parents provide me learning materials
30.5 My parents don't care whether I study or not
30.6 My parents gives me feedback on my study
30.7 My parents helps me to do my homework
30.8 My parents don't care about whatever I do
30.9 My parents give priority for household
30.10 I think, my parents support on my study
Parent child relationship
30.11 Parents discuss about my study at home
30.12 Parents express affection
30.13 Parents discuss about my study
30.14 Parents do encourage to know new things

172
Appendixes 2: Survey Questionnaires for Mathematics Teachers
Name of school………………………………………………………….
Male Female
Age Years of experiences
Permanent Temporary
1. How long are you in teaching profession?
…………………….
2. What is the highest level of academic education you have attained? And what is your
major subject that you graduated?
Academic degree Major
3. How many years of teacher training have you received altogether? (Please tick only one
box.)
did not receive any teacher training have had training of less than 3 months.
have had training of less than 6 months have had a total equivalent of one year
have had a total equivalent of two year have had complete teacher training
4. After having completed your initial teacher training, how many short in-service courses
have you attended during the past three years?
Number of in-service courses
5. How many classes and hours do you teach once a week?
Number of Classes Hours per week
6. As a mathematic subject teacher, how often do you give homework for students?
Every day I give Homework Sometimes I give homework
I rarely give homework I do not give homework

173
7. How do you evaluate the learning achievement of children?
Test and examinations Oral examination of pupils
Observation of pupil participation in class Classroom work for pupils
Homework/assignments Project work
Others
8. How often do you evaluate the learning achievement of children?
Once a month Once a three months
Once a six months At the end of session
9. Which of the following items do you have access to in your classroom? (Please tick the
appropriate box for each resource.)
Yes No
9.1 A classroom library, book corner or book box
9.2 Black board/white board
9.3 Map
9.4 Wall chart
9.5 Chair for teacher
9.1 Book corner
9.1 Teacher’s guide (Mathematics)
10. Do you get any kinds of feedback or support to improve your teaching and learning
practices by any institutions?
Yes No
If your answer is yes, could you mention, who provides you feedback or support?
………………………………………………………………………………………..

174
11. How often do you use the following approaches when teaching Mathematics?
Never/rarely Sometimes often
11.1 Using everyday problems (verbally, written)
11.2 Teaching the whole class as a group
11.3 Teaching individually
11.4 Teaching through question and answer technique
11.5 Using everyday problems (verbally, written)
11.6 Giving positive feedback
11.7 Relating to everyday life situations
12. How often do you usually meet with the parents or guardians of the pupils in your class to
discuss pupil performance or related matters?
12.1 Never Once a three months
12.3 Once a year I do not have such fixed schedule

175
Appendixes 3: Survey Questionnaires for Head Teachers
Name of school………………………………………………………….
Sex Male Female
Age Years of experiences
Types of Job Permanent Temporary
8. Could you mention total number of children in your school?
Total students Girls
2. Could you mention how many days your school was opened in last year?.
School days
3. What is the highest level of academic education you have attained?
3.1 I Intermediate 3.2 Bachelor degree
3.3 Master degree
4. How many years have you been heading this school as School Head and/or Acting School
Head?
Years/months
5. How many years of teacher training have you received altogether?
5.1 I did not receive any teacher training.
5.2 I have had short course of less than one-year duration in total.
5.3 I have had a total equivalent of one year of teacher training.
5.4 I have had a total equivalent of two years of teacher training.
5.5 I have had a total equivalent of three years of teacher training.
5.6 I have had a total equivalent of more than three years of teacher training.
6. Have you received specialized training in school management? If ‘Yes’, please indicate the

176
total length of the course(s).
6.1 Yes 6.2 No
If ‘Yes’, please indicate the total length of the course(s).
7. How many years have you been heading this school as School Head and/or Acting School
Head?
Years/months
8. Do you have the following institutions near by your schools? If yes, please mention how
far is it.
Yes No How far
8.1 Health post
8.2 Book shops
8.3 Public road
8.4 Market
9. Which of the following best describes the location of your school? (Please tick only one
box.)
9.1 Isolated
9.1 Urban
9.1 In or near a small town
9.1 In or near a large town or city
10. How many teachers (according to the following categories) are there in your school?
10.1 Permanent teacher
10.2 Temporary teacher
10.3 Female teacher
11. How many times has your school been visited by an school supervisor last year in 2010?

177
(Please write the number in the boxes below. Please write ‘0’ if there have been no visits.)
Times
12. How many times resource persons have visited your school during last year? (Please
tick only one box. If they have visited the school, please write the frequency in the
Times
13. Which of the following does your school have? (Please tick appropriate box for each
item.)
Yes No
13.1 School library
13.1 Teacher/staff room
13.1 Separate office for school head
13.1Sports area/Play ground
13.1 Piped water/Water tank
13.1 Electricity13.1Telephone
13.1 Compound wall
13.1 Separate toilets for girls
14. What is the general condition of your school buildings? (Please tick only one box.)
14.1 The school needs complete rebuilding.
14.2 Some classrooms need major repairs.
14.3 Most or all classrooms need minor repairs.
14.4 Some classrooms need minor repairs.
14.5 In good condition

178
Appendixes 4: Mathematics Test Items
Time: 1 hour Total Marks 50
(All questions are compulsory) Group A (4x1 = 4)
1. Find the ratio of 25 and 55.
2. If Amount (A), Rate ® and Times (T) are given write the formula to calculate the principle
(P).
3. What power of x has the value 1?
4. Find the x intercept of the line AB in the graph given.
Group B ( 9x2 = 18)
5. Round of 0.35674 into 2 significant figures
5. How much money should be added to an item which costs Rs. 350 is tax rate is 10%?
6. Find the median of the following data.
5,6,7,8,11,17,11,19,6

179
7. Simplify
m2-4m
m2-6m
8. Simplify 3x2+5x(x-2)-8x
2+5
9. Find the slope of the line 3y-2x = 3
10. Find the value of x in the figure.
11. Find the length of AC.
12. Find the circumference of the circle with radius 14cm.
Group C (7x4 = 28)
13. Simplify
110112 + 100112 - 11112
+
14. A shopkeeper marked the price of a radio as R. 5000. He sold it allowing a discount of
10% and made of profit rs.500. Find the cost price of the radio.

180
15. Find the mean from the table given below.
Marks obtained 10 20 30 40 50 60
No of students 2 3 5 4 3 3
16. (Simplify)
17. Find the Highest Common Factor (HCF) and Lowest Common Factor (LCM)
8x2-27 and 4x
2-12x+9
19. Construct a trapezium from the measurement given below.
AB = 7.5cm; BC = 4.9 cm; BAD = 60 and ABC = 90
20. Find the total surface area of the given triangular prism.
A A’
12 cm 18 cm
B B’
C 13 cm C’

181
Appendixes 5: Marking Scheme for Mathematics Test Items
The following are the guidelines for awarding the marks.
1. Give relevant marks for a numerically correct stage or a correct result provided essential
steps leading to that stage or result are clearly shown.
2. If a candidate uses a method other than those shown in the scheme, give relevant marks
for correct stage of result if the method used is correct.
3. When the data of a question is misread in such a way as not to change the aim or difficulty
of the question, follow through the working and give marks as indicated on the scheme.
Then deduct marks as punishment for misreading. This is applicable only if the wrong
value is used throughout the solution.
4. If units (where necessary) are not given, deduct 1 mark for long questions only.
5. Use of wrong methods or formula scores 0.
6. If no figure is drawn or if the figure drawn is not relevant to the question or if the figure is
drawn at the end of proof. The whole question scores 0.
7. If construction is stated but not shown on the figure, the proof scores 0.
8. If a part of working is not shown, check if it can be done mentally: if the omitted working
can de done mentally and answer is correct, give relevant marks.
9. If the omitted working cannot be done mentally, deduct relevant marks (i.e. marks
allocated for a particular stage or result). But candidate still gets mark (s) for subsequent
work.

182
Marking scheme
Group A
mark
1. 5/11 1
2. P = 100 X A/100+ TR 1
3. 0 1
4. 3 1
Group B
5. 0.36 2
6. Tax = 35 x 10/100 1
= Rs. 35 1
7. Writing the data in ascending or descending order and formula 1
M = 9 1
8. m(m-4)/m(m-6) 1
m-4/m-6 1
9. 3x2 + 5x
2 -10x – 8x
2 +5 1
5 (1-2x) 1
10. 3y = 2x + 3 1
Slope = 2/3 1
11. 2x = x + 600 (alternate angels) 1
= x = 600 1
12. Ac2 = 3
2 + 4
2 1
= 5 cm 1
13. For writing the formula 1

183
Circumference of circle = 88 cm 1
Group C
14. 110112 + 100112 – 11112
(i) 1011102 – 11112 2
(ii) 111112 2
15. (i) SP = Rs. 5000- 10% of Rs. 5000 (1 + 1)
= Rs. 4500
(ii.) CP – SP – G (1 + 1)
= Rs. 4500- Rs 500
= Rs. 4000
16. (i) x a+b
x x –c-b
x x c + d
x x –d-a
1
(ii.) x a+b-c-d+c+d-d-a
1
(iii) X0
1
(iv) 1 1
17.
Marks obtain (x) No. of student (f) fX
10 2 20
20 3 60
30 5 150
40 4 160
50 3 150
60 3 180
∑f = N = 20 ∑f = N = 720
(i) ∑ f = N = 20 1
(ii) ∑ fX = 720 1
(iii) Mean = ∑fX/N 1

184
(iv) Mean = 720/20 = 36 1
18. (i) (2x -3) (4x2+ 6x + 9) 1
(ii) 4x2 – 12x + 9
4x2 -6x -6x +9
(iii) (2x -3) (2x-3) 1
(iv.) HCF = (2x-3) 1
(v) LCM = (2x -3)2 (4x
2 + 6x +9) 1
19. (i) Draw a line AB = 7.5 cm 1
(ii) Construct angels of size 600 and 90
0 at A and B 1
(iii) Draw a line BC = 4.9 cm and draw CD parallel to BA 1
(iv.) Hence, trapezium ABCD is the required figure and completing the figure 1
4.9 cm
600 90
0
7.5 cm
20. (i) Area of the triangle ABC
(ii) 1/2 x 5cm x 12 cm
= 30 cm2 1
(ii) Area of total surface of the prism
= 2 x 30cm2 + 18 (5cm + 13 cm + 12 cm) (1 + 1)
(iii) 60 cm2 + 540 cm
2
= 600 cm2 1

185
Appendixes 6: Classification of Ethnicity by Caste
1. Middle ethnicity by caste
Classification castes
Endangered Kusunda, Bankariya, Raute, Surel, Hayu, Raji, Kisan, Lepcha, Meche and
Kusbadiya
Highly
marginalized
Majhi, Siyar, Lohmi, Thudam, Dhanuk, Chepang, Satar(Santhal), Jhangad,
Thami, Bote, Danuwar, Barumu
Marginalized Sunuwar, Tharu, Tamang, Bhujel, Kumal, Rajbansi, Gangai, Dhimal,
Bhote, Darai, Tajpuriya, Pahari, Topkegola, Dolpo, Free, Mugal, Larke,
Lohpa, Dura and Walung
Disadvantaged Gurung, Magar, Rai, Limbu, Chhairotan, Tangbe, Tinganule Thakali,
Bargaule, Marphali Thakali, Sherpa, Yakkha, Chhantyal, Jirel, Byansi,
Yolmo
Advanced Newar and Thakali
2. Low ethnicity by caste
Hill Dalit 1. Kami, 2. Sarki, 3. Damai, 4. Lohar, 5. Sunar, 6. Gaine, 7. Badi, 8.
Kuche
Newar Dalit 1. Kusule, 2. Kasai, 3. Chyame, 4. Pode
Terai Dalit 1.Tatma, 2. Paswan (Dusadh), 3. Dhobi, 4. Bantar, 5. Mushahar, 6.
Khatwe, 7. Chamar, 8. Dom, 9. Santhal, 10. Satar, 11. Halkhor.
Source: Central Bureau of Statistics. Nepal Living Standard Survey 2011, Kathmandu, Nepal

186
Appendixes 7: Correlation Coefficient of Family Characteristics, Student Characteristics, Parental Involvement, and School Characteristics
1 2 3 4 5 6 7 8 9 10 11 12 13 14 15 16 17 18 19 20 21 22 23 24 25 26 27
1 1
2 -.238 1
3 .32 -.145 1
4 .421 -.227 .497 1
5 .088 -.108 .166 .152 1
6 .384 -.142 .288 .249 .179* 1
7 .337 -.169 .378 .414 .224 .347 1
8 .165 -.107 .031 .039 .098 .078 .134 1
9 -.297 .161 -.193 -.220 -.091 -.175 -.153 -.105 1
10 -.298 .073 -.255 -.266 -.055 -.194 -.242 -.035 .140 1
11 -.364 .102 -.220 -.187 -.102 -.211 -.162 .035 .167 .203 1
12 .316 -.101 .137 .127 .028 .202 .072 .029 -.136 -.148 -.128 1
13 .201 -.089 .132 .083 .025 .126 .096 .086 -.125 -.112 -.095 .156 1
14 .377 -.058 .206 .165 .042 .158 .182 .123 -.081 -.195 -.184 .189 .175 1
15 -.305 .139 -.256 -.222 -.087 -.192 -.276 -.131 .184 .177 .127 -.154 -.093 -.180 1
16 .263 -.138 .227 .200 .130 .157 .200 .057 -.097 -.129 -.114 .097 .049 .091 -.195 1
17 .372 -.162 .172 .186 .022 .211 .153 .078 -.171 -.181 -.155 .209 .161 .292 -.145 .116 1
18 .459 -.149 .410 .348 .134 .248 .264 .057 -.152 -.210 -.223 .233 .167 .277 -.252 .356 .243 1
19 .460 -.219 .306 .289 .119 .300 .295 .182 -.185 -.242 -.184 .292 .207 .338 -.258 .252 .512 .435 1
20 .170 .029 .069 .107 -.042 .051 .029 .046 -.056 -.088 -.096 .076 .040 .096 .014 -.011 .057 .083 .000 1
21 -.509 .285 -.397 -.553 -.152 -.258 -.445 -.165 .253 .238 .155 -.144 -.065 -.163 .329 -.271 -.206 -.273 -.318 -.096 1
22 .202 .136 .216 .286 .131 .069 .185 .041 .055 .082 .109 .047 .079 .136 .146 .146 .152 .143 .167 .097 .407 1
23 -.112 -.129 -.077 -.034 -.071 .053 .029 -.023 -.071 .075 .056 .116 .012 -.153 .045 -.037 .029 -.046 .068 -.180 .132 .167 1
24 .355 -.204 .199 .245 .061 .179 .220 -.007 -.088 -.050 -.101 .202 .152 .193 -.114 .122 .210 .191 .224 .042 -.288 .422 .259 1
25 .307 -.121 .106 .179 -.059 .077 .067 .116 -.197 -.039 -.130 .221 .105 .067 -.069 -.015 .198 .085 .220 .058 -.309 .001 .109 .105 1
26 .365 -.040 .209 .125 .095 .130 .031 .056 -.130 -.051 -.140 .182 .190 .253 -.124 .063 .166 .179 .161 .096 -.127 .207 -.181 .400 .214 1
27 -.287 .208 -.238 -.327 -.163 -.152 -.296 .024 .129 .196 .113 -.053 -.007 -.048 .205 -.191 -.142 -.085 -.204 -.036 .679 .489 .040 -.207 -.120 .130 1
28 .399
-.274 .200 .286 .084 .218 .198 .031 -.148 -.099 -.129 .214 .157 .132 -.203 .138 .300 .206 .346 .072 -.398 .467 .274 .498 .244 .307 -.43
4
1
Note: Numbers 1 to 28 indicate the variables examined in this study as explained in Table 5.3