Embed Size (px)
Citation preview

Factors Affecting the Profitability of Golf Courses in Georgia
Pierre I. Boumtje1, Wojciech J. Florkowski2, Gil Landry3, and Cesar L.Escalante4 1 Assistant Professor, Department of Agriculture, Southern Arkansas University, Magnolia, Arkansas, [email protected]. 2 Professor, Department of Agricultural and Applied Economics, University of Georgia, Griffin, Georgia 3 Professor and Extension Specialist, Department of Crop and Soil Sciences, University of Georgia, Griffin, Georgia 4 Assistant Professor, Department of Agricultural and Applied Economics, University of Georgia, Athens, Georgia
Selected Paper prepared for presentation at the Southern Agricultural Economics Association Annual Meeting, Tulsa, Oklahoma, February 14-18, 2004
Copyright 2004 by Pierre I. Boumtje, Wojciech J. Florkowski, Gil Landry, and Cesar L.Escalante. All rights reserved. Readers may make verbatim copies of this document for non-commercial purposes by any means, provided that this copyright notice appears on all such copies.
1
Factors Affecting the Profitability of Golf Courses in Georgia
Introduction Golf is a major recreational activity and a rapidly growing business in the United
States today. Between 1980 and 1999, the number of golf players increased by 78.7%
from about 15 million to 27 million, while the total number of golf courses increased by
18.3%, i.e., from 12,846 to 15,195. The number of daily fees courses, the most common
type of golf courses, increased by 57.7% during the same period (The U.S. Census
Bureau).
Despite an increase in the number of golf courses and golfers, the average number
of rounds played per person and per year has consistently declined over the past two
decades (National Golf Foundation). The decline in the number of rounds played
indicates an increasing competition for attracting and retaining golfers to individual sites.
Agricultural economists show an increasing interest in the golf course business
for various reasons. First, golf courses constitute a recreational use of land, which
seriously competes with agriculture. This competition is evidenced by more frequent
reallocation of land away from farming to golf course facilities. In 2001, for example, a
total of 377 new golf course construction projects, not including reconstructions, were
completed in the United States, and the majority of these facilities were built on
farmland. In addition, turfgrass maintenance of golf courses uses traditionally known
agricultural inputs such as fertilizers, pesticides and other chemicals, irrigation water, and
equipment. In this regard, golf courses and agriculture show many similarities, the main
difference being that the golf course output is a recreational service and not a commodity

2
as in the case of agriculture. In Georgia, the urban sprawl has become a major issue as the
residential, commercial, and recreational sites encroach on farming communities once
located in remote areas.
Economic motivations of golf businesses are diverse and fall in line with the
ownership structure of golf courses (public, semi-private and private). The growing
number of golf courses and raising competition to attract players requires balancing the
fees and the course appearance directly tied to maintenance expenditures. The golf
industry understands that to remain competitive, a course must be well managed and
marketed (Crittenden, 1998). All managers, however, must deal with unavoidable issues
of feasibility, profitability, and sustainability of operations (Aterburn), which constitute
key indicators of the viability of any business, including golf course businesses.
Feasibility implies that the business generates sufficient cash to fund its
operations in the short-, medium-, or long-term. A careful cash flow preparation is
essential in monitoring the performance against budget. Not only a golfing enterprise
needs to continue funding of its operations, but it also has to earn and retain profits on an
annual basis to survive in the medium- to long-term. For growth and sustainability, a
golf facility must show an acceptable return on the invested capital.
With increased competition noted in the golf industry (Stephenson), it is
becoming important for golf course managers to identify factors which attract and retain
their golfing clientele. The demand for golf at a particular golf course is a function of the
price, location, relevant population, and other characteristics including the level of
maintenance of the golf course (Shmanske). The golf course maintenance includes
mowing, fertilizing and pest control in turfgrass, caring for trees and shrubbery,

3
maintaining sand traps, and equipment among others. If maintenance is not undertaken
daily, the condition of the course will suffer, risking the loss of a clientele to better
maintained courses. Therefore, proper maintenance is expected to result in greater
demand for golfing. However, regular maintenance is associated with higher
expenditures, but the potential for profit remains if the marginal revenue exceeds the
marginal cost.
The primary objective of this study is to conduct a profitability analysis of golf
course maintenance. Specifically, this study will quantify the link between the set of
factors that significantly enhance golf course revenues and their effect on the measure of
profitability, the gross margin. To provide additional insights, we distinguish among
three ownership types of golf courses. The importance of this distinction is relevant
because various golf course characteristics and factors influencing the management of a
facility may differ in their influence depending on the owner. It is plausible that a private
corporation operating a golf courses attaches a different importance of profits than a tax-
supported entity responsible to a group of elected officials. We test the ownership
relevance by estimating the model using sub-samples of data accounting for an ownership
type and using the pooled data and the binary variables describing the ownership.
The results from the analysis will be beneficial to superintendents and managers
of golf courses. The job performance of these groups are directly evaluated on the basis
of the financial performance of each facility, yet their immediate interests are not
identical. Superintendents, who are directly responsible for the course maintenance,
struggle with the pressure to control maintenance costs, while assuring a high quality
playing surface. Managers are accountable for the performance of the whole enterprise.

4
The relative role of various activities in creating costs and generating revenue helps
managers to allocate resources within the operated facility. Specifically, this study will
quantify the link between the additional maintenance expenditures and a measure of
profitability, the gross margin. Furthermore, investors in real estate development will
gain knowledge enabling an enhanced calculation of expected returns prior to committing
resources to invest in a golfing facility. This is particularly important because many
courses are a part of a housing community. Research and extension personnel at land-
grant universities will gain insights about the contribution of various factors to the
financial performance of the enterprise. The importance of each factor affecting the
marginal costs or revenues will guide the research and outreach efforts. Finally, local
governments, especially those investing in community golf courses, will be able to better
gauge the current and planned costs, while recognizing factors responsible for shaping
the profitability. Public bodies considering a renovation, expansion or construction of a
golf course will be able to compare the relative importance of different factors for such
undertakings.
The ownership type in the golf course sector
Public golf courses dominated in Georgia in the past. The recent decade
witnessed a rapid growth in construction of private and semi-private courses. Georgia
experienced rapid population growth in the past two decades which, consequently
resulted in increased demand for the game. The larger, wealthier population created an
attractive pool of potential players stimulating the construction of new facilities. The
distinction according to ownership type provides unique insights about varying degrees
of relevance and influence of a number of financial, structural and demographic factors in

5
revenue and profit generation for each ownership type in the golf business. If ownership
type does not matter then the analysis will reveal few differences. This outcome,
however, is likely if the motive of, for example, an entrepreneur constructing a private
course is not different from a city commission committing public funds for building a
public golf course.
The role of ownership factor for the economic performance of an enterprise has
been well established. Communal ownership has been observed to experience greater
incidence of mismanagement leading to X inefficiency. Such ownership kept costs high,
while the concealed measure of profits hid the extent of waste. In case of the public
ownership of golf courses, in some communities there has been pressure to privatize such
facilities due to the need or desire to lower government expenditures and the search for
new revenue sources (Gustafson; Gustafson and McLean). Many members of the
community viewed privatization of public service provision as a way to promote
competition and risk-taking constrained by the public sector preoccupation with the
strictly defined responsibilities and the emphasis on following the procedures. The
“invisible hand” guided numerous course construction projects because the primary
motives of the investors were anticipated returns. Land used for the construction of a golf
course is typically privately owned, but the course can be constructed and operated by a
private or public entity. Farmers across the U.S. have attempted to convert their
operations into golf courses in expectations of returns higher than for agricultural
production (Anonymous; Mothes). This study primarily contends that differences in the
magnitude and direction of marginal effects of the various explanatory variables across

6
the ownership groups will have important implications on the nature of competition for
land use.
Some private facilities limit the players to a narrowly defined group, typical
members and their guests. National Golf Foundation (1995) reported that about seven
percent of golfers were members of private clubs. Semi-private facilities have been open
to the public, but, sometimes, on somewhat different principles than for members. Public
golf courses operate in many cities and municipalities without special membership
requirements from any golfers. They operate on a fee basis and are accessible to residents
and nonresident alike. The membership in semi-private or municipal golf clubs was
reported by 11 percent of all golfers (NGF, 1995).
This study focuses on gross margin because there is less agreement and
uniformity in the classification and magnitude of some expense categories, e.g., land-
related expenditures. Some courses are built on leased rather than purchased land, thus
making a comparative cost analysis complicated and difficult. The analysis used the
implicit assumption that the cost of land, capital and several other fixed cost categories
would not differ among courses due their ownership type.
Golf course revenues are the total golf facility revenues from all areas of
operations. The sources of income include membership fees, membership dues, and golf
green/guest fees. Additional revenues included in this study are generated by golf car
fees, golf instruction fees (for lessons, clinics, and schools), tournament operations, a golf
range, and a club rental service. Some golf courses obtain revenues for providing special
services such as club repair, handicapping service, caddie service, golf bag storage, and
locker fees. Golf merchandise sales generate much needed revenues and methods

7
enhancing sales are closely studied by the golf industry (Johnson). Property wide food
and beverage sales also supplement the facility’s income. Factors influencing golf course
revenues at a particular site include the number of rounds played, the acreage, the
location, and the existence of other facilities such as the pro shop. The rounds played are
a major revenue driver (Golf Business Magazine), especially for semi-private and public
facilities because they cannot expect large revenues from membership dues and fees.
Some amenities, for example food and beverage service are expected by players. Food
and beverage sales generate $3.4 billion annually at golf course facilities (GolfBusiness
Magazine.com). This is the third largest revenue-generating service provided by golf
course operators. Swimming pools, tennis courts, and gyms are less common because
they are supplemental amenities to the primary service which is the game of golf. Private
golf clubs are more likely than the public-access facilities to have tennis courts (38
percent vs. 8 percent), swimming pools (50 percent vs. 9 percent), or fitness clubs (11
percent vs. 4 percent) (Stephenson).
The age of the golf facility is potentially influential in determining revenues
because long existing courses had adequate time to establish its reputation among its
clientele. The issue of whether or not a golf course is a part of the real estate
development has emerged with the increasing popularity of gated communities. A nicely
designed course surrounded by upscale residences has a great potential to generate
revenues. Although the link between the golf course presence and housing prices has
been researched (Asabere and Huffman), the question how a development affects a
course revenues is largely unanswered.

8
Gross margin, the difference between revenues and maintenance costs, is the
focus of the analysis. Data on maintenance expenditures use in this study were provided
by superintendents. The data included labor costs and the total costs of the following
items: herbicide, fungicide, insecticides, growth regulators, lime and gypsum, wetting
agents, fuel, oil, lubricants, equipment repair, irrigation repair, topsoil and sand top
dressings, seed, sod, sprigs, trees, shrubs, bedding plants and ornamentals, water, other
non-labor expenses and renovation. Annual depreciation of equipment purchases and
renovation was also included in the total expenditures. Measures of gross margins differ
from the overall profits of every golf course facility, which are net of such expenses as
interest and insurance. In contrast, all variables influencing revenues are also expected to
affect the gross margin.
Consider the following model aimed at estimating the gross margin equation:
(1) Y = Xβ + g
where X is a vector of independent variables used in the estimation of Y, β is the vector
of coefficients, and g is the error term such that E[g] = 0 and E[ g g’] = σ2. Assuming that
disturbances are uncorrelated across observations,
(2) E[gmt gns] = σmn if t = s; 0 otherwise.
The incremental maintenance cost, the incremental revenues, and the change in gross
revenues are generated within each facility, but the relationships among these three
measures are indirect. Both equations can, therefore, be estimated separately, using the
Ordinary Least Squares (OLS) approach (Greene, 1993).

9
The Empirical Model
We specified four separate equations, one for each ownership type and one for all
golf course data pooled together. To estimate the equations, we included a number of
explanatory variables based on the information shared by the surveyed golf courses. We
augment the variable choice by the observation of the golf course management practices
to identify additional factors relevant to this study. All variables influencing maintenance
expenditures and revenues are expected to affect revenues although the direction of the
effect may be different from that on the gross margin or a priori unknown.
The number of rounds played is especially important because it reflects the
frequency of turf use and is positively associated with the frequency of turf injury and
damage. In addition, the total acreage of the golf facility is important because, as an
integral part of a course, it also requires frequent care and maintenance, therefore
negatively influencing the gross margin.
The age of a golf course is included primarily because it is a proxy for ‘brand
recognition.’ Long established courses are well known in the area and may have been
visited by more than a single generation of players in the same family. Some Georgia
facilities constructed in the 19th century continue to operate, thus, suggesting that the
longevity has been earned by a consistent provision of satisfaction to golfers over time.
We will also test the effects of the location of the golf course. For this purpose
we identified courses located in the metropolitan and non-metropolitan areas. The
definition of the metropolitan area was consistent with that used by the U.S. Census
Bureau. Metropolitan location implies denser population than in non-metropolitan areas,
thus, creating increased demand for the game reflected in higher revenues and gross

10
margins. Also, golf participation rates in large metropolitan areas exceed those in non-
metro areas (Sports Business Research Network). The ‘metro’ location was expected to
positively influence both revenues and the gross margin.
Demand permitting, revenue is higher on a multiple course facility (Shmanske).
The survey data permitted the specification of four variables describing course
classification according to the number of holes. Golf course facilities with more than 18
holes will have larger total acreage and will also have a larger capacity. We have
combined the size and the number of holes into a single variable, area per hole, defined as
the area of the turfgrass divided by the number of wholes. Although it is logical to expect
an increase in the earning potential as the number of holes on the course increases, the
actual direction of the effect on the gross margin by a specific class of a course will be
determined empirically.
The manager’s educational attainment can influence both revenues and the gross
margin. Managers, who received more education can be expected to be more efficient
and innovative in using available resources in improving the gross margin while
exploiting existing opportunities in generating revenues. In some facilities, a manager
also carried responsibilities commonly assigned to a superintendent. This combination of
two functions prevented the use of the superintendent education and the division of the
effect between that associated with the manager and the superintendent education levels.
The manager’s experience, measured as the number of years in service is also expected to
positively influence the gross margin. Experience, a form of informal education, can be a
source of improved management through better organization, planning, and innovation.

11
The acreage of turfgrass maintained is expected to vary negatively with the gross
margin. Although it takes longer to mow grass on larger greens, thus raising costs, the
main effect of a large green is to spread wear and tear caused by golfers’ footsteps and by
golf balls landing with great force. A recent study by Shmanske revealed that it was a
unanimous view of golf course superintendents that large greens are easier and cheaper to
maintain than small greens.
The coefficient associated with the number of rounds played is an estimate of the
marginal cost that an additional golfer imposes on the course, but rounds played are also
a source of fees generating revenues. Therefore, the number of rounds likely increases
the revenues, but its effect on the gross margin is not clear, especially once considered in
the context of the course ownership.
The total acreage of the golf facility is also expected to be positively related to
revenues because a larger facility tends to offer wider services, more diversified playing
field and other amenities which attract the playing public. However, caring for more
acres is more expensive than caring for fewer acres and the total acreage may negatively
influence the gross margin.
The presence of amenities such as tennis clubs, swimming pools, food and
beverage services were also expected to enhance revenues, because such additional
facilities attract a broader spectrum of people. For example, some players may choose a
course because the presence of amenities permits the whole family to enjoy an outing.
However, the effect of the presence of amenities on the gross margin was uncertain and
will be determined empirically.

12
Finally, the existence of real estate development on its revenues and the gross
margin was taken into consideration. Such developments are increasing in frequency, but
their effect on revenues and gross margin has not been tested. Some developments are
limited to a few dozen homes, while some consist of hundreds of residences.
Homeowners could potentially increase the number of rounds played, but if homes are
part of a gated community, the access to the course may be restricted. We have no a
priori expectations regarding the effect of the housing development in the immediate
vicinity of the golf course.
Data and Variable Specifications
The data for the empirical analysis were obtained from the survey of
superintendents and managers of private, public, and resort golf courses located in
Georgia. The golf course’s financial performance reflects the risk of the enterprise
subject to market forces. Because the competition among golfing facilities was strong,
the willingness to provide some type of information was tempered by the perception of its
sensitivity.
Georgia is located in a climatic zone, which allows almost year-round golfing.
The number of golf courses has been growing and new facilities continue to be
constructed. To obtain the needed information we implemented a survey of the members
of the Georgia Golf Course Superintendent Association (GGCSA). The survey was
conducted using two different survey instruments. One questionnaire was designed to
obtain information from the superintendents in order to gain insights on the issues related
to maintenance. Another questionnaire was prepared for the managers of these facilities
to account for other sources of costs and revenues.

13
The questionnaires were mailed to each manager and each superintendent
separately. Within ten days of the mailing, a post card was sent requesting the
completion of the questionnaire. Subsequently, another copy of the questionnaire was
mailed to those who did not respond to the first mailing or the reminder. The number of
returns differed between the superintendent and the manager surveys. It was likely that
the primary reason for different participation rates was the nature of questions and the
degree of detailed financial information requested. From the total of 352 mailing
addresses, 208 were returned by the superintendents and 149 by the managers. After
accounting for duplicate addresses (1), courses that were out of business (2), wrong
addresses (2), courses merged with another establishment (1), and misidentified
establishments (13) the rates of returns were excellent for a self-administered
questionnaire. The response or return rates of 62.5 percent and 44.7 percent among
superintendents and mangers, respectively, are high for a mail survey. High return rates
were attributed to the limited geographical scope (only Georgia courses surveyed by a
state institution) and the support from the GGCSA, which encouraged members to
respond to the survey.
The next step of data preparation involved identifying the facilities where both the
superintendent and the manager provided the responses and merging the collected
information into a single data set. We identified 114 courses which provided the most
complete information. Tables 1 shows the descriptive statistics of golf course
characteristics and respondent characteristics based on the 114 responses.
Results and Discussions

14
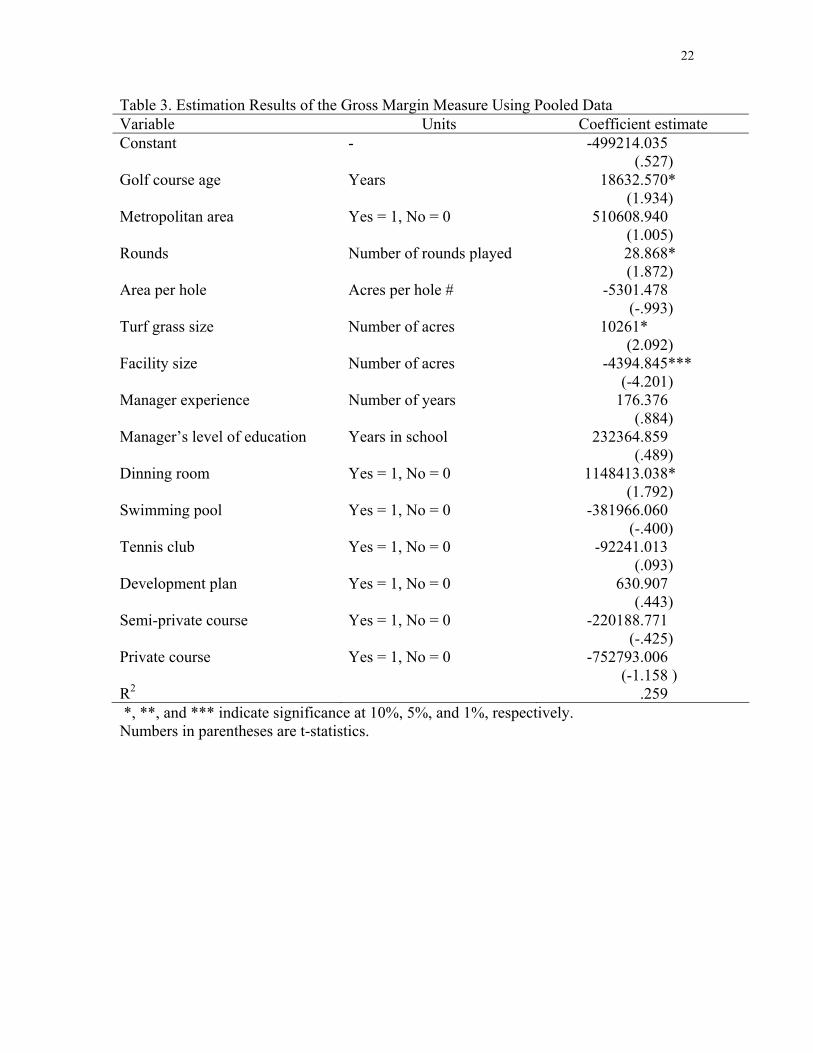
Results from the estimation of the gross margin equation are summarized in
Tables 2 and 3. The age of golf courses appears to positively affect the gross margin. As
private and semi-private golf courses age, the revenue and gross margin they can expect
to earn increase substantially. This result is consistent with expectations that older golf
courses have established a reputation through a sustained satisfaction provided over
decades to generations of clients.
The facility’s location appears to have significant and positive effect on the gross
margin of private golf courses. However, in case of semi-private and public courses, this
factor does not seem to matter.
Rounds played at a golf course negatively influenced the gross margins of private
courses. It is true that private facilities operate for profit and would be interested in
selling the largest possible number of games. However, each played round also increases
maintenance costs, and private courses may not always break-even. In the case of semi-
private courses, the coefficient was positive, meaning that courses in this ownership
category did better than breaking-even. We observed the same result when all courses
are pooled together.
The facility’s location appears to have significant effect on the gross margin of
private golf courses. The location variable indicated that a private golf course located
within the metropolitan statistical area, can expect higher revenues than a similar course
located in the non-metro area. Gross margins of private golf courses can be expected to
increase by $1.28 million if it is located within a metropolitan area as compared to a non-
metro location. Some Georgia metropolitan counties have experienced a rapid growth
and the public amenities may have not been developed at a similar pace. Private courses

15
constructed and operated for profit may be able to further convert the increased revenues
into higher gross margins. This variable did not matter in the case of semi-private and
public courses.
The area per hole negatively and significantly affected gross margin of private
courses. This result makes sense because the larger size of turfgrass per hole, the larger
the maintenance costs, making it difficult for private courses to break-even.
The size of turfgrass showed a positive and significant association with gross
margin for private courses, confirming the results by Shmanske that large greens are
easier and cheaper to maintain than small greens. The total acreage of the golf facility
showed a negative and significant relationship with gross margin except for semi-private
courses. This result is contrary to our expectation that larger facilities may get more
revenue and greater gross margin because they tend to offer wider services, more
diversified playing field and other amenities which attract the playing public. However,
the result seems to indicate that caring for more acres is more expensive than caring for
fewer acres and the total acreage may negatively influence the gross margin.
The manger’s level of education showed a positive and significant relationship
with the gross margin. This result is consistent with expectations that managers with
more education would be more efficient and innovative in using available resources in
improving the gross margin while exploiting existing opportunities in generating
revenues.
Among several variables accounting for various amenities of golf courses, none
had any significant influence on the total revenues or the gross margin. The primary role
of a golf course was the game, not the use of a swimming pool or a tennis court. In some

16
instances, perhaps, other household members or players themselves make use of the
available services, but such use was likely affected by seasonal weather and their
secondary importance to the game of golf.
Implications
The steady increase in the number of golf courses in Georgia has not been
matched by the extent of applied research focusing on golf course operation and financial
management. This study examined factors influencing the financial performance of golf
courses measured by their gross margin.
The size of the golf courses (in terms of the number of holes) tends to increase
over time in Georgia. But this study supports that private courses with larger turf area
per hole could expect to generate lower flow gross margins. The substantial population
growth in Georgia generates increased demand for the game, but at the same time, local
and state governments are under pressure to invest in basic infrastructure requirements of
the local communities including roads and schools. Even among alternative recreational
facilities, golf falls behind more popular forms of recreation.
A metropolitan location for a private golf course appears to be preferred to a non-
metro site. Because a golf course requires a large number of players to generate
revenues, densely populated urban and suburban neighborhoods are more likely to
support a facility by generating an intense flow of traffic. Remote golf courses must offer
special incentives to attract players. Among semi-private courses, some are associated
with resorts and are intended for a weekend or a longer stay. Golfers visit such sites to
enjoy the game, but also to rest in the different environment than that offered by courses
near their permanent residence.

17
The trade-off exists between the size of the whole facility and the size of the turf
constituting the playing field. The gross margin improves in response to an increase of
turf area, but worsens if the area dedicated to the game does not expand. Because the
whole area requires some kind of maintenance, limiting the acreage that is not a playing
turf, will enhance the gross margin. The design of some facilities may underscore the
appearance of the whole facility as a way of attracting customers. However, from the
purely financial standpoint this may be less desirable.
Only about 15 percent of golf courses nationwide are profitable (Harack). In the
absence of applied studies that can verify the relevance of specific aspects of the golf
enterprise, managers and superintendents cannot be offered guidelines regarding factors
responsible for the industry total revenues or gross margins. Such studies would provide
the necessary benchmark for the comparison with a specific operation. Instead, managers
and superintendents must depend on their experience and their own analysis in the
evaluation of enterprise performance.

18
References
Anonymous. 1995. Indy Developers Convert Farm into Links. National Golf Foundation, The Golf Industry in the U.S.: Sales & Marketing Trends, Jupiter, FL, p. 102.
Asabere, P. K. and F. E. Huffman. “Negative and Positive Impacts of Golf Course
Proximity on Home Prices.” Appraisal J. 64(October 1996):351-356. Aterburn, T. A. “Public-Private Partnerships in Golf-Course Development.” Parks and
Recreation 33(June 1998):50-60. Crittenden, A. Marketing Required. In: The Golf Industry in the U.S.: Sales & Marketing
Trends. 2nd Edition, National Golf Foundation, Jupiter, FL, p. 124. Georgia Golf Course Superintendent Association. Available online at
http://www.ggcsa.com. [Retrieved May 2002]. Golf Business Magazine.com. 2003. By the Numbers. November 2003. Available on line
http://www.golfbusinessmagazine.com/pageview.asp?/doc=944. [Accessed November 2003].
Greene, W. C. Econometric Analysis, 2nd Edition, Macmillan Publishing Company,
1993. Gustafson, T. F. 1999. The Process of Privatizing Public Golf Courses. LARNet: The
Cyber Journal of Applied Leisure and Recreation Research. Available on line http://www.nccu.edu/larnet/2002-9.html. [Accessed September 2003].
Gustafson, T. F. And D. D. McLean. 2002. Privatization and Its Effects on Public Golf
Employees. LARNet: The Cyber Journal of Applied Leisure and Recreation Research. Available on line http://www.nccu.edu/larnet/2002-9.html. [Accessed September 2003].
Harack. T. 2003. Capitalizing on Falling Rates? GolfBusiness Magazine.com. November
2003. Available on line http://www.golfbusinessmagazine.com/pageview.asp?/doc=944. [Accessed November 2003].
Johnson, T. 2003. Critical Factors. GolfBusiness Magazine.com. November 2003.
Available on line http://www.golfbusinessmagazine.com/pageview.asp?/doc=944. [Accessed November 2003].
LaPlante, M. G. A Comparative Cost Analysis of Golf Course Maintenance in Georgia.
Univ. of Georgia, Research Bulletin 108, June, 1972.

19
Mothes, J. B. 1995. In the Heartland, Family Farms Make Way for Golf. National Golf Foundation, The Golf Industry in the U.S.: Sales & Marketing Trends, Jupiter, FL, p. 98-99.
National Golf Foundation. 1995. Golfer Segmentation and Marketing Implications for the
90’s. Jupita, FL. National Golf Foundation. Available online at http://www.ngf.org [Accessed May
2002]. Petrick, J. F., S. J. Backman, R. Bixler, and W. C. Norman. “Analysis of Golfer
Motivations and Constraints by Experience Use History.” J. Leisure Research 33(First Quarter 2001):56-72.
Shmanske, S. “The Economics of Golf Course Condition and Beauty.” Atlantic Econ. J.
47(September 1999):301-314. Shmanske, S. “Price Discrimination at the Links.” Contemporary Economic Policy
16(July 1998):368-379. Sports Business Research Network. Golf Participation by Market Size. Available on line
http://www.sbrnet.com/Research/Research.cfm?subRID=199. [Accessed November 2003].
Stepehnson, R. Eye on the Market. GolfBusiness Magazine.com. November 2003.
Available on line http://www.golfbusinessmagazine.com/pageview.asp?/doc=944. [Accessed November 2003].
Tuck, Jr., J. R. “Valuing Private Golf Courses: Where Did the Money Go?” Assessment
J. 5(October 1998):37-42. U.S. Census Bureau. Statistical Abstract of the United States 2001.

20
Table 1. Descriptive Statistics of Variables Variable Unit Mean St. dev. Min. Max.
Golf course age Years 34.8 26.0 3.00 110.
Metropolitan area Yes=1; no=0 .447 .499 0.00 1.00
9 Holes Yes=1; no=0 .123 .330 0.00 1.00
18 Holes Yes=1; no=0 .789 .409 0.00 1.00
27 Holes Yes=1; no=0 .052 .224 0.00 1.00
36 Holes Yes=1; no=0 .026 .160 0.00 1.00
45 Holes Yes=1; no=0 .008 .093 0.00 1.00
Area of turfgrass maintained
Acres 117.2 60.5 1.50 500.00
Area of the entire golf course facility
Acres 222.640 234.190 57.00 1,750.00
Area per hole Acres 7.069 4.402 0.833 27.777
Manager’s experience Years 6.588 6.652 0.170 33.00
Manager education level Years in school
15.47 1.81 11.00 21.00
Number of rounds played at the course
Actual number
28,1436.010 14,047.5498 4,000 82,000
Dining room Yes=1; no=0 .482 .501 0.00 1.00
Swimming pool Yes=1; no=0 .464 .500 0.00 1.00
Tennis club Yes=1; no=0 .421 .495 0.00 1.00
Facility is part of a development plan
Yes=1; no=0 .373 .541 0.00 1.00
Gross margin Dollars 2,382,841 1,423,514 339,925 25,955,000

21
Table 2. Estimation Results of the Golf Course Gross Margin Measure by Ownership Category
Coefficient estimates Variables
Private courses Semi-private courses Public courses
Constant -918210.483 (-1.352)
-2285047.348 (-1.596)
994392.415 (.389)
Golf course age 24489.786*** (3.629)
65241.780** (3.091)
-22666.877 (-.892)
Metropolitan 1283703.179** (2.945)
-863876.979 (-1.226)
1077888.759 (.943)
Rounds -34.454* (-2.311)
54.900* (2.025)
46.659 (1.602)
Area per hole -26844.368*** (-5.037)
150.109 (.024)
-2719.609 (-.131)
Turf-grass size 32166.879***
(5.392)
-904.101
(-.183)
9161.257
.482
Facility size -6856.473*** (-3.650)
2065.157 (1.022)
-5826.748*** (-3.701)
Manager’s experience 2065.240**
(2.677)
1618.673
(.849)
-21160.613
(-.271)
Manager education 743090.002* (1.811)
1952951.878* (2.537)
-516445.103 (-.387)
Dining room -768662.4280 (-1.296)
669166.715 (.628)
1067850.807 (.797)
Swimming pool -204213.919 (-.201)
-2226637.419* (-1.817)
-1053006.397 (-.502)
Tennis club 406888.410 (.366)
585641.865 (.494)
-554543.893 (-.241)
Development plan -528.707 (-.578)
-187760.649 (-.249)
22418.935 (.2841)
R2 .563 .621 .421
Number of observations
48 27 39
*, **, and *** indicate significance at 10%, 5%, and 1%, respectively. Numbers in parentheses are t-statistics.
22
Table 3. Estimation Results of the Gross Margin Measure Using Pooled Data Variable Units Coefficient estimate Constant - -499214.035
(.527) Golf course age Years 18632.570*
(1.934) Metropolitan area Yes = 1, No = 0 510608.940
(1.005) Rounds Number of rounds played 28.868*
(1.872) Area per hole Acres per hole # -5301.478
(-.993) Turf grass size Number of acres 10261*
(2.092) Facility size Number of acres -4394.845***
(-4.201) Manager experience Number of years 176.376
(.884) Manager’s level of education Years in school 232364.859
(.489) Dinning room Yes = 1, No = 0 1148413.038*
(1.792) Swimming pool Yes = 1, No = 0 -381966.060
(-.400) Tennis club Yes = 1, No = 0 -92241.013
(.093) Development plan Yes = 1, No = 0 630.907
(.443) Semi-private course Yes = 1, No = 0 -220188.771
(-.425) Private course Yes = 1, No = 0 -752793.006
(-1.158 ) R2 .259 *, **, and *** indicate significance at 10%, 5%, and 1%, respectively. Numbers in parentheses are t-statistics.