Embed Size (px)
Citation preview

Retrospective Theses and Dissertations Iowa State University Capstones, Theses andDissertations
1984
Factors affecting the production of thermonucleaseby Staphylococcus aureus Z88Deland Jay MyersIowa State University
Follow this and additional works at: https://lib.dr.iastate.edu/rtd
Part of the Microbiology Commons
This Dissertation is brought to you for free and open access by the Iowa State University Capstones, Theses and Dissertations at Iowa State UniversityDigital Repository. It has been accepted for inclusion in Retrospective Theses and Dissertations by an authorized administrator of Iowa State UniversityDigital Repository. For more information, please contact [email protected].
Recommended CitationMyers, Deland Jay, "Factors affecting the production of thermonuclease by Staphylococcus aureus Z88 " (1984). Retrospective Thesesand Dissertations. 9016.https://lib.dr.iastate.edu/rtd/9016

INFORMATION TO USERS
This reproduction was made from a copy of a document sent to us for microfilming. While the most advanced technology has been used to photograph and reproduce this document, the quality of the reproduction is heavily dependent upon the quality of the material submitted.
The following explanation of techniques is provided to help clarify markings or notations which may appear on this reproduction.
1.The sign or "target" for pages apparently lacking from the document photographed is "Missing Page(s)". If it was possible to obtain the missing page(s) or section, they are spliced into the film along with adjacent pages. This may have necessitated cutting througli an image and duplicating adjacent pages to assure complete continuity.
2. When an image on the film is obliterated with a round black mark, it is an indication of either blurred copy because of movement during exposure, duplicate copy, or copyrighted materials that should not have been filmed. For blurred pages, a good image of the page can be found in the adjacent frame. If copyrighted materials were deleted, a target note will appear listing the pages in the adjacent frame.
3. When a map, drawing or chart, etc., is part of the material being photographed, a definite method of "sectioning" the material has been followed. It is customary to begin filming at the upper left hand comer of a large sheet and to continue from left to right in equal sections with small overlaps. If necessary, sectioning is continued again-beginning below the first row and continuing on until complete.
4. For illustrations that cannot be satisfactorily reproduced by xerographic means, photographic prints can be purchased at additional cost and inserted into your xerographic copy. These prints are available upon request from the Dissertations Customer Services Department.
5. Some pages in any document may have indistinct print. In all cases the best available copy has been filmed.
UniversiV Microrilms
International 300 N. Zeeb Road Ann Arbor, Ml 48106


8423661
Myers, Deland Jay
FACTORS AFFECTING THE PRODUCTION OF THERMONUCLEASE BY STAPHYLOCOCCUS AUREUS Z88
Iowa State University PH.D. 1984
University Microfilms
Internâtionâl 300N.ZeebRoad, Ann Arbor,Ml48106


Factors affecting the production of thermonuclease
A Dissertation Submitted to the
Graduate Faculty in Partial Fulfillment of the
Requirements for the Degree of
DOCTOR OF PHILOSOPHY
Major: Food Technology
by Staphylococcus aureus Z88
by
Deland Jay Myers
Approved :
Work
For the Major Department
For the Graduate College
Iowa State University Ames, Iowa
1984
Signature was redacted for privacy.
Signature was redacted for privacy.
Signature was redacted for privacy.

ii
TABLE OF CONTENTS
Page
DEDICATION iv
INTRODUCTION 1
LITERATURE REVIEW 3
The Genus Staphylococcus 3
Discovery of Staphylococcal Food Poisoning 8
Pathology of Staphylococcal Food Poisoning 9
Food Poisoning Outbreaks 10
Food Poisoning Outbreaks in Meats 11
Detection of Enterotoxins 12
Serological Detection of Enterotoxin 13
Screening of Foods for the Presence of Enterotoxin 20
Coagulase Assay 21
Thermonuclease Test 23
MATERIALS AND METHODS 52
Measurement of Thermonuclease Activity 52
Evaluation of Environmental Factors 57
RESULTS AND DISCUSSION 64
Extraction of Thermonuclease from Meat 62
Development of Quantitative Assay for Staphylococcal Thermonuclease 64
Effect of Environmental Conditions on Thezmo-nuclease Production 86
Number of Cells versus Nuclease Production 135
Extraction of Nuclease from Sausage Samples 14 8

iii
Page
SUMMARY AND CONCLUSIONS 150
RECOMMENDATIONS 155
LITERATURE CITED 156
ACKNOWLEDGMENTS 171

iv
DEDICATION
To
Juanita L. Myers
and
Eveadean Myers
Without their love, sacrifice and faith in God, this disser
tation would have been in vain. Words cannot express my
love and respect for you.

1
INTRODUCTION
Interest in rapid tests for the detection of micro
organisms in food products has increased during the past
decade. The reasons for this are the ease, low cost and
speed of the tests. These rapid tests primarily involve
the detection of metabolic products made by the micro
organism in the food; i.e., COg, acids, proteins, etc.
A rapid test for the presence of Staphylococcus aureus
in foods is detection of the enzyme thermonuclease. The pres
ence of this protein provides a very good indicator because
the enzyme: 1) survives the mild heat processing of food
products, 2) has a high correlation with the toxigenicity of
Staphylococcus aureus, and 3) has physical characteristics
that make it specific for Staphylococcus aureus.
A number of questions have been raised concerning the
various methods used to detect this enzyme. Can any of
these tests be used on a daily basis in a quality control
laboratory? Can any of these analyses be quantitative as
well as qualitative, and what advantage is there in
having a quantitative test? A final, very pertinent ques
tion is whether thermonuclease will be produced in all
food systems and environments in which enterotoxin is
produced.
The purpose of this dissertation is an attempt to

2
answer all or part of the aforementioned questions. The
dissertation will address three specific concerns: 1)
modification of a test used for detection of the thermo-
nuclease and the limits of that test; i.e., specificity,
sensitivity, simplicity and quantitative capability, 2)
examination of what effects certain environmental conditions
have on the production of thermonuclease in broth culture,
and 3) compare two methods for extracting nuclease from a
meat product.

3
LITERATURE REVIEW
The Genus Staphylococcus
Staphylococcus is a genus of gram-positive bacteria
in the family Micrococcaceae. This genus consists of non-
motile cocci that grow in irregular clusters (Baird-Parker,
1974). This genus differs from others in the same family
because: 1) it is primarily parasitic, 2) it is faculta
tively anaerobic and produces acid from glucose under
anaerobic conditions, 3) the guanine and cytosine content
is lower in cells of Staphylococcus (30-40%) as compared
to the guanine and cytosine content of cells of the other
genera in the same family, and 4) the chemical composition
of the cell walls differ (Baird-Parker, 1974; Minor and
Marth, 1971) .
Organisms in the genus Staphylococcus grow at an optimum
temperature of 35 to 40°C with a temperature growth range of
6.5° to 46°C and at an optimum pH of 7.0 to 7.5 with a
pH growth range of 4.2 to 9.3 (Baird-Parker, 1974). These
organisms are associated with and usually found on the
skin, skin glands, and mucous membranes of warmblooded
animals.
Staphylococci require an organic source of nitrogen
(amino acids) and two or more vitamins for growth, particu
larly in a synthetic medium (Minor and Marth, 1971) .

4
Staphylococcus aureus
The species of Staphylococcus that is of most concern
and is most commonly studied in food microbiology is
Staphylococcus aureus. The reason for this is that
S. aureus is the only species of this genus implicated
in food poisoning outbreaks. This organism, which can be
destroyed during the heat processing of foods, produces
an enterotoxin that can survive the heat processing of
foods. The toxin, when ingested with the food product,
causes food poisoning (Minor and Marth, 1972).
Characteristics of S. aureus that distinguish this
species from other Staphylococcus species are: 1) the
production of coagulase, and 2) the fermentation of mannitol
(Baird-Parker, 1974; Minor and Marth, 1971). The organism
produces a myriad of extracellular enzymes which are be
lieved to assist the bacterium in infective processes
(Baird-Parker, 1974). Enzymes present in this arsenal
include proteases, lipases, phospholipases, lipoprotein
lipases, esterases, lyases, coagulases, nitrases and heat-
stable nucleases.
Enterotoxin
Staphylococcus aureus causes a food-poisoning syndrome
in man upon the ingestion of preformed enterotoxins present
in the food product. Enterotoxins are single, unbranched

5
water-soluble peptides (M.W. 30,000-35,000) that cause
gastroenteritis by acting on the intestines (Baird-Parker,
1971; Minor and Marth, 1972). To date, there are 8 sero
logically different enterotoxins identified. The 8 are
given the letter-numerical designations of A, B, C^, ,
D, E, and F (Payne and Wood, 1974). The letter designa-
cions for enterotoxin types were established on May 9,
1962 at the American Society for Microbiology Meeting in
Kansas City, Mo. (Gasman et , 1963). Staphylococcal
enterotoxins A and D (SEA and SED) have been implicated in
the majority of the food poisoning outbreaks caused by
S. aureus (Jay, 1978).
Enterotoxins are produced by cells when they grow in
a laboratory medium or a food product. Because the toxin
causing the syndrome is produced outside the body, food
poisoning caused by S. aureus is classified as a food
intoxication (Minor and Marth, 1972) . The minimum number of
cells needed to produce a sufficient quantity of enterotoxins
to cause food poisoning is generally agreed to be >10^
cells/g (Baird-Parker, 1971; Barber and Deibel, 1972;
Genigeorgis et a2., 1971a). Optimum conditions for the pro
duction of all enterotoxin types include: 1) a pH in the
range of 6.U to 8.0, 2) a temperature of 37 to 40°C, 3) an Aw
greater than 0.94, and 4) an environment of high Og tension

6
(Jay, 1978). The point should be made that enterotoxin
production takes place in a more narrow range of environ
mental conditions than the multiplication of S. aureus.
Conditions favorable for the production of specific
enterotoxins differ depending on the type of enterotoxin
being produced (Minor and Marth, 1972) . Not all strains
of S. aureus are capable of producing enterotoxins or are
enterotoxigenic (Baird-Parker, 1971) . On the other hand,
many enterotoxigenic staphylococci are able to produce more
than one type of enterotoxin (Gilbert and Wieneke, 1973;
Payne and Wood, 1974).
Another important physical characteristic of these
enterotoxins is the remarkable heat stability of these
proteins. As a general rule, enterotoxins can be boiled
for 15 minutes without any or only minimal loss in activity.
SEB is the most heat stable of the enterotoxins followed by
SEC and SEA (Bergdoll, 1973).
Enterotoxin A
Enterotoxin type A is the toxin that is most often impli
cated in staphylococcal food poisoning outbreaks. Freeze-
dried enterotoxin type A is described as a fluffy, snow-
white material that is highly hygroscopic and very soluble
in water and salt solutions (Chu et al^., 1966; Minor and
Marth, 1972). The molecular weight has been estimated to be

7
about 34,400. The isoelectric point is pH 6.8. The active
toxin is trypsin resistant to trypsin and has a maximum
absorption at 277 mp (Chu ̂ , 1966).
Staphylococcal enterotoxin type A is produced during
the log phase of growth (Bergdoll et a^., 1974). Optimum
conditions for the production of SEA are pH 7.0 (Car
penter and Silverman, 1976), aeration. Aw >0.90 (Lotter
and Leistner, 1978) and a temperature of 37°C. Entero
toxin A is normally produced in smaller amounts than the
other serological types (Jarvis et al., 1973; Kato et al.,
1966) . For example, SEA can be produced under ideal
conditions in amounts of 5 to 6 yg/ml; quantities of SEB
can be produced at levels of 350 yg/ml (Reiser and Weiss,
1969). SEA, however, appears to be produced in more uni
form amounts from strain to strain (Kato et a2., 1966).
There are several explanations why many researchers
believe that SEA is implicated in more food poisoning
outbreaks than the other serological types. The first
is that most enterotoxigenic S. aureus isolated from
foods produce SEA (Jay, 1978) . In one survey of staphylo
cocci isolated from foods, Payne and Wood (1974) found
that 49% produced enterotoxin A. In another survey. Hall
(1968) found 62.4% of the enterotoxigenic organisms
produced SEA. The second explanation is that the

8
optimal pH range of 6.0 to 7.0 for production of SEA is
commonly encountered in foods (Markus and Silverman,
1970) .
Discovery of Staphylococcal Food Poisoning
Elek (1959) chronicled the history of the discovery of
staphylococcal food poisoning. He lists J. Denys as the
first researcher to correlate a food poisoning case to
staphylococci in 1894. The case involved meat consumed
from a sick cow infected with staphylococci. All the persons
who ate the meat became ill while one person in the family
who did not eat the meat did not become ill. Elek notes
R. Owen as the next significant researcher; Owen corroborated
Denys' findings in 1907. His work involved an acute
gastroenteritis in 19 persons who had consumed dried beef
contaminated with staphylococci. The next investigator
of note was Barber who in 1914 investigated acute gastro
intestinal upsets. He traced these upsets to milk
from cows infected with mastitis. He reproduced this
disease in himself by consuming cream from the milk of
these cows.
The final important investigators in the elucidation of
staphylococcal food poisoning were Dack et a^. (19 30).
These investigators are credited with reporting the first

9
thorough examination of food poisoning by staphylococci
(Elek, 1959) and showed conclusively that some strains of
S. aureus are able to produce food poisoning (Jay, 19 78).
The research involved an outbreak of intestinal upsets
from eating a Christmas cake. After eliminating metallic
poisons or Salmonella as possible causes, they grew
strains of cocci found in the food. The filtrates of these
organisms were toxic to a rabbit and human volunteers.
These cocci were Staphylococcus aureus.
Pathology of Staphyloccal Food Poisoning
After ingestion of food containing sufficient amounts
of enterotoxin, the onset of symptoms occurs in approximate
ly 4 hours with a range of 1 to 6 hours (Jay, 1978; Minor
and Marth, 1972). The time of onset is consistent with the
syndrome for a food intoxication; most symptoms of an intoxi
cation occur within 1 to 10 hrs. The symptoms start with
salivation followed by nausea, vomiting, abdominal cramps
(which are usually quite severe), diarrhea, sweating,
headache, prostration and sometimes a fall in body tempera
ture. Complications can occur, including dehydration,
shock and blood and mucus in the.vomitus and stools. The
symptoms last for 24 to 48 hours; the illness is rarely

10
fatal (Jay, 1978; Minor and Marth, 1972). Treatment in
volves maintaining fluid balance and bed rest.
The mode of action of enterotoxin on the intestines
is unclear. The target areas for binding and inducing
vomiting and diarrhea in humans appear to be the abdominal
viscera and gastrointestinal tract (Jay, 1978; Sugiyama
and Hayama, 1964). The amount of enterotoxin needed to
produce the symptoms in humans is believed to be <1 yg
(Bergdoll, 1972).
Food Poisoning Outbreaks
A wide variety of foods are involved in staphylococcal
food poisoning outbreaks (Banwart, 1981; Jay, 1978) . In a
summary of the foods involved in staphylococcal food
poisoning outbreaks compiled by the CDC for the years 1971-
1976 (Banwart, 1981), the top 3 implicated foods were
meat, poultry and salads in decreasing order. Jay (1978)
listed the usual two "common denominators" of foods impli
cated in these food poisoning outbreaks as convenience
foods made by hand and improper refrigeration after prepara
tion. Despite the wide variety of foods implicated, re
search shows that red meats are involved in over 40% of
cases of staphylococcal food poisoning.

11
Food Poisoning Outbreaks in Meats
Fresh meats are less involved in food poisoning out
breaks than cured or fermented meats. Banwart (1981)
lists the primary reason for this as being that fresh meats
are held under refrigeration because they are perishable.
Also, fresh meats contain more competitive organisms
that can inhibit the growth of S. aureus (Gasman et a2.,
19 63; Troller and Frazier, 1963). Banwart (1981) reported
that cured meats often are mishandled by allowing them
to remain at room temperature and therefore may be impli
cated more often. Peterson et a^. (19 64) noted that NaCl
(an important ingredient in cured products) acts as a
selective agent for staphylococci by being antagonistic
to saprophytic organisms. Data summarized by Bryan (1976)
support this theory by showing that of 251 meat products-
implicated, 76 were ham products.
Cooked meats should be safe if produced so as to con
tain low numbers of organisms and then are held at tempera
tures above 140°F or below 40°F (Jay, 1978).
Food poisoning outbreaks from fermented meats are
the result of bad manufacturing practices (Lee et a2.,
1977) . Lee et a2. (1977) noted that lactic acid bacteria
inhibit growth of S. aureus.

12
Detection of Enterotoxins
Use of animals
The best method to demonstrate the presence of entero-
toxin in foods is to feed the suspected food to humans
(Jay, 1978; Minor and Marth, 1972). Due to the lack of
volunteers (Jay, 1978) and the lack of practicality of the
method (Minor and Marth, 1972), researchers have turned to
animals. Animals that have been used in these analyses in
clude dogs, pigs, pigeons, frogs, and rabbits. The two
animal subjects that have been used most frequently are
kittens and monkeys (Jay, 1978; Minor and Marth, 1972).
The kitten test, developed by Dolman ̂ a2. (19 36)
consists of an intraperitoneal dose of filtrate from an
enterotoxin-producing culture of S. aureus into a kitten.
If the enterotoxin is present, vomiting is produced in
the animal. The problems with the kitten test are: 1) the
lack of consistent sensitivity of kittens to the toxin, and
2) other toxic substances that can also induce vomiting
necessitating the need for heat treatment of the filtrate
(Minor and Marth, 197 2) .
The detection of enterotoxins using monkeys involves
the preparation of a filtrate from the suspected food
and administering the filtrate via a catheter (Jay, 1978).
The advantages of the monkey test are: 1) the filtrate can
be administered orally, 2) the monkeys give the emetic

13
response only in the presence of enterotoxin (Bergdoll,
1972), and 3) young Rhesus monkeys are thought to be the
most susceptible animals to enterotoxins other than man,
although some believe cats are more susceptible (Denny
et al., 1966). Some disadvantages are: 1) the monkeys
may exhibit some variability in their response to oral
doses of enterotoxin (Surgalla et a^., 1953), and 2)
monkeys become less sensitive to the emetic response of
enterotoxin for a short time after the continued administra
tion of the toxin (Sugiyama et a2., 1962; Sugiyama and
Hayama, 1964).
Serological Detection of Enterotoxin
Serological detection of staphylococcal enterotoxin
is based on the theory of antigen-antibody reactions. If
the antigen reacts with the proper antibody at the right
titer, binding will take place. The use of serology
for the detection of enterotoxins presents the investi
gator with two specific problems. The first is the
need for a separate reagent (antibody) to detect each entero
toxin (Bergdoll et al., 1976). Secondly, enterotoxin is
produced or may be present (especially in foods) in small
amounts. This requires either concentration to get de
tectable levels of enterotoxin or an extremely sensitive
test.

14
In the hope of making detection more sensitive and
easier to do, several serological methods have been devised.
These tests include: 1) the Microslide method (Gasman and
Bennett, 1965), 2) an Immunofluorescence method (Stark and
Middaugh, 1969), 3) Radioimmunoassay (Bergdoll and Reiser,
1980) , 4) a Reversed Passive Hemagglutination Assay (Silver
man et a^., 1968), and the 5) Enzyme-linked Immunosorbent
Assay (Freed ̂ , 1982; Notermans ejt al., 1978).
Microslide method
The antigen-antibody precipitation reaction will be
seen as a white band if it takes place in an agar medium
(Minor and Marth, 1971). This concept was developed by
Ouchterlony (1958) into a double-diffusion technique in
Petri plates with the agar containing the antigen and anti
body; Ouchterlony cites Oudin as having applied the same
concept to tubes in 1946. Wadsworth (1957) modified the
method of Ouchterlony by using a miçroscope slide coated with
a thin layer of agar.
Although some enterotoxin detection analyses are per
formed with Ouchterlony plates and tubes (Fung and Wagner,
1970), the most frequently used method is the Wadsworth
method. The microslide method, although considered to be un
reliable and archaic by some, is still widely used in many
laboratories (Freed et a^., 1982) and recognized by the FDA

15
Bacteriological Analytical Manual for Foods (Olson, 1976)
and the Compendium of Methods for the Microbiological
Examination of Foods (Bergdoll and Bennett, 1976).
The basic method involves the application of a thin
layer of agar to a microscope slide. The filtrate and anti
body are added to wells on the slide. Formation of a white
band of precipitate between wells containing filtrate and
antibody constitutes a positive reaction (Bennett and
McClure, 1976; Bergdoll et a2., 1976).
Two major problems with the test have caused many
laboratories to abandon this test in favor of other methods.
The first is that the test is not very sensitive. The lower
limit of sensitivity of this test for foods is approximately
0.1 jjg enterotoxin/ml of filtrate; many researchers have
difficulty detecting enterotoxin at this level (Bergdoll _et ,
1976). The second major problem is the length of time re
quired to obtain results from this test. Because of the
lack of sensitivity of the method, concentration becomes
necessary and takes several days. This need, along with
the incubation time, can require a total time of 3 to 6 days
(Bergdoll ̂ al., 1976). Although some modifications have
been made in the method (Reiser ̂ aJL., 1974), the test
still takes up to 3 days.

16
Fluorescent Antibody Technique
One method that has been proposed as a rapid detec
tion method for the presence of enterotoxin in foods is
the Fluorescent Antibody Technique (FAT). The theory behind
the method involves the development of antibodies to the
enterotoxin and conjugating them to fluorescein isothio-
cynate (Minor and Marth, 1972). The conjugated antiserum
(conjugate) is used to stain smears of broth cultures or
food slurries. These preparations are incubated for a
period of time and then the unreacted conjugate is washed
off (Stark and Middaugh, 1969) . Detection of fluorescence
on the slide when observed under a U.V. microscope indicates
the presence of enterotoxin. The method can be quantitated
by measuring the degree of cell fluorescence (Stark and
Middaugh, 1969).
The major advantage of this test is the lack of the
necessity for concentrating the food extract. This de
creases the amount of time needed to run the test (Stark
and Middaugh, 1969) .
Two problems exist with this method that bear men
tioning. The first and most important problem with the
test is sensitivity. Genigeorgis and Sadler (19 66b) detec
ted as little as 0.05 yg enterotoxin/ml while Bergdoll
(1970) lists the sensitivity at only 1 yg/ml. Another
problem with the method is the need for expensive equip
ment; namely, the U.V. microscope.

17
Reversed Passive Hemagglutination Assay and the Radioimmunoassay ~ ~
Two methods have been proposed that have proven to in
crease the sensitivity of detecting enterotoxin. The
methods are the Reversed Passive Hemagglutination Assay
(RPHA) and the Radioimmunoassay (RIA) (Bergdoll et al.,
1976; Bergdoll and Reiser, 1980).
The RPHA is based on the adsorption of specific
antibody to tannic acid-treated sheep red blood cells.
When these cells come into contact with enterotoxin, a
hemagglutination reaction occurs (Silverman e^ al.,
1968) .
There are a number of advantages to using the RPHA.
The test is very sensitive and can detect levels of 1.5 ng
enterotoxin/ml of food without concentration of the food
sample (Bergdoll et a2., 1976) . Since no concentration of
food extracts is necessary, the method is fast and can be
done in only a few hours (Silverman et ̂ ., 1968). Bergdoll
et al. (1976) list two problems encountered with the test
that have caused many researchers to become disillusioned
with the RPHA. The first is the nonadsorption of the anti
body to the red blood cells which results in the absence of
agglutination of the cells in the presence of enterotoxin;
this yields false-positive results. This problem has been
related to low titer antisera. The second problem is the
nonspecific agglutination of proteins in the food extracts.

18
Although the problem can be resolved by the use of trypsin
or by partial purification of the food extract (Reiser
et al., 1974), it also increases the time needed to perform
the analysis. Bennett et a]^. (1973) along with Bergdoll
et al. (1976) concluded that the method was unreliable.
The radioimmunoassay (RIA) is a method that is ex
tremely sensitive for the detection of enterotoxin. Berg
doll and Reiser (1980) credit Dr. Robert A. Monroe for
initiating the use of the RIA technique for detection of
staphylococcal enterotoxins. Bergdoll and Reiser (1980)
describe the basic RIA technique as a given antigen (or
unknown sample) competing with a known amount of the same
antigen labeled with a radioactive nucleide. The amount
of antigen present is calculated from a standard curve
prepared from results obtained when known amounts of un
labeled antigen are used. This technique is the basis for
many different tests (Miller et a2., 1978).
Conflicting reports have been published on the sensi
tivity of this technique. Bennett et al. (1973) detected
a minimum of 10 ng of SEA/g of food while Johnson et al.
(197 3) were able to detect 1 ng SEA/g of food. Bergdoll
and Reiser (1980) list the sensitivity of the method of
1 ng toxin/g of food and the ability to perform the
analysis in one day as advantages of this technique.
Bergdoll and Reiser (1980) list two problems which de-

19
ters the RIA test from becoming a widely used method. The
first is the need for expensive equipment and radioactive
materials that many laboratories may have a problem pro
viding. The second is the need for purified enterotoxins
which are rare and very expensive. Kuo and Silverman
(1980) also list nonspecific adsorption as a problem.
Enzyme-Linked Immunosorbent Assay
The method that presently is showing promise for the
detection of enterotoxins is the Enzyme-Linked Immunosorbent
Assay (ELISA). The key selling point of this assay is that
it is as sensitive and as rapid as the RIA, <1 ng/g food,
without the use of radioactive materials (Freed et al.,
1982; Kuo and Silverman, 1980).
Kuo and Silverman (1980) stated that the principle of
their ELISA method is identical with the RIA. The method,
like the RIA (Bergdoll and Reiser, 1980), basically involves
the antigen (or unknown sample) competing with a known anti-
gen-enzyme conjugate for antibody sites. The amount of anti
gen present is calculated from a standard curve established
with known amounts of antigen. The major difference between
the RIA and the ELISA is that the RIA uses a radioactive
nucleide that is measured; in the ELISA method, the meas
urement is related to color formation by the reaction of
the enzyme and the substrate with both relating to the
amount of toxin present (Freed et al., 1982; Kuo and Silver-

20
man, 1980).
Kuo and Silverman (1980) list the advantage of the
ELISA as: 1) no radioactive compounds are needed, 2) common
equipment can be used, and 3) a positive reaction can be
visually evaluated. They also state that the major dis
advantage of the assay is the problem of nonspecific
adsorption of proteins.
Screening of Foods for the Presence of Enterotoxin
A major trend in research on S. aureus in foods is
the use of assays that would serve as an indicator for the
presence of enterotoxin. Tatini ̂ (1976) state that
direct detection of enterotoxins in foods is expensive and
is based on methods presently not feasible. They list
five qualities that a substance should meet to qualify as
an indicator for enterotoxin; it should: 1) be rapidly
and inexpensively assayed for,. 2) be produced by all strains
of S. aureus, including all enterotoxigenic strains, 3) be
produced only by S. aureus or can be differentiated by
some other test (pH optimum, etc.) , 4) be produced in de
tectable amounts under conditions that permit the growth
of S. aureus or the production of detectable amounts of
enterotoxins, and 5) be able to survive processing condi
tions to the same extent that enterotoxins do.

21
Many substances produced by S. aureus have been
studied in an attempt to associate their presence with
the presence of enterotoxins; they include gelatinase, phos
phatase, lysozyme, lecithinase, lipase, thermonuclease,
fermentation of carbohydrates, and coagulase (Jay, 1978;
Lachica et , 1969; Minor and Marth, 1971; Niskanen
and Nurmi, 19 77). The only substances that have been em
ployed with any success have been coagulase and thermo
nuclease. Two additional properties, production of protein
A and fibrinogen affinity, are presently of interest to
some researchers (Carret et al., 1982).
Coagulase Assay
Coagulase is an extracellular enzyme produced by
S. aureus ; it clots citrated or oxylated rabbit or human
blood plasma (Minor and Marth, 1971). The enzyme has throm-
bokinase-like activity in that it initiates the conversion
of fibrinogen to fibrin. The bacterial cells become
coated with fibrin and then clump together forming a
clot-like appearance in the test procedure (Clancy, 1974;
Willett, 1980).
The coagulase test is carried out by adding citrated
rabbit or human blood plasma to a broth culture (in a
tube or on a slide) and incubating for a suitable period of
time. If the enzyme is present, a fibrin clot is formed

22
(Clancy, 1974).
Early studies on coagulase and enterotoxin production
(Evans and Niven, 1950) established the belief that almost
all food-poisoning strains of S. aureus were coagulase-posi-
tive. Although much evidence has been accumulated to show
that this was a false assumption (Willett, 1980), many re
searchers still agree that a high percentage of the strains
of S. aureus that cause food poisoning produce coagulase
(Baird-Parker, 1974; Gramoli and Wilkinson, 1978; Jay,
19 78) . The production of coagulase is not necessarily a
stable characteristic in all cultures. Some cultures have
been reported to lose this trait during laboratory storage
(Lachica et aJ^., 1969) .
Two major problems are encountered with the coagulase
test. The first problem relates to false-positive results.
Some bacteria, particularly S. epidermidis, produce pseudo-
coagulases that coagulate blood plasma (Wegrzynowicz et a2.,
1980). Baird-Parker (1965) reported that citrate-utilizing
bacteria such as Pseudomonas aeruginosa, Serratia marcescens
and Streptococcus faecalis can cause false positives in this
test. Rayman e;t a2. (1975) cited the second major problem
as the difficulty in interpreting the results of the test.
The tube coagulase test is semiquantitative with the degree
of clotting measured by +1 (lowest degree) to +4 (highest
degree). The test is very subjective and there is a question

23
as to what degree of clotting exhibits a positive test.
The subjective nature of this test could lead to an in
accurate interpretation of the results (Barry et .,
1973; Rayman et a2., 1975).
A significant problem concerning the coagulase
assay for foods is the need for viable organisms. The
assay can be performed in raw, unprocessed products but if
the organisms have been killed by processing, the assay
cannot be used. Enterotoxin, which can withstand processing
conditions, can still be present. Another analysis is then
necessary for the screening of processed foods for entero-
toxins.
Thermonuclease Test
Enzyme
In microbial literature, reference to thermonuclease
generally means the extracellular enzyme produced by patho
genic strains of S. aureus (Anfinsen et al., 1971). The
enzyme is a small, globular protein with a molecular
weight of 17,000 and consists of 149 amino acids. The
enzyme, described as a 3'-nucleotidohydrolase that can hydro-
lyze RNA or DNA, cleaves the 5'-phosphoryl diester with exo-
and endo-activity. The result of this reaction produces 3'-
phosphomononucleotides and dinucleotides (Cuatrecasas et .,
1967). The enzyme is most reactive at the sugars attached to

24
adenine-thymine but can cause some breakdown of those sugars
attached to cytosine and guanine (Anfinsen et a2., 1971).
The greater activity of the enzyme on DNA than RNA is be
lieved to be based on the base preference (Cuatrecasas
et al., 1967). The enzyme has even greater activity on
denatured DNA (Anfinsen et a2., 1971; Cuatrecasas et al.,
1967).
One important physical property of the enzyme is its
+2 dependence on Ca (Anfinsen et a^., 1971; Cuatrecasas
et al., 1967; Heins et aJ.; 1967) . In fact, the pH optimum
of the enzyme, which is between 9 and 10, depends on the
+2 concentration of Ca (Cuatrecasas et al., 1967). The
optimum temperature is reported to be 50°C (Kamman and
Tatini, 1977).
Thermostability or the maintenance of activity at high
temperatures is the most remarkable physical property of
this enzyme. In one of the earliest studies on this enzyme,
Cunningham et al. (1956) reported that the enzyme with
stands boiling for 15 minutes without any appreciable loss
in activity. Cuatrecasas et a2. (1967) reported that the
enzyme had no loss of activity after boiling for 20 minutes
and Chesbro and Auborn (1967) reported that the enzyme was
stable for 15 minutes at 121°C. Enzyme stability is en-
+2 handed by the presence of Ca ion, serum albumin, and
nucleotide breakdown products (Cuatrecasas et a2., 1967;

25
Sulkowski and Laskowski, 1968).
The enzyme is produced by S. aureus early during the
log phase of growth and continues into the stationary phase
(Carpenter and Silverman, 1976; Erickson and Deibel, 1973a).
Most researchers agree that at least 10^ cells/ml are
needed to produce nuclease in detectable amounts (Koupal
and Deibel, 1978; Tatini et a^., 1975, 1976) .
Arvidson et a2. (1971) showed that nuclease is produced
under more restrictive conditions than those for growth.
Optimum conditions for the production of the enzyme are
difficult to determine. These optimum conditions will dif
fer based on the growth conditions such as the type of
medium used, amount of aeration, strain used, and the
+2 concentration of Ca ion (Arvidson et , 1971; Fox and
Holtman, 1968; Tatini et al., 1976; Weckman and Catlin,
1957). Most researchers agree, however, that conditions
that stimulate the production of nucleases are conditions
that stimulate large numbers of cells of S. aureus (>10^
cells/ml). As conditions become less favorable for the
growth of the organisms, less, if any, nuclease is pro
duced (Arvidson et ., 1971) .
Nuclease vs. enterotoxin
The primary significance of thermonuclease (DNAse) in
food microbiology research is screening for enterotoxin in
foods (Tatini et a^., 1976). The reason for assaying for

26
nuclease as an indicator for the presence of enterotoxin is
the high correlation between the presence of enterotoxin and
nuclease (Cunningham et a^., 1956; Niskanen and Nurmi, 1977).
Lachica et a^. (1969) reported that 95% of the enterotoxin-
producers elaborated nuclease. Tatini et a^. (1976) reported
data showing that 93.3% of the enterotoxigenic strains pro
duced nuclease. In addition to the high nuclease-entero-
toxin correlation. Cords and Tatini (1973) and Ibrahim and
Baldock (1981) reported that nuclease can be detected in
cheese before enterotoxin and in the presence of lower num
bers of cells. Lachica et al. (1972c) and Ibrahim and Bal
dock (1981) reported that nuclease, like enterotoxin, is
stable under food storage conditions. Some studies have
demonstrated that nuclease production is commensurate with
enterotoxin production and factors that affect toxin produc
tion affect nuclease production (Niskanen and Nurmi, 1976;
Tatini et , 1975) . In fact, Niskanen and Nurmi (1977)
and Weckman and Catlin (19 57) reported that strong DNAse
activity was correlated with highly toxigenic strains.
There are several drawbacks in using the thermonuclease
assay for screening for the presence of enterotoxin. One
limitation is that not all enterotoxin-producers elaborate
DNAse (Rayman et a^., 1975) . Jarvis and Lawrence (1971)
suggested that nuclease production may be under a different

27
metabolic control than enterotoxin. Todd et al. (1981)
reported finding enterotoxin in a food product when no
thermonuclease was detected. Park et (1978) have sug
gested that all foods may not be adaptable to the thermo
nuclease assay.
Other nuclease-producing organisms
One major limitation to the thermonuclease test is
the presence of other nucleases produced by organisms other
than S. aureus. Microorganisms other than S. aureus that
produce nucleases include species from the genera Bacillus,
Serratia, Streptococcus, Micrococcus, Lactobacillus,
Staphylococcus and Pseudomonas (Jeffries et a^.^ 1957;
Lachica and Deibel, 1969; Miller ̂ al., 1971). Fortu
nately, most of the nucleases these other organisms produce
are not thermostable (Lachica and Deibel, 1969) and do not
cause a problem in the thermonuclease assay.
Other microorganisms that produce thermostable nucleases
are Streptococcus faecalis var. faecalis, S. faecalis var.
zymogenes (Batish et al., 1982), Staphylococcus epidermidis
(Gramoli and Wilkinson, 1978) and "minor" species of Staphylo
coccus (intermedius and hyicus) (Devriese and Van De Kerckhove,
1979) . The nucleases that these organisms produce can be
distinguished from S. aureus. Batish et al. (1982) reported
that the optimum pH for the enterococcal nuclease is 6.7 as

28
opposed to the alkaline pH (9.0-10.0) of the thermonuclease
from S. aureus and can be used as a distinguishing character
istic. The nucleases produced by the other species of
Staphylococcus are produced in smaller amounts and give weak
reactions in the thermonuclease tests (Devriese and Van De
Kerckhove, 1979). This difference helps to distinguish the
nucleases of S. aureus from those of other species of
Staphylococcus.
Inactivation of thermonuclease
Another factor concerning the use of the thermonuclease
assay as an indicator of enterotoxin in foods is the possi
bility of proteolytic activity breaking down the enzyme
while in the food product. Such activity would cause
negative results in the assay although enterotoxin would
be present. Potential sources of proteolytic enzymes that
could degrade the thermonuclease are microorganisms present
in the food products.
Some organisms are added to the food product, for
example in some types of cheeses, to produce proteolysis
for organoleptic purposes and are a potential source of
proteolytic enzymes that could degrade the thermonuclease
(Tatini et a^., 1976). The food product may also have
organisms in the normal flora that could produce proteoly
tic enzymes capable of degrading the thermonuclease.
Organisms of this latter group that have been shown to

29
produce such enzymes are Streptococcus faecalis subsp.
liquefaciens and Bacillus subtilis (Lachica et a^., 1972c;
Medwid and Grant, 1980). Medwid and Grant (1980) charac
terized the factor from S. faecalis subsp. liquefaciens
as heat labile, nondialyzable and optimally active at 55°C
and pH 7.0.
Two investigators believe that the potential problem
of thermonuclease degradation is not an insurmountable one.
Lachica et al. (1972c) stated that the enzyme is stabilized
against proteolytic cleavage near the binding site by the
+2 presence of Ca and by nucleotides which may be present
in many foods, particularly those of animal origin. Fur
thermore, Cords and Tatini (1973) explain that the in-
activation of the thermonuclease could be detected by
adding thermonuclease to the product and reassaying after
incubation at an appropriate temperature.
Coagulase test vs. thermonuclease test
Many researchers believe that•assaying for thermo
nuclease is superior to the coagulase assay as an
indicator of the presence of enterotoxin or the patho
genicity of S. aureus. Barry e^ al. (1973) and Menzies
(1977) considered the thermonuclease assay to be simple,
less time-consuming and less expensive when compared to the
coagulase test. Jasper (1973) states that the thermo-

30
nuclease assay was just as reliable as the coagulase assay in
his study. Furthermore, Lachica et al. (1969) reported that
a greater percentage of the enterotoxin-producers he studied
were thermonuclease producers (93%) than produced coagulase.
He suggested this as a good reason for using the thermo
nuclease assay instead of the coagulase assay. Other ad
vantages in using the thermonuclease assay is that the
coagulase property can be lost during storage (Lachica et a2.,
1969) while the thermonuclease is stable during storage
(Lachica et aJ^., 1972c). Also, the thermonuclease assay can
be used on pre- and post-processed foods (Tatini et aJ., 1976);
the coagulase test can only be used on preprocessed foods.
Because the thermonuclease assay, like the coagulase
test, is not 100% accurate, Barry et al. (1973) suggested
that the two tests be used to complement each other.
Rayman et al. (1975) also suggested that assaying for
thermonuclease would be very useful for confirming un
sure coagulase results. They reported that there was a
correlation between coagulase and thermonuclease produc
tion; Weckman and Catlin (1957) reinforced this theory by
reporting that more coagulase-positive strains produced
thermonuclease than do coagulase-negative strains.

31
Thermonuclease assays
Assays for thermonuclease activity all contain three
basic components. The first is a source of DNA in a liquid
or an agar-based medium- The second is a heat treatment
of the suspected material. When assaying for unpurified
nuclease produced by S. aureus, the sample is usually a
supernatant of a broth culture or' of a blended mixture of
the food product. The material is heated for 10 or 15
minutes at 100°C to remove any heat labile nucleases that
may interfere with the assay.
The third and final component is a means of detecting
the activity of the enzyme. This has been accomplished by
three basic techniques. The first is based on the spectro-
photometric measurement of absorption of DNA (Alexander
et al., 1961; Kunitz, 1950) or a turbid colloid (Houck,
1959) . In measuring the absorption of DNA, the biological
compound is known to absorb maximally at 260 nm due to the
presence of nucleotides (Clark and Switzer, 1977). When
measuring the absorbance of DNA in a system, the absorp
tion at 260 nm increases as the nucleic acid is degraded
and nucleotides are released. The increase in absorption
of 260 nm is proportional to the activity of the thermo
nuclease (Clark and Switzer, 1977). The method of measuring
the turbid colloid is based on the observation that

32
polymerized nucleic acid will form a stable, turbid colloid
in acidified serum albumin (Houck, 1958). When the colloid
is exposed to the nuclease, it will be broken down and the
absence of the colloid can be measured by a difference in
absorption. The difference in absorption is proportional
to the activity of the enzyme.
Spectrophotometric assay; DNA absorption
The spectrophotometric assay for thermonuclease is
usually based on light absorption at 260 nm of nucleotides
produced from DNA. Another method, however, assays thermo
nuclease activity by measuring the deoxyribose component
(as opposed to the nucleotide component) at a wavelength of
600 nm (Burton, 1956). As the DNA is broken down, this
component accumulates causing an increase in absorption that
is proportional to enzyme activity. This procedure has been
described as tedious, time-consuming (Wadstrom, 1967) and not
as reproducible as measuring nucleotide absorption (Arvidson
and Holme, 1971).
The spectrophotometric method for assaying thermo
nuclease in foods was used by Chesbro and Auborn (1967).
The supernatant of a suspected sample was added to a DNA-
containing glycine buffer (CaClg, glycine) adjusted to pH
8.6 and allowed to react for 20 to 30 minutes at 37°C. The
absorption of the mixture was then measured at 260 nm. An in

33
crease in adsorption at 260 nm represented enzyme activity.
The advantages of the spectrophotometric method are:
1) accuracy (Kamman and Tatini, 1977), 2) sensitivity, and
3) ability to quantitate. The disadvantages of the method
are: 1) laborious and time-consuming (Koupal and Deibel,
1978; Lachica et a2., 1972a; Sharpe and Woodrow, 1971), 2)
need for expensive equipment (Kamman and Tatini, 1977),
and 3) ineffective with weak nuclease activity or in the
presence of excessive impurities (Kamman and Tatini, 1977;
Lachica et a^. , 1972a).
Spectrophotometric assay: Turbidimetric assay
Another spectrophotometric assay is based on the light
absorption of a turbid colloidal suspension formed by poly
merized nucleic acid in acidified serum albumin (Houck,
1959) .
The method of Houck (1959) modified by Erickson and
Deibel (1973b) involves the addition of the enzyme to a
+2 DNA-containing borate buffer (boric acid, borax, Ca ) ad
justed to pH 9.0. After a reaction period of 15 minutes at
37°C, the reaction is stopped by adding 4N HCl which also
develops the turbid colloid. The absorbance is read at
600 nm.
The advantages of this assay as noted by Erickson
and Deibel (19 73b) are; 1) it is sensitive, 2) it

34
requires no special apparatus or technical skill, and 3)
it is unaffected by the purity of the enzyme. The dis
advantages of the assay are essentially the same as for the
other spectrophotometric assay; namely, 1) the need for
expensive equipment and 2) it is laborious and time-
consuming.
The second method is visual and consists of three
types: colorimetric, fluorescent, and acid precipitation.
The colorimetric method involves the incorporation of a dye
into a medium containing DNA. Toluidine blue and methyl
green are two dyes that are used in this method. The DNA
associates with the dye yielding a color based on the wave
length of light absorbed. When the enzyme breaks down the
DNA, the dye is disassociated from the DNA causing a color
change and indicating nuclease activity. The fluorescent
method is basically the same as the colorimetric method,
except that a decrease in fluorescence, indicates nuclease
activity. The acid precipitation method involves the
activity of nuclease on DNA in the system followed by the
addition of strong HCl (^1 N) which precipitates the
nucleate salts (Jeffries et ., 1957). Nuclease activity
is shown by clear areas in the agar where the nuclease has
broken down the DNA.

35
Colorimetric method: Toluidine blue
This assay is based on the unique reaction of toluidine
blue 0 (TB) with DNA. Toluidine blue has the ability of
absorbing maximally at different wavelengths under dif
ferent conditions (Lachica et a_l., 1971; Michaelis and
Granick, 1945). Toluidine blue alone has a maximum ab-
sorbance at 625 nm. It associates with DNA by inter
calating between bases and the color is blue because light
is absorbed at a longer wavelength. When the DNA is de
graded, the dye associates with the agar and is pink because
light is absorbed at a shorter wavelength. The color change
is used as an indication of nuclease activity (Lachica
et al., 1971).
A method developed by Lachica et a^. (1971, 1972a)
involves the addition of the enzyme or unknown supernatant
of sample to a well in toluidine blue-DNA agar (DNA, TB,
agar, CaClg and NaCl) at pH 9.0. The plate is incubated
for 3 hours at 37°C. The presence of pink halos indicates
nuclease activity. The sensitivity of the assay is 5 ng/ml.
The advantages of the assay are; 1) low detection limit,
2) speed, and 3) no special techniques or equipment are
required (Lachica et al., 1971, 1972a). The major dis
advantage of the assay is the problem of improper color de
velopment (Emswiler-Rose et al., 1980; Koupal and Deibel,

36
1978) which may be due to protein interference (Lachica
et al., 1972b).
Colorimetric method: Methyl green
This nuclease assay is based on the interaction of a
dye, methyl green, with DNA. Methyl green is capable of
staining polymerized DNA (Kurnick, 1950) . When the DNA is
depolymerized or degraded, the color disappears; the
degree of color disappearance can be related to nuclease
activity (Horney and Webster, 1971). This method has been
applied to spectrophotometric assays of nuclease activity
(Horney and Webster, 1971) but the bulk of the research in
volves using media containing an incorporated methyl green-
DNA complex (Horney and Webster, 1971; Smith et , 1969).
A method developed by Horney and Webster (1971) for
nucleases other than S. aureus involves the addition of the
enzyme or suspected sample to a well in DNA-methyl green
agar (methyl green, DNA, sodium acetate, EDTA, sodium phos
phate, MgClg, Tris-HCl) at pH 6.0 (Kunitz, 1950) followed
by incubation for 6 hours at 37°C. The detection limit of
the assay was <1 ng/ml.
The advantages of the assay are: 1) low detection limit,
2) simple equipment and no special techniques required, 3)
impure systems can be used (Lachica et aJ., 1972a), and 4) the
test can be quantitated (Horney and Webster, 1971). The

37
major disadvantages of the assay are the need for highly
polymerized DNA (Lachica et , 1972a) and the pH of 6.5
which is out of the optimum range for thermonuclease from
S. aureus which has an optimal activity in the range pH 9 to
10. The methyl green complex has greatest stability at
pH 7.5.
Fluorescent method; Acridine orange
In this assay, acridine orange dye intercalates with
DNA or slips in between adjacent base pairs (Stryer, 1981).
Since the molecule fluoresces under ultraviolet light, fluo
rescence indicates the location of DNA. The activity of the
enzyme is measured by a decrease in fluorescence as a
result of breakdown of DNA (Lachica and Deibel, 1969;
Lanyi and Lederberg, 1966).
A method developed by Lachica and Deibel (1969) in
volves the addition of supernatant from a sample (boiled
for 15 minutes) to a paper filter disc and overlaying it
with acridine orange-deoxyribonucleate agar (DNA salt,
KHPO^, agar, and acridine orange), adjusting to pH 9.0 and
incubating for 2 to 5 hours at 37°C. Halos of clearing
when viewed with a u.V. light are indicative of nuclease
activity.
The advantages of the assay are that it is rapid and
could be used in MPN procedures for food products (Lachica

38
and Deibel, 1969) . The obvious disadvantage is the use of
the mutagenic dye and ultraviolet light (Lachica et al.,
1971).
Acid precipitation This nuclease assay is based
on the acid precipitation of the salts of DNA. In media
containing DNA, the nucleate salts react with acid to produce
a precipitate (Jeffries et al., 1957). When DNA has been
degraded, no reaction takes place; the amount of precipi
tate can be related to enzymatic activity.
A method developed by Koupal and Deibel (1978)
involves the addition of the enzyme or unknown supernatant
to a well in Koupal-Deibel DNA agar (DNA, agar, NaCl,
trizma base, and CaCl^) at pH 9.0. The preparation is incu
bated at 50°C for 1 hour; the plate is then flooded with
4N HCl to precipitate any unhydrolyzed DNA. Clear areas
represent nuclease activity with the minimum detection
level consistently at 10 ng/ml or g of food product.
The advantages of the assay are: 1) simplicity and
rapidity, 2) easy reproducibility of results, 3) simple
equipment needed, and 4) pure and impure systems can be used
(Emswiler-Rose et a2^. , 1980; Jarvis and Lawrence, 1969:
Koupal and Deibel, 1978). The disadvantages of the test
are: 1) the need for strong acid, 2) lack of quantitation
(Koupal and Deibel, 1978), and 3) protein interference
(Lachica et al., 1972a).

39
A method that has not been used extensively is the
radioactive-labeled DNA complex (Sharpe and Woodrow,
1971). To determine nuclease activity, the complex is added
to a liquid buffer system containing the enzyme. After a
suitable reaction time, the complex is removed and the re
leased is proportional to the nuclease activity.
Thermonuclease test in meats
The thermonuclease test for meat and meat products
is suggested particularly for processed meats when no
viable S. aureus are present (Koupal and Deibel, 1978;
Tatini et aJ., 1976). Even when viable organisms are
present, the thermonuclease test provides a very rapid
assay to determine if S. aureus has grown to numbers >10^
cells/g (Tatini et al., 1976).
There are two basic methods to determine presence of
thermonuclease in meats; 1) by the direct application of the
meat product to the detection medium, or 2) by the extrac
tion of the nuclease from the meat product. The thermo
nuclease assays that are used by most investigators today
are the metachromatic agar-diffusion (MAD) method of
Lachica ̂ al. (1971, 1972b) and the acid precipitation
method developed by Koupal and Deibel (KD) (1978).
Lachica et al. (1972b) reported a direct food applica
tion in their MAD assay. Naturally and artificially con-

40
'taminated meat products were cut into small 5-mg portions,
steamed for 15 min and placed on the toluidine blue-O-DNA
(TB) medium. The medium was incubated for 3 hours at 37°C;
the appearance of bright pink halos indicated nuclease
activity. Problems with the assay included the development
of greenish halos with some assays and improper pink color
development (Emswiler-Rose et al., 1980; Lachica et al.,
19 72b). Another direct application method used by Emswiler-
Rose et al. (1980) involved the use of the casings of contami
nated sausages on TB and KD agars. This method was based
on research by Barber and Deibel (1972) that showed that most
of the growth and toxin production of S. aureus exists in the
outermost part of the sausage where the oxygen tension is
highest. They reported that the KD agar gave more consistent
results than the TB agar.
Two basic procedures are used today to extract thermo-
nuclease from foods. The method of Cords and Tatini
(1973) starts with the blending of 20 g of food sample fol
lowed by pK adjustment to 4.5. The mixture is centri-
fuged at 23,500 x g for 15 minutes at 5°C. Cold 3M tri
chloroacetic acid is added to the supernatant. The prepa
ration is centrifuged, adjusted to pH 8.5, boiled and
cooled. The resultant solution is then used in the thermo-
nuclease assay. This extraction procedure has been used
predominantly in the MAD assay (Niskanen and Nurmi, 1976;

41
Park ̂ a]^., 1978, 1979; Tatini et , 1976) ,
The Koupal-Deibel extraction procedure is shorter
and consists of blending 15 to 20 g of sample with
30 to 40 ml of water followed by the adjustment of the pH
to 5.5. The mixture is boiled for 20 min, cooled and
centrifuged for 45 min at 7500 rpm. The supernatant is
used in the thermonuclease assay.
Park et aJ^. (1978, 1979) found the extraction
procedure of Cords and Tatini (1973) to. be particularly
applicable to meats. They state this is not true for
all foods, particularly egg-containing products. A
modified extraction method has been developed to fa
cilitate the extraction of thermonuclease from these
other foods.
Staphylococcus aureus in meat
The presence of S. aureus and the potential for food
poisoning from this organism have always been a problem
in meats. The organism is part of the normal flora of
meats. In fact, the major source of S. aureus in the
environment is from warm-blooded animals (Baird-Parker,
1974) ; Jay (1978) notes that many domestic animals
harbor S. aureus. The factors that control the num
bers of S. aureus in meat and the presence of entero-
toxin are: 1) pH, 2) the oxidation/reduction potential, 3)
temperature, 4) Aw, and 5) the numbers and types of competing

42
organisms present (Jay, 1978). Other factors, not inherent
in the meat product, that also affect the number of
S. aureus in the meat product are: 1) the way the product
is handled, packaged^ and stored and 2) the cut of meat
(Jay, 1978).
Staphylococcus aureus in fresh meats
When an animal is killed and the muscle is converted
into meat, several important chemical changes take place
to influence the growth of S. aureus and other bacteria.
The major changes include: 1) the loss of oxygen in the
muscle, 2) the pH drop that takes place due to the break
down of glycogen to lactic acid, and 3) the absence of
the immune response due to the absence of the lymphatic
system and circulating white blood cells (Jay, 1978; Forrest,
1975) .
The depletion of O2 in the muscle causes the oxygen
tension to be the highest at the surface and reduced
in the interior of the meat. Although S. aureus is a
facultative anaerobe able to grow in the absence of
air (Baird-Parker, 1974), the organism is known to proliferate
and produce toxins to a greater extent in the presence of
0^ (Arvidson et a^., 1971; Barber and Deibel, 1972).
Perhaps the most important change in the muscle that
could potentially affect S. aureus is the drop in pH

43
(Forrest, 1975) . The change in pH has been described
as a gradual drop from 7.0 to 5.6 in 6 to 8 hours
(Forrest, 1975). This drop in pH alone does not affect
S^. aureus because it is able to survive and grow at a pH
as low as 4.2 (Baird-Parker, 1974; Barber and Deibel, 1972;
Lechowich et al., 1956).
An inherent factor of the meat that controls growth
of S. aureus is the normal flora (McCoy and Faber, 19 66;
Peterson et a2., 1962, 1964). The major sources of organisms
in fresh meats are; 1) animal lymph nodes, 2) knife used
for exsanguination, 3) hide of the animal, 4) intesti
nal tract, 5) hands of the handlers, 6) cutting knives,
and 7) storage bins (Ayres, 1955). Some of the common
bacteria found on meats include the genera Pseudomonas,
Moraxella, Escherichia, Serratia, Streptococcus, and
Proteus (Ayres, 1960; Jay, 1978). Gasman et a^. (1963)
demonstrated the ability of saprophytic organisms to in
hibit growth of S. aureus by showing how well the pathogen
grew after the removal of these organisms by heating.
Many of the saprophytic organisms found on meats
successfully outcompete S. aureus for nutrients (Troller
and Frazier, 1963). Troller and Frazier (1963) list the
genera of these competing organisms as Serratia and Pseudo-
monas. The inhibition of S. aureus by these organisms is

44
dependent on environmental conditions such as pH, tempera
ture, etc., S. aureus, of course, competes most effectively
at its optimum growth conditions (McCoy and Faber, 1966;
Troller and Frazier, 1963).
Some organisms found on meats control and inhibit
the growth of S. aureus by producing inhibitory substances
(Troller and Frazier, 1963). Troller and Frazier (1963)
list these organisms as Bacillus cereus, Proteus vulgaris,
E. coli and Aerobacter aerogenes. These organisms can produce
antibiotic substances that are Seitz-filterable, dialyzable
and stable at 90°C for 10 min (Troller and Frazier,
1963) .
Staphylococcus aureus in processed meats
Processed meats are made by the use of procedures that
alter the characteristics of fresh meat. These procedures
include salting, smoking, precooking and fermentation
(Forrest, 1975). Processing of meats has evolved as a means
of preserving meat; today, however, it is primarily used
for the flavor. Many of these processing procedures have
a direct effect on the survival and growth of S. aureus
in meats. Two important processes are: curing and fermen
tation.

45
Curing
Meat curing is defined as the application of salt,
color-fixing ingredients, and seasonings to meât'in order
to impart unique properties to the end product (Forrest,
1975).
1. Nitrite. Desrosier and Desrosier (1977) list the
functions of nitrite in meat curing as stabilization of
color, development of flavor, inhibition of growth of a
number of food poisoning and spoilage microorganisms and the
retardation of development of rancidity. Nitrite may be
directly added to foods or nitrate may be added. The latter
compound is then reduced to nitrite by microbial action.
The common amount of nitrite allowed in meats by the
USDA is 156 ppm (Forrest, 1975) .
The degree of the effect of nitrite on S. aureus in
cured meats is controlled by environmental conditions,
namely pH and the presence of Og (Buchanan and Solberg,
1972; Lechowich et al., 1956). Low pH is more effective
in preventing growth (Buchanan and Solberg, 1972; Lecho
wich et ̂ ., 1956; Tarr, 1941) . Castellani and Niven
(1955) reported that as the pH of a medium is lowered by
one unit, the bacteriostatic effect of nitrite is increased
10-fold.
The increase in the bacteriostatic activity of nitrite

46
by a drop in pH is attributed primarily to the formation
of nitrous acid (Castellani and Niven, 1955; Shank et al.,
1962) . The nitrous acid formed from the nitrite is an
effective bactericidal agent. In meat, at a pH of 5.5
to 6.0, some nitrite is converted to nitrous acid (Forrest,
1975). Nitrous acid is maintained at the highest con
centrations in the pH range of 4.5 to 5.5 and bactericidal
activity is at a maximum under these conditions (Shank et al.,
1962). Theories concerning the action of nitrous acid on
the bacterial cell are damage to the bacterial cell and
making constituents in the medium unavailable to the cell
(Castellani and Niven, 1955; Shank et al., 1962),
The other major environmental condition that affects
the bacteriostatic action of nitrite on S. aureus is the
absence of 0^. Several researchers have reported that
nitrite inhibits growth of S. aureus to the greatest extent
under anaerobic conditions with almost no effect under some
aerobic conditions (Buchanan and Solberg, 1972; Castellani
and Niven, 1955; Lechowich et a2., 1956). Buchanan and
Solberg (19 72) reported this inhibition at a pH as high as
7.2. Castellani and Niven (1955) suggested the bacterio
static action under anaerobic conditions lies in the ability
of nitrite to interfere with a system involving an essential
sulfhydryl compound. Buchanan and Solberg (1972) theorized
that nitrite may inhibit the growth of S. aureus by blocking

47
sulfhydryl sites of either coenzyme A or alpha-lipoic acid
which interferes with the normal metabolism of pyruvate.
2. NaCl: Salt (NaCl) and nitrite are the two main
ingredients used in meat curing (Forrest, 1975). Forrest
(1975) lists the two purposes of salt in meat as being a
preservative agent and a flavoring agent. Flavoring is
probably the most important function because the low level
of salt used in the product today has little, if any, preserva
tive action. Processed meats contain 1 to 5% salt with the
vast majority of sausages containing 2 to 3% salt (Kramlich,
1978).
The preservative effect of salt is due to its dehydrating
ability which alters the osmotic pressure so bacteria cannot
grow (Desrosier and Desrosier, 1977; Marsh, 1983). S. aureus
is one of the organisms most resistant to salt with growth
and/or survival at levels of salt up to 15 to 20% (Baird-
Parker, 1974; Jay, 19 78). Therefore, at the percent concen
trations of salt added to meats, salt in the product will not
inhibit the growth of this bacterium. In fact, Peterson
et al. (1964) found that concentrations of salt above 3.5%
decreased the numbers of antagonistic saprophytic organisms
and enabled growth of S. aureus. As the concentration of
salt is increased, however, enterotoxin production de
creases and stops before growth ceases (Hojvat and

48
Jackson, 1969). Like all other factors affecting growth
of S. aureus, the bacteriostatic ability of salt is affected
by other environmental factors such as pH (Genigeorgis and
Sadler, 1966a; Genigeorgis et , 1971a; Hojvat and
Jackson, 1969). As these environmental factors become more
adverse for the organism, the bacteriostatic activity of
the salt increases.
Public health aspects of NaCl usage
There is general concern in the medical community to
day concerning the role of salt in hypertension. Although
the relationship between high sodium intake and hypertension
is not a simple cause and effect (Sebranek et a^., 1983) ,
most researchers agree that sodium intake is a contributing
factor (Page, 1981). Manufacturers of processed foods
have been encouraged to reduce the levels of sodium in
their products. Compounds used in the processing of meats
that contribute sodium are sodium nitrite, sodium phos
phates, sodium ascorbate as well as nonfat dry milk and
soy derived proteins (Marsh, 1983). Sebranek et al.
(19 83) state, however, that sodium chloride is the com
pound that is responsible for the greatest portion of
sodium in processed meat products.
In an effort to comply with the demand to reduce sodium
in their products, manufacturers have been searching for

49
substitutes for NaCl. Some of these compounds have in
cluded potassium chloride (KCl), magnesium chloride
(MgClg)/ calcium chloride (CaCl2) and lithium chloride
(LiCl) (Marsh, 1983) . Research is still being carried
out on the safety and consumer acceptance of sodium-
reduced meat products containing certain of these com
pounds. In addition to these concerns, Sebranek e;t al.
(1983) list other aspects that must be considered,
including textural changes, decreased moisture retention
and product appearance.
Phosphates
The use of phosphates, previously prohibited in
sausage (Forrest, 1975), is now allowed in these products
(Desrosier and Desrosier, 1977) . There are several bene
fits from the use of alkaline phosphates in meat proces
sing; increased water holding capacity, increased
tenderness and juiciness of the product, improvement in
cured meat color, and protection against browning (Forrest,
1975) .
The use of phosphates (sodium tripolyphosphate,
heaxametaphosphate, acid pyrophosphate, pyrophosphate and
disodium phosphates) alone or in combination is restricted
to not more than 0.5% in the finished product (Bard and
Townsend, 1978). Their effect on bacteria, particularly

50
S. aureus, is not clear.
Fermented meats
A fermented food is a food product that is preserved
by the action of microorganisms inoculated into or in
herent to the product. Fermented meats are normally
sausages prepared by adding curing and seasoning ingredients
to ground meat, stuffing the mixture into casings and incu
bating for a period of time at 80 to 95°F (Jay, 1978).
The organisms normally used as starter cultures are from
the group of bacteria generally known as lactic acid bac
teria. These organisms produce lactic acid and include
the genera Lactobacillus, Leuconostoc, Pediococcus and
Streptococcus (Groups D and N) (Jay, 1978) .
The inhibitory actions these microorganisms provide
against S. aureus (Graves and Frazier, 1963) are the low
pH due to the production of lactic acid, the production of
inhibitory substances antagonistic to S. aureus and by
outcompeting the staphylococci for vital nutrients in the
meat system.
Lactic acid causes a drop in pH and has bacterio
static action against S. aureus (Haines and Harmon, 1973).
Bacteriostatic action is dependent on the presence of O2
in the system. Barber and Deibel (1972) reported that
S. aureus was more acid tolerant aerobically than ana-
erobically. The drop in pH can affect toxin production

51
without affecting growth (Barber and Deibel, 1972). Haines
and Harmon (1973) reported that lactic acid inhibited
growth of S. aureus in early but not late stages of
incubation.
Another theory on the effect of lactic acid bacteria
on S. aureus is the production of inhibitory substances. In
hibitory substances such as diplococcin and nisin are
produced by certain species of Streptococcus (Hirsch and
Wheater, 1951; Oberhofer and Frazier, 1951). Lactic acid
bacteria may also inhibit S. aureus by the production of
hydrogen peroxide (Dahiya and Speck, 1968) .
Finally, there is evidence to show that lactic acid
bacteria can out compete S. aureus for nutrients in the
medium (McCoy and Faber, 1966) . Haines and Harmon (1973)
reported that competition for vital nutrients, particularly
niacin and biotin, inhibited growth of S^. aureus. landolo
et al. (1965) reported that the depletion of nicotinamide
by lactic acid bacteria inhibited growth of S. aureus.
The extent of inhibition is dependent on environmental
conditions such as temperature, pH, etc. (Graves and
Frazier, 1963).

52
MATERIALS AND METHODS
The experiments in this research project consisted of
several phases: 1) development of a quantitative method for
the determination of thermonuclease, 2) evaluation of en
vironmental conditions on the production of thermonuclease,
and 3) the examination of extraction procedures used for the
detection of nuclease in a meat product.
Measurement of Thermonuclease Activity
Koupal-Deibel DNA medium
Koupal-Deibel (KD) medium used in this work was de
veloped and described by Koupal and Deibel (1978) . The medium
was prepared by adding to 100 ml of distilled water 0.6
g Trizma Base (Sigma Chemical Co., St. Louis, Mo., Cat.
No. T 1503), 0.045 g DNA (Sigma Chemical Co., St. Louis,
Mo., Cat. No. D 1632), 1.25 g Agar (Difco Laboratories,
Detroit, Michigan, Cat. No. 0140-01-0),, 1. GO g NaCl
(Fisher Scientific Co., Pittsburgh, Pa., Cat. No. S-271),
and 0.2 ml of O.OIM CaClg. The pH was adjusted to 9.0 with
IN HCl. This mixture was boiled for 20 minutes and stored
in rubber-stoppered 125 ml flasks at room temperature.
When needed, the medium was steamed to melt the agar
and 15 ml was pipetted into 100 x 15 mm plastic Petri dishes
(Fisher Scientific Co., Pittsburgh, Pa., Cat. No. 8-757-13)

53
allowed to cool for at least five hours at room temperature.
Wells were cut in the agar with a No. 2 cork borer. Agar
plugs were removed by the borer under vacuum suction.
Samples to be tested for the presence of thermonuclease
were added to the wells by two methods: Pasteur pipettes
(Fisher Scientific Co., Pittsburgh, Pa., Cat. No. 13-678-6B)
when not quantitated and by microliter pipette (Rainin
Instrument Co., Woburn, Mass., Cat. No. P-200) with pipette
tips (Brinkman Instruments, Inc., Westbury, N.Y., Cat. No.
2235130-3) when quantitation was desired. The Pasteur
pipette was attached to a bulb and the sample was added
until the well was filled. When the microliter pipette
was used, 30 yl and 20 yl of sample were examined.
Purified thermonuclease
The nuclease used in this research project was
micrococcal nuclease purchased from Worthington Farms
(Millipore Corp., Freehold, NJ). Two samples of the
nuclease were needed to provide enough nuclease for
all experiments. Each lot contained 15,000 units
(unit = ymoles of substrate used or product fotmed/
minute). In terms of purity or specific activity, the
samples contained 14,925 units/mg (used primarily in quan
titative assay development experiments) and 12,319 units/
mg, respectively.

54
Dilution of the purified nuclease
The enzyme was diluted using either 0.05 M Trizma
base, pH 8.8 + 0.1 or Brain Heart Infusion (BHI) pH 7.0
+0.1 except in specified experiments (Difco Laboratories,
Detroit, Michigan, Cat. No. OD 37-01-6). The nuclease
solution was diluted to obtain nanogram or unit quanti
ties/ml .
To obtain ng/ml quantities of thermonuclease for the
development of the quantitative assay, the following pro
cedure was used. One milligram or 10^ ng of nuclease was
added to 10 ml of 0.05 Trizma base giving 10^ ng of
nuclease per ml. Then 0.1 ml of the solution was added
to screw cap tubes giving lo'^ ng of nuclease/tube. These
tubes were frozen until needed. At that time, the solu
tion was further diluted with 9.9 ml of BHI or 0.05 M
Trizma base or BHI broth to obtain 1000 ng nuclease/ml.
The nuclease was serially diluted giving nuclease concen
trations of 640 ng/ml, 500 ng/ml, 320 ng/ml, 100 ng/ml,
80 ng/ml, 75 ng/ml, 50 ng/ml, 25 ng/ml, 20 ng/ml, 10 ng/ml
and 5 ng/ml.
The dilution of the nuclease, in terms of units,
was accomplished by adding 15,000 units of the purified
nuclease to 10 ml of 0.05M Trizma base, giving 1,500 units
of nuclease per ml. Then, 0.1 ml of the solution containing

55
1,500 units/ml was added to screw cap tubes giving 150
units of nuclease/tube. These tubes were kept frozen un
til needed. At that time, the solution was further diluted
with 9.9 ml of BHI to obtain 15.0 units of nuclease/ml.
The nuclease was serially diluted giving nuclease activi
ties of 7.50 units/ml, 1.50 units/ml, 0.75 units/ml, 0.15
units/ml and 0.08 units/ml.
These solutions were then added to wells cut in the
agar in Petri dishes and incubated for 1-2 hours at 50°C.
After the incubation period, the plates were flooded with
4N HCl. The acid precipitated unreacted DNA and circular
clear zones were present when enzymatic activity occurred.
The zones in the white precipitate were easier to detect
if the plate was placed on a black background.
Measuring thermonuclease activity
Thermonuclease activity was measured by placing the
Petri dish in an antibiotic-zone reader (Accu-Tech Corp.,
New York, NY) which had a magnifying glass and a black
background. The magnification of the zones and the black
background improved visibility and measurement.
The zones were measured with vernier calipers
(Fisher Scientific, Pittsburgh, Pa., Cat. No. 12-122) along
the horizontal and vertical axes. A measurement was taken

56
also of the well along the horizontal and vertical axis.
The measurement called "clearing zone" was calculated
by using the following formula;
Diameter horizontal clearing zone (mm) + diameter vertical clearing zone (nun) ̂
2
Diameter horizontal well (mm) + [ Diameter vertical well (mm) j = clearing zone
2
Organism
The organism used was Staphylococcus aureus Z88 and
was obtained from Dr. William Sveum, Armour and Company,
Scottsdale, Arizona. The organism was isolated originally
by Dr. Sita R. Tatini, University of Minnesota and was
involved in a food poisoning outbreak. The organism,
which produces staphylococcal enterotoxin A (SEA), is noted
for production of high levels of thermonuclease.
An active culture of the organism was maintained on
trypticase soy agar slants; maintenance transfers were
made at least once a month. Short-term storage of the
slants was at 4°C and for long-term storage the organism
was kept in a frozen state at -80°C in a sterile
10% glycerol-BHI mixture (Gherna, 1981).
The inoculum for the BHI broth cultures was taken
from stock cultures on trypticase soy agar. BHI broth
was incubated for 12 to 18 hours at 35 to 37°C. The cells

were centrifuged and washed once with sterile BHI broth.
BHI broth was sterilized in 150-ml quantities in 250-
ml flasks and stored at room temperature until used.
Evaluation of Environmental Factors
1. pH. The initial pHs of the broth used in these
experiments were 5.3, 6.3, 7.0 (the pH of the control flask)
and 8.3 + 0.1. Adjustment of the pH was made before auto-
claving by using either IN HCl or IN NaOH. The pH varied
at times from 0.1-0.3 of a unit after autoclaving.
2. NaCl. The concentrations of NaCl were calculated
on a weight percent basis (Fritz and Schenk, 1974) to obtain
5%, 10% and 15%.
^ _ 100 X grams of solute grams of solvent + grams of solute
Based on the above equation, 5 grams of NaCl were added
per 95 ml of BHI, 10 grams of NaCl were added per 90 ml
of BHI and 15 grams of NaCl were added to 85 ml of BHI to
obtain 5%, 10% and 15% concentrations, respectively. The
15% solution had to be heated to completely dissolve the
salt. The solutions (media) were distributed into flasks,
autoclaved, cooled and stored at room temperature.
3. KCl. The concentrations of KCl (Fisher Scientific,
Pittsburgh, Pa., Cat. No. P-217) used in these experiments
were the same as those used for NaCl, 5%, 10% and 15%.

58
The calculations used to determine the amount of KCl added
to the BHI to obtain the respective percentage concentra
tions were made on a weight percent basis.
The weights added were the same as those described
previously for NaCl. The solutions were prepared the same,
distributed into flasks, sterilized, cooled and stored.
4. Phosphate. The phosphate used in this experiment
was sodium acid pyrophosphate (SAPP) (Stauffer Chemical
Co., Westport, Conn.). The concentrations used, calculated
on a weight percent basis, were 0.1%, 0.25% and 0.5%.
Incubation of flasks
The flasks were incubated at three different tempera
tures: 15°, 22° and 37°C. A different level of inoculum
2 4 was used at each temperature. A level of 10 to 10
cells/150 ml of broth was inoculated into flasks incu
bated at 37°C, 10^ to 10^ cells/150 ml of broth were inocu
lated into flasks incubated at 22°C and 10^ to 10^ cells/
150 ml of broth were inoculated into flasks incubated at
15°C.
During the incubation period, the flasks were aerated
by shaking at constant speed on one of three shakers.
They were a Fisher Shaking Water Bath, Model 127 (Fisher
Scientific Co., Pittsburgh, Pa.), a Gyrotory Shaker, Model

59
G-76 (New Brunswick Scientific Co., New Brunswick, N.J.),
and a Laboratory Rotator, Model G2 (New Brunswick Scien
tific Co., New Brunswick, N.J.).
Measuring bacterial growth
Growth of S. aureus in the broth experiments was
monitored by light absorbance measurements. A standard
curve was produced for S. aureus growth in control BHI
flasks incubated for 48 hours at 15°, 22°, or 37°C,
respectively. Growth was measured every two hours by
removing a sample for an aerobic plate count on Trypticase
Soy Agar. Absorbance readings of broth cultures were
made at 660 nm at the same time (Koch, 1981) with a
spectrophotometer (Bausch and Lomb, Rochester, N.Y.).
Plate counts were taken every 2 to 4 hours along with
absorbance readings until the absorbance readings did
not change by more than 0.5 units. Absorbance readings
were taken on undiluted culture until the readings were
greater than 0.2. The sample was then diluted with BHI
to obtain readings less than 0.2. When the absorbance
readings had stabilized, readings were made every 4-8 hours
Numbers of organisms in the flasks with added materials
were estimated by comparing absorbance readings with the
standard curve. When carrying out the absorbance
readings on cultures, the blank used to standardize the
spectrophotometer had to be the same solution as used

60
for the culture.
Measurement of thermonuclease activity
During incubation of the flasks, thermonuclease pro
duction was monitored by taking a 4-ml sample every 8
hours for the 48-hour period. The sample was boiled for
10 minutes prior to sampling. The solution was centri-
fuged for five minutes and the supernatant was assayed
for thermonuclease.
The Koupal-Deibel DNA medium was used to determine
thermonuclease activity. The protocol for the test used
included the use of a 20 yl nuclease sample, 15 ml of
medium/plate, and incubation of the plate for 2 hours at
50°C.
The first step for obtaining a quantitative esti
mate of nuclease was to establish a standard curve using
purified nuclease. Five replicate wells were measured
for each known concentration; the "cleared zone" values
were plotted against log of concentration. Five repli
cates of each unknown well were tested also. "Cleared
zone" measurements were compared to the standard curve
to determine the nuclease concentration.

61
Plate counts
Plate counts were performed following the aerobic
plate count method as outlined by the Compendium of
Methods for the Microbiological Examination of Foods
(Gilliland et al., 1976).
Samples were taken every 2-4 hours from the control
flasks and absorbance measured until the absorbance
readings had stabilized. When the absorbance readings
had stabilized, counts were taken every 4-8 hours.
Counts were taken every 24 and 48 hours in flasks
containing BHI plus added materials. The numbers of
organisms present were primarily monitored by the
absorbance readings. The gram stain procedure was used
to periodically check for contamination.
Nuclease production vs. numbers of S. aureus
S. aureus was inoculated into flasks and incubated
for a period of time until nuclease was produced. The
time for nuclease production was estimated from previous
results. Thermonuclease was generally assayed for each
hour for 5 to 7 hours. The thermonuclease assay was
qualitative only. Plate counts were taken every other
hour during the 5 to 7 hour time period.

62
• Extraction of Thermonuclease from Meat
Two procedures for the extraction of thermonuclease
from meat were compared using sausage samples obtained
from Dr. William Sveum (Armour and Company, Scottsdale,
Arizona). Sausage samples contained S. aureus at levels
of 10^ to 10^ cells/g while others were uninoculated and
used as controls.
1. Method based on assay of Koupal and Deibel (1978);
The method of Koupal and Deibel involved using 20
grams of the outer 3 to 5 mm of the sausage sample and
blending with 40 g of distilled water. The sample was
blended for 3 to 5 minutes with a homogenizer (Sorvall
Omni Mixer, Ivan Sorvall Inc., Norwalk, Conn., Cat.
No. OM-1150), and poured into a centrifuge tube. The pH
was adjusted to 5.5 with IN HCl and placed in a boiling
water bath for 20 minutes. The tubes were then centri-
fuged for 45 minutes at 7500 rpm at 5°C in a refrigerated
centrifuge. The supernatant of the sample was used for
the thermonuclease qualitative assay.
2. Method based on assay of Tatini et al. (19 76);
This method involved blending 20 g of the outer
3 to 5 mm of the sausage sample with 40 ml of distilled
water. The sample was adjusted to pH 4.5 in a 100- or
150-ml beaker. The material was centrifuged at 14,000 rpm

63
(23,500 X G) for 15 minutes at 5°C in a refrigerated
centrifuge. Cold 3M trichloroacetic acid (TCA) was
added in the proportion of 1.5 ml TCA/30 ml supernatant
(Dr. William Sveum, Personal Communication, Armour and
Company, Scottsdale, Arizona). The solution was
centrifuged as previously stated. The supernatant was
decanted and the precipitate containing the nuclease
was resuspended in 2 ml of 0.05M Trizma buffer pH 9.1.
The solution then was adjusted to a final pH 8.2-8.6.
This preparation was heated for 15 minutes in a boiling
water bath after which it was cooled rapidly in ice.
The supernatant of the sample was used in the thermo-
nuclease qualitative assay.

64
RESULTS AND DISCUSSION
Development of Quantitative Assay for Staphylococcal Thermonuclease
Preliminary research involved examination of the
Koupal-Deibel method as a potential quantitative as well
as qualitative assay for thermonuclease. Initially, at
levels of 5 ng of thermonuclease/ml of sample, clearing in
the medium was inconsistent; after repeated trials, however,
activity as manifested by clearing zones became consistent.
The explanation for the inconsistent then consistent
clearing reactions is not understood but is attributed,
in part, to generally improved techniques. Due to the
initial inconsistent readings and the very small clearings
observed in further trials, 5 ng was taken to be the limit
of sensitivity. The concentration of 5 ng/ml of thermo
nuclease is equivalent to the 5 ng amount noted by Koupal
and Deibel (1978) as the limit of sensitivity; how
ever, they could not consistently detect this concentra
tion when extracting from food products. Lachica et al.
(1972b) found this concentration to be the limit of their
assay using the metachromatic agar diffusion technique.
Figure 1 shows results from preliminary experiments;
diameters of clearing zones are plotted against the log
thermonuclease concentration, ng/ml. Utilizing the statisti
cal model of predicting a known value from an unknown value

Figure 1. The relationship of the diameter of clearing versus the log of the thermonuclease concentration, ng/ml

1 4 . 0
1 3 . 0
12.0
1 1 . 0
1 0 . 0
9 . 0
8 . 0
7 . 0 L.
tu E 6 . 0 r a Q
5 . 0
4 . 0
3 . 0
2 . 0
1.0
F i g . 1
J I I J L J L J L 0 0 . 2 0 . 4 0 . 6 0 . 8 1 . 0 1 . 2 1 . 4 1 . 6 1 . 8 2 . 0 2 . 2 2 . 4 2 . 6 2 . 8 3 . 0 3 . 2 3 . 4 3 . 6 3 . 8 4 . 0
Log Thermonuclease Concentration, ng/ml

67
(Cox, 1971; Snedecor and Cochran, 1980), the thermonuclease
concentration was placed on the x axis and the diameter of
clearing was placed on the y axis. The analysis of
variance (Table 1) showed that 88% of the variability in
the measured diameters could be explained by the log of the
thermonuclease concentration (LGTN) and another 7% of
variability was attributable.to differences among plates.
The variability among plates was small compared to the
variability due to concentration.
Table 1.
Source
Regression and analysis of variance on the data from diameter measure vs. log thermonuclease concentration
DF Type I SS F Value PR>F R
Plate
LTTN
8
1
20.73
251.27
13.12 0.01 0.07
1271.72 0.01 0.88
Variance 0.20
y intercept - 5.99 Slope - 2.21
Several reasons may be given to explain why the plate
on which the diameter was measured contributed to the
size of the clearing zones. In agar diffusion assays
with round Petri dishes, there have been reports that
wells have to be equally spaced from the center to get
reproducible results (Bartlett and Mazens, 1971;

68
Hallynck and Pijck, 1978). Since the wells were cut at
random in this assay, this could have influenced the meas
urements between plates. The second factor that may have
influenced plate-to-plate variation is the convexity of
the Petri dish. Convexity of the Petri dish influences
the thickness of the agar and can influence the diffusion
of the enzyme through the agar. Thickness of the agar
can vary from one plate to another (Hallynck and Pijck,
1978) . Finally, day-to-day variations in technique may
have contributed to plate-to-plate variation. Because
the levels of nuclease used was.in very small increments,
a small error in technique could have also contributed to
the variations in measurements.
The analysis of variance (Table 1) gives the slope
(m) of the line y = mx+b in Figure 1 as 2.21 and the inter
cept (b) as 5.99. This linear relationship between the
log of the thermonuclease concentration and diameter
measurement was reported by Cords and Tatini (1973) and
Lachica et a^. (1972b) using toluidine blue (TB) DNA
medium. A strong linear relationship occurred throughout
the range of concentrations from 5 to 1000 ng/ml. The
linear relationship formed the basis for the development
of the quantitative assay. With this relationship, the
concentration of thermonuclease could be predicted, within

69
limits, by the size of the diameter of the cleared zone
(Cox, 1971; Snedecor and Cochran, 1980).
At each concentration of thermonuclease, there is
assumed to be a population of diameters that are normally
distributed with equal variance. The variance of the
diameters in this experiment was 0.20 (Table 1). In
the prediction model for enzyme concentrations from given
diameters, we wanted an experimental procedure for which
the variance of the diameter populations is as small as
possible. In the procedure used, the measurement of the
clearing was always horizontal in relation to the Petri
plate orientation. The problem with only one measurement
was that the clearing was not always perfectly circular.
One method for reducing this bias in measurement was to
measure the zones horizontally are vertically and then average
the two values. An F-test was used to determine if this
change in experimental procedure led to diameter popula
tions of smaller variance. The estimated variances in
Table 2 suggest that the average clearing (AC) procedure
results in less variation than that of the populations
from the horizontal (HOR) measuring procedure (FgQ gQ =
1.98, p<.01), and equal to that of the populations from
the vertical (VER) measuring procedure (F^g gQ = 0.93,

70
Table 2. Variance of horizontal, vertical and average clearing measuring procedures on data from measuring procedures vs. log thermonuclease concentration
Measuring procedure Variance
Horizontal go,60 '10
Vertical gg gg .05
Average clearing go,60 .05
p>. 25). Since the average clearing (AC) measure also
has the added stability of being the average of two lengths,
it is preferred to either the horizontal or vertical
measurements alone.
During the development of the quantitative assay,
results showed the 20 yl and 30 yl filled the well (15 ml
agar/plate) without overfilling or underfilling. Using the
30 yl sample might be expected to give significantly
larger clearing measurements. To determine if there was
a significant difference between measured clearings, the
analysis of variance (ANOVA) procedure was used.
The results in Table 3 show a low insignificant
F value (0.73) and a low contribution to the variability
in measured diameters. No significant difference was
observed in the measurement whether a 20 yl or 30 yl

71
Table 3. Analysis of variance on data from average clearing vs. log thermonuclease concentration using 20 pi or 3 0 )j1 per well
Source DF ANOVA SS F value Pr > F
Plate 5 14.20 17.67 0.01
Amt 1 0.12 0.73 0.40
LGTN 4 77.47 120.50 0.01
Amt*TN 4 0.63 0.99 0.42
sample was used. The 20 yl sample was chosen for future
use because this would hypothetically prevent overfilling
any wells that may not have had the proper agar thickness
or prevent spilling the nuclease out of the wells when
handling the plate.
As discussed earlier, the AC measurement of clearing
size was preferred over VER and HOR measurements. How
ever, AC itself was thought to have had a deficiency.
Since wells make up part of the measurement, AC would
best estimate clearings due to enzyme activity if all
wells were of equal size. The well sizes differed when
utilizing the cutting in this experiment as outlined by
Koupal and Deibel (1978) . The sizes of the wells
varied from 5.00 mm to 5.50 mm depending on the experiment.
Hallynck and Pijck (1978) noted that cutting wells in agar

72
with a cork borer can lead to wells with unevenly cut
edges. To remove this potential source of inaccuracy,
the measurement referred to as cleared zone (CZ) was de
veloped. This basic computation attempts to account for
differences in well sizes when measuring zone diameters.
This computation subtracts the average of the horizontal
well measure (HORW) and the vertical well measure (VERW)
from the AC. The formula used was:
CZ = AC - HORW-™
The results of the quantitative assay were used for
establishing a standard curve showing the concentration
of nuclease based on clearing size. A major concern when
producing the standard curve was whether the curve could
be reproduced daily or whether the difference between meas
urements made on different days were significant. Lachica
et al. {1972b) found that in their metachromatic agar
diffusion assay that the standard curve needed to be pro
duced daily due to variance in measurements. This factor
was considered previously when significant differences
were observed in measurements from plate-to-plate.
Using the reduction in sums of squares principle,
the slope of the fitted regression line (in the regression
of CZ on LGTN) differed significantly from Day 1 to Day 2.

73
From Figure 2, the estimated slopes from Day 1 and Day 2
are 1.39 and 2.30, respectively. The mean of readings
from Day 2 (3.98) was also larger than Day 1 (3.45).
This result shows that the standard curve used to
determine the activity of nuclease in an unknown sample
has to be run at the same time that the unknown sample is
measured. This result verifies the hypothesis made in the
preliminary experiment and is not unusual in biological
systems. Many biological systems have daily variation
within them (Hewitt, 1977) • As previously mentioned, day-
to-day variation in technique could also a'ccount for some
of the variation.
When carrying out preliminary research on the growth
of S. aureus Z88 in Brain Heart Infusion broth (BHI), the
decision was made to use BHI to dilute the enzyme rather
than Trizma because the organisms were grown in BHI broth.
Preliminary research showed that nuclease diluted
with BHI gave larger clearings than nuclease diluted
with Trizma. Also, it indicated that extension of the
time that the nuclease remained in the wells produced
larger clearing zones.
To test the significance of these two observations,
an experiment was designed. The experiment involved four
dilution media and four times of incubation. The four

Figure 2. The relationship of the clearing in agar (CZ readings) versus the log of the thermonuclease concentration, ng/ml on two different days

Log Thermonuclease Concentration, ng/ml

76
dilution media used were BHI at pHs of 6.99 (B) and 8.88
(H) and Trizma at pHs of 6.99 (R) and 8.88 (T). By using
the same media at different pHs, it was hoped to determine
the influence of pH on nuclease activity insofar as
clearing was concerned. Times of incubation were
staggered every 20 minutes giving incubation times of
1 hour (hr), 1 hr and 20 minutes (min), 1 hr and 40
min and 2 hrs.
An analysis of variance showed that there was a
significant difference in the measured clearings based on
F values at the different time periods and dilution media.
The results appear in Table 4.
The means in Table 5 show that as the incubation
times increased, CZ readings increased. The least sig
nificant difference for these comparisons is approximately
0.17 at the 5% level. The differences between these means
is greater than 0.17, therefore, incubating at the 4 dif
ferent times gave significantly different CZ readings.
The means in Table 5 and the absence of significant
interactions in the data in Table 4 also indicate that
these time differences are consistent for all nuclease
concentrations (activities) and diluting media.
The increase in size of the clearings with time was
not totally unexpected. Lachica et al. (1972b) saw an

77
Table 4. Analysis of variance on data from cleared zone readings vs. log thermonuclease concentration using various dilution media and incubation times
Source DF Type I SS F value PR >F
Time 3 24. ,64 32 . 06 0 .01
Medium 3 63 .84 83 .03 0, .01
LGTN 5 385, ,43 300, .79 0, ,01
Tm*Med 9 4, .27 1, .85 0, ,06
Tm*LGTN 15 2. 95 0, ,77 0. ,71
Med*LGTN 15 1. ,61 0. ,42 0. ,97
Tm*Med*LGTN 45 4. ,9.2 0. ,43 0. ,99
Table 5. Means of cleared zone readings at different incubation times on data from cleared zone readings vs. log thermonuclease concentration
Incubation Time CZ means (mm)
1 hour 3.71
1 hour, 20 min 3.95
1 hour, 40 min 4.24
2 hours 4.48

78
increase in zone diameter with time in their metachormatic
agar diffusion assay. Enzyme activity is measured in
units (mmoles of substrate used/min) (Clark and Switzer,
1977). Therefore, the longer the incubation period, the
more substrate is broken down and the larger should be the
CZ measurements within limits. Other assays for thermo-
nuclease are carried out at longer incubation times (>1 hr)
but most of these assays are run at temperatures lower than
50°C (Jarvis and Lawrence, 1969; Lachica et al., 1972b).
The increase in size in relation to enzyme concentration
is of particular interest at lower concentrations or
activities. By increasing the size of the CZ readings,
enzyme samples of lower activities are easier to detect
and measure; incubating for only 1 hour may not result
in a detectable reaction.
Two hours incubation time was chosen for future assay
work. The longer incubation time was thought to increase
the detection of low activities of nuclease. Any longer
incubation time would be counter productive to the speed
of the assay.
The means in Table 6 show that purified nuclease
diluted with BHI, irrespective of pH, gave higher overall
CZ means than purified nuclease diluted in Trizma. The
means in Table 6 and the absence of significant inter-

79
Table 6. Means of cleared zone readings with different dilution media on data from cleared zone readings vs. log thermonuclease concentration
Medium CZ reading means (mm)
BHI - pH 6.99 4.56
BHI - pH 8.88 4.57
Trizma - pH 6.99 3.56
Trizma - pH 8.88 3.69
actions in the data in Table 4 indicate that the media
differences are consistent for all nuclease concentra
tions and times. At the least significant difference
level of 0.17, the two media at different pHs were not
significantly different while the two different media,
regardless of pH, were significantly different. There
fore, the differences in activity of the diluting media
are attributable to the constituents of the media and not
due to pH.
This observation may be explained by increased
nuclease stability in the BHI broth. Research has shown
that the enzyme is more stable when the following are
+2 present: nucleotide components, Ca ion and bovine serum
albumin (Lachica et al., 1972c; Sulkowski and Laskowski,
1968). The ingredients for BHI are basically an extract

80
of beef brain and heart with salts added. There would be
bovine serum albumin, degraded nucleotides present as well
+2 as traces of Ca from the added salts. If the enzyme
were more stable, this stability would enable the enzyme
to retain much of its activity over a longer period of
time. Trizma does not contain all these components and
the enzyme would not necessarily be as stable.
Based on these results, BHI was chosen as the dilution
medium for future assays. The greater stability of the
enzyme in BHI should reduce variation in CZ measurements.
Applying the changes discussed previously (BHI dilu
tion medium, 2 hour incubation time), a standard curve was
developed with results illustrated in Figure 3. The
results of regression analysis gave a relatively low
2 estimated CZ population variance (.05) and an R of
91%. The low variance estimate lends support to the
hypothesis that the CZ populations associated with BHI
medium have as small a variance as those associated with a
Trizma medium. This "low" variance estimate is expected
to be more stable from one experiment to another due to
the stability of the enzyme in BHI. The equation of the
fitted regression line is CZ = 2.39 + (0.89) LGTN. This
equation can be used to predict the concentration of
nuclease produced by S. aureus in growth medium.

Figure 3. The relationship of the clearing in agar (CZ readings) versus the log of the thermonuclease concentration, ng/ml when BHI was used as the diluting medium

7 . O r Fig. 3
6 . 0
5 . 0
E E
4 . 0 (A D) C '•5
8 3,0
N u
2 . 0
1 . 0
CO hJ
J L 1 J L I I J L J L 0 0 . 2 0 . 4 0 . 6 0 . 8 1 . 0 1 . 2 1 . 4 1 . 6 1 . 8 2 . 0 2 . 2 2 . 4 2 . 6 2 . 8 3 . 0 3 . 2 3 . 4 3 . 6 3 . 8 4 . 0
Log Thermonuclease Concentration, ng/ml

83
Confidence limits were placed on predictions based
on the regression line of the standard curve. In the pre
diction of X from y (i.e., nuclease concentration from the
diameter) Equation 1 was used. The term of particular
note in the equation is the m term. This term is equal to
the number of measurements made on the unknown sample. If
the prediction of the activity of the unknown sample gives
a confidence interval larger than desired, making more
measurements on the unknown sample theoretically reduces
the interval due to the m term is in the denominator of
a fraction in the following equation.
P{X +[
/ <X*<X + [
2 1-C
1-a
where
= t^a/2, N-2
bi^e(X^-X)^
Equation 1

84
where
t = t value at .05 level with 58 df
estimated slope
y = mean of cleared zone readings
X = mean of log of thermonuclease concentration
2 S =variance
S = standard deviation
a = level of error in confidence interval
y*=average clearing size of nuclease
x*=estimate of nuclease concentration
m = number of readings for the average clearing size
N = number of measures to produce the standard curve
P = probability
Table 7 shows the results of the confidence interval
calculations made on a hypothetical reading from the
standard curve in Figure 3. Table 7 shows that at the
95% (a = .05) confidence level, the more measurements
taken, the smaller the interval. For our purposes, taking
one reading gave an interval that was too large. Taking
more than 10 readings would be excessive in relation to
the time needed to run the experiment. The difference in
the confidence interval between 5 and 10 readings was
not large enough, 83.41 versus 59.80, respectively, to
merit 10 readings in relation to time. Therefore, five
readings per unknown sample were used for prediction

85
Table 7. Confidence intervals of a sample problem using data from cleared zone readings vs. log thermo-nuclease concentration with BHI medium at 2 hour incubation
Suppose Y* = 4.01 is the average of m clearing sizes for an enzyme of unknown concentration
Using Equation 1:
Confidence intervals of nuclease concentration (a=.05)
Log confidence interval Confidence interval ng/ml (.05) ng/ml (.05)
m=l 1.33 - 2.38 21.52 - 237.64
m=5 1.51 - 2.10 41.08 - 124.50
m=10 1.68 - 2.03 47.61 - 107.42
m=-m 1.71 - 1.92 61.32 - 83.40
purposes and five readings per known nuclease concentra
tion were used to produce the standard curve.
Up to this point, the assay for the enzyme has been
based on clearing zone (mm) versus ng of thermonuclease/ml.
Working with purified nuclease, this assay is valid.
However, when measuring the unpurified enzyme from
S. aureus cultures, activity in terms of enzyme units
would be the proper measure. An enzyme is measured pri
marily in units and is expressed in terms of amount of
substrate broken down or product formed per minute (Clark

86
and Switzer, 1977) . If the enzymes being measured are
not purified to the same degree, a ng of one enzyme would
not give the same reaction as a ng of the other. There
fore, when using the assay developed here for unpurified
enzyme produced by cultures of S. aureus Z88, clearing
zone versus units of enzyme is a more accurate measure.
Figure 4 shows a plot of clearing zones versus units
in a standard curve using the same data as shown in Figure
3. The same slope is obtained as when clearing zones versus
thermonuclease activity is plotted. The variance (.05)
is the same as well. Therefore, changing to activity did
not affect the assay adversely.
Effect of Environmental Conditions on Thermonuclease Production
Temperature
Many researchers agree that the presence of nuclease
is an indication of >10^ cells/ml of S. aureus is or have
have been present (Tatini et al., 1975, 1976). The
growth of S. aureus 288 at 15°, 22° and 37°C in numbers
>10^ cells/ml always resulted in the production of
nuclease within 48 hours. A major problem when using the
three temperatures was the number of cells needed in the
inoculum for the production of >10^ cells/ml within
48 hours. Also, the extent of the lag and log phases and

Figure 4. The relationship of the measure of agar clearing (CZ readings) vs. the log of the activity units/ml

88

89
the onset of the stationary phase.
As the temperature of incubation decreased, a larger
inoculum of cells was required to produce 10^ cells/ml
2 within the 48 hour incubation period. At 37°C, 10
4 4 to 10 cells were added to the flasks; at 22°C, 10
to 10^ cells were added; and at 15°C, 10^ to 10^ cells
were added to the flasks. This gave an initial concentration
of cells at <30 - 6.7x10^ cells/ml in flasks at 37°C,
6.7x10^ - 6.7x10^ cells/ml in flasks at 22°C, and 6.7x10^ -
6.7x10^ cells/ml in flasks at 15°C.
Research has shown that upon transferring bacteria
from one medium to another, a lag phase takes place
(Dawes, 1976; Postgate, 1967). The extent of the lag
phase or time for the development of growth in the new
medium is dependent on how different the change in
environment (medium) is from the original medium, how
well the organism grows in the new environment and the num
ber of organisms inoculated (Dawes, 1976; Postgate, 1967) .
The medium was the same in this experiment (BHI broth)
with the major difference being in the temperature.
At 37°C, the temperature did not vary much from the
temperature at which the cells for the inoculum (35°C)
were grown. S. aureus grows optimally at 37°C and, there
fore, the lower inoculum of cells sufficed at this tempera
ture. Temperatures of 22°C and 15°C varied to a greater

90
extent from the optimum temperature of 35° to 40°C. The
temperature of 22°C is less favorable than 37°C but more
favorable than 15°C. Other workers have also shown that
growth of S^. aureus at lower than optimum temperatures re
quires a large initial number of cells (Dawes, 1976;
Postgate, 1967) . Therefore, 15°C required a larger inoculum
than did 22°C to give >10^ cells/ml within 48 hours.
Figure 5 shows that at 37°C the log phase begins
within 2 to 3 hours and the stationary phase was reached
in 11 to 12 hours. Under these conditions, ̂ 10^ cells/ml
was reached in 8 to 10 hours. At 22°C (Figure 6), the log
phase does not start until after 4 to 6 hours and the
stationary phase was not reached until 34 to 36 hours. The
log phase was longer at 22°C (28 to 30 hours) than at 37°C
(8 to 9 hours). The level of 10^ cells/ml was reached in
20 to 22 hours, 12 to 14 hours later than at 37°C. At
15°C (Figure 7), the log phase starts even later (6 to
8 hours) and the stationary phase was not reached within
the 48 hour period; in fact, the numbers of cells were
still increasing after 48 hours. A concentration of 10^
cells/ml was attained in 24 to 28 hours.
The measure of absorbance on the turbidity of the
medium was used to monitor growth of S. aureus Z88 during
the 48 hour incubation period. Figure 8 shows the typical
result of absorbance readings versus log cells/ml obtained

Figure 5.
Figure 6.
Figure 7.
Log number of 0-48 hours at
Log number of 0-48 hours at
Log number of 0-48 hours at
S. aureus Z88 37°C
S. aureus Z88 22°C
S. aureus Z88 15°C
cells/ml present
cells/ml present
cells/ml present
in BHI broth in
in BHI broth in
in BHI broth in

Log Numbers Cells/ml

93
from plate counts. The readings in this figure are for
cultures incubated at 37°C and the absorbance was not
measurable until at least 10^ cells/ml were present. At
this point, the growth was in log phase. At 10^ cells/ml,
however, the curve shows a large increase in absorbance
without a parallel increase in numbers of organisms. At
this point the organism was in stationary phase. There
fore, when absorbance was read, at least 10^ cells/ml
were present and when the absorbance readings stabilized, g
at least 10 cells/ml were or had been present.
Figure 9 shows variation of absorbance with time at
the three temperatures. Generally, when absorbance
could be recorded at all three temperatures, 10^ cells/ml
were present. Both at 37°C and 22°C, the stationary
phase began when absorbance readings exceeded .700. At
15°C, no stationary phase occurred within 48 hours;
and in this instance, the absorbance readings exceeded
. 2 0 0 .
Tables 8 through 10 show the size of the clearing
zones from the assay plates and the corresponding nuclease
activity for S. aureus Z88 grown in BHI broth at 37°,
22° and 15°C. Table 8 shows that nuclease activity could
be detected after 8 hours of incubation; the units of
nuclease present were too low to predict with confidence the

Figure 8. Log numbers of S^. aureus Z88 cells/ml present in BHI broth at measured absorbance (660 nm) at 37°C

Log Numbers Cells/ml
O — ' N J W 4 5 t n O > ^ O O i e O • • • • • • • •
00 N)
o- s
w o
S6

Figure 9. The average absorbance readings (660 nm) of S. aureus Z88 in BHI broth incubated at 37°, 22° and 15°C during 0-48 hours

Absorbance (660nm)
00 NJ
KJ W
n o n 00
m
H NJ
w hj
w O)
00
z .6

98
activity of nuclease present. Nuclease activities were
much higher after 16 hours. Many of the readings exceeded
the limit of the standard curve.
Nuclease production at 22°C (Table 9) was not evident
until after 24 hours. Activity readings after 24 hours
were lower than those taken at 32 through 48 hours in
which many readings exceeded the standard curve limit.
Activity at 15°C (Table 10) was not detected until after
32 hours. Nuclease activity increased after 40 and 48
hours. The level of activity produced was not as high
at 15°C as was produced at 37°C and 22°C.
S. aureus Z88 produced nuclease at all three tempera
tures. Table 11 shows the number of cells/ml when nuclease
was first detected. The table show >10^ cells/ml present
when nuclease was present. From the research presented
here, it cannot be determined whether S. aureus Z88 can
produce as high an activity of nuclease at 15°C as was
produced at 22°C and 37°C since the stationary phase was
not reached in 48 hours.
Some of the CZ measurements exceeded that were out
of the range of the standard curve. The very high production
of thermonuclease by S. aureus Z88 produced very high CZ
values. Readings out of range at the lower end of the curve
(<0.08 units) are due to low activities. .Thermonuclease

1
2
3
1
2
3
1
2
3
1
2
3
1
2
3
1
2
3
Levels of -thermonuclease activity in cultures of S. aureus Z88 grown in BHI broth for 48 hours at 37°C
CZ readings Units of . ,, , Confidence (mm) activity/ml ^ ® interval (95%)
1.89 <0.08 8 -
2.26 <0.08 8 -
2.29 <0.08 8 -
6.14 11.6 16 6.47-21.2
5.52 4.57 16 2.63- 8.02
6.49 >15.0 16 -
5.99 9.27 24 5.22-16.7
5.85 7.51 24 4.26-13.4
5.86 7.62 24 4.32-13.6
6.22 13.1 32 7.27-24.0
7.13 >15.0 32 -
6.96 >15.0 32 -
6.49 >15.0 40 -
6.46 >15.0 40 -
6.54 >15.0 40 -
6.22 13.1 48 7.27-24.0
7.11 >15.0 48 -
7.16 >15.0 48 —

1
2
3
1
2
3
1
2
3
1
2
3
Levels of thermonuclease activity in cultures of aureus Z88 grown in BHI broth for 48 hours at 22°C
; Readings (mm)
Units of activity/ml Time (h) Confidence
interval (95%)
2.31 <0.08 24 -
3.72 0.12 24 0.06-0.24
3.74 0.13 24 0.06-0.25
6.54 >15.0 32 -
6.61 >15.0 32 -
6.62 >15.0 32 -
6.62 >15.0 40 -
6.60 >15.0 40 -
6.73 >15.0 40 -
6.78 >15.0 48 -
7.01 >15.0 48 -
6.94 >15.0 48 —

Table
Repli
1
2
3
1
2
3
1
2
3
Levels of thermonuclease activity in cultures of S. aureus Z88 grown in BHI broth for 48 hours at 15°C
CZ Reading Units of » Confidence (mm) activity/ml interval (9 5%)
3.04 0.10 32 0.07-0.15
3.40 0.17 32 0.12-0.25
4.02 0.45 32 0.32-0.64
4.18 0.58 40 0.41-0.82
4.33 0.72 40 0.51-1.02
4.47 0.90 40 0.64-1.27
4.79 1.46 48 1.04-2.08
4.77 1.42 48 1.01-2.01
4.84 1.58 48 1.12-2.24

Table
Repli
1
2
3
1
2
3
1
2
3
Nuclease activity compared with numbers of S. aureus Z88 cells/ml grown in BHI broth. Time indicates the first observation of nuclease activity
art"iiîy%i cells/ml (h) Temp (-C)
1.89 <0.08 2.3x10^ 8 37
2.26 <0.08 2.5x10^ 8 37
2.29 <0.08 6.2x10^ 8 37
2.31 <0 .08 3.2x10^ 24 22
3.72 0.12 4.9x10^ 24 22
3.74 0.13 1.0x10^ 24 22
3.04 0.10 3.8x10? 32 15
3.40 0.17 3.6x10? 32 15
4.02 0.45 8.0x10? 32 15

103
could not be detected at the low levels consistently during
the development of the quantitative assay and in addition
difficulty in measuring very small clearing zones was
encountered in the assay.
These measurements served as a reference or control
in subsequent observations for the comparison of S. aureus
Z88 grown in BHI broth in which the pH was varied and to
which NaCl, KCl and sodium acid pyrophosphate (SAPP) were
added.
£H
Figures 10 through 12 show the results of absorbance
of cultures of S. aureus Z88 in BHI broth at initial pHs
of 5.3, 6.3, 7.0 and 8.3 incubated for 48 hours at
temperatures of 15°, 22° and 37°C. These figures show
that at pH 6.3.the results-were similar to those of the
control flasks (pH 7.0). In other words, pH 6.3 had no
significant influence on the growth of S. aureus Z88 in
comparison to the control. Various researchers have re
ported that pH has no effect on the growth of S. aureus
until it drops below 6.0 (Arvidson and Holme, 19 71;
Jarvis ̂ a2., 1973). At pH 5.3 and 8.3, absorbance
could not be observed with the spectrophotometer as
soon as at pH 6.3. Based on these absorbance readings.

Figure 10.
Figure 11.
Figure 12.
The average absorbance (660 nm) of S. aureus Z88 grown in BHI broth at initial pHs of 5.3, 6.3, 7.0 and 8.3 incubated for 48 hours at 15°C
The average absorbance (660 nm) of S^. aureus Z88 grown in BHI broth at initial pHs of 5.3, 6.3, 7.0 and 8.3 incubated for 48 hours at 37°C
The average absorbance (660 nm) of S. aureus Z88 grown in BHI broth at initial pHs of 5.3, 6.3, 7.0 and 8.3 incubated for 48 hours at 22°C

Fig. 10 15°C pH Fig. 11 37°C pH
o Control o Control
. 80
. 10
16 24 32 34 36 38 40 42 44 46 48 2 4 6 8 10 12 14 16 '24 32 40 48
Time (hours)
Fig. 12 22°C pH
o Control
16'22 24 26 28 30 32 34 36 38 40 42 44 46 48
Time (hours)

106
pH 5.3 appeared more adverse to the growth of S. aureus Z88
than was pH 8.3 over all three temperatures. This finding
supports other observations that the growth of S. aureus
is more adversely affected by acid pHs than by alkaline
pHs (Arvidson and Holme, 1971; Jarvis ejb a2. , 1973).
Tables 12 through 14 show the production of nuclease
by S. aureus Z8 8 at the three pHs. Nuclease was detected
at pH 6.3 at the same time as for pH 7.0 and at about the
same level of activity. This observation was consistent
over all three temperatures and lends credence to the
assumption that at 6.3, growth and the production of
nuclease are the same as in the control (pH 7.0).
Table 12 shows that at pH 8.3, nuclease is produced
at higher activities than at 5.3, and growth at both pHs
reached stationary phase.
At 22°C (Table 13) the enzyme was produced at higher
levels of activity at 5.3 than was observed at 37°C.
This could be due to the slower growth rate allowing the
cells to survive longer and produce more nuclease. The
high levels of nuclease still were not produced as soon
as at 8.3. At 15°C (Table 14) nuclease activity was
detected after 40 and 48 hours at pH 8.3 and after 48 hours
at pH 5.3. Perhaps a combination of factors including the
low pH and the cold temperature (15°C) that delayed growth
to a greater extent at 5.3 contributed to activity being

107
Table 12. Nuclease activity of cultures of S. aureus Z88 grown in BHI broth at pHs 5.3, 6.3, 7.0 and 8.3 at 37°C
CZ Reading Units Confidence (mm) activity/ml interval (95%)
Experiment I 5.3 8 - - -
5.3 16 1.59 <0.08 —
5.3 24 5.27 3.14 1.82-5.44 5.3 32 2.04 <0.08 -
5.3 40 5.42 3.93 2.27-6.87 5.3 48 1.93 <0 .08 -
6.3 8 2.71 <0.08 —
6.3 16 6.03 9.85 5.53-17.8 6.3 24 5.95 8.73 4.92-15.7 6.3 32 6.18 12.3, 6.86-22.6 6.3 40 6.18 12.3 6.86-22.6 6.3 48 6.09 12.5 6.96-22.9
7.0 8 1.89 ^0.08 —
7.0 16 6.14 11.6' 6.48-21.2 7.0 24 5.99 9.28 5.22-16.7 7.0 32 6.22 13.0, . 7.27-24.0 7.0 40 6.49 19.7 10.7 -36.9 7.0 48 6.22 13.}. 7.27-24.0
8.3 8 _ —
8.3 16 5.39 3.76 2.17- 6^56 8.3 24 6.00 9.42 5.29-17.0 8.3 32 5.71 6.08 3.47-10.8 8.3 40 6.57 >15.0 -
8.3 48 5.71 6.08 3.47-10.8
Experiment II 5.3 8 - - -
5.3 16 3.81 0.12 0.06-0.23 5.3 24 5.09 1.36 0.73-2.47 5.3 32 5.37 2.31 1.24-4.24 5.3 40 5.15 1.52 0.82-2.77 5.3 48 5.36 2.27 1.22-4.16
6.3 8 3.26 <0.08 —
6.3 16 6.09 9.09 4.68-17.5 6.3 24 6.17 10.6' 5.41-20.5 6.3 32 6.41 >15.0 -
6.3 40 6.29 13.3 6.72-26.1 6.3 48 6.46 >15.0 -

108
Table 12 (Continued)
CZ Reading Units Confidence (nun) activity/ml interval (95%)
7.0 8 3.06 <0.08 7.0 16 6.14 10.0 5.12-19.4 7.0 24 6.14 10.0 5.12-19.4 7.0 32 6.37 >15.0 __ 7.0 40 6.77 >15.0 —
7.0 48 6.35 14.9 7.49-29.5
8.3 8 _ _ _
8.3 16 3.81 0.12 5.71-21.8 8.3 24 6.20 11.2 —
8.3 32 6.77 >15.0 _ 8.3 40 6.76 >15.0 _ 8.3 48 7.00 >15.0
Table 13. Nuclease activity of cultures of S. aureus ZS8 grown in BHI broth at pHs 5.3, 6.3, 7.0, and 8.3 at 22°C
pH Time (h) CZ Reading (mm)
Units activity/ml
Confidence interval (95%)
5.3 8 —
5.3 16 - - -
5.3 24 - — -
5.3 32 4.56 0.58 0.30- 1.10 5.3 40 5.97 7.73 3.91-15.6 5.3 48 5.69 4.61 2.38- 9.11
6.3 8 _ _ —
6.3 16 - — -
6.3 24 2.84 <0 .08 -
6.3 32 6.59 >15.0 -
6.3 40 6.75 >15.0 -
6.3 48 7.03 >15.0 -
7.0 8 _ — —
7.0 16 - — -
7.0 24 2.31 <0.08 -
7.0 32 6.54 >15.0 -
7.0 40 6.62 >15.0 -
7.0 48 6.78 >15.0 -

Table 13 (Continued)
109
pH Time (h) C Z Reading Units Confidence (mm) activity/ml interval (95%)
8.3 8 - - -
8.3 16 — - -
8.3 24 - - -
8.3 32 6.57 >15.0 -
8.3 40 6.11 10.0 5.00-20.5 8.3 48 6.61 >15.0
Experiment II
5.3 8 - - -
5.3 16 - -
5.3 24 - -
5.3 32 4.57 0.51 0.33-.1.11 5.3 40 6.17 10.6 5.41-20.5 5.3 48 6.52 >15.0
6.3 8 — - -
5.3 16 - - —
5.3 24 4.66 0.60 0.32-1.09 5.3 32 6.56 >15.0 —
6.3 40 6.75 >15.0 —
6.3 48 6.86 >15.0
7.0 8 — - -
7.0 16 - - —
7.0 24 4.83 0.83 0.44-1.50 7.0 32 6.74 >15.0 -
7.0 40 6.88 >15.0 -
7.0 48 6.87 >15.0 —
8.3 8 — - -
8.3 16 - - -
8.3 24 - - -
8.3 32 5.90 6.33 3.31-12.0 8.3 40 6.65 >15.0 -
8.3 48 6.70 >15,0 —

110
Table 14. Nuclease activity of cultures of S. aureus Z88 grown in BHI broth at pHs 5.3, 6.3, 7.0 and 8.3 at 15°C
PH Time (h) CZ Reading (mm)
Units activity/ml
Confidence interval (9 5
Experiment I b. J B — — —
5.3 16 - - -
5.3 24 - - -
5.3 32 - - -
5.3 40 - - -
5.3 48 2.65 <0.08 —
6.3 8 — — —
6.3 16 - - -
6.3 24 - - -
6.3 32 4.52 0.97 0.69-1.37 6.3 40 4.38 0.78 0.55-1.11 6.3 48 4.94 1.84 1.31-2.62
7.0 8 _ —
7.0 16 - — -
7.0 24 - - -
7.0 32 3.04 0.10 0.07-0.15 7.0 40 4.18 0.58 0.41-0.82 7.0 48 4.79 1.46 1.04-2.08
8.3 8 — - -
8.3 16 - - -
8.3 24 - - -
8.3 32 - - -
8.3 40 2.72 <0 .08 -
8.3 48 3.68 0.27 0.19-0.38
Experiment II 5.3 8 - - -
5.3 16 - - -
5.3 24 - - -
5.3 32 - - -
5.3 40 - - -
5.3 48 2.81 <0.08 -

Ill
Table 14 (Continued)
T-.H CZ Reading Units Confidence (mm) activity/ml interval (95%)
6.3 6.3 6.3 6.3 6.3 6.3
8 16 24 32 40 48
2.60 4.76 4.92
< 0 . 0 8 1.08 1.48
0.62-1.85 0.85-2.54
7.0 7.0 7.0 7.0 7.0 7.0
8 16 24 32 40 48
2.80 4.64 5.01
< 0 . 0 8 0 . 8 6 1.76
0.49-1.46 1.02-3.04
8.3 8.3 8.3 8.3 8.3 8.3
8 16 24 32 40 48
3.25 3.71
< 0 . 0 8 0.14 0.18-0.24

112
detected at pH 5.3 later than at pH 8.3. The data on
nuclease production at different pHs show that both pH
5.3 and 8.3 delay growth of the S. aureus Z88 and that at
pH 5.3 production of nuclease can be lower and even delayed
to a greater extent than at pH 8.3. These results may be
due to lower levels of nuclease produced at pH 5.3. Re
search by Arvidson and Holme (1971) and Jarvis ejt al.
(1973) reported that at pHs below 6.0, nuclease is pro
duced at lower levels than at pHs greater than 6.0.
Sodium acid pyrophosphate (SAPP)
Figures 13 through 15 show the effects of SAPP on the
absorbance of cultures of S. aureus Z88 at the three
temperatures. SAPP had no major effect on the growth of
the organism; absorbance readings of S. aureus Z88 in
the presence of the phosphate closely paralleled the read
ings of the control flasks regardless of incubation tempera
ture and phosphate concentration.
Although there was no major effect of the phosphate
on the growth of S. aureus Z88, there was a general
trend; that is, in most readings, the higher the concentra
tion of SAPP, the lower were the initial absorbance readings
and the corresponding plate counts (Table 15). An explana
tion for this difference could be due to the pH of

Figure 13,
Figure 14.
Figure 15,
The average absorbance (660 nm) of S. aureus Z88 grown in BHI broth with 0%, 0.1%, 0.25% and 0.5% of sodium acid pyrophosphate (SAPP) for 48 hours
The average absorbance (660 nm) of S. aureus Z88 grown in BHI broth with 0%, 0.1%, 0.25% and 0.5% of sodium acid pyrophosphate (SAPP) for 48 hours.
The average absorbance (660 nm) of S. aureus Z88 grown in BHI broth with 0%, 0.1%, 0.25% and 0.5% of sodium acid pyrophosphate (SAPP) for 48 hours at 22°C

15°C SAPP Fig. 13 Fig. 14 37°C SAPP
o Control • 0.1°
A 0.25 a 0.5?
o Control
A 0.25%
32»34 16'24 46 4 Time (hours)
22°C SAPP
o Control • 0.1% A 0.25 • 0.5
1 . 2 0 M
8 16 '20
Time (hours)

115
Table 15. Average peak counts and absorbance readings of S. aureus Z88 grown in BHI broth at SAPP concen-trations of 0%, 0.1%, 0.25%, and 0.5% at 15°C, 22°C, and 37°C
Plate counts (cells/ml) SAPP % Temp
C° Time (h) Absorbance
0 15 24 _
0.1 15 24 -
0.25 15 24 -
0.5 15 24 -
0 15 48 .144 0.1 15 48 .130 0.25 15 48 .102 0.5 15 48 .092
0 22 24 .130 0.1 22 24 .106 0.25 22 24 .082 0.5 22 24 .055
0 22 48 1.270 0.1 22 48 1.140 0.25 22 48 1.170 0.5 22 48 .970
0 37 24 .724 0.1 37 24 .782 0.25 37 24 .746 0.5 37 24 .642
0 37 48 .570 0.1 37 48 .516 0.25 37 48 .538 0.5 37 48 .524
2.6x10^ 3.6x10^ 2.6x10% 1.4x10
1.1x10^ 4.6x10' 6.0x10^ 5.1x10
1.1x10® 9.5xl0' 6.7x10' 3.6x10 '
1.4xlOq 1.5xl0q 1.4xlOq 3.5x10*
5.1x1Op 5.8x10: 4.2x10; 3.3x10
4.4x1Op 3.5x1Op 4.7x10% 3.5x10°

116
the medium. Table 16 shows the initial pHs of three samples
of media. As the concentration of the SAPP is increased,
the pH of the medium decreased. This is due to the ioniza
tion of the sodium acid pyrophosphate (Knipe, 19 82) . The
number of organisms being lower initially at 24 hrs may be
due to the lowering of the pH. The measured pH samples
were never lower than 6.0. As previously discussed, a pH
no lower than 6.0 did not greatly influence the growth
of S. aureus when compared with the optimum pH 7.0
(Arvidson and Holme, 1971; Jarvis et , 1973). There
fore, pH may not fully account for these results.
Tables 17 through 19 show nuclease activity in the
presence of SAPP. The level of nuclease produced in the
presence of SAPP in the initial readings when nuclease was
detected was lower than flasks as the concentration of SAPP
was increased. The explanation for this result requires
further study.
NaCl
Figure 16 shows the effect of NaCl on the absorbance
of cultures of S. aureus Z88 at the temperatures 22° and
37°C. No growth was detected by absorbance at 15°C at
all NaCl concentrations during the 48 hour incubation
period. At 22°C, absorbance readings were observed only
in 5% NaCl within 48 hours. At 37°C, absorbance was
observed in 5% and 10% NaCl within 48 hours.

117
Table 16. pHs of BHI broth with added SAPP in percent concentrations of 0%, 0.1%, 0.25% and 0.5% of 3 autoclaved samples
SAPP (%) sample pH sample pH sample
0 7.17 7.27 6.91 0.10 6.90 7.08 6.58 0.25 6.58 6.80 6.43 0.50 6.32 6.53 6.05
Table 17. Nuclease activity of cultures of S. aureus Z88 grown in BHI broth containing various concentrations of SAPP at 37°C
Time CZ Readings Units Confidence (h) (mm) activity/ml interval (95%)
Experiment I
0 8 - - -
0 16 6.61 >15 .0 -
0 24 6.28 >15.0 —
0 32 6.05 >15.0 -
0 40 6.45 >15.0 —
0 48 6.25 >15.0
0.1 8 __ — -
0.1 16 6.33 >15.0 -
0.1 24 6.17 >15.0 -
0.1 32 6.56 >15.0 -
0.1 40 6.38 >15.0 -
0.1 48 6.57 >15.0 —
0.25 8 — __ -
0.25 16 5.74 >15.0 -
0.25 24 6.24 >15.0 -
0.25 32 6.69 >15.0 -
0.25 40 6.42 >15.0 —
0.25 48 6.41 >15.0
0.5 8 _ _
0.5 16 4.62 2.79 1.77-4 0.5 24 6.02 >15.0 —
0.5 32 6.42 >15.0 —
0.5 40 6.01 >15.0 —
0.5 48 6.51 >15.0 —

118
Table 17 (Continued)
SAPP (%) Time (h) CZ Readings (mm) Units
activity/ml Confidence
interval (95%)
Experiment II 0 8 - - -
0 16 6.11 >15.0 -
0 24 6.30 >15.0 -
0 32 5.81 14 .1 9.89-19.8 0 40 6.08 >15.0 -
0 48 6.57 >15.0 —
0.1 8 -
0.1 16 5.68 11.3 7.97-15.8 0.1 24 6.19 >15.0 -
0.1 32 6.21 >15.0 -
0.1 40 6.33 >15.0 -
0.1 48 6.41 >15.0
0.25 8 _ _ —
0.25 16 5.31 5.99 4.30-8.28 0.25 24 6.35 >15.0 -
0.25 32 6.04 >15.0 -
0.25 40 6.53 >15.0 -
0.25 48 6.05 >15.0 —
0.5 8 -
0.5 16 4.69 2.08 1.52-2.83 0.5 24 6.11 >15.0 -
0.5 32 6.28 >15.0 -
0.5 40 6.00 >15.0 -
0.5 48 5.85 >15.0 -
Table 18. Nuclease activity of cultures of S. aureus Z88 grown in BHI broth containing various concentrations of SAPP at 22°C
S^PP (%) Time ,h,
Experiment I 0 8 — — "*
0 16 0 24 6.37 5.82 3.50- 9.73 0 32 6.40 6.04 3.63-10.1 0 40 7.08 14.2 8.29-24.6 0 48 7.38 >15.0

119
Table 18 (Continued)
SAPP m, Time (h, a=t:iS/mi
0.1 8 -
0.1 16 -
0.1 24 6.12 0.1 32 6.87 0.1 40 7.18 0.1 48 7.37
0.25 8 —
0.25 16 -
0.25 24 6.09 0.25 32 7.02 0.25 40 7.00 0.25 48 7.55
0.5 8 —
0.5 16 -
0.5 24 4.91 0.5 32 6.73 0.5 40 6.34 0.5 48 7.33
Experiment II 0 8 -
0 16 -
0 24 2.62 0 32 5.34 0 40 5.57 0 48 6.46
0.1 8 —
0.1 16 -
0.1 24 3.41 0.1 32 5.69 0.1 40 5.78 0.1 48 6.42
0.25 8 _
0.25 16 -
0.25 24 2.55 0.25 32 5.41 0.25 40 5.76 0.25 48 5.94
4.25 2.58- 7.04 10.9 6.43-18.7 >15.0 - • >15.0 -
4.09 2.48- 6.77 13.2 7.71-22.8 12.9 7.52 22.2 >15.0
0.92 0.57-1.50 9.16 5.43-22.8 5.60 3.38-9.36
>15.0
< 0 . 0 8 2.73 1.78- 4.21 3.83 2.49- 5.95
14.2. 8.90-2 3.0
.16 0.10- 0.25 4.57 2.96- 7.13 5.22 3.37- 8.17
13.4^ 8.41-21.6
< 0 . 0 8 3.02 1.98- 4.68 5.07 3.28- 7.92 6.61 4.24-10.4

120
Table 18 (Continued)
SAPP (%, Time (h,
0.5 8 - -0.5 16 — — — 0.5 24 2.34 <0.08 0.5 32 5.28 2.50 1.64- 3.85 0.5 40 5.66 4.38 2.84- 6.81 0.5 48 6.27 10.76 6.80-17.2
Table 19. Nuclease activity of cultures of S. aureus Z88 grown in BHI broth containing various concentrations of SAPP at 15°C
Time (h)
Experiment I
0 8 - - -
0 16 - - -
0 24 - - -
0 32 4.13 0.35 0.21-0.57 0 40 3.24 0.11 0.07-0.19 0 48 5.93 3.35 2.04-5.51
0.1 8 — — —
0.1 16 - - -
0.1 24 - - -
0.1 32 3.23 0.11 0.06-0.20 0.1 40 4.06 0.32 0.19-0.52 0.1 48 5.49 1.92 0.18-3.13
0.25 8 _
0.25 16 - - —
0.25 24 - - —
0.25 32 2.88 <0.08 -
0.25 40 5.18 1.30 0.80-2.11 0.25 48 4.82 0.83 0.51-1.34

121
Table 19 (Continued)
qaPP f&i Timp CZ Readings Units Confidence (mm) activity/ml interval (95%)
0.5 8 - - —
0.5 16 - - —
0.5 24 - -
0.5 32 2.72 <0.08 —
0.5 40 4.15 0.36 0.22-0.58 0.5 48 3.75 0.21 0.13-0.36 Experiment II 0 8 - - —
0 16 - - -
0 24 0 0 -
0 32 3.22 0.12 0.08-0.19 0 40 3.73 0.25 0.16-0.40 0 48 4.54 0.84 0.55-1.28
0.1 8 _ __ -
0.1 16 - - -
0.1 24 - - —
0.1 32 2.64 <0.08 —
0.1 40 3.19 0.11 0.07-0.18 0.1 48 3.86 0.31 0.20-0.48
0.25 8 -
0.25 16 - - -
0.25 24 - - -
0.25 32 3.69 0.23 0.15-0.37 0.25 40 4.04 0.40 0.26-0.62 0.25 48 4.52 0.81 0.54-1.25
0.5 8 _ _ -
0.5 16 - - -
0.5 24 - - -
0.5 32 2.72 <0.08 • —
0.5 40 3.31 0.13 0.09-0.22 0.5 48 4.16 0.48 0.31-0.74
Figure 16. The average absorbance (660 nm) of S. aureus Z88 grown in BHI broth with 0%, 5% and 10% NaCl for 48 hours at 22° and 37°C

Fig. 16 NaCl
o Control (370C) A Control (22°C)
1.00
.40
<
. 10
2 4 6 8 10 12 14 16 18 20 22 24 26 28 30 32 34 36 38 40 42 44 46 48
Time (hours)

124
S. aureus is noted for its ability to survive and grow
in higher salt concentrations than are many other bacteria
(Jay, 1978; Minor and Marth, 1971). Although S. aureus has
been reported to grow in 15 to 20% NaCl (Baird-Parker, 1974;
Genigeorgis and Sadler,.1966a; Jay, 1978) no absorbance
readings were observed at 15% NaCl even at the optimum
temperature of 37°C within 48 hours. Plate counts
showed that numbers of cells did increase in 48 hours but
not in numbers sufficient to produce an absorbance reading.
Growth in the medium containing ̂ 5% NaCl is dependent
on other environmental conditions such as temperature
(Genigeorgis and Sadler, 1966a; Genigeorgis et al., 1971a;
Hojvat and Jackson, 1969; Lotter and Leistner, 1978).
As these conditions become more adverse to the growth of
S. aureus, the organism becomes more sensitive to NaCl
(Genigeorgis and Sadler, 1966a; Genigeorgis et al., 1971a;
Hojvat and Jackson, 1969). This would explain the de
crease in growth in the presence of NaCl as the tempera
ture decreased.
Tables 20 and 21 show nuclease activity of S. aureus
Z88 in the presence of NaCl. The primary observation is
that at 37°C, activity in 10% NaCl was lower than that
produced in 5% NaCl and the control flasks. The
absorbance readings for 10% NaCl at 48 hours were lower

125
Table 20. Nuclease activity of cultures of S. aureus Z88 grown in BHI broth containing various concentrations of NaCl at 37°C
NaCl (%) Time (h) CZ Reading (mm)
Units activity/ml
Confidence interval (95
Experiment I 0 8 3.06 <0.08 -
0 16 6.14 10.0' 6.48-21.2 0 24 6.14 10.0 6.48-21.2 0 32 6.37 <15.0 -
0 40 6.77 <15.0 -
0 48 6.35 14.9 7.49-29.5
5 8 -
5 16 4.08 0.20 0.10- 0.37 5 24 6.35 14.9, 7.49-29.5 5 32 6.64 <15.0 -
5 40 6.59 <15.0 -
5 48 6.76 <15.0 —
10 8 — — -
10 16 - - -
10 24 - - -
10 32 - - -
10 40 2.37 <0.08 -
10 48 5.32 2.10 1.13-3.85 Experiment II 0 8 3.41 0.15 0.87-0.24 0 16 6.51 >15.0 -
0 24 6.56 >15.0 -
0 32 6.72 >15.0 -
0 40 6.62 >15.0 -
0 48 6.89 >15.0
5 8 __ - -
5 16 - - -
5 24 6.51 >15.0 —
5 32 5.93 6.56 3.93-10.9 5 40 6.68 >15.0 -
5 48 5.76 5.08 3.06- 8.25
10 8 _ _ -
10 16 - - —
10 24 3.42 0.15 0.09-0.25 10 32 5.85 5.82 3.49-9,60 10 40 5.55 3.70 2.25-6.03 10 48 5.67 4.44 2.68-7.26

126
Table 21. Nuclease grown in trations
activity of cultures BHI broth containing of NaCl at 22°C
of S. aureus Z88 various concen-
HaCl ,%) Time ,h,
Experiment I 0 8 — —
0 16 0 24 2.31 <0.08 0 32 6.54 >15.0 0 40 6.62 >15.0 0 48 6.78 >15.0
5 5 5 5 5 5
8 16 24 32 40 48
4.84 5.91
0.96 6.92
0.50- 1.84 3.52-13.9
Experiment II 0 8 — — —
0 16 — — —
0 24 4.83 0.83 0.44-1.50 0 32 4.75 >15.0 0 40 6.88 >15.0 0 48 6.88 >15.0
5 5 5 5 5 5
8 16 24 32 40 48
4.88 5.30
0.91 2 . 0 2
0.49-1.65 1.09-3.70

127
than for 5% NaCl and the control (Figure 16). In Table 22,
the numbers of cells produced at 48 hours in 10% NaCl were
not as high as that produced in the control or in the
presence of 5% NaCl at the stationary phase (24 and 48
hours). The lower number of organisms could be responsible
for the lower activity readings.
At 22°C, nuclease activities in 5% NaCl did not reach
those in the control. Since growth did not reach the
stationary phase in 5% NaCl, the nuclease activity dif
ference in this experiment can be attributed only to the
lack of maximum growth in the presence of 5% NaCl. Greater
variation in nuclease activity was observed in the presence
of NaCl than in its absence and reproducible results were
difficult to obtain. Additional work needs to be done
to obtain a satisfactory explanation.
Table 22. Average plate counts, absorbance and CZ readings of S^. aureus Z88 at 24 and 48 hours in BHI at NaCl concentrations of 0%, 5% and 10% at 37°C
NaCl (%) CZ Readings (mm) Time (h) Absorbance Numbers
cell/ml
0 5
10
6.35 6.43 1.71
24 24 24
0.983 0.636 0 . 0 2 8
1.4xl0p 2.6x10% 1.3x10
0 5
10
6 . 6 2 6 . 2 6 5.50
48 48 48
0 . 8 2 0 0.546 0.424
7.9x10% 2.4x10° 8.4x10

128
KCl
Figures 17 and 18 show the effects of KCl on the ab-
sorbance of cultures of S. aureus Z88 grown at the tempera
tures of 22° and 37°C. No growth occurred at 15°C at any of
the KCl concentrations to produce absorbance readings or
nuclease activity. At 22°C, absorbance readings were
observed in 5% and 10% KCl in 48 hours. At 37°C,
absornbnce readings were observed in all three KCl concen
trations .
Greater numbers of cells of S. aureus Z88 were ob
served in the presence of high concentrations of KCl than
of NaCl. The primary effect NaCl has on the growth of an
organism, among other theories, is the reduction in the
water activity (Aw) of the environment (Marsh, 1983;
Terrell, 1983). KCl, like NaCl, is a salt and has this
same capacity to produce ions and to control A^. NaCl,
however, has a lower molecular weight (58.46) than does
KCl (78.56). On a percentage basis, a higher number of
moles of NaCl would be present than KCl; therefore, more
ions theoretically are produced giving a lower Aw. This
theory is beneficial in helping to explain growth at higher
percentage concentrations of KCl than NaCl.
At 37°C (Figure 17), absorbance readings indicative
of growth could be taken at about the same time for 5%

Figure 17. The average absorbance (660 nm) of S. aureus Z88 grown in BHI with 0%, 5%, 10% and 15%
"KCl for 48 hours at 37°C
Figure 18. The average absorbance (560 nm) of S. aureus Z88 grown in BHI with 0%, 5%, 10% and 15% KCl for 48 hours at 22°C

130
80 37°C KCI Fig. 17
Control 70
10% 60
50
30
20
10
14 18 22 26 30 34 38 42 46 2 6
Time (hours)
1.50 Fig. 18 22°C KCI
o Control 1.40
A 10: 1.30
1 . 2 0
90
.70
20
8 16 18 34
Time (hours)

131
KCl and 5% NaCl (Figure 16). Readings at 10% KCl occurred
sooner than for 10% NaCl; and the stationary phase was
observed earlier. At 22°C (Figure 18) growth was ob
served earlier in the presence of 5% KCl than in the
presence of 5% NaCl (Figure 16).
Tables 23 and 24 show the measurements of the clearing
zones and thermonuclease activities in the presence of vari
ous levels of KCl. The data in Table 23 show that the final
(48 hours) nuclease activity levels at 10% KCl were as high
as those produced in 5% KCl and the control. This result
differs from that for NaCl which had lower nuclease readings
at 48 hours in the presence of higher concentrations of NaCl.
The data in Table 25 explain this difference. Unlike the
results in Table 22, the numbers of organisms present at
48 hours in 10% KCl were not lower than those at 5% KCl and
the control. Therefore, nuclease activity would be ex
pected to be as high at 10% KCl as in the control and 5%
KCl.
Tables 24 and 26 on the other hand, showed that the
activity measured nor the number of cells with KCl present
did not reach the same level as in the control. With the
numbers of cells being lower than the control at 10% KCl,
nuclease activity was not expected to be as high.

132
Table 23. Nuclease activity of cultures of S. aureus Z88 grown in BHI broth containing various concentrations of KCl at 37°C
KCl (%) Time (h) CZ Readings Units Confidence (mm) activity/ml interval (95%)
Experiment I 0 8 0 16 0 24 0 32 0 40 0 48
6.61 6 . 2 8 6.05 6.45 6.25
>15.0 >15.0 >15.0 >15.0 >15.0
5 5 5 5 5 5
8 16 24 32 40 48
5.38 6.15 6.58 6.05 6.43
12.1 >15.0 >15.0 >15.0 >15.0
6.57-19.8
10 10 10 10 10 10
8 16 24 32 40 48
6 . 6 2 6 . 6 8 6 . 0 0 6.46
>15.0 >15.0 >15.0 >15.0
15 15 15 15 15 15
8 16 24 32 40 48
2.42 5.33
< 0 . 0 8 11.02 6.03-18.0
Experiment II 0 8 0 16 0 24 0 32 0 40 0 48
5 5 5 5 5 5
8 16 24 32 40 48
6.11 6.30 5.81 6 . 0 8 6.57
5.09 6.29 6.53 6.40 6.32
>15.0 >15.0 14.6 >15.0 >15.0
4.12 >15.0 >15.0 >15.0 >15.0
9 .90-19 .8
2.98-5.65

Table 23 (Continued)
133
KC^ Tdme fh) Readings Units Confidence KCl {%) Time (nj (nm) activity/ml interval (9 5%)
15 8 - -15 16 - -15 24 - -15 32 - -15 40 2,60 <0.08 15 48 4.46 1.41 1.03-1.91
Table 24. Nuclease activity of cultures of S. aureus Z88 grown in BHI broth containing various concentrations of KCl at 22°C
Km /&) Time i-h) Readings Units Confidence KCi {o) Time (ti) activity/ml interval (9
Experiment I 0 8 - - -
0 16 - - —
0 24 6.37 5.82 3.50- 9.73 0 32 6.40 6.04 3.63-10.1 0 40 7.08 14.2 8.29-24.6 0 48 7.38 >15.0 —
5 8 — _ -
5 16 - - -
5 24 3.83 0.24 0.14-0.39 5 32 6.30 5.33 3.21-8.88 5 40 5.81 2.88 1.76-4.72 5 48 6.27 5.13 3.10-8.55
10 8 __ __ -
10 16 - - -
10 24 - — —
10 32 4.33 0.45 0.27-0.73 10 40 4.87 0.88 0.54-1.43 10 48 5.82 2.91 1.78-4.78

134
Table 24 (Continued)
Kci (%, Tim« ,h,
Experiment II 0 8 r 0 16 -
0 24 2.62 0 32 5.34 0 40 5.57 0 48 6.46
5 8 _ 5 16 -
5 24 -
5 32 4.97 5 40 5.32 5 48 5.21
10 8 —
10 16 -
10 24 -
10 32 2.46 10 40 3.08 10 48 4.32
< 0 . 0 8 2.73 1.78- 4.21 3.83 2.49- 5.95
14.2. 8.90-23.0
1.58 1.04-2.42 2.65 1.73-4.09 2.25 1.48-3.47
< 0 . 0 8 0.10 0.06-0.16 0.60 0.40-0.93
Table 25. Average plate counts, absorbance and nuclease readings of S. aureus Z88 at 24 and 48 hours in BHI broth at 0%, 5%, and 10% KCl concentrations at 37°C
KCl („ Time (h, Absorbance
0 24 6.29 0.724 S.lxlOp 5 24 6.22 0.438 1.8x10% 10 24 6.15 0.436 1.7x10
0 48 6.41 0.566 4.9x10* 5 48 6.38 0.212 1.2x10* 10 48 6.22 0.420 7.2x10^
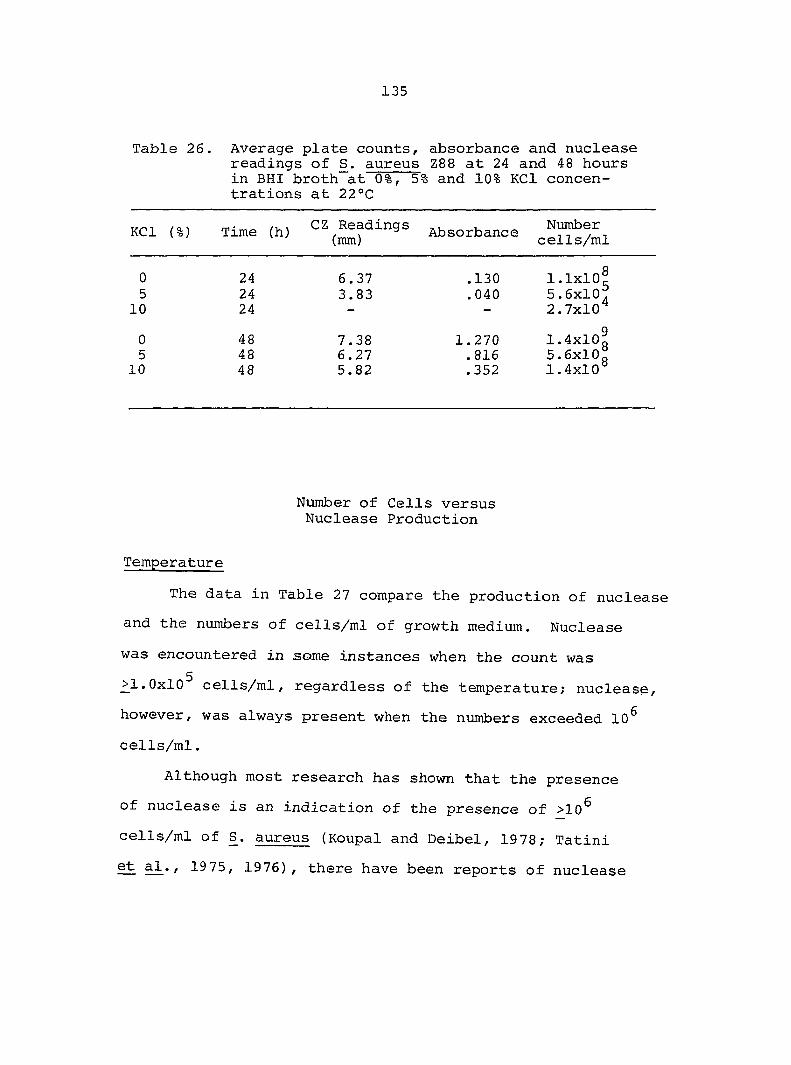
135
Table 26. Average plate counts, absorbance and nuclease readings of S. aureus Z88 at 24 and 48 hours in BHI broth at 0%, 5% and 10% KCl concentrations at 22°C
KCl Time <h, ^sorbance
0 24 6.37 .130 1.1x10 5 24 3.83 .040 5.6x10 10 24 - - 2.7x10
0 48 7.38 1.270 1.4x10 5 48 6.27 .816 5.6x10 10 48 5.82 .352 1.4x10
Number of Cells versus Nuclease Production
Temperature
The data in Table 27 compare the production of nuclease
and the numbers of cells/ml of growth medium. Nuclease
was encountered in some instances when the count was
>1.0x10 cells/ml, regardless of the temperature; nuclease,
however, was always present when the numbers exceeded 10^
cells/ml.
Although most research has shown that the presence
of nuclease is an indication of the presence of >10^
cells/ml of S. aureus (Koupal and Deibel, 19 78; Tatini
et al., 1975, 1976), there have been reports of nuclease

136
Table 21. Comparison of numbers of cells of S. aureus Z88 per ml and time of detection of nuclease in BHI broth incubated at 15°, 22° and 37°C
Temp (°C) Time (h) Presence of nuclease
Number cells/ml
15 28 _ 4.6x10^ 15 29 + c 15 30 + 6.8x10°
15 30 _ 1.4x10^ 15 31 - c 15 32 + 1.2x10
22 20 _ 4.6x10^ 22 21 - (Z 22 22 + 3.9x10°
22 20 1.5x10^ 22 21 -
22 22 + 2.8x10*
37 8 1.0x10^ 37 9 + -
37 10 + 4.4x10'
37 8 — 1.5x10^ 37 9 + "" "7 37 10 + 5.3x10
being present at counts of 10^ cells/g (Niskanen and
Nurmi, 1976), 10^ cells/g (Tatini et a2., 1975) and 10^
cells/g (Chesbro and Auborn, 1967) . Cords and Tatini
(1973) attribute the variability in results to several
factors including the nature of the growth medium, growth
conditions, variability in the recovery of S. aureus and
the variability in nuclease production between strains.

137
SAPP
Comparisons of numbers of cells and times of nuclease
detection in the presence of SAPP are shown in Tables 28
through 30. As observed previously, nuclease was sometimes
detected when about 10^ cells/ml were present but nuclease
was always detected when cell numbers exceeded 10^/ml.
SAPP at any level did not consistently delay production
of thermonuclease.
pH
Tables 31 through 33 show the effect of initial pH on
the production of nuclease. Again, the nuclease was de
tectable in some instances when the number of cells were
in the 10^/ml range and was always detected when numbers
>10^ cells/ml, regardless of pH and temperature. At an
initial pH of 6.3, nuclease was produced at times closely
paralleling that in the control flasks. As explained
previously, at this pH, S. aureus grows as well as at the
optimum pH of 7.0 (Arvidson and Holem, 1971; Jarvis
et al., 1973).
The time for nuclease production at the initial pH
values of 8.3 and 5.3 closely paralleled one another. Re
sults in the environmental studies might not have led to
this conclusion because the level of nuclease present was
higher at 8.3 than at 5.3. The conclusion from the data
in Tables 31 through 33 and the environmental studies is

138
Table 28. Comparison of numbers of cells of aureus Z88 per ml and time of detection of nuclease in BHI broth containing various concentrations of SAPP at 15°C
SAPP (%) Time (h) Presence of nuclease
Number cells/ml
0.1 28 1.1x10^ 0.1 29 -
0.1 30 + 2.0x10
0.1 30 3.6x10^ 0.1 31 -
- cz 0.1 32 + 2.4x10
0.25 30 _ 1.2x10® 0.25 31 -
0.25 32 + 3.1x10°
0.25 30 1.2x10^ 0.25 31 -
0.25 32 + 2.5x10
0.5 30 _ 1.9x10® 0.5 31 + c 0.5 32 + 3.2x10
0.5 30 2.0x10^ 0.5 31 - c 0.5 32 + 2,1x10

139
Table 29. Comparison of numbers of cells of S. aureus Z88 per ml and time of detection of nuclease in BHI broth containing various concentrations of SAPP at 22°C
SAPP (%) Time (h) Presence of Number nuclease cells/ml
0.1 22 - 3.1x10^ 0.1 23 + — ^ 0.1 24 + 8.2x10°
0.1 22 - 2.4x10^ 0.1 23 + —, 0.1 24 + 9.0x10
0.25 22 - 1.5x10^ 0.25 23 - - , 0.25 24 + 3.6x10®
0.25 22 - 1.4x10^ 0.25 23 + - r 0.25 24 + 2.9x10
0.5 22 - 7.6x10^ 0.5 23 - -0.5 24 + 1.4x10°
0.5 22 - 3.5x10 0.5 23 - -0.5 24 + 1.3x10°

140
Table 30. Comparison of numbers of cells of S. aureus Z88 per ml and time of detection of nuclease in BHI broth containing various concentrations of SAPP at 37°C
SAPP (%) Time (h) Pre^ence^of
0.1 8 - 4.3x10 0.1 9 + -0.1 10 + 7.9x10°
0.1 8 - 5.4x10 0.1 9 + -0.1 10 + 9.8x10°
0.25 8 - 4.5x10 0.25 9 + - f. 0.25 10 + 1.3x10°
0.25 8 - 4.3x10^ 0.25 9 + — g-0.25 10 + 1.4x10
0.5 8 - 7.5x10^ 0.5 9 + -0.5 10 + 1.0x10
0.5 8 - 2.4x10 0.5 9 + -0.5 10 + 5.8x10^

,141
Table 31. Comparison of numbers of cells of S. aureus Z88 per ml and time detection of nuclease in BHI broth at pHs 5.3, 6.3 and 8.3 at 15°C
^ Tiine (h) c"%l
5.3 46 - 1.3x10? 5.3 47 + - r 5.3 48 + 8.2x10°
5.3 44 - 2.8x10^ 5.3 45 + - 7 5.3 46 + 1.2x10
6.3 28 - 5.4x10^ 6.3 29 + — « 6.3 30 + 1.4x10'
6.3 28 - 6.6x10^ 6.3 29 + - f 6.3 30 + 1.1x10
8.3 46 - 4.0x10^ 8.3 47 + -, 8.3 48 + 9.6x10
8.3 44 - 4.3x10^ 8.3 45 -, 8.3 46 + 1.3x10°

142
Table 32. Comparison of numbers of cells of S. aureus Z88 per ml and time detection of nuclease in BHI broth at pH 5.3, 6.3 and 8.3 at 22°C
pH Time (h) Presence of Number nuclease cells/ml
5.3 28 - 2.2x10 5.3 29 - - , 5.3 30 + 5.2x10
5.3 26 - 1.8x10^ 5.3 27 - - . 5.3 28 + 8.4x10
6.3 22 - 4.4x10^ 6.3 23 - - , 6.3 24 + 6.2x10°
6.3 20 - 1.2x10^ 6.3 21 - - f. 6.3 22 + 2.8x10°
1.3 28 - 3.9x10 :.3 29 - -.3 30 + 1.6x10°
8.3 28 - 1.6x10 8.3 29 + - f. 8.3 30 + 4.6x10°

143
Table 33. Comparison of numbers of cells of S. aureus Z88 and time detection of nuclease in BHI broth at pH 5.3, 6.3 and 8.3 at 37°C
PB Time
5.3 8 - 6.4x10* 5.3 9 - -5.3 10 + 6.8x10^
5.3 10 - 1.3x10^ 5.3 11 + -, 5.3 12 + 1.2x10°
6.3 8 - 1.1x10^ 6.3 9 — - -J 6.3 10 + 2.6x10
6.3 8 - 7.0x10^ 6.3 9 + ~ -J 6.3 10 + 3.6x10
8.3 8 - 6.7x10^ 8.3 9 - - c 8.3 10 + 6.5x10^
8.3 8 - 1.3x10^ 8.3 9 - -8.3 10 + 1.8x10°

144
the level of nuclease produced at the initial 8.3 pH was
much higher than that at the initial pH of 5.3. This
result is the same as found by Jarvis et a^. (1973, 1975)
and Arvidson and Holme (1971) that a pH below 6.0 reduces
the level of thermonuclease and other extracellular pro
teins produced by S. aureus. The detection of the
presence of thermonuclease later at pH 8.3 (46 and 47
hours) in the experiments at 15°C than in the environ
mental assays (40 hours) was conceivably due to the combina
tion of extreme pH and temperature at which the organism
was grown.
NaCl and KCl
The data in Tables 34 through 36 show the same con
sistent result; nuclease was routinely detected when the
count was in the 10^ to 10^ range with a time lapse oc
curring before nuclease was detected regardless of NaCl or
KCl concentration or temperature.
The tables provide a comparison of the effects of
NaCl and KCl on nuclease production. Actually, 5% KCl
and 5% NaCl did not differ greatly in the time that
nuclease was produced at 22° and 37°C. Available infor
mation would support the contention that NaCl would have a
greater effect on S. aureus growth than KCl because of the
difference in the amount of ions produced that could lower

5 5 5
5 5 5
5 5 5
5 5 5
10 10 10
10 10 10
145
Comparison of numbers of cells of S. aureus Z88 and time detection of nuclease in BHI broth containing various concentrations of NaCl at 22° and 37°C
Temp ("C) Time (h)
22 28 - 1.3x10^ 22 29 - -, 22 30 + 3.8x10
22 28 - 1.4x10 22 29 - - f. 22 30 + 4.8x10
37 12 - 5.0x10 37 13 + - . 37 14 + 4.0x10
37 12 - 6.2x10^ 37 13 + - c 37 14 + 8.0x10
37 34 - 2.4x10 37 35 - - r 37 36 + 3.6x10^
37 34 - 2.1x10^ 37 35 - - f. 37 36 + 4.6x10

5 5 5
5 5 5
10 10 10
10 10 10
Ta]
KC:
5 5 5
5 5 5
10 10 10
10 10 10
146
Comparison of numbers of cells of S. aureus Z88 and time detection of nuclease in BHI broth containing various concentrations of KCl at 22°C
Tittip Presence of Number iime (n) nuclease cells/ml
30 — 5.0x10^ 31 + —•
32 + 5.0x10®
28 _ 5.4x10^ 29 -
30 + 3.8x10°
38 — 1.6x10® 39 - - G 40 + 7.6x10°
38 _ 1.4x10® 39 -
40 + 2.4x10*
Comparison of numbers of cells of S. aureus Z8 8 and time detection of nuclease in BHI broth containing various concentrations of KCl at 37°C
Presence of Number nuclease cells/ml
8 — 1.8x10^ 9 10 + 1.0x10^
10 _ 6.0x10^ 11 + -
12 + 2.7x10®
14 — 2.2x10^ 15 + 16 + 4.8x10®
14 _ 2.5x10^ 15 - c 16 + 1.5x10®

147
Table 36 (Continued)
KCl (%) Time (h) Presence of Number nuclease cells/ml
15 15 15
46 47 48
4.7x10 5
+ 2.5x10 6
15 15 15
46 47 48
1.1x10 5
+ 7.8x10 5
the Aw. Most researchers suggest using the same ionic
strength of KCl when replacing NaCl in processed products
(Dr. William Sveum, Personal Communication, Armour and
Company, Scottsdale, Arizona; Terrell, 1983). At a level
of 5%, NaCl does not severely hinder nuclease production
based on the results. A time difference in nuclease
production was observed when 10% NaCl and 10% KCl were
present at 37°C, showing that 10% NaCl has a much greater
effect on delaying nuclease production than 10% KCl. In
fact, 10% KCl did not hinder nuclease production at 37°C
much more than 5% NaCl did.

1.48
Extraction of Nuclease From Sausage Samples
The sausage samples supplied by Dr. William Sveum
(Armour and Company, Scottsdale, Arizona) had been inocu
lated with 10^ cells of S. aureus Z88 and were known to con
tain thermonuclease and enterotoxin A. The samples were
examined for the presence of thermonuclease by using the
extraction methods of Koupal and Deibel (1978) and Tatini
et al. (1976) with minor modifications.
Both assays were equally capable of detecting thermo
nuclease in the sausage. The Tatini method, however, gave
clearing zones that were easier to see than those in the
Koupal-Deibel assay. The clearing zones in the Koupal-
Deibel medium were cloudier and not as distinct. These
differences in reactions in the medium may be due to the
more extensive extraction procedure used in the method of
Tatini et aJL. (1976) . This method involved an adjustment
to an acidic pH (4.5), addition of 3M trichloroacetic acid
(TCA), addition of Trizma buffer, boiling and several centri-
fugations. The Koupal-Deibel method involved only an
adjustment to an acid pH, boiling and centrifugation.
Fewer steps are desirable for a rapid test, but in this
instance, less of the interfering substances may have been
removed, therefore, giving a less clear reaction.
The Koupal-Deibel extraction method, on the other

149
hand, is simpler and involves the use of fewer materials
and equipment.
Finally, the extraction procedure of Koupal and
Deibel left a fatty top layer when the sausage was used.
This lipid layer can interfere with the assay. To remove
this potentially hindering layer, cooling the tube for 15
to 30 minutes at 4°C or using a refrigerated centrifuge
(4°C) solidified the layer and it was removed with a
spatula to gain access to the aqueous layer containing
the enzyme.
In conclusion, the extraction method of choice depends
on the needs of the individual running the test. The Koupal-
Deibel extraction method is a good assay if one is looking
for a simple procedure that is easy to run and gives a
clearing reaction in a qualitative assay. The method of
Tatini et a^. (1976) is a better assay if one is looking
for a reaction that is clearer and would be the method
of choice if the method were quantitative as well as
qualitative. This would also be the method of choice
to detect low amounts of thermonuclease because of the
clearer reaction.

150
SUMMARY AND CONCLUSIONS
A quantitative assay was developed for the measure
ment of the concentration and activity of thermonuclease
present in a sample. The basis of the method is that of
Koupal and Deibel (1978) in which the thermonuclease
activity is detected by the development of clearing zones
in agar containing DNA. The quantitative assay was de
veloped in an effort to determine the amount of nuclease
produced by S. aureus Z88 under a variety of conditions.
The assay detected the presence of thermo
nuclease down to a level of 5 ng/ml (0.08 units/ml).
The relationship between clearing size and the log of
the concentration of activity of nuclease was shown to
be linear from 5 ng/ml (0.08 units/ml) through 1,000 ng/ml
(15.0 units/ml). In attempting to quantitate the method,
however, disadvantages that became evident were the spread in
the confidence interval (a=.05) and the necessity of taking
extra measurements to reduce the confidence intervals (a=.05).
Although the method could not provide exact nuclease
activities due to the variability in the measurements, the
assay was a useful tool in providing a rough estimate of
the activity of thermonuclease produced under various
environmental conditions.

151
In the development of the assay, information was
gathered that might prove useful in the qualitative use of
the test. First of all, incubation for longer periods of
time increases the size of the clearing. This information
would prove highly useful if the investigator suspected
low amounts of thermonuclease present and did not see a
clearing reaction after one hour. The enzyme is more
stable in BHI broth, probably due to the presence of
certain constituents. If all these constituents are not
present, the enzyme may not be as stable and easy to
detect. Finally, using the lowest level of nuclease the
assay can detect, it could be used as a standard when
running samples and limit the chance of any false positives
occurring.
The growth studies showed that, with the appropriate
number of cells/ml in the initial inoculum, S. aureus can
multiply and produce nuclease in BHI broth at the initial
pHs of 5.3, 6.3, 7.0 and 8.3, in the presence of SAPP at
levels of 0.1, 0.25 and 0.5% and at temperatures of 15°, 22°
and 37°C. Growth and nuclease production varied in 5%, 10%
and 15% KCl and 5%, 10% and 15% NaCl, depending on the
temperature. No nuclease production at 15°C was observed
at the concentrations of KCl and NaCl and incubation times
used.
Growth and nuclease production by S. aureus Z88

152
at pH 6.3 parallel growth and nuclease production at the
optimum pH (7.0). At pH values of 8.3 and 5.3, growth and
nuclease production were delayed but appeared when numbers
of cells exceeded 10^/ml in some experiments but always
when numbers were greater than 10^ cells/ml.
SAPP had no definitive affect on growth and on
nuclease production of S. aureus Z88 at all three tempera
tures. There was a noticeable trend, however, that as the
concentration of the SAPP increased, plate counts and activi
ties also decreased.
NaCl had a more pronounced effect on nuclease pro
duction and on growth of S. aureus Z88 than did KCl. The
organism grew more rapidly and produced relatively higher
activitives of nuclease in the presence of higher per
centages of KCl than NaCl.
The numbers of cells present when nuclease was first
detected was greater than 10^ cells/ml in some experi
ments; thermonuclease was always present when counts
were greater than 10^ cells/ml.
The results of studies involving the extraction of
nuclease from sausage showed that the method of Tatini et al.
(1976) yielded clearer zones than the method of Koupal and
Deibel (1978). The Tatini method, however, requires more
time and equipment than the Koupal and Deibel method; thus, a
compromise must be made in deciding if clearer zones or

153
shorter time is of paramount importance. For a qualitative
test as might be used in quality control, time may be more
important. In the Koupal-Deibel method, lipid was found to
be a potential hindrance in the assay. Refrigeration soon
after or during centrifugation and removing the solidifed
lipid solved this problem.
Based on the results of the experiments the conclusions
of this research are:
1. The relationship between the measured clearing zone
and the log of the nuclease concentration or activity is
linear from 5 ng (0.08 units) to 1000 ng (15.0 units).
2. The limit of sensitivity of the assay was 5 ng/ml
(0.08 units/ml).
3. The longer the incubation time up to two hours,
the larger clearing zone.
4. The thermonuclease enzyme gave larger clearing
zones when diluted with BHI broth than with Trizma buffer,
regardless of pH.
5. Day-to-day variation influenced the size of the
clearing zones.
6. A larger inoculum of S. aureus Z88 was needed to
produce nuclease in 48 hours in BHI broth when low tempera
tures were used.
7. When incubation of S. aureus was lower than 37°C
(22° and 15°C) growth and nuclease production in S. aureus

154
Z8 8 were delayed.
8. Growth and nuclease production were essentially
the same at the initial pH values of 7.0 and 6.3, but at
pHs 8.3 and 5.3, growth and nuclease production are delayed.
9. SAPP appeared to delay the growth and nuclease
production by S. aureus Z88.
10. NaCl was more detrimental than KCl to growth and
nuclease production.
11. In some experiments, nuclease was present when
the plate count was greater than 10^ cells/ml but nuclease
was always present when the count was greater than 10^
cells/ml.
12. Extracts prepared by the method of Tatini .e;t al.
(1976) yielded clearer reactions in the K-D medium than
did the method of Koupal and Deibel (1978).

155
RECOMMENDATIONS
The quantitative assay used in this research provides
a measure of thermonuclease production. Due to the amount
of variability between the measurements, the assay needs
some refinement. Suggestions would include the investment
in equipment to cut wells in a more uniform manner and a
zone reader that would make the zones of clearing in the
agar easier to measure. Sensitivity of the assay could be
increased by reducing the percent of agar present within
limits. Refinement of the quantitative assay would give
more confidence in the qualitative assay particularly as
to its sensitivity.
Studies should be continued on how various compounds
might affect nuclease production in foods and thus
affect the usefulness of thermonuclease as an indicator
of the growth of S. aureus and the presence of enterotoxin.
Comparisons of NaCl and KCl crould be done on a molar
basis to give equivalent ionic strengths. Research with
phosphates, including sodium acid pyrophosphate should be
continued to determine what effects these compounds may
have on growth and nuclease production. These experi
ments should be done in broth and in meat products as well.
Analysis for the presence of enterotoxin should be done in
conjunction with thermonuclease analyses.

156
LITERATURE CITED
Alexander, M., L. A. Heppel, and J. Hurwitz. 1961. The purification and properties of micrococcal nuclease. J. Biol. Chem. 236 (11): 3014-3019.
Anfinsen, C. B., P. Cuatrecasas, and H. Taniuchi. 1971. Staphylococcal nuclease, chemical properties and catalysis. Pages 177-204 in P. D. Boyer, ed. The enzymes. Vol. 4. 3rd ed. Academic Press, New York, NY. 896 pp.
Arvidson, S., and T. Holme. 1971. Influence of pH on the formation of extracellular^p^^teins by Staphylococcus aureus. Acta Pathol. Microbiol. Scand., Section" B, /9: 406-413.
Arvidson, S., T. Holine, and T. Wadstrom. 1971 Influence of cultivation conditions on the production of extracellular proteins by Staphylococcus aureus. Acta Pathol. Microbiol. Scahd. Section B, 79:399-405.
Ayres, J. C. 1955. Microbiological implications in handling, slaughtering and dressing of meat animals. Adv. Food Res. 6:109-161.
Ayres, J. C. 1960. The relationship of organisms of the genus Pseudomonas to the spoilage of meat, poultry and eggs. J. Appl. Bacterid. 23:471-486.
Baird-Parker, A. C. 1965. The classification of staphylococci and micrococci from world-wide sources. J. Gen. Microbiol. 38:363-387.
Baird-Parker, A. C. 1971. Factors affecting the production of bacterial food poisoning toxins. J. Appl. Bacterid. 34:181-197.
Baird-Parker, A. C. 1974. Genus II. Staphylococcus. Pages 483-489 ̂ R. E. Buchanan and W. W. Carmichael, eds. Bergey's manual of determinative bacteriology. 8th ed. Williams and Wilkins Company, Baltimore, MD.
Banwart, G. J. 1981. Basic food microbiology. AVI Publishing Company, Westport, CT. 519 pp.

157
Barber, L. E., and R. H. Deibel. 1972. Effect of pH and oxygen tension on staphylococcal growth and entero-tox.i.n formation in fermented sausage. Appl. Microbiol. 24:891-898.
Bard, J., and W. E. Townsend. 1978. Meat curing. Pages 452-459 in J. F. Price and B. S. Schweigert, eds. The science of meat and meat products. 2nd ed. Food and Nutrition Press Inc., Westport, CT.
Barry, A. L., R. V. F. Lachica, and F. W. Atchison. 1973. Identification of Staphylococcus aureus by simultaneous use of tube coagulase and thermonuclease tests. Appl. Microbiol. 25:496-497.
Bartlett, R. C., and M. F. Mazens. 1971. Effect of plate size and location of disc on zone diameter in the disc antimicrobial susceptibility test. Appl. Microbiol. 22:372-376.
Batish, V. K., H. Chandler, and B. Ranganathan. 1982. Characterization of deoxyribonuclease-positive enterococci isolated from milk and milk products. J. Food Prot. 45 (4) :348-352.
Bennett, R. W. 1976. Staphylococcal enterotoxins. Pages XII-l-XII-16 in Food and Drug Admin., ed. Bacteriological analytical manual. A.O.A.C., Arlington, VA.
Bennett, R. W. and F. McClure. 1976. Collaborative study of the serological identification of staphylococcal enterotoxins by the microslide gel double diffusion test. J. Assoc. Anal. Chem. 59:594-601.
Bennett, R. W., and F. McClure. 1980. Extraction and separation of staphylococcal enterotoxin in foods: collaborative study. J. Assoc. Anal. Chem. 63 (6)::1205-1210.
Bennett, R. W., S. W. Keoseyan, S. R. Tatini, H. Thota and W. S. Collins, II. 1973. Staphylococcal enterotoxin: A comparative study of serological detection methods. Can. Inst. Food Sci. Technol. J. 6:131-134.
Bergdoll, M. S. 1970. Enterotoxins. Pages 265-326 ̂ T. C. Montie, S. Kadis and S. J. Ajl, eds. Microbial toxins. Vol. 3. Academic Press, New Yo'frk., NÎ.

158
Bergdoll, M. S. 1972. The enterotoxins. Pages 301-331 ^ J, O. Cohen, ed. The staphylococci. Wiley-ïnterscience, New York, NY.
Bergdoll, M. S. 1973. Enterotoxin detection. Pages 287-290 in B. C. Hobbs and J. H. B. Christian, eds. The microbiological safety of food. Academic Press, New York, NY.
Bergdoll, M. S., and R. W. Bennett. 1976. Staphylococcal enterotoxins. Pages 387-416 ̂ M. L. Speck, ed. Compendium of methods for the microbial examinations of foods. Am. Pub. Health Assoc., Washington, DC.
Bergdoll, M. S. and R. Reiser. 19 80. Application of radioimmunoassay for detection of staphylococcal enterotoxins in foods. J. Food Prot. 43(l):68-72.
Bergdoll, M. S., J. K. Czop and S. S. Gould. 1974. Enterotoxin synthesis by the staphylococci. Ann. N.Y. Acad. Sci. 236:307-317.
Bergdoll, M. S., R. Reiser and J. Spitz. 1976. Staphylococcal enterotoxins detection in food. Food Technol. 30(5);80-84.
Bryan, F. L. 1976. Staphylococcus aureus. Pages 12-128 ̂ M. P. de Figueiredo and D. F. Splittstoesser, eds. Food microbiology: Public health and spoilage aspects. AVI Publishing Company, Westport, CT. 492 pp.
Buchanan, R. L., and M. Solberg. 1972. Interaction of sodium nitrite, oxygen and pH on growth of Staphylococcus aureus. J. Food Sci. 37:81-85.
Burton, K. 1956. A study of the conditions and mechanism of the diphenylamine reaction for the colorimetric estimation of deoxyribonucleic acid. Biochem. J. 62:315-323.
Carpenter, D. F. and G. J. Silverman. 1976. Synthesis of staphylococcal enterotoxin A and nuclease under controlled fermentor conditions. Appl. Environ. Microbiol. 31 (2) :243-248.
Carret, G., J. P. Flandrois, R. Bismuth and M. Saulnier. 1982. Relative value of staphylocoagulase and fibrinogen affinity for the identification of Staphylococcus aureus. J. Appl. Bacterid. 53:351-354.

159
Gasman, E. P., and R. W. Bennett. 1965. Detection of staphylococcal enterotoxin in food. Appl. Microbiol. 13:181-189.
Gasman, E. P., M. S. Bergdoll, and J. Robinson. 1963. Designation of staphylococcal enterotoxins. J. Bacterid. 85:715-716 .
Gasman, E. P., D. W. McGoy, and P. J. Brandly. 1963. Staphylococcal growth and- enterotoxin production in meat. Appl. Microbiol. 11:498-500.
Gastellani, A. G., and G. F. Niven, Jr. 1955. Factors affecting the bacteriostatic action of sodium nitrate. Appl. Microbiol. 3:154-159.
Ghesbro, W. R. and K. Auborn. 1967. Enzymatic detection of the growth of Staphylococcus aureus in foods. Appl. Microbiol. 15 ill50-1159.
Ghu, F. S., K. Thadhani, E. J. Schantz and M. S. Bergdoll. 1966. Purification and characterization of staphylococcal enterotoxin A. Biochemistry 5:3281-3289.
Clancy, G. F. 1974. The cocci. Pages 231-246 in A. I. Laskin and H. A. Lechevalier, eds. Handbook of microbiology. CRC Press, Cleveland, OH.
Clark, J. M., and R. L. Switzer. 1977. Experimental biochemistry. 2nd ed. W. H. Freeman Company, San Francisco, CA. 335 pp.
Cords, B. R., and S. R. Tatini. 1973. Applicability of heat-stable deoxyribonuclease assay for assessment of staphylococcal growth and the likely presence of enterotoxin in cheese. J. Dairy Sci. 56(12):1512-1519.
Cox, D. F. 1971. Methods for data analysis. Part I. D. F. Cox, Ames, lA. 202 pp.
Cuatrecasas, P., S. Fuchs, and G. B. Anfinsen. 1967. Catalytic properties and specificity of the extracellular nuclease of Staphylococcus aureus. J. Biol. Chem. 242 (7) :1541-1547.
Cunningham, L. B., W. Catlin, and M. Privât de Garille. 1956. A deoxyribonuclease of Micrococcus pyogenes. J. Amer. Chem. Soc. 78:4642-4645.

160
Dack, G. M., W, E. Cary, 0. Woolpert and H. Wiggers. 193 0. An outbreak of food poisoning proved to be due to a yellow hemolytic staphylococcus. J. Prev. Med. 4: 167-175.
Dahiya, R. S., and M. L. Speck. 1968. Hydrogen peroxide formation by lactobacilli and its' effect on Staphylococcus aureus. J. Dairy Sci. 51:1568-1572.
Dawes, I. W. 1976. Microbial physiology. Vol. 4. Blackwell Scientific Publications, Oxford, England. 185 pp.
Deibel, R. H., G. D. Wilson, and C. F. Niven, Jr. 1961. Microbiology of meat curing IV. A lyophilized Pediococcus cerevisiae starter culture for fermented sausage. Appl. Microbiol. 9:239-243.
Denny, C. B., P. L. Tan and C. W. Bohrer. 1966. Heat inactivation of staphylococcal enterotoxin A. J. Food Sci. 31:762-767.
Desrosier, N. W., and J. N. Desrosier. 1977. The technology of food preservation. 4th ed. AVI Publishing Co., Westport, CT. 558 pp. .
Devriese, L. A., and A.- Van De Kerckhove. 1979. A comparison of methods and the validity of deoxyribonuclease tests for the characterization of staphylococci isolated from animals. J. Appl. Bacteriol. 46:385-393.
Dolman, C. E., and R. J. Wilson. 1938. Experiments with staphylococcal enterotoxin. J. Immunol. 35:13-30.
Dolman, C. E., R. J. Wilson, and W. H. Cockcroft. 1936. A new method of detecting staphylococcus enterotoxin. Can. J. Public Health 27:489-493.
Elek, S.,D. 19 59. Staphylococcus pyogenes and its relation to disease. E. and S. Livingstone LTD. Edinburgh and London, England. 767 pp.
Emswiler-Rose, B. S., R. W. Johnston, M. E. Harris, and W. H. Lee. 1980. Rapid detection of staphylococcal thermo-nuclease on casings of naturally contaminated fermented sausages. Appl. Environ., Microbiol. 40(1):13-18.
Erickson, A., and R. H. Deibel. 1973a. Production and heat stability of staphylococcal nuclease. Appl. Microbiol. 25:332-336.

161
Erickson, A., and R. H, Deibel. 1973b. Turbidimetric assay of staphylococcal nuclease. Appl. Microbiol. 25^337-341,
Evans, J. B., and C. F. Niven, Jr. 1950. A comparative study of known food poisoning staphylococci and related varieties. J. Bacterid. 59:545-550.
Forrest, J. C. 1975. Principles of meat science. W. H. Freeman Publ. Co., San Francisco, CA. 417 pp.
Fox, J. B., and D. F. Holtman. 1968. Effect of an anerobiosis on staphylococcal nuclease production. J. Bacterid. 95 (5) :1548-1550 .
Freed, R. C., M. L. Evenson, R. Reiser and M. S. Bergdoll. 19 82. Enzyme-linked immunosorbent assay for detection of staphylococcal enterotoxins in foods. Appl. Environ. Microbiol. 44(6):1349-1355.
Fritz, J. S., and G. H. Schenk. 1974. Quantitative analytical chemistry. 3rd ed. Allyn and Bacon, Boston, MA. 689 pp. .
Fung, D. Y. C., and J. Wagner. Capillary tube assay for staphylococcal enterotoxins A, B, and C. Appl. Environ. Microbiol. 21:.559-561.
Genigeorgis, C., and W. W. Sadler. 1966a. Effect of NaCl and pH on enterotoxin B production. J. Bacterid. 92(5) :1383-1337.
Genigeorgis, C., and W. M. Sadler. 1966b. Immunoflucres-cent detection of staphylococcal enterotoxin B. II. Detection in foods. J. Food Sci. 31:605-609.
Genigeorgis, C., M. S. Foda, A. Mantis, and W. W. Sadler. 1971a. Effect of sodium chloride and pH on enterotoxin C production. Appl. Microbiol. 21:862-866,
Genigeorgis, C., M, Savoukidis, and S, Martin, 1971b, Initiation of staphylococcal growth in processed meat environments. Appl. Microbiol. 21:940-942.
Gherna, R. L. 1981. Preservation. Pages 208-217 ̂ P. Gerhardt, R. G. E. Murray, R. N. Costilow, E. W. Nester, W. A. Wood, N. R. Krieg, and G. B. Phillips, eds. Manual of methods for general bacteriology. Am. Soc. Microbiol., Washington, DC.

162
Gilbert, R. J., and A. A. Wieneke. 1973. Staphylococcal food poisoning with special reference to the detection of enterotoxin in food. Pages 273-284 in B. C. Hobbs and J. H,- B. Christian, eds. The microbiological safety of food. Academic Press, New York, NY.
Gilliland, S. E., F. F. Busta, J. J. Brinda and J. E. Campbell. 1976. Aerobic plate count. Pages 107-131 ̂ M. L. Speck, ed. Compendium of methods for the microbiological examinations of foods. Am. Pub. Health Assoc., Washington, DC.
Gramoli, J. L. and B. J. Wilkinson. 1978. Characterization zation and identification of coagulase-negative, heat-stable deoxyribonuclease-positive staphylococci. J. Gen. Microbiol. 105:275-285.
Graves, R. R., and W. C. Frazier. 1963. Food microorganisms influencing the growth of Staphylococcus aureus. Appl. Microbiol. 11:513-516.
Gray, H. B., and G. P. Haight. 19 67. Basic principles of chemistry. W. A. Benjamin Inc., New York, NY. 595 pp.
Haines, W. C., and L. G. Harmon. 1973. Effect of selected lactic acid bacteria on growth of Staphylococcus aureus and production of enterotoxin. Appl. Microbiol. 25:436-441..
Hall, H. E. 1968. Enterotoxin and enzyme production by a selected group of Staphylococcus aureus cultures. Bacterid. Proc. 1968:77-78.
Hallynck, T. H., and J. Pijck. 1978. An agar well punching-sucking device for diffusion assays. J. Antimicrob. Chemother. 4:94-9 6.
Heins, J. N., J. R. Suriano, H. Taninchi, and C. B. Anfinsen. 1967. Characterization of a nuclease produced by Staphylococcus aureus. J. Biol. Chem. 212(5):1016-1020.
Hewitt, W. 1977. Microbiological assay: An introduction to quantitative principles an evaluation. Academic Press, Inc., New York, NY.
Hirsch, A., and D. M. Wheater. 1951. The production of antibiotics by streptococci. J. Dairy Res. 18:193-197.

163
Hojvat, S. A., and H. Jackson. 1969. Effects of NaCl and temperature on the growth and production of enterotoxin B by Staphylococcus aureus. Can. Inst. Food Tech. J. 2(2) :56-59 .
Horney, D. L., and D. A. Webster. 1971. Deoxyribonuclease: A sensitive assay using radial diffusion in agarose containing methyl green-DNA complex. Biochim. Biophys. Acta 247:54-61.
Houck, J. C. 1958. The microdetermination of ribonuclease. Arch. Biochem. Biophys. 73:384-390.
Houck, J. C. 1959. The turbidimetric determination of deoxyribonuclease activity. Arch. Biochem. Biophys. 82:135-144.
landolo, J. J., C. W. Clark, L. Bluhm, and Z. J. Ordal. 1965. Repression of Staphylococcus aureus in associative culture. Appl. Microbiol. 13:646-649.
Ibrahim, G. F., and A. K. Baldock. 1981. Thermostable deoxyribonuclease content and enterotoxigenicity of Cheddar cheese made with sub-normal starter activity. J. Food Prot. 44 (9):655-660.
Jarvis, A. W., and R. C. Lawrence. 1969. A micro-method for the quantitative determination of deoxyribonuclease. Can. J. Biochem. 47:673-675.
Jarvis, A. W., and R. C. Lawrence. 1971. Production of extracellular enzymes and enterotoxins A, B, and C by Staphylococcus aureus. Infect. Immun. 4 (2);110-115.
Jarvis, A. W., R. C. Lawrence, and G. G. Pritchard. 1973. Production of staphylococcal enterotoxins A, B, and C under conditions of controlled pH and aeration. Infect. Immun. 7(6):847-854.
Jarvis, A. W., R. C. Lawrence, and G. G. Pritchard. 1975. Glucose repression of enterotoxins A, B,and C and other extracellular proteins in staphylococci'in batch and continuous culture. J. Gen. Microbiol. 86:75-87.
Jasper, D. E. 1973. Thermostable nuclease production by staphylococci in milk samples from bovine mastitis. Am. J. Vet. Res. 34 (3) :445-446.
Jay, J. M. 1978. Modern food microbiology. 2nd ed. D. van Nostrand, New York, NY. 479 pp.

164
Jeffries, C. D., D. F. Holtman, and D. G. Guse. 1957. Rapid method for determining the activity of microorganisms on nucleic acids. J. Bac'teriol. 73 :590-591.
Johnson, H. M., J. A. Bukovic and P. E. Kauffman. 1973. Staphylococcal enterotoxins A and B: solid-phase radioimmunoassay. Appl. Microbiol. 22:837-841.
Kamman, J. F., and S. R. Tatini. 1977. Optimal conditions for assay of staphylococcal nuclease. J. Food Sci. 42 (2):421-424.
Kato- E., M. Khan, L. Kujovich and M. S. Bergdoll. 1966. Production of enterotoxin A. Appl. Microbiol. 14: 966-972.
Knipe, C. L. 1982. Effects of inorganic polyphosphates on reduced sodium and conventional meat emulsion characteristics. Ph.D. Dissertation. Library, Iowa State University, Ames, lA. 249 pp.
Koch, A. L. 1981. Growth measurement. Pages 179-207 P. Gerhardt, R. G. E. Murray, R. N. Costilow, E. W. Nester, W. A. Wood, N. R. Krieg, and G. B. Phillips, eds. Manual of methods for general bacteriology. Am. Soc. Microbiol., Washington, DC.
Koupal, A., and R. H. Deibel. 1978. Rapid qualitative method for detecting staphylococcal nuclease in foods. Appl. Environ. Microbiol. 35 (6) :1193-1197.
Kramlich, W. E. 1978. Sausage products. Pages 484-512 ̂ J. F. Price and B. S. Schweigert, eds. The science of meat and meat products. 2nd ed. Food and Nutrition Press Inc., Westport, CT.
Kunitz, M. 1950. Crystalline desoxyribonuclease I. Isolation and general properties. Spectrophotometric method for the measurement of desoxyribonuclease activity. J. Gen. Phys. 33:349-362.
Kuo, J. K. S., and G. J. Silverman. 1980. Application of enzyme-linked immunosorbent assay for detection of staphylococcal enterotoxins in food. J. Food Prot. 43(5):404-407.

165
Kurnick, N. B. 1950. The quantitative estimation of desoxyribose-nucleic acid based on methyl green staining. Exp. Cell Res. 1:151-158.
Lachica, R. V. F., and R. H. Deibel. 1969. Detection of nuclease activity in semisolid and broth cultures. Appl. Microbiol. 18: 174-176.
Lachica, R. V. F., K, F. Weiss and R. H. Deibel. 1969. Relationships among coagulase, enterotoxin, and heat stable deoxyribonuclease production by Staphylococcus aureus. Appl. Microbiol. 18:126-127.
Lachica, R. V. F., C. Genigeorgis, and P. D. Hoeprich. 1971. Metachromatic agar-diffusion methods for detecting staphylococcal nuclease activity. Appl. Microbiol. 21:585-587.
Lachica, R. V. F., P. D. Hoeprich, and C. E. Franti. 1972a. Convenient assay for staphylococcal nuclease by the metachromatic well-agar-diffusion technique. Appl. Microbiol. 24:920-923.
Lachica, R. V. F., P. D. Hoeprich, and C. Genigeorgis. 1972b. Metachromatic agar-diffusion microslide technique for detecting staphylococcal nuclease in foods. Appl. Microbiol. 23:168-169.
Lachica, R. V. F., P. D. Hoeprich, and H. P. Riemann. 1972c. Tolerance of staphylococcal thermonuclease to stress. Appl. Microbiol. 23:994-997.
Lanyi, J. K., and J. Lederberg. 1966. Fluorescent method for the detection of excreted ribonuclease around bacterial colonies. J. Bacterid. 92:1469-1472.
Lechowich, R. V., J. B. Evans, and C. F. Niven, Jr. 1956. Effect of curing ingredients and procedures on the survival and growth of staphylococci in and on cured meats. Appl. Microbiol. 4:360-363.
Lee, I. C., L. G. Harmon, and J. F. Price. 1977. Growth and enterotoxin production by staphylococci in genoa salami. J. Food Prot. 40:325-329.
Lotter, L. P. and L. Leistner. 1978. Minimal water activity for enterotoxin A production and growth of Staphylo-coccus aureus. Appl. Environ. Microbiol. 36(2): 377-380.

166
Markus, Z. H., and G. J. Silverman. 1970. Factors affecting the secretion of staphylococcal enterotoxin A. Appl. Microbiol. 20:492-496.
Marsh, A. C. 1983. Processes and formulations that affect the sodium content of foods. Food Technol. 37(3):45-49.
McCoy, D. W., and J. E. Faber. 19 66. Influence of food microorganisms on staphylococcal growth and enterotoxin production in meat. Appl. Microbiol. 14:3,72-377.
Medwid, R. D., and D. W. Grant. 1980. Inactivation of staphylococcal thermonuclease by an enzyme-like factor produced by Streptococcus faecalis subsp. liquefaciens. J. Food ProtI 43(3) :201-202T
Menzies, R. E. 1977. Comparison of coagulase, deoxyribo-nuclease (DNase) and heat-stable nuclease tests for identification of Staphylococcus aureus. J. Clin. Pathol. 30:606-608.
Michaelis, L., and S. Granick. 1945. Metachromasy of basic dyestuffs. J. Am. Chem. Soc. 67:1212-1219.
Miller, A., W. E. Sandine and P. R. Elliker. 1971. Extracellular nuclease in the genus Lactobacillus. J. Bacteriol. 108 (1) :604-606 .
Miller, B. A., R. Reiser, and M. S. Bergdoll. 1978. Detection of staphylococcal enterotoxins A, B, C, D and E in foods by radioimmunoassay, using staphylococcal cells containing protein A as immunoabsorbent. Appl. Environ. Microbiol. 36(3);421-426 .
Minor, T. E. and E. H. Marth. 1971. Staphylococcus aureus and staphylococcal food intoxications. A review. I. The staphylococci: characteristics, isolation, and behavior in artificial media. J. Milk and Food Technol. 34 (11) :557-564.
Minor, T. E. and E. H, Marth. 1972. Staphylococcus aureus and staphylococcal food intoxications. A review. II. Enterotoxins and epidemiology. J. Milk and Food Technol. 35(l):21-29.

167
Niskanen, A., and E. Nurmi. 1976. Effect of starter culture on staphylococcal enterotoxin and thermonuclease production in dry sausage. Appl. Environ. Microbiol. 31(l):ll-20.
Niskanen, A., and E. Nurmi. 1977. Correlation of enterotoxin and thermonuclease production with some physiological and biochemical properties of staphylococcal strains isolated from different sources. J. Food Prot. 40:543-548.
Notermans, S., H. L.'Verjans, J. Bol and M. van Schothorst. 1978. Enzyme linked immunosorbent assay (ELISA) for determination of Staphylococcus aureus enterotoxin type B. Health Lab. Sci. 15:28-31.
Oberhofer, T. R., and W. C. Frazier. 1961. Competition of Staphylococcus aureus with other organisms. J. Milk Food Technol. 24:172-175.
Olson, J. C. Jr. 1976. Bacteriological analytical manual, îth ed. A.O.A.C., Washington, DC.
Ouchterlony, O. 1958. Diffusion-in-gel methods for immunological analysis. Progress Allergy 5:1-77.
Page, L. B. 1981. The hazards of hypertension and the determinants of blood pressure in populations. Pages 231-254 ̂ H. Villarreal, ed. Hypertension. John Wiley and Sons, New York, NY.
Park, C. F., H. B. El Derea, and M. K. Rayman. 1978. Evaluation of staphylococcal thermonuclease (TNase) assay as a means of screening foods for growth of staphylococci and possible enterotoxin production. Can. J. Microbiol. 24:1135-1139.
Park, C. E., H. B. El Derea, and M. K. Rayman. 1979. Effect of non-fat dry milk on recovery of staphylococcal thermonuclease from foods. Can. J. Microbiol. 25:44-46.
Payne, D. N., and J. M. Wood. 1974. The incidence of enterotoxin production in strains of Staphylococcus aureus isolated from foods. J. Appl. Bacterid. 37: 319-325.
Peterson, A. C., J. J. Black, and M. F. Gunderson. 1962. Staphylococci in competition II. Effect of total numbers and proportion of staphylococci in mixed i cultures on growth in artificial culture medium. Appl. Microbiol. 10:23-30.

168
Peterson, A. C., J. J. Black, and M. F. Gunderson. 1964, Staphylococci in competition III. Influence of pH and salt on staphylococcal growth in mixed populations. Appl. Microbiol. 12:70-76.
Postgate, J. R. 1967. Viability measurements and the survival of microbes under minimum stress. Pages 1-23 in A. H. Rose and J. F. Wilkinson. Advances in Microbial Physiology. Vol. 1. Academic Press, New York, NY.
Rayman, M. K., C. E. Park, J. Philpott and E. C. D. Todd. 19 75. Reassessment of the coagulase and thermonuclease tests as means of identifying Staphylococcus aureus. Appl. Microbiol. 29:451-454^ 1
Reiser, R. , D. Conway and M. S. Bergdoll. 1974. Detection of staphylococcal enterotoxin in foods. Appl. Microbiol. 27:83-85.
Reiser, R. F., and K. F. Weiss. 1969. Production of staphylococcal enterotoxins A, B and C in various media. Appl. Microbiol. 18:1041-1043.
Sebranek, J. G., D. G. Olson, R. C. Whiting, R. C. Benedict, R. E. Rust, A. A. Kraft, and J. H. Woychik. 1983. Physiological role of dietary sodium in human health and implications of sodium reduction in muscle foods. Food Technol. 37(7):51-59.
Shank, J. L., J. H. Silliker, and R. H. Harper. 1962. The effect of nitric oxide on bacteria. Appl. Microbiol. 10:185-189.
Sharpe, A. N., and M. N. Woodrow. 1971. Insoluble radioactive DNA complex for determination of Staphylococcus aureus deoxyribonuclease activity. Anal. Biochem. 41: 430-434.
Silverman, S. J., A. R. Knott and M. Howard. 1968. Rapid, sensitive assay for staphylococcal enterotoxin and a comparison of serological methods. Appl. Microbiol. 16: 1019-1023.
Smith, P. B., G. A. Hancock, and D. L. Rhoden. 1969. Improved medium for detecting deoxyribonuclease producing bacteria. Appl. Microbiol. 18:991-993.
Snedecor, G. W., and W. G. Cochran. 1980. Statistical methods. 7th ed. Iowa State University Press, Ames, lA. 507 pp.

169
Stark, R. L., and P. R. Middaugh. 1969. Iiranunofluorescent detection of enterotoxin B in food and a culture medium. Appl. Microbiol. 18;631-635.
Stryer, L. 1981. Biochemistry. 2nd ed. W. H. Freeman Company, San Francisco, CA. 949 pp.
Sugiyama, H., M. S. Bergdoll, and G. M. Dack. 1962. Early developments of a temporal resistance to the emetic action of staphylococcal enterotoxin. J. Infect. Dis. 111:233-238.
Sugiyama, H., and T. Hayama. 1964. Comparative resistance of vagotomized monkeys to intravenous vs. intragastric staphylococcal enterotoxin challenge. Proc. Soc. Exptl. Biol. Med. 115:243-246.
Sugiyama, H., and T. Hayama. 1965. Abdominal viscera as site of emetic action for staphylococcal enterotoxin in the monkey. J. Infect. Dis. 115:330-336.
Sulkowski, E., and M. Laskowski. 1968. Protection of micro-coccal nuclease against thermal inactivation. J. Biol. Chem. 243 (3):651-655.
Surgalla, M. J., M. S. Bergdoll and G. M. Dack. 1953. Some observations on the assay of Staphylococcal enterotoxin by the monkey-feeding test. J. Lab. Clin. Med. 41:782-788.
Tarr, H. L. A. 1941. The action of nitrites on bacteria. J. Fish. Res. Bd. Can. 5 (3):265-275.
Tatini, S. R., B. R. Cords and J. Gramoli. 1976. Screening for staphylococcal enterotoxins in foods. Food Technol. 30:64-74.
Tatini, S. R., H. M. Soo, B. R. Cords, and R. W. Bennett. 1975. Heat-stable nuclease for assessment of staphylococcal growth and likely presence of enterotoxin in foods. J. Food Sci. 40:352-356.
Terrell, R. N. 19 83. Reducing the sodium content of processed meats. Food Technol. 37(7):66-71.
Todd, E., R,. Szabo, H. Robern, T. Gleeson, C. Park, and D. S. Clark. 1981. Variation in counts, enterotoxin levels and TNase in swiss-type cheese contaminated with Staphylococcus aureus. J. Food Prot. 44(11): 839-848.
170
Troller, J. A., and W. C. Frazier. 1963. Repression of Staphylococcus aureus by food bacteria. II. Causes of inhibition. Appl. Microbiol. 11:163-165.
Wadstrom, T. 1967. Studies on extracellular proteins from Staphylococcus aureus. II. Separation of deoxyribo-nucleases by isoelectric focusing. Purification and properties of the enzymes. Biochim. Biophys. Acta 147:441-452.
Wadsworth, C. 1957. A slide microtechnique for the analysis of immune precipitates in gel. Int. Arch. Allergy Appl. Immunol. 10:355-360.
Weckman, B. G., and B. W. Catlin. 1957. Deoxyribonuclease activity of micrococci from clinical sources. J. Bacterid. 73 (6) : 747-753 .
Wegrzynowicz, 2., P. B. Heczko, G. R. Drapeau, J. Jeljaszewicz and G. Pulverer. 1980. Prothrombin activation by a metalloprotease from Staphylococcus aureus. J. Clin. Microbiol. 12:138-139.
Willett, H. P. 1980. Staphylococcus. Pages 532-552 ̂ W. K. Joklik, H. P. Willett and D. B. Amos, eds. Zinsser microbiology. Appleton-Century-Crofts, New York, NY.

171
ACKNOWLEDGMENTS
I would like to first of all acknowledge and thank my
major professor, Dr. Homer Walker, for his patience and
guidance throughout the research and writing of this
dissertation.
I would like to express my gratitude to Dr. Allen
Kraft for his helpful suggestions in my research and as a
member of my committee. Thanks also go out to the other
members of my committee; Dr. P. Hartman, Dr. J. Sebranek
and Dr. D. Olson for their support.
A very special word of thanks goes out to the
statisticians who helped me with this research; Dr. David
Cox and Mr. Terrance Callanan. Your contributions and many
tireless hours spent have been invaluable.
My sincere appreciation goes out to my laboratory
assistants Sarah Abraham and Laura Nelson whose help made
this dissertation possible. Thank you also to laboratory
technician Mr. Steven Niebuhr who was there as a technician
and a friend.
Special mention goes out to Mr. and Mrs. Calvin and
Esther Morrison. Without their love and support, this work
would not have been accomplished.