Embed Size (px)
Citation preview

eISSN: 2357-044X Taeckholmia 38 (2018): 1-16
Received on 01/04/2018 and accepted on 25/04/2018
Factors affecting the distribution of Pluchea dioscoridis (L.) DC. and its associated species in Gharbia Governorate, Nile Delta, Egypt.
D. A. Ahmed*, M. El-Beheiry, A. Sharaf El-Din, G. T. El-Taher
Botany Department, Faculty of Science, Tanta University, Egypt. *Corresponding author: [email protected]
Abstract
Pluchea dioscoridis is a perennial ruderal shrub. It has been classified as a weed controller due to its bushy growth, medicinal plant due to its strong antioxidant and anti-liver cancer activity and a phytoremediator plant. The present work aims to study the environmental factors affecting the distribution and common associated species of P. dioscoridis in Gharbia governorate, Nile Delta, Egypt. It aims also to assess the diversity and behavior of the common species along the different environmental factors. Seventy three stands, representing four common urban habitats (wastelands, railway sides, canal and drain banks), were selected. In each stand; the florisitic composition and cover of the studied species and its common associated species were estimated. Seventy-two species were recorded as being associated with P. diosocridis. Therophytes were the most represented, while parasites were the least. Mediterranean taxa had the highest chorological contribution. The highest coverage percentage of P. dioscoridis was recorded in the canal banks. TWINSPAN and DCA techniques led to the recognition of four vegetation groups; these groups were indicated by Persicaria salicifolia (A); Echinochloa stagnina and Chenopodium album (B); Arundo donax (C) and P. dioscoridis (D). Vegetation group D, which occupied wastelands, was the most diverse, while VG B occupied drain banks, was the least diverse. Soil analysis indicated that VG A occupied canal banks had the highest values of OM (7.7%) and P (41.2 mg100g-1), but the lowest water holding capacity (20.8%), Cl (0.08%), CO3 (0.07%) and HCO3 (0.04%). Canonical Correspondence Analysis (CCA) showed that chloride, electrical conductivity, total nitrogen, carbonate, and calcium cations were the most effective environmental variables on the distribution of P. dioscoridis and its associated species in the study area. This study may be a beneficial tool to use P. dioscoridis as indicator of ecological change and to estimate the relationship between soil variables and wild communities of it.
Keywords: Chorotype, habitat, Pluchea dioscoridis, species diversity, species cover, soil measurement
Introduction The plant community has a vital role in
affordable management by maintaining biodiversity and conserving the environment (Kandi et al. 2011). Communities of ruderal vegetation owe their existence to disturbance of their habitats (Grime 1979). Weeds are considered to be a main component of agro-ecosystems and have an influence on land diversity. Field experiments indicate that weeds can enhance species diversity of an ecosystem, lower pest density and conserve soil fertility (Chen et al. 2004). Most of weed communities help in featuring the patterns of species structure and distribution and then interpretation of these patterns with respect to environmental factors (Fried et al. 2008). Classification and ordination techniques have been applied to feature the ecological relationships between vegetation and the environmental factors (Zhang & Zhang 2000).
Urban areas are unique habitats; where large populations of humans build dense
buildings; these areas have been significantly changed from their natural state into urban ecosystems. Urbanized lands have a very simple community structure and species composition (McKinney 2002, Lundholm & Marlin 2006, Jim & Chen, 2010). The urban ecosystem comprises plant species from the natural flora of ruderal habitats to the cultivated flora of reclaimed areas (Sukopp & Werner 1983). The relationship between urban vegetation and environmental factors was represented by few studies like those of Klotz (1990) and Pyšek (1993); these studies showed that species richness of plant is highly correlated to population size in cities. Gilbert (1989) reported that cities have high species richness due to their habitat diversity which offers a variety of ecological conditions for plant species.
New habitats have been introduced in Nile Delta by agriculture and by the permanent occupation of sites for habitation (Shaltout &
Factors affecting the distribution of Pluchea dioscoridis (L.) DC. Sharaf El-Din 1988). Different types of habitats have been supported by the Nile Delta region; some of which are natural and the others are human made; salt marshes, coastal dunes, and brackish shallow lakes were found to be the main natural habitats at the northern part of the Nile Delta; while irrigation, drainage canals, railways, railway yards, motor roads, abandoned fields, demolished houses, refuse areas and grave yards were the human made habitats (Shaltout & Sharaf El-Din 1988, Shaltout 1994).
Pluchea dioscoridis (L.) DC (Asteraceae); is an important perennial wild evergreen shrub. It had been recorded in eight habitats (rail ways, highways, wastelands, abandoned fields, orchards, canal and drain banks and Lake Mariut) in Nile Delta (Shaltout et al. 2010). The distribution and presence of P. dioscoridis had been affected by human activity, chiefly due to destructive manner (limiting canals and drains), resulting in the reduction of aquatic communities (Shaltout & El-Sheikh 2002). Herein, we investigated the distribution and associated species of the P. dioscoridis in the different habitats in Gharbia Governorate (middle of Nile Delta), Egypt. We also aimed at evaluating the most important environmental factors affecting its distribution in the different habitats, and assessing the diversity and behavior of the associated species along different environmental factors, which may be a good tool to use it as indicator of ecological change.
Materials and methods 1. Study area Gharbia Governorate (Fig. 1) is located in the middle of Nile Delta (31°9'22'' -30°34'41''N; 31°18'22'' -30°45'27''E). It covers about 25,400 km2 (Abdel-Hamid et al. 2011); and comprises eight districts, which were selected to represent the distribution of P. dioscoridis population in different habitats. The main land use is agriculture; Nile Delta comprises about 63% of Egypt’s fertile land (Abu Al-Izz 1971). This Delta lies in the arid belt of the southern Mediterranean region; its climate is rather arid to semi-arid (UNESCO 1977). The highest temperature is in July and August with an average of 38 °C, and its lowest temperature in December and January with an average of 7.7 °C, with an average rainfall of
42.8 mm year-1. The relative humidity varies between 45% at the south in June and 76%, at middle region in August (NASA-POWER 2000-2017). The soil of Nile Delta is mostly heavy in texture and rather compact at the surface. The human status of the soils is fairly well. Thus, all soils with exception of the northern part are man-made and are regarded as anthropic variants of the Gleysols and Fluvisols (for more details see Shaltout et al. 2010).
2. Vegetation sampling Seventy three stands (100 m2 each) were selected to represent the different habitats of P. dioscoridis populations in the eight disrticts of Gharbia Governorate. The sampling processes of the study sites have been carried out during a year between March 2016 to Februaray 2017 through regular seasonal visits to the study area. These stands represent the distribution of P. dioscoridis population in four urban habitats (wastelands, railway sides, canal and drain banks); and were distributed as follow: 40 (1-40) in the wastelands, 12 (46 – 57) along the canal banks, 16 (58 – 73) along the drain banks, and 5 (41 – 45) along the railwaysides. In each stand, the floristic elements had been surveyed and the associated perennial and annual species were recorded seasonally indicating the first and second dominant species. Identification and nomenclature of the recorded species were according to Boulos (1999, 2000, 2002, 2005, 2009). The life form of each species was according to Raunkiaer (1937); and the actual and relative number of species belonging to each life form were calculated. The abundance of each species in each stand (visual estimate of coverage as a percentage of the stand area), was estimated according to the scheme of Braun-Blanquet (1932). Analysis of global geographical distribution of the recorded species was carried out according to Zohary (1966, 1972); Täckholm (1974); Abdel El-Ghani (1981, 1985); Hassan (1987). Voucher specimens were kept in Tanta University Herbarium (TANE).
3. Soil analysis Three composite soil samples were collected as profiles for the soil depth (0-50 cm) from each stand. The sampled soil was brought to the laboratory in plastic bags directly after collection,
2

D. A. Ahmed et al.
Fig. 1. Study area showing the selected stands (o) in Gharbia Governorate
spread over paper sheets, air dried and passed through a 2 mm sieve to remove gravels and debris. Prior to particle size analysis, the binding agents as carbonates and organic matter were removed by treating the soil with a few drops of 1M HCl, boiled with H2O2 and dispersed with sodium hexa-metaphosphate. Soil texture analysis was carried out by Bouyoucos hydrometer method (Piper 1947), whereby the percentages of sand, silt and clay were calculated. The porosity of soil and water-holding capacity were measured as reported by Piper (1947).
Soil-water extract of 1:5 w/v were prepared for the determination of pH values, electric conductivity (EC; as a measure of salinity), carbonates, bicarbonates, Cl, SO4 and CaCO3. Soil reaction (pH) and EC were measured using a glass electrode pH meter (Model 9107 BN, ORION type) and electrical conductivity meter (conductivity meter 60 Sensor Operating Instruction Corning), respectively. Determination of carbonates and bicarbonates was carried out by titration with 0.1N HCl using phenolphthalein
and methyl orange as indicators. Chlorides were estimated by direct titration against N/ 35.5 silver nitrate and calcium carbonate was determined by titration against 1N NaOH (Jackson 1962). Sulphates were determined using the "gravimetric with ignition of residue method", where sulphates were precipitated in 1% HCL solution as barium sulphate (Piper 1947).
Total organic matter was determined by loss-on-ignition at 440 °C according to Piper (1947). Nutrients (N, P, K and Ca) content in the collected samples were determined after digestion using the mixed-acid digestion method (Parkinson & Allen 1975). Estimation of K and Ca in the soil solution was carried out by using flame photometer (CORNING M410). Determination of the total soluble nitrogen was achieved using Kjeldahl method (Pirie 1955). Molybdenum blue and indo-phenol blue methods were applied for the determination of P and N, respectively, using a spectrophotometer (CECIL CE 1021) set at 660 nm in case of N and 700 nm in case of P. All these procedures are according to APHA (1985) and Allen (1989).
Dam
anhu
r
3
Factors affecting the distribution of Pluchea dioscoridis (L.) DC. 4. Data analysis
Two-way indicator species analysis (TWINSPAN) and detrended correspondence analysis (DCA) were applied to the matrix of cover estimates of the associated species with P. dioscoridis in 73 stands (Hill 1979 a,b). The relationships between vegetation gradients and environmental variables were produced by canonical correspondence analysis (Ter Braak 1986, 1987) in which points represent the common species and arrows represent environmental variables. The significance of variation in the soil variables with respect to TWINSPAN vegetation types was evaluated using one-way analysis of variance (ANOVA) using SPSS (SPSS 2006). Duncan's new multiple range test was applied as a post-hoc test to the ANOVA to evaluate the significance of differences between each pair of means.
Species richness (alpha diversity) for each vegetation group (VG) was assessed as the average number of species per stand, and then the species average per TWINSPAN group was used for comparison between other vegetation groups. The relative evenness or equitability (Shannon-Wiener diversity index) of the importance value (relative coverage) of a species was calculated from the formula: H' = -∑ Pilog Pi (Harper 1999), where Pi is the relative importance value (relative coverage) of the species. The relative concentration of dominance (Simpson’s diversity index) is the
second group of heterogeneity indices and is expressed by Simpson’s diversity index: C = ∑ Pi
2 (Whittaker 1972, Pielou 1975), where Pi is the relative importance value (relative coverage) of the species.
Results 1. Floristic analysis
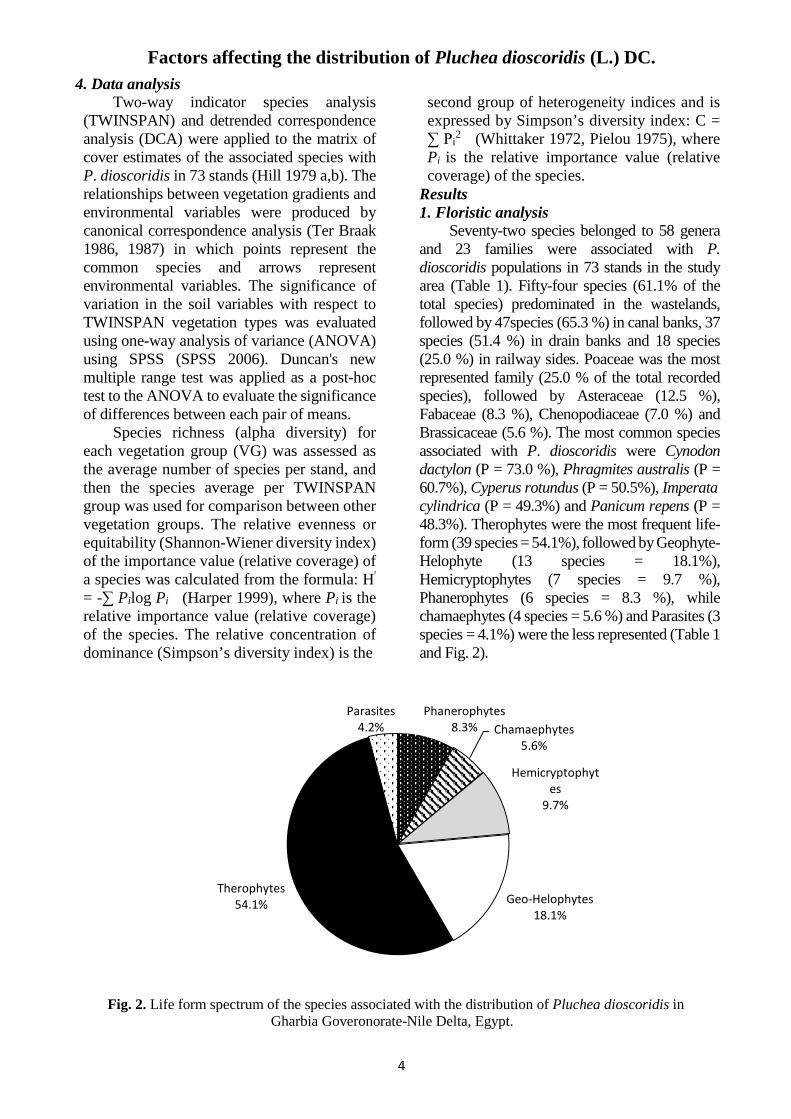
Seventy-two species belonged to 58 genera and 23 families were associated with P. dioscoridis populations in 73 stands in the study area (Table 1). Fifty-four species (61.1% of the total species) predominated in the wastelands, followed by 47species (65.3 %) in canal banks, 37 species (51.4 %) in drain banks and 18 species (25.0 %) in railway sides. Poaceae was the most represented family (25.0 % of the total recorded species), followed by Asteraceae (12.5 %), Fabaceae (8.3 %), Chenopodiaceae (7.0 %) and Brassicaceae (5.6 %). The most common species associated with P. dioscoridis were Cynodon dactylon (P = 73.0 %), Phragmites australis (P = 60.7%), Cyperus rotundus (P = 50.5%), Imperata cylindrica (P = 49.3%) and Panicum repens (P = 48.3%). Therophytes were the most frequent life-form (39 species = 54.1%), followed by Geophyte-Helophyte (13 species = 18.1%), Hemicryptophytes (7 species = 9.7 %), Phanerophytes (6 species = 8.3 %), while chamaephytes (4 species = 5.6 %) and Parasites (3 species = 4.1%) were the less represented (Table 1 and Fig. 2).
Fig. 2. Life form spectrum of the species associated with the distribution of Pluchea dioscoridis in Gharbia Goveronorate-Nile Delta, Egypt.
Phanerophytes8.3% Chamaephytes
5.6%
Hemicryptophytes
9.7%
Geo-Helophytes18.1%
Therophytes54.1%
Parasites4.2%
4
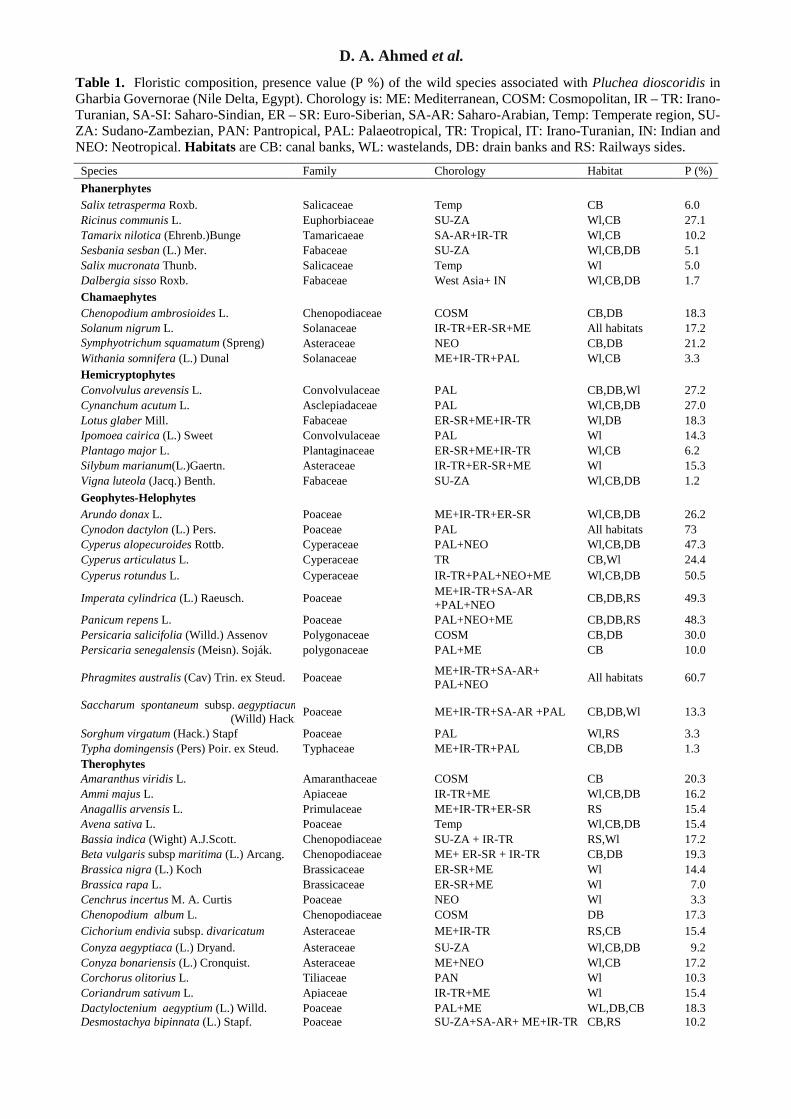
D. A. Ahmed et al. Table 1. Floristic composition, presence value (P %) of the wild species associated with Pluchea dioscoridis in Gharbia Governorae (Nile Delta, Egypt). Chorology is: ME: Mediterranean, COSM: Cosmopolitan, IR – TR: Irano-Turanian, SA-SI: Saharo-Sindian, ER – SR: Euro-Siberian, SA-AR: Saharo-Arabian, Temp: Temperate region, SU-ZA: Sudano-Zambezian, PAN: Pantropical, PAL: Palaeotropical, TR: Tropical, IT: Irano-Turanian, IN: Indian and NEO: Neotropical. Habitats are CB: canal banks, WL: wastelands, DB: drain banks and RS: Railways sides.
Species Family Chorology Habitat P (%) Phanerphytes Salix tetrasperma Roxb. Salicaceae Temp CB 6.0 Ricinus communis L. Euphorbiaceae SU-ZA Wl,CB 27.1 Tamarix nilotica (Ehrenb.)Bunge Tamaricaeae SA-AR+IR-TR Wl,CB 10.2 Sesbania sesban (L.) Mer. Fabaceae SU-ZA Wl,CB,DB 5.1 Salix mucronata Thunb. Salicaceae Temp Wl 5.0 Dalbergia sisso Roxb. Fabaceae West Asia+ IN Wl,CB,DB 1.7 Chamaephytes Chenopodium ambrosioides L. Chenopodiaceae COSM CB,DB 18.3 Solanum nigrum L. Solanaceae IR-TR+ER-SR+ME All habitats 17.2 Symphyotrichum squamatum (Spreng)
Asteraceae NEO CB,DB 21.2
Withania somnifera (L.) Dunal Solanaceae ME+IR-TR+PAL Wl,CB 3.3 Hemicryptophytes Convolvulus arevensis L. Convolvulaceae PAL CB,DB,Wl 27.2 Cynanchum acutum L. Asclepiadaceae PAL Wl,CB,DB 27.0 Lotus glaber Mill. Fabaceae ER-SR+ME+IR-TR Wl,DB 18.3 Ipomoea cairica (L.) Sweet Convolvulaceae PAL Wl 14.3 Plantago major L. Plantaginaceae ER-SR+ME+IR-TR Wl,CB 6.2 Silybum marianum(L.)Gaertn. Asteraceae IR-TR+ER-SR+ME Wl 15.3 Vigna luteola (Jacq.) Benth. Fabaceae SU-ZA Wl,CB,DB 1.2 Geophytes-Helophytes Arundo donax L. Poaceae ME+IR-TR+ER-SR Wl,CB,DB 26.2 Cynodon dactylon (L.) Pers. Poaceae PAL All habitats 73 Cyperus alopecuroides Rottb. Cyperaceae PAL+NEO Wl,CB,DB 47.3 Cyperus articulatus L. Cyperaceae TR CB,Wl 24.4 Cyperus rotundus L. Cyperaceae IR-TR+PAL+NEO+ME Wl,CB,DB 50.5
Imperata cylindrica (L.) Raeusch. Poaceae ME+IR-TR+SA-AR +PAL+NEO CB,DB,RS 49.3
Panicum repens L. Poaceae PAL+NEO+ME CB,DB,RS 48.3 Persicaria salicifolia (Willd.) Assenov Polygonaceae COSM CB,DB 30.0 Persicaria senegalensis (Meisn). Soják. polygonaceae PAL+ME CB 10.0
Phragmites australis (Cav) Trin. ex Steud. Poaceae ME+IR-TR+SA-AR+ PAL+NEO All habitats 60.7
Saccharum spontaneum subsp. aegyptiacum (Willd) Hack. Poaceae ME+IR-TR+SA-AR +PAL CB,DB,Wl 13.3
Sorghum virgatum (Hack.) Stapf Poaceae PAL Wl,RS 3.3 Typha domingensis (Pers) Poir. ex Steud. Typhaceae ME+IR-TR+PAL CB,DB 1.3 Therophytes Amaranthus viridis L. Amaranthaceae COSM CB 20.3 Ammi majus L. Apiaceae IR-TR+ME Wl,CB,DB 16.2 Anagallis arvensis L. Primulaceae ME+IR-TR+ER-SR RS 15.4 Avena sativa L. Poaceae Temp Wl,CB,DB 15.4 Bassia indica (Wight) A.J.Scott. Chenopodiaceae SU-ZA + IR-TR RS,Wl 17.2 Beta vulgaris subsp maritima (L.) Arcang. Chenopodiaceae ME+ ER-SR + IR-TR CB,DB 19.3 Brassica nigra (L.) Koch Brassicaceae ER-SR+ME Wl 14.4 Brassica rapa L. Brassicaceae ER-SR+ME Wl 7.0 Cenchrus incertus M. A. Curtis Poaceae NEO Wl 3.3 Chenopodium album L. Chenopodiaceae COSM DB 17.3 Cichorium endivia subsp. divaricatum
Asteraceae ME+IR-TR RS,CB 15.4 Conyza aegyptiaca (L.) Dryand. Asteraceae SU-ZA Wl,CB,DB 9.2 Conyza bonariensis (L.) Cronquist. Asteraceae ME+NEO Wl,CB 17.2 Corchorus olitorius L. Tiliaceae PAN Wl 10.3 Coriandrum sativum L. Apiaceae IR-TR+ME Wl 15.4 Dactyloctenium aegyptium (L.) Willd. Poaceae PAL+ME WL,DB,CB 18.3 Desmostachya bipinnata (L.) Stapf. Poaceae SU-ZA+SA-AR+ ME+IR-TR CB,RS 10.2
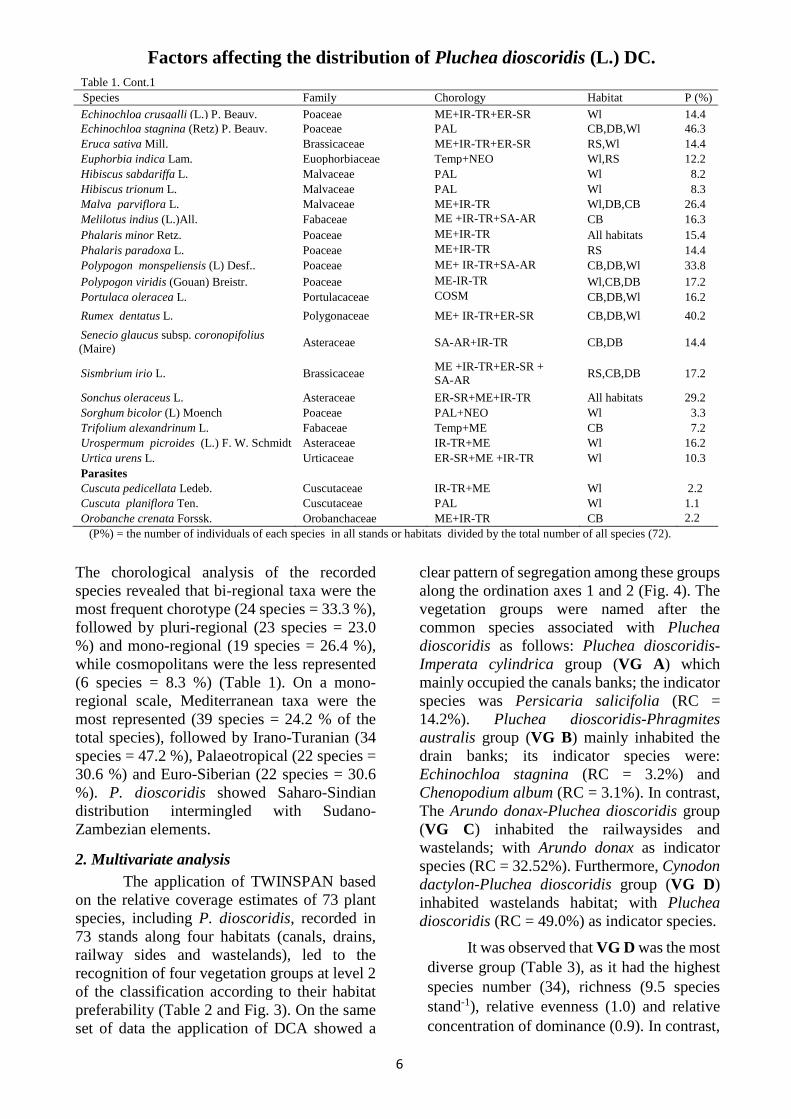
Factors affecting the distribution of Pluchea dioscoridis (L.) DC. Table 1. Cont.1 Species Family Chorology Habitat P (%) Echinochloa crusgalli (L.) P. Beauv. Poaceae ME+IR-TR+ER-SR Wl 14.4 Echinochloa stagnina (Retz) P. Beauv. Poaceae PAL CB,DB,Wl 46.3 Eruca sativa Mill. Brassicaceae ME+IR-TR+ER-SR RS,Wl 14.4 Euphorbia indica Lam. Euophorbiaceae Temp+NEO Wl,RS 12.2 Hibiscus sabdariffa L. Malvaceae PAL Wl 8.2 Hibiscus trionum L. Malvaceae PAL Wl 8.3 Malva parviflora L. Malvaceae ME+IR-TR Wl,DB,CB 26.4 Melilotus indius (L.)All. Fabaceae ME +IR-TR+SA-AR CB 16.3 Phalaris minor Retz. Poaceae ME+IR-TR All habitats 15.4 Phalaris paradoxa L. Poaceae ME+IR-TR RS 14.4 Polypogon monspeliensis (L) Desf.. Poaceae ME+ IR-TR+SA-AR CB,DB,Wl 33.8 Polypogon viridis (Gouan) Breistr. Poaceae ME-IR-TR Wl,CB,DB 17.2 Portulaca oleracea L. Portulacaceae COSM CB,DB,Wl 16.2 Rumex dentatus L. Polygonaceae ME+ IR-TR+ER-SR CB,DB,Wl 40.2 Senecio glaucus subsp. coronopifolius (Maire)
Asteraceae SA-AR+IR-TR CB,DB 14.4
Sismbrium irio L. Brassicaceae ME +IR-TR+ER-SR + SA-AR RS,CB,DB 17.2
Sonchus oleraceus L. Asteraceae ER-SR+ME+IR-TR All habitats 29.2 Sorghum bicolor (L) Moench Poaceae PAL+NEO Wl 3.3 Trifolium alexandrinum L. Fabaceae Temp+ME CB 7.2 Urospermum picroides (L.) F. W. Schmidt Asteraceae IR-TR+ME Wl 16.2 Urtica urens L. Urticaceae ER-SR+ME +IR-TR Wl 10.3 Parasites Cuscuta pedicellata Ledeb. Cuscutaceae IR-TR+ME Wl 2.2 Cuscuta planiflora Ten. Cuscutaceae PAL Wl 1.1 Orobanche crenata Forssk. Orobanchaceae ME+IR-TR CB 2.2
(P%) = the number of individuals of each species in all stands or habitats divided by the total number of all species (72).
The chorological analysis of the recorded species revealed that bi-regional taxa were the most frequent chorotype (24 species = 33.3 %), followed by pluri-regional (23 species = 23.0 %) and mono-regional (19 species = 26.4 %), while cosmopolitans were the less represented (6 species = 8.3 %) (Table 1). On a mono-regional scale, Mediterranean taxa were the most represented (39 species = 24.2 % of the total species), followed by Irano-Turanian (34 species = 47.2 %), Palaeotropical (22 species = 30.6 %) and Euro-Siberian (22 species = 30.6 %). P. dioscoridis showed Saharo-Sindian distribution intermingled with Sudano-Zambezian elements.
2. Multivariate analysis The application of TWINSPAN based on the relative coverage estimates of 73 plant species, including P. dioscoridis, recorded in 73 stands along four habitats (canals, drains, railway sides and wastelands), led to the recognition of four vegetation groups at level 2 of the classification according to their habitat preferability (Table 2 and Fig. 3). On the same set of data the application of DCA showed a
clear pattern of segregation among these groups along the ordination axes 1 and 2 (Fig. 4). The vegetation groups were named after the common species associated with Pluchea dioscoridis as follows: Pluchea dioscoridis-Imperata cylindrica group (VG A) which mainly occupied the canals banks; the indicator species was Persicaria salicifolia (RC = 14.2%). Pluchea dioscoridis-Phragmites australis group (VG B) mainly inhabited the drain banks; its indicator species were: Echinochloa stagnina (RC = 3.2%) and Chenopodium album (RC = 3.1%). In contrast, The Arundo donax-Pluchea dioscoridis group (VG C) inhabited the railwaysides and wastelands; with Arundo donax as indicator species (RC = 32.52%). Furthermore, Cynodon dactylon-Pluchea dioscoridis group (VG D) inhabited wastelands habitat; with Pluchea dioscoridis (RC = 49.0%) as indicator species.
It was observed that VG D was the most diverse group (Table 3), as it had the highest species number (34), richness (9.5 species stand-1), relative evenness (1.0) and relative concentration of dominance (0.9). In contrast,
6

D. A. Ahmed et al.
Table 2. Mean and coefficient of variation (value between brackets) of the relative coverage of species (%) in the different vegetation groups, resulting from TWINSPAN classification of the sampled stands of different habitats in Gharbia Governorate, (Nile Delta, Egypt) .A: canal banks, B: drain banks, C: railway sides and wastelands, D: wastelands
Classification level Vegetation group
Level 2 A B C D
No. of stands 12 16 11 34 Amaranthus viridis - - 0.20 (2.44) - Ammi majus - 0.56 (2.45) 5.4 (1.40) 0.92 (6.23) Anagallis arvensis 0.09 (5.50) - 0.10 (2.20) - Arundo donax - 27.0 (0.33) 39.5 (0.45) 41.2 (0.55) Avena sativa 3.1 (1.25) - 1.7 (4.15) - Bassia indica 1.3 (3.45) - - 8.1 (1.64) Beta vulgaris subsp maritima 0.43 (4.25) - 1.0 (5.26) 0.35 (3.26) Brassica nigra - - 5.2 (3.28) 3.2 (4.04) Brassica rapa - - 2.1 (4.23) 1.7 (5.23) Cenchrus incertus 1.2 (2.23) - - 1.7 (3.32) Chenopodium album 2.7 (3.66) 3.4 (2.36) 11.5 (2.36) 12.7 (2.10) Chenopodium ambrosioides 2.7 (5.36) 3.1 (1.25) - - Chenopodium murale - 0.2 (4.25) - 3.2 (1.22) Cichorium endivia subs. divaricatum 1.2 (6.43) 0.27 (3.25) 0.37 (5.36) - Convolvulus arevensis - 4.2 (2.32) - 1.5 (2.39) Conyza aegyptiaca 2.7 (1.36) - - 3.6 (1.58) Conyza bonariensis - 0.32 (3.25) - 0.97 (6.36) Corchorus olitorius - - 2.5 (1.44) 3.1 (1.90) Coriandrum sativum - - 0.31 (2.36) 1.7 (3.21) Cuscuta pedicellata - - - 0.09 (3.26) Cuscuta planiflora 0.07 (5.25) - - - Cynanchum acutum - - 0.51 (2.26) 4.3 (1.00) Cynodon dactylon - 26.0 (1.36) - 50.1 (0.9) Cyperus alopecuroides - 10.2 (1.36) 7.1 (2.22) 8.2 (3.21) Cyperus articulates 7.1 (2.36) - 2.0 (1.47) 3.0 (2.32) Cyperus rotundus 15.2 (0.90) 20.2 (0.78) - 17.7 (1.29) Dactyloctenium aegyptium 3.1 (1.23) - 1.7 (3.25) 6.1 (2.22) Dalbergia sisso - 2.7 (1.32) - 1.0 (5.25) Desmostachya bipinnata - 2.1 (3.25) 5.2 (2.36) 3.1 (2.58) Echinochloa crusgalli - - - 4.3 (0.99) Echinochloa stagnina 3.2 (1.66) 2.11 (2.97) - 1.1 (3.58) Eruca sativa - - 2.7 (3.25) 1.5 (5.25) Euphorbia indica - - 2.52(2.00) 3.1 (3.10) Hibiscus sabdariffa - - 0.07 (3.62) - Hibiscus trionum - - 0.09 (4.33) 0.08 (5.36) Imperata cylindrica 30.2 (0.92) 20.2 (0.99) - 27.2 (0.79) Ipomoea cairica - - - 1.8 (3.39) Lotus glaber - 0.36 (2.39) - - Malva parviflora 24.5 (4.36) - 20.1
33.2 (2.21)
Melilotus indius 0.52 (4.32) 2.1 (2.01) - - Orobanche crenata 1.4 (3.65) - - 0.97 (4.39)

Factors affecting the distribution of Pluchea dioscoridis (L.) DC. Table. 2. Cont. Classification level Vegetation group
Level 2 A B C D
No. of stands 12 16 9 36
Panicum repens 16.2 (2.11) 9.3 (0.92) 7.2 (2.14) - Persicaria salicifolia 14.2 (2.25) 7.5 (1.44) - - Persicaria senegalensis 0.92 (2.89) - 0.78
- Phalaris minor - 4.2 (2.36) 1.7 (3.55) - Phalaris paradoxa 0.71 (3.36) - 5.2 (2.00) - Phragmites australis - 30.3 (1.30) 19.3
37.2 (0.12) Plantago major 1.6 (5.36) - - Pluchea dioscoridis 50.4 (2.01) 35.2 (2.00) 30.2
47.0 (0.25) Polypogon monspeliensis - 12.8 (2.36) 1.3 (3.39) 2.7 (2.36) Polypogon viridis - 1.9 (5.21) - 1.2 (3.45) Portulaca oleracea 2.7 (1.11) - - 15.2 (1.58) Ricinus communis 10.1 (3.33) - 17.2
15.2 (3.96) Rumex dentatus - 13.2 (2.22) 10.3
9.1 (3.50) Saccharum spontaneum subsp.
- 3.2 (2.31) - 2.7 Salix mucronata - - 1.4 (3.58) 0.91 (2.54) Salix tetrasperma 4.11 (1.25) - - 2.17 (1.00) Senecio glaucus subsup.
3.21 (2.25) 1.8 (5.28) - - Sesbania sesban - 0.91 (3.21) 0.42
- Silybum marianum - - 8.54
11.26 (0.79) Sismbrium irio 0.31 (2.58) 3.4 (1.36) 0.45
- Solanum nigrum 0.34 (3.25) - 0.09
1.5 (1.52) Sonchus oleraceus 0.21 (2.36) - 7.1 (1.28) 6.2 (2.25) Sorghum bicolor - 0.91 (3.26) 0.42
2.7 (1.32) Sorghum virgatum - - 1.2 (1.66) 1.4 (1.98) Symphyotrichum squamatum 6.1 (1.54) 2.5 (1.44) - - Tamarix nilotica 3.21 (1.11) - 5.2 (2.26) - Trifolium alexandrinum 3.2 (2.36) - 4.8 (2.25) - Typha domingensis 0.05 (3.36) - - - Urospermum picroides - - - 0.09 (4.25) Urtica urens - - 5.2 (1.28) 0.92 (2.77) Vigna luteola 0.82 (3.69) - - - Withania somnifera 2.7 (1.25) - - 3.4 (1.47)
VG B had the lowest species richness (6.2 species stand-1), and relative evenness (0.7), while VG C had the lowest relative concentration of dominance (0.4).
3. Soil analysis Soil texture of the study area was clay loam, while pH values indicated that the soil reaction is neutral with a tendency to alkalinity in all groups (Table 4). VG A had the highest values of OM (7.7%) and P (41.2 mg100g-1), but the lowest of water holding capacity (20.8%), Cl (0.08%), CO3 (0.07%)
and HCO3 (0.04%), VG B had the highest values of N (224.3 mg100g-1) and Ca (1900.1 mg100g-1), while the lowest of porosity (27.7%), SO4 (0.08%) and P (23.2 mg100g1).VG C had the highest water holding capacity (28.4%), Cl (0.22%), SO4 (0.32%) and CO3 (0.19%); while the lowest of CaCO3 (2.7%) and K (32.3 mg100g-1). VG D had the highest values of porosity (44.3%), CaCO3 (3.2%) and K (94.3 mg100g-1), but had the lowest of OM (2.6%), N (114.3 mg100g-1) and Ca (933.5 mg100g-1).
8

D. A. Ahmed et al.
Fig. 3. The dendrogram resulting from the application of a two-way indicator species analysis on the coverage estimates of the 73 species that were recorded in the 73 stands in Gharbia Governorate, Nile Delta, Egypt. A canal banks, B drain banks, C railway sides and wastelands, D wastelands. The indicator species are abbreviated by the first three letters of genus and species, respectively; as Tam. Nil Tamarix nilotica, Ave. fat Avena fatua, Sal. tet Salix tetrasperma, Ses. ses Sesbania sesban, Con. bon Conyza bonariensis, Per. Sal Persicaria salicifolia, Che. alb Chenopodium album, Aru. don Arundo donax, Plu. dio Pluchea dioscoridis, Cyn. acu Cynanchum acutum, Cyp. rot Cyperus rotundus, Rum. den Rumex dentatus, Bet. vul Beta vulgaris, Mal. par Malva parviflora, Dac. aeg Dactyloctenium aegyptium, Son. ole Sonchus oleraceus, Che. mur Chenopodium murale, Mel. ind Melilotus indius, Che. alb Chenopodium album, Bas. ind Bassia indica,Uro. Pic Urospermum picroides, Cor.sat Coriandrum sativum,Con. aeg Conyza aegyptiaca, Sis. iri Sismbrium irio, Pol. mon Polypogon monspeliensis and Por. ole Portulaca oleracea
Fig. 4 Detrended correspondence analysis (DCA) ordination diagram of the vegetation groups that resulted from the application of the coverage estimates of the 73 species on the 73 sampled stands in Gharbia Governorate, Egypt. A canal banks, B (B1and B2) drain banks, C railway sides and wastelands, D wastelands.
Lev
el o
f cla
ssifi
catio
n
Vegetation group
9

Factors affecting the distribution of Pluchea dioscoridis (L.) DC.
Table 3. Characteristics of the four vegetation groups identified after application of TWINSPAN on the 73 stands of Pluchea dioscoridis in Gharbia Governorate, Nile Delta, Egypt .A canal banks, B drain banks, C railway sides and wastelands, D wastelands. P%: presence percentage, VG: vegetative groups and RC: relative cover.
VG No. of
Stands
P %
stands
No. of
species
P % of
species
First dominant
species
RC
(%)
Second
dominant
species
RC
(%)
Species
richness
Shannon-
Weiner
index
Simpson's
diversity
index
A 12 16.4 42 57.5 Pluchea dioscoridis
50.4 Imperata cylindrica
30.2 9.0 0.8 0.7
B 16 21.9 33 45.2 Pluchea dioscoridis
35.2 Phragmites australis
30.3 6.2 0.7 0.5
C 11 15.1 40 54.8 Arundo donax 39.5 Pluchea dioscoridis
30.2 9.1 0.8 0.4
D 34 46.6 50 68.5 Cynodon dactylon
50.1 Pluchea dioscorid
47.0 9.5 1.0 0.9
Table 4. Mean and standard error (±SE) of soil variables of the four vegetational groups (A-D) obtained by TWINSPAN classification of different habitat types supporting the 73 stands of Pluchea dioscoridis in Gharbia Governorate (Nile Delta, Egypt).A canal banks, B drain banks, C railway sides and wastelands, D wastelands.
P< 0.05, **:P< 0.01, ***: P< 0.001, ns = not significant. Means in the same columns followed by different letters are significantly different at P<0.05 according to Duncan's multiple range test (LSR0.05).
Soil variable Vegetation group
F-values A B C D
Clay
(%)
42.44 ± 2.70a 49.33 ± 0.89b 53.67 ± 1.07d 44.60 ± 0.40c 60.42***
Sand 41.87 ± 0.67a 26.41 ± 1.22c 31.12 ± 0.49a 31.49 ± 0.35a 0.52ns
Silt 15.69 ± 2.38a 24.26 ± 0.61a 15.21 ± 0.58c 23.91 ± 0.25a 57.92***
Porosity 30.80 ± 0.49a 27.66 ± 0.48b 38.37 ± 0.52cd 44.33 ± 2.60c 55.79***
WHC 20.82 ± 0.24ab 23.24 ± 0.56c 28.37 ± 0.62bc 25.52 ± 0.39a 54.77***
CaCO3 3.11 ± 0.32a 2.99 ± 0.15c 2.65 ± 0.19e 3.22 ± 0.26e 251.28***
OM 7.69 ± 0.19a 5.26 ± 0.23b 3.69 ± 0.24c 2.58 ± 0.25c 83.38***
Cl- 0.08 ± 0.02c 0.17 ± 0.02a 0.22 ± 0.01ab 0.15 ± 0.01b 18.29***
SO4-- 0.09 ± 0.01b 0.08 ± 0.01a 0.32 ± 0.01bc 0.30 ± 0.05a 20.45***
CO3-- 0.07 ± 0.02cd 0.09 ± 0.02a 0.19 ± 0.03bc 0.12 ± 0.01b 47.96***
HCO3- 0.04 ± 0.01a 0.07 ± 0.02c 0.27 ± 0.02ab 0.32 ± 0.01b 344.01***
pH 6.72 ± 0.24ab 7.03 ± 0.11ab 7.18 ± 0.01a 7.25 ± 0.03a 3.26*
EC (mS/cm) 2.11 ± 0.02b 3.21 ± 1.04a 4.05 ± 0.01d 9.25 ± 0.18d 88.50***
TN
(mg
100g
-1) 217.21 ± 1.21a 224.25 ± 2.06d 165.73 ± 1.35b 114.30 ± 1.92b 3924.39***
TP 41.16 ± 1.01b 23.23 ± 0.96b 31.35 ± 1.29ab 31.25 ± 0.89a 248.15***
K 55.48 ± 1.18bc 42.97 ± 2.14e 32.32 ± 1.00b 94.27 ± 0.98ab 1172.62***
Ca 1501.36 ± 255.23ef 1900.99 ± 230.36d 1126.08 ± 115.36bc 933.48 ± 60.22d 3329.79***
10
D. A. Ahmed et al.
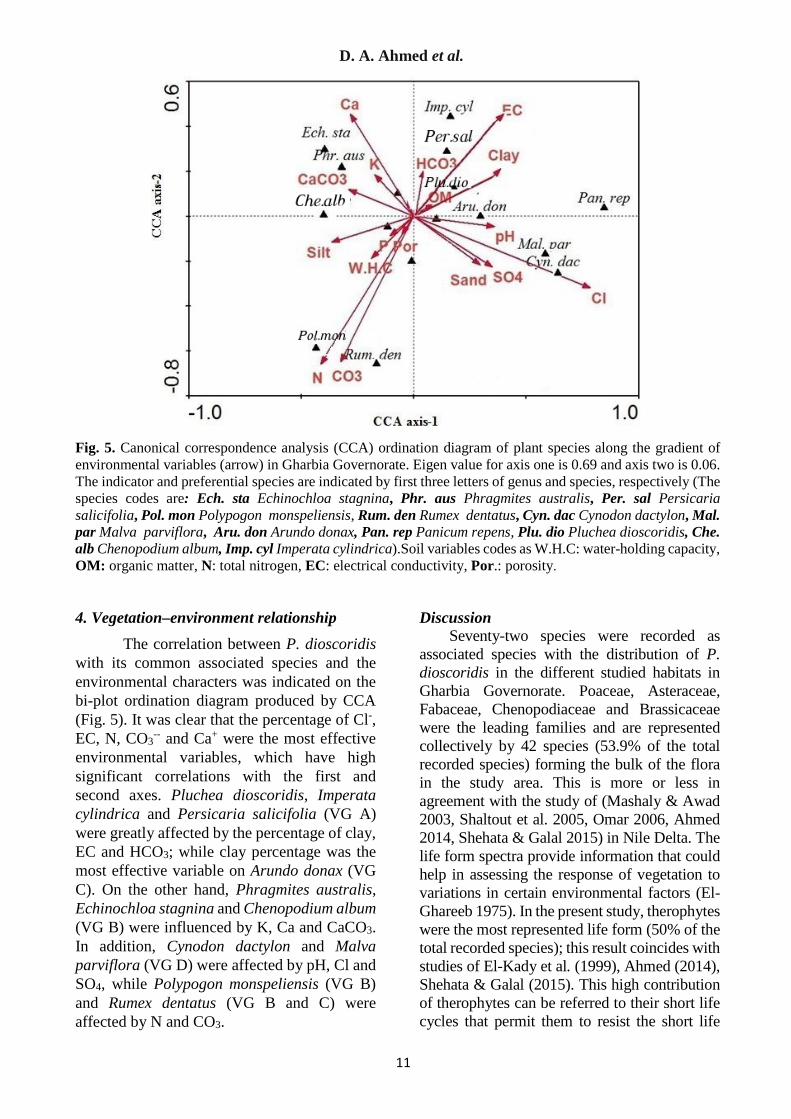
Fig. 5. Canonical correspondence analysis (CCA) ordination diagram of plant species along the gradient of environmental variables (arrow) in Gharbia Governorate. Eigen value for axis one is 0.69 and axis two is 0.06. The indicator and preferential species are indicated by first three letters of genus and species, respectively (The species codes are: Ech. sta Echinochloa stagnina, Phr. aus Phragmites australis, Per. sal Persicaria salicifolia, Pol. mon Polypogon monspeliensis, Rum. den Rumex dentatus, Cyn. dac Cynodon dactylon, Mal. par Malva parviflora, Aru. don Arundo donax, Pan. rep Panicum repens, Plu. dio Pluchea dioscoridis, Che. alb Chenopodium album, Imp. cyl Imperata cylindrica).Soil variables codes as W.H.C: water-holding capacity, OM: organic matter, N: total nitrogen, EC: electrical conductivity, Por.: porosity. 4. Vegetation–environment relationship
The correlation between P. dioscoridis with its common associated species and the environmental characters was indicated on the bi-plot ordination diagram produced by CCA (Fig. 5). It was clear that the percentage of Cl-, EC, N, CO3
-- and Ca+ were the most effective environmental variables, which have high significant correlations with the first and second axes. Pluchea dioscoridis, Imperata cylindrica and Persicaria salicifolia (VG A) were greatly affected by the percentage of clay, EC and HCO3; while clay percentage was the most effective variable on Arundo donax (VG C). On the other hand, Phragmites australis, Echinochloa stagnina and Chenopodium album (VG B) were influenced by K, Ca and CaCO3. In addition, Cynodon dactylon and Malva parviflora (VG D) were affected by pH, Cl and SO4, while Polypogon monspeliensis (VG B) and Rumex dentatus (VG B and C) were affected by N and CO3.
Discussion
Seventy-two species were recorded as associated species with the distribution of P. dioscoridis in the different studied habitats in Gharbia Governorate. Poaceae, Asteraceae, Fabaceae, Chenopodiaceae and Brassicaceae were the leading families and are represented collectively by 42 species (53.9% of the total recorded species) forming the bulk of the flora in the study area. This is more or less in agreement with the study of (Mashaly & Awad 2003, Shaltout et al. 2005, Omar 2006, Ahmed 2014, Shehata & Galal 2015) in Nile Delta. The life form spectra provide information that could help in assessing the response of vegetation to variations in certain environmental factors (El-Ghareeb 1975). In the present study, therophytes were the most represented life form (50% of the total recorded species); this result coincides with studies of El-Kady et al. (1999), Ahmed (2014), Shehata & Galal (2015). This high contribution of therophytes can be referred to their short life cycles that permit them to resist the short life
11

Factors affecting the distribution of Pluchea dioscoridis (L.) DC.
cycle of crops (El-Kady et al. 2000). In addition, the adverse climatic conditions; moisture deficiency and substrate instability of the other habitats probably lead to the frequent occurrence of therophytes, associated with P. dioscoridis during the suitable seasons (El-Kady et al. 2000).
The chorology of the recorded species indicated that the bi-regional taxa had the highest percentage, followed by the pluri-regional, mono-regional and cosmopolitan. This may be due to that, Egypt is a meeting point of floristic elements belonging to at least four phyto-geographical regions: African Sudano-Zambesian, Asiatic Irano-Turanian, Afro-Asiatic Sahro-Sindian and Euro-Afro Asiatic Mediterranean (El-Hadidi 1993). Zohary (1973) explained that the inter-regional species (bi-, tri- and pluri-regionals) are dominant over mono-regional ones due to the presence of interzonal habitats, such as anthropogenic, hydro-, halo- and psammophilous sites. Thirty nine of the recorded species (50%) were Mediterranean taxa (pluri-, bi- and mono-regional). Irano-Turanian chorotypes, either pure or penetrated into other regions, comprised 34 species (43.6%) of the recorded flora; while the other floristic elements are represented by varying number of species, reflecting their different capability to penetrate the region, and this can be due to the influence of man and the history of agriculture in the study area (El-Ameir 2005).
Vegetation structure could be spilt through the classification and ordination analyses depending on indicator species and their correlation to environmental factors (Abd El-Ghani et al. 2013). The indicator species is of high importance because of their sensitivity to changes in environmental factors which may be beneficial or damaging (Seele et al. 2000; Thiebaut et al. 2002; Stelzer et al. 2005). The vegetation composition of P. dioscoridis along wastelands, railway sides, canal and drain banks was classified by TWINSPAN classification into four groups. P. dioscoridis was the first dominant in two groups (A and B); which occupies canal and drain banks. Shaltout & Slima (2007) reported that P. dioscoridis prefers inhabiting wetlands, while it was recorded as second dominant in two other
groups (C and D); inhabiting railway sides and wastelands. Comparable results were reported by Shaltout and El-Sheikh (2002), Abu Ziada et al. (2008), El-Halawany et al. (2010), Shaltout et al. (2010), Abdel El-Ghani et al. (2012), El-Sherbeny et al. (2015) and Shehata & Galal (2015).
In the present study, it was clear that VG D, which characterizes wastelands, had the highest species richness and was the most diverse, while VG B which inhabited the drain banks was the least diverse; these results coincided with the study of Shaltout & Slima (2007). The lower species diversity in drain banks may be due to the bushy growth of the shrub preventing other species from colonizing the banks (Simpson 1932), and the dense canopy of tall growing associated species along canal and drain banks (e.g. Cyperus alopecuroides, Phragmites australis and Persicaria senegalensis) making more difficult, the germination and growth of other species leading to reduction of the species diversity (Shaltout & El-Sheikh 1993). It is well known that the aquatic weeds aggressively colonize disturbed canal or drain banks forming dense mono-dominant stand (Holzner 1978), which in turn increases their competitive ability and lower their species richness (Abdel El-Ghani et al. 2012). Diversity, species richness and evenness vary among different habitats due to dissimilarities in the soil characteristics, substrate discontinuities and the phytotoxic effects of one or more species, depending on their relative dominance among the other associated species (James et al. 2006).The highest coverage percentage for P. dioscoridis was recorded in canal and drain banks despite of its lower species diversity as a result of allelopathic effect of P. dioscoridis which offer phytotoxicity for some weeds by reducing their germination rates and seedling growth (Fahmy et al. 2012; Balah 2016).
The texture of soil has an influence on the soil or productivity through affecting the soil water-holding capacity, moisture availability and infiltration rate for plants (Sperry & Hacke, 2002).The soil analysis in the present study showed that canal and drain banks had the lowest salinity values, while wastelands had the highest salinity and this is in accordance with the study of Shaltout & Slima (2007) and
12
D. A. Ahmed et al.
Ahmed (2014). Also, it was observed that the electrical conductivity (salinity) for all studied habitats was higher than those recorded by Shaltout (1994), Sharaf El-Din et al. (1999), El-Sheikh (2003)and Shaltout & El-Komi (2006) for the soil of P. dioscoridis and this may be related to the high ability of P. dioscoridis to sustain salinity.
Multivariate analysis of CCA indicated that, the most important soil variables with respect to the distribution of plants were soil fertility (phosphorus content and organic carbon), salinity, alkalinity, pH, soil texture, nitrogen and calcium carbonate (Shaltout & El-Sheikh 1993; Shaltout et al. 1994; Al-Sodany, 1998). Shaltout & El-Sheikh (1991) reported that the distribution of plants has either negative correlation with some soils parameters. In the present study, it was found that chloride, EC, total nitrogen, carbonate, and calcium cations were the most effective soil variables. The distribution of P. dioscoridis was positively correlated with EC, clay, organic matter and bicarbonate.
Conclusion Seventy-two species were recorded as
being associated with P. dioscoridis in the studied habitats in Gharbia Governorate. Poaceae, Asteraceae, Fabaceae, Chenopodiaceae and Brassicaceae were the leading families and are represented collectively by 42 species. Therophytes was the most represented life form (50%). Biregional and Mediterranean taxa were the most represented chorotype. Four vegetation groups (A-D) were identified after the application of TWINSPAN and DCA analysis. P. dioscoridis was the first dominant species in groups A and B, which inhabited the canal and drain banks (as P. dioscoridis prefers inhabiting wetlands). The same species was the second dominant in groups C and D, which occupied railway sides and wastelands. Group D had the highest species richness and was the most diverse, while VG B was the least diverse. The highest coverage percentage for P. dioscoridis was recorded in canal banks. The environmental variables such as chloride, electrical conductivity, nitrogen, carbonate, and calcium cations were the most effective environmental factors in the distribution of P. dioscoridis populations and its associated species. The
distribution of this shrub was positively correlated by EC, clay, organic matter and bicarbonate.
References Abd El-Ghani, M.M. 1981. Preliminary studies on the vegetation of Bahariya Oasis-Egypt. M.Sc.Thesis, Cairo Univ, Egypt. Abd El-Ghani, M.M. 1985. Comparative study of the vegetation of Bahariya and Farafra Oases and the Faiyum region, Egypt. Ph.D. Thesis, Cairo Univ, Egypt. Abd El-Ghani, M.M., Shehata, M.N., Mobarak, A. & Bakr, R. 2012. Factors affecting the diversity and distribution of synanthropic vegetation in urban habitats of the Nile Delta, Egypt. Rendiconti Lincei. 23(4): 327-337. Abd El-Ghani, M.M., Soliman, A., Hamdy, R. & Bennoba, E. 2013. Weed Flora in the Reclaimed Lands along the Northern Sector of the Nile Valley in Egypt. Turk. Jour. Bot. 37: 464-488. Abd El-Hamid, Y.A., Mostafa, A.A., Allam, K.M. & Kenawy, M.A. 2011. Mosquitoes (Diptera: Culicidae) in El-Gharbia Governorate, Egypt: their spatial distribution, abundance and factors affecting their breeding related to the situation of lymphatic filariasis." Egypt. Acad. J. Biol. Sci. 3: 9-16. Abu Al-Izz, M.S. 1971. Land Forms of Egypt. The American University in Cairo Press. Dar Al-Maaref, Cairo. Abu Ziada, M.A., Mashaly, I.A. & Torky, M. 2008. Ecological studies on the aquatic vegetation in North East Nile Delta, Egypt. Intern. Jour. Bot. 4(2): 151-163. Ahmed, D. 2014. Distribution and antifungal activity of medicinal plant Solanum nigrum L. (Solanaceae) in the Nile Delta of Egypt. Ecol. Med. 40 (2): 29-39. Allen, S.E. 1989. Chemical analysis of ecological materials. Blackwell Scientific Publications, London. Al-Sodany, Y.M. 1998. Vegetation analysis of canals, drains and lakes of northern part of Nile Delta Region. Ph.D. Thesis, Tanta Univ., Egypt. American Public Health Association (APHA) 1985 Standarad Methods for the Examination of Water and Waste Water, 17th ed. American Public Health Association, Washington, D. C.
13

Factors affecting the distribution of Pluchea dioscoridis (L.) DC.
Balah, M.A. 2016. Chemical and biological characterization of Conyza dioscoridis (L.) Desf. family (Compositae) in some perennial weeds control. South African Journal of Botany. 103: 268-274. Boulos, L. 1999. Flora of Egypt, Vol. 1. Azollaceae–Oxalidaceae.Al–Hadara Publishing, Cairo. Boulos, L. 2000. Flora of Egypt, Vol. 2. Geraniaceae -Boraginaceae. Al– Hadara Publishing, Cairo. Boulos, L. 2002. Flora of Egypt, Vol. 3. Verbenaceae-Compositae. Al-Hadara Publishing, Cairo. Boulos, L. 2005. Flora of Egypt, Vol. 4. Monocotyledons (Alismatacae- Orchidaceae). Al-Hadara Publishing, Cairo. Boulos, L. 2009. Flora of Egypt, Checklist. Revised Annotated Edition. Al-Hadara publishing, Cairo. Braun-Blanquet, J. 1932. Plant sociology, 1st ed. McGraw Hill, NewYork. Chen, X., Tang, J., Fang, Z. & Shimizu, K. 2004. Effects of weed communities with various species numbers on soil features in a subtropical orchard ecosystem. Agriculture. Ecosystem & Environment Journal 102:377–388. El-Ameir, Y.A. 2005. Eco-palynological studies of the plant life of the River Nile in Egypt. M. Sc. Thesis, Mansoura University, Egypt. El-Ghareeb, R. 1975. A Study of the Vegetation Environmental Complex of Saline and Marshy Habitats on the Northern Coast of Egypt. Ph.D. Thesis, Alexandria Univ, Egypt. El-Hadidi, M.N. 1993. Natural Vegetation. In G.M. In Craig (ed.). The Agriculture in Egypt, Oxford Univ. Press, Chapter 3: 39-62. El-Halawany, E., Mashaly, I., Abu-Ziada, M. and Abd El-Aal, M. 2010. Habitat and Plant Life in El-Dakahlyia Governorate, Egypt. Journal of Environmental Sciences 39(1): 83-108. El-Kady, H.F., Shaltout, K.H., Mousa, M.T. 1999. Diversity of Weed Communities in the Common Orchards of the Nile Delta. Jour. Univ. Arab Bio, Cairo. 9(13):149-168. El-Kady, H.F., Shaltout, K.H., El-Shourbagy, M.N. & Al- Sodany, Y.M. 2000. Characterization of habitats in the North Western part of the Nile Delta. Proc. 1st Int.
Conf. Biol. (ICBS) Fac. Sci., Tanta Univ. 1: 144-157. El-Sheikh, M. 2003. Plant succession on abandoned fields In Assiut, Egypt. Ass. Univ. Bull. Environmental Research 6 (1): 115-130. El Sherbeny, G.A., El-Shehaby, O.A. & Mohsin, I.I. 2015. Ecological study and morphological variation of Pistia stratiotes in the northern eastern section of the Nile Delta, Egypt. Jour. Envir. Sci. 44(1): 31-45. Fahmy, G.M., Al-Sawaf, N.A., Turki, H. & Ali, H.I. 2012. Allelopathic potential of Pluchea dioscoridis (L.) DC. Jour. App. Sci. Res.. 8(7): 3129-3142. Fried, G., Norton, L.R. & Reboud, X. 2008. Environmental and management factors determining weed species composition and diversity in France. Agr. Ecosys. Environ.128: 68–76. Gilbert, O.L. 1989. The ecology of urban habitats. Chapman and Hall, London. Grime, J.P. 1979. Plant Strategies and Vegetation Processes. John Wiley and Sons. Chichester. Harper, D.A. 1999. Numerical palaeobiology: computer-based modelling and analysis of fossils and their distributions. John Wiley & Sons Inc. Hassan, L.M. 1987. Studies of the flora of Eastern Desert, Egypt. Ph.D. Thesis, Fac. Sci., Cairo Univ, Egypt. Hill, M.O. 1979a. DECORANA-a FORTRAN Program for Detrended Correspondence Analysis and Reciprocal Averaging. Section of Ecology and Systematic, Cornell Univ., Ithaca, New York. Hill, M.O. 1979b. TWINSPAN-a FORTRAN program for arranging multivariate data in an ordered two-way table by classification of the individuals and attributes. Cornell University, Ithaca. New York. Holzner, W. 1978. Weed species and weed communities. Vegetatio 38 (1):13–20. Jackson, M.L. 1962. Soil Chemical Analysis. Constable and Co. LTD. London. James, J.J., Caird, M.A., Drenovsky, R.E. & Sheley, R.L. 2006. Influence of resource pulses and perennial neighbors on the establishment of an invasive annual grass in the Mojave Desert. Jour. Arid Environ. 67: 528–534.
14

D. A. Ahmed et al.
Jim, C.Y. & Chen, W.Y. 2010. Habitat effect on vegetation ecology and occurrence on urban masonry walls. Urban For Urban Gree. 9:169–178. Kandi, B., Sahu, S.C., Dhal, N.K. & Mohanty, R.C. 2011. Species diversity of vascular plants of Sunabeda wildlife sanctuary, Odisha, India. N.Y. Sci. J 4: 1–9. Klotz, S. 1990. Species-area and species-inhabitants relations in European cities. In: Sukopp H, Hejny´ S, Kowarik I (eds) Urban ecology: plants and plant communities in urban environments. SPB Publishing, The Hague. pp 99–104. Lundholm, J.T. & Marlin, A. 2006. Habitat origins and microhabitat preferences of urban plant species. Urban Ecosystems 9:139–159. Mabberley, D.J. 1987. The plant book, a portable dictionary of the higher plants.Cambridge Univ. Press. Mashaly, I.A. & Awad, E.R. 2003. Ecological Perspectives on the Weed Flora of Orchards in the Nile Delta, Egypt. Journ. Envirn. Sci. 25:1-37. McKinney, M.L. 2002. Urbanization, biodiversity, and conservation. Bioscience. 52:883–890. NASA-POWER. 2017. Climatology resource for agroclimatology. NASA prediction of worldwide energy. http://power.larc.nasa.gov/cgi-bin/cgiwrap/solar/agro.cgi. Omar, G.M. 2006. Plant life of the Different Habitats in the North Nile Delta of Egypt: Ecology and Fodder Potentialities. Ph.D. Thesis, Fac. Sci., Mansoura. Univ., Egypt. Parkinson, J. & Allen, S.E. 1975. A wet oxidation procedure suitable for the determination of nitrogen and mineral nutrients in biological material." Communications in Soil Science & Plant Analysis 6: 1-11. Pielou, E.C. 1975. Ecological diversity. Wiley, New York. Piper, C.S. 1947. Soil and Plant Analysis. Interscience publishers, Inc. New York. Pirie, N.W. 1955. Protein. In: Modern Methods of Plant Analysis IV, 23, Springer Verlage, Berlin. Pyšek, P. 1993. Factors affecting the diversity of flora and vegetation in central European settlements. Vegetatio 106:89–100.
Raunkiaer, C. 1937. The Life Forms of Plants and Statistical Plant Geography. Clarendon Press., Oxford. Seele, J., Mayr, M., Staab, F. & Raeder, U. 2000. Combination of two indication systems in pre-alpine lakes diatom index and macrophyte index. Ecol. Model. 130: 145-149. Shaltout, K.H. 1994. Post-agricultural succession in the Nile Delta region. Jour. Arid Envir. 28: 31-38. Shaltout, K.H. & Sharaf El-Din, A. 1988. Habitat types and plant communities along a transect in the Nile Delta region. Fedd. Repert.. 99: 153 – 162. Shaltout, K.H. & El‐Sheikh, M.A. 1991. Gradient analysis of canal vegetation in Nile Delta region. Fedd. Repert. 102: 639-645. Shaltout, K.H. & El‐Sheikh, M.A. 1993. Vegetation‐environment relations along water courses in the Nile Delta region. Jour. Veget. Sci. 4(4): 567−570. Shaltout, K.H. & El-Sheikh, M.A. 2002. Vegetation of the urban habitats in the Nile Delta region, Egypt. Urban Ecosystems. 6 (3): 205-221. Shaltout, K.H., El-Din, A.S. & El-Sheikh, M.A. 1994. Species richness and phenology of vegetation along irrigation canals and drains in the Nile Delta, Egypt. Vegetatio. 112(1): 35−43. Shaltout, K.H., Hassan, L.M. & Farahat, E.A. 2005. Vegetation-Environment Relationships in South Nile Delta, Taeckholmia 25:15-46. Shaltout, K. H. & El–Komi, T. M. 2006. Above-ground phytomass of Pluchea dioscoridis and Tamarix nilotica in the abandoned fields in Nile Delta, Egypt. Proc. 4th Int. Con. Biol.Sci.(Botany). pp. 59–64. Shaltout, K. H. & Slima, D. F. 2007. The biology of Egyptian woody perennials. Ass. Univ. Bull. Envir. Res. 10(1): 85-103. Shaltout, K.H., Sharaf El-Din, A. & Ahmed, D. 2010. Plant life in the Nile Delta: Tanta University Press, Tanta. Shaltout, K.H., El-Beheiry, M.A., El-Kady, H.F. & Keshta, A.E. 2010. Distribution of the naturalized species Dalbergia sisso Roxb.ex DC. in Nile Delta, Egypt. Taeckholmia. 30: 121-141. Sharaf El-Din, A., Shaltout, K.H., E1-Kady, H.F. & El-Komi, T.M. 1999. Nutrient status of Pluchea dioscoridis and Tamarix nilotica
15

Factors affecting the distribution of Pluchea dioscoridis (L.) DC.
under pure and mixed situations in the Nile Delta region. J. Union Arab. Biol. 9 (B): 43-58. Shehata, H.S. & Galal, T.M. 2015. Factors affecting the distribution and associated species of Malva parviflora in the Nile Delta, Egypt. Weed biology and management. 15(1): 42-52. Simpson, N.D. 1932. A Report on the Weed Flora of the Irrigation Channels in Egypt. Ministry of Public Works, Government Press, Cairo. Sperry, J.S. & Hacke, U.G. 2002. Desert shrub water relations with respect to soil characteristics and plant functional type. Functional Ecology 16: 367–378. SPSS. 2006. SPSS base 20.0 User’s guide. SPSS inc., Chicago, USA Stelzer, D., Schneider, S. & Melzer, A. 2005. Macrophyte – based assessment of lakes – a contribution to the implementation of the European water Frame work Directive in Germany. Intimate. Rev. Hydrobiologyia. 90: 223 – 237 Sukopp, H. & Werner, P. 1983. Urban environments and vegetation. In:Holzner W, Werger MJA, Ikushima I (eds) Man’s impact on vegetation. Dr W Junk Publishers, The Hague. pp. 247–260. Tӓckholm, V. 1974. Students' Flora of Egypt 2nd ed. Cairo University.
Ter Braak, C.J. 1986. Canonical Correspondence Analysis: A New Eigenvector Technique for Multivariate Direct Gradient Analysis. Ecology. 67: 1167-1179. Ter Braak, C.J. 1987. The Analysis of Vegetation - Environment Relationships by Canonical Correspondence Analysis (CCA).Vegetation. 69: 69-77. Thiebaut, G., Guerold, F. & Muller, S. 2002. Are trophic and diversity indices based on macrophyte communities pertinent tools to monitor water quality? Water Res. 36:3602–3610. UNESCO. 1977. Map of the world distribution of arid regions. MAB Technical Notes, Paris. Whittaker, R.I. 1972. Evolution and measurement of species diversity. Taxon. 21:213–251 Zhang, F. & Zhang, J.T. 2000. Research progress of numerical classification and ordination of vegetation in China. J. Shanxi Univ. (Nat. Sci. Educ.) 23: 278–282 (in Chinese with English abstract). Zohary, M. 1966 & 1972. Flora Palaestina. Parts 1 & 2, Israel Academy of Sciences and Humanities. Jerusalem. Zohary, M. 1973. Geobotanical Foundations of the Middle East, Gustav Fischer Verlag, Stuttgart, Germany.
16