Embed Size (px)
Citation preview
Journal of Cereal Science 25 (1997) 93–102
Factors Affecting Rapid Visco Analyser Curves forthe Determination of Maize Kernel Hardness
H. D. Almeida-Dominguez, E. L Suhendro and L. W. Rooney
Cereal Quality Laboratory, Soil and Crop Sciences Department, Texas A&M University, CollegeStation, TX 77843-2474, U.S.A.
Received 3 January 1995
ABSTRACTThe effects of grinding condition, solids content and heating rate on apparent viscosity measuredwith a Rapid Visco Analyzer (RVA) for maize kernel varieties with different endosperm hardnesswere investigated. Maize hardness was measured with a tangential abrasive dehulling device (TADD),density, flotation, and subjective ratings. Harder maize kernels gave rise to coarser particles that tooklonger to reach peak viscosity and had lower peak heights than the finer particles from soft kernels.Finely ground samples produced distinct viscosity curves. Higher solids content increased peakviscosity. A low heating rate produced the highest peak viscosities. The viscosity characteristics ofdecorticated, degermed maize kernels were similar to those observed for whole maize samples. Peakviscosity and slope were significantly correlated with kernel hardness values. Evaluation at 18% solidsconcentration with 10 °C/min heating rate for soft kernels and 2·4 °C/min for hard kernels resultedin the greatest sensitivity to differences in endosperm hardness. Maize samples can be initiallyseparated into hard and soft categories by flotation or density. RVA parameters can then be adjustedto distinguish between samples within each group. The RVA technique is sensitive to differences inmaize kernel endosperm hardness with the advantages of small sample size, short testing time, simpleprocedure, easy data management and versatility for screening kernels. 1997 Academic Press Limited
Keywords: maize, corn, kernel hardness, viscometric.
hardness indicator3. The torque and energy duringINTRODUCTIONpearling and disk milling has been recorded to
The normal variability in maize properties due to evaluate hardness of maize with different mois-genetics, growing environment, harvest, storage ture4. The proportion of maize kernels that floatand handling must be monitored in order to enable in a sodium nitrate solution of fixed specific gravitymilling and cooking processors to correct the pro- is commonly accepted in grain trading as a hard-cessing for optimum, consistent product quality in ness index.the manufacture of maize grits/meal, breakfast Breakage susceptibility can be measured bycereals, tortillas, tortilla chips and snacks. Hard- centrifugal impact in a Wisconsin Breakageness and breakage susceptibility are related prop- Tester5. Maize kernels are impacted against eacherties that can affect the utilization of maize1. other in an accelerator at speeds equivalent to
Density, grinding characteristics, crushing tests those attained by maize from 30·5 m vertical falland the flotation test have historically been used (US Marketing Research Laboratory)6. Maize canto measure hardness. The time required to obtain also be exposed to shear grinding in the Stein testa given amount of ground meal (resistance to for breakage susceptibility. Techniques sensitive togrinding) and the weight (or volume) ratio between cooking parameters are required to assess alkalinecoarse and fine particles are used in the Stenvert cooking and other cooking processes.test2,3. Near-infrared reflectance measurements of A viscometric procedure to estimate maize ker-
nel hardness that monitors the viscosity developedparticle size in ground maize has been used as a
0733–5210/97/010093+10 $25.00/0/jc960072 1997 Academic Press Limited

H. D. Almeida-Dominguez et al.94
as a result of hydration of particles and gel- Aspirator (Model 81863) to remove the hulls, andcleaned on a gravity table (Carter-Day Hi-Capatinization of starch during heating and stirring
in excess water can be used to relate/predict Gravity Separator, Oliver Manufacturing Co., Inc.Rocky Ford, CO) to remove the germ.cooking performance. A Brabender Visco Amy-
lograph has been used to evaluate the starch char-acteristics of commercial alkaline cooked maize
Milling conditions for samples with differentmasas7. The effect of processing in the pastingparticle sizescharacteristics of maize tortilla chips was evaluated
with a Rapid Visco Analyzer (RVA)8. Utilization Whole Export C (soft) and Pioneer 3192 (hard)of the RVA to evaluate sprout damage in barley9; maize kernels were ground with an Udy Cyclonenoodle quality of wheat10; and maize, wheat and mill (Model 3010-030, Udy Corporation, 201potato starch pasting characteristics has been Rome Court, Fort Collins, CO 80524) equippeddocumented11,12. The RVA provides information with a 1 mm screen (Fine) and with a Wiley millon starch characteristics similar to the Brabender (Thomas Laboratory Mill Model 4, Arthur H.Visco Amylograph with additional versatility of Thomas Co., Philadelphia, PA) equipped with atesting parameters13,14. Stirring speed, paddle 1 mm (Intermediate) or 2 mm (Coarse) screen toclearance and type, starch concentration, sample produce samples with different particle sizes. Thevolume/weight and heating and cooling rate affect recovery during grinding was essentially 100% tostarch paste viscosity15. The RVA has the ad- avoid segregation of chemical components. Over-vantages of using a small sample size, short testing heating was avoided to prevent excess starch dam-time, and the ability to modify testing conditions, age. Triplicate samples from each maize weresuch as stirring speed and heating rate, to optimize separately ground for testing.sensitivity to distinguish differences amongsamples. Effect of sample particle size on viscosityA RVA rapid viscometric technique to evaluate characteristics of maizemaize hardness was developed in this laboratory.
Viscosities of Fine, Intermediate and CoarseThe effect of grinding conditions, solids contentground samples were evaluated with a Rapid Viscoand heating rate on apparent viscosity were in-Analyzer 3C (RVA, Newport Scientific PTY, Ltd.,vestigated on six commercial hybrids with differentNarrabeen, Australia) at 15 and 18% solids. Theendosperm characteristics. The apparent viscositytime (min):temperature (°C) profiles were 0:50, 2:profiles were related to hardness measured with a50, 21:95 and 25:95, and 0:50, 2:50, 6·5:95, 11:tangential abrasive dehulling device, flotation and95, 15:50, 25:50, for 2·4 and 10 °C/min heatingsubjective observation.rates, respectively. The solids were added to waterand manually mixed with a thin spatula for 30 sto prepare slurries (28 g) for testing. The slopeMATERIALS AND METHODS(Rapid Visco Analyzer Units per min, RVU/min)
Raw materials of the ascending viscosity curve from the onsettemperature to peak viscosity, and the peak vis-A total of six commercial maize samples withcosity (RVU), time (min) and temperature (°C,different endosperm hardness, including Export Afrom the RVA heating block) were recorded.(11·6% moisture, 12·0% protein, d.b.), Export
C (11·5% moisture and 11·9% protein), Sunray(12·2% moisture, 11·3% protein), Asgrow 405W Effect of RVA parameters on viscosity(11·3% moisture, 10·7% protein), Pioneer 3192 characteristics of maize(12·1% moisture, 11·3% protein) and Popcorn(11·4% moisture, 11·2% protein), were screened The RVA viscosity characteristics of six Udy milled
(1 mm screen) whole maize samples were evaluatedand hand cleaned to obtain whole sound kernelsfor testing. at 15 or 18% solids concentration and 2·4 or
10 °C/min heating rate in an attempt to increaseAsgrow 405W was dry milled to obtain theendosperm fraction for testing. Grain (45·4 kg) was the sensitivity of the RVA to differences in kernel
hardness. The RVA test was conducted and vis-tempered to 22% moisture, broken with an impactmill (Ripple Mill Model SP-6368942, The Louis cosity parameters were recorded as described
above. Asgrow 405W endosperm fractions wereAllis Co., Milwaukee, WI), aspirated with a Kice
Viscometric Measurement of Maize Hardness 95
tested with the RVA at 15 or 18% solids con- level were used for mean comparison. The Meancentrations and 2·4 or 10 °C/min heating rates. Square Error after the variability of the model hasEndosperm particles were Udy milled before test- been removed was used to calculate LSD. Pearsoning with the RVA. correlation coefficients between physical and past-
ing characteristics of maize samples were de-termined.
Analysis
Maize hardness was determined with a TangentialRESULTS AND DISCUSSIONAbrasive Dehulling Device (TADD, Model 4E-
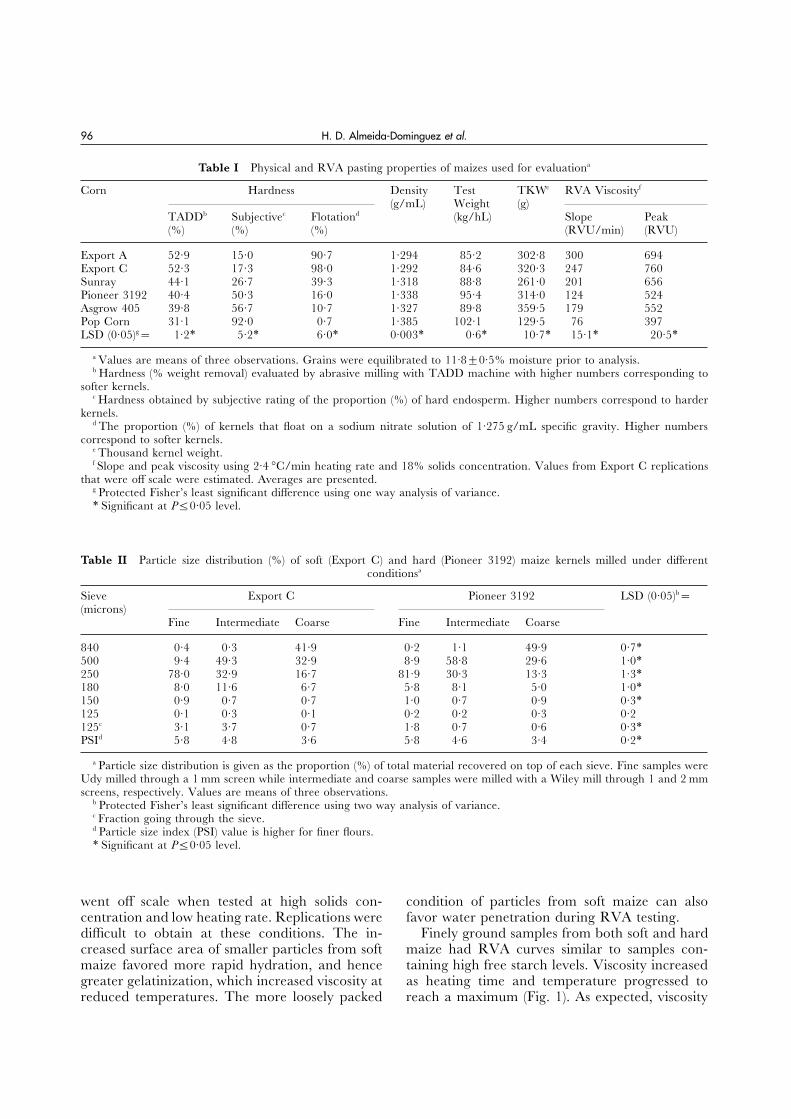
115, Venables Machine Works, Saskatoon, SK, The maize varieties had significantly differentCanada), by the proportion (%) of 50 maize kernels physical properties (Table I). Harder maizethat floated in a sodium nitrate solution (1·275 g/ samples such as Pioneer 3192, Popcorn, and As-mL density), and by subjectively rating the content grow 405W lostΖ40% of the kernel weight duringof hard endosperm. TADD hardness was recorded abrasive milling with the TADD, had [50%as the proportion (%) of the weight removed after of subjectively determined hard endosperm, highabrasion of 40 g of grain for 10 min using an density, high test weight and Ζ16% floaters. Softaluminium oxide abrasive disk (38A36-LSVBE) maize samples, such as Export A and C, lostand an 8-hole base. Higher values correspond more weight during abrasive milling, had smallerto softer kernels. The subjective hardness was proportion of hard endosperm and high pro-recorded as the proportion (%) of corneous en- portion of floaters. The air voids and the looselydosperm determined by visual examination of the packed structures increased the buoyancy of theendosperm from 10 kernels manually cut in half kernels in the floaters test, as well as the sus-with a blade. ceptibility of breakage during abrasive milling.
Density of grains (80 g) was determined with The soft kernel endosperms had a more opaquea nitrogen comparison multipycnometer (Model appearance than those in hard kernels. Opaque-MUP-1 S/N 232, Quantachrome Corp., Syosset, ness (mealyness or flouryness) is generally as-NY). Test weight was determined with a Win- sociated with softness in wheat kernels where airchester bushel meter using a 1 L cup. One thou- spaces make kernels less dense17. Drying, especiallysand kernel weight of grains was manually at high rates, produces air spaces that result indetermined by weighing 40 kernels and mul- opaqueness in wheat kernels18.tiplying by 25.
Particle size distribution of ground maizesamples was determined by sifting 50 g of ground
Effect of sample grinding conditions on viscositysample over 840, 500, 250, 180, 150 and 125characteristics of maizemicron sieves for 3 min. Overs from each sieve
were reported as a proportion (%) of the total The Intermediate and Coarse samples from Exportmaterial recovered. Particle size index was cal- C soft maize had finer particle sizes than thoseculated according to Khan et al.16 Higher values from the harder Pioneer 3192 (Table II). Thecorrespond to finer flours. proportion of coarse particles retained over the
840 micron sieve were higher for Pioneer 3192maize. In contrast, the proportion of fine particlesExperimental design and statistics from Export C maize that passed through the 125micron sieve was higher.A 3×2×2 factorial in a completely randomized
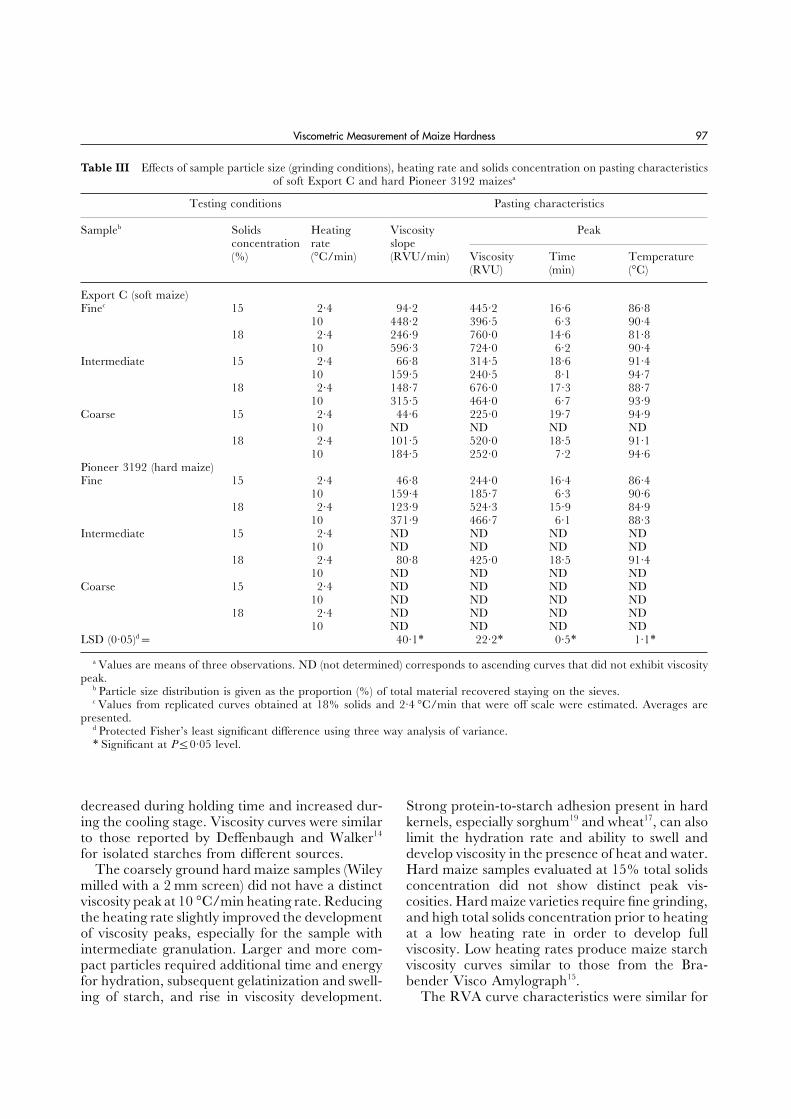
Grinding conditions significantly affected theexperimental design was used to evaluate thepasting characteristics of both soft and hard maizeeffects of sample particle size, RVA heating ratesamples (Table III). Finely ground samples (Udyand solids concentration on pasting properties ofmilled, 1 mm screen) had higher viscosity slopesmaize. A 6×2×2 factorial model in a completelyand more distinct peaks that developed both earlierrandomized experimental design was used toand at lower temperatures than did the coarserevaluate the effects of hardness (maize type), heat-samples. Soft maize was more affected by grindinging rate and solids concentration on the viscosityconditions than hard maize. Finely ground Exportcharacteristics of maize samples. Protected Fisher’s
least significant differences (LSD) at 0·05 alpha C soft maize developed high viscosity that easily
H. D. Almeida-Dominguez et al.96
Table I Physical and RVA pasting properties of maizes used for evaluationa
Corn Hardness Density Test TKWe RVA Viscosityf
(g/mL) Weight (g)TADDb Subjectivec Flotationd (kg/hL) Slope Peak(%) (%) (%) (RVU/min) (RVU)
Export A 52·9 15·0 90·7 1·294 85·2 302·8 300 694Export C 52·3 17·3 98·0 1·292 84·6 320·3 247 760Sunray 44·1 26·7 39·3 1·318 88·8 261·0 201 656Pioneer 3192 40·4 50·3 16·0 1·338 95·4 314·0 124 524Asgrow 405 39·8 56·7 10·7 1·327 89·8 359·5 179 552Pop Corn 31·1 92·0 0·7 1·385 102·1 129·5 76 397LSD (0·05)g= 1·2∗ 5·2∗ 6·0∗ 0·003∗ 0·6∗ 10·7∗ 15·1∗ 20·5∗
a Values are means of three observations. Grains were equilibrated to 11·8±0·5% moisture prior to analysis.b Hardness (% weight removal) evaluated by abrasive milling with TADD machine with higher numbers corresponding to
softer kernels.c Hardness obtained by subjective rating of the proportion (%) of hard endosperm. Higher numbers correspond to harder
kernels.d The proportion (%) of kernels that float on a sodium nitrate solution of 1·275 g/mL specific gravity. Higher numbers
correspond to softer kernels.e Thousand kernel weight.f Slope and peak viscosity using 2·4 °C/min heating rate and 18% solids concentration. Values from Export C replications
that were off scale were estimated. Averages are presented.g Protected Fisher’s least significant difference using one way analysis of variance.∗ Significant at PΖ0·05 level.
Table II Particle size distribution (%) of soft (Export C) and hard (Pioneer 3192) maize kernels milled under differentconditionsa
Sieve Export C Pioneer 3192 LSD (0·05)b=(microns)
Fine Intermediate Coarse Fine Intermediate Coarse
840 0·4 0·3 41·9 0·2 1·1 49·9 0·7∗500 9·4 49·3 32·9 8·9 58·8 29·6 1·0∗250 78·0 32·9 16·7 81·9 30·3 13·3 1·3∗180 8·0 11·6 6·7 5·8 8·1 5·0 1·0∗150 0·9 0·7 0·7 1·0 0·7 0·9 0·3∗125 0·1 0·3 0·1 0·2 0·2 0·3 0·2125c 3·1 3·7 0·7 1·8 0·7 0·6 0·3∗PSId 5·8 4·8 3·6 5·8 4·6 3·4 0·2∗
a Particle size distribution is given as the proportion (%) of total material recovered on top of each sieve. Fine samples wereUdy milled through a 1 mm screen while intermediate and coarse samples were milled with a Wiley mill through 1 and 2 mmscreens, respectively. Values are means of three observations.
b Protected Fisher’s least significant difference using two way analysis of variance.c Fraction going through the sieve.d Particle size index (PSI) value is higher for finer flours.∗ Significant at PΖ0·05 level.
went off scale when tested at high solids con- condition of particles from soft maize can alsofavor water penetration during RVA testing.centration and low heating rate. Replications were
difficult to obtain at these conditions. The in- Finely ground samples from both soft and hardmaize had RVA curves similar to samples con-creased surface area of smaller particles from soft
maize favored more rapid hydration, and hence taining high free starch levels. Viscosity increasedas heating time and temperature progressed togreater gelatinization, which increased viscosity at
reduced temperatures. The more loosely packed reach a maximum (Fig. 1). As expected, viscosity
Viscometric Measurement of Maize Hardness 97
Table III Effects of sample particle size (grinding conditions), heating rate and solids concentration on pasting characteristicsof soft Export C and hard Pioneer 3192 maizesa
Testing conditions Pasting characteristics
Sampleb Solids Heating Viscosity Peakconcentration rate slope(%) (°C/min) (RVU/min) Viscosity Time Temperature
(RVU) (min) (°C)
Export C (soft maize)Finec 15 2·4 94·2 445·2 16·6 86·8
10 448·2 396·5 6·3 90·418 2·4 246·9 760·0 14·6 81·8
10 596·3 724·0 6·2 90·4Intermediate 15 2·4 66·8 314·5 18·6 91·4
10 159·5 240·5 8·1 94·718 2·4 148·7 676·0 17·3 88·7
10 315·5 464·0 6·7 93·9Coarse 15 2·4 44·6 225·0 19·7 94·9
10 ND ND ND ND18 2·4 101·5 520·0 18·5 91·1
10 184·5 252·0 7·2 94·6Pioneer 3192 (hard maize)Fine 15 2·4 46·8 244·0 16·4 86·4
10 159·4 185·7 6·3 90·618 2·4 123·9 524·3 15·9 84·9
10 371·9 466·7 6·1 88·3Intermediate 15 2·4 ND ND ND ND
10 ND ND ND ND18 2·4 80·8 425·0 18·5 91·4
10 ND ND ND NDCoarse 15 2·4 ND ND ND ND
10 ND ND ND ND18 2·4 ND ND ND ND
10 ND ND ND NDLSD (0·05)d= 40·1∗ 22·2∗ 0·5∗ 1·1∗
a Values are means of three observations. ND (not determined) corresponds to ascending curves that did not exhibit viscositypeak.
b Particle size distribution is given as the proportion (%) of total material recovered staying on the sieves.c Values from replicated curves obtained at 18% solids and 2·4 °C/min that were off scale were estimated. Averages are
presented.d Protected Fisher’s least significant difference using three way analysis of variance.∗ Significant at PΖ0·05 level.
decreased during holding time and increased dur- Strong protein-to-starch adhesion present in hardkernels, especially sorghum19 and wheat17, can alsoing the cooling stage. Viscosity curves were similar
to those reported by Deffenbaugh and Walker14 limit the hydration rate and ability to swell anddevelop viscosity in the presence of heat and water.for isolated starches from different sources.
The coarsely ground hard maize samples (Wiley Hard maize samples evaluated at 15% total solidsconcentration did not show distinct peak vis-milled with a 2 mm screen) did not have a distinct
viscosity peak at 10 °C/min heating rate. Reducing cosities. Hard maize varieties require fine grinding,and high total solids concentration prior to heatingthe heating rate slightly improved the development
of viscosity peaks, especially for the sample with at a low heating rate in order to develop fullviscosity. Low heating rates produce maize starchintermediate granulation. Larger and more com-
pact particles required additional time and energy viscosity curves similar to those from the Bra-bender Visco Amylograph15.for hydration, subsequent gelatinization and swell-
ing of starch, and rise in viscosity development. The RVA curve characteristics were similar for

H. D. Almeida-Dominguez et al.98
25
900
Time (min)
App
aren
t vi
scos
ity
(RV
U)
5
500
(b)800
700
600
400
300
200
100
10 15 200
100
0
50
90
80
70
60
40
30
20
10
Tem
pera
ture
(°
C)
0
50
90
80
70
60
40
30
20
10
0
500
800
700
600
400
300
200
100
(a) Temperature profile
Figure 1 Effect of milling conditions (Udy or Wiley 1 or 2 mm screen) and total solids concentration (15 or 18%) on apparentviscosity of soft maize (Export maize C) heated at (a) 10 or (b) 2·4 °C/min. Curves correspond to individual replications. |—|Udy 15%, |— - - — - - —| Wiley 1 mm 15%, |— — — —| Wiley 2 mm 15%, |– – –| Udy 18%, |······| Wiley 1 mm 18%,|— - — - —| Wiley 2 mm 18%.
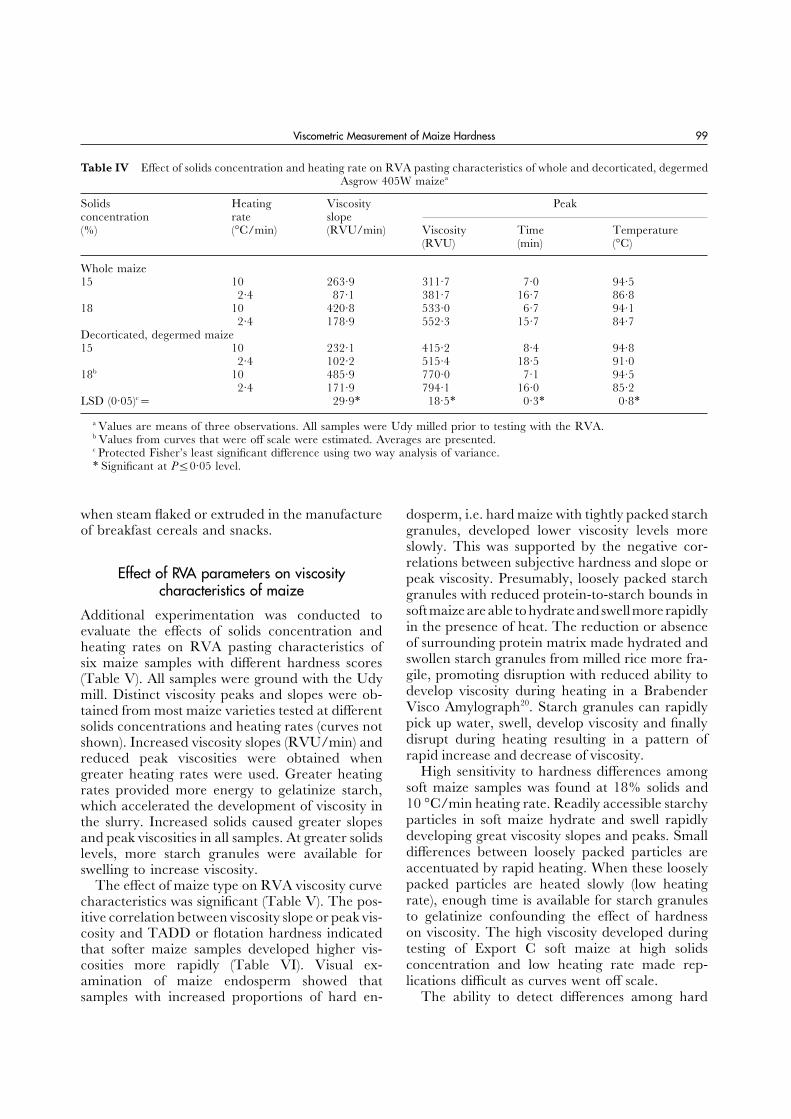
whole and decorticated, degermed Udy milled maize (i.e. maize grits or maize meal) as well aswhole maize. Fine grinding with the Udy millmaize sample (Table IV). As expected, de-
corticated, degermed maize developed sig- resulted in distinct viscosity curves. However, thesolids concentration may need to be reduced tonificantly higher viscosities than ground whole
maize, presumably due to the higher starch con- 16–17% when evaluating grits or meal in orderto obtain viscosity levels similar to those fromtent. Decorticated, degermed maize tested at the
high solids concentration was difficult to replicate whole maize kernels. The next logical step in thisresearch will be to optimize the RVA parametersas the slurry developed high viscosity that often
made the curve go off scale. to evaluate/predict the quality of whole maize fordry milling, and the performance of maize grits orThe RVA has the potential to evaluate the
pasting characteristics of decorticated, degermed meal that has undergone considerable disruption
Viscometric Measurement of Maize Hardness 99
Table IV Effect of solids concentration and heating rate on RVA pasting characteristics of whole and decorticated, degermedAsgrow 405W maizea
Solids Heating Viscosity Peakconcentration rate slope(%) (°C/min) (RVU/min) Viscosity Time Temperature
(RVU) (min) (°C)
Whole maize15 10 263·9 311·7 7·0 94·5
2·4 87·1 381·7 16·7 86·818 10 420·8 533·0 6·7 94·1
2·4 178·9 552·3 15·7 84·7Decorticated, degermed maize15 10 232·1 415·2 8·4 94·8
2·4 102·2 515·4 18·5 91·018b 10 485·9 770·0 7·1 94·5
2·4 171·9 794·1 16·0 85·2LSD (0·05)c= 29·9∗ 18·5∗ 0·3∗ 0·8∗
a Values are means of three observations. All samples were Udy milled prior to testing with the RVA.b Values from curves that were off scale were estimated. Averages are presented.c Protected Fisher’s least significant difference using two way analysis of variance.∗ Significant at PΖ0·05 level.
when steam flaked or extruded in the manufacture dosperm, i.e. hard maize with tightly packed starchof breakfast cereals and snacks. granules, developed lower viscosity levels more
slowly. This was supported by the negative cor-relations between subjective hardness and slope or
Effect of RVA parameters on viscosity peak viscosity. Presumably, loosely packed starchcharacteristics of maize granules with reduced protein-to-starch bounds in
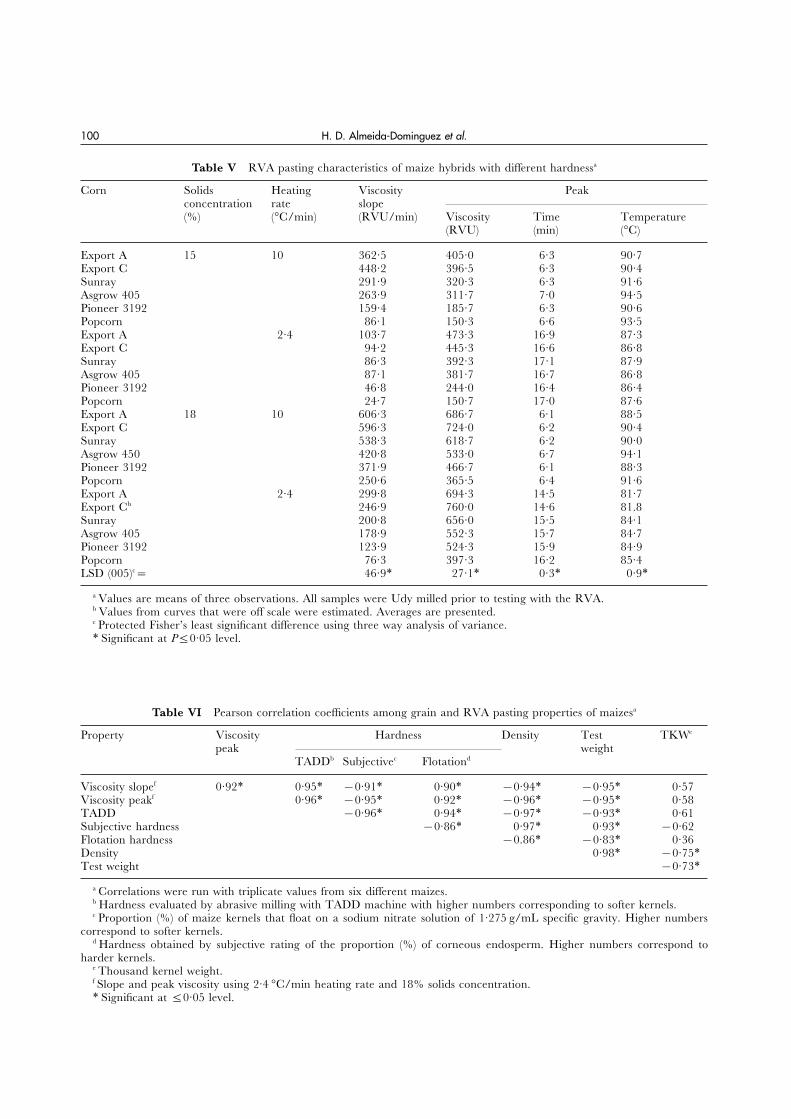
soft maize are able to hydrate and swell more rapidlyAdditional experimentation was conducted toin the presence of heat. The reduction or absenceevaluate the effects of solids concentration andof surrounding protein matrix made hydrated andheating rates on RVA pasting characteristics ofswollen starch granules from milled rice more fra-six maize samples with different hardness scoresgile, promoting disruption with reduced ability to(Table V). All samples were ground with the Udydevelop viscosity during heating in a Brabendermill. Distinct viscosity peaks and slopes were ob-Visco Amylograph20. Starch granules can rapidlytained from most maize varieties tested at differentpick up water, swell, develop viscosity and finallysolids concentrations and heating rates (curves notdisrupt during heating resulting in a pattern ofshown). Increased viscosity slopes (RVU/min) andrapid increase and decrease of viscosity.reduced peak viscosities were obtained when
High sensitivity to hardness differences amonggreater heating rates were used. Greater heatingsoft maize samples was found at 18% solids andrates provided more energy to gelatinize starch,10 °C/min heating rate. Readily accessible starchywhich accelerated the development of viscosity inparticles in soft maize hydrate and swell rapidlythe slurry. Increased solids caused greater slopesdeveloping great viscosity slopes and peaks. Smalland peak viscosities in all samples. At greater solidsdifferences between loosely packed particles arelevels, more starch granules were available foraccentuated by rapid heating. When these looselyswelling to increase viscosity.packed particles are heated slowly (low heatingThe effect of maize type on RVA viscosity curverate), enough time is available for starch granulescharacteristics was significant (Table V). The pos-to gelatinize confounding the effect of hardnessitive correlation between viscosity slope or peak vis-on viscosity. The high viscosity developed duringcosity and TADD or flotation hardness indicatedtesting of Export C soft maize at high solidsthat softer maize samples developed higher vis-concentration and low heating rate made rep-cosities more rapidly (Table VI). Visual ex-lications difficult as curves went off scale.amination of maize endosperm showed that
samples with increased proportions of hard en- The ability to detect differences among hard
H. D. Almeida-Dominguez et al.100
Table V RVA pasting characteristics of maize hybrids with different hardnessa
Corn Solids Heating Viscosity Peakconcentration rate slope(%) (°C/min) (RVU/min) Viscosity Time Temperature
(RVU) (min) (°C)
Export A 15 10 362·5 405·0 6·3 90·7Export C 448·2 396·5 6·3 90·4Sunray 291·9 320·3 6·3 91·6Asgrow 405 263·9 311·7 7·0 94·5Pioneer 3192 159·4 185·7 6·3 90·6Popcorn 86·1 150·3 6·6 93·5Export A 2·4 103·7 473·3 16·9 87·3Export C 94·2 445·3 16·6 86·8Sunray 86·3 392·3 17·1 87·9Asgrow 405 87·1 381·7 16·7 86·8Pioneer 3192 46·8 244·0 16·4 86·4Popcorn 24·7 150·7 17·0 87·6Export A 18 10 606·3 686·7 6·1 88·5Export C 596·3 724·0 6·2 90·4Sunray 538·3 618·7 6·2 90·0Asgrow 450 420·8 533·0 6·7 94·1Pioneer 3192 371·9 466·7 6·1 88·3Popcorn 250·6 365·5 6·4 91·6Export A 2·4 299·8 694·3 14·5 81·7Export Cb 246·9 760·0 14·6 81.8Sunray 200·8 656·0 15·5 84·1Asgrow 405 178·9 552·3 15·7 84·7Pioneer 3192 123·9 524·3 15·9 84·9Popcorn 76·3 397·3 16·2 85·4LSD (005)c= 46·9∗ 27·1∗ 0·3∗ 0·9∗
a Values are means of three observations. All samples were Udy milled prior to testing with the RVA.b Values from curves that were off scale were estimated. Averages are presented.c Protected Fisher’s least significant difference using three way analysis of variance.∗ Significant at PΖ0·05 level.
Table VI Pearson correlation coefficients among grain and RVA pasting properties of maizesa
Property Viscosity Hardness Density Test TKWe
peak weightTADDb Subjectivec Flotationd
Viscosity slopef 0·92∗ 0·95∗ −0·91∗ 0·90∗ −0·94∗ −0·95∗ 0·57Viscosity peakf 0·96∗ −0·95∗ 0·92∗ −0·96∗ −0·95∗ 0·58TADD −0·96∗ 0·94∗ −0·97∗ −0·93∗ 0·61Subjective hardness −0·86∗ 0·97∗ 0·93∗ −0·62Flotation hardness −0.86∗ −0·83∗ 0·36Density 0·98∗ −0·75∗Test weight −0·73∗
a Correlations were run with triplicate values from six different maizes.b Hardness evaluated by abrasive milling with TADD machine with higher numbers corresponding to softer kernels.c Proportion (%) of maize kernels that float on a sodium nitrate solution of 1·275 g/mL specific gravity. Higher numbers
correspond to softer kernels.d Hardness obtained by subjective rating of the proportion (%) of corneous endosperm. Higher numbers correspond to
harder kernels.e Thousand kernel weight.f Slope and peak viscosity using 2·4 °C/min heating rate and 18% solids concentration.∗ Significant at Ζ0·05 level.
Viscometric Measurement of Maize Hardness 101
maize samples was most successful at high solids in the RVA. Evaluation of whole maize samplescan be useful to select for endosperm hardness inconcentration (18%) and low heating rate (2·4 °C/
min). Distinctively different viscosity peaks were grain or seed improvement programs. Evaluationof the suitability of the RVA to monitor/predictobtained for hard endosperm maize samples when
heated at low rates. Identification of viscosity slopes the alkaline cooking performance of maize forproduction of tortillas and tortilla chips is needed.and peaks on clearly defined curves is important
to maintain high sensitivity to differences amongmaize samples. Tightly packed particles from hardmaize required additional time for hydration and
Acknowledgementsheating to develop viscosity compared to softmaize. Low heating and cooling rates increased This study was partially funded by the Snack Foodthe sensitivity of the RVA to differences in setback Association, Alexandria, VA and the Texas Corn Pro-
ducers Association, Dimmitt, TX.viscosities of various starches caused by differentstirring speeds15.
The RVA test is suitable for measuring differ-ences in hardness among groups of soft or hard
REFERENCESmaize. Maize samples can be initially sorted into1. Pomeranz, Y., Martin, C.R., Traylor, D.D. and Lai, F.S.soft and hard groups using flotation, density and
Corn hardness determination. Cereal Chemistry 61 (1984)TADD tests and then further classified using the147–150.RVA technique. Appropriate optimization of RVA
2. Stenvert, N.L.J. Grinding resistance, a simple measureparameters is recommended for maximum sensi- of wheat hardness. Flour Animal Feed Milling 156 (1974)tivity for particular ranges of maize hardness. 24–25, 27.
3. Pomeranz, Y., Czuchajowska, Z. and Lai, F.S. Com-Standardization of the grinding procedure to as-parison of methods for determination of hardness andsure consistent particle size distribution is fun-breakage susceptibility of commercially dried corn hard-damental.ness. Cereal Chemistry 63 (1986) 39–43.
Further studies are needed to evaluate the re- 4. Tran, T.L., de Man, J.M. and Rasper, V.F. Measurementlationship between RVA data and the alkaline of corn kernel hardness. Canadian Institute of Food Science
and Technology Journal 14 (1981) 42–48.cooking performance of maize varieties. The RVA5. Singh, S.S. and Finner, M.F. A centrifugal impacter forcan be used to evaluate ground maize for its
damage susceptibility evaluation of shelled corn. Trans-potential cooking properties.actions of The American Society of Agricultural Engineers 26(1983) 1858–1863.
6. Miller, B.S., Hughes, J.W., Rousser, R. and Pomeranz, Y.Note on a method for measuring breakage susceptibility ofCONCLUSIONSshelled corn during handling. Cereal Chemistry 56 (1979)213–216.The RVA viscosity was affected by the grinding
7. Plugfelder, R.L., Rooney, L.W. and Waniska, R.D. Frac-method (particle size), solids concentration, heat- tionation and composition of commercial corn masa.ing rate and type of maize. Fine grinding with an Cereal Chemistry 65 (1988) 262–266.Udy mill is recommended for testing grain in 8. Gomez, M.H., Lee, J.K., McDonough, C.M., Waniska,
R.D. and Rooney, L.W. Corn starch changes duringthe RVA. The rapid viscometric technique wastortilla chip processing. Cereal Chemistry 69 (1992) 275–279.sensitive enough to detect differences in maize
9. Bason, M.L., Ronalds, J.E., Wrigley, C.W. and Hubbard,endosperm hardness. Selection of particular RVA L.J. Testing for sprout damage in malting barley usingtesting conditions can improve this sensitivity to the Rapid Visco Analyzer. Cereal Chemistry 70 (1993)differences within groups of maize with similar 269–272.
10. Panozzo, J.F. and McCormick, K.M.J. The rapid visco-endosperm hardness. Testing samples at 18% sol-analyzer as a method for testing for noodle quality inids at either 2·4 or 10 °C/min heating rate isa wheat breeding programme. Cereal Science 17 (1993)recommended to evaluate differences within 25–32.
groups of hard and soft maize, respectively. The 11. Kim, C.S. and Walker, C.E. Changes in starch pastingRVA viscosity data were highly correlated to maize properties due to sugars and emulsifiers as determined
by viscosity measurements. Journal of Food Science 57 (1992)hardness determined by flotation, density, TADD1009–1013.and subjective methods. The RVA has potential
12. Deffenbaugh, L.B. and Walker, C.E. Use of the Rapidfor screening among groups of soft or hard maize Visco Analyzer to measure starch pasting properties.previously sorted using flotation or density. Starch/Starke 41 (1989) 461–467.
13. Walker, C.E., Ross, A.S., Wrigley, C.W. and McMaster,Both whole maize or maize grits can be tested
H. D. Almeida-Dominguez et al.102
G.J. Accelerated starch-paste characterization with the 17. Anjum, F.M. and Walker, C.E. Review on the significanceof starch and protein to wheat kernel hardness. JournalRapid Visco Analyzer. Cereal Foods World 33 (1988) 491–
494. of the Science of Food and Agriculture 56 (1991) 1–13.18. Parish, J.A. and Halse, N.J. Effect of light, temperature,14. Deffenbaugh, L.B. and Walker, C.E. Comparison of
starch properties in the Brabender Visco Amylograph and rate of desiccation on translucency in wheat grain.Australian Journal of Agricultural Research 18 (1968) 365–372.and the Rapid Visco Analyzer. Cereal Chemistry 66 (1989)
493–499. 19. Lawton, J.W. Studies of sorghum endosperm hardnessusing reconstituted tablets and the tangential abrasive15. Blakeney, A.B. and Welsh, L.A. The influence of stirring
speed on starch paste viscosity. Cereal Foods World 38 dehulling device. PhD. Dissertation, Kansas State Uni-versity, Manhattan, Kansas. 1989.(1993) 627. Abstract.
16. Khan, M.N., DesRosiers, M.C., Rooney, L.W., Morgan, 20. Hamaker, B.R. and Griffin, V.K. Changing the visco-elastic properties of cooked rice through protein dis-R.G. and Sweat, V.G. Corn tortillas: evaluation of corn
cooking procedures. Cereal Chemistry 59 (1982) 279–282. ruption. Cereal Chemistry 67 (1990) 261–264.