Embed Size (px)
Citation preview

MBA 2006/2007
Factors Affecting Private Investment in New Power Generating Capacity in
South Africa
CHRISTOPHER FORLEE
A research project submitted to the Gordon Institute of Business Science,
University of Pretoria in partial fulfilment of the requirements for the degree of
Master of Business Administration.
November 2007
©© UUnniivveerrssiittyy ooff PPrreettoorriiaa

Abstract
Private Investment in electrical power generation will play a substantial role in
South Africa’s massive capacity expansion programme over the next 20 years.
Should this investment not materialise, South Africa’s security of electricity
supply would be seriously compromised.
The purpose of this research was to determine whether major factors that
impact on the attractiveness of a country’s power sector to private investors are
being catered for in South Africa and where the possible shortcomings are.
The research was qualitative in nature and the methodology followed was to
survey industry role players by way of a self-administered questionnaire.
Response data were analysed using descriptive statistics as well as inferential
statistics (hypothesis testing) where a one tailed, one sample t-Test was used.
The findings of the research are that the South African legal system and the
revenue generation potential of the power sector are advantages that the
country can leverage off to attract power sector investors.
Major stumbling blocks to private investor participation needing immediate
attention, are the lack of responsiveness of Government to private sector needs
and timeframes as well as the lack of independence of the Regulatory
institutions and processes from Government interference whether perceived or
real.
ii

Declaration
I declare that this research project is my own work. It is submitted in partial
fulfilment of the requirements for the degree of Master of Business
Administration at the Gordon Institute of Business Science, University of
Pretoria. It has not been submitted before for any degree or examination in any
other University.
__________________________ Date: 14 November 2006
Christopher Forlee
iii

Acknowledgements
I would most of all, like to thank my fiancé, Nerupha for all of her love, support
and patience throughout the MBA programme, this journey would have been all
the more difficult and virtually impossible without you by my side.
Thank you to my parents for their love and support throughout my life and for
teaching me the value of a higher education.
Thank you to my supervisor, Dr. Rajinder Raina for all of the support and
practical guidance.
iv

Contents
Abstract ............................................................................................................ ii Declaration....................................................................................................... iii Acknowledgements ........................................................................................ iv
List of Figures ................................................................................................ vii List of Tables ................................................................................................. viii Chapter 1: Introduction to Research Problem............................................... 1
1.1. Introduction .......................................................................................... 1
1.2. The Research Problem........................................................................ 8
1.3. Objective of this Research ................................................................... 9
Chapter 2: Literature Review......................................................................... 10
2.1. Structure of the South African Electricity Supply Industry .................. 10
2.2. Policy and Legislation ........................................................................ 13
2.3. Independent Power Producers .......................................................... 17
2.4. System Planning................................................................................ 20
2.5. Security of Supply .............................................................................. 21
2.6. Criteria for Investment........................................................................ 22
2.7. Wholesale Markets vs. Vertically Integrated ...................................... 23
2.8. Efficiency Gains ................................................................................. 25
2.9. Comparative Studies.......................................................................... 26
2.10. Current Study..................................................................................... 28
Chapter 3: Research Hypotheses ................................................................. 29
3.1. Research Hypotheses........................................................................ 31
Chapter 4: Research Methodology ............................................................... 32
4.1. Research Design ............................................................................... 32
4.2. Unit of Analysis .................................................................................. 33
4.3. Population of Relevance .................................................................... 33
4.4. Sample Size and Sampling Method................................................... 34
4.5. Research Instrument.......................................................................... 36
4.6. Details of Data Collection................................................................... 38
4.7. The Process of Data Analysis............................................................ 39
4.7.1 Descriptive Statistics................................................................... 40
4.7.2 Inferential Statistics..................................................................... 42
v

4.8 Limitations of the Research ............................................................... 46
Chapter 5: Results ......................................................................................... 48
5.1. Descriptive Statistical Analysis .......................................................... 49
5.1.1 Analysis of Individual Questions ................................................. 49
5.1.2 Correlation Analysis.................................................................... 56
5.1.3 Analysis of Summated Observations per Hypothesis ................. 56
5.2. Inferential Statistical Analysis ............................................................ 62
5.2.1 Hypothesis 1: Adequate cash flow.............................................. 63
5.2.2 Hypothesis 2: Good Legal Framework........................................ 65
5.2.3 Hypothesis 3: Government responsive to power sector needs... 67
5.2.4 Hypothesis 4: Independence of Regulatory Institutions .............. 69
5.3. Summarised Results.......................................................................... 71
Chapter 6: Discussion of Results ................................................................. 72
6.1. Hypothesis 1: Adequacy of cash flows in the sector .......................... 74
6.2. Hypothesis 2: Stability and enforcement of laws and contracts ......... 77
6.3. Hypothesis 3: Government responsiveness to power sector needs .. 80
6.4. Hypothesis 4: Independence of Regulatory Institutions ..................... 83
6.5. Discussion of Results Summary ........................................................ 86
Chapter 7: Conclusion................................................................................... 90
References...................................................................................................... 95
APPENDIX 1: Research Questionnaire ........................................................ 99
APPENDIX 2: One-Sample t-Test Report (Hypothesis 1) .......................... 101
APPENDIX 3: One-Sample t-Test Report (Hypothesis 2) .......................... 102
APPENDIX 4: One-Sample t-Test Report (Hypothesis 3) .......................... 103
APPENDIX 5: One-Sample t-Test Report (Hypothesis 4) .......................... 104
vi

List of Figures
Figure 1. Declining Reserve Margin ................................................................ 5
Figure 2. South Africa: Electricity Demand/Capacity Forecast ........................ 7
Figure 3. South African National Grid and Eskom Power Stations ................ 12
Figure 4. International Electricity Price Comparison...................................... 13
Figure 5. Forms of Private Investment in the Power Sector .......................... 18
Figure 6. Breakdown of Respondents by Sector ........................................... 49
Figure 7. Hypothesis 1 (Adequate cash flows) .............................................. 51
Figure 8. Hypothesis 2 (Good Legal Framework).......................................... 52
Figure 9. Hypothesis 3 (Government responsive to power sector needs) ..... 54
Figure 10. Hypothesis 4 (Independence of Regulatory Institutions) ................ 55
Figure 11. Histogram of Summated Responses for Hypothesis 1 ................... 58
Figure 12. Histogram of Summated Responses for Hypothesis 2 ................... 59
Figure 13. Histogram of Summated Responses for Hypothesis 3 ................... 60
Figure 14. Histogram of Summated Responses for Hypothesis 4 ................... 62
vii
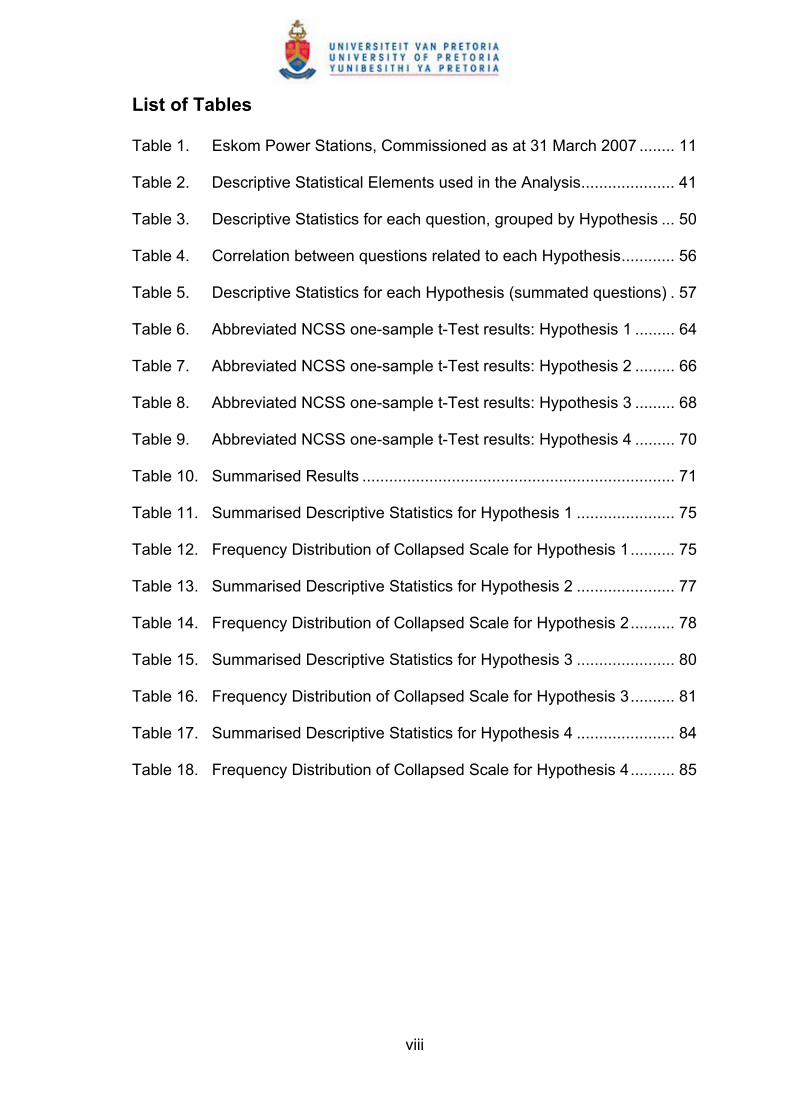
List of Tables
Table 1. Eskom Power Stations, Commissioned as at 31 March 2007 ........ 11
Table 2. Descriptive Statistical Elements used in the Analysis..................... 41
Table 3. Descriptive Statistics for each question, grouped by Hypothesis ... 50
Table 4. Correlation between questions related to each Hypothesis............ 56
Table 5. Descriptive Statistics for each Hypothesis (summated questions) . 57
Table 6. Abbreviated NCSS one-sample t-Test results: Hypothesis 1 ......... 64
Table 7. Abbreviated NCSS one-sample t-Test results: Hypothesis 2 ......... 66
Table 8. Abbreviated NCSS one-sample t-Test results: Hypothesis 3 ......... 68
Table 9. Abbreviated NCSS one-sample t-Test results: Hypothesis 4 ......... 70
Table 10. Summarised Results ...................................................................... 71
Table 11. Summarised Descriptive Statistics for Hypothesis 1 ...................... 75
Table 12. Frequency Distribution of Collapsed Scale for Hypothesis 1.......... 75
Table 13. Summarised Descriptive Statistics for Hypothesis 2 ...................... 77
Table 14. Frequency Distribution of Collapsed Scale for Hypothesis 2.......... 78
Table 15. Summarised Descriptive Statistics for Hypothesis 3 ...................... 80
Table 16. Frequency Distribution of Collapsed Scale for Hypothesis 3.......... 81
Table 17. Summarised Descriptive Statistics for Hypothesis 4 ...................... 84
Table 18. Frequency Distribution of Collapsed Scale for Hypothesis 4.......... 85
viii

Chapter 1: Introduction to Research Problem
1.1. Introduction
Energy in the form of electricity has become a necessary part of our daily lives.
The majority, if not all of our household appliances (cooking, entertainment,
security, etc.) are powered by electricity. One just has to experience a power
cut, especially at night to realise the how integral to our lives a reliable electricity
supply has become.
South Africa has been fortunate enough to have a supremely reliable electricity
supply system until fairly recently. There was huge over investment in power
generating infrastructure by the South African Electricity Supply Utility, Eskom,
during the 1970s and 80s as a result of forecast Gross Domestic Product (GDP)
growth that did not materialise. The result was that during the investment
phase electricity prices were much higher than they needed to be at that time,
however, during the years following the investment, much time has passed and
electricity prices have actually fallen in real terms due to the utility not needing
to invest in the massive capital expenditure that power plant require.
The nett effect has been that until the beginning of 2006, the South African
National Electricity Supply System at the Generation and Transmission level
has been extremely reliable, with unplanned outages being few and far
between. This has not been the case at the Distribution level where a lack of
maintenance, refurbishment and expansion has seen those networks
deteriorate into a severe state of disrepair resulting in a steady decline in the
1

quality of electricity supply at that level, but that is the subject for another paper,
this paper deals specifically with the Generation sector.
Given that electricity is a resource that cannot be stored in any significant
quantity and must in effect be produced as it is consumed, Joskow (2006)
states that the generating capacity available to supply electrical energy at any
point in time must always be greater than the demand for electrical energy at
that point in time. This results in the need to carry “inventory” in the form of
generators providing frequency regulation and operating reserve services. This
“inventory” is in the form of additional generating capacity reserves that must be
available either immediately or able to start up quickly to provide energy to
balance supply and demand at each location on the network in response to real
time variations in demand and unplanned equipment outages (failure).
When these reserves fall below a certain level because all available generating
capacity are fully utilised, system operators have to take actions to reduce
demand administratively according to a pre-specified hierarchy of “operating
reserve shortage” actions to prevent network failure. These culminate in rolling
blackouts (electricity supply is interrupted to large blocks of consumers on a
rotating basis) at which point all other options have been exhausted and the
network is in imminent danger of collapsing. Should a country’s electrical
network (‘grid”) be allowed to collapse, it may take many days for power to be
restored and the entire country would be in “darkness” for a prolonged period.
This is known as a “blackstart” condition, the nightmare every system operator
strives to avoid
2
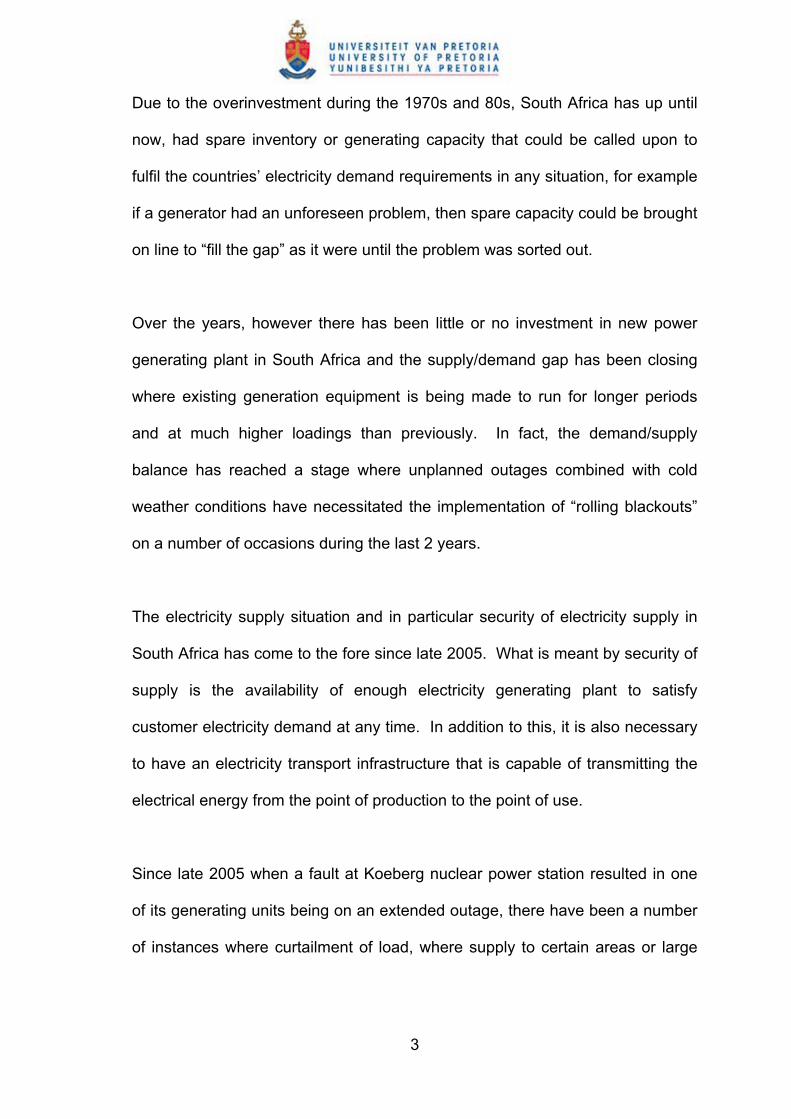
Due to the overinvestment during the 1970s and 80s, South Africa has up until
now, had spare inventory or generating capacity that could be called upon to
fulfil the countries’ electricity demand requirements in any situation, for example
if a generator had an unforeseen problem, then spare capacity could be brought
on line to “fill the gap” as it were until the problem was sorted out.
Over the years, however there has been little or no investment in new power
generating plant in South Africa and the supply/demand gap has been closing
where existing generation equipment is being made to run for longer periods
and at much higher loadings than previously. In fact, the demand/supply
balance has reached a stage where unplanned outages combined with cold
weather conditions have necessitated the implementation of “rolling blackouts”
on a number of occasions during the last 2 years.
The electricity supply situation and in particular security of electricity supply in
South Africa has come to the fore since late 2005. What is meant by security of
supply is the availability of enough electricity generating plant to satisfy
customer electricity demand at any time. In addition to this, it is also necessary
to have an electricity transport infrastructure that is capable of transmitting the
electrical energy from the point of production to the point of use.
Since late 2005 when a fault at Koeberg nuclear power station resulted in one
of its generating units being on an extended outage, there have been a number
of instances where curtailment of load, where supply to certain areas or large
3

customers is interrupted to cater for a shortfall in electricity generating capacity
to meet customer demand, had to be implemented (Eskom, 2007a).
To cater for the variability in electricity demand, which fluctuates daily and
seasonally, enough power plants have to be built to cater for the maximum that
would be demanded by the consumer at any one time. To cater for the
variability in demand, the national power system always needs to have a
“reserve” capacity in hand. This is called the reserve margin and is the
difference between the maximum power generating capacity available and the
maximum or peak electricity demanded by the consumer (Joskow, 2006). This
difference is considered adequate in most power systems internationally if it is
around 15%.
Over the last decade, the reserve margin on the South African power system
has declined below 15%, to levels where security of supply is at risk as has
been evidenced by a number of incidents during 2006/7 where national “load
shedding” had to be performed to ensure that the national electricity supply
system remained stable. The steady decline in reserve margin over the years is
illustrated in Figure 1 below.
Power stations have long lead times and have to be planned many years in
advance. There is a fine balance between building too many power stations too
quickly as there is a cost associated with this to the electricity consumer vs.
building too few power stations too late with resultant power outages and
4

associated blackouts, which come at a cost to the economy and customer
comfort.
Figure 1. Declining Reserve Margin
Source: Eskom Annual Report (2007)
The question currently being asked is why South Africa has only started building
additional power generating capacity now, when it is already experiencing
supply shortages. An even greater question is who should have started building
additional generating capacity.
The majority of the current power generating capacity in South Africa is owned
and operated by state owned utility, Eskom, a virtual monopoly. The idea of a
competitive wholesale electricity market was mooted many years ago where
Eskom and other Independent Power Producers (IPPs) would compete to
5

supply electricity and government had set targets of a 70:30 split between
Eskom and the IPPs in this regard (DME, 2007).
Given that South Africa is facing a fast reducing reserve margin and increased
risk of power supply interruptions, the need for timeous additional power
generating capacity is critical. The 30% of new generating capacity reserved for
the private sector is therefore of crucial importance to South Africa’s security of
electricity supply. The requirements to ensure private sector participation in the
build of new generating capacity are of particular interest in this context.
Eskom has embarked upon a substantial 20 year build program to restore
security of supply (the necessary level of “inventory”), but power stations by
their very nature take many years to construct and it will be some time before
security of supply is achieved. Current forecasts are that this will only be
around 2012 (five years from now) when the first of the new large coal-fired
power stations is scheduled to commence operation. In the interim, some gas-
fired plant, which is quicker to build, will come online to help alleviate the
situation, but these are generally only used during peak demand periods and for
a short time, due to their very high operational cost.
As indicated above, Government has a stated objective, that 30% of all new
non-nuclear power generation should be built, owned and operated by the
private sector as opposed to Eskom, the state-owned utility. It is envisaged that
private sector participation will allow benchmarking of the state-owned utility
6

and will introduce savings through increased efficiencies in operation as well as
a reduction in construction costs.
The 20 year build program required to meet the country’s growing electricity
needs comprises some 80 000MW (MW = Megawatt) of capacity, which means
that 24 000MW of new generating capacity needs to be built by the private
sector. Timeframes are extremely tight for delivery of this capacity if South
Africa’s security of supply is not to be compromised any further. The 20 year
demand forecast and the necessary generation capacity needed to meet it are
illustrated in Figure 2 below.
Figure 2. South Africa: Electricity Demand/Capacity Forecast
Source: Eskom Integrated Strategic Planning Department, 2007
Capacity Outlook of Eskom Position (MW)
30 000
35 000
40 000
45 000
50 000
55 000
60 000
65 000
70 000
75 000
80 000
85 000
90 000
2005 2006 2007 2008 2009 2010 2011 2012 2013 2014 2015 2016 2017 2018 2019 2020 2021 2022 2023 2024
Years
MW
Build New Base Load (Pulverised Fuel Proxy)Build New Base Load CCGT PlantsBuild New Pumped Storage PlantsBuild New OCGT Peaking PlantsReturn to Service Mothballed PlantsTotal DSM Capacity Conserved (MW)Import from Cahora Bassa Hydro (firm)Total Existing System incl Decommissioning Options Peak Demand before DSM of Eskom Position (MW)TOTAL CAPACITY CONTRIBUTION (MW)
7

The timeous delivery of additional power generating capacity is crucial for the
continued economic success of the country. A secure and reliable electricity
supply system is necessary for investor confidence and the continued growth of
the country’s industrial and manufacturing sector.
1.2. The Research Problem
A stable, secure electricity supply system is one of the foundations that a
healthy, growing economy needs, without it, South Africa will not achieve the
Government’s AsgiSA target of 6% GDP growth by 2010.
The supply/demand balance is already precarious at best and additional power
generating capacity is sorely needed. It is estimated that an additional
80 000MW of power generation is needed by 2025 to meet the country’s
electricity demand needs.
Government has stated that 30% or 24 000MW of this must be built, owned and
operated by the Private Sector, the so-called Independent Power Producers
(IPPs). The process for establishing the first IPP in the country was conducted
by the Department of Minerals and Energy (DME) and has been a long and
protracted process. During the process, there were initially 5 bidders, but 3
dropped out and eventually only 2 were left, the others had “lost interest”.
Given the tight timeframes South Africa must achieve to maintain quality of
supply at its current levels and to restore full security of supply and the
substantial role that IPPs will play in this, the process to establish the first IPP
8

raises many questions and concerns. It is clear that should the same process
be followed for the rest of the 24 000MW private sector participation, then
security of supply will not be restored by 2012, not even by 2020.
The problem facing South Africa’s electricity sector is that there appears to be a
lack of interest amongst Independent Power Producers as evidenced by the
DME’s competitive bidding process only yielding 2 interested parties.
This study will attempt to determine whether the major factors that influence
private sector investment in new power generation plant in South Africa are
catered for by surveying a sample of the organisations playing a major role in
this sector from both the government and private business sectors.
1.3. Objective of this Research
The objective of this research is to survey the major players in the Electricity
Sector in South Africa, especially potential private investors in power generation
to determine whether the major factors upon which decisions to invest or not to
invest in a power project are based are catered for in South Africa.
Once identified, action can be taken to address these factors to create the
necessary environment to attract private sector investment in new power
generating capacity in South Africa.
9

Chapter 2: Literature Review
2.1. Structure of the South African Electricity Supply Industry
The South African Electricity Supply Industry (ESI) remains dominated by the
state-owned and vertically integrated utility, Eskom, which ranks amongst the
top 11 utilities in the world in terms of electricity sales and amongst the top 10 in
terms of generating capacity (Eskom, 2007b).
Eskom is a virtual monopoly in the generation sector and generates 96% of
South Africa’s electricity, which amounts to more than half the electricity
generated on the African continent. Private generators contribute about 3% of
national output (mostly for their own consumption) and municipalities contribute
less than 1%. South Africa’s electricity infrastructure is heavily dependent on
coal (92%) with nuclear, hydro-electricity, bagasse (from sugarcane) and
emergency gas turbines (running on diesel fuel) accounting for the rest
(National Electricity Regulator, 2004). A breakdown of Eskom’s commissioned
power stations at 31 March 2007 is given in Table 1 below.
Eskom is a monopoly in the Transmission sector as it owns and controls the
entire national integrated high-voltage transmission grid and distributes about
60% of electricity directly to customers. The remainder of electricity distribution
is undertaken by about 185 local authorities that buy bulk-supplies of electricity
from Eskom (Eskom, 2007b).
Eskom also imports power from Mozambique and to a lesser extent from the
Democratic Republic of Congo and Zambia. However, the country also sells
10

electricity to neighbouring countries (Botswana, Lesotho, Mozambique,
Namibia, Swaziland, Zambia and Zimbabwe). Imports and exports constitute
about 5% of the total electricity on the Eskom system (Eskom, 2007b).
Table 1. Eskom Power Stations, Commissioned as at 31 March 2007
Source: Eskom Annual Report 2007
Type of Station Name of Station Location Number and Capacity of Generator Sets
Total Installed Capacity
Total Available Capacity
Arnot Middelburg 4x350 ; 2x370 2 140 2 020
Camden Ermelo 6x200 ; 2x190 1 580 930
Duvha Witbank 6x600 3 600 3 450
Grootvlei Balfour 6x200 1 200 -
Hendrina Hendrina 10x200 2 000 1 895
Kendal Witbank 6x686 4 116 3 840
Komati Middelburg 5x100 ; 4x125 1 000 -
Kriel Bethal 6x500 3 000 2 850
Lethabo Sasolburg 6x618 3 708 3 558
Majuba Volksrust 3x657 ; 3x713 4 110 3 843
Matimba Lephalale 6x665 3 990 3 690
Matla Bethal 6x600 3 600 3 450
Tutka Standerton 6x609 3 654 3 510
Acacia Cape Town 3x57 171 171
Ankerlig Atlantis 3x147 441 438
Gourikwa Mossel Bay 1x146 146 145
Port Rex East London 3x57 171 171
Colley Wobbles Mbashe River 3x14 42 -
First Falls Umtata River 2x3 6 -
Gariep Norvalspont 4x90 360 360
Ncora Ncora River 2x0.4 ; 1x1.3 2 -
Second Falls Umtata River 2x5.5 11 -
Vanderkloof Petrusville 2x120 240 240
Drakensberg Bergville 4x250 1 000 1 000
Palmiet Grabouw 2x200 400 400
Nuclear (1) Koeberg Cape Town 2x965 1 930 1 800
42 618 37 761
Pumped Storage (2)
Total (Megawatt)
Coal-Fired (13)
Gas/Liquid Fuel (4)
Hydroelectric (6)
Direct electricity sales to mines and industrial customers accounted for over
40% of Eskom’s electricity sales in 2006/7. Eskom also operates retail
distribution services for 3.96 million customers (3.8 million of these are
households) and the municipal distributors service an additional 4 million
customers.
11

A diagram of the South African power network and the location of Eskom’s
power stations nationally are given in Figure 3 below.
Figure 3. South African National Grid and Eskom Power Stations
Source: Eskom Annual Report 2007
About two-thirds of South Africans have access to electricity. South Africa has
the cheapest priced electricity in the world (see Figure 4). The Eskom average
electricity price in 2006/7 was 3.56US¢/kWh vs. its nearest rival Canada at
6.18US¢/kWh (NUS, 2007).
12
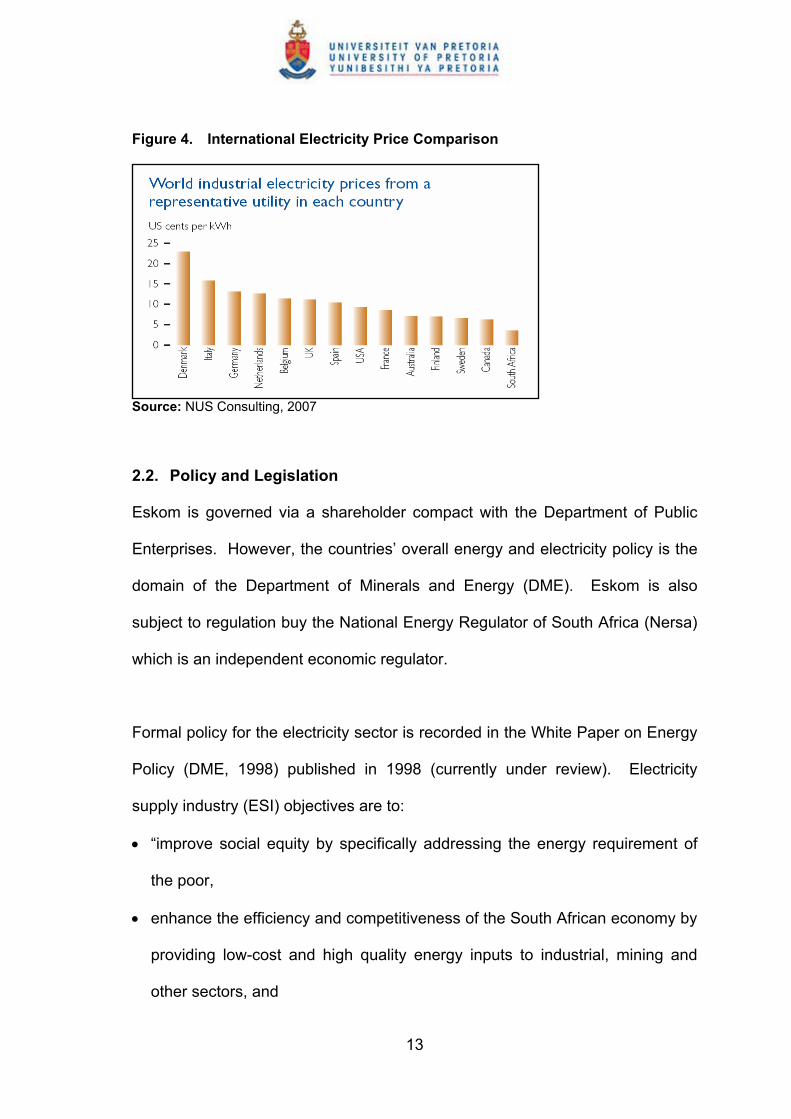
Figure 4. International Electricity Price Comparison
Source: NUS Consulting, 2007
2.2. Policy and Legislation
Eskom is governed via a shareholder compact with the Department of Public
Enterprises. However, the countries’ overall energy and electricity policy is the
domain of the Department of Minerals and Energy (DME). Eskom is also
subject to regulation buy the National Energy Regulator of South Africa (Nersa)
which is an independent economic regulator.
Formal policy for the electricity sector is recorded in the White Paper on Energy
Policy (DME, 1998) published in 1998 (currently under review). Electricity
supply industry (ESI) objectives are to:
• “improve social equity by specifically addressing the energy requirement of
the poor,
• enhance the efficiency and competitiveness of the South African economy by
providing low-cost and high quality energy inputs to industrial, mining and
other sectors, and
13

• achieve environmental sustainability in both the short and long-term usage of
natural resources.”
The White paper also envisaged:
• “giving customers the right to choose their electricity supplier,
• introducing competition into the industry, especially in the generation sector,
• permitting open, non-discriminatory access to the transmission system, and
• encouraging private sector participation in the industry.”
The White Paper stated further that in the long term, Eskom would “be
restructured into separate Generation and Transmission companies”.
Government also intended at the time “to separate power stations into a number
of companies” to introduce competition and Independent Power Producers
(IPPs) were also to be introduced.
These policies were confirmed in a Cabinet decision in May 2001 and
government engaged consultants to design an electricity market that included a
power exchange and bilateral contracts. While Distribution and Transmission
were to be unbundled, Cabinet stopped short of full horizontal unbundling of
Eskom’s Generation plant, only 30% was to be sold and the rest were to be
clustered into a number of generation units that would compete in the market.
In the meantime, Eskom was prohibited from building new generation plant and
was encouraged to expand its activities into the rest of Africa (Newbery and
Eberhard, 2007).
14

According to Newbery and Eberhard (2007), the electricity market was never
implemented and in 2004 Cabinet announced that Eskom would not be
unbundled, nor would it be privatised. Work on the design of the electricity
market was terminated and Eskom was once again authorised to invest in new
capacity, while IPPs would be invited to contribute up to 30% of new generation
capacity. A revised electricity policy has not formally been published. However,
it is now clear that the electricity policies in the 1998 Energy Policy White Paper
no longer apply, even though the White Paper has not been repudiated or
formally withdrawn and is still invoked in other energy policy areas.
Newbery and Eberhard (2007) go further to say that Government sees Eskom
as a “national champion” that will spearhead infrastructure investment in
support of economic growth and improved welfare. Government ministers have
said that Eskom’s Generation and Transmission divisions will not be unbundled
and that Eskom needs to take primary responsibility for security of electricity
supply in South Africa.
The electricity sector is governed by the following legislation:
• The Constitution of South Africa, 1996 which grants municipalities executive
authority and the right to administer “electricity reticulation”.
• The Eskom Conversion Act No.13 of 2001 which clarified Eskom’s status as
a public company subject to the Companies Act (with certain exemptions)
with 100% of its equity held by the state, governed by a Shareholder
Compact and liable for payment of dividends and taxes.
15

• National Energy Regulation Act No. 40 of 2004 that defines the composition,
powers and functions of Nersa, the electricity, gas and petroleum pipelines
regulator.
• Electricity Regulation Act No. 4 of 2006 that defines the electricity regulatory
functions of Nersa. An amendment to the Act deals with the regulation of
electricity “reticulation” as defined in the constitution.
• National Nuclear Regulator Act No. 47 of 1999 that regulates nuclear safety
issues.
• Public Finance Management Act No.1 of 1999 that provides the framework
for Eskom’s reporting and accounting responsibilities to government as a
public enterprise.
• Municipal Finance Management Act No. 56 of 2003 that defines how
municipal entities such as municipal electricity utilities should be managed.
• Local Government Municipal Systems Act No 32 of 2000 that includes
sections on municipal administration of electricity reticulation and tariffs.
• National Environmental Management Act No. 107 of 1998.
• Air Quality Act No. 39 of 2004.
In summary, this legislation stipulates in some detail how Eskom or municipal
distributors should be governed and how they should account to government. It
specifies also how the industry should be regulated and empowers the
Minister of Minerals and Energy to procure and contract IPPs and to direct
the regulator to licence specific plant, including the proportion that should come
from renewable energy sources. Government has also directed that poor
households should receive electricity subsidies. While subject to environmental
16

legislation there is no requirement for generating plant to meet European or
North American emission standards. There are no greenhouse gas emission
caps. New legislation is currently being drafted that will define the process for
restructuring the electricity distribution industry.
2.3. Independent Power Producers
A review of the definition of an Independent Power Producer (IPP) follows.
According to Woodhouse (2005), there are three types of enterprises that are
often referred to as IPPs. The three forms of “IPP” are graphically illustrated in
Figure 5 below.
The first of these are State dominated firms that masquerade as private firms,
and increasingly compete with their fully private brethren. These enterprises
attract the moniker “IPP” for various reasons, including the fact that some plants
receive favourable tax or other treatment when they are viewed as IPPs. Often
these plants are managed by the “dual firms” that emerged from a country’s
restructuring process, and the desire to embrace something called an IPP is
partly evidence of these firms’ savvy in seizing the latest management concepts
in the power sector. In the extreme, all five of the state-owned generation
companies created in China’s most recent reform of the power sector are
formally called “IPPs” although each firm is actually state-owned and state-
controlled. This study did not look at this type of generator because such plants
do not confront many of the issues that comprise the focus of this study, such
as the ability of private investors to enforce contract terms.
17

The second type is private generators that are not connected to the grid, often
called “captive plants”. In some countries, these plants are regulated under the
same law that governs grid-connected IPPs and they are thus often called IPPs
(In Mexico, for example, the same IPP law is used for all privately built power
plants whether or not the plant is designed principally to supply bulk power to
customers via the grid). Such plants are also not considered in this study
because the investor faces a different type of risk. Developers of captive
projects work, usually, with a single private buyer and the enforcement of
contracts is much easier, particularly when projects are developed for self-
supply.
Figure 5. Forms of Private Investment in the Power Sector
Source: Woodhouse (2005)
The third category is the so-called “classic IPPs”, which are the subject of this
research project. These plants generally sell electricity under a long-term
18

contract and the key off-taker for the power is a state-owned (or state-regulated)
electric utility, although in some cases, additional revenue is earned with sales
to private distributors or large private users.
Given that the entire Transmission network in South Africa is owned by Eskom,
the state-owned utility and there is no wholesale market, all IPPs would need to
enter into a long-term Power Purchase Agreement (PPA) with Eskom.
Classic IPPs are usually financed on a project basis, with a special purpose
vehicle established to own and manage the IPP. The company draws equity
from a number of foreign and domestic investors and secures debt from a
syndicate of banks on the basis of expected revenues. Most projects are highly
leveraged, with debt accounting for as large a share of project finance as the
bank syndicate will tolerate.
Due to the large amounts of capital involved, there is a substantial amount of
risk for the IPP and developers and lenders entering into these IPP
arrangements try to shift risk to the host government by relying on long term
Power Purchase Agreements (PPAs) and a host of other arrangements that
they believe will insulate projects from politically influenced government
decision-making and unexpected changes in circumstance.
IPPs generally try to secure minimum off-take and guaranteed tariff provisions
as well as government-backed guarantees to reduce their risk or perceived risk.
The electricity businesses generate revenues in local currency, while many of
19

the cost components for IPPs such as capital, equipment and fuel are set in
hard currency with the result that the IPP investor is generally particularly
sensitive to the allocation of currency risks.
2.4. System Planning
According to Doorman (2000), system planning starts normally with some
governmental body having supervisory responsibility for expansion of the power
system. This organisation basically takes responsibility for the following
activities amongst others:
• prepare load forecasts (energy and/or capacity)
• identify relevant options to satisfy the demand forecast
• identify constraints
• compute least cost options that satisfy all constraints
There are three major elements that need to be taken into account when
considering Generation Expansion Planning, namely:
• the type of project (choice of technology) and the size of the new plant
• the timing of the investment, and
• the location of the new plant (e.g. fuel supply for a coal fired station)
Traditionally Generation Expansion Planning only looked at the supply side of
the capacity/demand equation and strove to minimise the cost of supplying a
forecasted demand into the future. Due to the increasing cost of electricity
20

supply and also environmental consideration in more recent years, the concept
of integrated resource planning has come to the fore. According to Swisher et
al. (1997), the objective of traditional expansion planning was to meet demand
for electricity at least cost, whilst the principal goal in integrated resource
planning is to meet the demand for energy services at least cost.
The accuracy of system planning impacts on the efficiency of investments made
in power generating capacity. If the load forecast is not accurate, then either
too little plant may be built resulting in capacity shortages or too much plant will
be built too soon, which will result in unnecessarily high prices to consumers or
stranded assets for investors.
2.5. Security of Supply
Potential investors in power generation assets tend to base their decisions on
current electricity prices whether via a wholesale market or in a regulated
monopolistic situation such as South Africa’s. Due to the long timeframes for
the building of new power plant (3-5+ years depending on the type of plant),
decisions based on today’s prices do not generally yield the desired future
results. Bunn and Larsen (1992) surmise that what results is a capacity
shortage or a capacity glut as investors make decisions based on current
pricing without taking into account the behaviour of competitors. If the current
electricity price is high due to a capacity “crunch”, many investors enter the
market without considering the impact that each other will have on the price of
electricity, however, as all of the power generating capacity comes “online”, the
price of electricity will drop. This will cause the pool of new investors in power
21

generating capacity to shrink as new investors withdraw from the market and
investment in new power generating capacity will fall, resulting in an eventual
capacity shortage and the cycle starts all over again with investors entering the
market.
Any increase in security of supply which is brought about by an increase in
power generation capacity is to the benefit of all parties connected to the
National Electricity Grid as it is impossible to distinguish the flows between
individual power stations and customers on the Grid. Abbot (2001) believes
that in such a circumstance, it may be justified that revenue is raised by way of
a general tax or levy on electricity to create a fund that could be used to provide
incentives to investors to invest in new power generation capacity. Abbot
(2001) goes further to state that this is indeed necessary to ensure continued
security of supply since the specific benefactors of new generating capacity
cannot be determined, chances are that nobody will see any need to build the
next megawatt of new generation capacity until it is too late.
2.6. Criteria for Investment
A single power plant (e.g. large coal fired station) requires tens of billions of
rand in capital to be built (4 500MW Coal Fired Power Station costs in the
region of R80billion today). Generally, this capital is sourced from investors,
private equity markets and the like. Green (2003) states that there are risks
involved in power plant investment, thus for investors to participate, there needs
to be a certain confidence that all their costs will be recovered as well as a
22

reasonable (better than other investments and dependent on the amount of risk
that they will take on) return on their investment.
The ability to enter into long-term power purchase agreements is of paramount
importance to ensure investment in new power generation plant according to
Woo et al. (2005). Without a long term pricing agreement, the investor is
exposed to the volatility of the electricity market (if there is a market) or the
possibility that he/she will be left with a stranded asset if forecast electricity
demand does not materialise in a monopolistic situation such as that of South
Africa.
Wang (2004) claims that even a perfectly efficient short-term market does not,
on its own, send timely investment signals regarding the need for additional
capacity and cites the experiences in California and the UK as proof. Wang
(2004) suggests that there is a need for a mechanism to signal for new capacity
and investment in generation and this could be in the form of a capacity market
or probably long term contracts. This suggests that even wholesale electricity
markets are not properly addressing the issue of timeous new generation
capacity investment.
2.7. Wholesale Markets vs. Vertically Integrated
Botterud (2003) surmises that one of the fundamental trends driving the long-
term development of electrical power systems is the demand for cost efficiency,
which has triggered a wave of deregulation and liberalisation initiatives in
23

various industries that used to be operated under regulation (e.g. aviation,
railway, telecommunication, gas, and electricity).
According to Joskow (2006), policymakers in many countries are expressing
concerns that competitive wholesale electricity markets are not providing
appropriate incentives to stimulate “adequate” investment in new generating
capacity at the right time, in the right places, and using the right technologies.
These concerns are often expressed in the context of concerns about “supply
security,” “reliability,” “resource adequacy,” or “supply diversity”. In most cases
the concerns have been raised as policymakers observe growing electricity
demand, shrinking reserve margins and rising prices but little evidence of
investment in new generating capacity responding to balance supply and
demand consistent with traditional metrics for generation resource “adequacy.”
Griffin and Puller (2005) discuss the use of power plants by regulated utilities to
provide services other than the production of electricity. Regulated utilities
obviously use power plants primarily to produce electricity, but in many
situations also use them to avoid transmission investment and to provide
reliability-related services. Removing the vertical link between generation and
transmission has important implications for who should provide these services
and how they should be compensated, but also with respect to whether power
plants are being built, maintained, and operated more efficiently now in
deregulated markets than in the past.
24

The South African situation is unique in the sense that the majority of the
country’s generation is owned by Eskom the state-owned utility. The
government has stated goals to introduce private sector participation into the
generation sector within this monopolistic situation. It is debatable as to
whether the current monopoly situation will provide the correct environment to
attract private investors or whether a wholesale market should be established to
incentivise investors. Debatable as Joskow (2006) indicates, current wholesale
markets do not appear to be able to attract the necessary investment in power
generation timeously resulting in security of supply concerns.
In the absence of a wholesale electricity market and the stated requirement of
the South African Government for 30% of all new power generation to be in the
hands of the private sector, what are the factors that will influence/enable
investment in power generating capacity in South Africa.
2.8. Efficiency Gains
It is hoped that Private Sector participation will bring with it increased
efficiencies and cost savings and can be a useful measure to benchmark state
owned utilities that are constructing and operating similar plant.
The cost of funding an IPP project is invariably higher than that of funding a
state owned utility project as economies of scale are lost and the perceived
risks by investors tend to be higher. The efficiency gains are expected to more
than make up for the increased funding costs, otherwise IPPs would not make
financial sense from a country perspective.
25

2.9. Comparative Studies
Of particular relevance to this study is a survey the World Bank conducted in
early 2002 of 48 international firms involved in the power sector that had made
investments outside of their countries of origin in developing countries. The
objective of the survey was to determine the conditions that investors
considered important in making the decision to invest or to judge the
performance of their existing investments in a country.
According to the Lamech and Saeed (2003), when assessing country
conditions, the top priorities that investors consider:
• A legal framework defining investors’ rights and obligations
• Payment discipline and enforcement
• The availability of a guarantee from the government or a multilateral agency
• Independence of Regulatory Institution and Processes from arbitrary
Government interference
Lamech and Saeed (2003) also state that investors consider the following
factors most important in the success or failure of investments:
• Retail Tariffs and Collection Discipline must be adequate to meet cash flow
needs of the sector
• Fair adjudication of Tariff Adjustments and disputes
• Operational control and management freedom
• Regulatory commitment sustained through a long term contract
26

Lamech and Saeed (2003) also showed that investors overall considered the
following factors to be of paramount importance when making the decision to
invest in a country or not:
• Adequacy of cash flows in the sector
• Stability and enforcement of laws and contracts
• Government responsiveness to the needs and timeframes of investors
• Investors’ control over their investments
• Regulatory Independence
• Availability of credit enhancement or risk guarantee
The factors that investors did not consider as important are:
• Vertical Integration
• Competitive selection process
• Domestic borrowing costs and tenors
• Transition to a competitive market structure
The World Bank study indicated that most investors were more concerned
about cash flows and the stability of the regulatory environment which directly
impact on the profitability of the venture and in turn return on investment. This
was to be expected, given that business generally focuses on the bottom line
with all other considerations being secondary.
27

2.10. Current Study
This study will attempt to determine whether the top priority factors for investors
currently with a presence in South Africa that could potentially be IPPs are
being catered for the study will include Government and financial institutions. It
is hoped that the study will establish the perspectives of priorities from the
various players in the sector to determine where the “mis-matches” are, if any.
Having identified the status of those factors important to business to participate
in the power sector, aligning Government’s priorities (if they are different) would
go a long way to ensuring the necessary, timeous investment in power
generation in South Africa to achieve the 30% private sector participation target
that Government has set.
28

Chapter 3: Research Hypotheses
The objective of this research is to determine the factors that investors consider
a top priority in making the decision of whether to invest in new power
generation plant in South Africa or not.
The literature review highlighted a wide range of factors that investors consider
when looking at investment in power generation, some of them country factors
and others investment specific.
Of particular relevance to this study is a survey done by the World Bank
(Lamech and Saeed, 2003) in early 2002 in which 48 companies were
canvassed to determine their top priority factors when looking to invest in power
generation in a developing country.
The World Bank (Lamech and Saeed, 2003) study highlights the following six as
the top priority factors that investors surveyed considered most important when
deciding on whether to invest in a country’s power generation sector or not.
1) Adequacy of cash flows in the sector: Investors gave a clear priority to
adequate cash flows for ensuring a reasonable prospect of recovering costs
and making an investment a success.
2) Stability and enforcement of laws and contracts: The test of a good
legal framework is its clarity and the enforceability of contracts, particularly
contracts with government agencies. Investors want to see that the rights
29

and obligations of private investors are clearly defined and that applicable
laws and contracts are enforced.
3) Government responsiveness to the needs and timeframes of
investors: Delays in government approvals and licensing have an
opportunity cost for international investors responding to concession
auctions and solicitations for bids.
4) Investors’ control over their investments: Investor satisfaction is
enhanced by allowing investors greater management and operational
control over their investments and permitting them to derive the maximum
value from their assets.
5) Regulatory Independence: Independence of regulatory institutions and
processes from government interference.
6) Availability of credit enhancement or risk guarantee: The existence of a
guarantee alone is not enough to determine an investment decision, but it is
a key consideration in finalising deals in markets where cash flow is
influenced by a government entity (such as a state-owned purchaser of
power) or a new regulator.
The literature has highlighted these six factors as the top priority considerations
for investors in the power sector in developing countries. This study will attempt
to determine the status of these factors in South Africa and where the shortfalls
are, if any in creating a favourable climate for attracting international investment
into the South African power sector.
30

3.1. Research Hypotheses
The following hypotheses were formulated based on the literature reviewed and
an analysis of the issues at hand. Of the six factors identified in the World Bank
study of 2002 (Lamech and Saeed, 2003) detailed above, factors 4 and 6 were
not considered for this study as these are moot points in the South African
context, given that all IPP operations are to be Build-Own-Operate (BOO) and
the state-owned utility (Eskom) functions “at arms length” from government and
is currently required to provide any guarantees (at its discretion) without direct
government involvement, this is unlikely to change in the future, but is possible.
Hypothesis 1:
In South Africa, there are adequate cash flows for ensuring a reasonable
prospect of recovering costs and making an investment in the power generation
sector a success.
Hypothesis 2:
In South Africa, there is a good legal framework, the rights and obligations of
private investors in power generation are clearly defined and all applicable laws
and contracts are enforced.
Hypothesis 3:
In South Africa, Government is responsive to the needs and timeframes of
investors in the power sector.
Hypothesis 4:
In South Africa there is independence of regulatory institutions and processes
from government interference
31

Chapter 4: Research Methodology
4.1. Research Design
According to Zikmund (2003), a research design is a master plan specifying the
methods and procedures for collecting and analysing the needed information. It
is a framework or blueprint that plans the action for the research project.
Zikmund (2003) states that there are four basic research methods that can be
used to conduct descriptive and causal research, namely, surveys,
experiments, secondary data studies and observation.
Zikmund (2003) also states that descriptive studies are based on some previous
understanding of the nature of the research problem whereas causal studies
can only be conducted when a problem is sharply defined.
This research used the results from the exploratory research done by the World
Bank (Lamech and Saeed, 2003) to determine those factors given the highest
consideration by investors when considering investments in power generation in
developing countries.
This research sought to empirically determine whether the factors identified in
the World Bank study are sufficiently present or absent in South Africa thereby
allowing an assessment of the current investment environment. This would
enable an assessment of whether the investment climate is conducive to
attracting private sector investment in power generation to the country or not.
32

This research was therefore descriptive in nature. Additionally, the research
provided only qualitative data as no precise measurement was made regarding
the existence or absence of any of the factors under consideration.
4.2. Unit of Analysis
According to Zikmund (2003), the unit of analysis specifies at which level the
investigation will focus, namely, the entire organisation, departments, work
groups, individuals or objects.
In this research, the unit of analysis was each of the individuals that responded
to the questionnaire. The intention was to group individuals into different
categories for the purposes of the analysis (e.g. Government, Utilities,
Investors, etc.)
4.3. Population of Relevance
Zikmund (2003) defines a population as any complete group of people,
companies, hospitals, stores, college students, or the like that share some set
of characteristics. Population is a finite group, versus a universe which is
infinite.
The population of relevance to this research study was all parties that play a
role in private investment in power generation in South Africa. This included all
potential investors in new power generating plant worldwide that are active in
South Africa, as capital investment could conceivably emanate from all parts of
33

the globe. Included were individuals and organisations from Government to
Utilities to Financiers to Developers, etc.
A requirement for participation in the study was that the organisation had an
office in South Africa and was active in the power generation sector.
4.4. Sample Size and Sampling Method
Zikmund (2003) defines sampling as any procedure using a small number of
items or parts of the whole population to make conclusions regarding the whole
population. Zikmund (2003) goes further to say that a sample is a subset, or
some part, of a larger population.
Sampling is performed to enable inferences to be drawn about the population
from a smaller group as in most cases it is impractical and/or impossible to
include the entire population in the study. Sampling is normally performed due
to budget and/or time constraints (Zikmund, 2003).
It was not possible to obtain a probability sample for the population defined in
this case and nonprobability sampling was used. Zikmund (2003) states that
the selection of sampling units in nonprobability sampling is quite arbitrary, as
researchers rely heavily on personal judgement. Note that according to
Zikmund (2003) there are no appropriate statistical techniques for measuring
random sampling error from a nonprobability sample which means that it was
not possible to project the data beyond the sample with any statistical
confidence.
34

In this case judgment sampling which is a nonprobability sampling technique
was used (Zikmund, 2003). The author’s knowledge of the electricity industry in
South Africa as well as that of colleagues in the industry was used to select the
sample. The criteria for inclusion was loosely based on the requirement that the
individual targeted should either personally or through an organisation need to
play a meaningful role in enabling or enacting private sector investment in
power generation in South Africa.
The sample included representatives from the following industry sectors:
• Government
• Financiers (e.g. Banks, Venture Capitalists)
• Developers (potential IPP Builder-Owner-Operators)
• Utilities (state-owned)
• Utilities (large municipalities/metros)
• Regulation
Thus, the sample chosen was a non-probabilistic, judgemental sample.
Zikmund (2003), indicates that the size of the sample is determined by the
estimated variance of the population, the magnitude of acceptable error and the
confidence level desired. The more homogeneous the population, the smaller
the sample size required for the same variance and confidence level.
35
Given that this was a non-probability sample, which means that the data cannot
be extrapolated to the population with any statistical confidence, the sample
size was not of crucial importance, but it was important to cover as much of the
different sector participants and role players as possible.
In this context, the general rule of thumb that a minimum sample size of 30 is
needed to perform statistical analyses was followed and a sample size of 30
targeted.
4.5. Research Instrument
The research instrument used was that of a self-administered questionnaire.
The questionnaire was based on the World Bank Study by Lamech and Saeed
(2003), which identified a number of top priority considerations by investors
when looking at investment in the power sector in developing countries.
The questionnaire was designed to utilise the questions that the World Bank
study posed related to four of the top six considerations identified as per the
hypotheses developed in Chapter 3. The considerations were:
1) Adequacy of cash flows in the sector
2) Stability and enforcement of laws and contracts
3) Government responsiveness to the needs and timeframes of investors
4) Regulatory Independence
36

The questionnaire comprised of eight statements that respondents were asked
to rate on a 5 point Likert Scale ranging from Strongly Disagree to Disagree to
Neutral to Agree to Strongly Agree.
A Likert scale (pronounced 'lick-ert') is a type of psychometric response scale
often used in questionnaires, and is the most widely used scale in survey
research today. When responding to a Likert questionnaire item, respondents
specify their level of agreement to a statement. The scale is named after
Rensis Likert, who published a report describing its use in 1932.
The statements and the hypothesis each relates to are:
1. In South Africa retail tariff levels and collection discipline are adequate to
meet the cash flow needs of the power sector (Hypothesis 1)
2. In South Africa there is high consumer payment discipline and enforcement
(Hypothesis 1)
3. In South Africa there is a good legal framework defining the rights and
obligations of private investors (Hypothesis 2)
4. In South Africa all applicable laws and contracts are enforced (e.g.,
disconnections, payment by counter-parties, etc.) (Hypothesis 2)
5. In South Africa, the Government is responsive to the needs and timeframes
of investors (Hypothesis 3)
6. In South Africa, Government efficiently administers the processes to provide
the necessary approvals and licenses for private sector investment in the
power sector (Hypothesis 3)
37

7. In South Africa, there is independence of the regulatory institution and
processes from arbitrary government interference (Hypothesis 4)
8. In South Africa, there is regulatory commitment which is sustained through
long-term contracts (Hypothesis 4)
The statements were not given in this order, they were “mixed up” so that the
Hypotheses test statements were not all in order or together, this was to reduce
the risk of acquiescence bias. See Appendix 1 for a sample of the
questionnaire.
4.6. Details of Data Collection
The empirical data was collected by way of a self-administered questionnaire,
which was distributed by way of email. This form of distribution was deemed to
be the quickest and most cost-effective manner in which to distribute the
questionnaire. The questionnaire was in the form of a Microsoft Word
document, which respondents could fill in electronically and either return via
email or by facsimile.
According to Zikmund (2003), the worst case response rate for mail
questionnaires is 15%, in this case it was expected that the response rate would
be much higher, given that the questionnaire was distributed electronically and
that individuals targeted were industry role players with a vested interest. The
questionnaire was also short, comprising only 8 statements, it was hoped that
this would increase the response rate.
38

Respondents were not asked to provide any personal information, the only
information requested in addition to the 8 questions was the industry sector they
represented.
Questionnaires were emailed to 50 respondents who were identified as
individuals that would play a direct role in attracting/enabling private sector
investment in the South African power sector.
Where possible, respondents were contacted telephonically to explain the
nature of the study and to assure them of anonymity in an attempt to increase
the response rate by personalising the request.
Respondents were given the opportunity to return the completed questionnaires
electronically or via post or facsimile. Anonymity was guaranteed to all
respondents.
4.7. The Process of Data Analysis
The analysis of the data was divided into two parts, namely a section on
descriptive statistics where basic data analysis was performed and then a
section on inferential statistics where the hypotheses formulated in Chapter 3
was tested.
A Likert scale was chosen for the questionnaire. According to Wikipedia (2007),
responses to a single Likert item are normally treated as ordinal data, because
one cannot assume that respondents perceive the difference between adjacent
39

levels as equidistant. When treated as ordinal data, Likert responses can be
collated into bar charts, central tendency summarised by the median or the
mode (but not the mean), dispersion summarised by the range across quartiles
(but not the standard deviation), or analysed using non-parametric tests such as
the Chi-square, Mann-Whitney, Wilcoxon signed-rank or Kruskal-Wallis test.
Responses to several Likert questions may be summed, providing that all
questions use the same Likert scale and that the scale is a defendable
approximation to an interval scale, in which case they may be treated as interval
data measuring a latent variable. If the summed responses fulfil these
assumptions, parametric statistical tests such as the analysis of variance can be
applied.
4.7.1 Descriptive Statistics
According to Zikmund (2003), descriptive statistics are statistics used to
describe or summarise information about a population or sample. Descriptive
statistics were employed in this case to analyse the data at a basic level and to
discern any trends. The descriptive statistical elements (Albright, Winston and
Zappe, 2006) given in Table 2 were initially analysed for the statements related
to each Hypothesis.
Note that the mean was included, even though it is understood that it has no
significance given the ordinal nature of the data. However, for the purposes of
the descriptive statistics analysis, uniform distance between the Likert scale
40

categories was assumed and the scale was therefore deemed to be interval in
nature.
Table 2. Descriptive Statistical Elements used in the Analysis
Statistical Element Definition
Mean Average of observations
Median Middle Observation after observations are sorted from
high to low
Mode Most frequently occurring observation
Standard Deviation The square root of the variance that provides and
indication of the variability or spread of the data
Sample Variance Measure of variability (average of squared deviations
from the mean)
Skewness The lack of symmetry of a distribution of values.
Positive = skewed to the right, Negative = skewed to the
left, i.e. direction of the “tail”.
Kurtosis The amount of peakedness of a distribution
Range Difference between largest and smallest observations
Minimum Smallest observation
Maximum Largest observation
Sum The sum of all the observations
Count The number of observations
A correlation was then performed between the two questions related to each
hypothesis to see whether the responses were comparable.
41

Based on the correlation results, the decision was taken to summate the
responses for all the questions related to a particular Hypothesis (2 each) and
the descriptive statistics in Table 2 were again calculated for the summated
data for the questions for each Hypothesis.
The mean, median and mode were used to analyse the central tendency of the
observations per question/hypothesis (Zikmund, 2003). Of additional interest
was the tendency of the observations to depart from the central tendency
(measures of dispersion), to analyse this, the range, sample standard deviation
and sample variance were used (Zikmund, 2003). The shape of the frequency
distribution of the observations was represented by the skewness reading
where a negative reading indicated a “tail” to the left (negatively skewed) and a
positive reading a “tail” to the right (positively skewed), the closer the reading
was to zero the closer the distribution was to a normal distribution. The
peakedness of the distribution was represented by the kurtosis reading, the
higher the figure, the more peaked the shape of the distribution.
The frequency distributions for the summated questions per Hypothesis were
also plotted and a visual analysis of the sample tendencies was performed.
4.7.2 Inferential Statistics
According to Zikmund (2003), inferential statistics are statistics used to make
inferences or judgements about a population on the basis of a sample.
Notwithstanding the fact that the sample for this research was a judgemental
sample and as such its results could not be inferred on the population with any
42

statistical significance, the Hypotheses formulated were tested to prove or
disprove the statements posed with the sample as the basis.
4.7.2.1 Hypothesis Testing
There are two groupings of statistical procedures, namely, parametric and non-
parametric which are used in hypothesis testing. According to Zikmund (2003),
when the data are interval- or ratio-scaled and the sample size is large, then
parametrical statistical procedures are appropriate. Parametrical procedures
are based on the assumption that the population and/or sample is normally
distributed. Zikmund (2003), states further that when researchers do not make
the assumption of normality, it is appropriate to use nonparametric statistical
procedures.
The parametric statistical test selected to test the Hypotheses was the one
sample t-Test, which is the most suitable for small sample sizes, which is any
sample less than 30, according to Zikmund (2003). The one sample test was
used because the summated observations for each Hypothesis were used per
test.
The hypothesised population mean was chosen as 3 because a 5 point Likert
scale was used where 3 is the mid-point which corresponds to a “neutral”
stance on the statements presented. It is assumed that the population would be
normally distributed around this mid-point.
43

The null hypothesis would fail to be rejected for observation means/medians
equal to or less than 3 as that would indicate neutrality or disagreement. Only if
the mean/median is greater than 3 could the null hypothesis be rejected and the
alternative hypothesis upheld. As a result, the one-tailed test was used in this
instance.
A significance level of 1% was chosen for the t-Tests to reduce the risk of a
Type I error (rejecting the null hypothesis when it is true), thereby ensuring that
a high level of confidence could be placed on the result. . Type I and II errors
are related and by decreasing the risk of a type I error, the risk of a type II error
is increased. However, according to Albright et al. (2006), type I errors have
traditionally been regarded as more serious than type II errors, the decision was
therefore taken to favour caution in terms of rejecting the null hypothesis.
In addition to the t-Test for difference in means, the NCSS (Number Crunching
Statistical Software) software also performed the Wilcoxon Signed-Rank Test
for difference in medians which is a nonparametric test. Having used a Likert
scale, which, although ordinal in nature was deemed to be interval for the
purposes of this analysis, the Wilcoxon test results were used to ratify the t-Test
results. Should the results of the two tests differ, then the treatment of the
Likert scale data as interval would be brought into question.
The procedure followed for testing each of the hypotheses was as follows:
• Stating of the Null Hypothesis (H0)
• Stating of the Alternative Hypothesis (Ha)
44

• Formulation of the Null and Alternative Hypotheses
• Choose a hypothesised population mean/median
• Choose a significance level (α)
• Run the one sample t-Test on the summated observations for the Hypothesis
using a software package (NCSS – Number Cruncher Statistical System)
• Examine the test report to determine whether the null hypothesis can be
rejected
• If the null hypothesis can be rejected, examine the ρ-value and compare to
the significance (α) level.
o If ρ≥ α, the null hypothesis (H0) is not rejected
o If ρ< α, the null hypothesis (H0) is rejected
The ρ-value is defined by Albright et al. (2006) as the probability of seeing a
sample with at least as much evidence in favour of the alternative hypothesis
actually observed. This means that the smaller the ρ-value, the more evidence
there is in favour of the alternative hypothesis.
Albright et al. (2006) go further to say that there is a strong connection between
ρ-value and α-level approach and that the null hypothesis can only be rejected
at a specified level of significance (α) only if the ρ-value is less than α.
If the null hypothesis was rejected, then the alternative Hypothesis (as per
Chapter 3) was upheld in each case. If the test failed to reject the null
Hypothesis, then the Hypothesis as per Chapter 3 cannot be upheld, but that
does not prove that it is incorrect either.
45

4.8 Limitations of the Research
The sample canvassed was a judgemental sample, subject to researcher bias
and was not representative of the population of all the role players in the
investment in new power plant by private investors. The results from the study
can therefore not be inferred on the population with any statistical confidence.
Also, being a judgemental sample, it only included known participants in the
industry and did not include any potential participants who are not currently
active, but who might be should certain industry conditions change or be
present.
A Likert scale was used for data collection. According to Wikipedia (2007)
Likert scales may be subject to distortion from several causes. Respondents
may avoid using extreme response categories (central tendency bias), agree
with statements as presented (acquiescence bias), or try to portray themselves
or their organisation in a more favourable light (social desirability bias).
The questionnaire did not contain any reverse coded (negative) questions,
which is purported to increase the reliability of the data collected this way.
Another limitation of the study was that the timeframe allowed for respondents
to return completed questionnaires was very short (2 weeks), which contributed
to the low response rate.
46
The inclusion of only one independent power producer developer is of concern
and the inclusion of the dominant number of respondents from the government
and regulation sectors is a concern as the results would undoubtedly have
affected by this.
The research had originally hoped to analyse the observations by industry
sector as well as a group to discern the varying perceptions between the
sectors, but the low response rate meant that this could not be done with any
reliability and it was not attempted.
The statements selected for testing from the World Bank study (Lamech and
Saeed, 2003) were done so by the researcher with the result that the
questionnaire contains researcher bias and it was possible that the questions
put forth would lead respondents in their answers. The questionnaire was not
tested beforehand due to timing constraints.
47

Chapter 5: Results
A total of 50 questionnaires were distributed via email. Respondents were
given a 2 week period in which to respond. A response rate of 34% (17
completed questionnaires) was achieved. This lower than the expected
response rate of 60%, is partly attributed to the short response timeframe given
to respondents.
At this point we are reminded of the Hypotheses developed in Chapter3 that will
be tested:
Hypothesis 1:
In South Africa, there are adequate cash flows for ensuring a reasonable
prospect of recovering costs and making an investment in the power generation
sector a success.
Hypothesis 2:
In South Africa, there is a good legal framework, the rights and obligations of
private investors in power generation are clearly defined and all applicable laws
and contracts are enforced.
Hypothesis 3:
In South Africa, Government is responsive to the needs and timeframes of
investors in the power sector.
Hypothesis 4:
In South Africa there is independence of regulatory institutions and processes
from government interference.
48

5.1. Descriptive Statistical Analysis
Firstly, it is prudent to look at the breakdown of respondents by sector. This is
given in Figure 6 below. It is clear that the sample is dominated by
representatives from the Government and Regulation sectors which may be a
concern.
Figure 6. Breakdown of Respondents by Sector
Breakdown of Respondents by Industry Sector
Government29%
Financier12%
State-Owned Utility (Eskom)
12%
Utilities (Municipality/Metro)
12%
Independent Power Producer Developer
6%
Regulation29%
5.1.1 Analysis of Individual Questions
Next, using the data analysis function in Microsoft Excel, the descriptive
statistics for each question is calculated, these are given in Table 3 below.
A cursory examination of the descriptive stats for the dataset reveals that the
mean, median and mode appear to be close together for all of the questions,
indicating that most of the observations tend to the centre. However, given that
49

this is Likert scale data, it is worth looking at the median more closely. What is
apparent is that the median and mode are the same for most of the statements.
In addition, the distributions are mostly negatively skewed indicating a tendency
for observations to be toward the upper end of the scale. The skewness
readings are, however, very low which is an indication that the distributions
could approach normality.
Table 3. Descriptive Statistics for each question, grouped by Hypothesis
Q 1 Q 5 Q 2 Q 6 Q 3 Q 7 Q 4 Q 8Mean 3.94 3.65 3.88 3.82 3.29 2.88 3.71 3.71 Median 4 4 4 4 4 3 4 3 Mode 4 4 4 4 4 3 5 3 Standard Deviation 1.20 1.22 0.60 0.53 0.92 1.27 1.16 1.10 Sample Variance 1.43 1.49 0.36 0.28 0.85 1.61 1.35 1.22 Kurtosis 1.25 -0.19 0.23 0.74 0.87 -0.69 -1.47 -1.49 Skewness -1.36 -0.85 0.02 -0.26 -1.22 0.04 -0.16 0.03 Range 4 4 2 2 3 4 3 3 Minimum 1 1 3 3 1 1 2 2 Maximum 5 5 5 5 4 5 5 5 Sum 67 62 66 65 56 49 63 63 Count 17 17 17 17 17 17 17 17
Hypothesis 4Hypothesis 1 Hypothesis 2 Hypothesis 3
5.1.1.1 Question 1 and 5 (Hypothesis 1)
Looking at Table 3, the means of the observations for Questions 1 and 5 are
3.94 and 3.65 respectively. More importantly, the median and mode for each
question are all the same at a rating of 4. This would indicate that there is
support for these statements as a rating of 4 was portrayed as “agree” on the
questionnaire.
The range is quite wide at 4 for both questions, which is the widest it could be
with the 5 point Likert scale used. Both distributions are negatively skewed,
50

which indicates a bias of the observations towards the upper end of the scale.
The histogram of the observations for Questions 1 and 5 is given in Figure 7
below.
Figure 7. Hypothesis 1 (Adequate cash flows)
Histogram: Frequency Distribution of Observations(Hypothesis 1 - Question 1 and 5)
0%
5%
10%
15%
20%
25%
30%
35%
40%
45%
50%
Rating (Likert Scale)
Freq
uenc
y
Statement 1 6% 12% 0% 47% 35%
Statement 5 6% 18% 6% 47% 24%
1 (Strongly Disagree) 2 (Disagree) 3 (Neutral) 4 (Agree) 5 (Strongly Agree)
A visual examination of the frequency distribution for Questions 1 and 5 which
relate to Hypothesis 1 shows that most of the responses fall in the categories
above Neutral (3), 82% and 71% for Questions 1 and 5 respectively.
5.1.1.2 Question 2 and 6 (Hypothesis 2)
From Table 3, the means of the observations for Questions 2 and 6 are 3.88
and 3.82 respectively, almost the same. More importantly, the median and
mode for each question are all the same at a rating of 4. This would indicate
that there is support for these statements as a rating of 4 was portrayed as
“agree” on the questionnaire.
51

The range is narrow at 2 for both questions indicating that most of the
responses were within a narrow band. Both distributions are negatively
skewed, but very small. This indicates a bias of the observations towards the
upper end of the scale, but that the shape of the distribution approaches
normality. The histogram of the observations for Questions 2 and 6 is given in
Figure 8 below.
Figure 8. Hypothesis 2 (Good Legal Framework)
Histogram: Frequency Distribution of Observations(Hypothesis 2 - Question 2 and 6)
0%
10%
20%
30%
40%
50%
60%
70%
80%
Rating (Likert Scale)
Freq
uenc
y
Statement 2 0% 0% 24% 65% 12%
Statement 6 0% 0% 24% 71% 6%
1 (Strongly Disagree) 2 (Disagree) 3 (Neutral) 4 (Agree) 5 (Strongly Agree)
A visual examination of the frequency distribution for Questions 2 and 6 which
relate to Hypothesis 2 shows that there are no responses in the strongly
disagree and disagree categories. All of the responses fell in the categories
from Neutral (3) and above, in fact, 88% and 77% of the responses fell in the
categories above neutral (Agree/Strongly Agree) for Questions 2 and 6
respectively.
52

5.1.1.3 Question 3 and 7 (Hypothesis 3)
From Table 3, the means of the observations for Questions 3 and 7 are 3.29
and 2.88 respectively, indicating a difference between the two questions. More
importantly, the median and mode for Question 3 are the same with a rating of 4
and are also the same for Question 7 at a rating of 3. This indicates that there
was support for the statement in Question 3 as a rating of 4 was portrayed as
“agree” on the questionnaire, but that respondents were neutral about the
statement in Question 7.
The range is narrower for Question 3 than for Question 7, indicating that there
was more consensus of respondents for Question 3 than Question 7. The
distribution for Question 3 is negatively skewed, indicating a bias for the
responses toward the “agree” side of the scale. The distribution for Question 7
is positively skewed, but so small that it could be considered a normal
distribution. The histogram of the observations for Questions 3 and 7 is given
Figure 9 in below.
A visual examination of the frequency distribution for Questions 3 and 7 which
relate to Hypothesis 3 shows that the responses to both statements have quite
a wide spread. Even though the average for Question 3 tends towards “agree”,
it must be noted that 47% of the responses for that statement were either
neutral or on the “disagree” side. The responses to the statement in Question 7
are distributed normally, but of note is that only 30% of the responses are on
the agree side whereas 70% fell on the neutral and “disagree” side.
53

Figure 9. Hypothesis 3 (Government responsive to power sector needs)
Histogram: Frequency Distribution of Observations(Hypothesis 3 - Question 3 and 7)
0%
10%
20%
30%
40%
50%
60%
Rating (Likert Scale)
Freq
uenc
y
Statement 3 6% 12% 29% 53% 0%
Statement 7 18% 18% 35% 18% 12%
1 (Strongly Disagree) 2 (Disagree) 3 (Neutral) 4 (Agree) 5 (Strongly Agree)
5.1.1.4 Question 4 and 8 (Hypothesis 4)
From Table 3, the means of the observations for Questions 4 and 8 are identical
at 3.71, this would indicate that the responses were on average the same.
However, looking at the median and mode for each tells a different story. The
median and mode are 4 and 5 respectively for Question 4 and are both 3 for
Question 8.
This indicates that there was support for the statement in Question 4 as a rating
of 4 was portrayed as “agree” and rating 5 “strongly agree” on the
questionnaire, but that respondents were neutral about the statement in
Question 8. This is a very different picture from that which the means indicate.
The range is 3 for both Questions with a minimum of 2 and maximum of 5. This
would indicate that no respondents were vehemently opposed to these
54

statements, but that the spread of responses is quite wide. The distribution for
Question 4 is negatively skewed and positively skewed for Question 8, but the
readings are so small that the distributions can be considered normal. The
histogram of the observations for Questions 4 and 8 is given in Figure 10 below.
Figure 10. Hypothesis 4 (Independence of Regulatory Institutions)
Histogram: Frequency Distribution of Observations(Hypothesis 4 - Question 4 and 8)
0%
5%
10%
15%
20%
25%
30%
35%
40%
45%
Rating (Likert Scale)
Freq
uenc
y
Statement 4 0% 18% 29% 18% 35%
Statement 8 0% 12% 41% 12% 35%
1 (Strongly Disagree) 2 (Disagree) 3 (Neutral) 4 (Agree) 5 (Strongly Agree)
A visual examination of the frequency distribution for Questions 4 and 8 which
relate to Hypothesis 4 shows that the responses to both statements have quite
a wide spread between “disagree” and “strongly disagree”, there were no
observations for either question in the “strongly disagree” category. Even
though the average for both questions tends towards “agree” at 3.71, it must be
noted that 47% of the responses for that Question 4 and 53% of the responses
for Question 8 were either neutral or on the “disagree” side.
55

5.1.2 Correlation Analysis
The correlation between each of the two questions related to each of the
Hypotheses was calculated to determine whether the responses to the
questions related to the same Hypothesis could be summated. The results are
given in Table 4 below.
Table 4. Correlation between questions related to each Hypothesis
Correlation
Question 1 vs. 5 (Hypothesis 1) 71%
Question 2 vs. 6 (Hypothesis 2) 52%
Question 3 vs. 7 (Hypothesis 3) 51%
Question 4 vs. 8 (Hypothesis 4) 85%
It is clear that the questions for Hypothesis 1 and Hypothesis 4 are highly
correlated whilst those for Hypothesis 2 and 3 are less so.
Taking this analysis into account and the fact that the scales were the same for
all the questions, the decision was taken to summate the observations for the
questions related to each Hypothesis.
5.1.3 Analysis of Summated Observations per Hypothesis
The descriptive statistical analysis detailed in Table 2 was performed on the
summated data. The results are given in Table 5 below.
An analysis of the means in Table 5 shows that all of them are on the positive
side of 3 indicating that all of the Hypotheses have a bias toward the “agree”
56

side of the scale. Of note is the mean for Hypothesis 3, which is very close to 3,
which indicates neutrality. It is prudent, however to also look a the median in
this case, given that the data is based on a Likert scale. Looking at the median,
the results for Hypothesis 1, 2 and 4 are equal to “agree” or 4 on the Likert
scale, indicating agreement with the statements made. However, the median
for Hypothesis 3 is “neutral” or 3, indicating uncertainty.
Table 5. Descriptive Statistics for each Hypothesis (summated questions)
Hypothesis 1 Hypothesis 2 Hypothesis 3 Hypothesis 4(Q 1 & Q 5) (Q 2 & Q 6) (Q 3 & Q 7) (Q 4 & Q 8)
Mean 3.79 3.85 3.09 3.71 Standard Error 0.21 0.10 0.19 0.19 Median 4 4 3 4 Mode 4 4 4 5 Standard Deviation 1.20 0.56 1.11 1.12 Sample Variance 1.44 0.31 1.23 1.24 Kurtosis 0.12 0.25 -0.48 -1.44 Skewness -1.03 -0.07 -0.46 -0.07 Range 4 2 4 3 Minimum 1 3 1 2 Maximum 5 5 5 5 Sum 129 131 105 126 Count 34 34 34 34
5.1.3.1 Hypothesis 1 (Adequate cash flows)
From Table 5, the mean of the summated observations for Questions 1 and 5 is
3.79. This indicates that the responses were on average toward the “agree”
side of the scale. The median and mode are also on the “agree” side, both
being 4. This indicates that support for Hypothesis 1 as a rating of 4 on the
Likert scale corresponds with “agree”.
57

The range is 4, which is quite wide. The distribution is negatively skewed,
which indicates that the observations are biased toward the “agree” side of the
scale. The histogram of the summated observations for Hypothesis 1 is given
in Figure 11 below.
Figure 11. Histogram of Summated Responses for Hypothesis 1
Histogram: Frequency Distribution of Observations(Hypothesis 1 - Summated Observations)
6%
15%
3%
47%
29%
0%
5%
10%
15%
20%
25%
30%
35%
40%
45%
50%
1 (Strongly Disagree) 2 (Disagree) 3 (Neutral) 4 (Agree) 5 (Strongly Agree)
Rating (Likert Scale)
Freq
uenc
y
A visual examination of the frequency distribution for Hypothesis 1 above shows
that 76% of the observations fall in the categories “agree” and “strongly agree”.
This would indicate that there is strong support within the sample for this
Hypothesis that in South Africa, there are adequate cash flows for ensuring a
reasonable prospect of recovering costs and making an investment in the power
generation sector a success.
5.1.3.2 Hypothesis 2 (Good Legal Framework)
From Table 5, the mean of the summated observations for Questions 2 and 6 is
3.85. This indicates that the responses were on average toward the “agree”
58

side of the scale. The median and mode are also on the “agree” side, both
being 4. This indicates that support for Hypothesis 1 as a rating of 4 on the
Likert scale corresponds with “agree”.
The range is narrow at 2 indicating that most of the responses were within a
narrow band. The distribution is negatively skewed, but the reading is so small
that the distribution can be considered normal. This indicates a bias of the
observations towards the “agree” side of the scale, but that the shape of the
distribution approaches normality. The histogram of the summated
observations for Hypothesis 2 is given Figure 12 in below.
Figure 12. Histogram of Summated Responses for Hypothesis 2
Histogram: Frequency Distribution of Observations(Hypothesis 2 - Summated Observations)
0.00% 0.00%
23.53%
67.65%
8.82%
0%
10%
20%
30%
40%
50%
60%
70%
80%
1 (Strongly Disagree) 2 (Disagree) 3 (Neutral) 4 (Agree) 5 (Strongly Agree)
Rating (Likert Scale)
Freq
uenc
y
A visual examination of the frequency distribution for Hypothesis 2 above shows
that over 75% of the observations fall within the categories “agree” and “strongly
agree”, the balance are in the “neutral” category. This indicates strong support
within the sample for this Hypothesis that in South Africa, there is a good legal
59

framework, the rights and obligations of private investors in power generation
are clearly defined and all applicable laws and contracts are enforced.
5.1.3.3 Hypothesis 3 (Government responsive to power sector needs)
From Table 5, the mean of the summated observations for Questions 3 and 7 is
3.09. The median is 3, representing “neutral” and the mode is 4, representing
“agree”.
The range is 4, which is quite wide. The distribution is negatively skewed,
which indicates that the observations are biased toward the “agree” side of the
scale. The histogram of the summated observations for Hypothesis 3 is given
in Figure 13 below.
Figure 13. Histogram of Summated Responses for Hypothesis 3
Histogram: Frequency Distribution of Observations(Hypothesis 3 - Summated Observations)
12%
15%
32%
35%
6%
0%
5%
10%
15%
20%
25%
30%
35%
40%
1 (Strongly Disagree) 2 (Disagree) 3 (Neutral) 4 (Agree) 5 (Strongly Agree)
Rating (Likert Scale)
Freq
uenc
y
A visual examination of the frequency distribution for Hypothesis 3 in Figure 13
shows that only 41% of the observations fall within the categories “agree” and
60

“strongly agree”, the balance of 59% are in the “neutral”, “disagree” and
“strongly disagree” categories. This indicates that the Hypothesis that in South
Africa, Government is responsive to the needs and timeframes of investors in
the power sector is not supported by the sample. There are, however more
supporters (41%) than detractors (27%) with the rest being neutral (32%).
5.1.3.4 Hypothesis 4 (Independence of Regulatory Institutions)
From Table 5, the mean of the summated observations for Questions 4 and 8 is
3.71. This indicates that the responses were on average toward the “agree”
side of the scale. The median and mode are also on the “agree” side, both
being 4 and 5 respectively. This indicates that support for Hypothesis 1 as a
rating of 4 on the Likert scale corresponds with “agree” and a rating of 5 with
“strongly agree”.
The range is 3 from a maximum of 4. This indicates that the responses were
quite varied. The distribution is negatively skewed, but the reading is so small
that the distribution can be considered normal. There is a bias of the
observations towards the “agree” side of the scale, but the shape of the
distribution approaches normality. The histogram of the summated
observations for Hypothesis 4 is given in Figure 14 below.
A visual examination of the frequency distribution for Hypothesis 4 in Figure 14
shows that 50% of the observations fall within the categories “agree” and
“strongly agree”, the balance of 50% is split between “neutral” with 35% and
“disagree” with 15%, there were no observation in the “strongly disagree”
61

category. This indicates that the Hypothesis that in South Africa, there is
independence of regulatory institutions and processes from government
interference, is supported by the sample, but there are a significant number of
respondents “sitting on the fence”.
Figure 14. Histogram of Summated Responses for Hypothesis 4
Histogram: Frequency Distribution of Observations(Hypothesis 4 - Summated Observations)
0%
15%
35%
15%
35%
0%
5%
10%
15%
20%
25%
30%
35%
40%
1 (Strongly Disagree) 2 (Disagree) 3 (Neutral) 4 (Agree) 5 (Strongly Agree)
Rating (Likert Scale)
Freq
uenc
y
5.2. Inferential Statistical Analysis
An analysis of the descriptive statistics has given an indication of the support (or
lack thereof) for each of the Hypotheses formulated in Chapter 3. The next step
is to perform hypothesis testing to statistically prove or disprove each of the
Hypotheses.
The summated observations for each Hypothesis were used to perform the
hypothesis testing.
62

5.2.1 Hypothesis 1: Adequate cash flow
The first task in hypothesis testing is to formulate the Null and Alternative
Hypotheses.
The Null Hypothesis (H0) statement is:
In South Africa, there are not adequate cash flows for ensuring a reasonable
prospect of recovering costs and making an investment in the power generation
sector a success.
The Alternative Hypothesis (Ha) statement is:
In South Africa, there are adequate cash flows for ensuring a reasonable
prospect of recovering costs and making an investment in the power generation
sector a success.
The Hypotheses to be tested are:
H0: µ ≤ 3
Ha: µ > 3
where µ is the sample mean and 3 is the hypothesised population mean rating
Note that a significance level (α) of 0.01 (1% statistical significance level) is
stipulated.
The test performed is a one-tailed, one sample, t-Test which is a parametric
difference of means test. The Wilcoxon signed-rank test, which is a
nonparametric difference of medians test is also performed by the NCSS
63

software. This conveniently allows a comparison of the results from a non-
parametric and parametric test.
The full test report for Hypothesis Statement 1 is given in Appendix 2. The
abbreviated NCSS one sample t-Test results are given in Table 6 below.
Table 6. Abbreviated NCSS one-sample t-Test results: Hypothesis 1
Hypothesis Statement 1 (Summated Observations)
Statistical Variable t-Test Wilcoxon
Sample Size (n) 34
Sample Mean (µ) 3.79
Sample Std Dev (s) 1.2
Hypothesized Population Mean 3
Alternative Hypothesis (Ha) µ > 3 median > 3
Standard Error of Mean 0.21
p-Value 0.00025 0.00072
Significance Level (α) 0.01 0.01
Result at 1% Significance Level Reject H0 Reject H0
The test results in Table 6 above indicate that the p-Value (0.00025) is less than
the significance level (0.01) with the result that the null hypothesis is rejected
for Hypothesis Statement 1. This is confirmed by the Wilcoxon Signed-Rank
Test, which also yields a result of a p-Value (0.00072) < α-Level (0.01).
The alternative hypothesis for Hypothesis Statement 1 is therefore proven to be
statistically significant at the 1% level.
64

5.2.2 Hypothesis 2: Good Legal Framework
The first task in hypothesis testing is to formulate the Null and Alternative
Hypotheses.
The Null Hypothesis (H0) statement is:
In South Africa, there is not a good legal framework, the rights and obligations
of private investors in power generation are clearly defined and all applicable
laws and contracts are enforced.
The Alternative Hypothesis (Ha) statement is:
In South Africa, there is a good legal framework, the rights and obligations of
private investors in power generation are clearly defined and all applicable laws
and contracts are enforced.
The Hypotheses to be tested are:
H0: µ ≤ 3
Ha: µ > 3
where µ is the sample mean and 3 is the hypothesised population mean rating
Note that a significance level (α) of 0.01 (1% statistical significance level) is
stipulated.
The test performed is a one-tailed, one sample, t-Test which is a parametric
difference of means test. The Wilcoxon signed-rank test, which is a
nonparametric difference of medians test is also performed by the NCSS
65

software. This conveniently allows a comparison of the results from a non-
parametric and parametric test.
The full test report for Hypothesis Statement 2 is given in Appendix 3. The
abbreviated NCSS one sample t-Test results are given in Table 7 below.
Table 7. Abbreviated NCSS one-sample t-Test results: Hypothesis 2
Hypothesis Statement 2 (Summated Observations)
Statistical Variable t-Test Wilcoxon
Sample Size (n) 34
Sample Mean (µ) 3.85
Sample Std Dev (s) 0.6
Hypothesized Population Mean 3
Alternative Hypothesis (Ha) µ > 3 median > 3
Standard Error of Mean 0.10
p-Value < 0.0001 < 0.0001
Significance Level (α) 0.01 0.01
Result at 1% Significance Level Reject H0 Reject H0
The test results in Table 7 above indicate that the p-Value (<0.0001) is
negligible and far smaller than the significance (α) level of 0.01 with the result
that the null hypothesis is rejected for Hypothesis Statement 2. This is
confirmed by the Wilcoxon Signed-Rank Test, which also yields a result of a p-
Value (<0.0001) < α-Level (0.01).
66

The alternative hypothesis for Hypothesis Statement 2 is therefore proven to be
statistically significant at the 1% level.
5.2.3 Hypothesis 3: Government responsive to power sector needs
The first task in hypothesis testing is to formulate the Null and Alternative
Hypotheses.
The Null Hypothesis (H0) statement is:
In South Africa, Government is not responsive to the needs and timeframes of
investors in the power sector.
The Alternative Hypothesis (Ha) statement is:
In South Africa, Government is responsive to the needs and timeframes of
investors in the power sector.
The Hypotheses to be tested are:
H0: µ ≤ 3
Ha: µ > 3
where µ is the sample mean and 3 is the hypothesised population mean rating
Note that a significance level (α) of 0.01 (1% statistical significance level) is
stipulated.
The test performed is a one-tailed, one sample, t-Test which is a parametric
difference of means test. The Wilcoxon signed-rank test, which is a
nonparametric difference of medians test is also performed by the NCSS
67

software. This conveniently allows a comparison of the results from a non-
parametric and parametric test.
The full test report for Hypothesis Statement 3 is given in Appendix 4. The
abbreviated NCSS one sample t-Test results are given in Table 8 below.
Table 8. Abbreviated NCSS one-sample t-Test results: Hypothesis 3
Hypothesis Statement 3 (Summated Observations)
Statistical Variable t-Test Wilcoxon
Sample Size (n) 34
Sample Mean (µ) 3.09
Sample Std Dev (s) 1.1
Hypothesized Population Mean 3
Alternative Hypothesis (Ha) µ > 3 median > 3
Standard Error of Mean 0.19
p-Value 0.32317 0.24767
Significance Level (α) 0.01 0.01
Result at 1% Significance Level Fail to Reject H0 Fail to Reject H0
The test results in Table 8 above indicate that the p-Value (0.32317) is larger
than the significance (α) level of 0.01 with the result that the test fails to reject
the null hypothesis for Hypothesis Statement 3. This is confirmed by the
Wilcoxon Signed-Rank Test, which also yields a result of a p-Value (0.24767) >
α-Level (0.01).
68

Even at significance levels of 5% and 10% (α-Level = 0.05 or 0.10) the p-Value
of 0.32317 is still larger and the test fails to reject the null hypothesis.
What this means is that the alternative hypothesis is not statistically significant
at the 1% (or 5% or 10%) significance level (α). It is important to note that this
does not constitute acceptance of the null hypothesis in statistical terms.
5.2.4 Hypothesis 4: Independence of Regulatory Institutions
The first task in hypothesis testing is to formulate the Null and Alternative
Hypotheses.
The Null Hypothesis (H0) statement is:
In South Africa there is no independence of regulatory institutions and
processes from government interference.
The Alternative Hypothesis (Ha) statement is:
In South Africa there is independence of regulatory institutions and processes
from government interference.
The Hypotheses to be tested are:
H0: µ ≤ 3
Ha: µ > 3
where µ is the sample mean and 3 is the hypothesised population mean rating
Note that a significance level (α) of 0.01 (1% statistical significance level) is
stipulated.
69

The test performed is a one-tailed, one sample, t-Test which is a parametric
difference of means test. The Wilcoxon signed-rank test, which is a
nonparametric difference of medians test is also performed by the NCSS
software. This conveniently allows a comparison of the results from a non-
parametric and parametric test.
The full test report for Hypothesis Statement 4 is given in Appendix 5. The
abbreviated NCSS one sample t-Test results are given in Table 9 below.
Table 9. Abbreviated NCSS one-sample t-Test results: Hypothesis 4
Hypothesis Statement 4 (Summated Observations)
Statistical Variable t-Test Wilcoxon
Sample Size (n) 34
Sample Mean (µ) 3.71
Sample Std Dev (s) 1.1
Hypothesized Population Mean 3
Alternative Hypothesis (Ha) µ > 3 median > 3
Standard Error of Mean 0.19
p-Value 0.00040 0.00126
Significance Level (α) 0.01 0.01
Result at 1% Significance Level Reject H0 Reject H0
The test results in Table 9 above indicate that the p-Value (0.0004) is negligible
and far smaller than the significance (α) level of 0.01 with the result that the null
hypothesis is rejected for Hypothesis Statement 4. This is confirmed by the
70

Wilcoxon Signed-Rank Test, which yields a p-Value (<0.0001) < α-Level (0.01)
and the same result.
The alternative hypothesis for Hypothesis Statement 4 is therefore proven to be
statistically significant at the 1% level.
5.3. Summarised Results
The results from the descriptive statistical analysis and the hypothesis testing
are summarised in Table 10 below.
Table 10. Summarised Results
Sample Mean Sample Median t-Test Result
Hypothesis 1 3.79 4 Reject H0
Hypothesis 2 3.85 4 Reject H0
Hypothesis 3 3.09 3 Fail to Reject H0
Hypothesis 4 3.71 4 Reject H0
The results from the hypothesis testing are borne out when looking at the mean
and median results from the descriptive statistical analysis. The Sample means
for Hypotheses 1, 2 and 3 are highly biased toward the “agree” category and
this is supported by the median (a better indicator for Likert data which is ordinal
in nature) for all three which is the rating of 4, which corresponds to “agree” on
the Likert scale.
The hypothesis test result for Hypothesis 3 is also supported, even though the
mean tends slightly toward the “agree” side of the scale, the median yields a
rating of 3, which indicates neutrality.
71

Chapter 6: Discussion of Results
The objectives of this research were:
• To survey the major players in the Electricity Sector in South Africa,
especially potential private investors in power generation to determine the
whether the major factors upon which decisions to invest or not to invest in a
power project are based are catered for in South Africa.
• Having identified which of the major factors are catered for or not catered for
as the case may be, recommendations would be made regarding actions to
be taken to address shortcomings and to build on strengths to attract the
necessary private sector investment in new power generating capacity in
South Africa.
The literature review highlighted South Africa’s current capacity crunch with the
requisite need for a tremendous amount of new power generating capacity
(80 000MW in 20 years) within a relatively short timeframe and government’s
commitment that 30% of the new capacity will be built, owned and operated
(BOO model) by the private sector.
The problem highlighted is the lack of private sector interest in the power sector,
evidenced by the competitive bidding process conducted by the Department of
Minerals and Energy (DME) for an Independent Power Producer Gas Turbine
Power Plant, which yielded only 2 bidders at the end of the process.
There was a need for research into the factors that investors consider of
paramount importance when deciding on whether to invest in the power sector
72

in a country. These are not decisions to be taken lightly as power sector
investment by its very nature is highly capital intensive and involves billions of
Rands and also tend to be long term investments that can range from 15-20
years depending on the size and nature of power plant invested in.
The literature review revealed a study conducted by the World Bank in early
2002 (Lamech and Saeed, 2003) where an international survey was done to
determine the major factors that power sector investors consider when investing
in developing countries. South Africa was not highlighted in the study, results
reported were mainly from the South American and Asian regions.
The factors highlighted, however, were of particular interest as South Africa
intends attracting investment into its power sector from international as well as
local investors. Of the six factors identified by the World Bank study, 2 were
discarded as either being moot or not relevant to South Africa. The factors
investigated were:
1) Adequacy of cash flows in the sector
2) Stability and enforcement of laws and contracts
3) Government responsiveness to the needs and timeframes of investors
4) Regulatory Independence
A Hypothesis Statement was formulated for each of these and a questionnaire
survey done to test the various hypotheses. A discussion of the results of the
analysis of the questionnaire data follows for each of the factors investigated.
73

6.1. Hypothesis 1: Adequacy of cash flows in the sector
In South Africa, there are adequate cash flows for ensuring a reasonable
prospect of recovering costs and making an investment in the power generation
sector a success.
The Hypothesis above was surveyed with statements 1 and 5 in the
questionnaire survey (see Appendix 1) that required respondents to indicate
their agreement or disagreement on a 5 point Likert scale.
Descriptive statistics were calculated for the dataset for each question
individually and then the summated dataset of the two. The results of this
analysis are given in 0 below.
The descriptive statistics for the individual questions are very similar with the
result that the summated result is also very similar. The main result to look at
here is that the average of the observations (mean) tends toward the upper end
or “agree” side of the scale. The median readings reinforce this as they are all
a rating of 4 which corresponds with “agree” on the Likert scale. The
distributions are all negatively skewed, which also indicates a bias toward the
“agree” side.
This indicates that there is support within the sample for the Hypothesis
Statement that there are adequate cash flows in the power sector in South
Africa.
74

Table 11. Summarised Descriptive Statistics for Hypothesis 1
Variable Q 1 Q 5 SummatedMean 3.94 3.65 3.79 Standard Error 0.29 0.30 0.21 Median 4 4 4 Mode 4 4 4 Standard Deviation 1.20 1.22 1.20 Sample Variance 1.43 1.49 1.44 Kurtosis 1.25 -0.19 0.12 Skewness -1.36 -0.85 -1.03 Range 4 4 4 Minimum 1 1 1 Maximum 5 5 5 Sum 67 62 129 Count 17 17 34
If the scale is “collapsed” to comprise of only 3 categories, namely, “disagree”,
“neutral” and “agree” and the frequency of observations calculated in each, then
the result in Table 12 below is presented.
Table 12. Frequency Distribution of Collapsed Scale for Hypothesis 1
Category Statement 1 Statement 5 SummatedDisagree 18% 24% 21%Neutral 0% 6% 3%Agree 82% 71% 76%
Hypothesis 1
It is very clear from this table that the majority of the responses to these
questions (over 70%) are on the “agree” side of the scale, whether the
individual question responses or the summated responses are considered.
75

The above shows that, based on descriptive analysis, the majority of the
respondents are of the opinion that cash flows are adequate in the South
African power sector to ensure a reasonable prospect of recovering costs and
making an investment in the power generation sector a success.
Descriptive statistics are, however not enough to prove statistically that the
Hypothesis Statement is supported. In order to do this, hypothesis testing was
performed on the summated dataset using a one-tailed, one-sample t-test which
was performed using NCSS. The results are given in Table 6 above.
The outcome is that the null hypothesis is rejected for both the parametric and
nonparametric tests carried out by the software package. The Hypothesis 1
Statement was posed as the alternative hypothesis and is therefore proved to
be statistically significant at the 1% significance level.
There is therefore, statistical support that cash flows are adequate enough in
the South African power sector to ensure a reasonable prospect of recovering
costs and making an investment in the power generation sector a success.
This result must be tempered in the light of the composition of the sample,
which was dominated by the government and regulation sectors which made up
some 58% of the sample. It would be expected that this would be the sentiment
in those sectors, but the fact that over 70% of the observations were also
supportive of the statement supports the notion that cash flows are adequate in
the power sector.
76

6.2. Hypothesis 2: Stability and enforcement of laws and contracts
In South Africa, there is a good legal framework, the rights and obligations of
private investors in power generation are clearly defined and all applicable laws
and contracts are enforced.
The Hypothesis above was surveyed with statements 2 and 6 in the
questionnaire survey (see Appendix 1) that required respondents to indicate
their agreement or disagreement on a 5 point Likert scale.
Descriptive statistics were calculated for the dataset for each question
individually and then the summated dataset of the two. The results of this
analysis are given in Table 13 below.
Table 13. Summarised Descriptive Statistics for Hypothesis 2
Variable Q 2 Q 6 SummatedMean 3.88 3.82 3.85 Standard Error 0.15 0.13 0.10 Median 4 4 4 Mode 4 4 4 Standard Deviation 0.60 0.53 0.56 Sample Variance 0.36 0.28 0.31 Kurtosis 0.23 0.74 0.25 Skewness 0.02 -0.26 -0.07 Range 2 2 2 Minimum 3 3 3 Maximum 5 5 5 Sum 66 65 131 Count 17 17 34
Hypothesis 2
The descriptive statistics for the individual questions are very similar with the
result that the summated result is also very similar. The main result to look at
77

here is that the average of the observations (mean) tends toward the upper end
or “agree” side of the scale. The median figures reinforce this they are all a
rating of 4 which corresponds with “agree” on the Likert scale. The distributions
are either negatively skewed or almost zero, the summated figure for skewness
is almost zero which also indicates that the observations approximate a normal
distribution.
This indicates that there is support within the sample for the Hypothesis
Statement that there is stability and enforcement of laws and contracts in South
Africa.
If the scale is “collapsed” to comprise of only 3 categories, namely, “disagree”,
“neutral” and “agree” and the frequency of observations calculated in each, then
the result in Table 14 below is presented.
Table 14. Frequency Distribution of Collapsed Scale for Hypothesis 2
Category Statement 2 Statement 6 Hypothesis 2Disagree 0% 0% 0%Neutral 24% 24% 24%Agree 76% 76% 76%
Hypothesis 2
It is very clear from this table that the majority of the responses to these
questions (over 75%) are on the “agree” side of the scale, whether the
individual question responses or the summated responses are considered. Of
note is that there are no observations within the disagree scale, the rest are in
the “neutral” category.
78

The above shows that, based on descriptive analysis, the majority of the
respondents are of the opinion that that there is stability and enforcement of
laws and contracts in South Africa and that none of the respondents disagreed
with this.
Descriptive statistics are, however not enough to prove statistically that the
Hypothesis Statement is supported. In order to do this, hypothesis testing was
performed on the summated dataset using a one-tailed, one-sample t-test which
was performed using NCSS. The results are given in Table 7 above.
The outcome is that the null hypothesis is rejected for both the parametric and
nonparametric tests carried out by the software package. The Hypothesis 2
Statement was posed as the alternative hypothesis and is therefore proved to
be statistically significant at the 1% significance level.
There is therefore, statistical support that there is stability and enforcement of
laws and contracts in South Africa.
This result must also be tempered in the light of the composition of the sample,
which was dominated by the government and regulation sectors which made up
some 58% of the sample. It would be expected that this would be the sentiment
in those sectors, but the fact that over 75% of the observations were supportive
of the statement and none of the respondents disagreed with the statement
79

strongly supports that there is stability and enforcement of laws and contracts in
South Africa.
6.3. Hypothesis 3: Government responsiveness to power sector needs
In South Africa, Government is responsive to the needs and timeframes of
investors in the power sector.
The Hypothesis above was surveyed with statements 3 and 7 in the
questionnaire survey (see Appendix 1) that required respondents to indicate
their agreement or disagreement on a 5 point Likert scale.
Descriptive statistics were calculated for the dataset for each question
individually and then the summated dataset of the two. The results of this
analysis are given in Table 15 below.
Table 15. Summarised Descriptive Statistics for Hypothesis 3
Variable Q 3 Q 7 SummatedMean 3.29 2.88 3.09 Standard Error 0.22 0.31 0.19 Median 4 3 3 Mode 4 3 4 Standard Deviation 0.92 1.27 1.11 Sample Variance 0.85 1.61 1.23 Kurtosis 0.87 -0.69 -0.48 Skewness -1.22 0.04 -0.46 Range 3 4 4 Minimum 1 1 1 Maximum 4 5 5 Sum 56 49 105 Count 17 17 34
Hypothesis 3
80

The descriptive statistics for the individual questions are varied. The average of
the observations (mean) tends toward the upper end or “agree” side of the scale
for Question 7 and to the “disagree” side for Question 3. This is borne out in the
median figures where Question 3 has a median of 4 (“agree”) and Question 7 a
median of 3 (“neutral”). The mean for the summated dataset is very close to
“neutral” and the median is 3 (“neutral”). The distributions are either negatively
skewed or almost zero, the summated figure for skewness is negative,
indicating some bias toward the “agree” side..
It is not clear from the above whether there is support within the sample for the
Hypothesis Statement that Government is responsive to the needs and
timeframes of investors in the power sector in South Africa or not.
If the scale is “collapsed” to comprise of only 3 categories, namely, “disagree”,
“neutral” and “agree” and the frequency of observations calculated in each, then
the result in Table 16 below is presented.
Table 16. Frequency Distribution of Collapsed Scale for Hypothesis 3
Category Statement 3 Statement 7 Hypothesis 3Disagree 18% 35% 26%Neutral 29% 35% 32%Agree 53% 29% 41%
Hypothesis 3
It is not clear from the table where the majority of the responses lie. In Question
3, the majority of the observations are on the “agree” side, but when the
summated data is analyses, only 41% of the observations are on the “agree”
81

side of the scale. The observations appear to be almost evenly spaces
between the three categories, with a slight bias toward “agree”.
Based on the descriptive analysis it is not possible to discern any trend, the
opinions on this statement appear to be varied..
Descriptive statistics are, however not enough to prove statistically that the
Hypothesis Statement is supported in any case. In order to do this, hypothesis
testing was performed on the summated dataset using a one-tailed, one-sample
t-test which was performed using NCSS. The results are given in Table 8
above.
The outcome is that the null hypothesis cannot be rejected for both the
parametric and nonparametric tests carried out by the software package either
at the 1%, 5% or 10% significance level. The Hypothesis 3 Statement was
posed as the alternative hypothesis could not therefore be proved to be
statistically significant.
There is therefore, no statistical support that, Government is responsive to the
needs and timeframes of investors in the power sector in South Africa.
This was a surprising result, given that the sample was dominated by the
government and regulation sectors which made up some 58% of the sample. It
would appear that acknowledgement is being given of the fact that the DME
competitive bidding process has left a lot to be desired.
82

The outcome does not mean that Government is not responsive to the needs
and timing of investors in the power sector in South Africa, what if means is that
we were not able to prove that it is responsive with any statistical significance.
This result indicates that there is work to be done in this area if private sector
investment is to be attracted to the power sector.
6.4. Hypothesis 4: Independence of Regulatory Institutions
In South Africa there is independence of regulatory institutions and processes
from government interference.
The Hypothesis above was surveyed with statements 4 and 8 in the
questionnaire survey (see Appendix 1) that required respondents to indicate
their agreement or disagreement on a 5 point Likert scale.
Descriptive statistics were calculated for the dataset for each question
individually and then the summated dataset of the two. The results of this
analysis are given in Table 17 below.
The descriptive statistics for the individual questions are very similar with the
result that the summated result is also very similar. The main result to look at
here is that the average of the observations (mean) tends toward the upper end
or “agree” side of the scale and they are identical for the two questions. The
median figures do not reinforce this as they are varied, with one having a rating
83

of 4 and the other a rating of 3 which corresponds with “agree” and “neutral”
respectively on the Likert scale. The summated dataset has a median of 4.
The distributions are negatively skewed and close to zero, which indicates that
the observations approximate a normal distribution.
Table 17. Summarised Descriptive Statistics for Hypothesis 4
Variable Q 4 Q 8 SummatedMean 3.71 3.71 3.71 Standard Error 0.28 0.27 0.19 Median 4 3 4 Mode 5 3 5 Standard Deviation 1.16 1.10 1.12 Sample Variance 1.35 1.22 1.24 Kurtosis -1.47 -1.49 -1.44 Skewness -0.16 0.03 -0.07 Range 3 3 3 Minimum 2 2 2 Maximum 5 5 5 Sum 63 63 126 Count 17 17 34
Hypothesis 4
This above indicates that there might be support within the sample for the
Hypothesis Statement that there is independence of regulatory institutions and
processes from government interference in South Africa, but it is far from clear.
If the scale is “collapsed” to comprise of only 3 categories, namely, “disagree”,
“neutral” and “agree” and the frequency of observations calculated in each, then
the result in Table 18 below is presented.
84

Table 18. Frequency Distribution of Collapsed Scale for Hypothesis 4
Category Statement 4 Statement 8 Hypothesis 4Disagree 18% 12% 15%Neutral 29% 41% 35%Agree 53% 47% 50%
Hypothesis 4
The table shows that around 50% of the responses to these questions are on
the “agree” side of the scale. That is far from conclusive as to where the
sentiment of the sample lies with respect to this Hypothesis.
The above shows that, based on the descriptive analysis, it is not possible to
discern the majority opinion of the sample regarding whether there is
independence of regulatory institutions and processes from government
interference in South Africa or not.
Descriptive statistics are, however, in any case not enough to prove statistically
whether a Hypothesis Statement is supported or not. In order to do this,
hypothesis testing was performed on the summated dataset using a one-tailed,
one-sample t-test which was performed using NCSS. The results are given in
Table 9 above.
The outcome is that the null hypothesis is rejected for both the parametric and
nonparametric tests carried out by the software package. The Hypothesis 4
Statement was posed as the alternative hypothesis and is therefore proved to
be statistically significant at the 1% significance level.
85

There is therefore, statistical support that there is independence of regulatory
institutions and processes from government interference in South Africa even
though this is not borne out by the descriptive statistics.
This result must also be viewed in the light of the composition of the sample,
which was dominated by the government and regulation sectors which made up
some 58% of the sample.
It is expected that sentiment in those sectors would be positive toward this
statement and the fact that the respondents were split almost evenly between
neutral/disagree and agree means that this result must be looked at carefully.
Indications are that support for this statement is precarious and work will need
to be done in this area if private sector investment is to be attracted to the South
African power sector.
6.5. Discussion of Results Summary
The literature reviewed showed that in order to create a conducive (read ideal)
climate for private sector investment in South Africa’s power sector, the
following needs to be catered for.
There needs to be adequate cash flows which will ensure that investors have a
reasonable prospect of recovering costs and making an investment in the power
generation sector a success. This means that there needs to be adequate
recovery of costs allowed via the tariffs and that investors will be permitted to
86

make a reasonable profit. The term reasonable is not defined and could mean
many different things for different institutions.
The test results indicated strongly that the industry (bearing in mind the skewed
sample) agrees that cash flows are indeed adequate in South Africa. Although
there is some work to be done in this area, especially on defining a “reasonable
return”, it seems that this is not currently a barrier to private investment in the
South African power sector.
In addition to the cash flows, a good legal framework is needed, where the
rights and obligations of private investors in power generation are clearly
defined and all applicable laws and contracts are enforced. There is strong
consensus on this within the sample that South Africa does possess a good
legal framework. Investors need this because power sector investments run
into many millions if not billions of Rand and then need to be assured that their
interest will be protected in the long run. This appears to be catered for
sufficiently within South Africa’s current legal system and does not pose a
barrier to investment.
A government that is responsive to the needs and timeframes of investors in the
power sector was also put forward as one of the primary considerations by
private investors. Government is well known (in most parts of the world) for
being inefficient and lethargic. Protracted timeframes have an opportunity cost
for investors and can pose a substantial barrier to investment. The survey
results were inconclusive. The result shows that there is a lot of work to be
87

done in this area to restore confidence in government’s ability to address the
needs and timeframes of investors. This area is definitely an obstacle to private
sector investment in South Africa’s power sector and needs to be addressed
urgently. The protracted and convoluted DME competitive bidding process for
the first IPP is a case in point.
The independence of regulatory institutions and processes from government
interference is also considered important from an investor point of view. This
could be a concern in South Africa, given that the National Energy Regulator of
South Africa functions as an independent economic regulator, but is under the
direction of the Minister of Minerals and Energy. There is much room for
interference from government and the private sector is well aware of that. The
survey result was that there is statistical support to claim that the regulatory
institutions and processes are independent from government interference,
however when looking at the frequency distributions of the responses it is clear
that the sample was divided on this issue. This can be a major obstacle to
private sector investment and can impact on Hypothesis 1. If there is no
regulatory independence, then the private investor will be uncertain as to
whether the tariff needed to sustain their investment will be sustained into
perpetuity or whether they will be dealing with a constantly changing set of rules
which introduces additional risk into the investment thereby requiring a higher
rate of return to be viable.
The research objectives have been fulfilled in that we have identified that South
Africa offers private sector investors adequate cash flows to recover costs and
88

to make a reasonable return and also provides investors with a good legal
system that is enforced thereby allowing them protection for their investments.
The research has also identified that there is a severe shortcoming in
government’s responsiveness to investors’ needs and the timeframes
necessary to reduce opportunity cost and that the independence of regulatory
institutions is questionable and needs to be worked on.
South Africa has strengths to build on to attract private investors to the power
sector, but there are some shortcomings, notably with the government’s domain
that need to be addressed immediately if the necessary private sector
participation in the capacity expansion programme is to be achieved without
compromising South Africa’s security of electricity supply.
89

Chapter 7: Conclusion
South Africa faces a massive challenge to expand its power generation capacity
to double its current size to cater for increased demand over the next 20 years.
This situation has been brought about by accelerated growth of the South
African economy coupled with a lack of investment in new power generating
capacity over the preceding years which has resulted in a rapid narrowing of the
gap between supply and demand.
The system reserve margin is currently well below international norms and any
major unplanned outages during times of increased electricity demand have
necessitated “rolling blackouts” to ensure integrity of the national electricity
supply network. Timeframes for bringing new capacity online are extremely
tight as a result.
The South African government has a stated policy that 30% of all new power
generating capacity will be built, owned and operated by the private sector. The
role that the private sector needs to play to bring the necessary power
generating capacity into being within the necessary timeframe to prevent even
more severe power “blackouts” is therefore of crucial importance.
This research was aimed at determining whether the factors necessary to
attract private sector investment into the South African power sector are
adequately catered for. If the necessary environment is not created to stimulate
the investment needed, then capacity expansion timeframes will suffer and the
90

demand/supply balance will continue to deteriorate and electricity supply will
become increasingly unstable.
An inadequate or unstable electricity supply will have additional consequences
for other parts of the economy as investor confidence in general will suffer as a
result.
The research found that investors look at six major considerations when
considering investment in a country, two of those, namely the need for investors
to have greater management and operational control over their investments and
the availability of credit enhancement or risk guarantees were not researched
as these are moot points in the South African context, given that all IPP
operations are to be Build-Own-Operate (BOO) and the state-owned utility
(Eskom) functions “at arms length” from government and is currently required to
provide any necessary guarantees and indeed has a better credit rating that the
sovereign one.
The research focused on four major considerations identified by a World Bank
study in 2002, namely the need for adequate cash flows in order for cost
recovery as well as a reasonable return to be effected, the existence of a good
legal system that will protect the interests of all parties and uphold contracts, the
responsiveness of government to investor needs and timeframes and the
independence of regulatory institutions and processes from government
interference.
91

The findings of the research are that the South African power sector is deemed
to have adequate cash flows to allow investors to recover costs and to make a
reasonable return on their investment. Coupled with this is a good legal In
framework, the industry is comfortable that the rights and obligations of private
investors in power generation are clearly defined and all applicable laws and
contracts are enforced.
It was found that Government lacks responsiveness to the needs and
timeframes of private investors. The problem that investors face is that if
timeframes are too long, there is an opportunity cost associated with it for them.
Government needs to address the process whereby private sector investment in
power generation is enabled and enacted to reduce transaction costs and
reduce lead times to ensure that investor opportunity cost is minimised.
The independence of South Africa’s regulatory institutions and processes from
Government interference is questionable. The regulator overseeing the
electricity sector is an independent regulator, but is directed by the Minister of
Minerals and Energy. Work needs to be done in this area to make investors
comfortable that Government is not interfering in the Regulation of the industry,
other than to develop the policies that the regulator implements and that these
policies are clear and consistent.
In summary, the South African legal system and the revenue generation
potential of the power sector appear to be advantages that the country can
leverage off to attract power sector investors.
92
However, major stumbling blocks to private investor participation are the
responsiveness of Government and the independence of the Regulatory
institutions from Government. Both these factors lie squarely at Government’s
“feet” and need to be dealt with immediately.
It is recommended in addressing the issue of responsiveness that an alternative
procurement procedure for Independent Power Production be sought, possibly
an auction type process, rather than the protracted competitive bidding one
currently in place. It is also possible to set up an independent “buyer” to
procure the IPPs along business lines and timeframes.
The recommendation to address the issue of perceived Government
interference in regulation is to ensure that all policies are clear and transparent
and that any decisions taken by the Regulator are clearly explained and that the
decision making process is a transparent one.
93

Future Research:
This challenge of attracting private investors to the South African power sector
is a complex one and there are many other factors that may have been
overlooked.
• Possible future research in this area is to analyse the factors by industry
sector so as to determine whether different approaches need to be taken for
different role players.
• Additionally, it might be useful to investigate the factors that result in deals
not being concluded once an investor has been attracted to the sector.
• A study into the major factors investors take into consideration, specifically, in
a South African context would also be useful as they may differ to those
identified by the 2002 World Bank International Study.
94

References
Abbot, M. (2001) Is the Security of Electricity Supply a Public Good? The
Electricity Journal (August/September 2001).
Albright, S.C. Winston, W.L. and Zappe, C. (2006) Data Analysis and Decision
Making with Microsoft Excel. United States of America: Thomson South-
Western.
Botterud, A. (2003) Dynamic Modelling of Investments in New Power
Generation under Uncertainty. Trondheim: The Norwegian University of Science
and Technology (NTNU).
Bunn, D. and Larson, E. (1992) Sensitivity of Reserve Margin to Factors
Influencing Investment Behaviour in the Electricity Market of England and
Wales. Energy Policy. Vol. 20(5).
Doorman, G.L. (2000) Peaking Capacity in Restructured Power Systems.
Trondheim: The Norwegian University of Science and Technology (NTNU).
URN:NBN:no-2136.
DME (1998). White Paper on Energy Policy for South Africa. Pretoria:
Department of Minerals and Energy. p29.
95

DME (2007). Independent Power Producers. Johannesburg: Department of
Minerals and Energy. Article available at
http://www.dme.gov.za/energy/electricity.stm (accessed 01/06/2007).
Eskom (2007a). Eskom Presentation to the Public Enterprises Portfolio
Committee, The State of Electricity Supply to South Africa. Cape Town: Eskom.
Eskom (2007b). Eskom Annual Report 2007.
Green, R. (2003). Electricity Markets: Challenges for Economic Research. The
Hague: Research Symposium European Electricity Markets.
Griffin, J.M. and Puller. S.L. (2005) Electricity Deregulation: Choices and
Challenges. US: University of Chicago Press. ISBN 0-226-30856-1.
Joskow, P.L. (2006) Competitive Electricity Markets and Investment in New
Generating Capacity. Massachusetts: Massachusetts Institute of Technology.
06-009 WP.
Lamech, R. and Saeed K. (2003) What International Investors Look For When
Investing in Developing Countries. Washington: World Bank Energy and Mining
Board. Discussion Paper No. 6.
National Electricity Regulator (2004). Electricity Supply Statistics for South
Africa 2004. Pretoria: National Electricity Regulator.
96

Newbery, D. and Eberhard, A (2007) An independent assessment of the
performance of the electricity sector in South Africa: Key challenges and
recommendations. Pretoria: National Treasury.
NUS Consulting Group (2007) Extract from © 2005/6 and 2006/7 NUS
Consulting Group International Electricity Survey and Cost Comparison, April
2007. USA: NUS Consulting Group.
Swisher J.N. de Martino J.G. and Redlinger R.I. (1997) Tools and Methods for
Integrated Resource Planning: Improving Energy Efficiency and Protecting the
Environment. Roskilde: Risø National Laboratory. Working Paper No. 7.
Wang, K.M. (2004). The Deregulation of Taiwan Electricity Supply Industry.
Energy Policy (2004).
Wikipedia (2007). Likert Scale. Accessible at
http://en.wikipedia.org/wiki/Likert_scale (accessed 07/11/2007)
Woo, C.K. King, M. Tishler, A. and Chow, L.C.H. (2005). Costs of Electricity
Deregulation. Energy (2005). p1-22.
Woodhouse, E.J. (2005) The Experience of Independent Power Producers in
Developing Countries. Stanford: Stanford University. PESD Seminar Discussion
Paper.
97

Zikmund, W.G. (2003) Business Research Methods. United States of America:
Thomson Learning.
98

APPENDIX 1: Research Questionnaire
FACTORS AFFECTING PRIVATE INVESTMENT IN NEW POWER GENERATING CAPACITY IN SOUTH AFRICA
Research Questionnaire
Thank you for taking time to fill out this questionnaire about the factors that are
likely to impact on private sector investment in new power generating capacity
in South Africa. This research is in partial fulfillment of the MBA programme at
the Gordon Institute of Business Science. The research intends identifying
factors that are influential in ensuring that investment in new power generating
capacity in South Africa takes place successfully.
The questionnaire will take you between 5 and 10 minutes to complete.
Anonymity is guaranteed, upon receipt of the completed questionnaire, the
original facsimile or email will be destroyed or deleted after the data has been
captured.
Upon completion of the questionnaire, kindly return by fax on (012) 342 0583 or
by email at [email protected] by 5 November 2007.
Thank you for your cooperation.
PLEASE MARK (x) THE ORGANISATION OR GROUP YOU REPRESENT
ORGANISATION (x) Government
Financier
State-Owned Utility (Eskom)
Utilities (Municipality/Metro)
Independent Power Producer Developer
Regulation
99
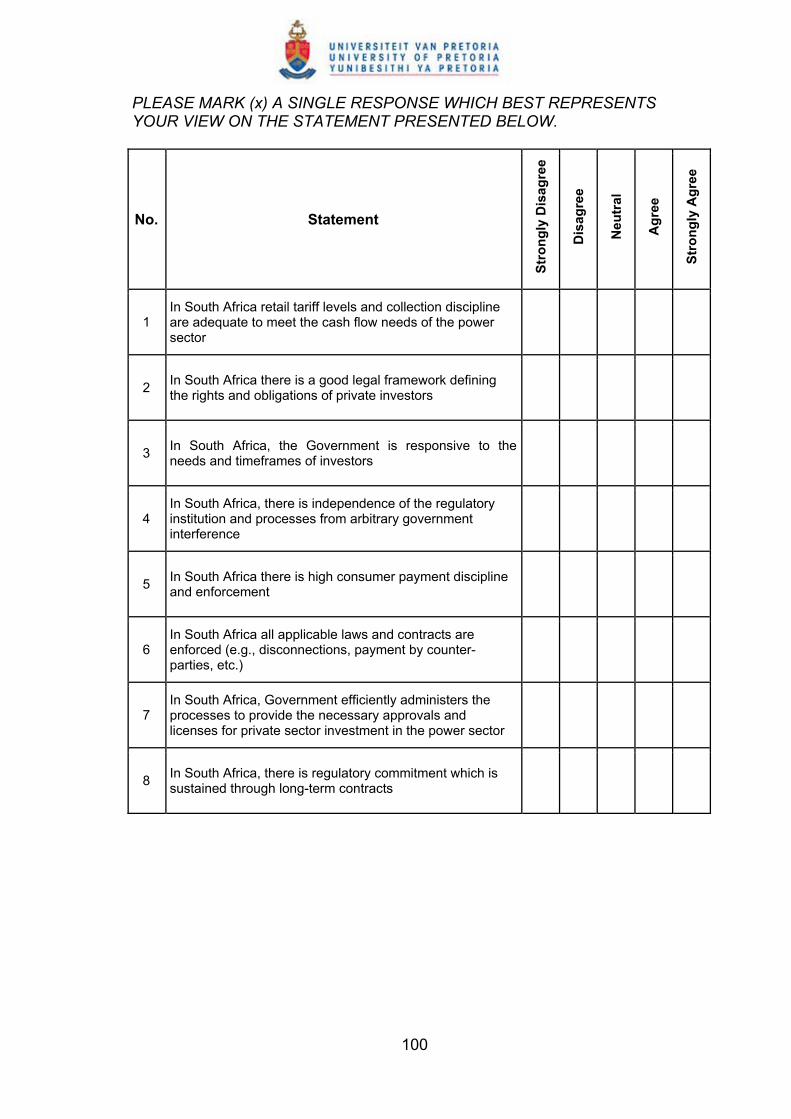
100
PLEASE MARK (x) A SINGLE RESPONSE WHICH BEST REPRESENTS YOUR VIEW ON THE STATEMENT PRESENTED BELOW.
No. Statement
Stro
ngly
Dis
agre
e
Dis
agre
e
Neu
tral
Agr
ee
Stro
ngly
Agr
ee
1 In South Africa retail tariff levels and collection discipline are adequate to meet the cash flow needs of the power sector
2 In South Africa there is a good legal framework defining the rights and obligations of private investors
3 In South Africa, the Government is responsive to the needs and timeframes of investors
4 In South Africa, there is independence of the regulatory institution and processes from arbitrary government interference
5 In South Africa there is high consumer payment discipline and enforcement
6 In South Africa all applicable laws and contracts are enforced (e.g., disconnections, payment by counter-parties, etc.)
7 In South Africa, Government efficiently administers the processes to provide the necessary approvals and licenses for private sector investment in the power sector
8 In South Africa, there is regulatory commitment which is sustained through long-term contracts
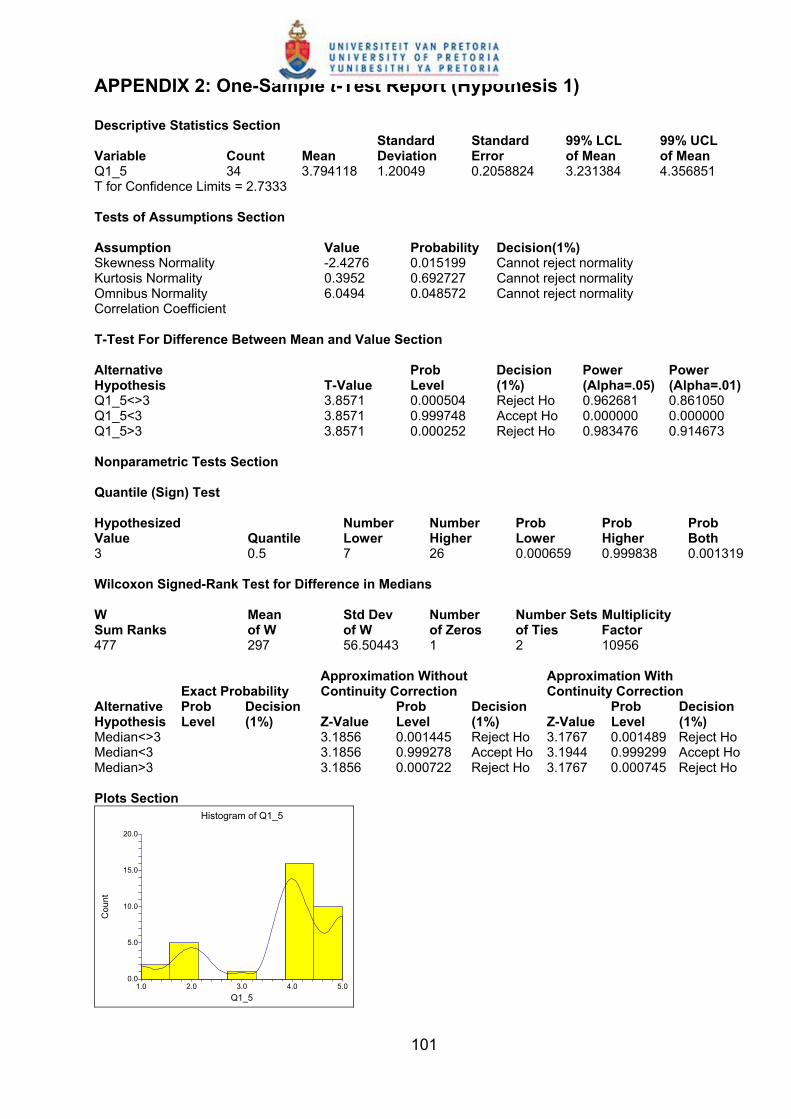
APPENDIX 2: One-Sample t-Test Report (Hypothesis 1) Descriptive Statistics Section Standard Standard 99% LCL 99% UCL Variable Count Mean Deviation Error of Mean of Mean Q1_5 34 3.794118 1.20049 0.2058824 3.231384 4.356851 T for Confidence Limits = 2.7333 Tests of Assumptions Section Assumption Value Probability Decision(1%) Skewness Normality -2.4276 0.015199 Cannot reject normality Kurtosis Normality 0.3952 0.692727 Cannot reject normality Omnibus Normality 6.0494 0.048572 Cannot reject normality Correlation Coefficient
T-Test For Difference Between Mean and Value Section Alternative Prob Decision Power Power Hypothesis T-Value Level (1%) (Alpha=.05) (Alpha=.01) Q1_5<>3 3.8571 0.000504 Reject Ho 0.962681 0.861050 Q1_5<3 3.8571 0.999748 Accept Ho 0.000000 0.000000 Q1_5>3 3.8571 0.000252 Reject Ho 0.983476 0.914673 Nonparametric Tests Section Quantile (Sign) Test Hypothesized Number Number Prob Prob Prob Value Quantile Lower Higher Lower Higher Both 3 0.5 7 26 0.000659 0.999838 0.001319 Wilcoxon Signed-Rank Test for Difference in Medians W Mean Std Dev Number Number Sets Multiplicity Sum Ranks of W of W of Zeros of Ties Factor 477 297 56.50443 1 2 10956 Approximation Without Approximation With Exact Probability Continuity Correction Continuity Correction Alternative Prob Decision Prob Decision Prob Decision Hypothesis Level (1%) Z-Value Level (1%) Z-Value Level (1%) Median<>3 3.1856 0.001445 Reject Ho 3.1767 0.001489 Reject Ho Median<3 3.1856 0.999278 Accept Ho 3.1944 0.999299 Accept Ho Median>3 3.1856 0.000722 Reject Ho 3.1767 0.000745 Reject Ho Plots Section
0.0
5.0
10.0
15.0
20.0
1.0 2.0 3.0 4.0 5.0
Histogram of Q1_5
Q1_5
Cou
nt
101

APPENDIX 3: One-Sample t-Test Report (Hypothesis 2) Descriptive Statistics Section Standard Standard 99% LCL 99% UCL Variable Count Mean Deviation Error of Mean of Mean Q2_6 34 3.852941 0.5577201 9.564821E-02 3.591508 4.114374 T for Confidence Limits = 2.7333 Tests of Assumptions Section Assumption Value Probability Decision(1%) Skewness Normality -0.1771 0.859433 Cannot reject normality Kurtosis Normality 0.5533 0.580050 Cannot reject normality Omnibus Normality 0.3375 0.844713 Cannot reject normality Correlation Coefficient T-Test For Difference Between Mean and Value Section Alternative Prob Decision Power Power Hypothesis T-Value Level (1%) (Alpha=.05) (Alpha=.01) Q2_6<>3 8.9175 0.000000 Reject Ho 1.000000 1.000000 Q2_6<3 8.9175 1.000000 Accept Ho 0.000000 0.000000 Q2_6>3 8.9175 0.000000 Reject Ho 1.000000 1.000000 Nonparametric Tests Section Quantile (Sign) Test Hypothesized Number Number Prob Prob Prob Value Quantile Lower Higher Lower Higher Both 3 0.5 0 26 0.000000 1.000000 0.000000 Wilcoxon Signed-Rank Test for Difference in Medians W Mean Std Dev Number Number Sets Multiplicity Sum Ranks of W of W of Zeros of Ties Factor 559 279.5 55.82786 8 2 12168 Approximation Without Approximation With Exact Probability Continuity Correction Continuity Correction Alternative Prob Decision Prob Decision Prob Decision Hypothesis Level (1%) Z-Value Level (1%) Z-Value Level (1%) Median<>3 5.0065 0.000001 Reject Ho 4.9975 0.000001 Reject Ho Median<3 5.0065 1.000000 Accept Ho 5.0154 1.000000 Accept Ho Median>3 5.0065 0.000000 Reject Ho 4.9975 0.000000 Reject Ho Plots Section
0.0
6.3
12.5
18.8
25.0
3.0 3.5 4.0 4.5 5.0
Histogram of Q2_6
Q2_6
Cou
nt
102

APPENDIX 4: One-Sample t-Test Report (Hypothesis 3) Descriptive Statistics Section Standard Standard 99% LCL 99% UCL Variable Count Mean Deviation Error of Mean of Mean Q3_7 34 3.088235 1.111037 0.1905413 2.567433 3.609037 T for Confidence Limits = 2.7333 Tests of Assumptions Section Assumption Value Probability Decision(1%) Skewness Normality -1.1900 0.234063 Cannot reject normality Kurtosis Normality -0.5444 0.586188 Cannot reject normality Omnibus Normality 1.7123 0.424787 Cannot reject normality Correlation Coefficient T-Test For Difference Between Mean and Value Section Alternative Prob Decision Power Power Hypothesis T-Value Level (1%) (Alpha=.05) (Alpha=.01) Q3_7<>3 0.4631 0.646349 Accept Ho 0.073476 0.017644 Q3_7<3 0.4631 0.676826 Accept Ho 0.017927 0.002794 Q3_7>3 0.4631 0.323174 Accept Ho 0.116786 0.029928 Nonparametric Tests Section Quantile (Sign) Test Hypothesized Number Number Prob Prob Prob Value Quantile Lower Higher Lower Higher Both 3 0.5 9 14 0.202436 0.894980 0.404873 Wilcoxon Signed-Rank Test for Difference in Medians W Mean Std Dev Number Number Sets Multiplicity Sum Ranks of W of W of Zeros of Ties Factor 303 264.5 56.4657 11 2 5106 Approximation Without Approximation With Exact Probability Continuity Correction Continuity Correction Alternative Prob Decision Prob Decision Prob Decision Hypothesis Level (1%) Z-Value Level (1%) Z-Value Level (1%) Median<>3 0.6818 0.495347 Accept Ho 0.6730 0.500963 Accept Ho Median<3 0.6818 0.752327 Accept Ho 0.6907 0.755118 Accept Ho Median>3 0.6818 0.247673 Accept Ho 0.6730 0.250482 Accept Ho Plots Section
0.0
3.0
6.0
9.0
12.0
1.0 2.0 3.0 4.0 5.0
Histogram of Q3_7
Q3_7
Cou
nt
103

APPENDIX 5: One-Sample t-Test Report (Hypothesis 4) Descriptive Statistics Section Standard Standard 99% LCL 99% UCL Variable Count Mean Deviation Error of Mean of Mean Q4_8 34 3.705882 1.11544 0.1912964 3.183016 4.228748 T for Confidence Limits = 2.7333 Tests of Assumptions Section Assumption Value Probability Decision(1%) Skewness Normality -0.1771 0.859433 Cannot reject normality Kurtosis Normality -3.7505 0.000176 Reject normality Omnibus Normality 14.0975 0.000868 Reject normality Correlation Coefficient T-Test For Difference Between Mean and Value Section Alternative Prob Decision Power Power Hypothesis T-Value Level (1%) (Alpha=.05) (Alpha=.01) Q4_8<>3 3.6900 0.000804 Reject Ho 0.947455 0.822978 Q4_8<3 3.6900 0.999598 Accept Ho 0.000000 0.000000 Q4_8>3 3.6900 0.000402 Reject Ho 0.975464 0.886899 Nonparametric Tests Section Quantile (Sign) Test Hypothesized Number Number Prob Prob Prob Value Quantile Lower Higher Lower Higher Both 3 0.5 5 17 0.008450 0.997828 0.016901 Wilcoxon Signed-Rank Test for Difference in Medians W Mean Std Dev Number Number Sets Multiplicity Sum Ranks of W of W of Zeros of Ties Factor 429.5 258.5 56.58953 12 2 2706 Approximation Without Approximation With Exact Probability Continuity Correction Continuity Correction Alternative Prob Decision Prob Decision Prob Decision Hypothesis Level (1%) Z-Value Level (1%) Z-Value Level (1%) Median<>3 3.0218 0.002513 Reject Ho 3.0129 0.002587 Reject Ho Median<3 3.0218 0.998743 Accept Ho 3.0306 0.998780 Accept Ho Median>3 3.0218 0.001257 Reject Ho 3.0129 0.001294 Reject Ho Plots Section
0.0
3.0
6.0
9.0
12.0
2.0 2.8 3.5 4.3 5.0
Histogram of Q4_8
Q4_8
Cou
nt
104