Embed Size (px)
Citation preview

1
Factors affecting enhanced video quality preferences
PremNandhini Satgunam, Russell L Woods, P Matthew Bronstad, Eli Peli, Member, IEEE
Abstract - The development of video quality metrics requires methods for measuring perceived video quality. Most such metrics are designed and tested using databases of images degraded by compression and scored using opinion ratings. We studied video quality preferences for enhanced images of normally-sighted participants using the method of paired comparisons with a thorough statistical analysis. Participants (n=40) made pair-wise comparisons of high definition (HD) video clips enhanced at four different levels using a commercially available enhancement device. Perceptual scales were computed with binary logistic regression to estimate preferences for each level and to provide statistical inference of the differences among levels and the impact of other variables. While moderate preference for enhanced videos was found, two unexpected effects were also uncovered: (1) Participants could be broadly classified into two groups: those who preferred enhancement ("Sharp") and those who disliked enhancement ("Smooth"). (2) Enhancement preferences depended on video content, particularly for human faces to be enhanced less. The results suggest that algorithms to evaluate image quality (at least for enhancement) may need to be adjusted or applied differentially based on video content and viewer preferences. The possible impact of similar effects on image quality of compressed video needs to be evaluated.
Keywords: television watching, image enhancement, image quality Contact details: [email protected]
1. Introduction Measuring image quality preferences (i.e., perceived image quality), and proper statistical analyses of such preferences, are essential for developing devices and techniques for image acquisition, image processing, image display and for setting broadcast, storage, and display standards. Computational image quality metrics that attempt to predict the perceived image quality perception are desirable, because direct measurement of perceived image quality tends to be laborious [1, 2] and expensive [3]. Besides using such computational image quality metrics to develop new display systems [4-6], such metrics can also be integrated within a system to adjust image appearance in real time (e.g., by controlling compression, bandwidth or adjusting the amount of enhancement applied).
Most widely used image quality metrics and their associated image databases along with human-subject preference measures are centered on images degraded by compression (though earlier metrics addressed low pass filtering and random noise as the degradations of interest). One inherent assumption of current computational image quality metrics is that all human observers respond in a similar manner, and that differences between responses to the same stimulus reflect measurement noise, both within- and between-subjects. In this paper, we present data that shows substantial between-subject differences in the preference responses to a video enhancement. This suggests that there may not be a (single) standard observer, at least for image enhancement.
A second assumption implied in current computations of human-subject image-quality responses is that responses are independent of image or video content. While some effects of image content have been acknowledged within the image-quality-assessment community, we are not aware of any published reports specifically addressing this issue. Small differences in favored video enhancement between content categories [7], and reductions in the impact of image compression with content desirability [8-10] have been noted. In our study, we found significant content-dependent effects. If this is the case in general, image enhancement and image quality algorithms may need to accommodate such content differences.
Progress in computational image quality metrics requires a solid understanding and accurate measurement of perceived image quality [11]. Sensory scaling measures can be used to determine the preferences of human observers [12-17]. Use of such grading or rating scales is included in the ITU-R BT.500-13 standard recommendation for assessment of perceived television picture quality [18] and have been applied in measuring (mean) opinion scores for various image quality databases. Such ratings can be analyzed to create estimates similar to Thurstone scales [19-21] using custom software [22, 23]. Pair-wise comparisons is an alternative measure that generates reliable and informative data about perceived image quality [24-27]. Pair-wise comparisons are widely used in applied psychology, marketing, food tasting, and advertising research [28-31]. Recently, two statistical methods have been described that produce an outcome very similar to Thurstone scaling while also providing inferential statistics [32, 33]. We [34] compared these two approaches, binary logistic regression [32] and linear regression [33], and found very similar outcomes. The Bradley-Terry-Luce model [35, 36], an alternative to Thurstone scaling, also has been used for paired comparisons [26, 27, 37]. We prefer the binary logistic regression approach [32], as the statistical significance can be obtained with commonly-used statistical software without the
This is the author's version of an article that has been published in this journal. Changes were made to this version by the publisher prior to publication.The final version of record is available at http://dx.doi.org/10.1109/TIP.2013.2282120
Copyright (c) 2013 IEEE. Personal use is permitted. For any other purposes, permission must be obtained from the IEEE by emailing [email protected].

2
need for additional calculations or custom software. In addition, since logistic regression is a widely used statistical method it is well understood and it facilitates the development and testing of models that account for experimental variables and uncontrolled or confounding variables (as illustrated in the Appendix), a capability that is not currently available with the Bradley-Terry-Luce analyses [26, 27, 37]. In our study, we analyzed the pair-wise comparisons of four video enhancement levels using logistic regression models that included potential confounding factors as covariates. The consequences of these findings for video processing (enhancement and compression) and for computational video quality metrics are discussed.
The original purpose of this project was to measure the effect of image enhancement on perceived video quality. However, we found the results, regarding between-observer variability and image content effects to be of general importance and, therefore, we present these as the main emphasis of this paper.
2. Methods 2.1. Procedure Participants viewed two versions of a 30s video clip on two side-by-side HDTVs each connected to a commercially-available video enhancement device that was set to one of four ordinal enhancement levels (Off, Low, Medium or High). Participants indicated their preference for one side over the other (left or right display; two alternative forced choice) using a computer mouse. Participants watched each video clip for the entire duration or stopped the clip as soon as they decided which one they preferred. If a participant had no preference s/he was asked to select left or right at random. Participants practiced the preference task until they understood the procedure. Every subsequent trial proceeded automatically after the participant indicated his or her preference on the previous trial. All 40 participants made 64 comparisons of 64 video clips, which took about an hour (more information available in section 2.5).
Participants were told that the two video clips on the two displays may or may not look different. We did not use the word “enhancement” in our instructions to avoid biasing the participants, as this word has a positive connotation. The participants were unaware that video quality was being assessed; they were told that they were control participants in a study of a rehabilitation device for vision impairment. This created an application-independent environment that is considered desirable for image quality evaluation [38].
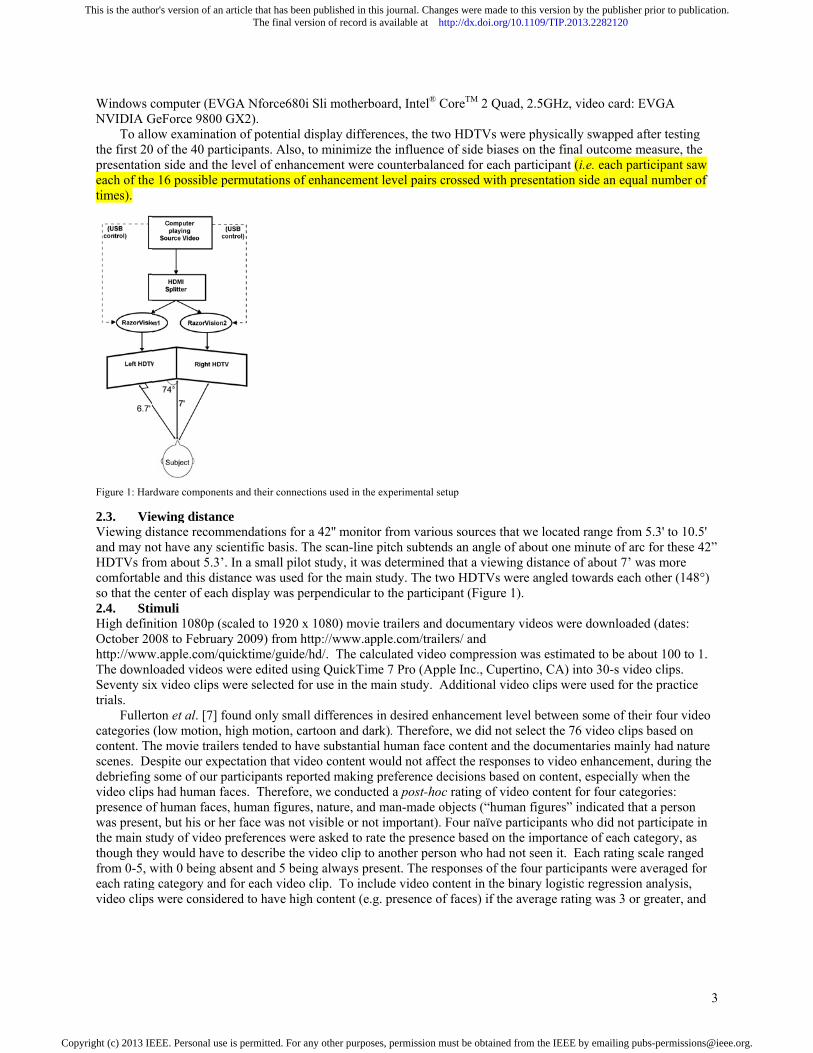
During pilot testing, debriefing of participants made us realize that there may be substantial differences in individual preferences. Some participants claimed to like a more “natural” or “smoother” appearance to video (i.e., enhancement Low or Off). We named this group “Smooth”. Other participants preferred “brighter” or “sharper” (typically, more enhanced) video. We named this group “Sharp”. Individual differences in preferences are potentially important, so combining data from all participants may mask such variability in enhancement preferences, possibly misrepresenting some or all participants. To account for such individual differences in enhancement preferences, upon completion of the 64 video clip comparisons, participants in the main study were debriefed by asking them to describe (in their own words) how they made their preference decisions. Using those descriptions, we classified participants into the two groups identified in the pilot testing. In addition, contrary to our expectations, many participants made comments during the debriefing that indicated that their preferences were affected by video content, so a post-hoc analysis was performed, as described in section 2.4. 2.2. Hardware components Two 42” HDTVs (VIZIO VO42L FHDTV10A, 16:9 aspect ratio) that were manufactured in the same month, had consecutive serial numbers, and were essentially identical in all important respects were used for pair-wise comparisons. There were no appreciable differences in the measured luminance and color properties of these two displays. A video clip was shown on these two HDTVs simultaneously. The source video was duplicated using a HDMI splitter (HSP12 HDMI Splitter-1-in 2-out, ConnectGear, Inc., Fremont, CA) and the video clips were processed independently by two video enhancement devices (PureAV RazorVision, Belkin International, Inc., Los Angeles, CA) that were each connected to one of the HDTVs (Figure 1). Measured luminance variability for the grayscale range 16-235 was within 5% between the two HDTVs with all hardware connected (i.e., PureAV Razor Vision device and HDMI splitter). The Rec.709 specification for digital image data [39] recommends using the range 16 to 235 for HDTVs, rather than 0 – 255. This places “pure black” at code 16 and “pure white” at code 235. Interface codes 0 and 255 are prohibited from video data. 8-bit codes between 1 and 15 provide “footroom” and 236-254 provide “headroom” to accommodate filter undershoots and overshoots. Although the HDTVs were connected to a computer, which would normally use the full 0-255 range, when video clips were displayed by the computer, the appropriate transformations were made to conform to Rec 709. The video signal came from a
This is the author's version of an article that has been published in this journal. Changes were made to this version by the publisher prior to publication.The final version of record is available at http://dx.doi.org/10.1109/TIP.2013.2282120
Copyright (c) 2013 IEEE. Personal use is permitted. For any other purposes, permission must be obtained from the IEEE by emailing [email protected].
Windows cNVIDIA G
To allothe first 20presentatioeach of thetimes).
2.3. VieViewing diand may noHDTVs frocomfortablso that the 2.4. StiHigh definOctober 20http://wwwThe downlSeventy sixtrials.
Fullertcategories content. Thscenes. Dedebriefing video clipspresence owas presenthe main stthough thefrom 0-5, weach ratingvideo clips
Figure 1: Har
computer (EVGGeForce 9800 Gow examinatio
0 of the 40 parton side and the e 16 possible p
ewing distancistance recommot have any sciom about 5.3’. le and this distcenter of each
imuli nition 1080p (sc008 to Februaryw.apple.com/quloaded videos wx video clips w
ton et al. [7] fo(low motion, h
he movie traileespite our expesome of our pa
s had human faf human faces,
nt, but his or hetudy of video py would have twith 0 being abg category and s were consider
rdware component
GA Nforce680GX2). on of potential icipants. Also,level of enhan
ermutations of
e mendations forientific basis. TIn a small pilo
ance was used h display was p
caled to 1920 xy 2009) from huicktime/guidewere edited usi
were selected fo
ound only smalhigh motion, caers tended to haectation that vidarticipants repo
aces. Therefore, human figureer face was notpreferences weto describe thebsent and 5 beifor each videored to have hig
ts and their connec
0i Sli motherbo
display differe to minimize th
ncement were cf enhancement
r a 42'' monitorThe scan-line pot study, it wasfor the main serpendicular to
x 1080) movie http://www.appe/hd/. The calcing QuickTimeor use in the m
ll differences inartoon and darkave substantial deo content woorted making pe, we conducte
es, nature, and mt visible or not ere asked to rate video clip to aing always preso clip. To inclugh content (e.g.
ctions used in the e
oard, Intel® Cor
ences, the two Hhe influence ofcounterbalancelevel pairs cro
r from various pitch subtends s determined thtudy. The two o the participan
trailers and dople.com/trailersculated video coe 7 Pro (Apple
main study. Add
n desired enhak). Therefore, whuman face co
ould not affect preference decied a post-hoc raman-made objeimportant). Foe the presence another personsent. The respoude video conte. presence of fa
experimental setup
reTM 2 Quad, 2
HDTVs were pf side biases oned for each partossed with pres
sources that wan angle of abo
hat a viewing dHDTVs were
nt (Figure 1).
ocumentary vids/ and ompression waInc., Cupertin
ditional video
ancement level we did not seleontent and the the responses
isions based onating of video ects (“human f
our naïve particbased on the im
n who had not sonses of the fouent in the binaraces) if the ave
p
2.5GHz, video
physically swapn the final outcticipant (i.e. eaentation side a
e located rangeout one minute
distance of abouangled toward
deos were dow
as estimated tono, CA) into 30clips were used
between someect the 76 videdocumentariesto video enhan
n content, especontent for foufigures” indicatcipants who didmportance of eseen it. Each raur participants ry logistic regrerage rating wa
card: EVGA
pped after testicome measure, ach participant an equal numbe
e from 5.3' to 1e of arc for thesut 7’ was more
ds each other (1
nloaded (dates
be about 100 t0-s video clips. d for the practi
e of their four vo clips based os mainly had nancement, durincially when th
ur categories: ted that a persod not participateach category, ating scale ranwere averaged
ression analysisas 3 or greater,
3
ing the saw
er of
10.5' se 42” e 148°)
s:
to 1.
ice
video on ature
ng the e
on te in as
nged d for s, and
This is the author's version of an article that has been published in this journal. Changes were made to this version by the publisher prior to publication.The final version of record is available at http://dx.doi.org/10.1109/TIP.2013.2282120
Copyright (c) 2013 IEEE. Personal use is permitted. For any other purposes, permission must be obtained from the IEEE by emailing [email protected].

4
to have low content if the average rating was 2 or less. The number of video clips that were found to have high and low ratings for each video-content category is shown in Table 1.
Table 1. The number of video clips (out of 76) that were rated as having high and low levels of that category of video content. The numbers of video clips for each video category do not sum to 76 because some videos had an average rating between 2 and 3. The remaining video clips (e.g. the 13 in the Face video content category) were not included in the video content analysis on preference (but were used in all other analyses). The Face scale was negatively related to the Nature (Fisher exact test, p<0.001) and Man-made Objects (p=0.004) scales. For example, few video clips had both high Face and high Nature content (n=1) or both low Face and low Nature content (n=7). The Human-figure and Man-made Objects categories were slightly positively related (p=0.06) with 29 video clips having a low rating on both, 9 clips having high rating on both, and 14 clips that were rated differently on the two scales. There were no significant relationships between other video-content category pairs. Because we had not planned an analysis of video content, video content was not balanced between participants and with respect to enhancement comparison pairs (e.g. low-content with Low versus High). There were some participants who did not experience particular enhancement level combinations (e.g. low Man-made Objects with High versus Medium). However, mixed-effects regression analyses are robust to such “missing data”, particularly since, across all participants, there were many comparisons of each enhancement comparison pair for each video content category (the least was 67 for comparisons for high-Man-made, Original versus Medium). 2.5. Image enhancement Video clips were enhanced in real time using the commercially available PureAV RazorVision device (Belkin International, Inc., Los Angeles, CA) that performed an adaptive local contrast enhancement [40, 41]. Briefly, the enhancement algorithm calculated the mean local luminance, which is then subtracted from the original image to produce a high-pass filtered version. The high-pass filtered version is amplified by an enhancement gain control that may be determined by multiple variables, including local mean luminance. To avoid image distortions (e.g., saturation), higher enhancement gain is adaptively applied to pixels in areas with moderate local mean luminance more than to pixels that have extreme luminance (bright or dark). The size of the Gaussian kernel used for local averaging was 9.1% of the screen width and thus spatial frequencies above 0.5 cycles/degree were enhanced in our viewing distance. To illustrate the available enhancement levels, an example still image photographed from one of the video clips at the four enhancement levels is shown in Figure 2.
Figure 2: Illustration of the Original image (upper left) and the three enhancement levels: Low (upper right), Medium (lower left) and High (lower right).
Each HDTV was connected to a separate PureAV RazorVision device to process the video clip independently (Figure 1). RazorVision can be set to one of four enhancement levels (Off, Low, Medium or High). All 16 (4x4) possible combinations of enhancement levels were compared (Table 2). Four of these 16 comparisons were between identical enhancement levels (shaded cells in Table 2), which were included to test for response (side) and display biases. Each of the 16 comparisons was made 4 times for a total of 64 comparisons per participant. A MATLAB program controlled the presentation order of the 64 comparisons, randomly selecting 64 video clips from the pool of
Video-Content Category
High Content (rating ≥3)
Low Content
(rating ≤2) Faces 36 27 Nature 23 49 Human Figures 25 36 Man-made Objects 18 49
This is the author's version of an article that has been published in this journal. Changes were made to this version by the publisher prior to publication.The final version of record is available at http://dx.doi.org/10.1109/TIP.2013.2282120
Copyright (c) 2013 IEEE. Personal use is permitted. For any other purposes, permission must be obtained from the IEEE by emailing [email protected].

5
76 video clips. No video clip was seen twice by any participant. Control of the PureAV RazorVision device was automated to present the desired enhancement level using a Visual C++ program, triggered by the MATLAB program. We used VLC media player (0.9.6) (www.videolan.org) to play the video clips.
2.6. Data analysis Thurstone perceptual scales derived from pair-wise comparisons represent the relative preference for one stimulus (e.g. enhancement level) over each other [19, 20, 31, 34]. By convention, the lowest relative preference score is set to zero, and the remaining relative preference scores are scaled accordingly to preserve the relative distances among the rated items. Thus, this perceptual scale orders the items from least to most preferred. Binary logistic regression has been used to obtain a Thurstone-like perceptual scale along with the statistical significance for the differences between stimuli [32, 34]. Since logistic regression does not account for the correlation between responses (i.e. assumes independence of data), we used crossed-random, mixed-effects logistic regression, as described in detail in the Appendix. In steps described in the Appendix, the final model was constructed:
, (A8) φ ε where aij was the exponent of the logistic function (Eq. A3), βk were coefficients for each stimulus, Xijk, at enhancement level k, βgk were coefficients of indicator variables for the reported-preference Group (Sharp or Smooth) at each enhancement level, βck were coefficients of indicator variables for the video-Content (low or high), βs was a coefficient for the Side (left or right), βd, was a coefficient for the Display (a or b), ϕi were coefficients for each participant, i, and θ j were coefficients for each video, j.
To construct a Thurstone-like perceptual scale, coefficients for each of the enhancement levels obtained were normalized to have a range of 1 unit. Unlike the traditional approach of setting the least preferred level to zero, we anchored this perceptual scale by fixing the preference level for the original video clips (Off condition) to zero, while maintaining the range of 1. Thus, an enhancement level that was preferred less than the original video clip received a negative value. The corresponding significance levels (p-values) of the relative preferences were calculated for the Wald χ2statistic1 for the coefficients, providing comparisons between enhancement levels. 2.7. Participants Forty normally-sighted participants (ages: 20-83y, median age: 32y) consented to participate.
1 Caution needs to be applied when proportions approach 100% or 0% as it can result in the Hauck-Donner effect [34, 42].
Table 2. Example preference matrices for two participants, reported for the 16 possible enhancement-level comparisons, each made 4 times. Participant 1 (left matrix) is representative of the Sharp group and Participant 2 (right matrix) is representative of the Smooth group. The shaded cells on the diagonal represent comparisons of the same enhancement levels applied to the left and right HDTVs. Each cell is read as Left HDTV preferred over the Right HDTV. Hence, for the first row, for Participant 2, Left Off was preferred 3 times (out of 4) over Right Off, Right Low and Right Medium, and was preferred 4 times over or Right High. From the first column for Participant 2, Left Low was preferred once over Right Off. Thus, for participant 2, in total Low was preferred 4 times, out of 8, over Off.
Participant 1 Right Off
Right Low
Right Medium
Right High Participant 2 Right
Off Right Low
Right Medium
Right High
Left Off 1 0 0 0 Left Off 3 3 3 4 Left Low 4 1 0 0 Left Low 1 0 0 3
Left Medium 4 4 1 1 Left Medium 1 1 2 1
Left High 4 4 2 0 Left High 0 4 2 3
This is the author's version of an article that has been published in this journal. Changes were made to this version by the publisher prior to publication.The final version of record is available at http://dx.doi.org/10.1109/TIP.2013.2282120
Copyright (c) 2013 IEEE. Personal use is permitted. For any other purposes, permission must be obtained from the IEEE by emailing [email protected].

6
The study was approved by the Institutional Review Board of the Schepens Eye Research Institute. Preliminary screening of the participants included self-report of ocular health, measures of their visual acuity and contrast sensitivity for a 2.5 degree-high letter target and evaluation of central retinal health using retinal photography (Nidek MP-1, Nidek Technologies, Vigonza, Italy). All the participants had visual acuity of 20/25 or better, letter contrast sensitivity of 1.675 log units or better and steady central fixation with no evidence of retinal defects. 3. Results 3.1. Overall preference results All 40 participants completed the 64 planned trials. Crossed-random, mixed-effects binary logistic regression for all participants’ preferences combined (Equation A52, χ2=26.7, df=3, p<0.001) was performed with all 2560 trials from the 40 participants. When including Display and Side (Equation A63, χ2=31.0, df=5, p<0.001), no bias was found for Display (HDTVa or HDTVb; p=0.46), that is, both Displays were equally preferred, but there was a preference for the right side (p=0.04). The side bias was mainly associated with the condition in which the two stimuli had equal levels of enhancement (n=640 trials, p=0.06), and not when the stimuli had different enhancement levels (n=1920 trials, p=0.18). The same-stimulus comparisons were included to evaluate side bias and were not used to analyze the overall preference data. Our results support prior reports that participants (or at least some of them) were poor in equally dispersing their ‘guess’ responses in a two alternate forced choice task [43, 44]. Overall, Low and Medium were preferred over Off and High (p≤0.024), and Low and Medium (p=0.35) and Off and High (p=0.14) were not significantly different from one another (Equation A6). Figure 3 shows that, overall, there was a non-monotonic response (inverted U-shape) to the video enhancement. As discussed below, such non-monotonic behavior is not expected when compression level is increased. The inverted U-shape obtained here is comparable to studies involving quality judgment for brightness [45], color [46] and stereoscopic depth [47].
Figure 3. Video-enhancement preferences, for all 40 participants, were non-monotonic. Error bars are 95% confidence intervals of the relative preferences derived from the standard errors of the logistic regression coefficients. 3.2. Two types of preferences Participants described their preference criteria for video quality in their own words at a debriefing following the completion of the 64 trials. After reviewing these criteria 39 of the 40, participants could be assigned to two groups. One group of participants (n=12) preferred more clarity and scrutinized the clarity of small details in the image (“Sharp” Group). The other group of participants (n=27) preferred smoother human faces yet they too preferred more clarity for nature scenes (“Smooth” Group). One participant preferred enhancement for neither human faces nor for nature scenes. This participant was not assigned to either group but was retained for the overall data analysis (section 3.1). Binary logistic regression was performed with the participant group (Sharp or Smooth) included (Equation A74, χ2=83.3, df=8, p<0.001) and provided an improvement (χ2=61.3, df=3, p<0.001) over the all-participants model (Equation A6).
Figure 4 shows that the Sharp group most preferred Medium enhancement, which was significantly preferred to Low (p=0.008) and Off (p<0.001) but was not significantly different from High (p=0.51). Off was least preferred, significantly less than Low (p<0.001). The Smooth group most preferred Low enhancement, but it was not
2 Equivalent to equation A8 with βgi = βci = βs = βd = 0. 3 Equivalent to equation A8 with βgi = βci = 0. 4 Equivalent to equation A8 with βci = 0.
This is the author's version of an article that has been published in this journal. Changes were made to this version by the publisher prior to publication.The final version of record is available at http://dx.doi.org/10.1109/TIP.2013.2282120
Copyright (c) 2013 IEEE. Personal use is permitted. For any other purposes, permission must be obtained from the IEEE by emailing [email protected].

7
significantly different from Medium (p=0.64) or Off (p=0.15). High was significantly least preferred (p≤0.025) when compared with the other 3 levels (analysis applied for all images).
Figure 4: Enhancement preferences of the Sharp (n=12 triangles) and Smooth (n=27, circles) groups. Error bars show 95% confidence intervals derived from the standard errors of the logistic regression coefficients. 3.3. Preferences depend on video content Many of the Smooth participants reported preferring enhancement of nature scenes but not of faces. If so, relative preferences should differ based on the video content rating levels (high or low) for the face and nature categories. For example, more enhancement should be preferred for Non-Face (low face content) video clips than for Face (high face content) video clips. Conversely, more enhancement may be preferred for Nature (high nature content) than for Non-Nature (low Nature content) video clips. Post-hoc analyses for each video classification were performed (Equation A8): Face (χ2=135.0, df=11, p<0.001); Nature (χ2=127.9, df=11, p<0.001); Human-figure (χ2=86.8, df=11, p<0.001); and Man-made-Objects (χ2=83.4, df=11, p<0.001) categories. Compared to Equation A7, the inclusion of both Face and Nature video categories (Equation A8) substantially improved the model (χ2>53, df=3, p<0.001), while the inclusion of the Human-figure (χ2=15.2, df=3, p=0.002) and Man-made (χ2=10.1, df=3, p=0.02) categories made smaller improvements in the fit.
Both the Smooth and Sharp groups had a lower preference for enhancement of Face than Non-Face video clips (p<0.001; Figure 5a). Conversely, both groups had a higher preference for enhancement of Nature than Non-Nature video clips (p≤0.001; Figure 5b). Similarly, for both the Human-figure (p ≤ 0.02; Figure 5c) and the Man-made-
Figure 5. Relative preferences by group (Sharp and Smooth) for high and low ratings of video-content categories (a) Faces, (b) Human figures, (c) Nature, and (d) Man-made Objects. The Face video-content category showed a response pattern that differed from the other three video-content categories, with enhancement being less preferred for high-rating (Face) video clips than for low rating (Non-Face) video clips (note the reversal of order of filled and open symbols from top to bottom). Error bars show 95% confidence intervals. To improve clarity, the group symbols are plotted with small offsets.
This is the author's version of an article that has been published in this journal. Changes were made to this version by the publisher prior to publication.The final version of record is available at http://dx.doi.org/10.1109/TIP.2013.2282120
Copyright (c) 2013 IEEE. Personal use is permitted. For any other purposes, permission must be obtained from the IEEE by emailing [email protected].

Objects (p rating thanenhancemewas a majo3.4. Mu
Since the tdecisions, calculated levels, Lowzero on theThe normafor the twoEnhancemParticipantfrom -5.29The Smootpreference group (t =
The Eindicated adistributionthan one (pThe adjustwith no imdistributionmixture moidentified awithin the
Figure 7: Thegroup had higinterquartile rthe frequencydifferent grou
Figure 6: RelParticipant 1
≤ 0.08; Figuren for those withent preference or factor in the ultimodal pref
wo groups, Shwe sought addfor each partic
w, Medium ande relative prefealized coefficieo participants frent Preferencet 1 in Figure 6)
9 to +6 (mean +th group had a greatly varied5.21, p<0.001)P score distribu
a significantly ins rather than tp=0.05). No siged Bayesian in
mprovement notns). There wasodel (Kendall’as having EP shigh-EP score
e box plots for enhgher EP scores. Thrange (IQR) and thy plot. The three sups due to overlap
ative preferences o(Sharp) was +5.49
e 5d) categoriesh a low rating (pattern to the Fenhancement
ference distrib
harp and Smootditional evidenccipant to represd High, were arerence scale). ents obtained fofrom Table 2 ar (EP) score. A
). The possible +1.23). Figure 7
wider range od with image ty). This is consution appearedimproved fit (χtwo Gaussian dgnificant impronformation criteted for models fair agreemens Tau-b = 0.46cores in the lowdistribution.
hancement preferenhe median EP scorhe whiskers represhades correspond of the fitted distri
of Participant 1 (tr9 and that of Partic
s, there was a h(“Non”). That Face video conpreferences of bution of obje
th, were determce of discrete psent his or her orbitrarily assig
or each participre shown in Fighigher EP scorange for the E
7 shows the dif EP scores tha
ype. The Sharp istent with the
d to be tri-modaχ2 = 16.75, df=distributions [4ovement was oerion (BIC) imusing more th
nt between the s65, p=0.002). Iw EP score and
nce (EP) score for re is marked by thsent values within to the three groupbutions.
riangles) and Particcipant 2 (Smooth)
higher preferenall the other th
ntent category sf participants inective scores
mined based onpreference patteoverall enhanc
gned ranks of 1
pant were weiggure 6. The re
ore indicated a pEP scores was stribution of Ean the Sharp grgroup had signlogistic regres
al (Figure 7). M=3, p<0.001) if 49], and two G
observed if mormproved from tw
an three Gausssubjectively-deIt seems that thd middle EP sc
the two subjectivee line within each 1.5 times the IQRs identified by the
cipant 2 (circles) rwas -5.21.
nce for enhancehree video-contsupports the con our study.
n the responseserns using an o
cement preferen, 2 and 3, respe
ghted by the ransulting weightepreference for from -6 to +6,
EP scores for alroup (Figure 7)nificantly highssion analysis (Mixture modelithe data were m
Gaussian distribre than three Gwo to three Gasian distributioefined groups ahe Smooth groucore distributio
ely-defined preferebox. The horizont. The EP score dis
e multimodal fit. O
reported in Table 2
ement of videotent categoriesonclusion that h
s to questions aobjective methonces. The threeectively (Off w
nks and then sued sum was thehigher enhanc the obtained El participants. ), as expected s
her EP scores th(Figure 4). ing using Mixmmodeled with tbutions were si
Gaussian distribaussian distribuns (p=0.26 forand the groupsup included theons, while the S
ence groups showstal extent of each bstribution was tri-mOne column has m
2. The calculated E
o clips with a h had a differenhuman face co
about preferencod. A scalar we enhancementwas normalized
ummed. Exame participant’s
cement levels (eEP scores range
since their han the Smooth
mod 2.1.1 [48]three Gaussianignificantly betbutions were usutions (p<0.001r four Gaussians identified by te participants Sharp group we
s that the Sharp box represents the modal as shown in
members of two
EP scores for
8
higher nt ntent
ce as t d to
mples
e.g. ed
h
] n tter sed. 1), n the
ere all
n
This is the author's version of an article that has been published in this journal. Changes were made to this version by the publisher prior to publication.The final version of record is available at http://dx.doi.org/10.1109/TIP.2013.2282120
Copyright (c) 2013 IEEE. Personal use is permitted. For any other purposes, permission must be obtained from the IEEE by emailing [email protected].

9
3.5. Effect of incomplete comparisons We applied a complete testing design comparing all enhancement levels to each other. The preference analysis method used here also enables determination of the relative preference (i.e., the coefficients) and statistical significance with an incomplete set of comparisons. Reducing the number of comparisons made can reduce the burden and cost of such studies and in some situations comparisons may be limited by other factors. For example, Fullerton and Peli [50] used a very similar device that implemented the same adaptive enhancement algorithm, but only one enhancement level could be displayed at a time. Therefore, only partial comparisons were conducted; Off (no enhancement) was compared to each of the other three enhancement levels but no comparisons were made amongst the three enhancement levels. To determine the effect of using partial comparisons like those used by Fullerton and Peli [50], a subset of data from the present study, that only included the comparisons made between the Off level to the other three levels, was analyzed for all the participants. The logistic-regression results obtained from this partial comparison [34] were different from the results obtained when all comparisons were made (Figure 8) and were similar to the results obtained by Fullerton and Peli [50] with the same constrained comparisons, particularly at the High level of enhancement. Also, the results for this subset of data obtained with logistic regression were different from those obtained using Thurstone scaling, but were consistent with the raw proportion of responses [34].
Figure 8: Enhancement preferences shown for full data (same as Figure 3) and when analyzed using only a partial set of the available comparisons in the current study, those that included the Off level. The results of that comparison are more similar to an earlier study [50] in which the 3 enhancement levels were compared to Off. Error bars are 95% confidence intervals. To improve clarity, the group symbols are plotted with small offsets.
3.6. Other individual differences We found no evidence that image quality preferences are related to conventional vision measures; there was no significant correlation between EP scores and either visual acuity (Spearman ρ39=0.15, p=0.37) or letter contrast sensitivity (ρ39=-0.13, p=0.42). In a normally-sighted population the range of visual acuities and contrast sensitivities are not large, thus reducing the probability of finding a significant correlation. Even so, with increasing age, visual acuity (ρ39=0.37, p=0.02) and letter contrast sensitivity (ρ39=-0.45, p=0.004) became worse, while EP score did not change (ρ39=0.07, p=0.69). Participants in the Sharp group tended to be older than those in the Smooth group (z=1.87, p=0.06) and were more likely to be male (z=1.88, p=0.06), but age and gender were confounded. So, when corrected for age there was no gender difference (z=0.21, p=0.83), and when corrected for gender, there was no relationship between age and group (z=0.80, p=0.42). There were no differences between the groups in visual acuity (z=0.40, p=0.69) or letter contrast sensitivity (z=0.41, p=0.68). We thought that video enhancement preferences might relate to personality, however, a personality questionnaire related to tolerance of blur [51] did not reveal any relations with preferences in a subset of 25 participants to whom the questionnaire was administered. 4. Discussion Our study was designed to measure the subjective preference of normally-sighted observers to motion videos enhanced by a commercially-available device. That objective was achieved. In general, the two lower enhancement levels were preferred, but the highest available level was not liked (Figure 3). Such a non-monotonic response to increasing enhancement is common and expected with image enhancements. However, we also uncovered two important effects: one related to the observers, and the other related to the video content.
We found that observers could be divided into at least two groups; one that liked enhancement over all (Sharp) and one that did not (Smooth) (Figure 4). That grouping of participants based on a debriefing interview was confirmed by an objective analysis (EP Score), which suggested a possible third group with weaker or intermediate preferences (Figure 7). That third group seemed to have been included in the Smooth group by the debriefing
This is the author's version of an article that has been published in this journal. Changes were made to this version by the publisher prior to publication.The final version of record is available at http://dx.doi.org/10.1109/TIP.2013.2282120
Copyright (c) 2013 IEEE. Personal use is permitted. For any other purposes, permission must be obtained from the IEEE by emailing [email protected].

10
classification. As it is possible that the Smooth-Sharp group differences were an artifact or were peculiar to our sample, we reanalyzed the data from two published studies [50, 52] that measured preferences from pair-wise comparisons. In the Fullerton and Peli study [50] that investigated a very similar video-enhancement device, the EP scores ranged from -6 to 6 for their 11 normally-sighted participants and from -3 to 6 for their 20 low-vision participants. The distribution of EP scores was slightly, but not significantly, better fit with two Gaussian distributions than with a single Gaussian (Mixmod 2.1.1: χ2 =6.57, df=3, p=0.17). In the Satgunam et al. study [52] that investigated static-image enhancement with a different enhancement algorithm, the EP scores ranged from -5 to 4.3 for their 24 low-vision participants, and it was best fit with a bi-modal distribution (χ2= 12.12, df=3, p=0.014, over uni-modal, and tri-modal). Thus, our finding that observers can vary widely in their preferences for enhancement was confirmed; the between-observer effect was found to occur with two image enhancement algorithms and in different populations. Whether there are two or three separate groups of preference types is not certain.
It has been suggested that differences between laboratories in video quality measures can be attributed to differences in the experience (with image quality) of the observers in those study samples [18]. All observers were naïve in our study and the other two studies [50, 52]. Our finding that enhanced video quality preferences were not uniform across observers (i.e. that between-observer variance reflects real differences in response) may have important consequences for the evaluation of computational image (video) quality metrics, particularly if there are similar between-observer differences in preference responses to image degradation (e.g. due to compression). Most image degradation studies differ from our image enhancement studies in two important ways: the observer’s task (rating versus paired comparison) and the effect of the intervention on perceived image quality (monotonic versus non-monotonic). The non-monotonic preference that we found for the enhancement (Figures 3 to 6 and 8) is not expected for image compression or other degrading effects. Most such studies and metrics presume that perceived image quality data is normally distributed (e.g. [12-17]), effectively that the between-participant variance is due to measurement noise. To evaluate this, we examined data from three studies of image compression in which the observers reported perceived image quality (“opinion score”). For two studies by one group [13-17] the distributions of relative (difference) opinion scores of the study participants (N=13 to 29) were uni-modal Gaussian distributions, and for a third study [12], between-observer differences were apparent, but there was no obvious shape to the distribution in the responses of the 16 participants.
In a study where noise was added to natural images of tree bark, two participant preference patterns were noted [53]. One group found the noise-added image to be sharp while another found it blurred. The authors attributed this difference to the observers’ specific attention to different image details, as noted in the observers’ introspection. Using synthetic simple images they found that added noise sharpened low spatial frequency content and blurred high spatial frequency content. Two preference patterns were also found in another study [54] where one group of observers found rough textures to be pleasant while another group did not. The authors in that study however were unsure of the presence of two groups, and raised concern about their experimental paradigm.
Future video- and image-quality observer studies may have to consider that there may be at least two different groups of observers. To classify an individual (to Sharp or Smooth), representative sample videos, enhanced by at least two levels, could be shown to observers who indicate their preferences over the original videos. Such a method should easily identify their preference pattern. Alternately, the enhancement could be provided with two settings, one expected to be preferred by each group, and the user can determine their preference by switching between the two settings while watching a sample of videos. If such differences are found with compressed images, the computational metrics will have to be able to address such a dichotomy in the population.
The second effect that we found was that video content affected preferences for video enhancement. When human faces were an important aspect of the content, our participants, independent of their overall preference group (smooth or sharp), preferred less enhancement than when face content was not important (Figure 5). For the other three video-content categories, Nature, Human Figures and Man-made Objects, video enhancement preference patterns were the opposite of that for Faces (Figure 5). This could not be explained by the categorizations for Faces being the inverse of these three categories (it was for Nature, but not for the other two). The reason for this video-content effect is not clear. Discussions with our study participants suggest that the enhancement increased the visibility of facial features (e.g. skin blemishes) in a way that was not “natural” and thus not preferred. This is in agreement with an earlier study [55] that noted the appearance of human skin to be a critical component in the judgment of ‘naturalness’ of color reproduction. A similar preference pattern was reported in a study that examined enhancement of static images for mobile displays [56]. The authors in that study recommended using one preset image enhancement parameter for images human figures (defined by detection of human skin coloration). However,
This is the author's version of an article that has been published in this journal. Changes were made to this version by the publisher prior to publication.The final version of record is available at http://dx.doi.org/10.1109/TIP.2013.2282120
Copyright (c) 2013 IEEE. Personal use is permitted. For any other purposes, permission must be obtained from the IEEE by emailing [email protected].

11
our results indicate different responses between faces and human figures (Figure 5) suggesting that a face detection algorithm would be more appropriate. To further examine whether such content effects were found in image degradation studies, we analyzed the data from such studies [13-15]. There were no images with face content in one image-degradation database [12] and the videos were not available for another [16, 17]. In the LIVE image database [13-15], participants gave higher ratings to images with face content independent of bitrate (p<0.001) and images with man-made-object content received lower ratings when the bitrate was lower (p<0.001). Thus, it seems that image content can affect subjective ratings of image quality when quality is degraded.
In a similar setting, studies of image compression, the “desirability” (how much the participant liked the content of the video) had an impact on video quality responses, with a more desirable (liked) video clip being given a higher rating [8-10]. Kortum and Sullivan [10] suggested that the desirability effect may be related to engagement with the content, in which case attention may be directed to regions such as faces. We did not measure the desirability of our video clips. We do not know how desirability can be determined computationally.
This video-content effect suggests that preferences could be predicted from current computational image quality metrics with some video contents, but not with others. For example, the visibility of minor facial skin blemishes may indicate superior image quality from computational measurements but may not be preferred by human observers, while the increased visibility of details of room furnishings by the same algorithm may be both superior for the computational metric and be preferred by observers. For assessment of video quality, it may be possible to include face detection within a computational metric, then using separate algorithms or parameters for video content with and without predominantly human faces. When using image enhancement, to overcome this preference difference, it may be necessary to apply less enhancement when faces are present or to regions that contain faces. Computational measurements to evaluate enhanced video quality should capture the non-monotonic preferences of human observers.
Most current computational image quality metrics are likely to find an enhanced image to be of lower quality than the original, even though our participants found the low and medium levels of enhancement to be preferred (Figure 3). Image quality metrics should be able to capture such effects as image enhancement could be used to reduce bandwidth or improve quality when bandwidth reduces image quality. 5. Conclusion Video image quality can be effectively tested using side-by-side pair-wise comparisons and scored using logistic regression that enables examination of possibly confounding factors. While an incomplete test design that reduces the test burden may be used and analyzed, care should be taken in such a design, as incomplete comparison sets may adversely affect the results. To avoid the effect of bias it may be important to permit a “no difference” or equal quality response [43, 44]. When choosing videos for image quality studies and analyzing video quality, video content should be considered, especially the presence or absence of human faces. Videos used in observer study or computational study should match the anticipated images to be used in an application. Between-participant differences may reflect real individual differences in perceived image quality. If between-observer effects or content effects are found they need to be addressed in computational image quality metrics. While we studied preference for video enhancement, similar considerations and tools may need to be applied to image quality evaluation in the field of image compression. It is possible that not all our findings will be replicated in studies of perceived quality or preference for compressed imagery. Appendix
Participant ID Trial Off Low Medium High Side Display Group e 1 1 1 0 -1 0 1 -1 0 0 1 2 -1 0 1 0 0 1 0 1
…
…
…
…
…
…
…
…
…
…
1 64 0 0 1 -1 0 -1 0 1 2 1 0 1 0 -1 1 -1 1 0
…
…
…
…
…
…
…
…
…
…
40 63 -1 1 0 0 1 -1 1 1 40 64 1 -1 0 1 1 1 0
This is the author's version of an article that has been published in this journal. Changes were made to this version by the publisher prior to publication.The final version of record is available at http://dx.doi.org/10.1109/TIP.2013.2282120
Copyright (c) 2013 IEEE. Personal use is permitted. For any other purposes, permission must be obtained from the IEEE by emailing [email protected].

12
For the binary logistic regression analysis, each paired comparison was entered in a logistic regression matrix (Table A1), where for each participant, i, for each video, j, of stimuli k=r and k=s, the preferred stimulus (column), Xijr, was allocated +1 and the non-preferred stimulus, Xijs, was allocated -1: if Xijr Xijs then Xijr = +1 and Xijs = -1, (A1)
where is a left preferred indicator. All other row entries are allocated zeros. As described by Lipovetsky and Conklin [32], an identity vector (dependent variable column), ei, was randomly assigned to a value of 0 or 1. When ei = 0 (“false”), the signs of the responses for that comparison are reversed, such that:
if Xijr Xijs then Xijr = -1 and Xijs = +1, (A2)
The outcome of the analysis is independent of the proportion of eij=0 comparisons, so long as 0 < p(eij=0) <1, where p(eij=0) is the proportion of comparisons with eij=0. The binary logistic regression involved fitting the equation:
, (A3)
where pij was the probability of the response (for each combination of participant and video, there was only one comparison of two enhancement levels, i.e. each participant only saw one video once). For the model, the responses to one stimulus (e.g., Low enhancement) were fixed by not including it, and the model was forced through the origin (no intercept term). Thus, to compare four stimuli, the term aij in equation A3 was defined as:
, (A4)
where βk, were the coefficients for each enhancement level (stimulus), Xijk, and εij was the residual error. Those unknown parameters βk were estimated by a maximum likelihood procedure, common to generalized linear models, with SPSS 11.5.0 (SPSS, Chicago, IL) and Stata/IC 12.1 for Mac (StataCorp, College Station, TX). The computed coefficients thus represented the relative preferences of the included stimuli with the excluded stimulus having a relative preference of zero. The statistical significance for stimulus k reported in each analysis was for the difference between the excluded stimulus and stimulus k. When n stimuli were compared, to obtain statistical significance for all n(n-1)/2 comparisons, the analysis was performed n-1 times, with a different stimulus kept constant (excluded) from each analysis. In our case of four stimuli the analysis was conducted three times.
Logistic regression presumes independence between data. However, our data includes repeated measures from each participant and for each video. No participant saw all videos, and the comparison pair of enhancements applied to each video varied between participants. This is known as a crossed-random experimental design. Therefore, we fit a crossed-random, mixed-effects logistic regression:
, (A5)
Where ϕi were coefficients for each participant and θ j were coefficients for each video. The side on which enhancement was presented could influence responses, as some participants may have an inherent response bias [43, 44] to choose the display on the left or right side and the two HDTVs, while perceived to be virtually identical, cannot be guaranteed to be completely identical in every respect and so could have influenced participants’
f
f
f
pij = f aij( )= eaij
eaij +1
=1
1+ e−aij
aij = β1Xij1 + β2Xij2 + β3Xij3 +εij
aij = β1Xij1 + β2Xij2 + β3Xij3
+ϕ i +ϑ j +εij
Table A1. Illustration of the logistic regression matrix for all 64 trials for all 40 participants and used for the binary logistic regression analyses. Stimuli (enhancement levels) not presented during the trial are indicated by 0. Presented stimuli were allocated 1 or -1 depending on the reported preference and the identity vector (e), as described in the text. The preferred stimulus in each trial is shown in bold in each row.
This is the author's version of an article that has been published in this journal. Changes were made to this version by the publisher prior to publication.The final version of record is available at http://dx.doi.org/10.1109/TIP.2013.2282120
Copyright (c) 2013 IEEE. Personal use is permitted. For any other purposes, permission must be obtained from the IEEE by emailing [email protected].

13
responses. To measure these effects, Side and Display were included as covariate factors in the model. With the responses, Xsi, for Side and, Xdi, for Display, term aij became:
, (A6)
When the preferred stimulus was on the right monitor, Xsi = 1, and when on the left, Xsi = 0, except for ei = 0
(“false”) when the assigned value of Xsi was reversed. Similarly, when the preferred stimulus was on HDTVa, Xdi = 1, and when on HDTVb, Xdi = 0, except for ei = 0 (“false”) when the assigned value of Xdi was reversed.
To examine between-group differences (between participants in the Sharp and Smooth groups), an indicator variable, g, was used, and the term aij became:
, (A7)
In this model, for simplicity of interpretation, the original video clip (Off condition) was excluded. For participants in the Smooth group, g = 0 and for the Sharp group, g = 1. Thus, for the Smooth group, gXji = 0, and the perceptual scale was defined by the first three terms in Equation A7 only (i.e. those that did not include g). The statistical significance of differences between the two groups in responses to stimulus j was then found using the coefficient βgj.
Equation A7 can also be written as:
, (A7a)
To also examine the effects of video content, video-content category (as described in section 2.4) an indicator
variable, c, was used, and the term aij became:
, (A8)
For each of the four video categories, when the video clip had a high rating on that scale (e.g., Face ≥3) video
clips were coded with c =1 and when the video clip had a low rating (e.g., Face ≤2), the video clip was coded with c =0. Statistical significance for the differences between the high and low content levels in responses to stimulus j were obtained from the coefficient βcj. A more complex model that included an interaction between subjective group and video content was also investigated, but it was found to provide no improvement in the model (Wald χ2≤5.7, df=3, p≥0.13). Acknowledgements Supported in part by NIH grants EY05957, EY16093 and EY019100, and a grant from Analog Devices Inc.
aij = β1Xij1 + β2Xij2 + β3Xij3
+βsXs + βdXd +ϕ i +ϑ j +εij
aij = β1Xij1 + β2Xij2 + β3Xij3
+βg1Xij1 + βg2Xij2 + βg3Xij3
+βsXs + βd Xd +ϕ i +ϑ j +εij
aij = β1 + βg1( )Xij1
+ β2 + βg2( )Xij2
+ β3 + βg3( )Xij3
+βsXs + βdXd +ϕ i +ϑ j +εij
aij = β1 + βg1 + βc1( )Xij1
+ β2 + βg2 + βc2( )Xij2
+ β3 + βg3 + βc3( )Xij3
+βsXs + βdXd +ϕ i +ϑ j +εij
This is the author's version of an article that has been published in this journal. Changes were made to this version by the publisher prior to publication.The final version of record is available at http://dx.doi.org/10.1109/TIP.2013.2282120
Copyright (c) 2013 IEEE. Personal use is permitted. For any other purposes, permission must be obtained from the IEEE by emailing [email protected].

14
References [1] P. G. J. Barten, Contrast Sensitivity of the Human Eye and its Effects on Image Quality. Bellingham, WA:
SPIE-The International Society for Optical Engineering, 1999. [2] M. Miyahara, K. Kotani, and V. R. Algazi, "Objective picture quality scale (PQS) for image coding," IEEE
Trans. Commun., vol. 46, pp. 1215-1226, Sept 1998. [3] A. C. Bovik, The Essential Guide to Video Processing. Burlington, MA: Academic Press, 2009. [4] J. A. J. Roufs, "Brightness contrast and sharpness, interactive factors in perceptual image quality," in
Human Vision, Visual Processing, and Digital Display. vol. 1077, B. E. Rogowitz, Ed. Los Angeles, CA: SPIE, 1989, pp. 66-72.
[5] P. G. J. Barten, "Evaluation of subjective image quality with the square-root integral method," Journal of the Optical Society of America A: Optics, Image Science and Vision, vol. 7, pp. 2024-2031, 1990.
[6] J. Lubin, "A visual discrimination model for imaging system design and evaluation," in Vision Models for Target Detection, E. Peli, Ed. Singapore: World Scientific, 1995, pp. 245-283.
[7] M. Fullerton, R. L. Woods, F. A. Vera-Diaz, and E. Peli, "Measuring perceived video quality of MPEG enhancement by people with impaired vision," J. Opt. Soc. Am. A Opt. Image Sci. Vis., vol. 24, pp. B174-B187, Dec 2007.
[8] P. Kortum and M. Sullivan, "Content is king: The effect of content on the perception of video quality," in Proceedings of the Human Factors and Ergonomics Society 48th Annual Meeting 2004, pp. 1910-1914.
[9] M. Sullivan, J. Pratt, and P. Kortum, "Practical issues in subjective video quality evaluation: human factors vs. psychophysical image quality evaluation," in Proceeding of the 1st international conference on Designing interactive user experiences for TV and video, Silicon Valley, California, USA, 2008, pp. 1-4.
[10] P. Kortum and M. Sullivan, "The effect of content desirability on subjective video quality ratings," Hum. Factors, vol. 52, pp. 105-118, Feb 2010.
[11] Z. Wang and A. C. Bovik, Modern Image Quality Assessment. Austin, TX: Morgan & Claypool Publishers, 2006.
[12] Z. M. Parvez Sazzad, Y. Kawayoke, and Y. Horita. (Accessed 2012, Dec 28). Image quality evaluation database [Online]. Available: http://mict.eng.u-toyama.ac.jp/database_toyama/.
[13] H. R. Sheikh, Z. Wang, L. Cormack, and A. C. Bovik. (Accessed 2012, Dec 28). LIVE Image Quality Assessment Database Release 2 [Online]. Available: http://live.ece.utexas.edu/research/quality.
[14] Z. Wang, A. C. Bovik, H. R. Sheikh, and E. P. Simoncelli, "Image quality assessment: from error visibility to structural similarity," IEEE Trans. Image Process., vol. 13, pp. 600-612, Apr 2004.
[15] H. R. Sheikh, M. F. Sabir, and A. C. Bovik, "A statistical evaluation of recent full reference image quality assessment algorithms," IEEE Trans. Image Process., vol. 15, pp. 3440-3451, Nov 2006.
[16] K. Seshadrinathan, R. Soundararajan, A. C. Bovik, and L. K. Cormack, "A subjective study to evaluate video quality assessment algorithms," in Proceedings of the SPIE Human Vision and Electronic Imaging XV, 2010, p. 75270H.
[17] Seshadrinathan, Soundararajan, A. C. Bovik, and L. K. Cormack, "Study of subjective and objective quality assessment of video," IEEE Trans. Image Process., vol. 19, pp. 1427-1441, June 2010.
[18] Radiocommunication Sector of ITU, "Recommendation ITU-R BT.500-13: Methodology for the Subjective Assessment of the Quality of Television Pictures," International Telecommunications Union, Geneva, Switzerland Jan 2012.
[19] L. L. Thurstone, "A law of comparative judgment," Psychol. Rev., vol. 34, pp. 273-286, 1927. [20] L. L. Thurstone, "Psychophysical analysis," The American Journal of Psychology, vol. 38, pp. 368-389,
1927. [21] M. C. Gacula, Design and Analysis of Sensory Optimization. Trumbull, Connecticut: Food & Nutrition
Press, Inc., 1993. [22] M. C. Boschman, "ThurCatD: a tool for analyzing ratings on an ordinal category scale," Behav. Res.
Methods Instrum. Comput., vol. 32, pp. 379-388, Aug 2000. [23] M. C. Boschman, "DifScal: a tool for analyzing difference ratings on an ordinal category scale," Behav.
Res. Methods Instrum. Comput., vol. 33, pp. 10-20, Feb 2001. [24] J. E. Farrell, "Image quality evaluation," in Colour Imaging: Vision and Technology, L. W. MacDonald and
M. R. Luo, Eds. New York: John Wiley & Sons Ltd., 1999, pp. 285-313.
This is the author's version of an article that has been published in this journal. Changes were made to this version by the publisher prior to publication.The final version of record is available at http://dx.doi.org/10.1109/TIP.2013.2282120
Copyright (c) 2013 IEEE. Personal use is permitted. For any other purposes, permission must be obtained from the IEEE by emailing [email protected].

15
[25] D. A. Silverstein and J. E. Farrell, "Efficient method for paired comparison," J. Electron. Imaging, vol. 10, pp. 394-398, Apr 2001.
[26] F. Wickelmaier and S. Choisel, "Modeling within-pair order effects in paired-comparison judgments," in Proceedings of the 22nd Annual Meeting of the International Society for Psychophysics, St. Albans, UK, 2006, pp. 89-94.
[27] J.-S. Lee, F. De Simone, and T. Ebrahimi, "Subjective quality evaluation via paired comparison: application to scalable video coding," IEEE Transactions on Multimedia, vol. 13, pp. 882-893, Oct 2011.
[28] C. H. Coombs, "Thurstone's measurement of social values revisited forty years later," J. Pers. Soc. Psychol., vol. 6, pp. 85-91, 1967.
[29] Y. K. Kwan, W. C. Ip, and P. Kwan, "A crime index with Thurstone's scaling of crime severity," Journal of Criminal Justice, vol. 28, pp. 237-244, 2000.
[30] P. E. Green, D. S. Tull, and G. S. Albaum, Research for Marketing Decisions, 5th ed. Englewood Cliffs, N.J.: Prentice Hall, 1988.
[31] M. C. Gacula and J. Singh, Statistical Methods in Food and Consumer Research. Orlando, FL: Academic Press, 1984.
[32] S. Lipovetsky and M. W. Conklin, "Thurstone scaling via binary response regression," Statistical Methodology, vol. 1, pp. 93-104, 2004.
[33] R. Rajae-Joordens and J. Engel, "Paired comparisons in visual perception studies using small sample sizes," Displays, vol. 26, pp. 1-7, January 2005.
[34] R. L. Woods, P. Satgunam, P. M. Bronstad, and E. Peli, "Statistical analysis of subjective preferences for video enhancement," in Human Vision and Electronic Imaging XV, Proceedings of SPIE -IS&T Electronic Imaging, San Jose, CA, 2010, pp. 75270E1-75270E10.
[35] R. A. Bradley and M. E. Terry, "Rank analysis of incomplete block designs, I. the method of paired comparisons," Biometrika, vol. 39, pp. 324-345, 1952.
[36] R. D. Luce, Individual Choice Behavior - A Theoretical Analysis. New York: John Wiley & Sons, 1959. [37] F. Wickelmaier and C. Schmid, "A Matlab function to estimate choice model parameters from paired-
comparison data," Behav. Res. Methods Instrum. Comput., vol. 36, pp. 29-40, Feb 2004. [38] P. G. Engeldrum, "A theory of image quality: The image of quality circle," Journal of Imaging Science and
Technology, vol. 48, pp. 446-456, Sept/Oct 2004 [39] C. A. Poynton, Digital Video and HDTV Algorithms and Interfaces. San Francisco, CA: Morgan
Kaufmann, 2003. [40] E. Peli and T. Peli, "Image enhancement for the visually impaired," Opt. Eng., vol. 23, pp. 47-51, Jan/Feb
1984. [41] R. G. Hier, G. W. Schmidt, R. S. Miller, and S. E. DeForest, "Real-time locally adaptive contrast
enhancement: A practical key to overcoming display and human-visual-system limitations," in Society for Information Display International Symposium: Digest of Technical Papers, Seattle, WA, 1993, pp. 491-494.
[42] W. W. Hauck and A. Donner, "Wald's test as applied to hypotheses in logit analysis," Journal of the American Statistical Association, vol. 72, pp. 851-853, 1977.
[43] M. A. Garcia-Perez, "Denoising forced-choice detection data," British Journal of Mathematical and Statistical Psychology, vol. 63, pp. 75-100, Dec 2010.
[44] M. A. García-Pérez and R. Alcalá-Quintana, "The difference model with guessing explains interval bias in two-alternative forced-choice detection procedures," Journal of Sensory Studies, vol. 25, pp. 876-898, 2010.
[45] J. A. J. Roufs, V. J. Koselka, and A. A. van Tongeren, "Global brightness contrast and the effect on perceptual image quality," in Proceedings of the SPIE, Human Vision, Visual Processing, and Digital Display V, May 1, 1994, 1994, pp. 80-89.
[46] T. J. W. M. Janssen and F. J. J. Blommaert, "Image quality semantics," Journal of Imaging Science and Technology, vol. 41, pp. 555-560,
[47] W. A. Ijsselsteijn, H. De Ridder, and J. Vliegen, "Subjective evaluation of stereoscopic images: effects of camera parameters and display duration," IEEE Trans. Circ. Syst. Vid. Technol., vol. 10, pp. 225-233,
[48] C. Biernacki, G. Celeux, G. Govaert, and F. Langrognet, "Model-based cluster and discriminant analysis with the MIXMOD software," Computational Statistics & Data Analysis, vol. 51, pp. 587-600, 2006.
[49] A. Agresti, An Introduction to Categorical Data Analysis. New York: John Wiley & Sons, Inc., 1996.
This is the author's version of an article that has been published in this journal. Changes were made to this version by the publisher prior to publication.The final version of record is available at http://dx.doi.org/10.1109/TIP.2013.2282120
Copyright (c) 2013 IEEE. Personal use is permitted. For any other purposes, permission must be obtained from the IEEE by emailing [email protected].

16
[50] M. Fullerton and E. Peli, "Digital enhancement of television signals for people with visual impairments: Evaluation of a consumer product," J. Soc. Inf. Display, vol. 16, pp. 493-500, 2008.
[51] R. L. Woods, C. R. Colvin, F. A. Vera-Diaz, and E. Peli, "A relationship between tolerance of blur and personality," Invest. Ophthalmol. Vis. Sci., vol. 51, pp. 6077-6082, May 2010.
[52] P. Satgunam, R. L. Woods, G. Luo, P. M. Bronstad, Z. Reynolds, C. Ramachandra, B. W. Mel, and E. Peli, "Effects of contour enhancement on low-vision preference and visual search," Optom. Vis. Sci., vol. 89, pp. E1364-E1373, 2012.
[53] T. Kurihara, N. Aoki, and H. Kobayashi, "Analysis of sharpness increase by image noise," in Human Vision and Electronic Imaging XIV, Proceedings of SPIE-IS&T Electronic Imaging, 2009, pp. 7240141-7240149.
[54] R. van Egmond, P. Lemmens, T. N. Pappas, and H. de Ridder, "Roughness in sound and vision," in Proceedings of the SPIE, Human Vision and Electronic Imaging XIV, 2009, pp. 1-12.
[55] S. N. Yendrikhovskij, F. J. J. Blommaert, and H. de Ridder, "Color reproduction and the naturalness constraint," Color Research & Application, vol. 24, pp. 52-67,
[56] Y.-G. Lee, Y.-J. Kang, H.-E. Kim, K.-H. Kim, and C.-W. Kim, "Content dependent selection of image enhancement parameters for mobile displays," in Proceedings of the SPIE, Color Imaging XVI: Displaying, Processing, Hardcopy, and Applications, January 25, 2011, 2011, pp. 1-11.
This is the author's version of an article that has been published in this journal. Changes were made to this version by the publisher prior to publication.The final version of record is available at http://dx.doi.org/10.1109/TIP.2013.2282120
Copyright (c) 2013 IEEE. Personal use is permitted. For any other purposes, permission must be obtained from the IEEE by emailing [email protected].