Embed Size (px)
Citation preview

Performance Summary as on August 31 2016
Scheme Name
SFIN
NAV BM NAV BM NAV BM NAV BM NAV BM
Apex Equity Fund
ULIF 009 20/01/10 SUD‐LA‐EQ1 142
Equity Fund
ULIF 002 25/02/09 SUD‐LI‐EQ1 142
Individual Pension Fund ‐ Apex Equity
ULIF 013 20/01/10 SUD‐PA‐EQ1 142
Individual Pension Fund ‐ Equity
ULIF 005 31/03/09 SUD‐PI‐EQ1 142
Apex Growth Fund
ULIF 010 20/01/10 SUD‐LA‐GR1 142
Growth Fund
ULIF 003 25/02/09 SUD‐LI‐GR1 142
Individual Pension Fund ‐ Apex Growth
ULIF 014 20/01/10 SUD‐PA‐GR1 142
Individual Pension Fund ‐ Growth
ULIF 006 31/03/09 SUD‐PI‐GR1 142
Apex Balanced Fund
ULIF 011 20/01/10 SUD‐LA‐BL1 142
Balanced Fund
ULIF 001 18/02/09 SUD‐LI‐BL1 142
Absolute CAGR (Annualised)
18/02/2009 25.02 21.84 12.33% 9.41%
7.80% 17.32%
8.09% 12.28% 10.91%
25/02/2009 48.03 32.63 25.52%
25/02/2009 144.71 30.62 21.32% 10.78%
20/01/2010 528.24 17.99 26.16% 10.49% 5.63%
9.02% 5.73%
10.09%
10.49% 6.07%
5.51%
7.34%
16.35%
15.76%
31/03/2009 20.98 27.70 25.05%
20.26%
10.09% 5.49% 17.54%
7.34% 15.76%
10.93% 7.34%18.30 22.51% 11.71% 7.93% 17.35%
5.51%
14.71%
31/03/2009 21.01 24.40 20.11%
20/01/2010 572.63 9.57%
20/01/2010 437.80 18.11 17.82% 11.56%16.67% 9.24% 15.67%
15.15% 12.77%
15.96%
11.29% 8.75%
10.08%
1 Year6 Month
11.54%
10.09%
10.93%
10.09%
10.93%
25.89% 9.04% 5.06%
21.18% 10.95% 7.00%
10.09%
10.93%
8.30%
8.57%
8.69%
2 Year (A) 3 Year Since Inception (A)
10.92%
15.89%17.83% 16.97%
9.15%
9.11%
16.35%
15.76%
9.39%
9.28%18.29%
5.51%
13.67%
16.35%
16.21%
5.51%
7.34%
17.65%
Inception dateAUM (Rs.
Cr)
NAV
(Rs.)
13.16%
23.43%
20.26%
23.43%
20.26%
23.43%
23.43%
20.26%
14.42%
14.83%
13.63%
8.30%
8.57%
20/01/2010 34.59 17.84
20/01/2010 36.73 17.81
16.35%
15.76%
14.75%
1
2
3
4
5
6
7
8
9
10
InveSTAR
Trademark used under licence from respective owners.
Individual Pension Fund ‐ Apex Balanced
ULIF 015 20/01/10 SUD‐PA‐BL1 142
Individual Pension Fund ‐ Balanced
ULIF 007 31/03/09 SUD‐PI‐BL1 142
Express Balanced Fund
ULIF 017 29/04/11 SUD‐LX‐BL1 142
Apex Bond Fund
ULIF 012 20/01/10 SUD‐LA‐BN1 142
Bond Fund
ULIF 004 25/02/09 SUD‐LI‐BN1 142
Individual Pension Fund ‐ Apex Bond
ULIF 016 20/01/10 SUD‐PA‐BN1 142
Individual Pension Fund ‐ Bond
ULIF 008 31/03/09 SUD‐PI‐BN1 142
Discontinued Policies Fund
ULIF 018 03/06/11 SUD‐UL‐DP1 142
Bluechip Equity Fund
ULIF 019 11/12/13 SUD‐LI‐EQ2 142
Growth Plus Fund
ULIF 023 11/12/13 SUD‐LI‐GR2 142
Balanced Plus Fund
ULIF 024 11/12/13 SUD‐LI‐BL2 142
Income Fund
ULIF 020 11/12/13 SUD‐LI‐BN2 142
Group Debt Fund
ULGF 003 20/03/15 SUD‐GN‐BN1 142
Total AUM 3102.17
10.97% 11.36% NA NA 11.19% 11.39%22 29/1/2014 74.30 13.16 7.99% 7.40% 10.79% 11.15%
25/02/2009 9.91 17.76 7.83% 10.81% 10.85% 10.85% 8.01%11.55% 11.56%
31/03/2009 11.96 21.15 13.50% 10.74% 8.90% 10.61%
31/03/2009 3.93 17.61 7.21% 10.36% 10.61% 10.65% 7.92%
10.08%
11.55%
13.67%13.07%
7.99% 10.94% 11.36% 8.45%11.35% 11.55% 11.20%
8.79% 7.99%9.03%4.83% 9.02%
8.37% 15.15% 9.13%
11.22% 11.12% 8.21%
10.24% 9.31% 13.23% 9.49%
11.29%
11.35%
11.54%13.16%
8.75%
11.55%
10.08%
14.75%10.98%
11.35%
03/06/2011 454.90 14.50 3.98% 7.84% 8.29%
29/04/2011 72.33 16.24 12.61%
20/01/2010 17.92 17.83 18.21%
20/01/2010 5.42 16.85 8.26%
8.59%
7.60%
13.16%
7.60%
7.60%
16.67%
7.60%
8.01%
10.70%
8.10%
14
15
16
8.44%
8.69%
8.44%
9.29%
11.35%
11.54%
11.17%
20/01/2010 197.53 17.10
17
18
11.56%
13.67%
9.42%
11.56%
11.56%
11
12
13
NA 14.76% 14.15%
20 29/1/2014 117.96 14.16 21.50% 20.26% 10.73% 10.93% 7.48% 7.34% NA NA 14.37% 14.30%
19 29/1/2014 121.38 14.28 25.31%
13.16% 10.65% 11.54%
6.44% 5.71% NA22.28% 10.81% 10.01%
9.18% 10.08% NA NA 13.04% 13.06%
23 6/10/2015 10.05 10.99 8.56% 8.33% NA NA NA NA NA NA 9.89% 9.52%
21 29/1/2014 134.84 13.73 13.45%
Trademark used under licence from respective owners.

142L003V01 142L004V01 142L008V01 142L028V01 142L010V01 142L018V01 142L019V01 142L020V01 142L024V01 142L025V01 142L026V01 142L021V01 142L041V01 142L042V01 142L049V01
Fund Name (SFIN)
Apex Equity Fund
ULIF 009 20/01/10 SUD‐LA‐EQ1 142
Equity Fund
ULIF 002 25/02/09 SUD‐LI‐EQ1 142
Individual Pension Fund ‐ Apex Equity
ULIF 013 20/01/10 SUD‐PA‐EQ1 142
Individual Pension Fund ‐ Equity
ULIF 005 31/03/09 SUD‐PI‐EQ1 142
Bluechip Equity Fund
ULIF 019 11/12/13 SUD‐LI‐EQ2 142
Apex Growth Fund
ULIF 010 20/01/10 SUD‐LA‐GR1 142
Growth Fund
ULIF 003 25/02/09 SUD‐LI‐GR1 142
Individual Pension Fund ‐ Apex Growth
ULIF 014 20/01/10 SUD‐PA‐GR1 142
Individual Pension Fund ‐ Growth
ULIF 006 31/03/09 SUD‐PI‐GR1 142
Growth Plus Fund
ULIF 023 11/12/13 SUD‐LI‐GR2 142
SUD Life
Group
Retirement
BALANCED FUND
GROWTH FUND
10
EQUITY FUND
5
Dhan
Suraksha Plus
Wealth Builder
Plan
New Dhruv
Tara
Dhan Suraksha
Express
Dhruv Tara
Product
New Dhan
Suraksha
New Dhan
Suraksha
Premium
Dhan Suraksha
3
Dhan
Suraksha
Premium 3
Prabhat Tara
3
New Prabhat
Tara
6
7
8
9
Mapping of Funds and Products (Funds representing the underlying Products)
1
2
3
4
Product Name (UIN)
Dhan SurakshaDhan Suraksha
PremiumPrabhat Tara
Trademark used under licence from respective owners.
Apex Balanced Fund
ULIF 011 20/01/10 SUD‐LA‐BL1 142
Balanced Fund
ULIF 001 18/02/09 SUD‐LI‐BL1 142
Individual Pension Fund ‐ Apex Balanced
ULIF 015 20/01/10 SUD‐PA‐BL1 142
Individual Pension Fund ‐ Balanced
ULIF 007 31/03/09 SUD‐PI‐BL1 142
Express Balanced Fund
ULIF 017 29/04/11 SUD‐LX‐BL1 142
Balance Plus Fund
ULIF 024 11/12/13 SUD‐LI‐BL2 142
Apex Bond Fund
ULIF 012 20/01/10 SUD‐LA‐BN1 142
Bond Fund
ULIF 004 25/02/09 SUD‐LI‐BN1 142
Individual Pension Fund ‐ Apex Bond
ULIF 016 20/01/10 SUD‐PA‐BN1 142
Individual Pension Fund ‐ Bond
ULIF 008 31/03/09 SUD‐PI‐BN1 142
Income Fund
ULIF 020 11/12/13 SUD‐LI‐BN2 142
Group Debt Fund
ULGF 003 20/03/15 SUD‐GN‐BN1 142
Discontinued Life Policies Fund
ULIF 018 03/06/11 SUD‐UL‐DP1 142
21
17
GROUP UNIT LINKED FUND
DISCONTINUED FUND
BOND FUND
16
19
11
12
20
22
13
14
15
17
18
Trademark used under licence from respective owners.
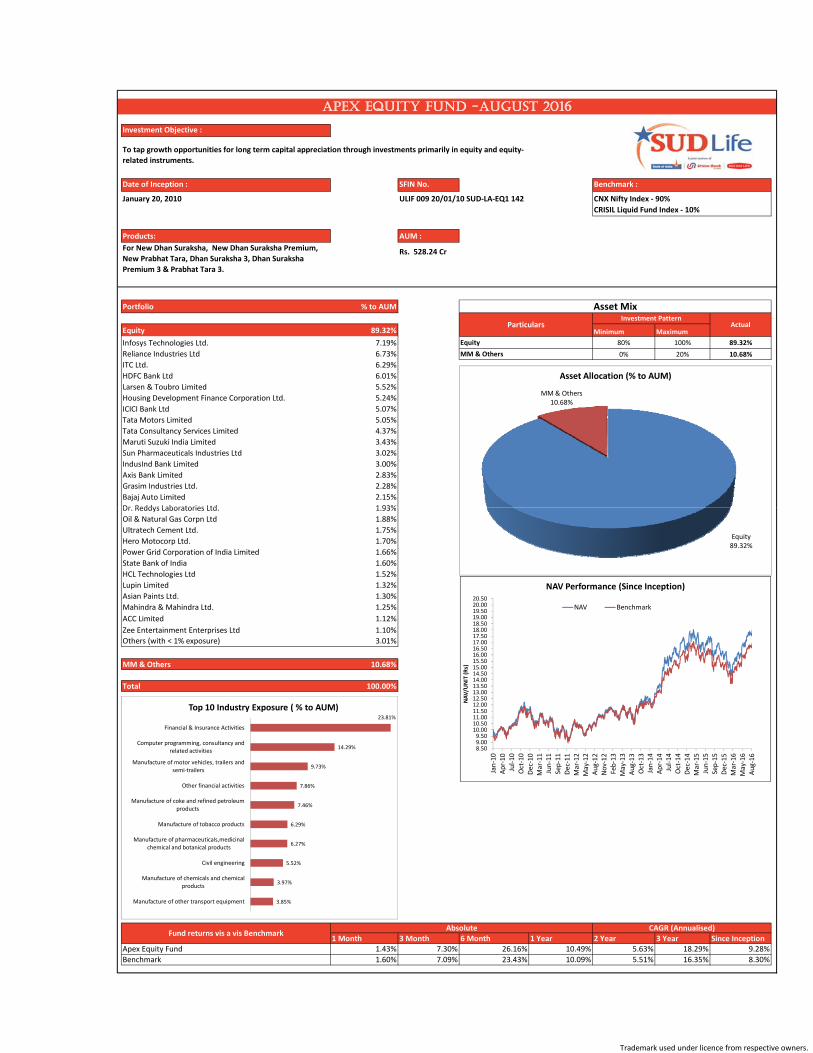
Investment Objective :
Date of Inception : SFIN No.
January 20, 2010 ULIF 009 20/01/10 SUD‐LA‐EQ1 142
Products: AUM :
Rs. 528.24 Cr
Portfolio % to AUM
`
Equity 89.32% Minimum Maximum
Infosys Technologies Ltd. 7.19% 80% 100% 89.32%
Reliance Industries Ltd 6.73% 0% 20% 10.68%
ITC Ltd. 6.29%
HDFC Bank Ltd 6.01%
Larsen & Toubro Limited 5.52%
Housing Development Finance Corporation Ltd. 5.24%
ICICI Bank Ltd 5.07%
Tata Motors Limited 5.05%
Tata Consultancy Services Limited 4.37%
Maruti Suzuki India Limited 3.43%
Sun Pharmaceuticals Industries Ltd 3.02%
IndusInd Bank Limited 3.00%
Axis Bank Limited 2.83%
Grasim Industries Ltd. 2.28%
Bajaj Auto Limited 2.15%
Dr Reddys Laboratories Ltd 1 93%
To tap growth opportunities for long term capital appreciation through investments primarily in equity and equity‐
related instruments.
Investment PatternActual
Asset Mix
Particulars
For New Dhan Suraksha, New Dhan Suraksha Premium,
New Prabhat Tara, Dhan Suraksha 3, Dhan Suraksha
Premium 3 & Prabhat Tara 3.
Benchmark :
CNX Nifty Index ‐ 90%
CRISIL Liquid Fund Index ‐ 10%
APEX EQUITY FUND -AUGUST 2016
Equity
MM & Others
MM & Others10.68%
Asset Allocation (% to AUM)
Dr. Reddys Laboratories Ltd. 1.93%
Oil & Natural Gas Corpn Ltd 1.88%
Ultratech Cement Ltd. 1.75%
Hero Motocorp Ltd. 1.70%
Power Grid Corporation of India Limited 1.66%
State Bank of India 1.60%
HCL Technologies Ltd 1.52%
Lupin Limited 1.32%
Asian Paints Ltd. 1.30%
Mahindra & Mahindra Ltd. 1.25%
ACC Limited 1.12%
Zee Entertainment Enterprises Ltd 1.10%
Others (with < 1% exposure) 3.01%
MM & Others 10.68%
Total 100.00%
`
1 Month 3 Month 6 Month 1 Year 2 Year 3 Year Since InceptionApex Equity Fund 1.43% 7.30% 26.16% 10.49% 5.63% 18.29% 9.28%
Benchmark 1.60% 7.09% 23.43% 10.09% 5.51% 16.35% 8.30%
Fund returns vis a vis BenchmarkAbsolute CAGR (Annualised)
23.81%
14.29%
9.73%
7.86%
7.46%
6.29%
6.27%
5.52%
3.97%
3.85%
Financial & Insurance Activities
Computer programming, consultancy and related activities
Manufacture of motor vehicles, trailers and semi‐trailers
Other financial activities
Manufacture of coke and refined petroleum products
Manufacture of tobacco products
Manufacture of pharmaceuticals,medicinal chemical and botanical products
Civil engineering
Manufacture of chemicals and chemical products
Manufacture of other transport equipment
Top 10 Industry Exposure ( % to AUM)
Equity89.32%
8.509.009.5010.0010.5011.0011.5012.0012.5013.0013.5014.0014.5015.0015.5016.0016.5017.0017.5018.0018.5019.0019.5020.0020.50
Jan‐10
Apr‐10
Jul‐10
Oct‐10
Dec‐10
Mar‐11
Jun‐11
Sep‐11
Dec‐11
Mar‐12
May‐12
Aug‐12
Nov‐12
Feb‐13
May‐13
Aug‐13
Oct‐13
Jan‐14
Apr‐14
Jul‐14
Oct‐14
Dec‐14
Mar‐15
Jun‐15
Sep‐15
Dec‐15
Mar‐16
May‐16
Aug‐16
NAV/U
NIT (Rs)
NAV Performance (Since Inception)
NAV Benchmark
Trademark used under licence from respective owners.

Investment Objective:
Date of Inception : SFIN No.
February 25, 2009 ULIF 002 25/02/09 SUD‐LI‐EQ1 142
Products : AUM:
Rs. 48.03 Cr
Portfolio % to AUM
`
Equity 87.73% Minimum Maximum
Infosys Technologies Ltd. 6.60% 80% 100% 87.73%
Reliance Industries Ltd 6.36% 0% 20% 12.27%
HDFC Bank Ltd 5.95%
ITC Ltd. 5.48%
ICICI Bank Ltd 5.21%
Larsen & Toubro Limited 5.16%
Tata Motors Limited 4.90%
Tata Consultancy Services Limited 3.75%
Sun Pharmaceuticals Industries Ltd 3.62%
Housing Development Finance Corporation Ltd. 3.13%
Maruti Suzuki India Limited 2.98%
Axis Bank Limited 2.90%
Grasim Industries Ltd. 2.31%
Yes Bank Limited 2.22%
Power Grid Corporation of India Limited 2.02%
IndusInd Bank Limited 1.98%
Mahindra & Mahindra Ltd. 1.94%
Lupin Limited 1.90%
State Bank of India 1 79%
Equity
MM & Others
To tap growth opportunities for long term capital appreciation through investments primarily in equity and
equity‐related instruments.
Investment PatternActual
Asset Mix
Particulars
Benchmark :
CNX Nifty Index ‐ 90%
CRISIL Liquid Fund Index ‐ 10%
For Dhan Suraksha, Dhan Suraksha Premium, Prabhat
Tara.
EQUITY FUND - AUGUST 2016
E it
MM & Others12.27%
Asset Allocation (% to AUM)
State Bank of India 1.79%
Bajaj Auto Limited 1.67%
Dr. Reddys Laboratories Ltd. 1.61%
Oil & Natural Gas Corpn Ltd 1.55%
ACC Limited 1.51%
Asian Paints Ltd. 1.50%
HCL Technologies Ltd 1.37%
Others (with < 1% exposure) 8.35%
MM & Others 12.27%
Total 100.00%
`
1 Month 3 Month 6 Month 1 Year 2 Year 3 Year Since Inception
Equity Fund 1.29% 7.31% 25.52% 10.49% 6.07% 17.83% 16.97%
Benchmark 1.60% 7.09% 23.43% 10.09% 5.51% 16.35% 15.89%
Fund returns vis a vis BenchmarkAbsolute CAGR (Annualised)
23.84%
13.24%
9.82%
8.30%
8.03%
7.12%
5.48%
5.16%
5.08%
3.51%
Financial & Insurance Activities
Computer programming, consultancy and related activities
Manufacture of motor vehicles, trailers and semi‐trailers
Other financial activities
Manufacture of coke and refined petroleum products
Manufacture of pharmaceuticals,medicinal chemical and botanical products
Manufacture of tobacco products
Civil engineering
Manufacture of chemicals and chemical products
Infrastructure
Top 10 Industry Exposure (% to AUM)
Equity87.73%
9.50
11.00
12.50
14.00
15.50
17.00
18.50
20.00
21.50
23.00
24.50
26.00
27.50
29.00
30.50
32.00
33.50
Feb‐09
May‐09
Aug‐09
Nov‐09
Feb‐10
May‐10
Aug‐10
Nov‐10
Jan‐11
Apr‐11
Jul‐11
Oct‐11
Jan‐12
Apr‐12
Jul‐12
Oct‐12
Jan‐13
Apr‐13
Jun‐13
Sep‐13
Dec‐13
Mar‐14
Jun‐14
Sep‐14
Dec‐14
Mar‐15
Jun‐15
Aug‐15
Nov‐15
Feb‐16
May‐16
Aug‐16
NAV/U
NIT (Rs)
NAV Performance (Since Inception)NAV Benchmark
Trademark used under licence from respective owners.

Investment Objective :
Date of Inception : SFIN No.
January 20, 2010 ULIF 013 20/01/10 SUD‐PA‐EQ1 142
Products : AUM :
Rs. 34.59 Cr
Portfolio % to AUM
`
Equity 90.01% Minimum Maximum
Reliance Industries Ltd 7.84% 80% 100% 90.01%
Infosys Technologies Ltd. 7.38% 0% 20% 9.99%
ITC Ltd. 6.58%
HDFC Bank Ltd 5.71%
Larsen & Toubro Limited 5.30%
Housing Development Finance Corporation Ltd. 5.15%
Tata Motors Limited 4.77%
ICICI Bank Ltd 4.59%
Tata Consultancy Services Limited 4.29%
Sun Pharmaceuticals Industries Ltd 3.54%
Maruti Suzuki India Limited 3.36%
IndusInd Bank Limited 3.32%
Axis Bank Limited 2.60%
Bajaj Auto Limited 2.33%
Grasim Industries Ltd. 2.26%
Dr. Reddys Laboratories Ltd. 2.03%
State Bank of India 2.01%
HCL Technologies Ltd 1.80%
Asian Paints Ltd. 1.77%
Ultratech Cement Ltd 1 75%
To seek consistent long term capital appreciation through investments primarily in equity and equity‐
related instruments by focusing predominantly on well established companies.
Asset Mix
ParticularsInvestment Pattern
Actual
Benchmark :
CNX Nifty Index ‐ 90%
CRISIL Liquid Fund Index ‐ 10%
INDIVIDUAL PENSION FUND APEX EQUITY - AUGUST 2016
Equity
For New Dhruv Tara Products
MM & Others
Equity90 01%
MM & Others9.99%
Asset Allocation (% to AUM)
Ultratech Cement Ltd. 1.75%
Hero Motocorp Ltd. 1.74%
Power Grid Corporation of India Limited 1.70%
Oil & Natural Gas Corpn Ltd 1.64%
Lupin Limited 1.50%
Mahindra & Mahindra Ltd. 1.25%
ACC Limited 1.14%Others (with < 1% exposure) 2.67%
MM & Others 9.99%
Total 100.00%
`
1 Month 3 Month 6 Month 1 Year 2 Year 3 Year Since InceptionIndividual Pension Fund ‐ Apex Equity 1.48% 7.46% 25.89% 9.04% 5.06% 17.65% 9.15%Benchmark 1.60% 7.09% 23.43% 10.09% 5.51% 16.35% 8.30%
Fund returns vis a vis BenchmarkAbsolute CAGR (Annualised)
23.38%
14.41%
9.37%
8.64%
7.30%
7.07%
6.58%
5.30%
4.07%
Financial & Insurance Activities
Computer programming, consultancy and related activities
Manufacture of motor vehicles, trailers and semi‐trailers
Manufacture of coke and refined petroleum products
Other financial activities
Manufacture of pharmaceuticals,medicinal chemical and botanical products
Manufacture of tobacco products
Civil engineering
Manufacture of other transport equipment
Top 10 Industry Exposure ( % to AUM)
90.01%
9.009.50
10.0010.5011.0011.5012.0012.5013.0013.5014.0014.5015.0015.5016.0016.5017.0017.5018.0018.5019.0019.5020.00
Jan‐10
Apr‐10
Jul‐10
Oct‐10
Dec‐10
Mar‐11
Jun‐11
Sep‐11
Dec‐11
Mar‐12
May‐12
Aug‐12
Nov‐12
Feb‐13
May‐13
Aug‐13
Oct‐13
Jan‐14
Apr‐14
Jul‐14
Oct‐14
Dec‐14
Mar‐15
Jun‐15
Sep‐15
Dec‐15
Mar‐16
May‐16
Aug‐16
NAV/U
NIT (R
s)
NAV Performance (Since Inception)
NAV Benchmark
Trademark used under licence from respective owners.

Investment Objective :
Date of Inception : SFIN No.
March 31, 2009 ULIF 005 31/03/09 SUD‐PI‐EQ1 142
Products : AUM :
Rs. 20.98 Cr
Portfolio % to AUM
`
Equity 89.52% Minimum Maximum
Infosys Technologies Ltd. 7.37% 80% 100% 89.52%
HDFC Bank Ltd 7.17% 0% 20% 10.48%
Reliance Industries Ltd 6.58%
ITC Ltd. 5.77%
ICICI Bank Ltd 5.65%
Larsen & Toubro Limited 5.06%
Tata Motors Limited 5.06%
Tata Consultancy Services Limited 4.20%
Sun Pharmaceuticals Industries Ltd 3.91%
Housing Development Finance Corporation Ltd. 3.81%
Axis Bank Limited 3.14%
Maruti Suzuki India Limited 3.05%
Grasim Industries Ltd. 2.23%
Power Grid Corporation of India Limited 2.03%
Yes Bank Limited 2.02%
Asian Paints Ltd. 1.93%
Mahindra & Mahindra Ltd. 1.91%
Oil & Natural Gas Corpn Ltd 1.91%
Lupin Limited 1 90%
To seek consistent long term capital appreciation through investments primarily in equity and equity‐related
instruments by focusing predominantly on well established companies.
Asset Mix
ParticularsInvestment Pattern
Actual
Benchmark :
CNX Nifty Index ‐ 90%
CRISIL Liquid Fund Index ‐ 10%
INDIVIDUAL PENSION FUND EQUITY - AUGUST 2016
MM & Others
Equity
For Dhruv Tara Products
MM & Others10.48%
Asset Allocation (% to AUM)
Lupin Limited 1.90%
HCL Technologies Ltd 1.71%
Bajaj Auto Limited 1.62%
Ultratech Cement Ltd. 1.15%
IndusInd Bank Limited 1.13%
Dr. Reddys Laboratories Ltd. 1.03%
ACC Limited 1.02%Others (with < 1% exposure) 7.16%
MM & Others 10.48%
Total 100.00%
`
1 Month 3 Month 6 Month 1 Year 2 Year 3 Year Since InceptionIndividual Pension Fund ‐ Equity 1.06% 7.09% 25.05% 10.09% 5.49% 17.54% 14.71%Benchmark 1.60% 7.09% 23.43% 10.09% 5.51% 16.35% 14.83%
Fund returns vis a vis BenchmarkAbsolute CAGR (Annualised)
23.88%
14.89%
10.02%
8.43%
7.21%
6.84%
5.77%
5.06%
4.71%
3.00%
Financial & Insurance Activities
Computer programming, consultancy and related activities
Manufacture of motor vehicles, trailers and semi‐trailers
Manufacture of coke and refined petroleum products
Other financial activities
Manufacture of pharmaceuticals,medicinal chemical and botanical products
Manufacture of tobacco products
Civil engineering
Manufacture of chemicals and chemical products
Infrastructure
Top 10 Industry Exposure ( % to AUM)
Equity89.52%
9.50
11.50
13.50
15.50
17.50
19.50
21.50
23.50
25.50
27.50
29.50
Mar‐09
Jul‐09
Oct‐09
Jan‐10
Apr‐10
Jul‐10
Oct‐10
Jan‐11
Apr‐11
Jul‐11
Oct‐11
Jan‐12
Apr‐12
Jul‐12
Oct‐12
Jan‐13
Apr‐13
Jul‐13
Oct‐13
Jan‐14
May‐14
Aug‐14
Nov‐14
Feb‐15
May‐15
Aug‐15
Nov‐15
Feb‐16
May‐16
Aug‐16
NAV/U
NIT (R
s)
NAV Performance (Since Inception)
NAV Benchmark
Trademark used under licence from respective owners.

Investment Objective :
Date of Inception : SFIN No.
January 29, 2014 ULIF 019 11/12/13 SUD‐LI‐EQ2 142
Products : AUM :
Rs. 121.38 Cr
Portfolio % to AUM
Equity 85.61% Minimum Maximum
Infosys Technologies Ltd. 6.95% 70% 100% 85.61%
HDFC Bank Ltd 5.93% 0% 30% 14.39%
ICICI Bank Ltd 5.86%
Reliance Industries Ltd 5.15%
ITC Ltd. 5.01%
Tata Motors Limited 4.93%
Larsen & Toubro Limited 4.89%
Tata Consultancy Services Limited 3.33%
Sun Pharmaceuticals Industries Ltd 3.11%
Axis Bank Limited 2.84%
Maruti Suzuki India Limited 2.71%
IndusInd Bank Limited 2.52%
Grasim Industries Ltd. 2.33%
Housing Development Finance Corporation Ltd. 2.23%
Oil & Natural Gas Corpn Ltd 2.10%
Mahindra & Mahindra Ltd. 1.95%
Lupin Limited 1.90%
Power Grid Corporation of India Limited 1.88%
Dr Reddys Laboratories Ltd 1 67%
ParticularsInvestment Pattern
Actual
Equity
INDIVIDUAL BLUE CHIP EQUITY - AUGUST 2016
MM & Others
Asset Mix
For Dhan Suraksha Plus & Wealth Builder Plan
The fund seeks to achieve long term capital appreciation by investing predominantly in equity and equity
related securities.
Benchmark :
CNX Nifty Index ‐ 85%
CRISIL Liquid Fund Index ‐ 15%
MM & Others14.39%
Asset Allocation (% to AUM)
Dr. Reddys Laboratories Ltd. 1.67%
Yes Bank Limited 1.58%
State Bank of India 1.46%
Ultratech Cement Ltd. 1.44%
Bajaj Auto Limited 1.36%
Kotak Mahindra Bank Limited 1.30%
HCL Technologies Ltd 1.08%Others (with < 1% exposure) 10.09%
MM & Others 14.39%
Total 100.00%
`
1 Month 3 Month 6 Month 1 Year 2 Year 3 Year Since InceptionIndividual Blue Chip Equity 1.22% 7.11% 25.31% 10.81% 6.44% NA 14.76%Benchmark 1.55% 6.80% 22.28% 10.01% 5.71% NA 14.15%
Fund returns vis a vis BenchmarkAbsolute CAGR (Annualised)
23.71%
13.27%
11.06%
9.59%
6.69%
6.14%
5.01%
4.89%
4.71%
Financial & Insurance Activities
Computer programming, consultancy and related activities
Other financial activities
Manufacture of motor vehicles, trailers and semi‐trailers
Manufacture of pharmaceuticals,medicinal chemical and botanical products
Manufacture of coke and refined petroleum products
Manufacture of tobacco products
Civil engineering
Manufacture of chemicals and chemical products
Top 10 Industry Exposure ( % to AUM)
Equity85.61%
9.50
10.00
10.50
11.00
11.50
12.00
12.50
13.00
13.50
14.00
14.50
15.00
Jan‐…
Mar…
Apr‐…
May…
Jun‐…
Jul‐14
Sep‐ …
Oct‐…
Nov…
Dec…
Jan‐…
Mar…
Apr‐…
May…
Jun‐…
Jul‐15
Aug …
Oct‐…
Nov…
Dec…
Jan‐…
Feb‐…
Mar…
May…
Jun‐…
Jul‐16
Aug …
NAV/U
NIT (Rs)
NAV Performance (Since Inception)NAV Benchmark
Trademark used under licence from respective owners.

Investment Objective :
Date of Inception : SFIN No.
January 20, 2010 ULIF 010 20/01/10 SUD‐LA‐GR1 142
Products : AUM :
Rs. 572.63 Cr
Portfolio % to AUM
`
Equity 67.33% Minimum Maximum
Infosys Technologies Ltd. 5.09% 55% 85% 67.33%
HDFC Bank Ltd 4.51% 15% 45% 32.67%
Reliance Industries Ltd 4.50%
ICICI Bank Ltd 4.17%
ITC Ltd. 4.17%
Larsen & Toubro Limited 3.82%
Tata Motors Limited 3.77%
Tata Consultancy Services Limited 3.12%
Housing Development Finance Corporation Ltd. 3.08%
Axis Bank Limited 2.84%
IndusInd Bank Limited 2.69%
Maruti Suzuki India Limited 2.41%
Sun Pharmaceuticals Industries Ltd 2.22%
Grasim Industries Ltd. 1.94%
Yes Bank Limited 1.85%
Power Grid Corporation of India Limited 1.60%
State Bank of India 1.51%
Oil & Natural Gas Corpn Ltd 1.41%
Mahindra & Mahindra Ltd. 1.22%
Dr. Reddys Laboratories Ltd. 1.16%
HCL Technologies Ltd 1.16%
Bajaj Auto Limited 1.13%
Lupin Limited 1.06%
Others (with < 1% exposure) 6.91%
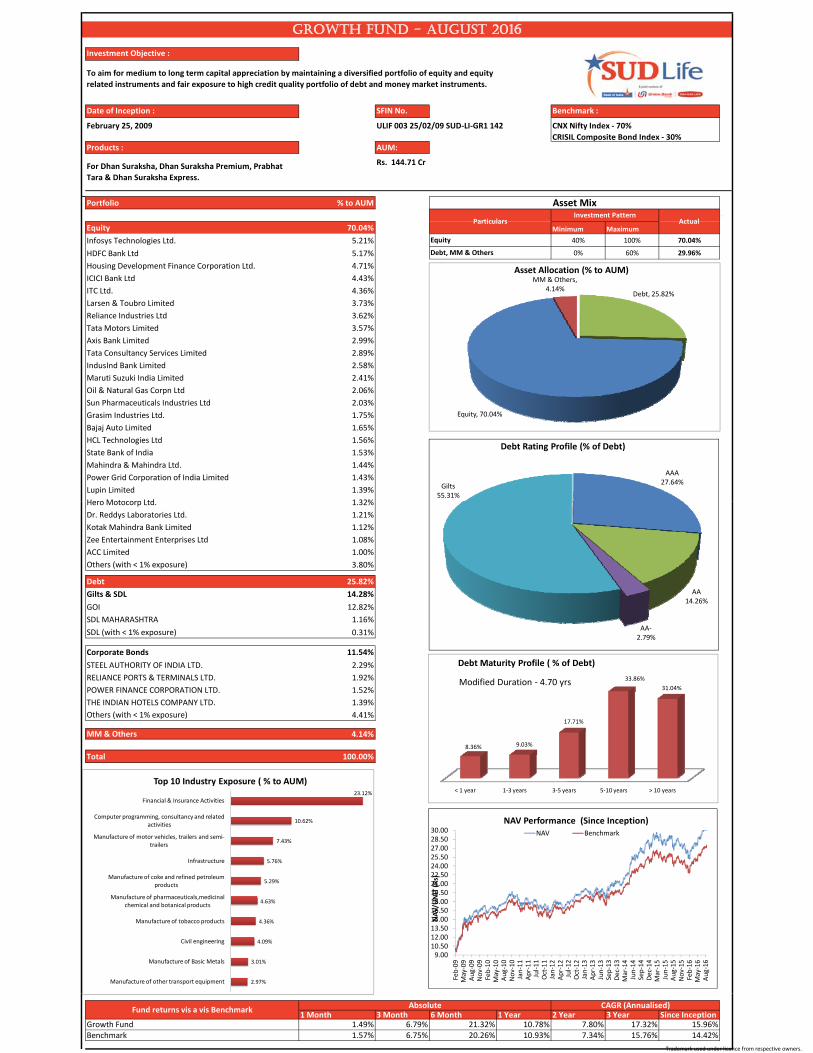
To aim for medium to long term capital appreciation by maintaining a diversified portfolio of equity and equity
related instruments and fair exposure to high credit quality portfolio of debt and money market instruments.
Investment PatternActual
Asset Mix
Particulars
For New Dhan Suraksha, New Dhan Suraksha Premium,
New Prabhat Tara, Dhan Suraksha 3, Dhan Suraksha
Premium 3 & Prabhat Tara 3.
Benchmark :
CNX Nifty Index ‐ 70%
CRISIL Composite Bond Index ‐ 30%
APEX GROWTH FUND - AUGUST 2016
Equity
Debt, MM & Others
Debt27.59%
Equity67.33%
MM & Others5.08%
Asset Allocation (% to AUM)
AAA37.46%
Gilts45.81%
Debt Rating Profile (% of Debt)
Debt 27.59%
Gilts & SDL 12.64%
GOI 11.21%
SDL (with < 1% exposure) 1.43%
Corporate Bonds 14.95%
POWER GRID CORPORATION OF INDIA LTD 2.22%
POWER FINANCE CORPORATION LTD. 1.40%
RURAL ELECTRIFICATION CORPORATION L 1.33%
LIC HOUSING FINANCE LTD 1.17%
Others (with < 1% exposure) 8.83%
MM & Others 5.08%
Total 100.00%
`
1 Month 3 Month 6 Month 1 Year 2 Year 3 Year Since InceptionApex Growth Fund 1.40% 7.04% 22.51% 11.71% 7.93% 17.35% 9.57%Benchmark 1.57% 6.75% 20.26% 10.93% 7.34% 15.76% 8.57%
Fund returns vis a vis BenchmarkAbsolute CAGR (Annualised)
24.06%
10.82%
8.62%
7.40%
6.58%
4.44%
4.17%
3.86%
3.82%
2.73%
Financial & Insurance Activities
Computer programming, consultancy and related activities
Infrastructure
Manufacture of motor vehicles, trailers and semi‐trailers
Manufacture of coke and refined petroleum products
Manufacture of pharmaceuticals,medicinal chemical and botanical products
Manufacture of tobacco products
Manufacture of chemicals and chemical products
Civil engineering
Other financial activities
Top 10 Industry Exposure ( % to AUM)
< 1 year 1‐3 years 3‐5 years 5‐10 years > 10 years
5.29%
10.65%
14.18%
42.35%
27.53%
Debt Maturity Profile ( % of Debt)
AA+9.56%AA
3.94%AA‐3.22%
Modified Duration ‐ 4.58 yrs
9.50
10.50
11.50
12.50
13.50
14.50
15.50
16.50
17.50
18.50
19.50
Jan‐10
Apr‐10
Jul‐10
Oct‐10
Jan‐11
Apr‐11
Jul‐11
Oct‐11
Jan‐12
Apr‐12
Jul‐12
Oct‐12
Jan‐13
Apr‐13
Jul‐13
Oct‐13
Jan‐14
May‐14
Aug‐14
Nov‐14
Feb‐15
May‐15
Aug‐15
Nov‐15
Feb‐16
May‐16
Aug‐16
NAV/U
NIT (Rs)
NAV Performance (Since Inception)
NAV Benchmark
Trademark used under licence from respective owners.
Investment Objective :
Date of Inception : SFIN No.
February 25, 2009 ULIF 003 25/02/09 SUD‐LI‐GR1 142
Products : AUM:
Rs. 144.71 Cr
Portfolio % to AUM
`
Equity 70.04% Minimum Maximum
Infosys Technologies Ltd. 5.21% 40% 100% 70.04%
HDFC Bank Ltd 5.17% 0% 60% 29.96%
Housing Development Finance Corporation Ltd. 4.71%
ICICI Bank Ltd 4.43%
ITC Ltd. 4.36%
Larsen & Toubro Limited 3.73%
Reliance Industries Ltd 3.62%
Tata Motors Limited 3.57%
Axis Bank Limited 2.99%
Tata Consultancy Services Limited 2.89%
IndusInd Bank Limited 2.58%
Maruti Suzuki India Limited 2.41%
Oil & Natural Gas Corpn Ltd 2.06%
Sun Pharmaceuticals Industries Ltd 2.03%
Grasim Industries Ltd. 1.75%
Bajaj Auto Limited 1.65%
HCL Technologies Ltd 1.56%
State Bank of India 1.53%
Mahindra & Mahindra Ltd. 1.44%
Power Grid Corporation of India Limited 1.43%
Lupin Limited 1.39%
Hero Motocorp Ltd 1 32%
To aim for medium to long term capital appreciation by maintaining a diversified portfolio of equity and equity
related instruments and fair exposure to high credit quality portfolio of debt and money market instruments.
Investment PatternActual
Asset Mix
Particulars
For Dhan Suraksha, Dhan Suraksha Premium, Prabhat
Tara & Dhan Suraksha Express.
Benchmark :
CNX Nifty Index ‐ 70%
CRISIL Composite Bond Index ‐ 30%
GROWTH FUND - AUGUST 2016
Equity
Debt, MM & Others
AAA27.64%
Gilts55.31%
Debt Rating Profile (% of Debt)
Debt, 25.82%
Equity, 70.04%
MM & Others, 4.14%
Asset Allocation (% to AUM)
Hero Motocorp Ltd. 1.32%
Dr. Reddys Laboratories Ltd. 1.21%
Kotak Mahindra Bank Limited 1.12%
Zee Entertainment Enterprises Ltd 1.08%
ACC Limited 1.00%
Others (with < 1% exposure) 3.80%
Debt 25.82%
Gilts & SDL 14.28%
GOI 12.82%
SDL MAHARASHTRA 1.16%
SDL (with < 1% exposure) 0.31%
Corporate Bonds 11.54%
STEEL AUTHORITY OF INDIA LTD. 2.29%
RELIANCE PORTS & TERMINALS LTD. 1.92%
POWER FINANCE CORPORATION LTD. 1.52%
THE INDIAN HOTELS COMPANY LTD. 1.39%
Others (with < 1% exposure) 4.41%
MM & Others 4.14%
Total 100.00%
`
23.12%
10.62%
7.43%
5.76%
5.29%
4.63%
4.36%
4.09%
3.01%
2.97%
Financial & Insurance Activities
Computer programming, consultancy and related activities
Manufacture of motor vehicles, trailers and semi‐trailers
Infrastructure
Manufacture of coke and refined petroleum products
Manufacture of pharmaceuticals,medicinal chemical and botanical products
Manufacture of tobacco products
Civil engineering
Manufacture of Basic Metals
Manufacture of other transport equipment
Top 10 Industry Exposure ( % to AUM)< 1 year 1‐3 years 3‐5 years 5‐10 years > 10 years
8.36% 9.03%
17.71%
33.86%
31.04%
Debt Maturity Profile ( % of Debt)
AA14.26%
AA‐2.79%
9.0010.5012.0013.5015.0016.5018.0019.5021.0022.5024.0025.5027.0028.5030.00
Feb‐09
May‐09
Aug‐09
Nov‐09
Feb‐10
May‐10
Aug‐10
Nov‐10
Jan‐11
Apr‐11
Jul‐11
Oct‐11
Jan‐12
Apr‐12
Jul‐12
Oct‐12
Jan‐13
Apr‐13
Jun‐13
Sep‐13
Dec‐13
Mar‐14
Jun‐14
Sep‐14
Dec‐14
Mar‐15
Jun‐15
Aug‐15
Nov‐15
Feb‐16
May‐16
Aug‐16
NAV/U
NIT (R
s)
NAV Performance (Since Inception)NAV Benchmark
Modified Duration ‐ 4.70 yrs
1 Month 3 Month 6 Month 1 Year 2 Year 3 Year Since InceptionGrowth Fund 1.49% 6.79% 21.32% 10.78% 7.80% 17.32% 15.96%Benchmark 1.57% 6.75% 20.26% 10.93% 7.34% 15.76% 14.42%
Fund returns vis a vis BenchmarkAbsolute CAGR (Annualised)
Trademark used under licence from respective owners.

Investment Objective :
Date of Inception : SFIN No.
January 20, 2010 ULIF 014 20/01/10 SUD‐PA‐GR1 142
Products : AUM :
Rs. 36.73 Cr
Portfolio % to AUM
`
Equity 67.86% Minimum Maximum
Infosys Technologies Ltd. 5.69% 55% 85% 67.86%
HDFC Bank Ltd 5.29% 15% 45% 32.14%
Reliance Industries Ltd 5.24%
ITC Ltd. 4.61%
Larsen & Toubro Limited 4.10%
Tata Consultancy Services Limited 4.06%
Tata Motors Limited 3.86%
ICICI Bank Ltd 3.60%
Axis Bank Limited 3.09%
IndusInd Bank Limited 2.71%
Housing Development Finance Corporation Ltd. 2.68%
Sun Pharmaceuticals Industries Ltd 2.64%
Maruti Suzuki India Limited 2.61%
Grasim Industries Ltd. 2.24%
Yes Bank Limited 1.86%
Lupin Limited 1.66%
Oil & Natural Gas Corpn Ltd 1.62%
Power Grid Corporation of India Limited 1.55%
State Bank of India 1.27%
Bajaj Auto Limited 1.18%
Mahindra & Mahindra Ltd. 1.17%
Others (with < 1% exposure) 5.12%
To seek consistent growth over medium to long term by focusing predominantly on well
established companies through investments primarily in equity and equity‐related instruments
and fair exposure to high credit quality portfolio of debt and money market instruments.
Asset Mix
ParticularsInvestment Pattern
Actual
Benchmark :
CNX Nifty Index ‐ 70%
CRISIL Composite Bond Index ‐ 30%
INDIVIDUAL PENSION FUND APEX GROWTH - AUGUST 2016
Equity
For New Dhruv Tara Products
Debt, MM & Others
Debt29.14%
Equity67.86%
MM & Others3.00%
Asset Allocation (% to AUM)
AAA50.06%
Debt Rating Profile (% of Debt)
Debt 29.14%
Gilts & SDL 10.36%
GOI 7.47%
SDL ‐ TAMIL NADU 2.89%SDL (with < 1% exposure) 0.00%
Corporate Bonds 18.79%
RELIANCE PORTS & TERMINALS LTD. 4.85%
LIC HOUSING FINANCE LTD 3.42%
STEEL AUTHORITY OF INDIA LTD. 2.78%
POWER GRID CORPORATION OF INDIA LTD 2.04%
RELIANCE GAS TRANSPORTN INFRA LTD. 1.51%
HINDALCO INDUSTRIES LTD. 1.42%
RELIANCE CAPITAL LTD. 1.38%
HDB FINANCIAL SERVICES LTD 1.38%Others (with < 1% exposure) 0.00%
MM & Others 3.00%
Total 100.00%
`
1 Month 3 Month 6 Month 1 Year 2 Year 3 Year Since InceptionIndividual Pension Fund ‐ Apex Growth 1.07% 6.45% 21.18% 10.95% 7.00% 16.21% 9.11%Benchmark 1.57% 6.75% 20.26% 10.93% 7.34% 15.76% 8.57%
Fund returns vis a vis BenchmarkAbsolute CAGR (Annualised)
23.92%
11.30%
10.65%
7.65%
5.99%
5.14%
4.61%
4.20%
4.10%
3.42%
Financial & Insurance Activities
Computer programming, consultancy and related activities
Infrastructure
Manufacture of motor vehicles, trailers and semi‐trailers
Manufacture of coke and refined petroleum products
Manufacture of pharmaceuticals,medicinal chemical and botanical products
Manufacture of tobacco products
Manufacture of Basic Metals
Civil engineering
Housing Sector
Top 10 Industry Exposure ( % to AUM)
< 1 year 3‐5 years 5‐10 years > 10 years
16.49%
43.10%
32.90%
7.50%
Debt Maturity Profile ( % of Debt)
AA9.54%
AA‐4.86%
Gilts35.54%
9.00
10.50
12.00
13.50
15.00
16.50
18.00
19.50
21.00
22.50
Jan‐10
Apr‐10
Jul‐10
Oct‐10
Jan‐11
Apr‐11
Jul‐11
Oct‐11
Jan‐12
Apr‐12
Jul‐12
Oct‐12
Jan‐13
Apr‐13
Jul‐13
Oct‐13
Jan‐14
May‐14
Aug‐14
Nov‐14
Feb‐15
May‐15
Aug‐15
Nov‐15
Feb‐16
May‐16
Aug‐16
NAV/U
NIT (Rs)
NAV Performance (Since Inception)
NAV Benchmark
Modified Duration ‐ 3.31 yrs
Trademark used under licence from respective owners.

Investment Objective :
Date of Inception : SFIN No.
March 31, 2009 ULIF 006 31/03/09 SUD‐PI‐GR1 142
Products : AUM :
Rs. 21.01 Cr
Portfolio % to AUM
`
Equity 67.24% Minimum Maximum
Housing Development Finance Corporation Ltd. 5.72% 40% 100% 67.24%
Infosys Technologies Ltd. 5.21% 0% 60% 32.76%
ICICI Bank Ltd 4.84%
ITC Ltd. 4.65%
Tata Consultancy Services Limited 4.43%
Reliance Industries Ltd 3.99%
Larsen & Toubro Limited 3.67%
IndusInd Bank Limited 3.63%
HDFC Bank Ltd 3.44%
Tata Motors Limited 3.34%
Sun Pharmaceuticals Industries Ltd 2.93%
Axis Bank Limited 2.84%
Maruti Suzuki India Limited 2.41%
Mahindra & Mahindra Ltd. 2.04%
State Bank of India 1.97%
HCL Technologies Ltd 1.87%
Grasim Industries Ltd. 1.74%
Ultratech Cement Ltd. 1.34%
Power Grid Corporation of India Limited 1.31%
Zee Entertainment Enterprises Ltd 1.28%
Hero Motocorp Ltd. 1.25%
Others (with < 1% exposure) 3.33%
Debt 26.24%
Gilts & SDL 10.02%
To seek consistent growth over medium to long term by focusing predominantly on well established companies
through investments primarily in equity and equity‐related instruments and fair exposure to high credit quality portfolio
of debt and money market instruments.
Asset Mix
For Dhruv Tara Products
Benchmark :
CNX Nifty Index ‐ 70%
CRISIL Composite Bond Index ‐ 30%
INDIVIDUAL PENSION FUND GROWTH - AUGUST 2016
ParticularsInvestment Pattern
Actual
Equity
Debt, MM & Others
AAA47 16%Gilts
Debt Rating Profile (% of Debt)
Debt26.24%
Equity67.24%
MM & Others6.53%
Asset Allocation (% to AUM)
Gilts & SDL 10.02%
GOI 6.12%
SDL ‐ KERALA 2.61%
SDL MAHARASHTRA 1.30%
SDL (with < 1% exposure) 0.00%
Corporate Bonds 16.21%
INDIAN OIL CORPORATION LTD 4.06%
THE INDIAN HOTELS COMPANY LTD. 3.84%
THE GREAT EASTERN SHIPPING CO. LTD. 3.53%
RURAL ELECTRIFICATION CORPORATION L 2.38%
RELIANCE GAS TRANSPORTN INFRA LTD. 1.53%Others (with < 1% exposure) 0.88%
MM & Others 6.53%
Total 100.00%
`
1 Month 3 Month 6 Month 1 Year 2 Year 3 Year Since InceptionI di id l P i F d G th 1 05% 6 12% 20 11% 9 02% 5 73% 15 15% 12 77%
Fund returns vis a vis BenchmarkAbsolute CAGR (Annualised)
22.84%
11.52%
8.04%
7.79%
5.22%
4.65%
3.84%
3.77%
3.67%
3.53%
Financial & Insurance Activities
Computer programming, consultancy and related activities
Manufacture of coke and refined petroleum products
Manufacture of motor vehicles, trailers and semi‐trailers
Infrastructure
Manufacture of tobacco products
Accommodation
Manufacture of pharmaceuticals,medicinal chemical and botanical products
Civil engineering
Water transport
Top 10 Industry Exposure ( % to AUM)
< 1 year 1‐3 years 3‐5 years 5‐10 years > 10 years
23.71%
27.01%
9.60%
22.19%
17.49%
Debt Maturity Profile ( % of Debt)
47.16%
AA14.63%
38.21%
9.00
10.50
12.00
13.50
15.00
16.50
18.00
19.50
21.00
22.50
24.00
Mar‐09
Jul‐09
Oct‐09
Jan‐10
Apr‐10
Jul‐10
Oct‐10
Feb‐11
May‐11
Aug‐11
Nov‐11
Feb‐12
May‐12
Aug‐12
Dec‐12
Mar‐13
Jun‐13
Sep‐13
Dec‐13
Mar‐14
Jul‐14
Oct‐14
Jan‐15
Apr‐15
Jul‐15
Oct‐15
Jan‐16
May‐16
Aug‐16
NAV/U
NIT (Rs)
NAV Performance (Since Inception)
NAV Benchmark
Modified Duration ‐ 2.64 yrs
Individual Pension Fund ‐ Growth 1.05% 6.12% 20.11% 9.02% 5.73% 15.15% 12.77%Benchmark 1.57% 6.75% 20.26% 10.93% 7.34% 15.76% 13.63%
Trademark used under licence from respective owners.

Investment Objective :
Date of Inception : SFIN No.
January 29, 2014 ULIF 023 11/12/13 SUD‐LI‐GR2 142
Products : AUM:
Rs. 117.96 Cr
Portfolio % to AUM
`
Equity 68.08% Minimum Maximum
Infosys Technologies Ltd. 5.94% 40% 100% 68.08%
ICICI Bank Ltd 5.44% 0% 60% 26.04%
Housing Development Finance Corporation Ltd. 4.96% 0% 30% 5.88%
HDFC Bank Ltd 4.31%
ITC Ltd. 4.04%
Larsen & Toubro Limited 3.85%
Reliance Industries Ltd 3.60%
Tata Motors Limited 3.54%
Axis Bank Limited 3.31%
IndusInd Bank Limited 2.53%
Bajaj Auto Limited 1.95%
Tata Consultancy Services Limited 1.93%
Dr. Reddys Laboratories Ltd. 1.85%
Grasim Industries Ltd. 1.71%
Sun Pharmaceuticals Industries Ltd 1.70%
Power Grid Corporation of India Limited 1.47%
State Bank of India 1.40%
Maruti Suzuki India Limited 1.37%
Oil & Natural Gas Corpn Ltd 1.35%
Lupin Limited 1.33%
Zee Entertainment Enterprises Ltd 1.32%
h h
Benchmark :
To aim for medium to long term capital appreciation by maintaining a diversified portfolio of equity and equity related
instruments and fair exposure to high credit quality portfolio of debt and money market instruments.
GROWTH PLUS FUND - AUGUST 2016
CNX Nifty Index ‐ 70%
CRISIL Composite Bond Index ‐ 30%
For Dhan Suraksha Plus & Wealth Builder Plan.
Asset Mix
ParticularsInvestment Pattern
Actual
MM & Others
Equity
Debt
AAA25.85%
Debt Rating Profile (% of Debt)
Debt26.04%
Equity68.08%
MM & Others5.88%
Asset Allocation (% to AUM)
Mahindra & Mahindra Ltd. 1.24%
Hero Motocorp Ltd. 1.14%
Asian Paints Ltd. 1.10%
Others (with < 1% exposure) 5.67%
Debt 26.04%
Gilts & SDL 17.57%
GOI 16.45%
SDL (with < 1% exposure) 1.12%
Corporate Bonds 8.47%
HDFC LTD. 2.50%
POWER FINANCE CORPORATION LTD. 1.97%
RURAL ELECTRIFICATION CORPORATION L 1.32%
Others (with < 1% exposure) 2.68%
MM & Others 5.88%
Total 100.00%
`
1 Month 3 Month 6 Month 1 Year 2 Year 3 Year Since InceptionCAGR (Annualised)
Fund returns vis a vis BenchmarkAbsolute
23.63%
8.79%
6.36%
6.15%
4.87%
4.17%
4.04%
3.85%
3.73%
3.38%
Financial & Insurance Activities
Computer programming, consultancy and related activities
Infrastructure
Manufacture of motor vehicles, trailers and semi‐trailers
Manufacture of pharmaceuticals,medicinal chemical and botanical products
Manufacture of coke and refined petroleum products
Manufacture of tobacco products
Civil engineering
Manufacture of chemicals and chemical products
Other financial activities
Top 10 Industry Exposure ( % to AUM)
< 1 year 1‐3 years 3‐5 years 5‐10 years > 10 years
3.31%8.43% 11.88%
54.06%
22.32%
Debt Maturity Profile ( % of Debt)
Modified Duration ‐ 4.65 yrs
AA+5.03%
AA‐1.65%
Gilts67.48%
9.50
10.00
10.50
11.00
11.50
12.00
12.50
13.00
13.50
14.00
14.50
Jan‐14
Mar‐14
Apr‐14
May‐14
Jun‐14
Jul‐14
Aug‐14
Sep‐14
Oct‐14
Nov‐14
Dec‐14
Jan‐15
Feb‐15
Mar‐15
Apr‐15
May‐15
Jun‐15
Jul‐15
Aug‐15
Sep‐15
Oct‐15
Nov‐15
Dec‐15
Jan‐16
Feb‐16
Mar‐16
Apr‐16
May‐16
Jun‐16
Jul‐16
Aug‐16
NAV/U
NIT (R
s)
NAV Performance (Since Inception)
NAV Benchmark
1 Month 3 Month 6 Month 1 Year 2 Year 3 Year Since InceptionGrowth Plus Fund 1.42% 6.66% 21.50% 10.73% 7.48% NA 14.37%
Benchmark 1.57% 6.75% 20.26% 10.93% 7.34% NA 14.30%
IN/LIFE/UL/GRO PLUS 1 2 3 4 7 8 6
Trademark used under licence from respective owners.
Investment Objective :
Date of Inception : SFIN No.
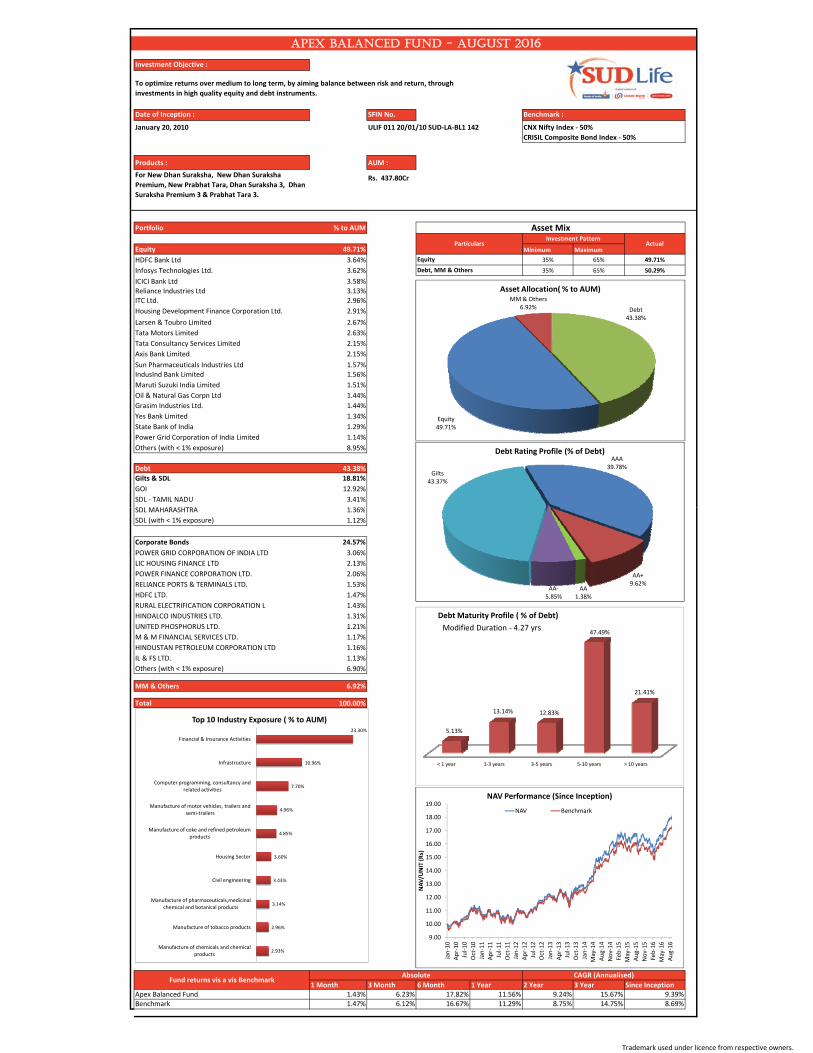
January 20, 2010 ULIF 011 20/01/10 SUD‐LA‐BL1 142
Products : AUM :
Rs. 437.80Cr
Portfolio % to AUM
`
Equity 49.71% Minimum Maximum
HDFC Bank Ltd 3.64% 35% 65% 49.71%
Infosys Technologies Ltd. 3.62% 35% 65% 50.29%
ICICI Bank Ltd 3.58%
Reliance Industries Ltd 3.13%
ITC Ltd. 2.96%
Housing Development Finance Corporation Ltd. 2.91%
Larsen & Toubro Limited 2.67%
Tata Motors Limited 2.63%
Tata Consultancy Services Limited 2.15%
Axis Bank Limited 2.15%
Sun Pharmaceuticals Industries Ltd 1.57%
IndusInd Bank Limited 1.56%
Maruti Suzuki India Limited 1.51%
Oil & Natural Gas Corpn Ltd 1.44%
Grasim Industries Ltd. 1.44%
Yes Bank Limited 1.34%
State Bank of India 1.29%
Power Grid Corporation of India Limited 1.14%
Others (with < 1% exposure) 8.95%
Debt 43.38%
Gilts & SDL 18.81%
GOI 12.92%
SDL ‐ TAMIL NADU 3.41%
SDL MAHARASHTRA 1 36%
Investment PatternActual
Asset Mix
Particulars
APEX BALANCED FUND - AUGUST 2016
Equity
Debt, MM & Others
To optimize returns over medium to long term, by aiming balance between risk and return, through
investments in high quality equity and debt instruments.
For New Dhan Suraksha, New Dhan Suraksha
Premium, New Prabhat Tara, Dhan Suraksha 3, Dhan
Suraksha Premium 3 & Prabhat Tara 3.
Benchmark :
CNX Nifty Index ‐ 50%
CRISIL Composite Bond Index ‐ 50%
Debt43.38%
Equity49.71%
MM & Others6.92%
Asset Allocation( % to AUM)
AAA39.78%
Gilts43.37%
Debt Rating Profile (% of Debt)
SDL MAHARASHTRA 1.36%
SDL (with < 1% exposure) 1.12%
Corporate Bonds 24.57%
POWER GRID CORPORATION OF INDIA LTD 3.06%
LIC HOUSING FINANCE LTD 2.13%
POWER FINANCE CORPORATION LTD. 2.06%
RELIANCE PORTS & TERMINALS LTD. 1.53%
HDFC LTD. 1.47%
RURAL ELECTRIFICATION CORPORATION L 1.43%
HINDALCO INDUSTRIES LTD. 1.31%
UNITED PHOSPHORUS LTD. 1.21%
M & M FINANCIAL SERVICES LTD. 1.17%
HINDUSTAN PETROLEUM CORPORATION LTD 1.16%
IL & FS LTD. 1.13%
Others (with < 1% exposure) 6.90%
MM & Others 6.92%
Total 100.00%
`
1 Month 3 Month 6 Month 1 Year 2 Year 3 Year Since InceptionApex Balanced Fund 1.43% 6.23% 17.82% 11.56% 9.24% 15.67% 9.39%
Fund returns vis a vis BenchmarkAbsolute CAGR (Annualised)
23.30%
10.96%
7.70%
4.96%
4.85%
3.60%
3.43%
3.14%
2.96%
2.93%
Financial & Insurance Activities
Infrastructure
Computer programming, consultancy and related activities
Manufacture of motor vehicles, trailers and semi‐trailers
Manufacture of coke and refined petroleum products
Housing Sector
Civil engineering
Manufacture of pharmaceuticals,medicinal chemical and botanical products
Manufacture of tobacco products
Manufacture of chemicals and chemical products
Top 10 Industry Exposure ( % to AUM)
< 1 year 1‐3 years 3‐5 years 5‐10 years > 10 years
5.13%
13.14% 12.83%
47.49%
21.41%
Debt Maturity Profile ( % of Debt)
AA+9.62%
AA1.38%
AA‐5.85%
9.00
10.00
11.00
12.00
13.00
14.00
15.00
16.00
17.00
18.00
19.00
Jan‐10
Apr‐10
Jul‐10
Oct‐10
Jan‐11
Apr‐11
Jul‐11
Oct‐11
Jan‐12
Apr‐12
Jul‐12
Oct‐12
Jan‐13
Apr‐13
Jul‐13
Oct‐13
Jan‐14
May‐14
Aug‐14
Nov‐14
Feb‐15
May‐15
Aug‐15
Nov‐15
Feb‐16
May‐16
Aug‐16
NAV/U
NIT (Rs)
NAV Performance (Since Inception)
NAV Benchmark
Modified Duration ‐ 4.27 yrs
Benchmark 1.47% 6.12% 16.67% 11.29% 8.75% 14.75% 8.69%
Trademark used under licence from respective owners.
Investment Objective :
Date of Inception : SFIN No.
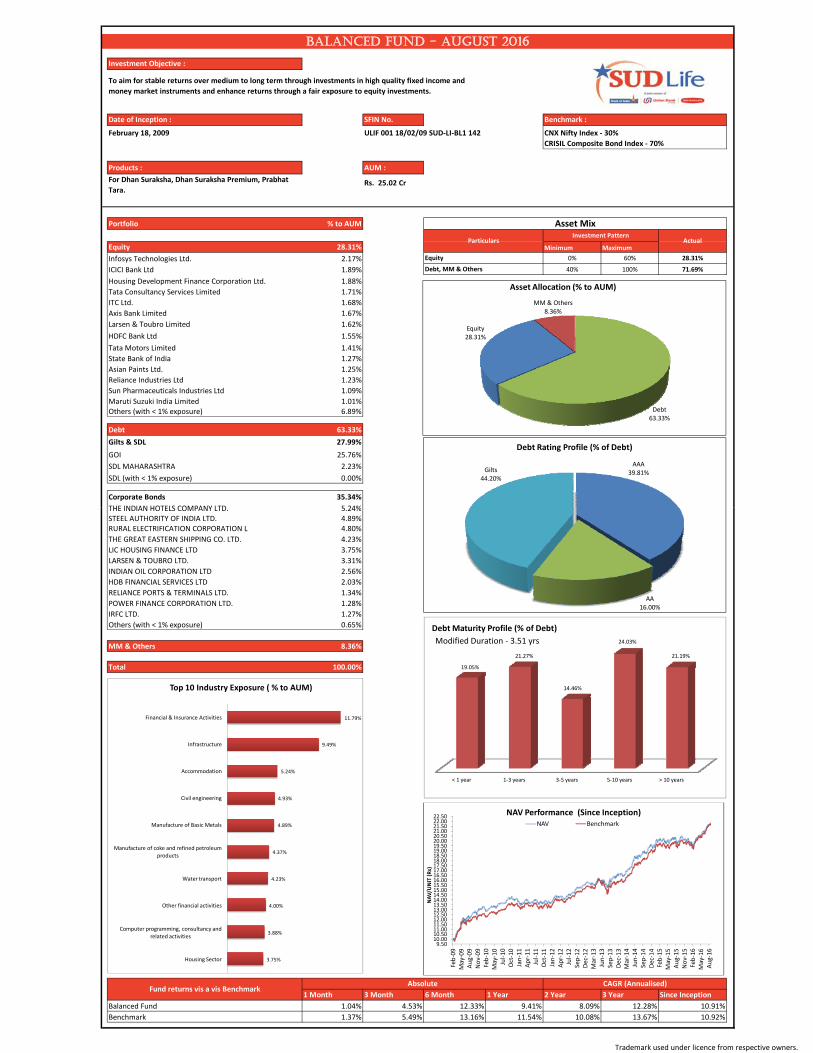
February 18, 2009 ULIF 001 18/02/09 SUD‐LI‐BL1 142
Products : AUM :
Rs. 25.02 Cr
Portfolio % to AUM
`
Equity 28.31% Minimum Maximum
Infosys Technologies Ltd. 2.17% 0% 60% 28.31%
ICICI Bank Ltd 1.89% 40% 100% 71.69%
Housing Development Finance Corporation Ltd. 1.88%
Tata Consultancy Services Limited 1.71%
ITC Ltd. 1.68%
Axis Bank Limited 1.67%
Larsen & Toubro Limited 1.62%
HDFC Bank Ltd 1.55%
Tata Motors Limited 1.41%
State Bank of India 1.27%
Asian Paints Ltd. 1.25%
Reliance Industries Ltd 1.23%
Sun Pharmaceuticals Industries Ltd 1.09%
Maruti Suzuki India Limited 1.01%Others (with < 1% exposure) 6.89%
Debt 63.33%
Gilts & SDL 27.99%
GOI 25.76%
SDL MAHARASHTRA 2.23%
SDL (with < 1% exposure) 0.00%
Corporate Bonds 35.34%
THE INDIAN HOTELS COMPANY LTD 5 24%
To aim for stable returns over medium to long term through investments in high quality fixed income and
money market instruments and enhance returns through a fair exposure to equity investments.
Investment PatternActual
Asset Mix
Particulars
For Dhan Suraksha, Dhan Suraksha Premium, Prabhat
Tara.
Benchmark :
CNX Nifty Index ‐ 30%
CRISIL Composite Bond Index ‐ 70%
BALANCED FUND - AUGUST 2016
Equity
Debt, MM & Others
Debt63.33%
Equity28.31%
MM & Others8.36%
Asset Allocation (% to AUM)
AAA39.81%Gilts
44.20%
Debt Rating Profile (% of Debt)
THE INDIAN HOTELS COMPANY LTD. 5.24%STEEL AUTHORITY OF INDIA LTD. 4.89%RURAL ELECTRIFICATION CORPORATION L 4.80%
THE GREAT EASTERN SHIPPING CO. LTD. 4.23%
LIC HOUSING FINANCE LTD 3.75%
LARSEN & TOUBRO LTD. 3.31%
INDIAN OIL CORPORATION LTD 2.56%
HDB FINANCIAL SERVICES LTD 2.03%
RELIANCE PORTS & TERMINALS LTD. 1.34%
POWER FINANCE CORPORATION LTD. 1.28%
IRFC LTD. 1.27%
Others (with < 1% exposure) 0.65%
MM & Others 8.36%
Total 100.00%
`
1 Month 3 Month 6 Month 1 Year 2 Year 3 Year Since InceptionFund returns vis a vis Benchmark
Absolute CAGR (Annualised)
11.79%
9.49%
5.24%
4.93%
4.89%
4.37%
4.23%
4.00%
3.88%
3.75%
Financial & Insurance Activities
Infrastructure
Accommodation
Civil engineering
Manufacture of Basic Metals
Manufacture of coke and refined petroleum products
Water transport
Other financial activities
Computer programming, consultancy and related activities
Housing Sector
Top 10 Industry Exposure ( % to AUM)
< 1 year 1‐3 years 3‐5 years 5‐10 years > 10 years
19.05%
21.27%
14.46%
24.03%
21.19%
Debt Maturity Profile (% of Debt)
AA16.00%
9.5010.0010.5011.0011.5012.0012.5013.0013.5014.0014.5015.0015.5016.0016.5017.0017.5018.0018.5019.0019.5020.0020.5021.0021.5022.0022.50
Feb‐09
May‐09
Aug‐09
Nov‐09
Feb‐10
May‐10
Jul‐10
Oct‐10
Jan‐11
Apr‐11
Jul‐11
Oct‐11
Jan‐12
Apr‐12
Jul‐12
Sep‐12
Dec‐12
Mar‐13
Jun‐13
Sep‐13
Dec‐13
Mar‐14
Jun‐14
Sep‐14
Dec‐14
Feb‐15
May‐15
Aug‐15
Nov‐15
Feb‐16
May‐16
Aug‐16
NAV/U
NIT (Rs)
NAV Performance (Since Inception)NAV Benchmark
Modified Duration ‐ 3.51 yrs
Balanced Fund 1.04% 4.53% 12.33% 9.41% 8.09% 12.28% 10.91%
Benchmark 1.37% 5.49% 13.16% 11.54% 10.08% 13.67% 10.92%
Trademark used under licence from respective owners.

Investment Objective :
Date of Inception : SFIN No.
January 20, 2010 ULIF 015 20/01/10 SUD‐PA‐BL1 142
Products : AUM :
Rs. 17.92 Cr
Portfolio % to AUM
`
Equity 49.26% Minimum Maximum
Infosys Technologies Ltd. 4.59% 35% 65% 49.26%
Housing Development Finance Corporation Ltd. 4.41% 35% 65% 50.74%
ITC Ltd. 3.95%
ICICI Bank Ltd 3.67%
Reliance Industries Ltd 3.66%
HDFC Bank Ltd 2.95%
Tata Motors Limited 2.90%
Larsen & Toubro Limited 2.67%Axis Bank Limited 2.33%State Bank of India 2.20%
Maruti Suzuki India Limited 2.11%Tata Consultancy Services Limited 2.10%
Oil & Natural Gas Corpn Ltd 1.98%Sun Pharmaceuticals Industries Ltd 1.95%IndusInd Bank Limited 1.93%Grasim Industries Ltd. 1.70%Power Grid Corporation of India Limited 1.18%HCL Technologies Ltd 1.03%Others (with < 1% exposure) 1.94%
Debt 48 76%
To optimize returns over medium to long term, by aiming balance between risk and return, through
investments in high quality equity and debt instruments.
Asset Mix
ParticularsInvestment Pattern
Actual
Benchmark :
CNX Nifty Index ‐ 50%
CRISIL Composite Bond Index ‐ 50%
INDIVIDUAL PENSION FUND APEX BALANCED - AUGUST 2016
Equity
For New Dhruv Tara Products
Debt, MM & Others
AAA38.12%
Debt Rating Profile (% of Debt)
Debt48.76%
Equity49.26%
MM & Others1.98%
Asset Allocation (% to AUM)
Debt 48.76%
Gilts & SDL 24.42%
GOI 22.64%
SDL ‐ TAMIL NADU 1.78%
SDL ‐ Other States (with < 1% exposure) 0.00%
Corporate Bonds 24.34%
IL & FS LTD. 6.16%
LIC HOUSING FINANCE LTD 5.83%
RELIANCE GAS TRANSPORTN INFRA LTD. 3.10%
TATA SONS LTD. 2.92%
HINDALCO INDUSTRIES LTD. 2.90%
STEEL AUTHORITY OF INDIA LTD. 2.85%Others (with < 1% exposure) 0.58%
MM & Others 1.98%
Total 100.00%
`
1 Month 3 Month 6 Month 1 Year 2 Year 3 Year Since InceptionFund returns vis a vis Benchmark
Absolute CAGR (Annualised)
20.41%
10.43%
7.71%
5.83%
5.75%
5.02%
4.24%
3.95%
2.67%
1.98%
Financial & Insurance Activities
Infrastructure
Computer programming, consultancy and related activities
Housing Sector
Manufacture of Basic Metals
Manufacture of motor vehicles, trailers and semi‐trailers
Manufacture of coke and refined petroleum products
Manufacture of tobacco products
Civil engineering
Extraction of crude petroleum and natural gas
Top 10 Industry Exposure ( % to AUM)
3‐5 years 5‐10 years > 10 years
31.33%
40.66%
28.00%
Debt Maturity Profile ( % of Debt)
AA5.84%AA‐
5.96%
Gilts50.09%
9.30
10.30
11.30
12.30
13.30
14.30
15.30
16.30
17.30
18.30
Jan‐10
Apr‐10
Jul‐10
Oct‐10
Jan‐11
Apr‐11
Jul‐11
Oct‐11
Jan‐12
Apr‐12
Jul‐12
Oct‐12
Jan‐13
Apr‐13
Jul‐13
Oct‐13
Jan‐14
May‐14
Aug‐14
Nov‐14
Feb‐15
May‐15
Aug‐15
Nov‐15
Feb‐16
May‐16
Aug‐16
NAV/U
NIT (Rs)
NAV Performance (Since Inception)
NAV Benchmark
Modified Duration ‐ 5.65 yrs
pIndividual Pension Fund ‐ Apex Balanced 1.54% 6.44% 18.21% 10.98% 8.37% 15.15% 9.13%
Benchmark 1.47% 6.12% 16.67% 11.29% 8.75% 14.75% 8.69%
Trademark used under licence from respective owners.

Investment Objective :
Date of Inception : SFIN No.
March 31, 2009 ULIF 007 31/03/09 SUD‐PI‐BL1 142
Products : AUM :
Rs. 11.96 Cr
Portfolio % to AUM
`
Equity 28.22% Minimum Maximum
Infosys Technologies Ltd. 2.47% 0% 60% 28.22%
HDFC Bank Ltd 2.16% 40% 100% 71.78%
Housing Development Finance Corporation Ltd. 2.08%
ITC Ltd. 1.98%Reliance Industries Ltd 1.90%
ICICI Bank Ltd 1.78%
Larsen & Toubro Limited 1.73%
Tata Motors Limited 1.57%
Axis Bank Limited 1.50%
Sun Pharmaceuticals Industries Ltd 1.49%
Tata Consultancy Services Limited 1.26%
IndusInd Bank Limited 1.24%
State Bank of India 1.13%
Maruti Suzuki India Limited 1.06%
Others (with < 1% exposure) 4.86%
Debt 65.11%
Gilts & SDL 29.67%
GOI 15.87%SDL MAHARASHTRA 9.22%SDL ‐ KERALA 4.58%SDL (with < 1% exposure) 0.00%
Corporate Bonds 35.44%
LIC HOUSING FINANCE LTD 6.94%
To aim for stable returns over medium to long term through investments in high quality fixed income and
money market instruments and enhance returns through a fair exposure to equity investments.
Asset Mix
ParticularsInvestment Pattern
Actual
Benchmark :
CNX Nifty Index ‐ 30%
CRISIL Composite Bond Index ‐ 70%
INDIVIDUAL PENSION FUND BALANCED - AUGUST 2016
Equity
For Dhruv Tara Products
Debt, MM & Others
AAA45.37%
Gilts45.57%
Debt Rating Profile (% of Debt)
Debt65.11%
Equity28.22%
MM & Others6.67%
Asset Allocation (% to AUM)
THE INDIAN HOTELS COMPANY LTD. 5.90%RURAL ELECTRIFICATION CORPORATION L 5.85%
RELIANCE PORTS & TERMINALS LTD. 4.66%
THE GREAT EASTERN SHIPPING CO. LTD. 4.43%
IL & FS LTD. 1.84%
HDFC LTD. 1.82%
LARSEN & TOUBRO LTD. 1.74%
STATE BANK OF INDIA 1.36%
Others (with < 1% exposure) 0.90%
MM & Others 6.67%
Total 100.00%
`
1 Month 3 Month 6 Month 1 Year 2 Year 3 Year Since InceptionFund returns vis a vis Benchmark
Absolute CAGR (Annualised)
14.11%
11.25%
8.77%
5.90%
4.43%
3.73%
3.47%
2.64%
2.63%
2.62%
Infrastructure
Financial & Insurance Activities
Housing Sector
Accommodation
Water transport
Computer programming, consultancy and related activities
Civil engineering
Manufacture of pharmaceuticals,medicinal chemical and botanical products
Manufacture of motor vehicles, trailers and semi‐trailers
Manufacture of coke and refined petroleum products
Top 10 Industry Exposure ( % to AUM)
< 1 year 1‐3 years 3‐5 years 5‐10 years > 10 years
18.05%
5.33%
23.34%
28.91%
24.38%
Debt Maturity Profile ( % of Debt)
Modified Duration ‐ 4.14 yrs
AA9.06%
9.5010.0010.5011.0011.5012.0012.5013.0013.5014.0014.5015.0015.5016.0016.5017.0017.5018.0018.5019.0019.5020.0020.5021.0021.5022.00
Mar‐09
Jun‐09
Sep‐09
Dec‐09
Mar‐10
Jun‐10
Sep‐10
Dec‐10
Mar‐11
Jun‐11
Sep‐11
Dec‐11
Mar‐12
Jun‐12
Sep‐12
Dec‐12
Mar‐13
Jun‐13
Sep‐13
Dec‐13
Mar‐14
Jun‐14
Sep‐14
Nov‐14
Feb‐15
May‐15
Aug‐15
Nov‐15
Feb‐16
May‐16
Aug‐16
NAV/U
NIT (Rs)
NAV Performance (Since Inception)
NAV Benchmark
Individual Pension Fund ‐ Balanced 1.07% 5.27% 13.50% 10.74% 8.90% 13.07% 10.61%Benchmark 1.37% 5.49% 13.16% 11.54% 10.08% 13.67% 10.70%
Trademark used under licence from respective owners.

Investment Objective :
Date of Inception : SFIN No. Benchmark :
April 29, 2011 ULIF 017 29/04/11 SUD‐LX‐BL1 142 CNX Nifty Index ‐ 30%
CRISIL Composite Bond Index ‐ 70%
Products : AUM :
For Dhan Suraksha Express Rs. 72.33 Cr
Portfolio % to AUM
`
Equity 28.10% Minimum Maximum
Infosys Technologies Ltd. 2.05% 0% 60% 28.10%
HDFC Bank Ltd 1.79% 40% 100% 71.90%
ICICI Bank Ltd 1.69%
ITC Ltd. 1.64%
Tata Motors Limited 1.60%
Reliance Industries Ltd 1.59%
Larsen & Toubro Limited 1.57%
Housing Development Finance Corporation Ltd. 1.55%
Axis Bank Limited 1.39%
Tata Consultancy Services Limited 1.30%
Sun Pharmaceuticals Industries Ltd 1.15%
Others (with < 1% exposure) 10.77%
Debt 64.16%
Gilts & SDL 29.99%
GOI 25.57%
SDL ‐ TAMIL NADU 2.51%
SDL MAHARASHTRA 1.15%
Other SDL (with < 1% exposure) 0.76%
Corporate Bonds 34.17%
THE GREAT EASTERN SHIPPING CO. LTD. 3.66%
POWER FINANCE CORPORATION LTD 3 43%
To optimize returns over medium to long term, by aiming balance between risk and return, through investments in
high quality equity and debt instruments.
Asset Mix
ParticularsInvestment Pattern
Actual
EXPRESS BALANCED FUND - AUGUST 2016
Equity
Debt, MM & Others
AAA
Debt Rating Profile (% of Debt)
Debt64.16%
Equity28.10%
MM & Others7.74%
Asset Allocation( % to AUM)
POWER FINANCE CORPORATION LTD. 3.43%
RELIANCE GAS TRANSPORTN INFRA LTD. 3.07%
FULLERTON INDIA CREDIT COMPANY LTD. 2.78%
IL & FS LTD. 2.69%
LIC HOUSING FINANCE LTD 2.14%
VEDANTA LIMITED 2.10%
RELIANCE PORTS & TERMINALS LTD. 2.00%
POWER GRID CORPORATION OF INDIA LTD 1.82%
TATA SONS LTD. 1.45%
STCI FINANCE LIMITED 1.41%
HINDUSTAN PETROLEUM CORPORATION LTD 1.41%
THE INDIAN HOTELS COMPANY LTD. 1.39%
HDFC LTD. 1.03%
Others (with < 1% exposure) 3.79%
MM & Others 7.74%
Total 100.00%
1 Month 3 Month 6 Month 1 Year 2 Year 3 Year Since InceptionFund returns vis a vis Benchmark
Absolute CAGR (Annualised)
14.88%
14.24%
4.86%
4.44%
3.66%
3.25%
3.17%
2.97%
2.44%
2.10%
Infrastructure
Financial & Insurance Activities
Other financial activities
Computer programming, consultancy and related activities
Water transport
Manufacture of coke and refined petroleum products
Housing Sector
Manufacture of motor vehicles, trailers and semi‐trailers
Civil engineering
Mining of metal ores
Top 10 Industry Exposure ( % to AUM)
< 1 year 1‐3 years 3‐5 years 5‐10 years > 10 years
8.01%
12.77%
21.34%
39.92%
17.96%
Debt Maturity Profile ( % of Debt)
39.74%
AA+4.33%AA
3.27%
AA‐5.93%
Gilts46.74%
9.50
10.50
11.50
12.50
13.50
14.50
15.50
16.50
17.50
Apr‐11
Jul‐11
Oct‐11
Jan‐12
May‐12
Aug‐12
Nov‐12
Feb‐13
May‐13
Aug‐13
Nov‐13
Feb‐14
May‐14
Aug‐14
Nov‐14
Feb‐15
May‐15
Aug‐15
Nov‐15
Feb‐16
May‐16
Aug‐16
NAV/U
NIT (Rs)
NAV Performance (Since Inception)
NAV Benchmark
Modified Duration ‐ 4.25 yrs
pExpress Balanced Fund 1.20% 5.19% 12.61% 10.24% 9.31% 13.23% 9.49%
Benchmark 1.37% 5.49% 13.16% 11.54% 10.08% 13.67% 9.29%
Trademark used under licence from respective owners.

Investment Objective :
Date of Inception : SFIN No. Benchmark :
January 29, 2014 ULIF 024 11/12/13 SUD‐LI‐BL2 142 CNX Nifty Index ‐ 30%
CRISIL Composite Bond Index ‐ 70%
Products : AUM :
For Dhan Suraksha Plus & Wealth Builder Plan Rs.134.84 Cr
Portfolio % to AUM
`
Equity 29.74% Minimum Maximum
Infosys Technologies Ltd. 2.44% 0% 60% 29.74%
HDFC Bank Ltd 2.33% 40% 100% 57.34%
ICICI Bank Ltd 2.12% 0% 30% 12.92%
ITC Ltd. 1.94%
Housing Development Finance Corporation Ltd. 1.72%
Larsen & Toubro Limited 1.64%
Tata Motors Limited 1.52%
IndusInd Bank Limited 1.39%
Reliance Industries Ltd 1.34%
Axis Bank Limited 1.30%
Oil & Natural Gas Corpn Ltd 1.25%
Tata Consultancy Services Limited 1.10%
Others (with < 1% exposure) 9.64%
Debt 57.34%
Gilts & SDL 31.16%
GOI 26.81%
SDL MAHARASHTRA 2.39%
SDL ‐ TAMIL NADU 1.35%
SDL (with < 1% exposure) 0.61%
Corporate Bonds 26.19%
LARSEN & TOUBRO LTD. 3.24%
HDFC LTD. 3.17%
POWER FINANCE CORPORATION LTD 2 77%
To optimize returns over medium to long term, by aiming balance between risk and return, through investments
in high quality equity and debt instruments.
Asset Mix
ParticularsInvestment Pattern
Actual
BALANCED PLUS FUND - AUGUST 2016
MM & Others
Equity
Debt
AAA34.35%
Gilts54.33%
Debt Rating Profile (% of Debt)
Debt57.34%
Equity29.74%
MM & Others12.92%
Asset Allocation( % to AUM)
POWER FINANCE CORPORATION LTD. 2.77%
RELIANCE PORTS & TERMINALS LTD. 2.31%
RURAL ELECTRIFICATION CORPORATION L 2.28%
VEDANTA LIMITED 1.88%
THE GREAT EASTERN SHIPPING CO. LTD. 1.81%
STCI FINANCE LIMITED 1.52%
IRFC LTD. 1.04%
INDIAN OIL CORPORATION LTD 1.03%
Others (with < 1% exposure) 5.13%
MM & Others 12.92%
Total 100.00%
`
1 Month 3 Month 6 Month 1 Year 2 Year 3 Year Since InceptionBalance Plus Fund 1 34% 5 36% 13 45% 10 65% 9 18% NA 13 04%
Fund returns vis a vis BenchmarkAbsolute CAGR (Annualised)
12.97%
10.12%
8.11%
4.89%
4.24%
3.96%
2.62%
2.60%
1.94%
1.90%
Financial & Insurance Activities
Infrastructure
Other financial activities
Civil engineering
Computer programming, consultancy and related activities
Housing Sector
Manufacture of motor vehicles, trailers and semi‐trailers
Manufacture of coke and refined petroleum products
Manufacture of tobacco products
Manufacture of pharmaceuticals,medicinal chemical and botanical products
Top 10 Industry Exposure ( % to AUM)
< 1 year 1‐3 years 3‐5 years 5‐10 years > 10 years
2.86%
10.09%
20.62%
39.03%
27.39%
Debt Maturity Profile ( % of Debt)
AA+1.94%AA
1.84%
AA‐7.54%
9.9010.1010.3010.5010.7010.9011.1011.3011.5011.7011.9012.1012.3012.5012.7012.9013.1013.3013.5013.7013.9014.10
Jan‐14
Apr‐14
Jun‐14
Sep‐14
Nov‐14
Jan‐15
Apr‐15
Jun‐15
Aug‐15
Nov‐15
Jan‐16
Mar‐16
Jun‐16
Aug‐16
NAV/U
NIT (Rs)
NAV Performance (Since Inception)
NAV Benchmark
Modified Duration ‐ 4.65 yrs
Balance Plus Fund 1.34% 5.36% 13.45% 10.65% 9.18% NA 13.04%Benchmark 1.37% 5.49% 13.16% 11.54% 10.08% NA 13.06%
Trademark used under licence from respective owners.

Investment Objective :
Date of Inception : SFIN No.
January 20, 2010 ULIF 012 20/01/10 SUD‐LA‐BN1 142
Products : AUM :
Rs. 197.53 Cr
Portfolio % to AUM
`
Debt 89.62% Minimum Maximum
Gilts & SDL 36.97% 80% 100% 89.62%
GOI 30.45% 0% 20% 10.38%
SDL ‐ TAMIL NADU 3.62%
SDL MAHARASHTRA 1.96%
SDL (with < 1% exposure) 0.95%
Corporate Bonds 52.65%
NATIONAL THERMAL POWER CORPORATION 3.82%
LIC HOUSING FINANCE LTD 3.68%
M & M FINANCIAL SERVICES LTD. 3.59%
IL & FS LTD. 3.55%
POWER GRID CORPORATION OF INDIA LTD 3.29%
STEEL AUTHORITY OF INDIA LTD. 2.86%
HDFC LTD. 2.70%
RELIANCE PORTS & TERMINALS LTD. 2.65%
RURAL ELECTRIFICATION CORPORATION L 2.65%
HINDUSTAN PETROLEUM CORPORATION LTD 2.58%
FULLERTON INDIA CREDIT COMPANY LTD. 2.57%
POWER FINANCE CORPORATION LTD. 2.43%
To aim for stable returns over medium to long term by judicious mix of investments in Government securities
and high quality corporate debt of varying maturities and also in money market instruments.
Investment PatternActual
Asset Mix
For New Dhan Suraksha, New Dhan Suraksha Premium,
New Prabhat Tara, Dhan Suraksha 3, Dhan Suraksha
Premium 3 & Prabhat Tara 3.
Benchmark :
CRISIL Composite Bond Index ‐ 90%
CRISIL Liquid Fund Index ‐ 10%
APEX BOND FUND - AUGUST 2016
DEBT
MM & Others
Particulars
Debt89.62%
MM & Others10.38%
Asset Allocation (% to AUM)
AAA38.50%Gilts
41.25%
Debt Rating Profile (% of Debt)
TATA SONS LTD. 1.70%
TATA CAPITAL FINANCIAL SERVICES LTD 1.55%
THE GREAT EASTERN SHIPPING CO. LTD. 1.39%
MRF LTD. 1.34%
L&T HOUSING FINANCE LIMITED 1.33%
LARSEN & TOUBRO LTD. 1.27%
HINDALCO INDUSTRIES LTD. 1.26%
L & T FINANCE LTD. 1.03%
VEDANTA LIMITED 1.03%
THE INDIAN HOTELS COMPANY LTD. 1.02%
Others (with < 1% exposure) 3.35%
MM & Others 10.38%
Total 100.00%
`
1 Month 3 Month 6 Month 1 Year 2 Year 3 Year Since InceptionFund returns vis a vis Benchmark Absolute CAGR (Annualised)
19.12%
13.02%
7.72%
5.50%
4.13%
3.05%
1.39%
1.34%
1.27%
1.03%
Infrastructure
Financial & Insurance Activities
Housing Sector
Other financial activities
Manufacture of Basic Metals
Manufacture of coke and refined petroleum products
Water transport
Manufacture of rubber and plastics products
Civil engineering
Mining of metal ores
Top 10 Industry Exposure ( % to AUM)
< 1 year 1‐3 years 3‐5 years 5‐10 years > 10 years
4.19%
16.91%13.86%
45.34%
19.70%
Debt Maturity Profile ( % of Debt)
AA+12.77%
AA4.34%
AA‐3.13%
9.50
10.00
10.50
11.00
11.50
12.00
12.50
13.00
13.50
14.00
14.50
15.00
15.50
16.00
16.50
Jan‐10
Apr‐10
Jul‐10
Oct‐10
Jan‐11
Apr‐11
Jul‐11
Oct‐11
Jan‐12
Apr‐12
Jul‐12
Oct‐12
Jan‐13
Apr‐13
Jul‐13
Oct‐13
Jan‐14
May‐14
Aug‐14
Nov‐14
Feb‐15
May‐15
Aug‐15
Nov‐15
Feb‐16
May‐16
Aug‐16
NAV/U
NIT (Rs)
NAV Performance (Since Inception)
NAV Benchmark
Modified Duration ‐ 4.40 yrs
1 Month 3 Month 6 Month 1 Year 2 Year 3 Year Since InceptionApex Bond Fund 1.15% 4.36% 7.99% 10.94% 11.36% 11.20% 8.45%Benchmark 1.15% 4.25% 7.60% 11.35% 11.55% 11.56% 8.44%
Trademark used under licence from respective owners.
Investment Objective :
Date of Inception : SFIN No. Benchmark :
February 25, 2009 ULIF 004 25/02/09 SUD‐LI‐BN1 142 CRISIL Composite Bond Index ‐ 90%
CRISIL Liquid Fund Index ‐ 10%
Products : AUM :
Rs. 9.91 Cr
Portfolio % to AUM
`
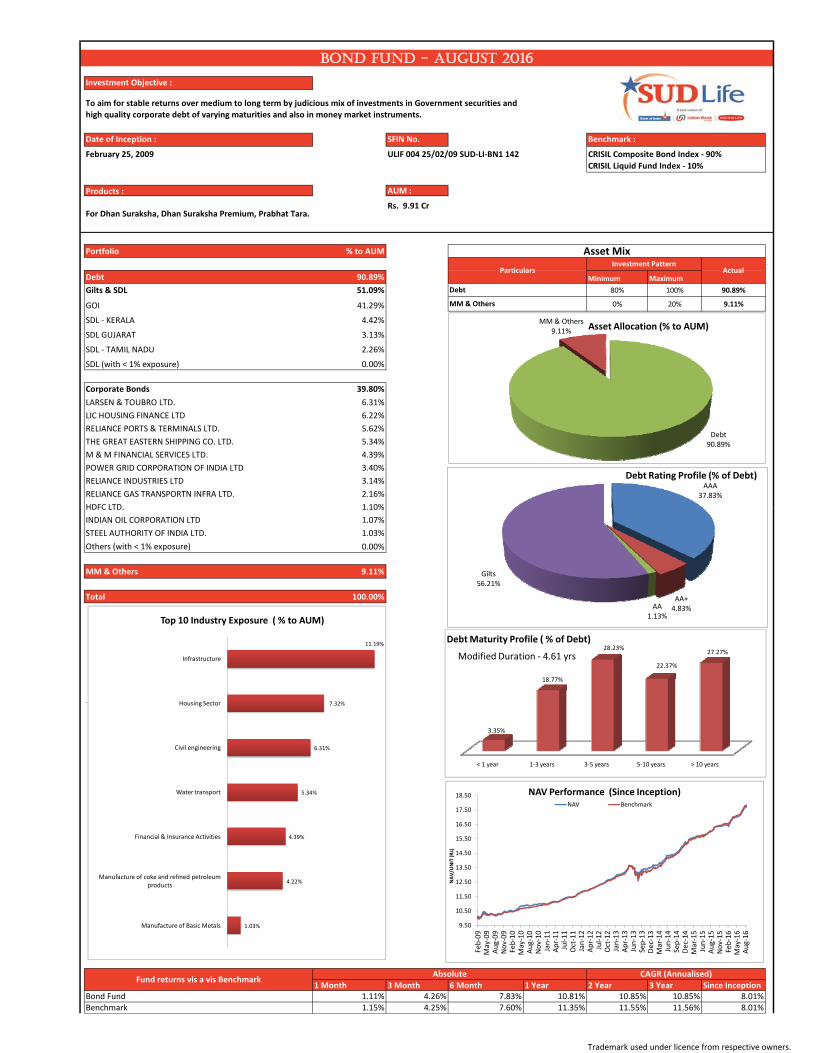
Debt 90.89% Minimum Maximum
Gilts & SDL 51.09% 80% 100% 90.89%
GOI 41.29% 0% 20% 9.11%
SDL ‐ KERALA 4.42%
SDL GUJARAT 3.13%
SDL ‐ TAMIL NADU 2.26%
SDL (with < 1% exposure) 0.00%
Corporate Bonds 39.80%
LARSEN & TOUBRO LTD. 6.31%
LIC HOUSING FINANCE LTD 6.22%
RELIANCE PORTS & TERMINALS LTD. 5.62%
THE GREAT EASTERN SHIPPING CO. LTD. 5.34%
M & M FINANCIAL SERVICES LTD. 4.39%
POWER GRID CORPORATION OF INDIA LTD 3.40%
RELIANCE INDUSTRIES LTD 3.14%
RELIANCE GAS TRANSPORTN INFRA LTD. 2.16%
HDFC LTD 1 10%
To aim for stable returns over medium to long term by judicious mix of investments in Government securities and
high quality corporate debt of varying maturities and also in money market instruments.
Investment PatternActual
Asset Mix
Particulars
For Dhan Suraksha, Dhan Suraksha Premium, Prabhat Tara.
BOND FUND - AUGUST 2016
Debt
MM & Others
Debt90.89%
MM & Others9.11%
Asset Allocation (% to AUM)
AAA37.83%
Debt Rating Profile (% of Debt)
HDFC LTD. 1.10%
INDIAN OIL CORPORATION LTD 1.07%
STEEL AUTHORITY OF INDIA LTD. 1.03%
Others (with < 1% exposure) 0.00%
MM & Others 9.11%
Total 100.00%
`
1 Month 3 Month 6 Month 1 Year 2 Year 3 Year Since InceptionBond Fund 1.11% 4.26% 7.83% 10.81% 10.85% 10.85% 8.01%
Fund returns vis a vis BenchmarkAbsolute CAGR (Annualised)
11.19%
7.32%
6.31%
5.34%
4.39%
4.22%
1.03%
Infrastructure
Housing Sector
Civil engineering
Water transport
Financial & Insurance Activities
Manufacture of coke and refined petroleum products
Manufacture of Basic Metals
Top 10 Industry Exposure ( % to AUM)
< 1 year 1‐3 years 3‐5 years 5‐10 years > 10 years
3.35%
18.77%
28.23%
22.37%
27.27%
Debt Maturity Profile ( % of Debt)
AA+4.83%AA
1.13%
Gilts56.21%
9.50
10.50
11.50
12.50
13.50
14.50
15.50
16.50
17.50
18.50
Feb‐09
May‐09
Aug‐09
Nov‐09
Feb‐10
May‐10
Aug‐10
Nov‐10
Jan‐11
Apr‐11
Jul‐11
Oct‐11
Jan‐12
Apr‐12
Jul‐12
Oct‐12
Jan‐13
Apr‐13
Jun‐13
Sep‐13
Dec‐13
Mar‐14
Jun‐14
Sep‐14
Dec‐14
Mar‐15
Jun‐15
Aug‐15
Nov‐15
Feb‐16
May‐16
Aug‐16
NAV/U
NIT (Rs)
NAV Performance (Since Inception)NAV Benchmark
Modified Duration ‐ 4.61 yrs
Benchmark 1.15% 4.25% 7.60% 11.35% 11.55% 11.56% 8.01%
Trademark used under licence from respective owners.

Investment Objective :
Date of Inception : SFIN No.
January 20, 2010 ULIF 016 20/01/10 SUD‐PA‐BN1 142
Products : AUM :
For New Dhruv Tara Products Rs. 5.42 Cr
Portfolio % to AUM
`
Debt 93.10% Minimum Maximum
Gilts & SDL 67.07% 80% 100% 93.10%
GOI 49.16% 0% 20% 6.90%
SDL MAHARASHTRA 13.99%SDL (with < 1% exposure) 3.92%
Corporate Bonds 26.03%
POWER GRID CORPORATION OF INDIA LTD 6.22%
RELIANCE PORTS & TERMINALS LTD. 6.16%
HDFC LTD. 4.02%
TATA SONS LTD. 3.86%
HINDALCO INDUSTRIES LTD. 3.84%
LARSEN & TOUBRO LTD. 1.92%Others (with < 1% exposure) 0.00%
MM & Others 6.90%
Total 100.00%
To aim for stable returns over medium to long term by judicious mix of investments in Government securities and
high quality corporate debt of varying maturities and also in money market instruments.
Asset Mix
ParticularsInvestment Pattern
Actual
Benchmark :
CRISIL Composite Bond Index ‐ 90%
CRISIL Liquid Fund Index ‐ 10%
INDIVIDUAL PENSION FUND APEX BOND - AUGUST 2016
DEBT
MM & Others
Top 10 Industry Exposure ( % to AUM)
Debt93.10%
MM & Others6.90%
Asset Allocation( % to AUM)
AAA23.84%
AA‐4.12%
Debt Rating Profile (% of Debt)
`
1 Month 3 Month 6 Month 1 Year 2 Year 3 Year Since InceptionFund returns vis a vis Benchmark
Absolute CAGR (Annualised)
12.39%
4.02%
3.86%
3.84%
1.92%
Infrastructure
Housing Sector
Financial & Insurance Activities
Manufacture of Basic Metals
Civil engineering
1‐3 years 3‐5 years 5‐10 years > 10 years
4.15%
33.91%
35.42%
26.51%
Debt Maturity Profile ( % of Debt)
Gilts72.04%
9.50
10.50
11.50
12.50
13.50
14.50
15.50
16.50
Jan‐10
Apr‐10
Jul‐10
Oct‐10
Jan‐11
Apr‐11
Jul‐11
Oct‐11
Jan‐12
Apr‐12
Jul‐12
Oct‐12
Jan‐13
Apr‐13
Jul‐13
Oct‐13
Jan‐14
May‐14
Aug‐14
Nov‐14
Feb‐15
May‐15
Aug‐15
Nov‐15
Feb‐16
May‐16
Aug‐16
NAV/U
NIT (Rs)
NAV Performance (Since Inception)
NAV Benchmark
Modified Duration ‐ 5.37 yrs
p
Individual Pension Fund ‐ Apex Bond 1.24% 4.65% 8.26% 11.17% 11.22% 11.12% 8.21%Benchmark 1.15% 4.25% 7.60% 11.35% 11.55% 11.56% 8.44%
Trademark used under licence from respective owners.

Investment Objective :
Date of Inception : SFIN No.
March 31, 2009 ULIF 008 31/03/09 SUD‐PI‐BN1 142
Products : AUM :
Rs. 3.93 Cr
Portfolio % to AUM
`
Debt 89.43% Minimum Maximum
Gilts & SDL 46.30% 80% 100% 89.43%
GOI 35.43% 0% 20% 10.57%
SDL ‐ TAMIL NADU 5.70%
SDL ‐ KERALA 5.17%
SDL (with < 1% exposure) 0.00%
Corporate Bonds 43.12%
LARSEN & TOUBRO LTD. 7.91%
POWER GRID CORPORATION OF INDIA LTD 5.73%
MRF LTD. 5.60%
INDIAN OIL CORPORATION LTD 5.43%
STEEL AUTHORITY OF INDIA LTD. 5.19%
RELIANCE GAS TRANSPORTN INFRA LTD. 2.73%
THE GREAT EASTERN SHIPPING CO. LTD. 2.70%
RURAL ELECTRIFICATION CORPORATION L 2.64%
LIC HOUSING FINANCE LTD 2.61%
NATIONAL BANK FOR AGRI & RURAL DEVE 2.58%
Others (with < 1% exposure) 0.00%
To aim for stable returns over medium to long term by judicious mix of investments in Government securities
and high quality corporate debt of varying maturities and also in money market instruments.
Asset Mix
ParticularsInvestment Pattern
Actual
Benchmark :
CRISIL Composite Bond Index ‐ 90%
CRISIL Liquid Fund Index ‐ 10%
INDIVIDUAL PENSION FUND BOND - AUGUST 2016
Debt
For Dhruv Tara Products
MM & Others
Debt89.43%
MM & Others10.57%
Asset Allocation (% to AUM)
AAA42.42%
Debt Rating Profile (% of Debt)
MM & Others 10.57%
Total 100.00%
`
1 Month 3 Month 6 Month 1 Year 2 Year 3 Year Since InceptionFund returns vis a vis Benchmark
Absolute CAGR (Annualised)
13.69%
7.91%
5.60%
5.43%
5.19%
2.70%
2.61%
Infrastructure
Civil engineering
Manufacture of rubber and plastics products
Manufacture of coke and refined petroleum products
Manufacture of Basic Metals
Water transport
Housing Sector
Top 10 Industry Exposure ( % to AUM)
< 1 year 1‐3 years 3‐5 years 5‐10 years > 10 years
2.89%
26.86%29.53%
18.67%
22.05%
Debt Maturity Profile ( % of Debt)
AA5.81%
Gilts51.78%
9.70
10.70
11.70
12.70
13.70
14.70
15.70
16.70
17.70
18.70
Mar‐09
Jun‐09
Sep‐09
Dec‐09
Mar‐10
May‐10
Aug‐10
Nov‐10
Feb‐11
Apr‐11
Jul‐11
Oct‐11
Jan‐12
Mar‐12
Jun‐12
Sep‐12
Dec‐12
Feb‐13
May‐13
Aug‐13
Nov‐13
Jan‐14
Apr‐14
Jul‐14
Oct‐14
Dec‐14
Mar‐15
Jun‐15
Sep‐15
Dec‐15
Feb‐16
May‐16
Aug‐16
NAV/U
NIT (Rs)
NAV Performance (Since Inception)
NAV Benchmark
Modified Duration ‐ 4.22 yrs
1 Month 3 Month 6 Month 1 Year 2 Year 3 Year Since InceptionIndividual Pension Fund ‐ Bond 1.06% 4.08% 7.21% 10.36% 10.61% 10.65% 7.92%Benchmark 1.15% 4.25% 7.60% 11.35% 11.55% 11.56% 8.10%
Trademark used under licence from respective owners.
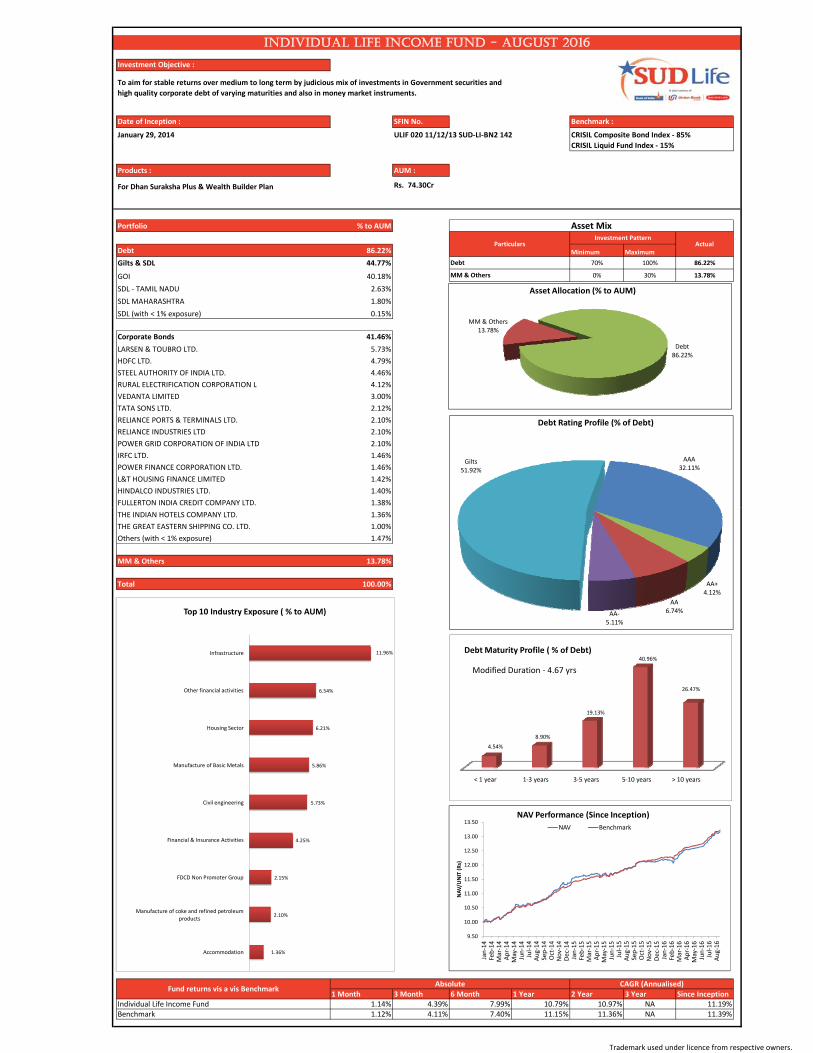
Investment Objective :
Date of Inception : SFIN No.
January 29, 2014 ULIF 020 11/12/13 SUD‐LI‐BN2 142
Products : AUM :
Rs. 74.30Cr
Portfolio % to AUM
`
Debt 86.22% Minimum Maximum
Gilts & SDL 44.77% 70% 100% 86.22%
GOI 40.18% 0% 30% 13.78%
SDL ‐ TAMIL NADU 2.63%
SDL MAHARASHTRA 1.80%
SDL (with < 1% exposure) 0.15%
Corporate Bonds 41.46%
LARSEN & TOUBRO LTD. 5.73%
HDFC LTD. 4.79%
STEEL AUTHORITY OF INDIA LTD. 4.46%
RURAL ELECTRIFICATION CORPORATION L 4.12%
VEDANTA LIMITED 3.00%
TATA SONS LTD. 2.12%
RELIANCE PORTS & TERMINALS LTD. 2.10%
RELIANCE INDUSTRIES LTD 2.10%
POWER GRID CORPORATION OF INDIA LTD 2.10%
IRFC LTD. 1.46%
POWER FINANCE CORPORATION LTD. 1.46%
L&T HOUSING FINANCE LIMITED 1.42%
HINDALCO INDUSTRIES LTD. 1.40%
FULLERTON INDIA CREDIT COMPANY LTD. 1.38%
To aim for stable returns over medium to long term by judicious mix of investments in Government securities and
high quality corporate debt of varying maturities and also in money market instruments.
Benchmark :
CRISIL Composite Bond Index ‐ 85%
INDIVIDUAL LIFE INCOME FUND - AUGUST 2016
CRISIL Liquid Fund Index ‐ 15%
MM & Others
For Dhan Suraksha Plus & Wealth Builder Plan
Asset Mix
ParticularsInvestment Pattern
Actual
Debt
Debt86.22%
MM & Others13.78%
Asset Allocation (% to AUM)
AAA32.11%
Gilts51.92%
Debt Rating Profile (% of Debt)
THE INDIAN HOTELS COMPANY LTD. 1.36%
THE GREAT EASTERN SHIPPING CO. LTD. 1.00%
Others (with < 1% exposure) 1.47%
MM & Others 13.78%
Total 100.00%
1 Month 3 Month 6 Month 1 Year 2 Year 3 Year Since InceptionFund returns vis a vis Benchmark
Absolute CAGR (Annualised)
AA+4.12%
AA6.74%AA‐
5.11%
< 1 year 1‐3 years 3‐5 years 5‐10 years > 10 years
4.54%
8.90%
19.13%
40.96%
26.47%
Debt Maturity Profile ( % of Debt)
9.50
10.00
10.50
11.00
11.50
12.00
12.50
13.00
13.50
Jan‐14
Feb‐14
Mar‐14
Apr‐14
May‐14
Jun‐14
Jul‐14
Aug‐14
Sep‐14
Oct‐14
Nov‐14
Dec‐14
Jan‐15
Feb‐15
Mar‐15
Apr‐15
May‐15
Jun‐15
Jul‐15
Aug‐15
Sep‐15
Oct‐15
Nov‐15
Dec‐15
Jan‐16
Feb‐16
Mar‐16
Apr‐16
May‐16
Jun‐16
Jul‐16
Aug‐16
NAV/U
NIT (Rs)
NAV Performance (Since Inception)
NAV Benchmark
Modified Duration ‐ 4.67 yrs
11.96%
6.54%
6.21%
5.86%
5.73%
4.25%
2.15%
2.10%
1.36%
Infrastructure
Other financial activities
Housing Sector
Manufacture of Basic Metals
Civil engineering
Financial & Insurance Activities
FDCD Non Promoter Group
Manufacture of coke and refined petroleum products
Accommodation
Top 10 Industry Exposure ( % to AUM)
Individual Life Income Fund 1.14% 4.39% 7.99% 10.79% 10.97% NA 11.19%Benchmark 1.12% 4.11% 7.40% 11.15% 11.36% NA 11.39%
Trademark used under licence from respective owners.

Investment Objective :
Date of Inception : SFIN No.
October 6, 2015 ULGF 003 20/03/15 SUD‐GN‐BN1 142
Products : AUM :
Rs. 10.05 Cr
Portfolio % to AUM
`
Debt 84.86% Minimum Maximum
Gilts & SDL 42.78% 70% 100% 84.86%
GOI 25.41% 0% 30% 10.16%
SDL GUJARAT 6.23% 0% 15% 4.98%
SDL ‐ TAMIL NADU 4.24% 0% 15% 0.00%
SDL MAHARASHTRA 4.16%
SDL ‐ KERALA 2.72%
SDL (with < 1% exposure) 0.00%
Corporate Bonds 42.09%
MRF LTD. 5.47%
NATIONAL THERMAL POWER CORPORATION 5.34%
LIC HOUSING FINANCE LTD 5.23%
RELIANCE INDUSTRIES LTD 5.17%
LARSEN & TOUBRO LTD. 5.15%
RURAL ELECTRIFICATION CORPORATION L 5.15%
TATA SONS LTD. 4.16%
HDFC LTD. 3.26%
THE GREAT EASTERN SHIPPING CO. LTD. 3.16%
Others (with < 1% exposure) 0.00%
MM & Others 10.16%
To generate stable returns over medium to long term with full exposure in debt market instruments by judicious
mix of Government Securities and high quality corporate debt and also in money market instruments.
Benchmark :
CRISIL Composite Bond Index ‐ 90%
Debt
CRISIL Liquid Fund Index ‐ 10%
MM & Others
Mutual Funds
GROUP DEBT FUND - AUGUST 2016
For SUD Life Group Retirement Benefit Plan
Asset Mix
ParticularsInvestment Pattern
Actual
Fixed Deposits with Banks
Debt84.86%
MM & Others15.14%
Asset Allocation (% to AUM)
D bt R ti P fil (% f D bt)Mutual Fund 4.98%
Fixed Deposit with Banks 0.00%
Total 100.00%
1 Month 3 Month 6 Month 1 Year 2 Year 3 Year Since InceptionFund returns vis a vis Benchmark
Absolute CAGR (Annualised)
AAA49.60%
Gilts50.40%
Debt Rating Profile (% of Debt)
1‐3 years 3‐5 years 5‐10 years > 10 years
9.79%
23.60%
51.21%
15.39%
Debt Maturity Profile ( % of Debt)
10.00
10.20
10.40
10.60
10.80
11.00
11.20
6‐Oct‐15
23‐Oct‐15
9‐Nov‐15
26‐Nov‐15
13‐Dec‐15
30‐Dec‐15
16‐Jan
‐16
2‐Feb
‐16
19‐Feb
‐16
7‐M
ar‐16
24‐M
ar‐16
10‐Apr‐16
27‐Apr‐16
14‐M
ay‐16
31‐M
ay‐16
17‐Jun‐16
4‐Jul‐16
21‐Jul‐16
7‐Aug‐16
24‐Aug‐16
NAV/U
NIT (Rs)
NAV Performance (Since Inception)
NAV Benchmark
Modified Duration ‐ 4.25 yrs
10.49%
8.49%
5.47%
5.17%
5.15%
4.98%
4.16%
Infrastructure
Housing Sector
Manufacture of rubber and plastics products
Manufacture of coke and refined petroleum products
Civil engineering
Other financial activities
Financial & Insurance Activities
Top 10 Industry Exposure ( % to AUM)
1 Month 3 Month 6 Month 1 Year 2 Year 3 Year Since InceptionIndividual Life Income Fund 1.23% 4.59% 8.56% NA NA NA 9.89%Benchmark 1.13% 4.23% 8.33% NA NA NA 9.52%
Trademark used under licence from respective owners.
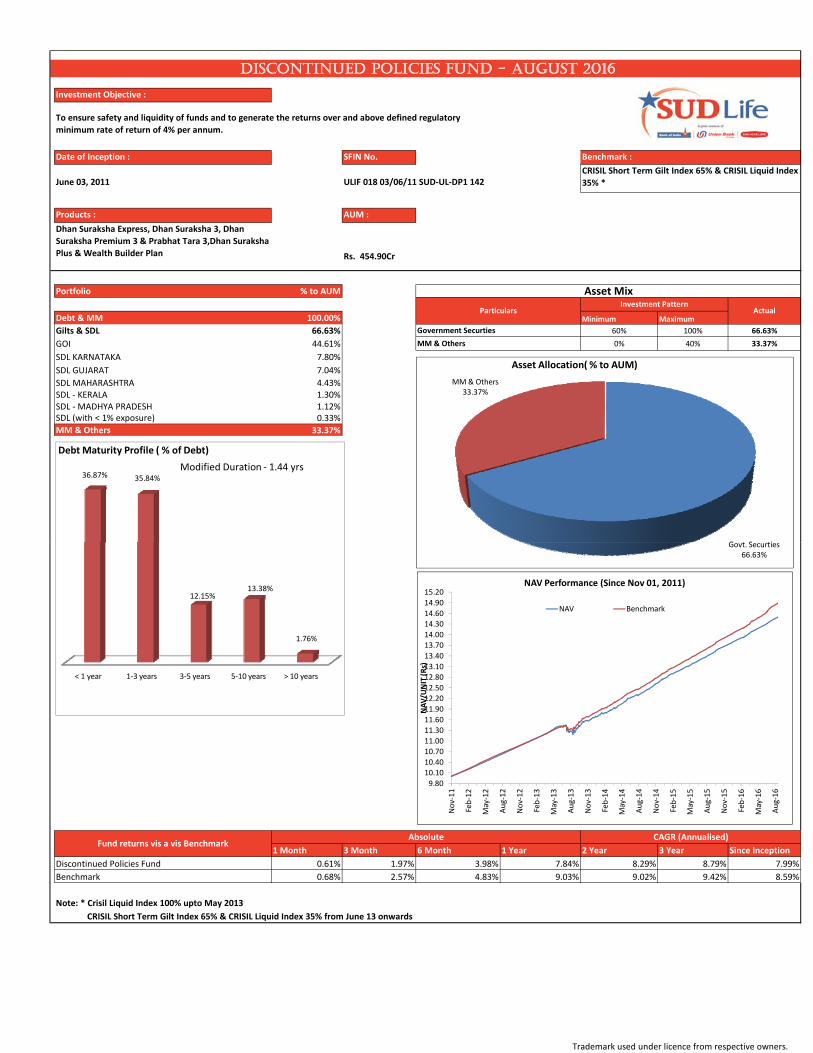
Investment Objective :
Date of Inception : SFIN No. Benchmark :
June 03, 2011 ULIF 018 03/06/11 SUD‐UL‐DP1 142
Products : AUM :
Dhan Suraksha Express, Dhan Suraksha 3, Dhan
Suraksha Premium 3 & Prabhat Tara 3,Dhan Suraksha
Plus & Wealth Builder Plan Rs. 454.90Cr
Portfolio % to AUM
Debt & MM 100.00% Minimum Maximum
Gilts & SDL 66.63% 60% 100% 66.63%
GOI 44.61% 0% 40% 33.37%
SDL KARNATAKA 7.80%
SDL GUJARAT 7.04%
SDL MAHARASHTRA 4.43%SDL ‐ KERALA 1.30%SDL ‐ MADHYA PRADESH 1.12%SDL (with < 1% exposure) 0.33%
MM & Others 33.37%
DISCONTINUED POLICIES FUND - AUGUST 2016
Government Securties
MM & Others
To ensure safety and liquidity of funds and to generate the returns over and above defined regulatory
minimum rate of return of 4% per annum.
Asset Mix
CRISIL Short Term Gilt Index 65% & CRISIL Liquid Index
35% *
ParticularsInvestment Pattern
Actual
G t S ti
MM & Others33.37%
Asset Allocation( % to AUM)
36.87% 35.84%
Debt Maturity Profile ( % of Debt)
Modified Duration ‐ 1.44 yrs
1 Month 3 Month 6 Month 1 Year 2 Year 3 Year Since Inception
Discontinued Policies Fund 0.61% 1.97% 3.98% 7.84% 8.29% 8.79% 7.99%
Benchmark 0.68% 2.57% 4.83% 9.03% 9.02% 9.42% 8.59%
Note: * Crisil Liquid Index 100% upto May 2013
CRISIL Short Term Gilt Index 65% & CRISIL Liquid Index 35% from June 13 onwards
Fund returns vis a vis BenchmarkAbsolute CAGR (Annualised)
Govt. Securties66.63%
9.80
10.1010.40
10.7011.00
11.3011.60
11.90
12.2012.50
12.8013.10
13.40
13.7014.00
14.3014.60
14.90
15.20
Nov‐11
Feb‐12
May‐12
Aug‐12
Nov‐12
Feb‐13
May‐13
Aug‐13
Nov‐13
Feb‐14
May‐14
Aug‐14
Nov‐14
Feb‐15
May‐15
Aug‐15
Nov‐15
Feb‐16
May‐16
Aug‐16
NAV/U
NIT (R
s)
NAV Performance (Since Nov 01, 2011)
NAV Benchmark
< 1 year 1‐3 years 3‐5 years 5‐10 years > 10 years
12.15%13.38%
1.76%
Trademark used under licence from respective owners.