Embed Size (px)
Citation preview

The Environmental ScanA Fact-Finding Report of the FederalGlass Ceiling CommissionWashington, D.C.
GOOD FOR BUSINESS: MAKING FULL USE OF THENATION’S HUMAN CAPITAL
THE VISIONOF THE GLASS CEILING COMMISSIONA national corporate leadership fully aware that shifting demographics and economic restructuringmake diversity a prerequisite for the long-term success of the United States in domestic and global market places.
THE MISSIONOF THE GLASS CEILING COMMISSION“There is established a Glass Ceiling Commission to conduct a study and prepare recommendations concerning—(1) eliminating artificial barriers to the advancement of women and minorities; and(2) increasing the opportunities and developmental experiences of women and minorities to foster advancement ofwomen and minorities to management and decisionmaking positions in business.”
Public Law 102-166—November 21, 1991Civil Rights Act of 1991
Section 203
GOOD FOR BUSINESS: MAKING FULL USE OF THENATION’S HUMAN CAPITAL

The Environmental ScanA Fact-Finding Report of the FederalGlass Ceiling CommissionWashington, D.C.
March 1995
GOOD FOR BUSINESS: MAKING FULL USE OF THENATION’S HUMAN CAPITAL

The Honorable Robert B. Reich, ChairmanSecretary of Labor
Mrs. Patricia V. AsipManager of Multi-Cultural Affairs J.C. Penney Company Inc.
Mr. J. Alphonso BrownPrincipalBrown Consulting Groups
Mrs. Joanne M. CollinsAssistant Vice PresidentUnited Missouri Bank of Kansas City
Mrs. Maria Contreras-SweetVice President of Public AffairsSeven-Up Royal Crown Bottling CompanyHispanics Organized for Political Equality
Mr. Earl G. GravesPresident and Chief Executive OfficerBlack Enterprise Magazine
The Honorable John T. JenkinsMayorCity of Lewiston, Maine
Ms. Beverly A. KingPresidentKing & Wright Consulting Inc.
Ms. Jean Ledwith KingAttorney-at-Law
Ms. Judith L. LichtmanPresidentWomen’s Legal Defense Fund
The Honorable Nita M. LoweyU. S. House of RepresentativesNew York 18th District
The Honorable Patty MurrayUnited States SenateState of Washington
Dr. Lynne O’SheaGroup Strategic Planning DirectorDDB Needham Worldwide
Mrs. Marilyn B. PaulyPresidentBank IV Kansas
Mrs. Delia M. ReyesPresidentReyes Consulting Groups
The Honorable Marge RoukemaU.S. House of RepresentativesNew Jersey 5th District
Ms. M. Anne SzostakSenior Vice PresidentFleet Financial Group
Mr. Henry TangManaging DirectorJeffries and Company
Mrs. Carol Cox WaitPresident and Chief Executive OfficerCommittee for a Responsible Federal Budget
Ms. Judith B. WierciakDirector of Special Programs & AdministrationAnheuser-Busch Companies Inc.
Ms. René A. RedwoodDesignated Federal Official for the CommissionU.S. Department of Labor
THE COMMISSIONERS
ii

iii
The term “glass ceiling” first entered America’s public conversation less than a decade ago, when TheWall Street Journal’s “Corporate Woman” column identified a puzzling new phenomenon. There seemedto be an invisible—but impenetrable—barrier between women and the executive suite, preventing themfrom reaching the highest levels of the business world regardless of their accomplishments and merits.The phrase immediately captured the attention of the public as well as business leaders, journalists, andpolicy makers. The metaphor was quickly extended to refer to obstacles hindering the advancement ofminority men, as well as women.
Thanks to the leadership and vision of Secretary Elizabeth Dole—and that of her able successor,Secretary Lynn Martin— the Department of Labor became closely involved in identifying and publiciz-ing the glass ceiling problem, issuing a Report on the Glass Ceiling Initiative in 1991. Senator Robert Dole,who introduced the Glass Ceiling Act in 1991, praised Martin’s report, noting that it “confirm(s) whatmany of us have suspected all along—the existence of invisible, artificial barriers blocking women andminorities from advancing up the corporate ladder to management and executive level positions.” Headded: “For this Senator, the issue boils down to ensuring equal access and equal opportunity.”
The Glass Ceiling Act was enacted with only minor changes as Title II of the Civil Rights Act of 1991. Itestablished the bipartisan Glass Ceiling Commission, with the Secretary of Labor as its chair. And itcharged the twenty-one member Commission (itself an appropriately diverse body, in terms of ethnicity,gender, and political affiliation) with a complex mission: to conduct a study and prepare recommenda-tions on “eliminating artificial barriers to the advancement of women and minorities” to “managementand decisionmaking positions in business.”
The fact-finding report that the Commission is now releasing confirms the enduring aptness of the “glassceiling” metaphor. At the highest levels of business, there is indeed a barrier only rarely penetrated bywomen or persons of color. Consider: 97% of the senior managers of Fortune 1000 industrial and
MESSAGE FROM THE CHAIRMANSECRETARY OF LABOR ROBERT B. REICH

Fortune 500 companies are white; 95 to 97% are male. In Fortune 2000 industrial and service compa-nies, 5% of senior managers are women—and of that 5%, virtually all are white.
The research also indicates that where there are women and minorities in high places, their compensa-tion is lower. For example, African American men with professional degrees earn 79% of the amountearned by white males who hold the same degrees and are in the same job categories. One study foundthat, more than a decade after they had graduated from the Stanford University of Business School, menwere eight times more likely to be CEOs than women.
Nor does the evidence indicate that the glass ceiling is a temporary phenomenon. In fact, the researchcited here finds relatively few women and minorities in the positions most likely to lead to the top—the“pipeline.” The critical career path for senior management positions requires taking on responsibilitiesmost directly related to the corporate bottom line. But the relatively few women and minorities found atthe highest levels tend to be in staff positions, such as human resources, or research, or administration,rather than line positions, such as marketing, or sales, or production. Similarly, most companies requirebroad and varied experience in core areas of the business to advance—experience of the sort that, evennow, too few women or minority men are in a position to develop.
In short, the fact-finding report tells us that the world at the top of the corporate hierarchy does not yetlook anything like America. Two-thirds of our population, and 57 percent of the working population, isfemale, or minorities, or both. Nor, ominously, does the population of today’s executive suite resemblethe workforce of America’s future. Women and minority men will make up 62% of the workforce by theyear 2005.
As many of the CEOs interviewed by the Commission observed, this state of affairs is not good for business.Corporate leaders recognize that it is necessary for their business that they better reflect the market- placeand their customers. Their trading partners and customers are becoming more global and diverse. And tosucceed in this increasingly competitive environment, they need to attract and retain the best, most flexibleworkers and leaders available, for all levels of their organization. Narrowing the pool of talent from whichthey draw is—among other things—a blunder in competitive tactics. Most business leaders know that theysimply cannot afford to rely exclusively on white males for positions of leadership.
iv

v
The facts support their contention that diversity is good for business. A 1993 study of Standard and Poor500 companies showed that firms that succeed in shattering their own glass ceilings racked up stock-mar-ket records that were nearly two and a half times better than otherwise-comparable companies.
Nevertheless, as the report finds, serious barriers to advancement remain—such as persistent stereotyp-ing, erroneous beliefs that “no qualified women or minorities are out there,” and plain old fear ofchange.
The next order of business, then, is to learn from the success stories—to find out the best means ofinvesting in the human assets that together form America’s most important productive resource. TheCommission’s report contains case studies of world-class companies that have boosted profits while effec-tively eliminating glass ceiling barriers in their organizations. It also identifies some of the factors com-mon to successful corporate initiatives—beginning with high-level commitment and leadership andincluding corporate-wide accountability.
We need to learn from these lessons and create models of success for all American workers, to demon-strate palpably that hard work and talent will be rewarded and promoted. This is the only way to preservefor the modern age, and to pass on to future generations, the age-old American ethic of work and itsreward.
As we have learned through the work of the Glass Ceiling Commission, shattering the glass ceiling bothserves our national values and makes our businesses stronger.
America—which has always been a nation containing wide diversity and profound differences—has beenbound together by shared promise of expanding opportunity. We cannot allow ourselves to be detouredfrom the next stage of our national journey. The inclusive values that modeled our past, and the eco-nomic imperatives of a challenging future, both require us to overcome the “glass ceiling” that mars thearchitecture of our economy today.

Georgiana McGuireQuinn MiddletonJoyce MillerAnn MorrisonSiobhan NicolauHarry PachónLinda ParisKarin PedrickHermelinda PompaElizabeth RoseThomas ScoppStephanie SwirskyClarissa TomHeidi TomVince TrivelliEllen WernickLinda Faye WilliamsShirley WitcherBarbara Wootton
The Federal Glass Ceiling Commission wishes to thank the many people who gave of their time,energy, and experiences to help make this reportpossible. Without their sustained cooperativeeffort and commitment to excellence, the widerange of data and experiences chronicled in this report could not have been gathered andpublished.
We welcome this opportunity to appreciate thestaff of the Glass Ceiling Commission whose tire-less effort helped fulfill this mandate. We aregrateful for their strong stewardship: YvonneLacey, Loretta Davis, Howard S. Hankerson,Gordon Berg, Debra Brown, Carmen T. Lepe,Amy Golen, Alicia Neering, Victor Sewell, andSharon Muse. And to all who have served on staffover the life of the commission, our thanks.
To all of those people throughout the regionswhere our hearings were held go our gratitude fortheir generous response.
Our work would have been impossible without thesupport of the U.S. Department of Labor who hasgiven us a home complete with support servicesand the necessary aid and advice to allow us tooperate.
Finally, the Federal Glass Ceiling Commissionwould like to recognize the able men and womenwho have confronted glass ceiling barriers andbroken through them. Your efforts will speed theday when all people are recognized in the work-place for their skills and abilities. Each of you hasstrengthened the American dream. You have, in fact, defined it.
ACKNOWLEDGEMENTS
vi
Special thanks to those individuals who,beyond their regular duties, greatly facilitated the work of the Commission.
Jeannie BenettiAnn BookmanCarmen CampbellDiane CrothersRudy De La GarzaNorm DeWeaverTom DowdGloria DuusRonald EdwardsDennis FalcónJocelyn FryeJennifer GardnerAngela JacksonLuke HendersonNaomi HendersonCatherine HusbandsKaya IkumaYvonne LeeTish Leonard

I. Executive Summary . . . . . . . . . . . . . . . . . . . . . . . . . . . . . . . . . . . . . . . . . . . . . . . . . . . . . . . . . . . . . . . . 1Introduction . . . . . . . . . . . . . . . . . . . . . . . . . . . . . . . . . . . . . . . . . . . . . . . . . . . . . . . . . . . . . . . . . . . 3Overview . . . . . . . . . . . . . . . . . . . . . . . . . . . . . . . . . . . . . . . . . . . . . . . . . . . . . . . . . . . . . . . . . . . . . 7Highlights of the Research . . . . . . . . . . . . . . . . . . . . . . . . . . . . . . . . . . . . . . . . . . . . . . . . . . . . . . 12
II. What Are the Glass Ceiling Barriers? . . . . . . . . . . . . . . . . . . . . . . . . . . . . . . . . . . . . . . . . . . . . . . . . . . 25
III. What Works to Overcome the Business Barriers? . . . . . . . . . . . . . . . . . . . . . . . . . . . . . . . . . . . . . . . . 37
IV. The Environmental Scan . . . . . . . . . . . . . . . . . . . . . . . . . . . . . . . . . . . . . . . . . . . . . . . . . . . . . . . . . . . 57“The Concrete Wall” . . . . . . . . . . . . . . . . . . . . . . . . . . . . . . . . . . . . . . . . . . . . . . . . . . . . . . . . . . . . 64“More Than Glass” . . . . . . . . . . . . . . . . . . . . . . . . . . . . . . . . . . . . . . . . . . . . . . . . . . . . . . . . . . . . . 84“The Impenetrable Glass” . . . . . . . . . . . . . . . . . . . . . . . . . . . . . . . . . . . . . . . . . . . . . . . . . . . . . . 101“The Two-Way Mirror” . . . . . . . . . . . . . . . . . . . . . . . . . . . . . . . . . . . . . . . . . . . . . . . . . . . . . . . . . 120“The Classic Glass Ceiling” . . . . . . . . . . . . . . . . . . . . . . . . . . . . . . . . . . . . . . . . . . . . . . . . . . . . . . 143
V. Glass Ceiling Realities: An Industry Comparative . . . . . . . . . . . . . . . . . . . . . . . . . . . . . . . . . . . . . . 157
VI. Appendices . . . . . . . . . . . . . . . . . . . . . . . . . . . . . . . . . . . . . . . . . . . . . . . . . . . . . . . . . . . . . . . . . . . . . 165Glossary of Terms . . . . . . . . . . . . . . . . . . . . . . . . . . . . . . . . . . . . . . . . . . . . . . . . . . . . . . . . . . . . . 167Composition of the U.S. Civilian Labor Force, by Sex, Race, and Hispanic Origin. . .. . . . . . 171Corporate Practices Tables . . . . . . . . . . . . . . . . . . . . . . . . . . . . . . . . . . . . . . . . . 172Methodology for Measuring Glass Ceiling Realities . . . . . . . . . . . . . . . . . .. . . . . . . . . . . . . . . . 209Standard Industrial Classifications . . . . . . . . . . . . . . . . . . . . . . . . . . . . . . . . . . . . . . . . . . . . . . . 212Standard Occupational Classifications . . . . . . . . . . . . . . . . . . . . . . . . . . . . . . . . . . . . . . . . . . . . 214Survey of CEOs: Methodology And Questions Asked . . . . . . . . . . . . . . . . . . . . . . . . . . . . . . . . 216Focus Group Methodology . . . . . . . . . . . . . . . . . . . . . . . . . . . . . . . . . . . . . . . . . . . . . . . . . . . . . 219Employed Persons within Industry by Race and Hispanic Origin . . . . . . . . . . . . . . . . . . . . . . 220Employed Persons within Industry by Gender and Occupational Level . . . . . . . . . . . . . . . . . 221Public Hearings: Roster of Oral Testimony . . . . . . . . . . . . . . . . . . . . . . . . . . . . . . . . . . . . . . . . 222Index of Tables . . . . . . . . . . . . . . . . . . . . . . . . . . . . . . . . . . . . . . . . . . . . . . . . . . . . . . . . . . . . . . 227
VII. Annotated Bibliography . . . . . . . . . . . . . . . . . . . . . . . . . . . . . . . . . . . . . . . . . . . . . . . . . . . . . . . . . . . 229
VIII. References . . . . . . . . . . . . . . . . . . . . . . . . . . . . . . . . . . . . . . . . . . . . . . . . . . . . . . . . . . . . . . . . . . . . . . 237
vii
TABLE OF CONTENTS


EXECUTIVE SUMMARY
INTRODUCTIONOVERVIEW
HIGHLIGHTS OF THE RESEARCH


GLASS CEILING COMMISSION
The term glass ceiling was popularized in a 1986Wall Street Journal article describing the invisiblebarriers that women confront as they approachthe top of the corporate hierarchy.
The Federal Glass Ceiling Commission, a 21-mem-ber bipartisan body appointed by President Bushand Congressional leaders and chaired by theSecretary of Labor, was created by the Civil RightsAct of 1991. Its mandate was to identify the glassceiling barriers that have blocked the advance-ment of minorities and women as well as the suc-cessful practices and policies that have led to theadvancement of minority men and all women intodecisionmaking positions in the private sector.
TASK
The Commission was specifically directed—• to conduct a study of opportunities for,
and artificial barriers to, the advancement of minority men and all women into man-agement and decisionmaking positions in Corporate America, and
• to prepare and submit to the President and
the appropriate committees of the Congress written reports containing the findings and conclusions resulting from the study and the recommendations based on those findings and conclusions.
SCOPE OF WORK
The Federal Glass Ceiling Commission systemati-cally gathered information on barriers, opportuni-ties, policies, perceptions, and practices as theyaffect five target groups that historically have beenunderrepresented in private sector top-level management—women of all races and ethnicities,and African American, American Indian, Asianand Pacific Islander, and Hispanic American men. As the Glass Ceiling Act (Section 204 of PublicLaw 102-166) mandates,* the Commission wasdirected to do the following:
“(1) examine the preparedness of women and minorities to advance to management and decisionmaking positions in business;
*Pursuant to Title II of the Civil Rights Act of 1991 (pub. L. 102-166) andSection 9 of the Federal Advisory Committee Act (FACA) (pub. L. 92-262, 5U.S.C. app. II) a Notice of establishment of the Glass Ceiling Commissionwas published in the Federal Register on March 30, 1992 (57FR 10776). 3
The Commission conducted a study of
opportunities for, and artificial
barriers to, the advancement of
minority men and all women into
management and decisionmaking
positions in Corporate America.
INTRODUCTION

(2) examine the opportunities for women and minorities to advance to management and decisionmaking positions in business;
(3) conduct basic research into the practices,policies, and manner in which managementand decisionmaking positions in business arefilled;
(4) conduct comparative research of businessesand industries in which women and minorities are promoted to management anddecisionmaking positions, and business andindustries in which women and minorities are not promoted to management and decision-making positions;
(5) compile a synthesis of available research onprograms and practices that have successfullyled to the advancement of women and minorities to management and decisionmakingpositions in business including trainingprograms, rotational assignments, developmental programs, reward programs, employee benefit structures, and family leave policies; and
(6) examine any other issues and information relating to the advancement of women andminorities to management and decisionmakingpositions in business.”
The Commission research and information-gathering process included the following:
• Five public hearings held in Kansas City, Kansas; Dallas, Texas; Los Angeles, California; Cleveland, Ohio; and New York, New York, at which 126 employers and employees from a broad spectrum of industries and institutions testified about their experiences and perceptions of the glass ceiling.
• The commissioning of eighteen research papers on the status and problems of minorities and women and on other specific aspects of the glass ceiling such as the impact of downsizing on diversity, comparative compensation, and law enforcement.
• A survey of twenty-five chief executive officers (CEOs) from white- and minority-owned businesses regarding their perceptions and experiences in recruiting, developing, and promoting minorities and women into decisionmaking positions.
• Six racially homogeneous focus groups of Asian and Pacific Islander American, African American and Hispanic/Latino male executives in New York, Chicago, and Los Angeles to determine the perceptions, opinions, beliefs, and attitudes of minority men on the key issues related to the glass ceiling barriers. (With each racial/ethnic
4
group, two sessions were held, one of younger men (30-45) and one older (46-65). All respondents were college graduates with a mix of bachelor’s, master’s, and Ph.D. degrees. All were full-time employees of U.S. companies in the following industries: communications, legal, electronic, health care, aerospace, utility, airline, financial/banking, travel, transport, publishing, realty, employment services, personal products, and beverage.)
• Two focus panel groups with American Indian men and women in Washington, D.C. (All members of the groups were college graduates with a mix of bachelor’s, master’s, and law degrees, a mix of govern-ment and private sector employment, and a mix of ages and tribal affiliations. The majority were based in Washington but others came from as far away as California.)
• Analyses of special data runs of U.S. Bureau of the Census data conducted expressly for the Federal Glass Ceiling Commission to establish as clearly as possible the educational achievement, status, and compensation levels of the target groups.
• Analyses of special data runs of U.S. Bureau of the Census data to identify the status of minorities and women by industrial sector.
THE REPORTS
Glass ceiling issues are about business and aboutpeople who work in business. Therefore, for thefirst report, the findings and conclusions are pre-sented in an “Environmental Scan.” The secondreport will contain recommendations and will be a“Strategic Plan.”
Report One: The Environmental ScanThis document, The Environmental Scan, presents the findings of the Federal Glass CeilingCommission resulting from research by its consor-tium of consultants, commission hearings, studies,interviews, focus groups, and panel discussions —as well as its review of other public and privateresearch.
The Environmental Scan describes and analyzes the barriers identified in existing research, independent studies, and Department of Labor surveys, as well as information gathered in the minority male executive focus groups, the American Indian focus groups, the CEO survey interviews, and the five public hearings. It also identifies and outlines strategies and practices that have been employed successfully to promote the advancement of minorities and women to senior-level positions in the private sector. These examples emerged from Commission research conducted by Catalyst and from the 5
Glass ceiling issues are about
business and about people who work
in business.

Commission’s work in preparing for the Frances Perkins—Elizabeth Hanford Dole National Award for Diversity and Excellence in American Executive Management.
Finally, The Environmental Scan summarizes the perceptions of corporate leaders and minorities and women in the private sector and presents available quantitative data that supports or refutes them.
Emphasis is placed on perceptions because perceptions, true or not, perpetuate the existence of the glass ceiling barrier. Perceptions are what people believe and people translate their beliefs into behaviors, attitudes, and bias. Many judgments on hiring and promotion are made on the basis of a look, the shape of a body, or the color of skin. A 1992 report on a number of the nation’s most progressive businesses and institutions, The New Leaders: Guidelines on Leadership Diversity in America by Ann M. Morrison, revealed that prejudice against minorities and white women continues to be the single most important barrier to their advancement into the executive ranks. For this reason, this report explores the perceptions of employers and employees, outlines the popular stereotypes, and then contrasts them with the research data and findings that delineate the realities and status of minority
men and all the women who are affected by the glass ceiling.
Much of the qualitative information on perceptions is drawn directly from transcripts of the Commission’s five public hearings, the CEO Survey, the minority executive focus groups, and the American Indian focus groups. The quantitative data is based on private surveys and Commission research and on extensive analyses of U.S. Department of Census data, analyses prepared expressly for the Commission. Specific sources are cited in the body of this report.
Report Two: A Strategic PlanA second report will present the Commission’srecommendations based on its findings. Theserecommendations will form a “Strategic Plan” that will be presented to the President and theCongress in the Summer of 1995.
The recommendations will speak to the imperative of dismantling artificial barriers toadvancement. The recommendations will bedesigned to assure equitable opportunity for white men, minorities, and women.
6
Many judgments on hiring and
promotion are made on the basis of a
look, the shape of a body, or the color
of skin.
Corporate leaders surveyed, and women andminorities who participated in focus groups,researchers, and government officials, all agreethat a glass ceiling exists and that it operates substantially to exclude minorities and womenfrom the top levels of management. At the same time, increasing numbers of corporate leaders recognize that glass ceilings and exclusion ofmembers of groups other than white non-Hispanic males are bad for business because of recent dramatic shifts in three areas that arefundamental to business survival:
• Changes in the demographics of the labor force
• Changes in the demographics of the national consumer markets
• The rapid globalization of the marketplace
CEOs state that the need to compete in changingnational and international business environmentsis driving business to address glass ceiling issuesbecause:
• Glass ceilings exclude from top leadership of corporations able people of diverse backgrounds that businesses need in order to compete successfully
• Top quality people, regardless of gender, race, or ethnicity, are essential to the health and profitability of business
Despite the growing awareness among corporateleadership of the bottom-line value and economicimperative of including minorities and women insenior corporate management, progress has beendisappointingly slow, and barriers persist whichstop able people from achieving their full employ-ment potential.
GLASS CEILING BARRIERS
Glass Ceiling research reveals three levels of artificial barriers to the advancement of minoritiesand women in the private sector that contradictthis nation’s ethic of individual worth andaccountability—the belief that education, train-ing, dedication, and hard work will lead to a better life.
The three levels of barriers identified by theCommission research, CEO studies, and focusgroups are these:
• Societal Barriers which may be outside the direct control of business 7
OVERVIEW OF THE FACT-FINDING REPORT
Corporate leaders surveyed, and
women and minorities who partici-
pated in focus groups, researchers,
and government officials, all agree
that a glass ceiling exists and that it
operates substantially to exclude
minorities and women from the
top levels of management.

—The Supply Barrier related to educational opportunity and attainment—The Difference Barrier as manifested in conscious and unconscious stereotyping, prejudice, and bias related to gender, race, and ethnicity.
• Internal Structural Barriers within the direct control of business
—Outreach and recruitment practices that do not seek out or reach or recruit minorities and women—Corporate climates that alienate and isolate minorities and women—Pipeline Barriers that directly affect opportunity for advancement
—Initial placement and clustering in staff jobs or in highly technical and professional jobs that are not on the career track to the top—Lack of mentoring—Lack of management training—Lack of opportunities for career development, tailored training, and rotational job assignments that are on the revenue-producing side of the business—Little or no access to critical develop mental assignments such as memberships on highly visible task forces and committees—Special or different standards for performance evaluation
—Biased rating and testing systems—Little or no access to informal net-works of communication—Counterproductive behavior and harassment by colleagues
• Governmental Barriers—Lack of vigorous, consistent monitoring and law enforcement—Weaknesses in the formulation and collection of employment-related data which makes it difficult to ascertain the status of groups at the managerial level and to disaggregate the data—Inadequate reporting and dissemina-tion of information relevant to glass ceiling issues
A majority of the CEOs interviewed felt that thesepractices are obstacles to pursuing opportunity.Change can be handled well or it can be handledpoorly. Those corporate leaders who have success-fully addressed the business barriers to theadvancement of minorities and women are thosewho have squarely confronted the reality thattheir priorities and the priorities of their middle-and upper-level managers are not always synony-mous. These are the companies who have madethe transition to inclusion while continuing toprosper. Their experience demonstrates that barriers can be overcome.
8
Corporate leaders who have
successfully addressed the
business barriers to the advancement
of minorities and women are
those who have squarely confronted
the reality that their priorities and
the priorities of their middle- and
upper-level managers are not always
synonymous.

WHAT WORKS TO OVERCOME BUSINESS BARRIERS
There is no “one way” to eliminate the barriers to the advancement of minorities and women inthe private sector. Each company is different andeach must carefully evaluate its situation andneeds. However, analysis of the companies that are managing change effectively indicates that the following characteristics—detailed in this report—are common to all successful glass ceiling initiatives:
• They have CEO support• They are part of the strategic business plan• They are specific to the organization• They are inclusive—they do not exclude
white non-Hispanic men• They address preconceptions and stereo-
types• They emphasize and require accountability
up and down the line • They track progress• They are comprehensive
THE ENVIRONMENTAL SCAN
Despite the growing number of corporate leaderswho consider diversity at the managerial and decisionmaking levels to be an important issueimpacting their company’s bottom line, significantbarriers continue to exist at various levels withinorganizations and are experienced differently bydifferent ethnic and racial groups. These barriers
impede the advancement of qualified minoritiesand women. In general, African Americans,American Indians, Asian and Pacific IslanderAmericans, and Hispanic Americans resist the use of the term minority which they feel impliesinferiority. It has been pointed out that in the U.S.any population is a minority if it occupies a subordinate power position in relation to another population within the same country or society.
African American, American Indian, and HispanicAmerican men believe that within their groupsnot enough individuals are earning the degreesthat business needs. On the other hand, they alsoperceive that even those who have these creden-tials face brick, opaque, and thick glass ceilings that block their advancement to senior-level decisionmaking positions. A survey of senior-level male managers in Fortune 1000 industrialand Fortune 500 service industries shows thatalmost 97 percent are white, 0.6 are AfricanAmerican, 0.3 percent are Asian, and 0.4 percentare Hispanic.
African American men and women comprise lessthan 2.5 percent of total employment in the topjobs in the private sector. African American menwith professional degrees earn only 79 percent ofthe amount of their white male counterparts;African American women with professionaldegrees earn only 60 percent of what white malesearn. African Americans represent a $257 billionconsumer market.
9
In general, African Americans,
American Indians, Asian and Pacific
Islander Americans, and Hispanic
Americans resist the use of the term
minority which they feel implies
inferiority.
Only 9 percent of American Indians in the work-force hold college degrees. American Indianshave the highest high school dropout rate of anyethnic or racial group — 36 percent. According to the 1990 census, only 7,862 American Indiansheld executive, administrative, or managerial positions at any level, very little of it in the privatesector.
From 1960 to 1990, Asian and Pacific IslanderAmericans were the fastest growing minoritygroup. Asian and Pacific Islander Americans represent a $94 billion consumer market. Asianand Pacific Islander men feel that they have morethan sufficient educational credentials and experi-ence and still are kept under the ceiling becausethey are perceived as superior professionals butnot as management material.
Hispanic American men have the highest work-force participation rate of any ethnic group at78.2 percent. In 1990, 370,000 HispanicAmericans had earned advance degrees now con-sidered essential for climbing the corporate ladder. Hispanic American represent a $175 billion consumer market.
White women in Corporate America agree theyhave made some movement through the glass ceiling. They are cautiously optimistic but they donot perceive that the problem has been solved.There is still a long way to go and barriers
continue to exist. Only two women are CEOs in Fortune 1000 companies.
Minority women do not see much progress andfeel that significant barriers to their advancementstill exist.
The data show that minorities and white womenare increasingly earning the credentials that business needs. However, data also show thatwomen hold only 3 to 5 percent of the senior-leveljobs in major corporations. Moreover, only 5 percent of the women who hold those senior-level jobs are minority women.
IN CONCLUSION
Two major strengths of our country—which withthe exception of American Indians is a nation ofimmigrants—have been:
• the nation’s ability to adapt to perpetual demographic change
• the nation’s remarkable ability in most respects to make self-corrections whenever the contract with its citizenry is threatened or damaged
The body of research detailed in the following sec-tion reveals that in the private sector, equally qual-ified and similarly situated citizens are beingdenied equal access to advancement into senior-level management on the basis of gender, race, or10
ethnicity. At the highest levels of corporations thepromise of reward for preparation and pursuit ofexcellence is not equally available to members ofall groups. Furthermore, it is against the bestinterests of business to exclude those Americanswho constitute two-thirds of the total population,two-thirds of the consumer markets, and morethan half of the workforce (approximately 57 percent).
11
At the highest levels of corporations
the promise of reward for preparation
and pursuit of excellence is not
equally available to members of all
groups.
American IndianAPI
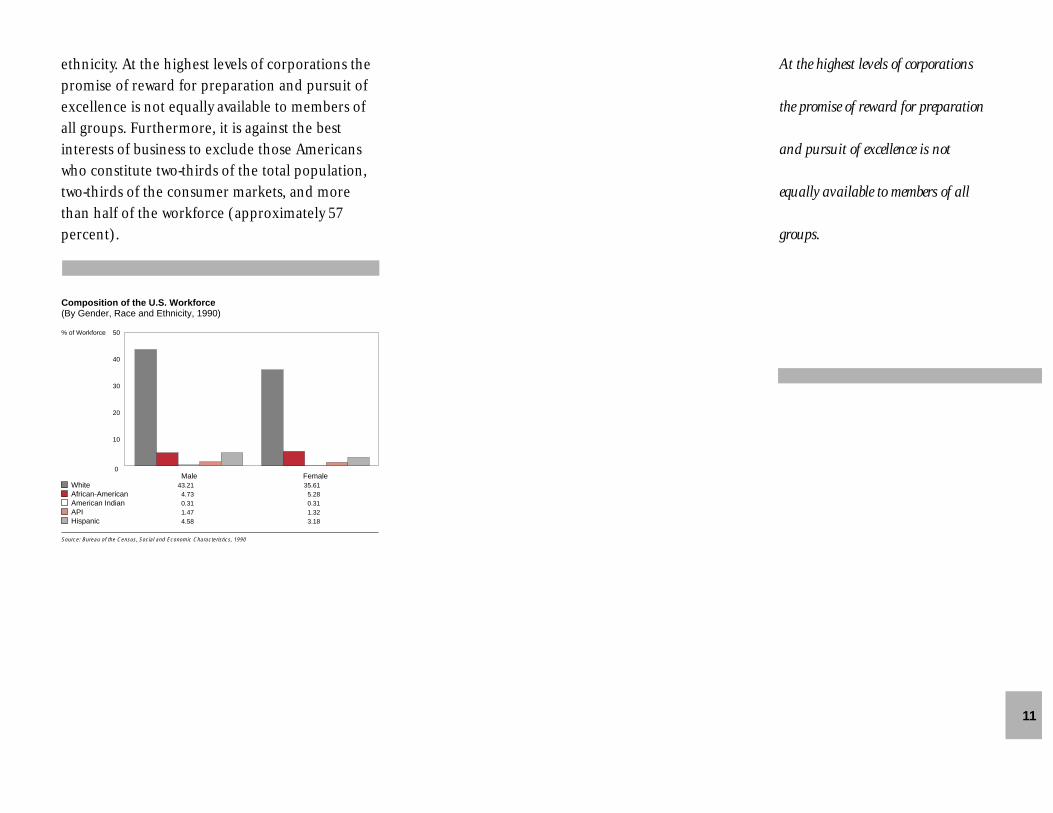
Composition of the U.S. Workforce (By Gender, Race and Ethnicity, 1990)
50% of Workforce
Source: Bureau of the Census, Social and Economic Characteristics, 1990
WhiteAfrican-American
Hispanic
0.311.47
4.7343.21
0.311.32
4.58 3.18
5.2835.61
Male Female0
40
30
20
10

What is the Glass Ceiling?GCC Research 3, 8, and 13* Federal Glass Ceiling Commission researchpapers, as well as testimony presented at the public hearings, clearly document that today’sAmerican labor force is gender and race segregated—white men fill most top managementpositions in corporations.
According to surveys of Fortune 1500 companiesconducted by Korn/Ferry International andCatalyst over the last decade, 95 to 97 percent of senior managers—vice presidents and above—were men. A 1989 Korn/Ferry survey found that97 percent of male top executives are white. A1992 survey of Fortune 1500 companies foundthat 95 percent of the three to five percent of thetop managers who were women were white non-Hispanic women. In 1994, two women were CEOsof Fortune 1000 companies.
The representation of women and minorities onFortune 1500 boards of directors is also limited.Cox and Smolinski point out that less than 10 percent of the largest employers have women ontheir board of directors. According to a 1992
*The numerical references cited at each heading refer to theresearch papers listed at the end of this section.
Heidrick & Struggles survey, Minorities and Womenon Corporate Boards, non-U.S. citizens held 2.85 percent of the board seats of 806 Fortune companies, slightly less than the 3.11 percentcombined total held by all racial and ethnicminorities.
Conversely, the American workforce is increasing-ly diverse. In 1950, white men comprised 65 percent of the labor force; in 1990 white male representation had dropped to 43 percent.During the same period, representation of whitewomen in the labor force increased from 24.2 per-cent to 35.3 percent. At the same time, minority representation in the labor force doubled, to 15.2 percent. Over the last decade,the size of the Asian and Pacific IslanderAmerican population has doubled, becoming thefastest growing of minority groups in the UnitedStates.
A larger proportion of women and minorities arelocked into low wage, low prestige, and dead-endjobs, which according to Harlan and Bertheide,are not connected to any career ladder.
12
HIGHLIGHTS OF THE RESEARCH
Over the last decade, 95 to 97 percent
of senior managers—vice presidents
and above—were men.
Population of the United States Years 1980, 1990 and 2000* By Percent
Source: Department of Commerce-Economic and Statistics Administration 1980 and 1990 Census Counts on Specific Racial Groups Year 2000-Bureau of the Census-Population Branch
*Year 2000 represents a population projection
White African-American American Indian API American Hispanic American
1980
79.7
11.7
0.6
1.5
6.5
1990
75.3
12.0
0.8
2.9
9.0
2000*
71.2
12.6
0.8
4.3
11.1
The Current Status of Minorities and Women Managers GCC Research 1, 4, 7, 9, 11, 12, 13, 14, and 17Most female and minority professionals and man-agers do not work in the private-for-profit sector.They hold jobs in the public sector and “third sec-tor” — non-governmental agencies in health,social welfare, and education; legal service, profes-sional service, membership organizations andassociations; libraries, museums and art organiza-tions. According to Burbridge, 90 percent of Blackfemale professionals, 70 percent of Black maleprofessionals, and 83 percent of white andHispanic women professionals work in the govern-ment or the third sector, compared to 56 percentof white male non-Hispanic professionals.
The exception to this pattern of employment isAsian and Pacific Islander Americans (API) whorely heavily on the for-profit sector. Contrary to the popular image of API Americans, only a smallpercentage are entrepreneurs or managers ofsmall businesses (9.8 percent).
Federal Glass Ceiling Commission research also analyzed salaries as an indicator of advancement.In 1992, U.S. Census data reported the ratio offemale to male earnings in management jobsranged from a low of 50 percent in the bankingindustry to a high of 85 percent for managers inhuman services. An analysis of 1990 U.S. Censusdata shows that Black men who hold professional
degrees and top management positions earned 79 percent of what white men earn. Black women,also with professional degrees and in top management positions, earn 60 percent of whatwhite men in comparable positions earn.
Despite identical education attainment, ambition,and commitment to career, men still progressfaster than women. A 1990 Business Week study of 3,664 business school graduates found that awoman with an MBA from one of the top 20 business schools earned an average of $54,749 inher first year after graduation, while a comparableman earned $61,400—12 percent more. Wernickreports that a 1993 follow-up study of the StanfordUniversity Business School class of 1982 foundthat 16 percent of the men were CEOs, chairmen,or presidents of companies compared to only two
Despite identical education attain-
ment, ambition, and commitment to
career, men still progress faster than
women.
13
African-AmericanWhite
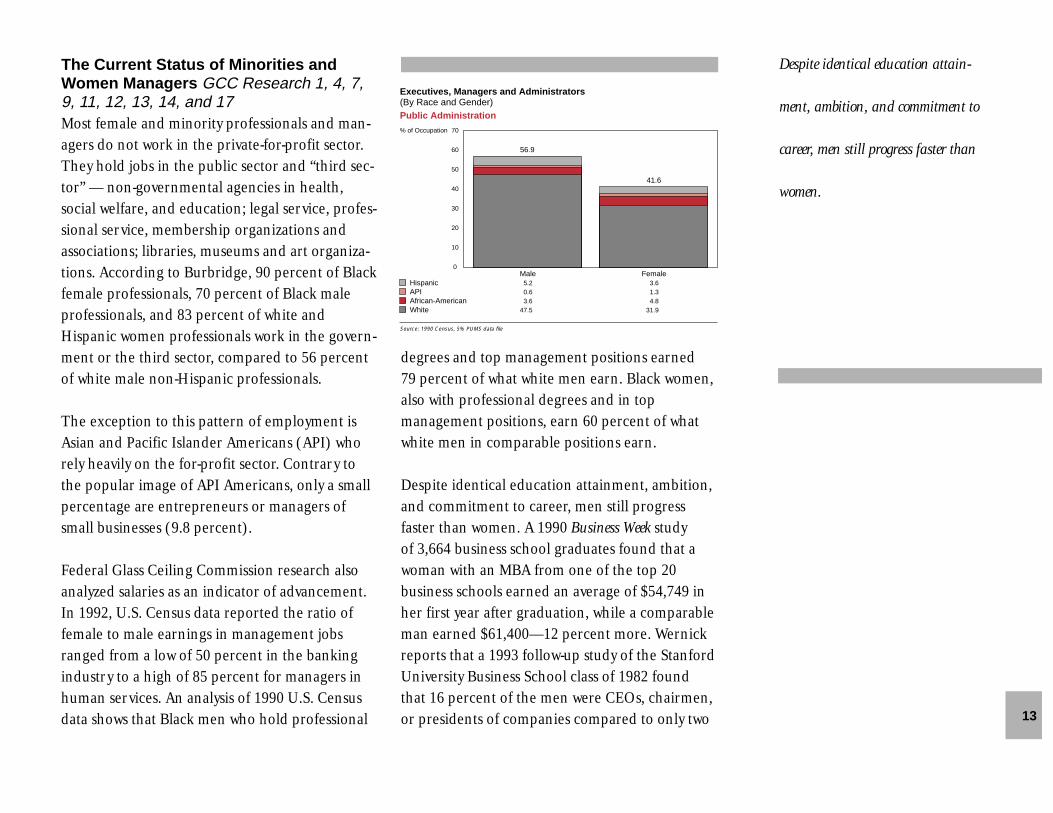
Executives, Managers and Administrators (By Race and Gender) Public Administration
70% of Occupation
60
50
40
30
20
10
Source: 1990 Census, 5% PUMS data file
HispanicAPI
3.647.5
0.65.2
4.831.9
1.33.6
Male Female0
56.9
41.6

percent of the women. At the level below thosetop posts, 23 percent of the men in the 1982 classwere now vice presidents and 15 percent weredirectors, compared to 10 percent and 8 percent,respectively, of the women.
Some data support the optimism that the 25 CEOsexpressed about the progress of women. For exam-ple, between 1982 and 1992 the percentage ofwomen who held the title of female executive vicepresident increased from four percent to nine per-cent; the percentage who held the title of senior vicepresident increased from 13 percent to 23 percent.In comparison, between 1982 and 1992, the percent-age of African Americans who held the title of vicepresident or above increased from one percent to2.3 percent. During the same period, the percentageof Hispanic top managers increased from 1.3 per-cent to 2 percent, and the percentage of Asiansenior managers increased from .4 percent to 1.8percent.
The small numbers of minorities and womenthroughout management makes statistics on therate of change in representation misleading. Forexample, if two out of three Black male managerstake early retirement, a firm experiences a 67 percent decline in representation.
The Business ImperativeAnother reason for optimism is the growing bodyof evidence which indicates shattering the glass
ceiling is good for business. Organizations thatexcel at leveraging diversity (including hiring and promoting minorities and women into seniorpositions) can experience better financial perfor-mance in the long run than those which are not effective in managing diversity.
Cox cites a Covenant Investment Managementstudy to prove this point. The Covenant studyrated the performance of the Standard and Poor’s500 companies on factors relating to the hiringand advancement of minorities and women, compliance with EEOC and other regulatoryrequirements, and employee litigation.Companies which rated in the bottom 100 onglass ceiling related measures earned an averageof 7.9 percent return on investment, compared toan average return of 18.3 percent for the top 100.
Cox offers several other explanations about whysome businesses are motivated to eliminate the glassceiling. In the U.S., Asians, Blacks, and Hispanics col-lectively represent more than $500 billion a year inconsumer spending. In the automobile industryexplicit recognition of cultural differences within theU.S. market is paying off. In 1987, by targeting adver-tising, hiring bilingual sales people, and holding spe-cial events, a Miami Toyota dealer gained more than50 percent of the local Hispanic market and his salesincreased 400 percent over a six-year period. On theWest coast, a San Francisco Volkswagen dealershipcredited improved sales to Asian and Pacific Islander14
Organizations that excel at leveraging
diversity (including hiring and
promoting minorities and women into
senior positions) can experience better
financial performance in the long
run than those which are not effective
in managing diversity.

Americans for a five-fold increase in overall sales permonth. Sales people learned through cultural sensi-tivity training that among Chinese Americans, familyelders often are the ultimate decisionmakers formajor purchases.
To a lesser degree than competition for marketshare, turnover costs are also factors motivatingcompanies to address issues related to glass ceiling. Cox cites a published report of OrthoPharmaceuticals that stated yearly savings of$500,000 mainly from lower turnover amongwomen.
These savings are not surprising. Recent studiesestimate the turnover costs range between 150and 193 percent of a manager or professional’sannual salary, compared to 75 percent for lowerlevel employees. Corning Glass reported that dur-ing the period from 1980 to 1987 turnover amongwomen in professional jobs was double that ofmen. During the same time period, the turnoverrates for Blacks were almost two and a half timesthose of whites. Another study of male and femalemanagers of large corporations found that themajor reason for women quitting was a lack ofcareer growth opportunity or dissatisfaction withrates of progress.
The PipelineGCC Studies 1 through 8The research monographs and testimony that
examined the preparedness of minorities andwomen to advance to top management positionsconsidered preparedness in terms of corporatedevelopment of minorities and women and educational credentials.
As Wernick explains, the development of businessexecutives is a long, complicated process. Chiefexecutive officers (CEOs) are generally in their50s or 60s when they assume the top position.Furthermore, they have usually spent 20 to 25years “in the pipeline.”
It is also worth noting that career paths to CEOpositions vary by industry. Certain functionalareas are more likely than others to lead to thetop. The “right” areas are most likely to be linefunctions such as marketing or production or acritical control function such as accounting orfinance. Studies across industries find certain factors common to successful executives, regard-less of gender, race, or ethnicity. They include:broad and varied experience in the core areas ofthe business; access to information, particularlythrough networks and mentoring; companyseniority; initial job assignment; high job mobility;education; organizational savvy; long hours andhard work; and career planning.
Minorities and women have limited opportunityto obtain broad and varied experience in mostcompanies. They tend to be in supporting, staff 15
Minorities and women have limited
opportunity to obtain broad and
varied experience in most companies.
Annual Consumer Expenditures By Race & Ethnicity
Total Expenditure of U.S. Consumer Market $3,028 Billion
*Data is not disaggregated for White Non-Hispanics, American Indians, and other.
Hispanic 5.8%
API 3.1%
White & Other* 82.6%
African American 8.6%

function areas—personnel/human resources,communications, public relations, affirmativeaction, and customer relations. Movementbetween these positions and line positions is rarein most major companies. Furthermore, careerladders in staff functions are generally shorterthan those in line functions, offering fewer possibilities to gain varied experience.
Education is also an important part of an execu-tive’s preparation. According to a 1993Korn/Ferry International UCLA report, almost 90percent of executives are college graduates. U.S.Census data show that Asian and Pacific IslanderAmericans and women have the largest percent-age of the work force with college or graduatedegrees, with 42 percent and 35 percent, respec-tively. The same source shows that college atten-dance is increasing for Black men and women ofall ages. Between 1982 and 1991, there was a 36percent increase in the number of AfricanAmericans, ages 20 to 44, with a college degree ormore.
The picture for American Indians and HispanicAmericans is less encouraging. Only 9 percent ofAmerican Indians in the workforce hold collegedegrees. Between 1980 and 1990, the number ofHispanic Americans with bachelor’s or graduate degrees increased from 7.7 percent to 10 percent.Furthermore, the opposition to bilingual educa-tion discourages the acquisition of one of theassets that business values. According to a 1994
Hispanic Business magazine survey of 169 Hispanicsenior managers, the majority of managers workin line positions in international divisions usingtheir bilingual and bicultural skills. However, only4 percent of Hispanic high school students gainbilingual capability by taking the minimumrequirement for Spanish literacy, according to aDepartment of Education longitudinal study.
Where are the Opportunities?GCC Studies 1, 3, 5, 7, 11, 15, 17, and 19.Federal Glass Ceiling Commission research on theopportunities for minorities and women to advanceto top management positions in corporate Americafocused on two areas: 1) identification of growthindustries and businesses and high-demand occupations and their relation to opportunities foradvancement, and 2) identification of possibilitiesresulting from changes in the structure of work, newtechnologies, and the demands of a global economy.
Gender distribution is more prominent than race distribution across industries. Women aremore likely than men to be clustered in services;finance, insurance, and real estate (FIRE), and inthe wholesale/retail trade industries. Nearly 75percent of employed women work in these industries.
Growth IndustriesThe industries expected to grow the most between1990 and 2005 are service/retail trade; FIRE;wholesale trade; transportation, communications,
16
Gender distribution is more
prominent than race distribution
across industries.

17
Restructuring can present problems as
well as opportunities for minorities
and women in management.
and public utilities; and construction.
Those areas which are expected to have growingneeds for general managers and top executivesinclude wholesale trade; retail trade, especially eating and drinking establishments; finance and real estate (but not insurance carriers); and services, particularly business services, auto services,health services, education, social services, and engineering and management services.
Women appear to have the best opportunity foradvancement into management and decision- making positions in three types of industries: thosewhich are fast-growing (business services); those liketelecommunications where change, i.e., deregula-tion, restructuring has occurred; and those with afemale intensive work force (insurance, banking).
RestructuringA review of research on recent changes in theorganization of work identifies seven ways inwhich downsizing and restructuring can limitopportunities for all managers, professionals, andadministrators. They are: 1) an increase in exter-nal recruiting which reduces the number of inter-nal career ladders; 2) elimination of layers of man-agement and staff positions, 3) hiring of indepen-dent contractors or small businesses to performsome staff functions; 4) more stringent perfor-mance measures on those managers who remain;5) more geographic mobility required of man-
agers; 6) increased importance of team work; and7) a shift of employment from manufacturing toservices.
As Hamlin’s research on the impact of downsizingand restructuring in nine companies found, inmore than half the companies, white womenand—to a somewhat lesser extent—minority men have increased their representation in management both in absolute numbers and inproportion to white men between 1990 and 1994.Restructuring can present problems as well asopportunities for minorities and women in man-agement. In some cases the last hired are the firstfired. On the other hand, when early retirement ispart of the restructuring process, higher levelpositions may become available, thereby increas-ing advancement opportunities. Hamlin’s studyshowed that white male managers who had senior-ity and were eligible for relatively generous buy-out packages were most likely to take early retire-ment or choose other forms of severance duringdownsizing.
Comparison of Industries—WomenThe industries with the highest percent of womenmanagers were FIRE (41.4%), services (38.9%),retail trade (38.5%), transportation, communica-tion, and public utilities (25.6%), and wholesaletrade (20.9%). Manufacturing (15.9%), agriculture(14.5%), construction (10.4%), and mining (9.8%)had the lowest percentages.

18
Women appear to be advancing best in
industries with relatively high growth,
those undergoing change with regard
to regulation, and those highly
competitive and thus dependent on
marketing and flexibility.
The proportion of women employees who are managers is the closest to that of men who are managers in transportation, communications, andpublic utilities (10.1%; 15.2%), with the construc-tion industry second (6.4%; 9.9%). Manufacturingand FIRE showed the biggest proportional differences.
Predominately female industries have larger per-centages of women in at least mid-level managerialpositions than do predominately male industries.Furthermore, women appear to be advancing bestin industries with relatively high growth, thoseundergoing change with regard to regulation, andthose highly competitive and thus dependent onmarketing and flexibility.
Comparison of Industries—MinoritiesDepartment of Labor analyses of 1990 EEOC datafor minorities (men and women) find that theindustries with the highest percentage of minoritymanagers are retail trade (13%), transportation,communication, and public utilities (12%), ser-vices (11%), and FIRE (11%). Agriculture (1.3%),wholesale trade (0.9%), manufacturing (0.8%),mining (0.7%), and construction (0.6%) had thelowest percentages.
The proportion of minority employees who aremanagers is the closest to that of non-minoritieswho are managers in transportation, communica-tion, and public utilities (7.7%; 15.0%), with the retail trade industry second (9.2%; 21.0%).
Agriculture and construction had the biggest dif-ferences between the proportions.
However, a study of Hispanic executives in theFortune 500 industrial and 500 service industries(HACR 1993) found the highest percentage ofHispanic officers in beverages (3.8%), soaps andcosmetics (2.4%), building materials (1.9%), andmotor vehicles and parts (1.1%). These sub-indus-tries are all in the manufacturing sector. Officerrepresentation for Hispanics in all others indus-trial sectors was below 1 percent, and has the lowest percentage of FIRE and transportation,communication, and public utilities.
An analysis of the 30 companies listed as bestplaces for Blacks to work in the February 1992edition of Black Enterprise found 8 of the 30
companies were in the consumer products industry. Telecommunications, automobiles, other manufacturing firms, oil, chemical companies, and banking/financial services had 3 mentions each.
Representation of minorities in an industry is not directly related to their advancement to management, as is the case with women. However,like women, minorities have the best chance ofadvancement in industries with relatively highgrowth, those undergoing change with regard to regulation, and those highly competitive andthus dependent on marketing and flexibility.(Note industry charts on next page.)

African-AmericanWhite
Business Servies Finance70% of Occupation
% of Occupation
60
50
40
30
20
10
Source: 1990 Census, 5% PUMS data file
HispanicAPI
3.551.6
1.75.2
0.532.8
1.23.2
Male Female
62
37.7
0
African-AmericanWhite
80
Source: 1990 Census, 5% PUMS data file
HispanicAPI
2.458.4
1.76.1
1.025.6
0.33.4
Male Female0
African-AmericanWhite
60% of Occupation
% of Occupation
Source: 1990 Census, 5% PUMS data file
HispanicAPI
2.644.8
1.83.4
2.637.6
2.65.0
Male Female0
African-AmericanWhite
Source: 1990 Census, 5% PUMS data file
HispanicAPI
3.244.0
0.52.0
3.040.7
1.74.2
Male Female0
Communications Insurance
68.6
30.3
52.6
47.8
49.7 49.670
60
50
40
30
20
10
50
40
30
20
10
60
50
40
30
20
10
19
EXECUTIVES, MANAGERS, AND ADMINISTRATORS (By Race and Gender)
Asian and Pacific Islander Americans is abbreviated as API

African-AmericanWhite
Retail Trade Utilities% of Occupation
% of Occupation
Source: 1990 Census, 5% PUMS data file
HispanicAPI
2.341.7
3.52.8
2.639.1
1.72.0
Male Female0
African-AmericanWhite
80
Source: 1990 Census, 5% PUMS data file
HispanicAPI
2.458.4
1.76.1
1.025.6
0.33.4
Male Female0
African-AmericanWhite
100% of Occupation
% of Occupation
Source: 1990 Census, 5% PUMS data file *API males sample size too small
HispanicAPI
3.171.9
0.0*3.1
0.817.2
0.80.7
Male Female0
African-AmericanWhite
Source: 1990 Census, 5% PUMS data file
HispanicAPI
1.253.4
2.42.7
0.336.2
1.82.1
Male Female0
Transportation Wholesale Trade
70
60
50
40
30
20
10
70
50.3
45.4
68.6
30.3
78.1
19.5
59.7
40.4
60
50
40
30
20
10
80
60
40
20
60
50
40
30
20
10
EXECUTIVES, MANAGERS, AND ADMINISTRATORS (By Race and Gender)
20
Asian and Pacific Islander Americans is abbreviated as API

21
Additional Research NeededAlthough the Commission was able to conductuseful research with limited funding, it is clearthat its work must be complemented with a five-to-ten year longitudinal study to determinedefinitively the sequence of activities that wouldbe most effective in dismantling glass ceilings andpromoting women and minorities. A study similarto the work of Valiant conducted at Harvard dur-ing the 1950s and 60s regarding the advancementof white executives would add considerably toknowledge of the factors that perpetuate the glassceiling and the impact of various remedies in furthering the advancement of women andminorities into the ranks of upper management.Such a study could focus on both the elements of selected organizations’ infrastructure that mayaffect the glass ceiling and the career progress of a number of high-potential individuals withinthe management ranks of the selected organiza-tions, including white women, white men, andminority women and men. The results of thismajor research would add a significant dimensionto the work already commissioned and reviewedfor this report.
Research Papers1. Bell, Ella Louise J. Edmondson and Nkomo,Stella M. 1994. Barriers to Work PlaceAdvancement Experienced by African-Americans.Ella Louis J. Bell, Sloan School of Management,Massachusetts Institute of Technology and Stella
M. Nkomo, Belk College of BusinessAdministration, University of North Carolina atCharlotte. Paper prepared for the Glass CeilingCommission. On file.
2. Braddock, David and Bachelder, Lynn. 1994.The Glass Ceiling and Persons with Disabilities.University of Illinois at Chicago. Paper preparedfor the Glass Ceiling Commission. On file.
3. Burbridge, Lynne. 1994. The Glass Ceiling inDifferent Sectors of the Economy: DifferencesBetween Government, Non-Profit and For-Prof i tO rganizations. Wellesley College Center forResearch on Women. Paper prepared for theGlass Ceiling Commission. On file.
4. Catalyst. 1993. Successful Initiatives forBreaking the Glass Ceiling to Upward Mobilityfor Minorities and Women. Paper prepared forthe Glass Ceiling Commission. On file.
5. Cox, Taylor and Smolinski, Carol. 1994.Managing Diversity and Glass CeilingInitiatives as National Economic Imperatives.The University of Michigan. Paper prepared forthe Glass Ceiling Commission. On file.
6. Golen, Amy. 1994. The Impact of the GlassCeiling on the Professions. Draft working paperprepared for the Glass Ceiling Commission. On file.
The Federal Glass Ceiling
Commission was directed to
“conduct a study of opportunities for,
and artificial barriers to, the
advancement of women and
minorities to management and
decisionmaking positions in
business.” The study included a
variety of activities, including
analyses of current academic and
business research, empirical studies,
data analysis, focus groups, surveys,
and public hearings. The components
of the research are listed in
alphabetical order.

7. Hamlin, Nancy; Erkut, Sumru; and Fields,Jacqueline P. 1994. The Impact of CorporateRestructuring and Downsizing on theManagerial Careers of Minorities and Women:Lessons Learned. Paper prepared for the GlassCeiling Commission. On file.
8. Harlan, Sharon L. and Bertheide, CatherineWaite. 1994. Barriers to Workplace AdvancementExperienced by Women in Low-PayingOccupations. Colorado State University. Paperprepared for the Glass Ceiling Commission. On file.
9. James, K. et al. 1994. Barriers to WorkplaceAdvancement Experienced by Native Americans.Paper prepared for the Glass CeilingCommission. On file.
10. Leonard, Jonathan. 1994. Use of Enforcementin Eliminating Glass Ceiling Barriers. School ofBusiness, University of California, Berkeley.Paper prepared for the Glass CeilingCommission. On file.
11. Mauricio Gastón Institute for LatinoCommunity Development and Public Policy,University of Massachusetts. 1994. Barriers to theEmployment and Work-Place Advancement ofLatinos. University of Massachusetts at Boston.Paper prepared for the Glass CeilingCommission. On file.
12. Schwartz, Debra B. An Examination of theImpact of Family-Friendly Policies on the GlassCeiling. 1994. Paper prepared for the GlassCeiling Commission. On file.
13. Shaw, L.B. et al. 1993. The Impact of theGlass Ceiling and Structural Change onMinorities and Women. Paper Commissioned forthe Glass Ceiling Commission. On file.
14 Thomas, Roosevelt et al. 1994. Impact ofRecruitment, Selection, and CompensationPolicies and Practices on the Glass Ceiling.Morehouse College. Paper prepared for the GlassCeiling Commission. On file.
15. Tomaskovic-Devy, Thomas. 1994. Race, Ethnicand Gender Earnings Inequality: The Source andConsequences of Employment Segregation. NorthCarolina State University. Paper prepared for theGlass Ceiling Commission. On file.
16. Wernick, Ellen. 1994. Preparedness, CareerAdvancement, and the Glass Ceiling. Paper pre-pared for the Glass Ceiling Commission. On file.
17. Woo, Deborah. 1994. The Glass Ceiling andAsian Americans. University of California,Berkeley. Paper prepared for the Glass CeilingCommission. On file.
18. Woody, Bette and Weiss, Carol. 1994. Barrierst o Work Place Advancement Experienced by
22

23
White Women Workers. University of Massachusetts at Boston. Paper prepared for theGlass Ceiling Commission. On file.
Analyses and Commentaries19. Bell, Ella Louise J. Edmondson and Nkomo,Stella M. 1992. The Glass Ceiling vs. TheConcrete Wall: Career Perceptions of White andAfrican-American Women Managers.Unpublished working paper.
20. Hispanic Policy Development Project. 1994. ALa Cumbre. A Latino Perspective on theCorporate Glass Ceiling. Paper prepared for theGlass Ceiling Commission. On file.
21. Lee, Yvonne Y. 1994. An Asian PacificAmerican Perspective on the Glass Ceiling. LeeConsultants. Paper prepared for the Glass CeilingCommission. On file.
Special Analyses of U.S. Bureau of the Census Data22. Asian and Pacific Islander Center for CensusInformation and Services. 1994. ReferenceDocumentation: Datasets of U.S. Bureau of theCensus Public Use Microdata Sample Files.Prepared for the Glass Ceiling Commission. On file.
23. Institute for Policy Research and Education ofthe Congressional Black Caucus Foundation.
1994. The Impact of the Glass Ceiling on AfricanAmerican Men and Women. Reference documen-tation: Datasets of U.S. Bureau of the Census Public Use Microdata Sample Files. Prepared forthe Glass Ceiling Commission. On file.
24. The Tomás Rivera Center. 1995. WageDifferentials Between Latinos and Anglos: AStatistical Portrait and Its Implications toGlass Ceiling Issues. Reference documentation:Datasets of U.S. Bureau of the Census Public UseMicrodata Sample Files. Prepared for the GlassCeiling Commission. On file.
Surveys and Focus Groups25. Henderson, Lucius S. III et al. 1994. Reporton Six Focus Groups with Asian, Black andHispanic Executives in Three Cities on IssuesRelated to The Glass Ceiling in CorporateAmerica. Paper prepared for the Glass CeilingCommission. On file.
26. ———. 1995. Final Report on Two FocusGroups with American Indians on Issues Relatedto the Glass Ceiling in Corporate America. Paperprepared for the Glass Ceiling Commission. On file.
27. McGuire, Georgianna and Nicolau, Siobhan.1994. In Their Own Words: CEO Views ofDiversity at the Top. Paper prepared for theGlass Ceiling Commission. On file.


WHAT ARE THE GLASS CEILING BARRIERS?

“I wanted to issue a ‘wake-up call’ to
American Business, telling them in
no uncertain terms that if they
effectively block half their employees
from reaching their full potential,
they’re only hurting themselves.”
Elizabeth Hanford Dole
President, American Red Cross
Former U.S. Secretary of Labor
A Few Good Women: Breaking the
Barriers to Top Management
Many of the same barriers that keep women and minority men from achieving their full potentialat lower levels of organizations continue to constitute the glass ceiling that keeps even the most qualified from advancing to top management.
Ann M. Morrison
The New Leaders: Guidelines on
Leadership Diversity in America
Ann Morrison’s study of a number of the nation’smost progressive businesses supports what theCommission research reveals. There are two majorareas of discrepancy which affect the advancement of minorities and women to senior managementpositions in business. They are:
• the discrepancies between the widely accepted stereotypes implying that minorities and women are unsuited for senior management, and the successful performance of many minorities and women who are in senior positions; and
• the discrepancies between the diversity that corporate leadership says it needs
and wants at the top, and what appears to be happening—or not happening—in society and in the corporations to support the leadership agenda.
The hard data and anecdotal information demonstrate that minorities and women are making progress in the private sector. (Korn/Ferry International and UCLA 1993). However,satisfaction with that progress must be temperedby the fact that the rate of change is discouraging-ly slow. Despite the recognition of corporate lead-ership that inclusion is a bottom-line issue, a glassceiling is still firmly in place and barriers to the advancement of minorities and women continueto exist on three levels: societal, internal, and governmental.
Societal Barriers that Affect the Glass CeilingThere are two major Societal Barriers that engen-der and reinforce a glass ceiling for minoritiesand women. They are:
• The Supply Barrier—Opportunity and Achievement
• The Difference Barrier—Stereotypes, Prejudice, and Bias26
WHAT ARE THE GLASS CEILING BARRIERS?

The Supply Barrier:Opportunity and AttainmentBefore one can even look up at the glass ceiling,one must get through the front door and into thebuilding. The fact is large numbers of minoritiesand women of all races and ethnicities arenowhere near the front door to CorporateAmerica.(Harlan and Bertheide 1994). Somegroups within the African American, AmericanIndian, Asian and Pacific Islander American, andHispanic American communities are dispropor-tionately represented among the working poor.Segments of all these groups are overrepresentedin low-wage occupations, in part-time and seasonaljobs, in the informal and secondary economies,and they suffer high unemployment. Mobility isalmost nonexistent, and if there is a lack of finan-cial resources, the prospects of educational attain-ment are further hindered.
Although business has been a strong supporter ofpublic and private education on all levels, (mostrecently in its sponsorship of a number of schoolreform initiatives), education lies outside thedirect purview of business. Corporate leadershipcan be a strong advocate for excellent schools, itcan participate in initiatives such as school-to-workand internships, and it can provide scholarshipdollars. But it cannot lead an education reformmovement, it can only promote one.
The Difference Barrier:Stereotype, Prejudice, and Bias Most stereotypes are not created out of thin air.Some may result from wide publicity given to theactions of those who are a minority within a group.For example, the exploits of African American,Asian, or Latino gang members or drug users areregularly reported in the media. This affects howthe general public views all members of these com-munities, a point that was strongly made at theFederal Glass Ceiling Commission’s New York public hearing by Charles Kamasaki, a vice president for the National Council of La Raza.
Other stereotypes reflect fantasies from the enter-tainment industry which has given us several generations of faithful African American servants,American Indian “savages,” treacherous and mys-terious Asians, and Latina “spitfires of the silverscreen.” Still other stereotypes result from faultyor narrow interactions with a particular segmentof a group that lead to generalizing from the par-ticular. If the only Hispanics or Asian and PacificIslander individuals one ever meets are waitersand parking lot attendants, the tendency is tobelieve that “they are all like that.” Stereotypes canbe absorbed and unconsciously become thebeliefs upon which we act.
Corporate leadership alone cannot eradicate attitudes that stem from widespread acceptance ofstereotypes. On the other hand, Ann Morrison 27
Large numbers of minorities and
women of all races and
ethnicities are nowhere near the front
door to Corporate America.

reports in The New Leaders: Guidelines on LeadershipDiversity in America that of all the barriers to corpo-rate advancement identified, it is prejudice thattops the list, or the prejudgment that someone“different,” such as a female executive, is lessable to do the job. Therefore, it is incumbentupon business to demand internal norms of practice and behavior that eliminate the impact of bias and prejudice on the hiring and advance-ment of minorities and women. To do so, it mustaddress the layers of difference that relate to thecomfort levels of those in charge. The major differences that lead to discomfort are:
• Cultural differences • Gender difference• Color-based differences
Cultural differences are the ones that businessleaders are most often willing to talk about. Infact, they themselves sometimes identify culturaldifferences as barriers that impede the advance-ment of minorities and women. As one corporateexecutive stated during an interview,
“Whether you’re talking about the factory flooror the Board room, you have to have a comfortand safety zone. You have to speak the samelanguage. It’s socialization, culture, and classthat are causing the problem.” (HispanicPolicy Development Project 1994).
A most revealing comment on the unconsciousresistance to differences is this:
“What’s important is comfort, chemistry, relationships, and collaborations. That’s whatmakes a shop work. When we find minoritiesand women who think like we do, we snatchthem up.”
Gender difference is not about minorities. It’s about the roles women—all women regardlessof color or ethnicity—are expected to fill. In theminds of many white male managers, business isnot where women of any race or ethnicity weremeant to be—certainly not functioning as thepeers of white men. Many white men don’t likethe competition and they don’t like the tension.The perception on the part of women that mendon’t respect them as professionals and don’twant to mentor them is borne out by the com-ments of male middle-level managers who saythings like—
“This man/woman thing is always going to bea problem. If you build a relationship with awoman people always assume that it is personal.” (Nicolau 1994).
“It’s always going to be tough to figure out howto treat the women, but now it’s worse and I’drather not be in a mentoring relationship withthem.” (Nicolau 1994).
Of all the barriers to corporate
advancement identified, it is prejudice
that tops the list, or the prejudgment
that someone “different,” such as a
female executive, is less able to do
the job.Ann Morrison
28

Such categories as managerial, execu-
tive, and administrative are too
broad to be useful in glass ceiling
analyses.
29
Color-based differences are inescapable butnobody likes to talk about them. These are complicated differences because they are notexclusively racial and not exclusively ethnic. The unstated but ever-present question is, “Do they look like us?”—whoever we may be.
Though it is mostly covert, our society has devel-oped an extremely sophisticated, and oftendenied, acceptability index based on gradations inskin color. It is not as simple a system as theblack/white/colored classifications that were usedin South Africa. It is not legally permissible, but itpersists just beneath the surface and it can be andis used as a basis for decisionmaking, sometimesconsciously and sometimes unconsciously. It isapplied to African Americans, to AmericanIndians, to Asian and Pacific Islander Americans,and to Hispanic Americans, who are described ina color shorthand of black, brown, yellow, andred, respectively.
Corporate leadership cannot make society culture-,gender-, or color-blind, but it can demand andenforce merit-based practice and behavior internally. The power of stereotyping in thegreater society could be substantially diminished if corporations across the board and on a grandscale were to demand behavioral change in howthey do their business.
The Government Barriers that Affect the Glass CeilingResearch sponsored by the Federal Glass CeilingCommission pinpointed three GovernmentalBarriers to the elimination of the glass ceiling.They are:
• Lack of vigorous and consistent monitoring and law enforcement
• Weaknesses in the collection and disaggregation of employment-related data
• Inadequate reporting and dissemination of information relevant to glass ceiling issues
Data CollectionOnly the public sector has the resources to gathernational, regional, and state data on education,status in the workforce, and compensation. Thecategories used by governmental data collectionagencies do not provide the information that isneeded to track and monitor accurately theprogress of minorities and all women. (SeeAppendices: Composition of the U.S. CivilianLabor Force, by Sex and Hispanic Origin). Suchcategories as managerial, executive, and adminis-trative are too broad to be useful in conductingdetailed glass-ceiling analyses.
It is significant that a number of the CEOs volunteered the information that the reportingcategories required by government agencies donot yield accurate profiles of their staffs in termsof race and ethnicity, gender, and level of management responsibility. One CEO scoffed at

30
“. . . the absurdity of the categories—they don’tget at what they should want to know—it’scriminal what people of ill will can get awaywith using those categories.”
The issue raised by the CEOs regarding the collection and disaggregation of compliance dataaffects all data related to the glass ceiling. It is notreadily available in contexts and forms that clearlyreveal whether minorities and women are advanc-ing in management positions in the private, public,and non-profit sectors. What is available is broadbrush, and in many cases has to be arrived at byworking backwards from statistics—for example,compensation levels that hint at status or levels ofresponsibility. In other cases, the datasets that con-tain the needed information are not large enoughto permit detailed disaggregated analyses. ReportTwo of the Federal Ceiling Commission will offerrecommendations about how governmental datacollection and disaggregation can be improved inorder to provide a better understanding of the roleof minorities and women in management.
Reporting and DisseminationResearchers, corporate leaders, focus group partici-pants, and advocates all agree that the governmentagencies play a very limited educational function.They collect data and monitor the progress ofminorities and women, but do little to provide infor-mation in useful forms to the public who are mostinterested and need to know what is happening.
Law EnforcementThe historical record shows that if affirmativeaction programs required of federal contractors areto be effective, government monitoring and sanc-tions are required. (Leonard 1994). While generalagreement exists that there is room for improve-ment, neither surveyed corporate leaders norminority male executives who participated in focusgroups called for any drastic changes in currentcompliance requirements. In fact, the majority ofthe CEOs interviewed stated that law enforcementhad been useful in “keeping us aware” or “keeping iton the front burner,” despite the inconvenience of“more paperwork downstairs.”
Jonathan Leonard’s paper prepared for the FederalGlass Ceiling Commission demonstrates the weak-nesses of past efforts to improve employmentopportunities for minorities and women throughvoluntary action. When the threat of enforcementis not real, the contract compliance program ceasesto have any demonstrable positive effect on minori-ty and female employment.
The Internal Business Barriersthat Affect the Glass CeilingCorporate leaders say that they want to removethe barriers that obstruct access to the top. Rareindeed is the white male high-level executive whopublicly opposes the principle of inclusion.Corporate leaders are talking the talk of inclusionyet minorities and women express dismay and

Corporate leaders say that they want
to remove the barriers that obstruct
access to the top. Rare, indeed, is the
white male high-level executive who
publicly opposes the principles of
inclusion.
31
anger when they describe what they perceive to beinnumerable obstacles to their corporate advance-ment. In short, there is a difference between whatcorporate leadership says it wants to happen andwhat is actually happening. (Hispanic PolicyDevelopment Project 1994). If we are to begin tounderstand why this difference exists, we mustseek answers to two questions:
• What is the underlying cause that we must address?
• What are the internal/structural barriers that we must dismantle to remove the glass ceiling?
The Underlying Cause: The Perception of LossThe Glass Ceiling Commission CEO survey, focusgroups and papers prepared by Woo, Bell andNkomo, James et al., Thomas, Wernick, Woodyand Weiss, as well as independent research con-ducted by Catalyst, the Hispanic PolicyDevelopment Project, White, Morrison andRosener, suggest that the glass ceiling existsbecause of the perception of many white malesthat as a group they are losing—losing the corpo-rate game, losing control, and losing opportunity.Many middle- and upper-level white male man-agers view the inclusion of minorities and womenin management as a direct threat to their ownchances for advancement. They fear that they arelosing competitive advantage. White male middle-level corporate managers, who were interviewed
in independent studies, frequently alluded to lossof opportunity. The following comments from“Off the Record,” an unpublished manuscriptmade available to the Federal Glass CeilingCommission by the Hispanic Policy DevelopmentProject, are illustrative:
“Look, you change the cast, you change the play. We are talking about more than pleasant diversity. We are talking about control.”
“If they are in, there’s less of a chance for me.Why would I want a bigger pool? White mencan only lose in this game. I’m endangered.”
Those corporate leaders who have successfullyaddressed these internal business barriers to theadvancement of minorities and women are thosewho have squarely confronted the reality that theirpriorities and the priorities of their middle- andupper-level managers are not always the same.
Many surveyed CEOs—even those who favoredinclusion and readily admitted that there wasupper- and middle-level white male resistance—tended to underestimate just how threatenedsome of the “white men in the middle” are by theinclusion of minorities and women. CEOs are notthreatened by the newcomers. As a consequence,the following business-based barriers to theadvancement of minorities and women are notalways being as forcefully addressed as they should

32
be even in companies that have made a commit-ment to inclusion.
Internal Structural Business BarriersOutreach and Recruitment Barriers—Most companies still prefer to grow their own leaders.Those who do not engage in active recruitmentcampaigns for minorities and women are notgoing to make much progress in advancing them.Most companies recruit on college campuses fortheir potential executives of the future. The indi-viduals who are recruited are the “best and thebrightest.” Business leaders are very clear aboutthis. Business seeks and recruits only the “cream ofthe crop” as prospective corporate leaders.
Business also competes. Those corporations withsubstantial recruitment budgets actively vie for thetop students from the top schools. Competition isso keen for some groups—African American men,for example—that some smaller companies report-ed that they can’t even schedule visits to campusesthat are likely to have these candidates. They feelthat this is a major barrier to their achieving diver-sity. CEOs of larger companies agreed with them,reporting that they identify promising candidatesin college in their freshman year and commit tothem with scholarships or internship arrange-ments.
It is important to note that corporate leaders didnot express concern about finding African
American women. In fact they reported that it was“easy to find top-quality Black women.” What is notclear is whether the recruiters envision the samepotential futures for the men as the women. AreBlack men being recruited for the same kinds ofmanagement jobs as are Black women? Are theybeing judged by the same standards?
Asian and Pacific Islander American men presented no recruitment challenges, accordingto the CEOs who were interviewed. They said thatthey know where to find them; they go after themand place them in professional positions. Theyalso reported no problem in recruiting Asian andPacific Islander American women.
When it came to other groups, not knowing where tolook emerged as a recurrent theme and barrier.American Indians appear nowhere on the radarscreens of most businesses and Hispanics onlyappear around the edges. There was a general feel-ing expressed by CEOs that “we don’t know where tolook for Hispanics.” Indeed, several had recruitedforeign nationals who spoke Spanish and who hadbeen trained in U.S. business schools. CEOs ofHispanic-owned businesses, however, report thatthey can find highly qualified Hispanics with“whatever credential you want” to fill top jobs. Theyagree with the mainstream CEOs that “the main-stream guys just don’t know where to look.”
Corporate America has not
demonstrated the flexibility required to
expand its traditional recruiting
networks.
33
It is clear that, in general, Corporate America hasnot demonstrated the flexibility required toexpand its traditional recruiting networks. Fewbusinesses have explored new and differentavenues to hire minorities and women. Most haverelied on executive search firms to find minorityand female candidates. (Bialeck: NY Hearing1994).
Some search firms have taken the initiative toexpand their reach. For example, a member ofthe board of directors of the Association ofExecutive Search Consultants (AESC)—which has123 members worldwide—testified at the LosAngeles public hearing that AESC is a major pro-ponent of diversity and is undergoing a re-exami-nation of its ethical and standard guidelines asresult of a AESC task force on advancing diversity.On the other hand, change does not happenovernight and some firms are still reluctant tomake major investments in expanding their net-works if they are not convinced that a marketexists.
The CEO of one search company candidly statedoff the record,
“I don’t have the networks into the minoritiesand women and I’m not sure that it is worthputting a lot of effort into building them untilthe clients’ demand increases.”
Another said,
“Listen, I’m meeting my bottom line and I wantto find the people that the client wants. My reputation is based on my track record of gettingthem candidates they are comfortable with. I can’t bring in too many minorities andwomen.”
Some corporate leaders say they have been unableto find enough top-quality minority candidatesfrom top graduate schools, and have resorted torecruiting proven managers from their competi-tion or from the military. (One CEO declared,“We steal, pirate and seduce—all of the above.”) Onthe upside, this practice has produced a cadre ofhighly paid, experienced minority male managers.On the down side, individuals who make too manylateral moves are, in the opinion of many of theCEOs who were interviewed, less likely to be invit-ed into top management because it is assumedthat they are likely to move on. Furthermore, mosttop executives still are “company men” who havecome up through the ranks.
The Corporate Climate Barriers—Once individuals have been recruited, differing communication styles and ideas of what is appropriate and acceptable behavior can know-ingly or inadvertently create barriers to theiradvancement and can influence supervisors’ evaluations of their performance and potential.
Today the prevailing culture of many businesses isa white male culture. As the CEO of a majornational retailer said:
“The old-line companies are run by the white‘46 long’ guys who practice inappropriate malerituals that are dysfunctional to business. Malebonding through hunting, fishing, and sportstalk is irrelevant to business. Too much so-called ‘strategic planning’ takes place after thebars close—that kind of male fellowship ritualis irrelevant to business.”
It may be irrelevant, but it thrives. Commissionresearch, testimony at public hearings, and com-ments made in the focus groups all spoke to thedifficulty and stress that minorities and womenexperience living in two worlds that are in someways incompatible. Minorities and women fre-quently related how hard they tried to discern thenorms and rules of the white male corporate cli-mate and to conform to them. Some went on tosay that no matter how hard they tried to con-form, it didn’t help. They feel excluded from theformal and informal networks that promoteadvancement.
One participant in a focus group described thecultural gulf that minorities and women experi-ence as the inability to build “kinship” with whitemen. Several echoed this view when they spoke ofhow they were excluded from “going out for beers”
or “to the gym” with the boss. They saw this exclu-sion as a barrier. They felt that those who wereinvited to the beer-bonding sessions or the gymhad better chances of promotion.
Many focus group participants spoke of the diffi-culty of decoding the corporate communicationstyle, both across the gender line and between cul-tures. Much has been written about the differingways in which men and women communicate andtherefore perceive each other. Less hard data isavailable about what different ethnic and racialgroups consider to be appropriate ways of commu-nicating in given situations and settings.
Still other focus group participants expressed dis-comfort at the corporate practice of includingfamilies in business-related social events. In theircultures, wives are not expected or encouraged toparticipate in business-related matters. The partic-ipants explained that they were willing to adapt totraditional corporate norms but were dismayedthat workplace acceptance required an invasion oftheir family privacy and violation of their culturalpractices. One man’s question posed the dilem-ma, “How much do I have to deny who and what I amto succeed in this company?”
Be it modes of dress, modes of communication, ormodes of socializing, many minorities and womenfeel that the corporate climate selects them out ofadvancement. Unfortunately, many business leaders
Minorities and women frequently
related how hard they tried to discern
the norms and rules of the white male
corporate climate and to conform to
them.
34

35
appear unaware of the discomfort minorities andwomen experience. Research, public hearings,focus groups, and interviews show that minoritiesand women feel that they cannot overcome thisexclusion barrier no matter how they modify theirbehavior to conform to the corporate climate. Onewoman declared,
“If I want to succeed, I have to accept the whitemale notion of what constitutes the good life. Buteven when we do that and demonstrate excellentperformance by their standards, it doesn’t guarantee a trip to the top.”
Women and minority men are frustrated when theycontinue to be excluded and their frustration trans-lates into anger. (Harris, LA Hearing 1994). Angeris exacerbated when overt racism, sexism, and sexu-al harassment occur. Some minorities and womenreported that they managed to internalize theirrage or hide it; others who could not said that theywere perceived to “have an attitude” or “a chip on myshoulder” which, they admitted, only increased tothe strikes against them.
The other side of the coin relates to how white menfeel. There is no doubt that as more minorities andwomen strive for top corporate positions, somewhite men continue to believe that minorities andwomen are taking over and imposing different cultures and communication styles on them. They,too, feel excluded and angry. Some envision the
extremes—white men won’t be able to get jobs, allwomen will sue men who pay them compliments,and if their houses are on fire they won’t be rescuedbecause the firefighters will be women who can’tcarry them. Many white men feel at risk. They usedto “know the rules” and they competed only againsteach other. Now those that they excluded from thegame have become players and some white menfear that minorities and women may gain power andexclude them. It is interesting that few white menperceive the historical denial of opportunity suf-fered by minorities and women as “loss.” The lossthey see is that which they fear will happen to them.White male anxiety is understandable but it con-tributes to the preservation of the glass ceiling anddenies business the diversity it needs to remain competitive.
The Pipeline Barriers—The corporate pipeline hasa series of glass ceilings that can block the access ofan individual to the top. White male anxiety and thepersistence of a traditional corporate culture caninfluence how and whether middle-level supervisorsdirect the career paths of minorities and womenover or under these multiple glass ceilings. If the mes-sage from the CEO at the top is not clear and doesnot demand accountability, minorities and womenare often subject to the policies and practices thatact as barriers to their advancement. The major barriers identified by Commission research, CEOstudies, and focus groups are these:
White male anxiety is understandable
but it contributes to the preservation
of the glass ceiling and denies
business the diversity it needs to
remain competitive.
The corporate pipeline has a series of
glass ceilings that can block the access
of an individual to the top.

• Initial placement and clustering in relatively dead-end staff jobs or highly technical professional jobs
• Lack of mentoring• Lack of management training• Lack of opportunities for career
development • Lack of opportunities for training tailored
to the individual• Lack of rotation to line positions or job
assignments that are revenue producing • Little or no access to critical developmental
assignments, including service on highly visible task forces and committees
• Different standards for performance evaluation
• Biased rating and testing systems• Little or no access to informal networks of
communication• Counterproductive behavior and
harassment by colleagues
It is important to understand that, in any given set-ting, these practices are tailored to different groupsin different ways, but the end result is the same—they all strengthen the glass ceiling.
IN CONCLUSION
Corporate leaders estimate that it takes 20 or 25 years in a corporation to achieve a high-level man-agement position. That means that businesses who
sought inclusion in the late 1960s are now crackingthe ceiling, while most of those who started later arefar behind. Using that same measure, businessesthat are just beginning to diversify their workforcesare unlikely to see significant change at the seniorlevels until well into the 21st century. This is notmeant to be a justification for lack of progress. It is awarning—the later a business starts, the later it willget where it is going.
Change comes hard and it carries a price tag. It isnot painless. However, it can be handled well or itcan be handled poorly. Companies have made thetransition from exclusion to inclusion while contin-uing to prosper. The information in the next sec-tion, What Works to Overcome The Business Barriers? isdrawn from their experiences.
One focus group participant succinctly summed upwhy and how the citizens of a pluralistic nation muststrive to work together—
“My first impression is that there is an ‘usagainst them’ mentality. So you must remove theracist thoughts that lie deep in the soul. And youdo that by removing all doubts about intention,remove the myths about upbringing.Understanding and familiarity breed togethernessand together we shall prosper as one.”
36

WHAT WORKS TO OVERCOME THE BUSINESS BARRIERS?
“The theme of the future must be inclusion, notexclusion—inclusion not at the expense of anygroup, but to the benefit of all.”
Solomon TrujilloPresident and CEOUS West Marketing Resources
The societal, government, and internal businessbarriers identified in the previous section areinterrelated. They form a maze as well as a set ofhurdles. There is, therefore, no one golden paththrough, over, under, or around the glass ceiling.
Corporate America alone did not erect all thesebarriers and it alone cannot be expected toremove them. However, barriers internal to businessmust be removed from within, and most corporateleaders recognize this. They understand that bothindividual and organizational change are requiredto open up the old networks and to change thefamiliar old ways of doing things. This section,What Works to Overcome the Business Barriers?describes the experiences of those companies thathave committed themselves to dismantling theglass ceiling. It is divided into three parts:
Part I, Characteristics of Successful Programs, identi-fies the organizing principles and elements com-mon to successful programs.
Part II, Case Studies, presents brief case studies ofcomprehensive programs implemented by threehighly successful and profitable companies.
Part III, 100 Corporate Practices, summarize infor-mation on successful corporate practices. Thisinformation - in table form - is found in theAppendix.
38
WHAT WORKS TO OVERCOME THE BUSINESS BARRIERS?
That change does not come easily is evidenced bythe slow progress in eliminating the glass ceilings.However, many companies are moving ahead andare managing change effectively. Although thedesign and structure of their plans differ accord-ing to the needs of different companies, the following characteristics are common to all successful glass ceiling initiatives:
• They have CEO support• They are specific to the organization• They are inclusive• They address preconceptions and
stereotypes• They emphasize accountability• They track progress• They are comprehensive (Catalyst 1993).
SUCCESSFUL PROGRAMS HAVE CEO SUPPORT
Successful programs have strong and sustainedCEO support. Programs work when the CEO andsenior-line managers are advocates for change andact accordingly. They recognize that time alonewill not eliminate corporate barriers to theadvancement of minorities and women.
Consequently, their strategic business plans include strategies for advancing minorities andwomen. Each CEO and leadership team mustdemonstrate that inclusion of minorities andwomen is a top business priority. Otherwise thebest-laid strategic plans designed to change how abusiness recruits, hires, develops, and promotes itsworkforce will fail. In the words of Ann Morrison,“it is the proactive, relentless intervention ofsenior executives in the organization that makesthe most difference.”
SUCCESSFUL PROGRAMS ARE SPECIFIC TO THE ORGANIZATION
Successful programs begin by identifying theinternal barriers specific to the corporate cultureand the working environment of minorities andwomen. No two companies are alike. Corporateleaders need to be alert to the danger of bench-marking against the programs of other companieswithout first identifying their own internal bar-riers to the advancement of minorities andwomen. What works in one situation may not beeffective elsewhere. Programs must be tailored tomeet specific needs. 39
Successful programs have strong and
sustained CEO support. Programs
work when the CEO and senior-line
managers are advocates for change
and act accordingly.
PART I: CHARACTERISTICS OF SUCCESSFUL PROGRAMS

SUCCESSFUL PROGRAMS ARE INCLUSIVE
Successful corporate efforts to remove barriers arenot exclusive to minority men or to women andthey do not exclude white males. Many white meninterpret a policy of inclusion of minorities andwomen to mean that the opportunities of whitemen are being limited. Some believe that asminorities and women gain advancement, whitemen will lose the opportunities they have histori-cally enjoyed. On the contrary, inclusive programsdo not subtract from the leadership pool—theyadd to it by making opportunities available to allby removing the barriers that have historicallyexcluded minorities and women.
Public testimony and CEO comments supportresearch findings that businesses have shiftedfrom programs that addressed the specific needsof minorities and women to more systematicapproaches that include all qualified employees. CEOsreport that inclusive initiatives make good sensefor the following business reasons:
• The entire organization benefits from accountability, leadership training, career development, succession planning, mentor-ing, and diversity training that all are good for all individual employees.
• Programs targeted at only one group may contribute to a stereotype that the mem-
bers of that targeted group are inadequate or unqualified.
• Programs that are open to all qualified employees overcome suspicions aboutselective treatment. This meets a concern expressed by senior executives.
Companies that have made progress in eliminat-ing glass ceiling barriers with minimum disrup-tion have attacked it from two directions. Theyhave emphasized common needs of all employees forconstructive performance appraisal, frequentfeedback, coaching, and mentoring. These tech-niques improve the work environment andadvancement opportunities for everybody. At thesame time, they have addressed the differences, real orperceived, that affect the opportunities of differentemployees for development and advancement. And,they have systematically monitored the develop-ment and advancement of particular groups with-in the employee population.
SUCCESSFUL PROGRAMS ADDRESS PRECONCEPTIONS AND STEREOTYPES
Diversity training—training that addresses stereo-types and preconceptions, issues of sexual andracial harassment, cultural differences, and stylesof communication—has been used by many cor-porations in their efforts to eliminate the glassceiling. Diversity training is useful for debunking
Businesses have shifted from programs
that addressed the specific needs of
minorities and women to more system-
atic approaches that include all
qualified employees.
40

myths about the suitability of minorities andwomen for careers in business, but diversity training alone will not solve the glass ceiling problem. Companies must be careful not to rely on diversity training as a panacea, therebyignoring the need to identify and attack internalorganizational barriers.
Effective diversity training has three common elements:
• All employees are required to participate.• Training sessions do not separate top
executives from lower- and middle-level workers. The presence and participation of top executives is important and signals commitment.
• Minorities and women are not isolated for special training. Such special programs have the serious disadvantage of appearing to address the “shortcomings” of the group.(Cox and Smolinski 1994).
Styles of CommunicationWhen business was almost exclusively the domainof the white male, styles of communication were a non-issue. Most white men understood what otherwhite men meant not necessarily by what they saidbut by how they said it. That has changed on thefactory floor and in the management suite.Minorities and women bring their own styles of communicating and this proliferation of stylesintroduces a potential for misunderstanding.
Misunderstandings cost money. Business can illafford breakdowns in communication. Corporateleaders have become increasingly aware of theneed to overcome barriers to communicationsand of the need to bridge internal communica-tion gaps. Companies are providing training onthe differences in communications styles in orderto sensitize all employees to the subtleties of thesedifferent styles. Such training helps employees tounderstand the meanings of the words and thebody language of their colleagues.
Cultural DifferencesA perception shared by many minority men andby many women is that they are expected to playby white male rules in order to get ahead or even tobe accepted in a corporate culture. There is nodoubt that a certain level of conformity isrequired in business as it is throughout the largersociety. However, as business management increas-ingly reflects the pluralistic nature of U.S. society,many businesses have realized that the harmony—and therefore the efficiency and effectiveness—of the workplace requires greater sensitivity to cultural differences.
The businesses that have moved towards diversityare those that have undertaken extensive trainingfor everyone—from the CEO on down—and havethen evaluated organizational attitudes, behaviors,expectations, practices, and policies in an attempt to establish a way of treating and judging allemployees that is as neutral as possible.
Diversity training is useful for
debunking myths about the suitability
of minorities and women for careers
in business, but diversity training
alone will not solve the glass
ceiling problem.
41

In some corporations, those traditional businessnorms that are not acceptable in some societiesand are not directly relevant to the functioning ofbusiness are no longer used to judge employees.Other companies have eliminated some of the tra-ditional male rituals—for example, they no longersponsor annual fishing expeditions or golf tourna-ments as corporate events.
Successful Programs Emphasize AccountabilityIn all organizations, but especially in large ones,managers down the line generally carry consider-able responsibility and wield great power in theirdomains. Therefore, the top leadership team ofany business intent on change must communicateits desire down the line and then support its mes-sage with clearly defined expectations.Accountability reinforces the message from thetop that progress toward inclusiveness is being assessed and will be rewarded. Managers must beheld accountable for the development andadvancement of minorities and women. Goals andtimetables must be agreed upon, measurableresults must be established, and incentives,rewards, and penalties must be tied to perfor-mance in meeting the goals and achieving results.
Those CEOs who demanded this kind of account-ability report that when the initial grumbling sub-sides, managers begin to compete to achieve andthe rate of change is accelerated. Several CEOs
cautioned that it is important to emphasize to allmanagers that inclusion does not mean changingstandards. Merit and performance remain thebasis for selecting potential senior managers.
Successful Programs Track ProgressSuccessful programs require constant attention,oversight, and review in order to ensure thatprogress is steady and that course corrections aremade as needed. Corporate leaders report thateffective programs rely on a tracking system thatmonitors the progress of high potential minoritiesand women to make sure that they acquire abroad range of experience in core business areasand are able to compete for leadership positionsat all levels.
Successful Programs are ComprehensiveSingle-pronged programs have little effect on glass ceilings. Isolated interventions here or there,however brilliant, do not result in lasting change. For example, programs that help employees bal-ance work/family responsibilities should be main-tained and strengthened because they are undeni-ably beneficial to all employees. However, they dolittle to attack structural barriers in the corporateculture and work environment.
This point was emphasized by a testifier at theFederal Glass Ceiling Commission public hearingin New York City. Speaking as an expert on issuesof diversity and managerial and professional-tech-42
Managers must be held accountable
for the development and advancement
of minorities and women.

nical labor, she said,
“I think that everyone agrees the glass ceilingissue is one that involves structural barriers tosome extent and that overcoming it may involvechanging an attitude but it also involveschanging structures.”
Those businesses that have made progress inremoving structural barriers are those using com-prehensive approaches designed to bring highpotential minorities and women into the corpora-tion and then to move them up within the corpo-ration. Outreach and recruitment get people in.Leadership training and career development, mentoring and networks, and assessment and pro-motion enable them to move on up.
Outreach and RecruitmentOutreach, recruitment, and identification ofpotential leaders are basic elements in any long-range plan to eliminate the glass ceiling. A busi-ness that does not seek out and recruit minoritiesand women early in their careers is unlikely everto have them in leadership positions. The same istrue for a business that does not identify andencourage high potential minorities and womenwithin its own organization.
Those businesses that do have minorities andwomen above or about to come through the glassceiling rely on more than one strategy. Proven
strategies include:• Providing internships targeted to minorities
and women during their undergraduate years as a means of identifying potential managers. Internships have proven to be extremely effective first steps in the identifi-cation and development of minority and female employees and managers.
• Emphasizing the responsibility of managers for recruitment. Some high-level managers have served on corporate teams that recruit and interview on college campuses. Other managers have been rewarded for identify-ing and recommending nontraditional candidates.
• Using executive search firms that specialize in placement of women and minority men. Often owned by women or minority men, these “headhunting” firms have their own networks that lead to candidates who are often invisible to traditional search firms.
• Making executive search firms accountable for bringing forward the best candidates available regardless of gender, race, or ethnicity by emphasizing that the firm is expected to identify top-quality candidates with diverse backgrounds and viewpoints. The CEOs who employed this strategy say that they are getting a better mix of candi-dates than they did before making their expectations very clear to the search firms.
• Asking female or non-white CEOs for 43
A business that does not seek out and
recruit minorities and women early in
their careers is unlikely ever to have
them in leadership positions.

advice and referrals. CEOs who have sought advice and referrals report that this not only identified candidates, but also strengthened their credibility with skeptical female and minority candidates.
• Recruiting entry-level candidates in groups. One Fortune 1000 business that has begun to recruit heavily from historically Black colleges and universities reported that many graduating seniors preferred to be hired in groups of two or three. Most were from rural areas, had little or no expe-rience living in metropolitan areas, and had maintained close family and community ties through frequent visits home during their college years. Because these candi-dates would be placed in year-long manage-ment training programs in major cities far from their homes, the business attempted to ease the transition to an urban corporate culture. The CEO felt that the company’s flexibility in addressing the candidates’ sense of isolation did not detract from successful business practices. In fact, it demonstrated to the candidates an under-standing that was likely to be returned in their loyalty and commitment to his business.
Leadership and Career DevelopmentProgramsUnless minorities and women with outstandingpotential are placed on the “star track” or the “fasttrack” and are then included in long-term leader-ship and career development programs, they areunlikely to be promoted into the positions thatlead to the top. Development programs are long-range and broad-based. They are designed tobuild skills that managers need to lead a companyin a changing competitive climate. Whereas train-ing programs are typically short-term and highlyspecific, development programs meet long-termgoals along the 20 to 25 year career path to seniormanagement.
Successful glass ceiling initiatives identify andmonitor the progress of high potential managers.The initiatives ensure that the managers acquirethe broad range of experience in core businessareas necessary to compete for senior leadershippositions. Successful leadership and career development programs share four common characteristics:
• Information about criteria for eligibility is clearly stated in writing and widely distributed
• High potential individuals are identified at all levels of the organization
• Training and educational opportunities are made available to all employees who have met those performance, skill, and knowledge criteria
44

A career path process identifies the
objective performance, skill, and
knowledge criteria for moving from
one level in a job to the next, enabling
individuals to plan their own growth
and advancement .
• A career path process identifies the objec-tive performance, skill, and knowledgecriteria for moving from one level in a job to the next, enabling individuals to plan their own growth and advancement (Catalyst 1993 and Wernick 1994).
The content and structure of career developmentprograms that are effective are much the same forminority men, women, and white men. Theyinclude career development assignments andleadership training and reflect the career optionspossible within the particular company. Theyoften include rotational and non traditional jobassignments. These assignments broaden the baseof experience, offer exposure and visibility in dif-ferent areas of a company, and provide opportuni-ties to demonstrate capabilities in an environmentwhere stereotypes affect job assignments. Theyalso offer exposure to senior leadership throughrotations, presentations, and special assignments.
Mentors and NetworksMentor relationships have always existed in theworkplace. In the business context, mentors arehigher level employees who can be dependedupon to share personal insights and provide guid-ance and support to enhance the performanceand career development of junior employees.Research has documented that having a mentorcan significantly affect an individual’s careerdevelopment and advancement. The person who
makes it to the executive suite without the supportand encouragement of a mentor is rare indeed.Minorities and women seldom have strong men-tors to guide them through the corporate thickets.(Some reasons for their lack of mentors will bepresented in the Group Environmental Scans.)
Over the past decade, corporations have focusedon this shortcoming by providing structured programs. They have established formal mentor-ing programs for minorities and women who havetraditionally been excluded from the informalmentoring process. Formal mentoring programsmake the process more widely available, more efficient and meaningful, and more equitablethan is often the case with informal mentoring. Research done by Catalyst for the Glass CeilingCommission shows that the following elements arecommon to the most effective programs:
• Objectives are linked to a business goal• Support of top management• Comprehensive planning (including
guidelines and training)• Involvement of protégé’s supervisor• Voluntary participation• Monitoring and evaluation
Businesses are not limiting themselves to mentor-ing programs to provide career guidance and sup-port. Employee-sponsored networks and affinitygroups also support career development and pro-vide leadership opportunities through confer- 45

ences, seminars, and workshops. One participantdescribed the value of networks in these words:
“[We] share strategies and information that is unavailable elsewhere. Those who are close to or through the glass ceiling tell others where thecracks are and what size hammer to bring.”
Assessment and PromotionOutreach, recruitment, leadership training,career development, mentoring, and networksaffect who is going to move into senior manage-ment. Businesses have clearly marked paths to thetop and those individuals who aspire to seniorleadership have to get onto those paths and thenmove along them. The rate at which one movesalong is controlled by assessment of performancein the various jobs that represent the stops alongthe way. Assessment and promotion can be, and often are, subjective decisions. Minorities and women often feel that they are evaluated unfair-ly—that stereotypes and prejudice are filtersthrough which they and their performances arejudged.
The companies that have been most successful inovercoming subjective judgments and that, there-fore, have better track records of promotingminorities and women, recommend adoption ofthe following practices and processes:
• Clearly written job descriptions that define responsibility and expected outcomes
• Cross-divisional Assessment and Promotion Committees to review promotion and succession decisions, reduce personal and subjective opinion, and place maximum emphasis on merit
• Vertical and horizontal organization of work and working relationships to provide and support opportunities for lateral mobility
• A formal system of open communication whereby the criteria for success is clearly stated and available to all employees
• Feedback on performance and information needed for career planning is available and accessible to all employees (Catalyst 1993).
These practices demystify and equalize advance-ment and promotion processes and policies.
The Next StepCorporate leaders perceive change in the businessenvironment to be the factor that is driving business to take a hard look at the glass ceilingand remove the barriers that keep minorities andwomen stalled. The first step in any successful ini-tiative is to take a hard look at the organizationitself—the presence, status, and opportunities ofminorities and women within the corporate cul-ture. Part II, Case Studies of Successful Programs,describes three companies whose leaders took ahard look at their organizations, did not like whatthey saw, and did something about it.46
Minorities and women seldom have
strong mentors to guide them through
the corporate thickets.

The Federal Glass Ceiling Commission has foundthat businesses vary in their awareness of glass ceil-ing issues and in efforts to overcome glass ceiling barriers. Some businesses pioneer initiatives toremove the barriers and continue to do so. Thework and family programs offered by theseemployers, have great impact on the lifelongcareer paths of women and people of color whoshare responsibility for their families daily care,and their ability to take on promotions and opportunities if offered. This section brieflydescribes the efforts of three companies—XeroxCorporation, Procter & Gamble, and IBM—thatare successfully eliminating glass ceiling barrierswhile remaining competitive and profitable.
XEROX CORPORATION
CEO Commitment and Leadership—Almost 40 years ago, Joseph C. Wilson, the founder ofXerox, made diversity a core value of the corpora-tion. He called it “valuing and respecting people.”Current CEO Paul Allaire believes that a diverseworkforce gives Xerox a competitive edge.
Accountability—Allaire expects senior managersto develop and maintain a balanced workforce
and holds them accountable for achieving thosegoals. In turn, senior managers hold their man-agers to the same standards. An annual memoentitled Balanced Workforce Performance, reports theworkforce participation of minorities and womenand summarizes progress in meeting the goals.
Under its Minority/Female Supplier Program, thecompany also holds its vendors to high standardsof workforce diversity while expanding their business opportunities. In 1992, Xerox spent $196 million with minority- and women-ownedbusinesses.
Outreach and Recruitment—Xerox has a long-standing and successful employee referral systemin which all employees are encouraged to referfriends and relatives to apply for employment. In the 1960s, Xerox initiated special efforts torecruit women and minority men, beginning with Booster, a collaborative program with UrbanLeague affiliates, and Step-Up, a minority out-reach program in Rochester, New York. Today the company has one team of African Americanmanagers who serve as liaisons with historicallyBlack colleges and universities and another team
47
“Workforce diversity is a priority at
Xerox and adds value to our business.
Diversity of our workforce requires an
openness by all employees in respect to
age, race, gender, and thought.”
CEO Paul Allaire
PART II: CASE STUDIES OF SUCCESSFUL PROGRAMS

of Hispanic managers who coordinate efforts torecruit Hispanic men and women.
Training—All employees are kept aware of company policies on issues sexual, racial, andethnic harassment. A brochure highlighting thecompany policy is given to every employee. Xeroxinstituted workshops in sexual harassment preven-tion in 1982.
Development—High potential employees arecounseled on the steps necessary to advance theircareers. Their job assignments support theiradvancement—for example, of the 80 Xerox managers currently on international assignments,13 are women and 23 are minorities. A key element of the succession-planning process is toimprove the representation of minorities andwomen in upper management—currently 20 percent of Xerox vice presidents are members of minority groups and 12 percent are women.Twenty-four percent of the corporate officers arewomen and minorities 1.
Mentoring—Caucus groups are fundamental tothe company’s mentoring activities. All groups areemployee-initiated and employee-funded. Theyconduct workshops, conferences, and individualmentoring activities on management processes,career planning activities, and work/family issues.
1The category “minorities” includes both men and women, so that a femaleemployee is counted here both under the category “women” and as aminority.
The company also has support groups based onsexual orientation, disability, and functionalexpertise.
Work and Family—Xerox’s Life Cycle Assistancecombines a variety of work/family programs thatinclude income-based subsidies for child care, customized medical benefits, an employee assistance program, and tuition aid for employees.
48

PROCTER & GAMBLE
CEO Commitment and Leadership—More than30 years ago, Procter & Gamble’s PresidentHoward Morgan sent a letter to his senior managers, stressing that the company simply hadto do better at providing employment for AfricanAmericans. Today, Chairman Edwin Artz sends an annual letter to P&G’s more than 100,000employees, outlining the company’s diversity policies and emphasizing its conviction that, in his words—“Developing and managing a strong,diverse organization is essential to achieving our busi-ness purpose and objectives.”
Accountability—Each P&G business unit has spe-cific goals for the development and advancementof minorities and women, as well as plans forachieving those goals. Data on hiring, promotions,job rotation, and training are entered into a computerized Diversity Measurement System, giving senior management the ability to trackprogress in meeting goals. The number of womenat the department director level has doubled inthe last five years and the number of minorities atthe associate director level has tripled.
Outreach and Recruitment—P&G provides internships through the Graduate Engineering for Minorities Consortium, the National UrbanLeague’s Black Executive Program, and theNational Alliance of Business Colleges’ Cluster
Program. In 1993, 47 percent of the interns werewomen and 46 percent were minorities. P&G provides leadership and support for several programs designed to attract minority students to engineering and science and the company provides support to numerous women’s andminority organizations.
During the past 10 years the company’s record of hiring and promoting minorities and womeninto management has been strong, with womenaveraging approximately 40 percent and minoritymen approximately 25 percent of new hires.
Training—All employees participate in diversitytraining. The company’s goal is to create a business environment in which individual differences are not only valued but celebrated and prized.
Development—Development programs are customized to give each employee opportunities,tools, and skills needed to realize his or her fullpotential. P&G College, designed to reach allemployees, is staffed by senior managers whoteach basic business courses fundamental to business success.
Mentoring—Dozens of networking and supportgroups exist throughout the company—for example, Women Supporting Women (WSW) and the Asian American Self Directed Learning 49
“Developing and managing a strong,
diverse organization is essential to
achieving our business purpose and
objectives.”
Chairman Edwin Artz

Conference. WSW’s annual workshop bringstogether mid-level women managers to discuss job growth and development issues. The LearningConference helps Asian and Pacific IslanderAmericans understand cultural differences andperceptions that affect business operations.Experienced P&G managers serve as counselors,coaches, guides, and advisors to less experiencedemployees and are available to all employees upon request.
Work and Family—P&G considers family-friendlypolicies as an investment that pays off in attractingand retaining employees. Family-friendly programs include child care leave, adoption assistance, on-site medical screening, employeeassistance programs, tuition reimbursement forcollege courses, flexible schedules, and financialsupport of nearby child-care facilities.
50

IBM
CEO Commitment and Leadership—In 1935,when IBM first hired professional women in marketing, Chairman T. J. Watson declared, “Men and women will do the same kind of work forequal pay.” Current CEO Louis V. Gerstner, Jr., terms diversity “an issue of strategic and tacticalimportance,” made workforce diversity the subjectof one of his first policy letters. He wrote,
“I believe workforce diversity to be of real importance to IBM’s success. As the marketplacebecomes increasingly diverse, IBM’s competitive-ness will be enhanced through a workforcewhich reflects the growing diversity of the external labor force, and the growing diversityof our customers.”
Accountability—IBM sets goals for minorities and women in job groups where they are under-utilized, with the intention of achieving represen-tation according to availability at all levels in thecompany. Each manager’s annual appraisalincludes an evaluation of his or her efforts inimproving IBM’s workforce diversity profile.
A salary analysis is conducted for each minorityand femalee employee. These analyses compareminorities and women employees with their similarly ensuring situated white and male peers.
Outreach and Recruitment—IBM was the firstcompany in the U.S. to support the United Negro College Fund in 1944, its initial year. The Company began active college recruiting athistorically Black colleges in the 1950s. In 1972IBM initiated the Faculty Loan Program whichallows employees to take up to a year off to work for a college, at full IBM salary, in projectsaddressing the needs of disadvantaged, female, or disabled students. More than 1000 employeeshave participated. In 1991 IBM established theMinority Campus Executive Program. AfricanAmerican, American Indian, Asian and PacificIslander, and Hispanic American executives serveas liaisons with the presidents of 24 colleges thathave large/predominantly African American,Hispanic American, Asian and Pacific IslanderAmerican, and American Indian populations.
IBM recruits from colleges and universities that have significant numbers of women andminority students. Critical to recruitment arethese three principles:
• Equal employment and affirmative action are treated as business objectives
• Line managers at all levels are accountable for progress in meeting diversity objectives
• Investing time and effort in recruiting and sustaining a supply of diverse employees long-term, continuing success in meeting diversity objectives
51
“. . . IBM’s competitiveness will be
enhanced through a workforce which
reflects the growing diversity of the
external labor force, and the growing
diversity of our customers.”
CEO Louis V. Gerstner, Jr.

Training—All company diversity training programs use an IBM video, “Valuing Diversity: A Competitive Advantage.” Diversity councils identify, recommend, and implement plans and programs to enhance workforce diversitymanagement. The councils meet regularly andcoordinate roundtable exchanges and focusgroups to discuss opportunities, challenges, andconcerns of the workforce. Training in sexualharassment prevention is an integral part of allemployee training.
Development—Attendance at IBM’s executiveseminars is an important training experience inthe company—in 1993, 22 percent of thoseattending were women and 7.7 percent wereminorities. In the same year, 25 percent of thosewho attended IBMs advanced management schoolwere women and 15.7 percent were minorities.
A key developmental experience is an internation-al job assignment—an experience outside of theU.S. in a different culture and work environment.From 1991 to the end of 1993, more than 500employees participated—15 percent were womenand 9.6 percent were minorities 1.
It is a requirement that the opportunity to use the Employee Development Plan process be
1The category “minorities” includes both men and women, so that a femaleemployee is counted here both under the category “women” and as aminority.
offered to each woman, minority, Vietnam-era veteran, and person with a disability. TheEmployee Development Plan is a document usedin partnership between the employee and themanager to understand and maximize strengths,and to identify and address weakness. It also provides a vehicle to discuss career aspirations and to establish a plan to help achieve reasonablecareer objectives.
Mentoring—The goal of IBM’s MentoringProgram is two-fold. First, it provides a place where women and minorities, and people with disabilities can go for “penalty-free advice”; andsecond, to provide senior employees and managers the opportunity to have a variety ofcoaching, developing, and managerial experi-ences with people who are different from them.Mentoring begins as soon as an employee joinsIBM. The program supports employees at three levels:
• Officer Level—Mentors guide selected women and minorities who have been identified as potential corporate officers
• Corporate Level—Mentors guide selected women and minorities who have been identified as potential executives
• Noncorporate Level—Mentors guide new employees to provide early career assistance and maximize their career growth.
52

Work and Family—IBM’s ongoing goal in this area is to demonstrate that these programs arepractical, effective, and efficient tools to achievebusiness results. IBM’s Work/Life Programs aredesigned to help all employees be productivewhile meeting personal and family needs.Programs include flexible work hours and flexiblework locations, a personal leave program, andchild and elder care support. Work/LifeEmployee Surveys in 1986 and 1991 providedvaluable data on existing programs, and led to recommendations for new projects/programs.IBM has made a special commitment to the subject of Dependent Care support. In 1989, IBMannounced the IBM Funds for Dependent Care
Initiatives, a $25 million investment made over theyears 1990-1994. During that period more than500 child care/elder care projects were funded incommunities where IBM employees live and work.In addition, in 1992, IBM was one of the 11“Champion” companies that funded TheAmerican Business Collaboration for QualityDependent Care. It was the largest collaborationin U.S. history that included 156 organizationsand invested 27 million dollars in 355 projects in 45 communities.
53

In its examination of corporate glass ceiling initiatives, the Federal Glass Ceiling Commissionfound that comprehensive, systemic approachesare more likely to have lasting positive impactthan isolate, one-shot or ad hoc approaches.Because they are designed to overcome the struc-tural barriers specific to the business, differentglass ceiling initiatives emphasize different com-ponents. However, research suggests that effectiveinitiatives include components of the seven elements listed below. (The summary tables areorganized by the following element headings andare found in the Appendices.)
• Leadership and Career DevelopmentAAA—American Automobile AssociationAT&TBarnett BankConnecticut MutualContinental InsuranceCorning Glass Works, Inc.Fannie MaeGannett Co., Inc.Hewlett-Packard Co.JC Penney Co., Inc.Massachusetts Mutual Life Insurance CompanyMorrison & FoersterNew England Telephone - NYNEX
Pacific Gas and ElectricSC Johnson WaxTom’s of MaineUniversity of North Carolina at GreensboroUS WEST
• Rotation/Nontraditional EmploymentAmerican AirlinesAvon Products, Inc.Chubb & Son, Inc.Con EdisonE.I. du Pont de Nemours & Company
• MentoringAT&TChubb & Son, Inc.CIGNADow Jones & CompanyE.I. du Pont de Nemours & CompanyExxon Research & Engineering Co.First Interstate Bank of CaliforniaJC Penney Co., Inc.New England Telephone - NYNEXPitney-Bowes, Inc.Procter & Gamble
• Accountability ProgramsBaxter Healthcare CorporationCorning Glass Works, Inc.Square D Co.
54
PART III: 100 CORPORATE PRACTICES

Tenneco, Inc.• Succession Planning
American AirlinesHershey FoodsMcCormack & DodgeMotorola, Inc.Public Service Electric & Gas Company
• Workforce Diversity InitiativesAvon Products, Inc.General Electric NY Silicone Manufacturing Division
General FoodsMcDonald’sPDQ Personnel ServicesProcter & GambleRenssalaer Polytechnic InstituteUS West
—(a) Programs for Women of ColorUS WESTXerox
—(b) Corporate Women’s Groups/Networks
Avon Products Inc.Case Western Reserve UniversityHoffmann-La RocheHoneywell, Inc.
—(c) Gender/Racial Awareness Training
Arthur Andersen & Co.E.I. du Pont de Nemours & CompanyJC Penney Co., Inc.Hughes Aircraft
3MMCA, Inc.North Broward Hospital DistrictPitney-Bowes, Inc.Port Authority of NY & NJRaychem CorporationRyder Systems, Inc.Tenneco, Inc.Texas Instruments
—(d) Elimination of Sexual Harassment
Apple ComputerAT&TE.I. du Pont de Nemours & Company
• Family-Friendly ProgramsEastman Kodak CompanyFel-Pro, Inc.John Hancock Financial ServicesJohnson & JohnsonMarquette ElectronicsNationsBankSC Johnson WaxPacific Gas and ElectricJC Penney Co., Inc.Tandem Computer, Inc. US Sprint
—(a) Flexible Work ArrangementsArthur Andersen & Co.Corning Glass Works, Inc.Eastman Kodak Company North Carolina National Bank Pacific Bell 55

The San Francisco Bar AssociationSidley & AustinSkadden, Arps, Slate,
Meagher & Flom Steelcase, Inc.Tucson Medical Center
—(b) Parental LeaveAetna Life & CasualtyCorning Glass Works, Inc. IBMProskauer, Rose, Goetz & Mendelsohn
—(c) Dependent Care
Allstate Insurance CompanyAmerican Express CompanyAmoco CorporationChampion International CorporationIBM CorporationJohnson & JohnsonJ.P. Morgan, Inc.Motorola, Inc.Philip MorrisStride Rite CorporationThe TravelersWork/Family DirectionsXerox Corporation
56
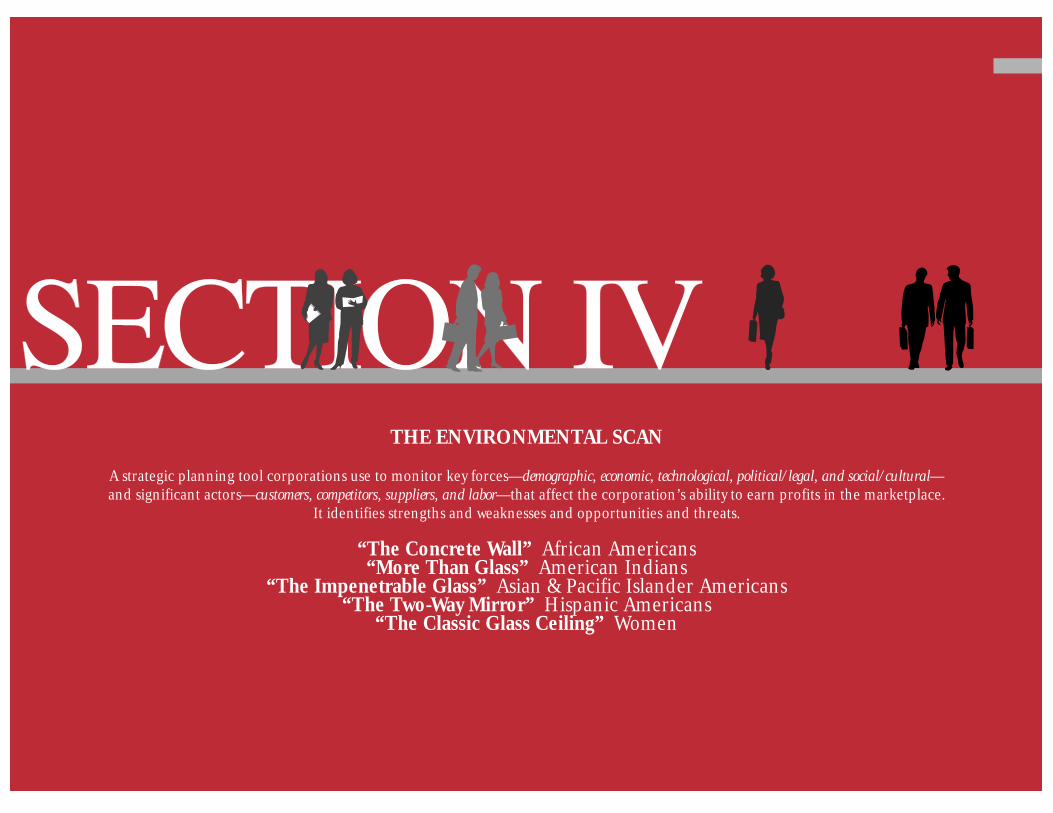
THE ENVIRONMENTAL SCAN
A strategic planning tool corporations use to monitor key forces—demographic, economic, technological, political/legal, and social/cultural—and significant actors—customers, competitors, suppliers, and labor—that affect the corporation’s ability to earn profits in the marketplace.
It identifies strengths and weaknesses and opportunities and threats.
“The Concrete Wall” African Americans“More Than Glass” American Indians
“The Impenetrable Glass” Asian & Pacific Islander Americans“The Two-Way Mirror” Hispanic Americans
“The Classic Glass Ceiling” Women

Corporate leaders, individuals preparing for corporate advancement, researchers, and govern-ment officials agree that a glass ceiling exists, andthat it operates to exclude minorities and womenfrom top levels of management. In that respect, itis a glass ceiling with very few openings except forwhite non-Hispanic males.
Although all affected groups experience the glassceiling as a serious limitation, the issues are notthe same for white women and women of color.They are not the same for women and minoritymen, and they are not the same for men of differ-ent racial and ethnic backgrounds. Therefore,The Environmental Scan is divided into separate sections for African Americans, American Indians,Asian and Pacific Islander Americans, HispanicAmericans, and women.
Each section examines the perceptions of groupmembers regarding the glass ceiling, the CEO perceptions of the group vis-à-vis the glass ceiling,and the popular stereotypes applied to the group.The pictures that the perceptions and stereotypespaint are then compared to the pictures thatemerge from analyses of available basic laborforce, education, placement, opportunity,advancement, and compensation information.
(It is important to note that consistent data cannot always be provided across the groups,either because it has not been collected orbecause the datasets that contain it are not largeenough to support disaggregation.)
Before focusing on the individual groups it ishelpful to look at the overarching perceptions,insights, and realities that make up the big pictureof how minorities and women are faring in theprivate sector.
CEO PERCEPTIONS OF THE GLASS CEILING
“Business is changing the way it does business because the climate—the whole environment—has changed.”
“Glass ceilings are bad business.”
Under its mandate to do original research, theCommission contracted with researchers to conduct in-depth interviews with CEOs of variouskinds of corporations throughout the country inorder to secure up-to-date CEO views about theglass ceiling.58
Although all groups experience the
glass ceiling as a serious limitation,
the issues are not the same for white
women and women of color. They are
not the same for women and minority
men, and they are not the same for
men of different racial and ethnic
backgrounds.
THE ENVIRONMENTAL SCAN

Corporate leaders interviewed in the FederalGlass Ceiling Commission survey perceived changein the business environment to be the factor thatis driving business to address glass ceiling issues.CEOs repeatedly stated that they are changing theway they do business because of recent dramaticshifts in three areas that are fundamental to business survival:
• Changes in the demographics of the labor force
• Changes in the demographics of the national consumer markets
• The rapid globalization of the marketplace
Corporate leaders recognize that, in order to compete successfully in the changing national andinternational business environments, businessesmust internalize those changes. Business leadersmaintain that:
• glass ceilings exclude top quality people of diverse backgrounds that businesses need in order to compete successfully, and
• top quality people, regardless of gender, race, or ethnicity, are essential to the health and profitability of business.
The following five themes emerged from corporate leaders’ perceptions of the nature ofthe glass ceiling and its impact on business:
• A majority of the CEOs interviewed per-ceive the glass ceiling as something that did affect women but no
longer does. Although they agree that parity between men and women has not yet been achieved—either in terms of decisionmaking jobs or in compensation—they believe that women have proven themselves to Corporate America over the past two decades and therefore are about to break through the glass ceiling in increasing numbers.
• The CEOs interviewed have not internalized the broadened definition of the glass ceiling and are less likely to think of a glass ceiling as something that applies to minority males. Rather they attribute the scarcity of minority males at the top—who they first think of as African Americans—to a lack of qualified candidates, asserting that demand is high but supply is limited. Most described themselves as desperately seeking minority males for jobs at all levels, from top executives down to management trainees.
• CEOs recognize that negative attitudes of some white males reflected in stereotypes, prejudice, and bias can and does hinder the advancement of minorities and women.Most acknowledge that resistance to minorities and women can be severe, especially “at the beginning,” and they understand that stereotypes conjure up the preconceptions, misconceptions, prejudice, and bias that influence 59
An overwhelming majority of the
CEOs interviewed perceive the glass
ceiling as something that did affect
women but no longer does.

corporate behavior in ways that can only solidify the glass ceiling. However, CEOs report that the high performance of minorities and women is slowly changing those negative attitudes, negating the argu-ment that “diversity hires” equal under-performance.
• All CEOs interviewed strongly affirm the principle of merit. They declared—perhaps in reaction to the negative connotation of “diversity hires”—that all recruits and employees should meet the same standards of preparedness, excellence, and performance, regardless of gender, race, or ethnicity.
• CEOs called attention to the fact that it is easier to institute change in good times than bad times. When a business is growing the inclusion of minorities and women is perceived as less of a problem because there is room for everybody. Conversely, when a business is not growing, or is downsizing, white males perceive inclusion of any new category of players as discrimi-nation against white men that threatens their security. In times of downsizing and takeovers, “white male anxiety,” as described by Secretary Reich, “runs high just as it does for all other employees regardless of gender, race, or ethnicity.”
HOW THE PERCEPTIONS OFMINORITIES AND WOMEN AND FACTUAL EVIDENCE RELATE TO WHAT THE CEOs PERCEIVE
Federal Glass Ceiling Commission research con-ducted by Catalyst and others, and independentstudies conducted by Korn/Ferry Internationaland Heidrick & Struggles support the CEOs’ per-ception that minorities and women have madesome inroads into executive, administrative, andmanagerial positions in the past 20 years.
However, white non-Hispanic males continue tohold an overwhelming majority of all manage-ment positions in the private sector—95 to 97 percent—and the advancement of others variessignificantly by gender, race, and ethnicity as evidenced in the Group scans that follow.Furthermore, the optimistic perceptions of theCEOs are not always shared by minorities andwomen inside corporations. They assert that theadvancement of white and non white women andminority men is blocked, and that minorities andwomen are still severely underrepresented at thesenior levels of Corporate America. Available datathat is cited in the following scans support thisperception.
A representative of Korn/Ferry International, an executive recruitment firm, testified at the Los Angeles Public Hearing of the Federal Glass60

CeilingCommission. The Korn/Ferry surveys ofsenior managers in Fortune 1000 industrial andFortune 500 service industries that were conduct-ed in collaboration with the John E. AndersonGraduate School of Management of the Universityof California, Los Angeles, show steady progress for most groups within the male and female cate-gories. At the same time, they dramatically illus-trate that the gap between men and women andwhites and others is still enormous.
Racial/Ethnic Origin of Respondents in Korn/Ferry International 1982 and 1992Surveys of Senior Level Females
1982 1992Caucasian 97.3 95.0African American 1.0 2.3Asian 0.4 1.8Hispanic 1.3 0.2Other 0.0 0.5No Response 0.0 0.2
Total 100.0% 100.0%
Racial/Ethnic Origin of Respondents in Korn/Ferry International 1979 and 1989Surveys of Senior Level Males
1979 1989Caucasian 99.1 96.9African American 0.2 0.6Asian 0.1 0.3Hispanic 0.1 0.4Other 0.1 0.0No Response 0.4 1.8
Total 100.0% 100.0%
As noted before, research also supports the asser-tion of those CEOs who say that inclusion acrossthe board has been good for business. For exam-ple, the J.L. Kellogg Graduate School ofManagement at Northwestern University, reportedon a 1993 study conducted by the CovenantInvestment Management firm that rated the per-formance of the Standard and Poor’s 500 on thehiring and advancement of minority men andwomen, and on compliance with EqualEmployment Opportunity Commission and otherregulatory requirements. That study then com-pared these ratings to the annualized return oninvestment on the stock of these companies overthe most recent five-year period. It found that thestock market performance of the firms that hadgood glass ceiling records was approximately 2.4times higher than that of the firms that had poorglass ceiling records. 61
In another study compiled by four business schoolprofessors examining the “impact that public ser-vice announcements of government awards forexemplary affirmative action programs have stockreturn behavior of winning firms.” Twenty-eightcompanies were chosen and provided definitiveresults supporting diversity management’s positiveimpact on corporate profitability. The averagereturn on the day of the announcement of win-ning the award was 0.459% and a more substantialraise of 0.581% was recorded for the day followingthe announcement, for a two-day total of nearly1.0%.
Research also supports the perception of corporate leaders that it is good business to findand keep good employees. CEOs are aware ofwhat it costs to develop managers and what it costs to lose them if they leave because theybelieve their advancement is limited. A promisingmodel being developed by Professors Ann Barteland Anna Duran of Columbia School of Business(described at the Glass Ceiling Public Hearing in New York City) is beginning to reveal a similar pattern of recruitment, replacement, and unrealized potential costs associated withmaintaining a glass ceiling. It is becoming increasingly clear that there is an economicimperative to retain employees to leverage corporate investment in recruitment and careerdevelopment.
Commission research (Woo, Hispanic PolicyDevelopment Project, Bell and Nkomo, MauricioGastón Institute, James et al., Wernick, Woody andWeiss, focus groups and the CEO Survey) as well a review of recent literature on management-diversity, support the CEOs’ perceptions that negative attitudes of some white males can and dohinder the advancement of minorities andwomen.Americans in general are threatened by recentstructural changes in the economy and the natureof work. White men in particular feel threatenedby the demographic shifts that are altering theethnic and gender mix on the factory floor and inthe conference and board rooms. Not only dopeople have to change how they work, they arealso being simultaneously required to change withwhom they work. This is a serious issue and it hasspawned a specialized training industry to helpbusiness help their employees adapt to diversity.The case studies in this report indicate that com-panies that undertake sensitive and fair strategiesfor change can level the playing field for minori-ties and women. With time and training they canovercome the very real and understandable anxiety of all employees.
Although the CEOs’ perception that it is easierto press for inclusion in times of growth than intimes of retrenchment is undoubtedly true,Commission research shows that minorities andwomen at the senior- levels did not lose groundover the last four- or five-year period of restructur-62
Commission research shows that
minorities and women at the senior-
levels did not lose ground over the last
four- or five-year period of restructur-
ing and retrenchment.

ing and retrenchment, partly at least becausethose who had the most to gain through earlyretirement packages were eligible white males whohad been in companies the longest. Federal GlassCeiling Commission research and testimony fromthe public hearings indicate that, at senior levels,many older white managers moved out, creatingopportunity for minority men and women.
The Environmental Scans that follow provide factsand findings—as required by the legislation—onthe corporate status of minorities and women inrelation to preparedness, opportunities, and thepractices that relate to the access to decisionmaking positions. In the interest of neutrality theScans of the affected groups are presented inalphabetical order. The order does not imply thatany one group is more important than another.
(Although Disabled Americans and olderAmericans were not included in the Commission’smandate, the Commissioners recognize that both
groups face barriers to their advancement to decisionmaking positions in management.)
63
Gross Domestic Product by Industry (Industries as a % of GDP)
Source: U.S. Department of Labor, Bureau of Economic Analysis-1992
Industries included in this report represent 93% of Gross Domestic Product. The remaining 7% is concentrated in the Agriculture and Mining Industries.
0% 5%
Manufacturing 17.7%
8.8%Transportation & Public Utilities
Wholesale Trade
Retail Trade
Business Services
Finance, Insurance & Real Estate
Public Administration
9.3%
6.6%
18.4%
19.6%
12.6%
10% 15% 20% 25%
Percent of GDP

GENERAL BACKGROUND
“There are far more Black persons who grew up inviable, stable, upward-striving Black families thanotherwise.”
Andrew Billingsley, Ph.D.Climbing Jacob’s Ladder:The Enduring Legacy of African American Families
According to the 1990 U.S. Census, 12.1 percentof United States citizens are African Americans.The African American population is, like HispanicAmericans and Asian and Pacific IslanderAmericans and American Indians and EuropeanAmericans, a group which is diverse within itself.Just as European Americans are not all “typicalwhites,” so African Americans are not all alike.The African American population includes U.S.-born persons whose families have been here formore than 300 years, persons of Caribbeandescent, and recent immigrants from Africa. TheAfrican American population has a complexityand diversity that is sometimes ignored or over-shadowed by popular negative perceptions of amonolithic underclass.
African Americans have demonstrated a strongtradition of self-help throughout AmericanHistory. They also have a long history of valuingeducation and encouraging their children to getdiplomas and degrees. And they have a solid histo-ry as entrepreneurs and professionals. A Blackbusiness class has grown and flourished outsidethe corporate culture. The glass ceiling question iswhether Black Americans are prepared to growand flourish within the mainstream corporate culture.
The information in this environmental scan isdrawn from several sources: extensive public hearings, CEO interviews and African Americanmale executive focus groups, as well as from unpub-lished research on African American women thatwas made available to the Glass CeilingCommission. These sources highlight the differentviews of African American preparedness and oppor-tunity for upward mobility in Corporate America.Research papers presented to the Glass CeilingCommission identified stereotypes of AfricanAmericans. The quantitative data comes fromCommission-sponsored research, private research,and analysis of U.S. Census data. The term AfricanAmerican and Black is used interchangeably.64
“THE CONCRETE WALL” AFRICAN AMERICANS

THE PERCEPTIONS
How CEOs Perceive African Americans and the Glass CeilingCEOs of businesses that are managed and/orowned by whites and minorities were interviewedas part of the Federal Glass Ceiling Commissionresearch. They were asked about their perceptionsand experiences in recruiting, developing, and promoting individuals from the target groups.The responses applicable to African Americansand the glass ceiling are summarized here.
The Glass Ceiling ItselfThe overwhelming majority of these CEOs inter-viewed continue to think of the “glass ceiling” interms of women; however, when reminded that italso affects minority males, virtually all interpreted“minority males” to mean African American men.
With two exceptions, the CEOs who were surveyedsaid they need and want African American menthroughout the ranks of their organizations,because diversity is good for business. They perceive demand for African American men ashigh and supply as small.
“Given the national demography, and the factthat much of our domestic business is with cityand state governments, walking in with an all-white male team is a tie breaker negative.”
“If I go to Washington, I need Black representa-tives to interact with the people who can give mecontracts.”
PreparednessThe CEOs who were interviewed shared a percep-tion that there is a shortage of high potential, college-educated Black men. Statements that illustrate this perception include:
“There are more women and more minoritywomen who end up at the top of their classesthan there are minority men in that category. I don’t know why that is; I think it has to dowith the modern culture that puts pressure onyoung minority males. What I do know is that I hire on merit because I have to compete to stayin business. I have to cream [recruit from the top decile] and there aren’t that manyminority guys who can cut it.”
“The push for minority males came later thanfor women, so there are fewer at the upper middle levels in the company or the industry.Within the company they are not a part of theage/experience cohort that is eligible for topmanagement, and the same is pretty much truethroughout the industry—we are all looking tosteal top quality candidates from each other, butthey weren’t let in early enough—now we are alldesperately watching the pipeline.”
65
The CEOs who were interviewed
shared a perception that there is a
shortage of high-potential,
college-educated Black men.

Opportunities With two exceptions, the CEOs interviewed saidthat they are eager to increase African Americanmale representation in their businesses. They saidthat they recruit actively; they also said the num-ber of qualified, credentialed African Americanmen is small and competition for the best and thebrightest is intense. They made it clear that theyare always on the lookout for top quality Blackmales and know that their competition is doingthe same. They perceive well-educated and experienced African American men as havingunlimited opportunities in Corporate America.
“It is a highly competitive market for minoritymales, even at the beginning professional levels.We recruit from the top five to ten percent of a graduating class and the top minority candidates have been recruited by the big firms,with scholarships and internships, since theirfreshmen years—we aren’t big enough or richenough yet to compete with that approach.”
“I tried for three years to recruit at [deleted]and couldn’t get the time of day until I finallygot a Black vice president who was an alum-nus. But it’s still a problem. In our business ifwe are going to compete we have to get the verybest. Well, the big guys go in and pick off thebest because they can identify them in the fresh-man year—they give them scholarships and internships and lock them in. We can’t affordthat yet so we don’t have a chance.”
Most of the CEOs perceived themselves as sensitive to issues of equity. Almost all expandedupon their self-perceptions by emphasizing theimportance of adhering to corporate standardsand considering merit when promoting minoritymales. One such comment was—
“Watering down standards does nobody anygood. It hurts that business and it hurts thegroup, because it increases the resistance to thenext person from that group.”
Other IssuesCEOs are worried about their failure to retainAfrican American men in the positions that normally lead to top management positions. Theattrition rate at the executive-trainee and middle-management levels is high. CEOs say that some-times middle-level African Americans leave toaccept better offers, but in other cases the reason or reasons they choose to leave remainsmysterious to the CEOs.
“On the entry and journeyman levels, we havegood Black representation, but we are low on the upper levels. We had one Black male VicePresident , a lawyer and an MBA, who left usto be Secretary for Economic Development for thestate—a golden opportunity for him, a loss forus. Another Black male, a retired three-star general, was about to come on, but took anothervery prestigious job at the last minute—our loss. The competition is brutal.”
66

“We recruit only from the top schools, and wehire only from the top 10 percent from thoseschools, for men and women, Black and white.But something happens to the Black men whenthey go through our training program—theyconsistently come out in the bottom quarter ofour classes. Something is going on and we don’tknow what it is. We are working with consul-tants, we are doing exit interviews, we are try-ing to find out what is wrong so we can fix it.Do they feel lost in a sea of white faces? Are theystressed in an uncomfortable environment? Do they feel that they are not expected to succeedand freeze up?”
How African American WomenPerceive the Glass Ceiling
“If she is rescued from the myth of the Negro, themyth of the woman entraps her. If she escapesthe myth of the woman, the myth of the Negrostill ensnares her.”
Deborah Gray WhiteA ren’t I a Woman?Female Slaves in the Plantation South
This section describing the feelings of AfricanAmerican women is drawn from an unpublishedmanuscript and work in progress made availableto the Federal Glass Ceiling Commission by itsauthors, Dr. Ella Louise Bell and Dr. Stella M.Nkomo. Their findings are reported here for the
first time with special permission of theresearchers. Their study based on a survey of 238African American women managers and 477 whitewomen managers is one component of a largeron-going investigation, Life Journeys of Women inCorporations.
Bell and Nkomo found that the African Americanwomen in their sample tend to feel they are laboring under the double burden of racism andsexism. Their findings also showed significant differences in the career perceptions of AfricanAmerican and white women. For example,
• Compared to the white women, African American women felt that they received less organizational support.
• African American women did not perceive their work to be as significant as did the white female respondents.
• African American women felt that they were in positions where they had less control and authority than did their peers who were white women and they believed that their jobs were less likely to allow them to use their skills and knowledge.
• African American women’s perceptions of their relationships with their bosses were less positive than those of the white women.
• Compared to the white female respondents, African American women were more conscious of their racial identity at work, felt less accepted by their 67
African American women did not per-
ceive their work to be as signif icant as
did the white female respondents.

colleagues at work, perceived less collegial support, and perceived a higher level of sex discrimination at work.
(In an earlier 1990 study, Dr. Bell found that many African American women in professionaljobs felt pressured by bicultural stress, the result of the contradictory pull between their own cultural identity and the pressure to conform to a corporate identity that is both masculine and white. Those who conform in order to beaccepted may simultaneously feel that they havebetrayed their own cultural identity.)
• African American women were less positive than white women about how their companies managed race and gender relations and their employers’ commitment to the advancement of women, Hispanics, and people of color.
• African American women and white women were equally satisfied with their career progress, although African American women were less satisfied than white women with their salaries.
In order to explain some of the distinguishing differences in the organizational experiences ofwhite and African American women managers,Bell and Nkomo changed the metaphor fromglass ceiling to concrete wall.
Bell and Nkomo explain that white women feelthat they are held down by a glass ceiling. Glass isdangerous and it can injure those who break it,but it can be broken. Furthermore, glass is clear—those below a glass ceiling can see through it andlearn by observation. They can see those aboveand they, in turn, are visible to those who areabove the glass ceiling. Visibility, sometimesknown as “face time,” is a critical factor in break-ing through the glass ceiling.
African American women, on the other hand, feel that they face a concrete wall. It is almostimpossible for one person alone to poke a hole in a concrete wall. Furthermore, those closed inbehind the wall cannot learn about the organiza-tion because they are isolated from the main-stream of organizational life and, worse, they areinvisible to the decisionmakers on the other side.
The research findings are borne out by the state-ment of an African American woman who testifiedat the Federal Glass Ceiling Commission PublicHearing in New York City. She declared,
“Yes, there is a ceiling. That’s not news in our community. Indeed, for African Americans,everyone who comments on it seems to call it theconcrete ceiling or the concrete wall. But forthose of us at the [deleted] we say that both ofthese terms really are descriptions of good, old-fashioned racial discrimination in recruitment,68

job placement, promotions, performance evalua-tions, compensation, and other terms and conditions of employment.”
She went on to explain,
“For Black women, it is even worse. They areonly three percent of all women managers, andwomen managers are estimated to be less thantwo to three percent. So we have a non-existence.We don’t even have a wall—no ceiling, no glassto look through. There is nothing.”
The metaphor of an impenetrable wall was alsoused by African American male executives in thefocus groups.
How African American Men Perceive the Glass Ceiling
“It’s not a glass ceiling, it’s a brick wall.”
The information presented in this section isdrawn from the comments made by AfricanAmerican male executives who participated infocus groups sponsored by the Federal GlassCeiling Commission to comply with theCongressional mandate to conduct originalresearch on issues pertaining to the glass ceiling.
The “Minority” LabelThe African American men resented being
labeled as “a minority.” They perceived it as a labelused to imply inferiority.
“‘Minority’ means ‘lower’ or ‘less,’ and I don’tsee myself any lower or less than anybody else.”
“They are forcing that word, minority, upon us;to keep beating it in our heads to remind us thatwe are less than. We have to act accordingly.I’ve never subscribed to that point of view.”
“I don’t think it was by mistake that the word‘minority’ was thrown out when we as Blackpeople sought to have equal opportunity.”
The Glass Ceiling ItselfAfrican American participants perceive this bar-rier as virtually impenetrable for most Black men.They view it not as a glass ceiling but as a brickwall. They believe that corporate America consid-ers them “a necessary evil” because of the changingdemographics of the marketplace, national andglobal. Despair and resentment were voicedtoward the permanence of the glass ceiling—the respondents believe the barriers to theirupward job mobility will not be removed in theirlifetimes. They believe their talent, education andexperience are not valued in corporate America.At the same time, they feel they have no choicebut to continue to fight against what they considerunfair and outright racist patterns in corporateadvancement. 69

“I’ve seen it. Not so much in a personal sense . . .but I’ve seen the figures. . . . I worked in payroll . . . only one Black out of 100 staffmembers would be making between $50,000and $75,000. If the salary goes over $100,000the numbers become zero for minorities. Whenyou get to the executive levels there are 35 people, most making close to a half a milliondollars a year . . . and not one Black person out of 35.”
“I’m experiencing that right now. They bring ina new CFO [Chief Financial Officer] . . . .even though I’ve been running things. They payhim twice as much as me and I’ve been there 10years. I see the salary differences between Blacksand whites. Every single white secretary, eventhe floater, makes $8,000 more than the oneminority secretary.”
“It’s a cement wall. You’re not getting past thispoint, my friend. When they bring in a minori-ty, the best day on the job for some people wastheir first day on the job. I can name about fivecompanies that come to mind. They hired you,they have a three year in and out policy . . . It’sa consistent pattern . . . Your chances of becoming a mover and shaker here, I’d soonersee a pig fly. It’s not going to happen.”
“As a Black man in Corporate America, you’rejust a low number. You’re non-existent. You’re
an endangered species. They know it. They willhire Black women before they hire one Blackman, and they know why they do it.”
Glass Ceiling Impact on Jobs and CareersBlack male executives who participated in theFederal Glass Ceiling Commission AfricanAmerican focus groups agreed that education is aprime prerequisite for getting through the glassceiling, although some felt that without an IvyLeague education it was difficult for anyone to getthrough. They also agreed that although experi-ence and education count for something inCorporate America, the glass ceiling is aboutsomething other than those qualifications. Theysee the acceptance and rise of other minoritiesand women as a discriminatory tactic designed tokeep Black men from advancing to the top ranksof Corporate America. They spoke of their feel-ings of always being judged as African Americans,rather than as individual men.
“The perception is that you get less quality education from a minority school. It’s that one little issue that makes it either positive ornegative on whether you get into the pipeline.Just the name of the school.”
“Once you get in the door, after you’ve made it inside the door, you have to be four, five, sixtimes better than the average person, the averagenon-Black, the average Caucasian, in order for you to get to where you should be.”
70
“As a Black man in Corporate
America, you’re just a low number.
You’re non-existent.

What are the StereotypesAbout African Americans?
“Sticks and stones may break my bones, But names will never hurt me.”
Children’s Rhyme
Research consistently identifies stereotypes, along with prejudice and bias, as a barrier to jobadvancement. The “names” all too often becometruth in the minds of those who are making decisions about corporate advancement, and as a consequence, become barriers for individualAfrican Americans, regardless of individual preparedness.
At the same time, it must be emphasized that onlytwo of the CEOs who were interviewed in a Commissionsurvey expressed any reservations about the suitability of African Americans for middle- or top-level corporatepositions. All others stated that they need and wantAfrican Americans throughout the ranks of theirorganizations but are having difficulty finding andretaining credentialed African American men.CEOs agreed that there aren’t enough “top-qualityminority males” who are “ready” for top-level jobsand expressed reservations about advancingminority males “too soon” or “before they are ready.”It is not clear how much of the difficulty, if any,relates to possible unrecognized organizationalbiases that grow out of stereotypes about African Americans. The research identifies the following
stereotypes about African Americans:
African American men are stereotypically perceived as lazy/ undisciplined/ always late/ fail topay their taxes/ unqualified but protected by affirmativeaction/ violent/ confrontational/ emotional/ hostile/aggressive/ unpredictable/ unable to handle stressful situations/ threatening/ demanding/ militant/ loud/and less intelligent than other racial or ethnic groups.
African American women are stereotypically perceived as incompetent/ educationally deficient/aggressive/ militant/ hostile/ lazy/ sly/ and untrustworthy.
Stereotypes must be addressed because they imply factual bases for glass ceiling barriers. Forexample, epithets such as lazy and educationallydeficient and unqualified but protected by affirmativeaction can be refuted by data on labor force participation and educational attainment. Stillothers—for example, confrontational or aggressiveor demanding or militant—may result from thereactions of many African American men andwomen to their perceptions that they have beendiscriminated against in the workplace. Many are frustrated, angry, and in despair; they haveprepared themselves for advancement and theyhave been excluded from opportunities foradvancement. Experience has taught them to be on guard, a reaction that they perceive as sensible and others perceive as threatening. 71

THE REALITY CHECK:Perceptions and Stereotypes-Versus the Facts
The Basic Facts• In 1990, the U.S. Bureau of the Census reported that African Americans comprised 12.1 percent
(30,000,000) of the total population.• The majority of African American men work for a living. In fact, the total African American male
labor force participation rate (63.1 percent) increased by 5.5 percent between 1980 and 1990 compared to an overall 4.2 percent increase for whites.
— In 1990, 68.8 percent of African American men, ages 20 to 24, were in the labor force, as compared to 77.9 percent of their white male peers.
— In the same year, 83.0 percent of African American men, ages 35 to 44, were in the labor force, as compared to 85.9 percent of their white male peers. (Bureau of Labor Statistics 1991).
• The majority of African American women work for a living. In fact, the total Black female labor force participation increased by 11.9 percent between 1980 and 1990, compared to an overall 12.0 percent increase for their white female peers.
— In 1990, 63.2 percent of African American women, ages 20 to 24, were in the labor force, as compared to 71.7 percent of their white female peers.
— In the same year, the percentage of African American women, ages 35 to 44, in the labor force was higher (79.0 percent) than that of their white female peers (76.6 percent.) (Bureau of Labor Statistics 1991).
• By the same token, in 1990 14 percent of Black families had annual incomes $50,000 and over; 29 percent had annual incomes $25,000 -$49,999; 31 percent had annual incomes of $l0,000-$24,999.(Bureau of the Census 1990).
• African Americans have a successful business tradition and experience as managers and entrepreneurs. Between 1982 and 1987, the number of Black owned firms increased by 37.6percent, from 308,260 to 424,165. The number of employees of these firms increased by 81 percent, from 121,373 to 219,685. Their annual payrolls increased by 191.3 percent from $948,l08,000 to $2,76l,105,000.(U.S. Bureau of the Census 1982, 1987).
• In 1990, the top 100 African American Industrial/Services Companies employed 33,300 persons and had total sales of $4.3 billion. (Billingsley 1992).
• The U.S. Department of Labor, Survey of Consumer Expenditures data shows that in 1993 African Americans represented a $257 billion consumer market.
72

The Participation of African Americans in Corporate America
Preparedness:—Are African Americans Prepared to Participate in Business?
African Americans have always placed high valueon education, believing in its power to overcomebarriers. Census data show that the number ofAfrican Americans enrolled in college rose dramatically from 141,000 in 1960, through thatdecade when many more opportunities in education opened up to them, to a peak of785,000 in 1988. Andrew Billingsley reports thatby 1981 business and management was the mostpopular discipline for all Black bachelor’s degreerecipients, with 13,325 Blacks earning degrees inbusiness and management in that year alone.Surely they, and their counterparts who graduatedin other years, have developed their managerialand leadership skills since then. It is evident thatthere is a pool of African American college gradu-ates and it has increased in the last decade. That isencouraging.
What is discouraging is the finding that equal educational attainment does not guarantee thatBlack men and women are getting through theglass ceiling or that they are fairly compensated.These findings are supported by Census data,Federal Glass Ceiling Commission research andprivate studies.
• According to the 12th Annual Status Report of the American Council on Education, entitled Minorities in Higher Education, the absolute number of college-educated Black men and women of all ages is increasing.
—Between 1982 and 1991, the proportion of the African American population, ages 20 to 44, with four or more years of college increased by 36.2 percent. —In the same period, the proportion of African Americans 35 to 44 years of age completing college increased by 52 percent.
• At the same time, African American men and women are half as likely as white men and women to be college graduates according to the 12th Annual Status Report of the American Council on Education, entitled Minorities in Higher Education.
—In 1989, Black men earned 4.6 percent (22,363) of the bachelor’s degrees awarded to men that year, compared to 84.5 percent (407,142) earned by white men.—In 1989, Black women earned 6.7 percent (35,702) of the bachelor’s degrees awarded to women that year, compared to 84.7 percent (452,557) earned by white women.
73
Equal educational attainment does
not guarantee that Black men and
women are getting through the glass
ceiling or that they are fairly
compensated.

• The American Council on Education 12th Annual Status Report, shows a similar pattern at the master’s degree level.
—In 1989, 3.5 percent (5,200) of all master’s level degrees awarded to men went to Black men and 73.5 percent (109,184) went to white men.—Also in 1989, 5.5 percent (8,876) of all master’s level degrees awarded to women went to Black women and 82.6 percent (132,423) went to white women.
• Furthermore, the report shows that as college costs increase, the gap between African American and white 20 to 29 year-olds who complete college also increases. Between 1982 and 1991, the proportion of African Americans 20 to 29 years of age completing four or more years of college decreased by 6 percent, while the proportion of their white cohorts completing college increased by 13 percent.
• Black men and women with college degrees are more likely to be in executive, managerial, and administrative positions than are Black men and women without degrees. That is not surprising. What is surprising is that the pattern for white women indicates a nearly equal proportion of white women with only high school educations in the same top positions as are Black men and women with college degrees. This suggests that equal
educational attainment does not level the playing field for Black men and women.
• Black women are underrepresented in private sector administrative, executive and managerial positions for each educational level. Black and white women continue to be underrepresented in these positions despite their college degrees. White men are overrepresented in top positions regardless of education level. Table 1presents the data.
• Table 2 demonstrates that white men have 68 percent more of the executive, administrative, and managerial positions than should be expected at this educational level-—all things being equal. This table illustrated that white men are over-represented in top positions regardless to educational levels. Black women are the most underrepresented group in executive, administrative, and managerial occupations for each educational level, when compared to Black men and white non-Hispanic men and women.
74
African Americans of both genders are
less than half as likely to be represent-
ed in top positions in most industries
as would be expected from their
proportion in the total population.
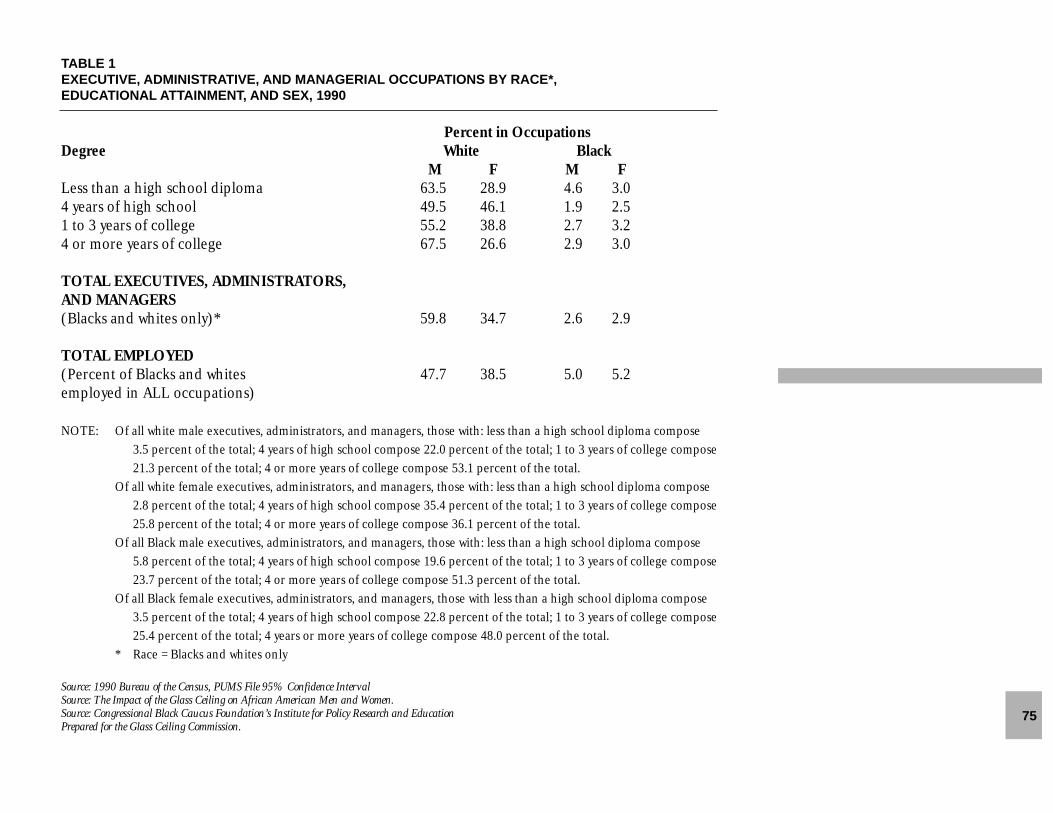
TABLE 1EXECUTIVE, ADMINISTRATIVE, AND MANAGERIAL OCCUPATIONS BY RACE*, EDUCATIONAL ATTAINMENT, AND SEX, 1990
Percent in OccupationsDegree White Black
M F M FLess than a high school diploma 63.5 28.9 4.6 3.04 years of high school 49.5 46.1 1.9 2.51 to 3 years of college 55.2 38.8 2.7 3.24 or more years of college 67.5 26.6 2.9 3.0
TOTAL EXECUTIVES, ADMINISTRATORS, AND MANAGERS(Blacks and whites only)* 59.8 34.7 2.6 2.9
TOTAL EMPLOYED(Percent of Blacks and whites 47.7 38.5 5.0 5.2employed in ALL occupations)
NOTE: Of all white male executives, administrators, and managers, those with: less than a high school diploma compose 3.5 percent of the total; 4 years of high school compose 22.0 percent of the total; 1 to 3 years of college compose 21.3 percent of the total; 4 or more years of college compose 53.1 percent of the total.
Of all white female executives, administrators, and managers, those with: less than a high school diploma compose 2.8 percent of the total; 4 years of high school compose 35.4 percent of the total; 1 to 3 years of college compose 25.8 percent of the total; 4 or more years of college compose 36.1 percent of the total.
Of all Black male executives, administrators, and managers, those with: less than a high school diploma compose 5.8 percent of the total; 4 years of high school compose 19.6 percent of the total; 1 to 3 years of college compose 23.7 percent of the total; 4 or more years of college compose 51.3 percent of the total.
Of all Black female executives, administrators, and managers, those with less than a high school diploma compose 3.5 percent of the total; 4 years of high school compose 22.8 percent of the total; 1 to 3 years of college compose 25.4 percent of the total; 4 years or more years of college compose 48.0 percent of the total.
* Race = Blacks and whites only
Source: 1990 Bureau of the Census, PUMS File 95% Confidence IntervalSource: The Impact of the Glass Ceiling on African American Men and Women.Source: Congressional Black Caucus Foundation’s Institute for Policy Research and EducationPrepared for the Glass Ceiling Commission.
75

TABLE 2PERCENT OF EDUCATIONAL LEVEL OF RACIAL GROUPS COMPARED TO PERCENT OF RACIALGROUPS IN EXECUTIVE, ADMINISTRATIVE, AND MANAGERIAL OCCUPATIONS, 1990
Degree White BlackM F M F
Less than high school diploma 37.7 42.0 7.5 8.8
4 years of high school 38.4 47.6 5.1 6.1
1 to 3 years of college 41.0 53.2 4.4 6.0
4 or more years of college 48.3 39.9 2.7 3.4
Ratios: % in Top Positions/% in Educ. Category
Less than high school diploma 1.68 0.68 0.61 0.34
4 years of high school 1.30 0.97 0.37 0.41
1 to 3 years of college 1.35 0.73 0.61 0.53
4 or more years of college 1.40 0.67 1.07 0.88
Source: 1990 Bureau of the Census, PUMS File 95% Confidence IntervalSource: The Impact of the Glass Ceiling on African American Men and Women.Source: Congressional Black Caucus Foundation’s Institute for Policy Research and EducationPrepared for the Glass Ceiling Commission.
*White men have 68 percent more of the executive, administrative, and managerial positions than should be expected at this educationallevel—all things being equal.
76

Placement and Opportunity:—Where are African American Managers?—What are the Opportunities Available
to Them?Most of the CEOs interviewed as part of a FederalGlass Ceiling Commission study maintained that executive-level African Americans are hard to findin Corporate America.
• Executive, administrative, and managerial advancement opportunities for African Americans are disproportionately in the government sector (local, state, and federal) and in the non-profit sector (non-government agencies in health, social welfare, education, legal services, professional services, membership organizations and associations, and libraries, museums, and arts organizations.)
• Although African Americans comprise 12 percent of the total population, African Americans of both genders are less than half as likely to be represented in top positions in most industries as would be expected from their proportion in the total population. Data on total employment in top categories in all private sector indus-tries indicate that Black men and women comprise less than 2.5 percent of those who have risen above the glass ceiling.
According to the 1990 Public Use Microdata (5%) Sample files, data on executive, administrative,
and managerial representation in major industriesby gender, race and ethnicity presented in Table 3(following) shows that in 1990:
• Black men held only 2.3 percent of the executive, administrative, and managerial jobs in all private sector industries; they held 3.9 percent of these jobs in the public and private sectors combined.
• Black women held 2.2 percent of the executive, administrative, and managerial jobs in all private sector industries; they held 4.6 percent of these jobs in the public and private sectors combined.
• Private sector industries that showed the most progress in promoting Black men to executive, administrative, and managerial positions were—
—communications (3.7 percent) —business services (3.5 percent)
• Those industries in which Black men had made the least progress were—
—wholesale trade (1.2 percent ) —other professional services
(1.2 percent) —manufacturing (1.6 percent)—construction ( 1.9 percent)
• Private sector industries that showed the most progress in hiring and promoting Black women to executive, administrative, and managerial positions were—
—communications (4.9 percent) —insurance (3.0 percent)
Black men with professional degrees
in these top positions earn only 79
percent of the income of white men
with the same degrees and positions.
77

78
• Those industries in which Black women had made the least progress were—
—construction (0.3 percent)—wholesale trade (0.3 percent)—business services (0.5 percent)—manufacturing (0.9 percent)
• Black men have been more successful than Black women in gaining executive, administrative, and managerial positions in business services, construction, entertainment, manufacturing, personal services, transportation, and wholesale trade. When industries that are heavily influenced by public sector employment are excluded, the only industry in which Black women have been more successful than Black men in gaining top positions is communications.
A 1990 Business Week profile of the chief executivesof the 1000 most valuable publicly held U.S. companies showed that the critical career path for senior management positions in CorporateAmerica historically has been finance, marketing,or operations—those areas that are likely to bedirectly related to a corporate bottom line.Therefore, it is significant that African Americanmen and women are underrepresented in finance,marketing, and operations.
• Research indicates that African Americans are not in the functions that lead to
the top. —Like white women and minorities other than Blacks, African American managers (men and women) are concentrated in staff functions rather than line positions. —African Americans who are at the professional and managerial levels in major mainstream corporations are clustered in the areas of community relations, public relations, personnel and labor relations, and affirmative action/equal employment opportunity areas.

79
TABLE 3EXECUTIVE, ADMINISTRATIVE, AND MANAGERIAL OCCUPATIONS FOR MAJOR INDUSTRYCATEGORIES, BY RACE AND SEX, 1990
Percent in OccupationsIndustry White Black Hispanic Asian
M F M F M F M FBanking 44.8 37.6 2.6 2.6 3.4 5.0 1.8 2.6*Business Services 51.6 32.8 3.5 0.5 5.2 3.2 1.7 1.2Communication 47.6 36.6 3.7 4.9 3.3 1.8 1.6 1.6Construction 74.6 15.6 1.9 0.3 1.7 0.9 0.3 0.3
Education/Elementary 35.4 45.3 3.5 4.3 2.7 5.5 0.8 0.8Education/College 38.4 48.3 1.6 4.5 0.8 2.9 1.6 0.8Entertainment 50.2 38.1 2.5 1.0 4.1 1.5 1.5 —Health Services 16.2 66.7 1.3 2.5 1.6 4.4 — 0.9
Hospitals 29.9 50.2 2.1 4.6 4.6 4.6 1.7 1.7Insurance 44.0 40.7 3.2 3.0 2.0 4.2 0.5 1.7Manufacturing 62.9 23.3 1.6 0.9 2.8 2.0 2.3 0.9Personal Services 41.3 40.4 3.4 2.5 4.3 2.8 2.5 1.9
Public Admininistration 47.5 31.9 3.6 4.8 5.2 3.6 0.6 1.3Retail 41.7 39.1 2.3 2.6 4.6 4.3 3.5 1.7Social Services 16.4 65.6 3.1 7.2 1.0 3.6 0.5 0.5Transportation 58.4 25.6 2.4 1.0 6.1 3.4 1.7 0.3
Utilities 71.9 17.2 3.1 0.8 3.1 0.7 — 0.8Wholesale 53.4 36.2 1.2 0.3 2.7 2.1 2.4 1.8
Other Prof. 52.8 37.8 1.2 1.6 1.9 1.9 1.9 1.5TOTAL 49.4 35.9 2.3 2.2 3.5 3.1 1.7 1.2
(All PrivateSector Industries)
Total Employed 39.8 36.3 3.9 4.6 6.4 5.0 1.5 1.3(Public and PrivateSector Industries)
*Data does not always add up to 100.0 percent due to rounding errors.Source: 1990 Bureau of the Census, PUMS File 95% Confidence IntervalSource: The Impact of the Glass Ceiling on African American Men and Women.Source: Congressional Black Caucus Foundation’s Institute for Policy Research and EducationPrepared for the Glass Ceiling Commission.
This table provides a distribution of the percent composition of each of the four racial groups for each industry category. AfricanAmericans remain underrepresented in the executive, administrative, and managerial occupations in every single industry category.

Compensation:—How are African American Managers Being Compensated?
Human capital theory suggests that individuals arerewarded in their current jobs for their pastinvestment in education and training. By this reasoning, individuals with comparable education,training, and experience would achieve similarlevels of career success. The research indicatesthat race and gender affect the evenhanded application of this theory. (Congressional BlackCaucus Foundation’s Institute for Policy Researchand Education 1994). Equal educational prepara-tion and job experience do not lead to equaladvancement for African American women andmen—both groups continue to lag behind whitenon-Hispanic men and women.
An analysis of 1990 PUMS file prepared by theCongressional Black Caucus Foundation’sInstitute for Policy Research and Education showsthat the average pay of white men in executive,administrative, and managerial positions is higherthan the average pay of white women, Blackwomen, or Black men at the same educationaland occupational levels. Even among those withprofessional and doctoral degrees, white men, onthe average, earn substantially more.
For example, as the following table shows, Blackmen with professional degrees in these top positions earn only 79 percent of the income of
white men with the same degrees and positions;Black women earn only 60 percent of the averagesalaries earned by their white male counterparts.It appears that they are either not getting the verytop jobs in these categories or, if they are in toppositions, they are not being rewarded equally.
80

81
Black MaleWhite Female
TABLE 4 EXECUTIVE, ADMINISTRATIVE, AND MANAGERIAL OCCUPATIONS BY RACE*, EDUCATION ATTAINMENT, INCOME, AND GENDER
$100,000
Source: 1990 Bureau of the Census, PUMS file, 95% Confidence Interval Source: The Impact of the Glass Ceiling on African American Men and Women Prepared for the Glass Ceiling Commission Source: Congressional Black Caucus Foundation’s Institute for Policy Research and Education Prepared for the Glass Ceiling Commission
White Male
This table illustrates the educational attainment level for African Americans and whites. Even when one secures an executive, administrative, or managerial occupation, black men, white women, and black women in these positions earn substantially less than do white men.
*Race=Black and White only
Black FemaleDoctoral Degree Professional Degree
44,230 54,17154,741 71,11447,876 61,99570,414 90,610
Masters Degree
34,00647,23438,39157,371
Bachelors Degree
30,58432,00131,33847,181
4 or More Years college
32,45240,93932,33250,052
1 to 3 years college
24,26226,02725,19538,588
4 years of H.S.
22,73225,53422,01533,074
Less than H.S.
18,629 7,20320,87630,275
Less than Bachelor’s
23,29123,94723,23034,862
$80,000
$60,000
$40,000
$20,000
$0
Private Sector refers to Business Services, Communications, Construction, Entertainment, Manufacturing, Public Administration, and Utilities Industries
(PRIVATE SECTOR ONLY)

82
TABLE 5EXECUTIVE, ADMINISTRATIVE, AND MANAGERIAL OCCUPATIONS BY RACE,* SELECTED INDUSTRY, MEAN INCOME, AND SEX, 1990
(Private Sector Only)
Ratio
Mean Income Black/
Industry White Black White Male
M F M F M F
Business Services $45,560 $29,037 $36,338 $29,037 79.7 63.7
Finance, Real Estate & Insurance 59,240 29,366 34,299 32,286 57.9 54.5
Manufacturing 58,366 31,662 48,152 38,055 82.5 65.2
Retail 36,439 23,540 22,592 21,863 62.0 60.0
Transportation 50,677 38,768 39,275 39,275 77.5 77.5
Wholesale 58,283 29,125 25,819 — 44.3 —
Other Profession 51,024 26,773 22,808 21,124 44.7 41.4
Source: Bureau of the Census, 1990 PUMS File, 95% Confidence IntervalSource: The Impact of the Glass Ceiling on African American Men and Women.Source: Congressional Black Caucus Foundation’s Institute for Policy Research and EducationPrepared for the Glass Ceiling Commission.
*Analysis of 1990 PUMS data files also shows that income deficits for Blacks in top positions compared to white men in top positions varyamong industries. This table shows, Black men and Black women in top positions in the finance, real estate, and insurance industries earnon average about half the income of white men in these industries, and Black men and women in top positions in the wholesale trade and business services industries average less than half the salaries of white men in these industries' top positions.

83
IN SUM
Public hearings, private studies, CEO interviews,African American male executive focus groups,and other research contracted for by the FederalGlass Ceiling Commission, indicate that the major barriers to the advancement of African Americansin business are these:
• The disproportionately small pool of African Americans with the educational credentials required for senior management positions.
• Recruitment practices that overlook or do not identify African Americans with the required credentials.
• Stereotypes that African Americans are not suited for leadership positions.
• Prejudice and bias that makes white middle-level managers reluctant to promote African Americans.
• Exclusion from informal communication networks.
• Reluctance of white managers to mentor African American men or women.
• Lack of career counseling and exclusion from career ladders.
• Lack of equal access to assignments that provide key career experiences.
• Lack of equal access to assignments that provide visibility and interaction with senior managers.

GENERAL BACKGROUND
Native American and Indian are designations forthe indigenous peoples who inhabited theWestern Hemisphere when the Europeansarrived. Just as with other races and ethnicities,it is misleading to consider American Indians as a one big group. The U.S. government recognizes more than 298 Federal reservations, 4 Federal trust land areas, 217 Alaskan NativeVillage Statistical Areas, and 17 Tribal JurisdictionStatistical Areas in Oklahoma. In addition, thereare 12 state reservations. The size of state and federal reservations range from holdings as largeas the State of Virginia to small plots of no morethan several acres. Indian tribes speak more than200 languages. Other aspects of their cultures differ as much as their languages do.
What American Indians do share is a unique political status as members of sovereign nations.The U.S. government entered into treaties withthe sovereign Indian nations and has trust responsibility for them. Administration of thetrust is lodged in the Department of Interior and the policy of the Bureau of Indian Affairs is determined by Congressional committees.
American Indians are the only people under the Interior umbrella. Because the situation ofAmerican Indians is so unique and so unfamiliarto most other Americans, a very brief history follows so that the status of American Indians relative to the glass ceiling and their feelingsabout it can be better understood.
Overall, American Indians are poor in materialgoods and wealthy in undeveloped assets. OneIndian leader has described them as “land rich anddirt poor.” It is estimated that 80 percent of thecountry’s untapped natural resources belong toIndian trusts. Some American Indian leaders saythat their lot would be easier if they were simply impoverished and not in possession ofthings others need and want: water, land, coal, oil,gas, timber, minerals, and fish. U.S. Indian policyfrom the beginning when Indians were called “savages,” was designed to acquire Indian landand resources and to destroy tribal society. Laterstrategies, such as the establishment of Bureau ofIndian Affairs, Indian boarding schools thatremoved American Indian children from theirfamilies, and the termination of tribal land holdings under the 1887 Dawes Act, devastated life in many tribal communities.84
American Indians are poor in
material goods and wealthy in
undeveloped assets.
“MORE THAN GLASS” AMERICAN INDIANS (Members of Sovereign Nations)

In 1990 only 3,277 American
Indians 18 years of age and over had
earned graduate degrees of any kind.
A 1928 report of a Federal investigation revealed anumber of serious abuses that had weakenedAmerican Indian cultures, damaged the health oftheir people, and eroded their land base. (Forexample, through the implementation of theDawes Act, popularly known as the “AllotmentAct,” American Indian tribes and individuals lost90 million of the 138 million acres that the tribesand bands had retained under peace treaties with the United States.) Not until 1934 was Indian policy radically changed by the IndianReorganization Act. The cornerstone of that legislation was federal re-recognition of the sovereignty of Indian tribes that ended efforts todestroy Indian language and culture. Since thattime, “Indian policy” has had its ups and downs,but American Indian leadership has fought stead-fastly for self-determination and the retention ofland and treaty rights.
Most American Indian tribes are still struggling to overcome attempts at forced assimilation. To American Indians, the Indian wars of the nine-teenth century are not a matter of ancient historyor television entertainment. Until recently,American Indian survivors of these wars hadrecounted their experiences to current genera-tions just as former African American slaves hadrecounted their experiences to their children andgrandchildren. Coercive efforts at assimilationand an institutional system that often disregardedboth the culture of the tribes and the cohesion of
American Indian families have shaped AmericanIndian perceptions of the majority society. ManyAmerican Indians are suspicious of whites. Giventhe prejudicial treatment to which the averageAmerican Indian has been exposed in “Indiancountry,” it is hardly surprising.
American Indian leaders point out that manyIndian people have no interest in enteringCorporate America. Indian leaders estimate thathalf of the Indians who earn MBAs or equivalentdegrees are employed with Indian tribes or ventures. For example, one hundred percent ofthose who earned MBAs through the First NationsScholarship Fund have returned to reservations todedicate their skills and talent to Indian people.(Bureau of the Census 1992). The overall number,however, is small. In 1990 only 3,277 AmericanIndians 18 years of age and over had earned grad-uate degrees of any kind.
Generally, CEOs do not think about AmericanIndians as candidates for management jobs. TheAmerican Indian men and women who participat-ed in the focus-group research expressed dismayat the general population’s ignorance of their history and status as sovereign nations. They confirmed the CEO perception that few are in theranks of corporate management, and describedthe barriers they confronted which included clashes of cultures and values. The stereotypes ofAmerican Indians that emerged from Commission 85
research are negative. They distort perceptions ofthe suitability of American Indians for businessleadership.
THE PERCEPTIONS
How CEOs Perceive The Glass CeilingAnd American Indians: Only one CEO in the Glass Ceiling Commissionsurvey mentioned American Indians. He recalledhiring one in a professional position. Althoughthere have been some senior managers in the pri-vate sector, American Indians are, for all practicalpurposes, invisible at the top management level inthat sector.
How American Indian Men and WomenPerceive the Glass Ceiling:
“The glass ceiling is that thick!”[Holding hands a foot apart.]
“It’s more than glass. It comes from lack ofknowledge , as you’ve been hearing here, and it comes from the entrenched group of peoplethat are in positions at certain levels and theypick and choose . . . about how decisions aremade . . . so you can get to a certain level and that’s it!”
Within almost every Indian culture there existstrong oral traditions that bind the generations
together. The oral tradition binds and linksIndian societies. In order for non-Indians tounderstand Indians it is fundamental that Indianstell their own story. The written word cannot cap-ture the rich experience of the oral tradition orthe systematic bonding of generations to generations. Their content and perceptions aboutCorporate American have to be heard in theirown words to be understood. It is for this reasonthat the report includes extensive quotes from the oral focus panel discussions of what theAmerican Indian participants said.
Here is what the American Indian men andwomen who participated in the focus groups told us.
The “Minority” LabelFocus group participants declared the term“minority” to be incorrect and offensive whenreferring to American Indians and suggestive ofinferiority when applied to anyone. They view it as a convenient term for others to use who do notconsider themselves “minority.” They interpret theword, whether it is number-based or color-based,as putting people in a lesser position.
“It’s easier for someone else to come upwith this nomenclature, whatever youwant to call it, so that they can aggregate or disaggregate.”
86

87
“It connotes less than able, less than
willing, less than something. It’s
always less than something . . . need-
ing special treatment and special care
and unable to make it without special
help.”
“When people hear the term ‘minority’they think of racial minorities or numbers, they’re in the minority number-wise . . . they’re less in numbers and fallinto a racial category.”
“I think they take a look at you and justlike they do a whole lot of people andanybody who is recognizably of color or feature-wise, they assume you’re probably in the minority. And there’sthat term again. Because that’s howthey’ve classified people in this country.”
“If you’re going to say Euro-Americans,they all came as Italians, Polish people,and all of that, Germans and all, butthey’re not called minorities. Or arethey? No. So, why is it only people ofcolor usually? And women.”
“On the diversity committees, they putall the minorities together . . . one ofeach . . . you always sing to the choir,and it never gets out beyond that . . . Ifyou keep the minorities busy, in their lit-tle meetings and everything, maybethey’ll leave the rest of these guys alone.”
“When the minorities are always placedtogether in these diversity things, andthey have to figure everything out, even
though they’re not the problem, the problem is some other place, then itbecomes kind of competing for resources . . . so it’s always putting things in away that will maybe even create somenegative things.”
The “Native American” LabelFocus group participants also rejected the “Native American” label. Their comments andexplanations include the following:
“No offense, but that’s the wrong term.Everybody’s a Native American that’ssecond generation whether you’re com-ing from Africa or from Ireland—we’reAmerican Indians.”
“. . . that’s ‘P.C.’ [politicallycorrect]in Washington.”
“Native American can be very inclu-sive. Even though American Indian isa misnomer, it’s been around a lotlonger than Native American. . . [We]kind of like it.”
The Ceiling ItselfFocus group participants believe that the glassceiling is lower for American Indians than forother groups. Furthermore, they believe that itstems from lack of knowledge on the part of

non-Indians, many of whom rely on stereotypes.This, in turn, forces American Indians into theburdensome and never-ending role of educator.
“The image is ‘not qualified,’ so we getstuck lower sooner and the glass isthicker.”
“Few of us even get that opportunity.”
“It depends on how white you look.”
“And how male you look.”
“As far as the glass ceiling, here again,I’ve never had a problem as a woman,it’s always because people didn’t likemy brown skin, because I wasAmerican Indian.”
“You’re not going to keep trying to bashand break a ceiling that’s so thick. You sort of acquiesce and move on tosomething else—or get creative . . .There are some of us who can run cir-cles around some of the people who aremaking decisions and who do it as wellor better but it’s not ever going to be anopportunity.”
“The glass ceiling is at a lower level. It confronts you—[you] butt up
against it sooner in business and ingovernment . . . you encounter it fasterthan other groups of people, if you’re aNative woman versus an Anglowoman, you will probably hit it fasterand get stuck at a lower level . . .”
“It is a perpetual education process. . .people are so ignorant of the realfacts.”
“We are one percent of the population---and it is our task to educate the other99 percent?”
“We need to put out more information.We have to re-educate our male society.. . . American Indians have to spendfull time educating. Same thing withthe glass ceiling for women.”
Glass Ceiling Impact on Jobs and Careers
“. . . had to work harder to prove them-selves . . . not just a Native Americanor American Indian problem, I thinkit’s for anyone that comes from adiverse community that’s not part ofwhat mainstream Corporate Americaor mainstream Federal America sees,which is a predominantly Anglo white-male environment. They tend to have88
Focus-group participants believe that
the glass ceiling is lower for American
Indians than for other groups.

to work harder, in my opinion, in my research, to get in, to be successful, tokeep turf they’ve claimed, and to moveup.”
“I found that it was very difficultbeing not only a woman but also beingan Indian woman, for them to take meseriously. So, I would circumvent thatby getting my ideas put across by amale . . . then it was taken seriously.”
“They tend to put you in the equalopportunity program or something likethat and you don’t have the opportuni-ties to move around in other places inthe workplace.”
“Because I was the only AmericanIndian in that agency, I didn’t haveanybody at higher positions to reallyalways support me. . . . If you reallywant to, at least in the present systems,to get ahead, you really have to knowhigher people to—why I don’t get theassignments so you can develop different skills . . . ”
“I believe that I’ve never been preju-diced against because I was a woman.I’ve been prejudiced against very oftenbecause I was an Indian.”
The focus-group participants also identified fourissues that are relevant to their status in Americaand their participation in Corporate America. The issues are —the unique legal status ofAmerican Indians as members of sovereignnations, their holy days and religious obligations,the culture conflict between traditional values and perceived corporate values, and their ties totheir communal land base. The statements thatfollow are drawn directly from the focus-group discussions.
Unique Legal Status as Members of Sovereign Nations
“In the sense of protocol, it would beFederal government, tribal government,state government, local government . . .the minute you leave the res* your sta-tus is different”
“American Indians (not NativeAmericans) have dual citizenship inthe United States and in their ownnations. So, I think something like thatshould be understood.”
“The United States deals with Indiansbecause of sovereignty, not becausethey’re minorities, and that’s the way it
*res = reservation 89

should be, because it’s been a long,hard struggle, to say that we have thatright. We’re governments and we canpetition another government—that’sthe U.S. government—because we havethe right to do that.”
“We try to get away from reference toIndian people as minorities because it’sa government-to-government sovereign-nation distinction which is uniqueamong all groups of people within thecontinental U.S. and elsewhere.”
“In California, the cities, some coun-ties, refer to Indians as ‘the minority ofminorities.’ We always make it a pointto say, ‘That’s how you view us, but inreality we are going out of the minority,we are the first Americans, we areAmerican Indians and we have a special relationship with the government.’”
“A lot of people don’t know, for example, that there are Indian courts,our own court system. . . an issuethey’re not used to, because they’re usedto state courts or municipal courts.”
Holy Days
“Our first education at home from ourcultures is our spiritual education, ourreligious education. We’re not going topreschool, or Montessori school, orkindergarten, we’re going to SundaySchool and churches or whatever religious classes. . . .There has to beroom for understanding—respect.”
“When you’re talking about the holydays and ceremonial days in Indiancountry, where schools cannot operatebecause the tribe has decided they haveto have everyone in the family, from thesmallest baby to the oldest man, doingthese full day ceremonial dances,which are prayers—and we all comefrom different religious backgroundsand we all have different holy days.”
“Because I’m not of the Christian persuasion, when I need time off formidwinter ceremonies, unlike peoplewho celebrate Christmas and getChristmas-time off, I would rathertrade those days for midwinter ceremonies and use sick or annual timeto attend ceremonies, but that’s moreimportant to me.”
90

“. . . the idea of having to maintainyour culture and be responsible to yourown people as well as to your boss—who’s got an 8-to-5 schedule, 40 hoursa week, Monday to Friday, who takesChristmas off, Thanksgiving, MartinLuther King Day, Presidents’ Day. Hedoesn’t understand your honoring theseasons, or you have to cut pinebranches on a certain day to preparewhile you dance for a full day. If you’rea San Juan Pueblo, on, say, the 26thof December—you’ve done for 400 yearsand the men dance all day long. If thathappens to be on a Tuesday, that doesn’t fit, you’ve got that danceresponsibility and your job responsibili-ty and I think there’s got to be anunderstanding of how we can fittogether. . . They are separate nationswith a great, distinct culture.”
Culture Conflict Between Traditional Values and Perceived Corporate Values
“I think of it [Corporate America] as a money-driven organization thatexploits resources and does not conservethem, which runs counter to the valuesof Indian people, which is to conserve aresource. So, those two values are at
loggerheads and will be at loggerheads,until somebody says there are differentthings out here that are more importantthan money.”
“We’re not brought up to think in thoseterms—our parents didn’t belong toCorporate America, so that’s the lastthing we’re brought up to think about.”
“Our kids are off the reservation. We’regiving them that extra option we didn’thave---I explain to my children, ‘Here’sanother choice for you.’. . .I did, in fact,send them off to Corporate America.”
“Family and community is more important. I was raised to contribute tomy community and there was no question about what I was going to doin life. There was no discussion. ”
“I saw a poster when I was over inLondon. It said, ‘After you cut down thelast tree, after you’ve killed the last buffalo, after you’ve poisoned the laststream, it is then that you will realizethat you can’t eat money.’ And that goesback to the values that most Indian peo-ple have.”
91

92
“I think that’s an impediment if mainstream society is willing to sacrificefamily to climb the corporate ladder—people who come from more traditional,family-centered backgrounds who arenot willing to do that —there’s a priceyou’ve got to pay, you’ve got to decide if you’re going to turn your face fromwhere you come from —to let go ofthat.”
“So when it comes time to go in and getyour first real job and you get your corporate uniform, your nice little suitand your pumps and you get your hair-do, and you start doing the things thatthey tell you in school, this is how you goin and work in Corporate America andthis is how you succeed. It doesn’t matter that you’ve played the game andyou got good grades and you learnedhow to do what it is you do. There aresome things you grew up not knowingabout that it seems everyone sittingaround you knows how to do, what todo . . . There are people around me whogrew up in that environment, so theywere very comfortable with what theywere doing. Those kinds of thingsthat make you comfortable in thatenvironment are the kinds ofthings that get you recruited intomanagement programs.”
“Indian people aren’t as transient . . .Most people don’t want to move awayfrom their communities and so in orderto rise in Corporate America you’ve gotto be mobile and if it’s a choice betweenyour family and a job, you really have tothink. It has to be an ideal opportunityfor you to take that chance.”
“And I’ve heard traditional people[from] a reservation environment,they’ve walked in two worlds, and donesuch a good job, then when they gohome, they’ve paid a price—‘Are you anapple?’ ‘Are you to be trusted?’ ‘Are youan Indian or have you sold out?’ Thereare all kinds of trade-offs.”
“When I think of Corporate America,it’s all profit-driven and those are notthe values I would promote . . . If it werea bank at home providing a service topeople, I would support that, but not fora profit motive. I was not brought upthat way.”
Ties to the Communal Land Base
“I think that’s who we are, AmericanIndians, our own land base and ourpeople. . . . We have very strong ties tothat land base wherever it may be andevery Indian has that sense of ‘I‘ve

never left there, I‘m still a part of mycommunity, and everything that I dohas to benefit Indian people as a wholeor my own tribe’ . . . and CorporateAmericans don‘t have a sense of thatland base. They have acreage, or property, but ours is different.”
“You see, we have the last frontier inAmerica. We have the last piece ofclean air. We have the last piece of riverthat might not be polluted. There’s acouple of trees left and CorporateAmerica wants that. Large timber companies would like to get their mittson that. . . . They can’t take NationalPark Service resources, they can’t takeBureau of Land Managementresources, they’re waiting to get atIndian America.”
“It’s wonderful because it’s genera-tional. We’re hundreds and hundredsand hundreds of years old. Our families go back a long way and we’rehappy. . . . That land base belongs tous. It’s ours. It’s communal. It’s heldin trust for us. The U.S. governmentsaid, ‘It’s yours.’ And, it shrinks daily .. . . It hacks at our sovereignty. . . .There’s a glass ceiling threat to ourvery essence as a people.”
What are the Stereotypes about American Indians?American Indians are subjected to discriminationand prejudice in the regions of the country inwhich they are concentrated. In these areas theyare frequently viewed as threats: as irresponsible dri-vers/ drunken/ and lazy members of the welfare ranks.Discrimination in housing, jobs, accommodations,and schools are part of life for many AmericanIndians who live off reservation.
A paper commissioned by the Glass Ceiling (pre-pared by a consortium of scholars, Keith James,Chris Lovato, Willie Wolf, and Steve Byers enti-tled, Barriers to Workplace Advancement Experiencedby Native Americans) showed that studies of non-Indian views of American Indians found that“Indians” were considered to be most deficient in theappearance and assertiveness deemed necessary for man-agement. American Indian men are consideredmore physical than mental—given to risky behavior thatis not consistent with the presence and control needed formanagerial positions.
The stereotypes of American Indians are reflec-tions of the two ways most non-Indian Americansare exposed to American Indians.
First, many non-Indians see or read in the mediaabout American Indians who have suffered sustained poverty, lack of adequate education, lackof jobs, attacks on their culture, and lack of hope. 93

These individuals perceive all or most AmericanIndians as dysfunctional people.
Second, most non-Indians are affected—consciously or unconsciously—by Hollywood“Indians,” the ones who endlessly rode downbuttes to attack the white settlers’ wagons thatwere drawn in a circle. These individuals perceiveAmerican Indians as “the bad guys.”
As one participant in the American Indian focusgroups said,
“I hate to repeat them . . . alcoholism,the jokes about Indian time, lack ofeducatio. . . .There’s just a whole seriesof negative tags that have been perpetu-ated in movies and in the media aboutnative peoples in general. First, wehave to overcome that. . .”
Few white Americans have any accurate knowledge about the history of AmericanIndian/white relations and even fewer have hadthe opportunity to appreciate the strength andperseverance it has taken the Indian nations tosurvive. Few non-Indians are familiar with the for-mal and informal American Indian leaders—menand women—who have struggled to preserve theculture and dignity of their people over genera-tions of deprivation.
Stereotypes and BarriersThe American Indian men and women who par-ticipated in Glass Ceiling Commission focusgroups perceived stereotypes as barriers to oppor-tunity and advancement in Corporate Americaand discussed the role of stereotypes in erectingcorporate barriers. In their words:
“It starts with all of these misconcep-tions . . . it filters down. You can seethat it does get worse when it gets downto the individual level in the workplace,and the barriers are both in CorporateAmerica and I would think in theFederal Government.”
“They think that Indian people arevery poor, that they have nothing, theconcept that is portrayed.”
“Buckskin and feathers . . . I looked atthis poster and I thought, that’s reallynice, the only person in traditionaldress was the Indian—why is this person the only person in traditionaldress . . . Why don’t you have thisBlack person dressed possibly in theirgarb from Africa? And this Latino?You know, Indian people do dress justlike everybody else dresses, too . . . We are contemporary. Am I dressed inbuckskin to attend this meeting?”94
“The movies tend to reinforce that.”“No expectation for [AmericanIndian]employees to succeed.”
“There’s not in some cases that expecta-tion for [American Indian] employeesto succeed.”
“Unfortunately, in this society, theywant everybody to be alike. They wanteveryone to get in to a certain stereotypethat they have of a lot of different people.”
“The challenge . . . to break downstereotypes. . . . I made a promise to anelder that I would try to open up doorsof opportunity for others. . . breakingdown stereotypes is a big deal to me.Maybe if I could get in, sharing withothers . . . that was sort of the motiva-tion for working in Corporate America,if you could get your foot in the door,and did well, not to fill a quota,because if you were not qualified, you would not succeed and that would slam the door in the face of any future applicant from the nativecommunity or Hispanic or any othercommunity . . .”
“There’s an expression I’ve heard, I’mvery uncomfortable with it, aboutNative peoples as being the ‘shadowculture.’ . . . It used to be the only timewe were portrayed in movies and presswas when something bad happened, thenegative image of a people who can’tcontrol their own destiny. CorporateAmerica might see that and think, well,if they can’t even survive in their owncommunities we’re going to inherit allthese problems? . . . It’s constantly aneducation process . . . so heaven forbidyou don’t do a good showing becausethen you’ve shot down the rest. It’s aburden.”
95

THE REALITY CHECK:Perceptions and Stereotypes -Versus the Facts
The Basic Facts• It is estimated that there were 5,000,000 indigenous people on the continent when the white man
arrived. By the time “the West had been won,” 250,000 survivors remained within what is now the borders of the contiguous 48 states.
• The American Indian population is one of the fastest growing groups in the United States. The 1990 Census reported that the population totaled 2 million.
• Bureau of Indian Affairs (BIA) data reveal that in 1991, 1,001,441 American Indians lived within its jurisdictional areas on reservations or adjacent lands. This makes American Indians a very rural population.
• Bureau of the Census data showed that in 1990, 402,827 American Indians resided in ten urban areas: Los Angeles, Tulsa, New York, Oklahoma City, San Francisco, Phoenix, Seattle/Tacoma, Minneapolis, Tucson and San Diego, each of which has American Indian populations exceeding 20,000. In 1990, more than 500,000 plus American Indians lived outside BIA jurisdiction in other urban or rural areas. Significant numbers of American Indians move frequently to and from Indian lands which makes it difficult to pin point the exact percentages of on- or off-reservation residency.
• American Indian leaders often describe reservation communities as underdeveloped countries as evidenced in the following statistics.
— The Bureau of the Census 1990 publication, Social and Economic Characteristics: American Indians and Alaskan Natives Areas, indicated that annual per capita income on the ten largest reservations ranged from $3,113 to $4,718; that 56 percent of American Indian households earned less than $15,000 per year.
— There are wide variations in the American Indian unemployment rate data from one place to the next. In general, unemployment is substantially higher in reservation areas than anywhere else. In 1990, the overall unemployment rate for Indian workers nationally was 14.4 percent. According to the Indian and Native American Employment and Training Coalition, the unemployment rate for Indian workers within the boundaries of federal reservation and trust land areas was 25 percent.
— The American Indian population suffers from the highest incidence of alcoholism, tuberculosis, and suicide of any ethnic group in the United States. (James 1994).
96

The high school dropout rate of
American Indians is 36 percent, the
highest overall dropout rate of any
ethnic or racial category.
The Participation of American Indiansin Corporate America:
Preparedness:—Are American Indians Prepared to Participate in Corporate America?
The data on educational attainment show that fewAmerican Indians are prepared for private sectormanagement positions.
• The Department of Education reports that the high school drop out rate of American Indians is 36 percent, the highest overall dropout rate of any ethnic or racial category. It is especially high among youth who attend the BIA boarding schools. Culture conflict is often cited as the cause.
• The educational attainment level of American Indians—including Eskimos and Aleuts—improved between 1980 and 1990 but remains considerably below the level of the total population. Only 9 percent of American Indians in the workforce hold college degrees.
• The 1990 Census reports that 5,899 American Indians 18 years and older have bachelor’s degrees, although 34,721 have some college experience. College dropout rates are high, especially among American Indian students who come to college from reservations. Culture conflict is often cited as the major contributing factor to the drop out rate.
• The 1990 U.S. Census also reports that only 3,277 American Indians 18 years or older hold post graduate degrees.
Placement and Opportunity:—Where are American Indians in Corporate America?—What Opportunities are Available to Them?
General American Indian Labor Force Trends:The material well-being of any community restslargely on the shoulders of its working people. If acommunity’s workers have the skills needed tomake them productive citizens, the communitywill have the foundation on which to build itslong-term success. If those workers are fullyemployed at decent jobs, the community will prosper and can prepare its people for positionsabove the glass ceiling. Earned income fromemployment is the cornerstone of almost everycommunity’s economy.
These factors are true in American Indian andAlaska Native communities as they are in others. Itis the labor force in Indian communities that isthe bedrock of their economies. However, the wayin which the labor force is defined for mostFederal statistical purposes—the segment of thepopulation, age 16 and over, that is either in theArmed Forces, employed in the civilian laborforce, or actively looking for work in the civilianlabor force—is a concept that does not fit theIndian population well. It misses many who are 97

According to the 1990 Bureau of the
Census, only 7,862 American
Indians held executive, managerial
or administrative positions.
jobless and some who are technically employedbut need unsubsidized jobs. The conventionallabor force definition also overlooks subsistenceand other productive but traditional activities thatremain important customs in many Indian com-munities. Nonetheless, all of the federal data col-lected through surveys at the individual Indianhousehold level use the standard definition of thelabor force in their classification of the workingage population.
The key characteristics of the Indian labor force,drawn from the Census counts of 1970, 1980 and1990, are shown in Table 6.
Perhaps the most striking feature of these num-bers is the enormous growth they show in theIndian labor force between 1970 and 1990. Theraw numbers have increased nearly four times injust two decades.
The labor force growth reflects a sharp rise in thesize of the American Indian and Alaskan Nativepopulation. Some of this growth comes fromthose who are now reporting themselves asAmerican Indians on the Census forms. Some is aresult of more complete Census coverage of theAmerican Indian population. Some is a product ofthe fact that the 1970 figures in Table 6 do notinclude Alaska Natives, a population which isincluded in the 1980 and 1990 numbers.
At the same time, the number of AmericanIndians in the labor force has gone up significant-ly as a result of natural increase—more births thandeaths. The labor force increase in each decade isalso attributable to the fact that more AmericanIndian people are participating in conventionallydefined employment and job seeking activities.
American Indians in ManagementAccording to the 1990 Bureau of the Census, only7,862 American Indians held executive, manageri-al, or administrative positions. Little of thisemployment for men or women was in the privatesector and a lack of a clear definition of “privatesector” further confuses the picture. Is the executive, managerial, and administrative employ-ment in the private sector on- or off-reservation,or is it in a mainstream company located on areservation or in a tribal enterprise? As oneAmerican Indian expert in economic develop-ment pointed out, “There’s a big difference betweenbeing a manager at IBM and a manager of the NavajoJitney Service.”
There does seem to be agreement among knowledgeable American Indians that almostthree-quarters of American Indian women managers work in government employment, but once again it is not clear if these women areemployed by tribal, federal, state, or local governments. It is frequently stated that thesewomen fill lower-level management jobs in tribaloffices, but there are as yet no reliable data.
98

Regardless of where American Indian men andwomen are employed, the number of those whoare prepared for senior-level management posi-tions in any sector is very low. Little has been doneto identify them.
Compensation:—How are American Indians Compensated?
The small size of the pool of American Indians inbusiness and the general lack of data on AmericanIndians makes it impossible to compare the compensation of American Indian managers withthe compensation of other managers in similarpositions.
IN SUM
The major barriers to the representation andadvancement of American Indians in private sec-tor senior management are these:
• Lack of educational opportunity which drastically reduces the pool
• Lack of attention to the upward mobility of American Indian employees
• Belief, based on bias and acceptance of stereotypes, that American Indians are not able to perform managerial positions in mainstream business
• Preference on the part of some American Indians to devote their talents to reservation economic development or to Indian-owned and -managed businesses that are consistent with their religious and cultural values.
99

TABLE 6AMERICAN INDIAN LABOR FORCE TRENDS: 1970-1990
1970* 1980 1990Characteristic Census Census Census
Population Age 16 & over 452,938 1,022,411 1,395,009
In Labor Force 221,733 598,626 865,703In Armed Forces 7,836 14,147 14,391
Labor ForceParticipation Rate 49.0% 58.6% 62.1%
Civilian Labor Force 213,897 584,479 851,312
Employed 190,233 507,614 728,953Male 116,467 286,687 388,911Female 73,766 220,927 340,042
Unemployed 23,664 76,865 122,359Percent Unemployed 11.1% 13.2% 14.4%
Male 15,308 46,884 70,981Percent Unemployed 11.6% 14.1% 15.4%Female 8,356 29,981 51,378Percent Unemployed 10.2% 11.9% 13.1%
Note: *1970 figures are for American Indian population only.
1980 and 1990 figures are for total American Indian, Eskimo, and Aleut population.
Source: 1970, 1980, and 1990 Bureau of the Census
100

GENERAL BACKGROUND
Between 1960 and 1990, the Asian and PacificAmerican population increased from 1 million toover 7 million, making it the racial group with thehighest growth rate. The 1965 Immigration Actand subsequent laws are largely responsible forthe phenomenal growth which created diverseAsian and Pacific Islander American communitieswith different national origins, cultural, social,and economic experiences. Yet many Americansare unaware of diversities within the Asian andPacific Islander American communities and theyhave even less understanding of their participa-tion or status in the private sector.
In fact, the powerful media image of Asian andPacific Islander Americans described in the following section about stereotyping has generat-ed a view of Asian and Pacific Islander Americansas “the model” for other minorities. Insofar as thisunderstanding has come to occupy the status ofconventional wisdom in the contemporary UnitedStates, it has led public policy makers and corpo-rate leaders to lump all Asian and Pacific IslanderAmericans together and dismiss the idea that theyhave any problems that require serious attention.
In fact, the U.S. Census disaggregates the Asianand Pacific Islander American community intoten categories and there are significant differ-ences among them that relate to birthplace, thetime and circumstances of their entry into theUnited States, their educational attainment, theireconomic status, and the roles they play in the private sector. Data are aggregated under theterm “Asian and Pacific Islander Americans.” It has been shortened to “API Americans” in thisreport. The categories included by the Census inAsian and Pacific Islanders are these:
• Chinese • Vietnamese • Filipino • Hawaiian • Japanese • Other Southeast Asian • Asian Indian • Other Asian • Korean • Pacific Islander
The CEO Survey interviews and the Asian andPacific Islander Male executive focus groups(assembled by the Glass Ceiling Commission),highlight the differences in the views of corporateleaders and the views of Asian and Pacific IslanderAmerican executives on the access, status, andupward mobility of Asian and Pacific IslanderAmericans in corporate America. The CEO inter-views mirror the popular view that Asian and
“THE IMPENETRABLE GLASS” ASIAN & PACIFIC ISLANDER AMERICANS
101

Pacific Islander Americans are the model minori-ty, unaffected by glass ceiling barriers, while the focus groups reveal how Asian and Pacific IslanderAmerican men perceive substantial obstacles totheir advancement in business. (Unfortunately,there are as yet few reports on Asian and PacificIslander American women’s attitudes.Observations from community leaders suggestthat they encounter a glass ceiling similar to thatencountered by Asian and Pacific Islander men.The data support that view (U.S. Bureau of theCensus - PUMS 1990). The following section onstereotypes, drawn from the Commission research,explains how even positive labels can turn nega-tive and become barriers to upward mobility inthe private sector.
THE PERCEPTIONS
How CEOs Perceive the Glass Ceiling and Asian and Pacific Islander AmericansThe overwhelming majority of the CEOs interviewed in the survey commissioned by theGlass Ceiling Commission think of the glass ceiling in terms of women. When reminded that italso affects minority men, almost all interpreted“minority” as African American. In fact, only twoof the non-minority CEOs even mentioned Asianand Pacific Islander Americans without beingreminded of that group. When asked directly,CEOs answered that they were agreeable to pro-moting Asian and Pacific Islander Americans to
top levels, but only the CEO of an internationalinvestment firm said that he was actively seekingthem. (Such lack of outreach may help to explainwhy less than one one-hundredth of one percentof all corporate directorships are held by Asianand Pacific Islander Americans.)
It is not clear whether CEOs do not perceive Asian and Pacific Islander Americans as a minorityor whether they simply do not perceive them asbeing employees with management potential They believe that Asian and Pacific IslanderAmericans “assimilate” economically and sociallywith ease.
How Asian and Pacific Men Perceivethe Glass Ceiling The information presented in this section, drawn from comments made by Asian and Pacific Islander American male executives whoparticipated in focus groups sponsored by theGlass Ceiling Commission, indicates that Asianand Pacific Islander Americans feel they are beingheld back by a glass ceiling. They feel that they arenot being treated equitably and they believe thattheir superior educational achievements and highperformance is not translated into access to seniordecision making positions.
The “Minority” Label102

103
Like African Americans and American Indians,Asian and Pacific Islander Americans perceive theterm “minority” as pejorative. None of the Asianand Pacific Islander American men who partici-pated in focus groups identified themselves as“minority.” To them “minority” meant a lack ofacceptance or a noticeably different appearance.Although they see striking cultural differencesbetween Eastern and Western cultures, theybelieve that racially they are considered in theU.S. to be the equivalent of white men. They per-ceive themselves as smarter and harder workingthan their white counterparts and are confidentthat they outperform their white colleagues.
“We’re not really a minority in the eyes ofwhites. We are good workers. They want to hire us.”
“My perception is that they don’t consider us a minority because we’ve got that positive image. I’ve been in meetings where they talkabout minorities. I’m sitting there with a groupof white people and I go to raise my hand, hey, I’m Asian, I’m a minority. They don’t consider that.”
The Glass Ceiling ItselfThe Asian and Pacific Islander focus group partic-ipants agreed that there is a glass ceiling but saw itas much lower for other groups. Although theyconsider themselves more assimilated and accept-
ed, they recognize that they experience difficultyreaching the top levels of management. OlderAsian and Pacific Islander Americans in the focus
groups are resigned to look to the future, believ-ing that if they do not rise above the ceiling, theirchildren and their children’s children will.
Younger participants expressed greater frustrationat their inability to crack the glass ceiling. Theysee it as a challenge. At present they feel that theimage of a non white CEO, even one who is anAsian and Pacific Islander American, does notappeal to Corporate America or the Americanpublic, but they are confident that their talent willbe recognized and eventually rewarded.
“You can put it this way. I see the ceiling and I tried [to shatter] it once, twice, a third time.I give up . . . I reach the ceiling, I can see it, Ican do it . . . You keep bumping it.”
“. . . You haven’t seen a CEO of a large corporation that’s Asian. Most of them may be senior vice president or some of these otherrankings. But when you get higher, you fit theimage better if you have a white person incharge of that. It appeals to a lot more people.Socially, it’s more acceptable to have a corporation headed by a white male.”
“If you compete with the same level
[of Caucasians] as a minority, then you havea disadvantage. . . You’ll still be held back; leftbehind. If you’re extremely ingenious or create something, you could reach the top. There is a chance.”
Glass Ceiling Impact on Jobs and CareersAsian and Pacific Islander Americans expressedthe opinion that corporate culture is a white-maleculture that values aggression and socializing overhard work and merit. They feel that admittance tothe top levels of corporate culture requires learn-ing how to work within the dominant white-maleculture. They want to do this without sacrificingtheir principles.
“I notice that a guy who is the highest rankingAsian in my company behaves like a typicalwhite officer. Sometimes a little bit nasty, veryaggressive, outspoken. I can see that’s how hegot to that level. . . .He’s very demanding atmeetings. Maybe that’s how he fits into thatupper management.”
“I had a superior who was a typical white. He was getting upset at me because I never getupset. . . .When I had my review. . .he gave mea low rating. . . . He said that the reason wasbecause, ‘You don’t get upset with your staff.You don’t reprimand them.’ I said, ‘Excuse me.I talk to them, but I don’t scream at them.’”
“I was told, ‘Hey, you’re going to have to step
on people. You may not like it, but. . .’ I said,‘That’s not my nature.’ My Asian mentor toldme, ‘After these many years, you’re going tohave to do what the white man says or you’renot going to be successful.’”
What are the Stereotypes About Asian and Pacific IslanderAmericans? Glass Ceiling Commission studies, testimony presented at the Commission’s Public Hearings,and CEO interviews consistently identify stereo-types, along with prejudice and bias, as a majorbarrier to job advancement.
Despite the fact that, prior to 1965, immigrationlaws singled out Asians for exclusion based onrace, today they are perceived as the kind ofminority/immigrant group others should emulate. Asian and Pacific Islander Americansand immigrants alike are perceived as intelligent/hard-working/ highly educated/ occupational success-ful/ patient/ polite/ non-confrontational/ non-violent/law-abiding/ politically passive/ culturally resourceful/detail-oriented/ and good at science, engineering, andtechnology. These generalized perceptions haveenabled Asian and Pacific Islander Americans togain initial entrance to Corporate America.
However, these same stereotypes do turn negative. Asian and Pacific Islander Americans arealso perceived as passive/ unassertive/ indirect/ moreequipped for technical than people-oriented work/ and
104

therefore not leadership material. As Shattering theGlass Ceiling—a 1992 report of the Organization ofChinese Americans—states that the fields of sci-ence and engineering,
“ . . . are thought not to depend as much onspeaking and writing skills as do other disciplines. . . [Acceptance of this belief]can and has hardened into a stereotype forChinese Americans in all walks of life. They arepictured as being excellent workers. but are notequipped to step into positions that require communication skills—such as management.”
The negativity of stereotypes was addressed by atestifier at the Commission’s Public Hearing inCleveland, Ohio. The speaker, who had describedherself as speaking,
“from the perspective of the Asian Americanand the problems that they face when sooner or later many of them will hit a barrier which has come to be known as the glass ceiling” she declared, “ . . . there is still notenough awareness and still a lot of negativestereotypes.”
Asian and Pacific Islander women are perceived
as content with the status quo/ inflexible/ lacking interpersonal skills and political savvy. They are oftenalso confronted with the dual stereotypes of theobedient and motherly figure or the exotic and fragile“China Doll.” Co-workers do not consider Asianwomen to be threats to their jobs, but neither dothey consider them to be tough enough to begroomed for leadership.
THE REALITY CHECK: 105

Perceptions and Stereotypes -Versus the Facts
The Basic Facts• The Asian and Pacific Islander American population doubled between 1980 and 1990 when the
Bureau of the Census reported 7.3 million Asian and Pacific Islander Americans. It is the third largest minority after African Americans and Hispanic Americans.
• Sixty percent of Asian and Pacific Islander Americans were born outside the United States.• The Asian and Pacific Islander American population is projected to total 9.9 million by the year
2000 and it will represent 4 percent of the U.S. population.• In 1990, the Bureau of the Census reported the total population by national origin groups as
follows: Chinese 23%; Filipino 19%; Japanese 11%; Asian Indian 11%; Korean 11%; Vietnamese 8%. The remaining population represents 21 other categories of other Asian and Pacific Islander Americans.Islander American population was concentrated in five states—California, New York, Hawaii, Texas, and Illinois.
Asian and Pacific Islander Americans as Managers• The corporate sector is a major area of employment for Asian and Pacific Islander Americans.• Asian and Pacific Islander Americans are seriously underrepresented in private sector
management.• Asian and Pacific Islander Americans have been found to earn less than non-Hispanic whites in
comparable circumstances when factors such as age or educational level are controlled for.• According to the 1990 Census, all Asian and Pacific Islander Americans 25 years of age and over
have earned at least a bachelor’s degree and 14 percent had a graduate or professional degree.• In 1993, Asian and Pacific Islander Americans represented a 94-billion-dollar consumer market
according to the Asian and Pacific Islander Center for Census Information and Services.
The Participation of Asian and Pacific Islander Americans in Corporate America 106

Asian and Pacific Islander
Americans as a whole are above the
national average in terms of
educational achievement at both the
high school and college levels.
Preparedness: —Are Asian and Pacific Islander Americans Prepared for Management?
The profile of those Asian and Pacific IslanderAmericans who are positioned to become corporate managers presents a picture of one ofthe most educationally prepared groups in thelabor force. Asian culture emphasizes the impor-tance of higher education as a reward for securedeconomic status.
Data from the 1990 Census shows that Asian andPacific Islander Americans as a whole are above thenational average in terms of educational achieve-ment at both the high school and college levels.
• Seventy-eight percent of Asian and Pacific Islander Americans in the workforce who are 25 years and older had completed high school, compared to 75 percent of the total population 25 years and older who had completed high school.
• A comparison of college completion is more striking: 20 percent of the general population has graduated with a bachelor’s degree or higher, whereas almost twice that proportion—38 percent—of Asian and Pacific Islander Americans have earned bachelor’s degrees.
• Two-thirds to three-fourths of the highly educated Asian and Pacific Islander American population are foreign-educated or immigrants who initially came to the
U.S. as foreign students.
According to the Asian and Pacific IslanderCenter for Census Information and Services, highuniversity and college enrollment among Asianand Pacific Islander Americans is attributable notonly to their population growth but also to theirhigh rates of academic preparedness. Once admit-ted to college, they tend to do well and have rela-tively low dropout rates. Persistence and perfor-mance are reflected in their high representationat subsequent educational levels. Although Asianand Pacific Islander American women continue tolag behind men in rates of post graduate educa-tion, women contributed significantly to theincrease in the overall representation of Asian andPacific Islander Americans in higher education.
The most impressive gains made by Asian andPacific Islander Americans were at the bachelor’sand master’s levels where the number of degreesawarded more than doubled between 1979 and1989. While the rate of gain for doctorates issomewhat lower according to the National Centerfor Educational Statistics, the 46 percent increasein doctorates earned during this period by Asianand Pacific Islander Americans puts them aheadof all other groups, including whites.
A less encouraging picture emerges when educational attainment is disaggregated by 107

TABLE 7NATIONAL ASIAN & PACIFIC ISLANDER AMERICAN EXECUTIVES, ADMINISTRATORS, ANDMANAGERS OF PRIVATE-FOR-PROFIT COMPANIES BY ETHNICITY, EDUCATIONAL ATTAINMENT, AND SEX, 1990
Total with Exe/Admin/Mgr Exec/Admin/MgrBachelor's Degree with Bachelor's Degree % of Total
Ethnicity Male Female Male Female Male FemaleTotal API Population 506,811 571,925 44,175 23,397 8.7 4.1Chinese 124,622 138,199 9,925 7,382 8.0 5.3Filipino 109,125 182,696 5,736 6,082 5.3 3.3Japanese 82,885 80,828 15,262 3,835 18.4 4.7Asian Indian 71,255 64,232 5,587 2,429 7.8 3.8Korean 52,075 58,028 4,475 2,045 8.6 3.5Vietnamese 27,729 16,502 496 495 1.8 3.0Hawaiian 5,263 4,574 414 266 8.0 5.8Other Southeast Asian 11,203 8,564 566 246 5.1 2.9Other API 22,704 17,302 1,714 617 7.5 3.6
Total with Exe/Admin/Mgr with Exec/Admin/MgrMaster’s/Prof. Degree Master’s/Prof. Degree % of Total
Ethnicity Male Female Male Female Male FemaleTotal API Population 321,164 197,481 26,043 7,627 8.1 3.9Chinese 105,297 65,033 7,935 3,102 7.5 4.8Filipino 29,422 34,471 1,475 1,198 5.0 3.5Japanese 33,028 22,164 3,608 844 10.9 3,8Asian Indian 87,718 41,863 8,882 1,430 10.1 3.4Korean 32,309 16,749 1,660 527 5.1 3.1Vietnamese 8,792 3,707 439 158 5.0 4.3Hawaiian 1,596 1,595 114 38 7.1 2.4Other Southeast Asian 5,645 3,735 347 31 6.1 0.8Other API 17,357 8,173 1,583 299 9.1 3.7
Source: 1990 Bureau of the Census, PUMS File; 95% Confidence IntervalCopyright 1994 Asian/Pacific Islander Data Consortium, ACCIS San Francisco, CA
• The total API population with college degrees is 1,597,381. Nationally, 77 percent of the total API population has less than a Bachelors’. The API males with a Bachelor’s who are Executives/Administrators/Managers nearly doubles the female population in the same occupational category (This only represents, BS/MA/MS of professional degrees. This excludes Doctorates and Associate college degrees.
108

Compared to other racial and ethnic
groups, Asian and Pacific Islander
Americans viewed as a group are
likely to be overrepresented in the
sciences.
national origin group. It is then that the dispari-ties become evident. For example,
• The Asian Indian American population is the most educated—21 percent of the Asian Indian American population hold master’s or other professional degrees according to the National Center for Educational Statistics.
• The Asian and Pacific Islander Center for Census Information and Services also reports that the educational achievement of Hawaiians is the lowest of these groups—only 7 percent have completed a bachelor’s degree. Other Southeast Asians, Filipino and Vietnamese show only slightly better rates of college enrollment or completion.
There are also striking disparities among Asianand Pacific Islander American male and femaleexecutives, administrators, and managers holdingbachelor’s, master’s, and professional degrees. Overall, Asian and Pacific Islander men are twiceas likely as Asian and Pacific Islander women tohold those degrees.
Placement and Opportunity:—Where are Asian and Pacific Islanders
Americans in Corporate America?—What Opportunities are Available to Them?
Overall Table 8 shows the number and percentageof APIs in the top four industries. Asian and Pacific Islander Americans are concentrated inretail trade, finance, professional and related ser-vices, and manufacturing.
Compared to other racial and ethnic groups,Asian and Pacific Islander Americans viewed as a group are likely to be overrepresented in thesciences, with very little difference between thosewho are native- or foreign-born. Ever since WorldWar II Asian and Pacific Islander American scientists and engineers—native-born and foreign-born—have been a dominant and growing minority in scientific and technical fields, especially through the 1970s, when high-technology research and development fueled thegrowth of the aerospace and defense industries.The 1965 Immigration Law creates the occupationcategory which enables America to recruit highlyskilled and professional workers such as thosefrom Asia to help develop these fast growingindustries.
It is striking, then, to learn from glass ceilingresearch that American-born Asian and Pacific 109

TABLE 8ASIAN & PACIFIC ISLANDER AMERICAN EXECUTIVES, ADMINISTRATORS, AND MANAGERS OF PRIVATE-FOR-PROFIT COMPANIES: TOP FOUR INDUSTRIES, 1990(Number and percent of total API male/female working-age population (16 years and over) with specified degree)
Male Populationwith Bachelor’s Degrees with Master’s Degrees
1. Manufacturing (n = 12,019; 27.2%) 1. Manufacturing (n = 9,210; 35.4%)
2. Finance, Insurance, and Real Estate 2. Finance, Insurance, and Real Estate (n = 6,562; 14.9%) (n = 3,618; 13.9%)
3. Retail Trade (n = 6,209; 14.1%) 3. Professional and Related Services (n = 2,643; 10.1%)
4. Other Industries (n = 5,461; 12.4%) 4. Retail Trade (n = 2,395; 9.2%)
Female Populationwith Bachelor’s Degrees with Master’s Degrees
1. Professional and Related Services 1. Professional and Related Services (n = 4,959; 21.2%) (n = 1,936; 25.4%)
2. Finance, Insurance, and Real Estate 2. Finance, Insurance, and Real Estate (n = 4,917; 21.0%) (n = 1,620; 21.2%)
3. Manufacturing (n = 3,626; 15.5%) 3. Manufacturing (n = 1,603; 21.0%)
4. Retail Trade (n = 2,698; 11.5%) 4. Wholesale Trade (n = 614; 8.1%)
Source: 1990 Bureau of the Census, PUMS File; 95% Confidence IntervalCopy Right 1994 Asian/Pacific Islander Data Consortium, San Francisco, CA.
110

Islanders are more likely than foreign-bornCaucasians to be in the lower echelons of theengineering profession. While formal schoolingand technical training are crucial credentials thatgive minorities access to high-paying professions,these qualifications do not produce upward mobility in Asian and Pacific Islander Americanengineers and other professionals. In fact, Asianand Pacific Islander American men are well represented as professionals in the workforce, but they are underrepresented in executive-managerial positions. Similarly, Asian and PacificIslander American women, despite their mobilityinto professional jobs, are even less likely thanAsian and Pacific Islander American men to berepresented as executives or as managers. Table 9 is based on Asian and Pacific IslanderAmerican Executives, Administrators, andManagers of Private-for-Profit Companies byEthnicity, Educational Attainment, and Sex.
Glass Ceiling Commission research shows thatAsian and Pacific Islander American professionalsare held in high regard in private employmentand in employment with state, local, and federalgovernment agencies. And yet, the same researchshows that those same professionals—the categoryof workers from which most managers come—are not selected to become members of manage-ment teams. Stereotypes of Asian and PacificIslander Americans as being better suited for technical work rather than people-oriented work has surfaced as a major reason why they are
not considered leadership material. They and aregrossly underrepresented in authority positionscompared to whites.
This attitude concerning leadership potential isalso reflected in the small number of Asians whoserve on the boards of directors of the major corporations. The 1992 Heidrick and Strugglesstudy of 806 of the public Fortune companiesrevealed that Asian and Pacific Islander Americanwomen held less than one one-hundredth of onepercent of the seats and Asian and Pacific IslanderAmerican men held less than two-tenths of onepercent of the seats.
Compensation:—How are Asian and Pacific Islander Americans Compensated?
The socioeconomic status of the various Asian andPacific Islander Americans national origin groupsdiffers markedly. Many of the misconceptionsregarding favorable economic status of Asian andPacific Islander Americans are fed by statisticaldata that is not disaggregated by national origingroup, age, or gender, and does not adjust for thegeographical concentration of these populationsin metropolitan areas of New York and Californiawhere wages and salaries, along with the cost ofliving, tend to be far higher than the rest of thenation.
However, even without such adjustments, the lowpromotion rates of Asian and Pacific Islander
111

earnings. Even with English fluency and U.S. citizenship and comparable or even higher levelsof education, the average annual earnings ofAsian and Pacific Islander Americans continue to be lower than their white counterparts in thesame occupations. According to some findingsstill emerging from an analysis of the NationalScience Foundation surveys, they are less likely tobe in managerial jobs than African Americans andHispanic Americans, and when promoted to middle- or upper-levels of management, are more likely to receive lower economic returnscompared to whites occupying similar positions,even though they are also likely to be more qualified in terms of education and work experi-ence. (While the data in the National ScienceFoundation surveys suggest that the pattern ofblocked upward mobility is most apparent in corporations, Woo’s glass ceiling paper entitled,Barrier to Work Place Advancement Experienced byAsian Americans finds evidence of the same phe-nomenon in other areas, such as law, journalism,government, and academia.)
Glass Ceiling research finds that despite higherlevels of formal education than other groups,Asian and Pacific Islander Americans receive alower yield in terms of income or promotions.Some research has even suggested that foreign-born Asian and Pacific Islander Americans experi-ence increasingly lower returns despite more yearsof education than their white counterparts and
that their returns often decrease as education andage increase. Although this phenomenon is some-times attributed to language difficulties of foreign-born Asian and Pacific Islander Americans,research indicates that foreign-born whites faceno such blocked mobility. This suggests the exis-tence of racial barriers or the possibility thatEuropean employees with English-language diffi-culties are treated differently than are those whoimmigrated from Asia or the Pacific Islands.
IN SUM112

TABLE 9NATIONAL ASIAN & PACIFIC ISLANDER AMERICAN POPULATION EXECUTIVES, ADMINISTRATORS,AND MANAGERS OF PRIVATE-FOR-PROFIT COMPANIES. NUMBER OF CASES, BY ETHNICITY,EDUCATIONAL ATTAINMENT, AND SEX, 1990
Educational AttainmentEthnicity/Sex Total BA/BS BA/BS MA/MS DoctoralTotal API Population 180,232Chinese 49,600 20,484 16,310 10,564 2,242
Male 11,855 9,502 7,666 1,97Female 8,629 6,808 2,898 264
Filipino 27,215 13,290 11.428 2,493 85Male 6,930 5,507 1,426 49Female 6,279 5,921 1,067 36
Japanese 39,500 16,046 18,685 4,369 410Male 9,678 14,927 3,566 382Female 6,468 3,748 793 28
Asian Indian 25,446 6,412 7,450 9,947 1,637Male 4,208 5,305 8,689 1,505Female 2,204 2,145 1,258 132
Korean 16,275 8,019 6,091 1,918 247Male 4,511 4,218 1,533 223Female 3,508 1,873 385 24
Vietnamese 5,649 4,135 942 559 13Male 2,429 460 416 13Female 1,706 482 143 0
Hawaiian 5,046 4,219 675 152 0Male 1,888 409 114 0Female 2,331 266 38 0
Other Southeast Asian 2,968 1,838 768 339 23Male 1,069 542 326 23Female 769 226 13 0
Other API 8,533 4,320 2.221 1,791 201Male 2,665 1,659 1,505 201Female 1,655 562 286 0
Source: 1990 Bureau of the Census, PUMS File; 95% Confidence IntervalCopy Right 1994 Asian/Pacific Islander Data Consortium, ACCIS San Francisco, CA
• Four levels of education are defined by the table columns. The Asian Indians represent the most educated of the API Exec/Adm/Mgr subgroups with the lowest percentage of Exec/Adm/Mgr with less than a BA/BS, and the highest percentage with a MS/MA, and Doctoral degree.
113

TABLE 10NATIONAL FOREIGN BORN ASIAN & PACIFIC ISLANDER AMERICAN POPULATION EXECUTIVES,ADMINISTRATORS, AND MANAGERS OF PRIVATE-FOR-PROFIT COMPANIES. NUMBER OF CASES,BY ETHNICITY, EDUCATIONAL ATTAINMENT, AND SEX
Educational AttainmentEthnicity/Sex Total BA/BS BA/BS MA/MS/Prof DoctoralTotal API Population 133,628Chinese 38,998 16,610 11,325 9,020 2,043
Male 9,637 6,948 6,759 1,852Female 6,973 4,377 2,261 191
Filipino 20,267 8,298 9,757 2,163 49Male 4,322 4,662 1,202 49Female 3,976 5,095 961 0
Japanese 19,106 6,007 10,357 2,506 236Male 4,101 9,439 2,205 208Female 1,903 918 301 28
Asian Indian 24,635 6,085 7,210 9,742 1,598Male 4,035 5,269 8,503 1,466Female 2,050 1,941 1,236 132
Korean 15,027 7,527 5,517 1,760 223Male 4,373 3,936 1,408 223Female 3,154 1,581 352 0
Vietnamese 5,510 4,100 838 559 13Male 2,394 460 416 13Female 1,706 378 143 0
Hawaiian 251 206 25 20 0Male 24 25 20 0Female 182 0 0 0
Other Southeast Asian 2,918 1,788 768 339 23Male 1,052 542 326 23Female 736 226 13 0
Other API 6,916 3,476 1,730 1,566 144Male 2,240 1,449 1,380 144Female 1,236 281 186 0
Source: Bureau of the Census 1990 Census PUMS File 95% Confidence IntervalCopy Right 1994 Asian/Pacific Islander Data Consortium, ACCIS San Francisco, CA
114

The major barriers to the advancement of Asianand Pacific Islander Americans into decisionmak-ing management positions in business are these:
• Widespread acceptance of the popular stereotype that Asian and Pacific Islander Americans are not affected by the glass ceiling
• Widespread acceptance of the stereotype that Asian and Pacific Islander Americans make superior professionals and technicians but are not suited for management leadership
• Benign neglect and ignorance of the complexity, needs, and difference among Asian and Pacific Islander groups
• Lack of disaggregated data to use in tracking the progress of the diverse Asian and Pacific Islander groups
• Lack of a better understanding by other Americans of the experiences of foreign and U. S. born Asian and Pacific Islander Americans.
The loss of Asian and Pacific Islander Americantalent that business incurs because of the glassceiling is hard to measure overall. Corporationsreport that some of the loss has been to overseasenterprises in a reverse brain drain. Other Asianand Pacific Islander American professionals, feeling blocked by the glass ceiling, have left largefirms—particularly in the electronics industry—to become independent entrepreneurs. It is in
such small businesses that these Asian and PacificIslander Americans—trained in white-owned companies—become CEOs and competitors withtheir former employers. (In 1990 the AsianAmerican Manufacturers Association reportedthat there are more than 200 Asian American-owned high-tech companies in the San FranciscoBay Area alone.) Data from the Natural SocialScientists and Engineers show both Asian andPacific Islander Americans and White Non-Hispanics are self-employed at 6 percent each.Such consequences of reverse brain drain andentrepreneurship is indicative, in the sense of theunequal opportunities Asian and Pacific IslanderAmericans feel they are encountering in America.
115

TABLE 11NATIONAL ASIAN & PACIFIC ISLANDER AMERICAN POPULATION EXECUTIVES, ADMINISTRATORS,AND MANAGERS OF PRIVATE-FOR-PROFIT COMPANIES. MEAN SALARY INCOME IN 1989 BYETHNICITY, EDUCATIONAL ATTAINMENT, AND SEX (in dollars)
Educational AttainmentEthnicity/Sex Total BA/BS BA/BS MA/MS DoctoralTotal API Population $39,045Chinese 37,473 $25,667 $36,268 $55,239 $70,396
Male 28,672 42,257 58,852 70,667Female 21,538 29,306 45,683 68,364
Filipino 29,766 $23,903 $33,543 $42,062 $72,464Male 25,952 39,189 50,167 81,563Female 21,642 28,293 31,231 60,080
Japanese 51,682 $36,532 $61,840 $64,890 $80,447Male 41,800 69,587 70,442 85,371Female 26,249 30,965 39,924 13,268
Asian Indian 45,709 $22,013 $39,531 $59,327 $83,895Male 24,776 45,309 63,368 88,677Female 16,738 25,242 31,421 29,371
Korean 32,002 $22,713 $37,553 $46,801 $81,783Male 25,115 42,781 51,570 88,540Female 19,625 25,779 27,815 19,000
Vietnamese 28,476 $23,265 $34,560 $55,810 $70,000Male 26,426 44,503 63,294 70,000Female 18,763 25,071 34,041 0
Hawaiian 27,914 $26,362 $30,941 $57,535 $ 0Male 29,591 35,929 43,292 0Female 23,748 34,272 100,263 0
Other Southeast Asian 25,813 $22,746 $26,283 $37,802 $78,500Male 25,975 26,960 36,677 78,500Female 18,257 24,659 66,000 0
Other API 31,012 $22,688 $37,626 $41,772 $40,943Male 24,092 40,328 44,637 40,943Female 20,427 29,650 26,696 0
Source: Bureau of the Census 1990 Census PUMS File 95% Confidence IntervalCopy Right 1994 Asian/Pacific Islander Data Consortium, ACCIS San Francisco, CA
• The Chinese, Japanese, and Asian Indian and Korean populations are the groups that are able to attain higher levels of education with high-end incomes ($75,000 plus).
116

TABLE 12NATIONAL U.S. BORN ASIAN & PACIFIC ISLANDER AMERICAN POPULATION EXECUTIVES,ADMINISTRATORS, AND MANAGERS OF PRIVATE-FOR-PROFIT COMPANIES. MEAN SALARY INCOMEIN 1989 BY ETHNICITY, EDUCATIONAL ATTAINMENT, AND SEX (in dollars)
Educational AttainmentEthnicity/Sex Total BA/BS BA/BS MA/MS DoctoralTotal API Population $35,338Chinese 38,806 $30,850 $36,132 $ 63,793 $66,809
Male 35,072 41,506 69,553 78,992Female 25,194 30,487 55,590 45,781
Filipino 26,759 $24,472 $30,370 $ 38,861 $60,080Male 27,883 38,129 40,614 0Female 20,611 22,433 36,157 60,080
Japanese 39,113 $31,249 $44,067 $ 55,336 $83,020Male 34,867 51,611 62,967 83,020Female 26,910 29,410 34,228 0
Asian Indian 28,813 $11,743 $19,762 $ 58,356 $72,345Male 10,540 6,500 65,329 72,345Female 13,094 22,103 350 0
Korean 34,991 $24,160 $31,714 $ 83,050 $19,000Male 32,377 36,333 96,591 0Female 20,957 27,253 31,758 19,000
Vietnamese 25,424 $15,612 $28,726 $ 0 $ 0Male 15,612 0 0 0Female 0 28,726 0 0
Hawaiian 27,938 $26,471 $30,074 $ 62,010 $ 0Male 29,644 34,786 46,546 0Female 23,720 23,272 100,263 0
Other Southeast Asian 3,310 $3,310 $ 0 $ 0 $ 0Male 2,500 0 0 0Female 3,727 0 0 0
Other API 29,162 $25031 $32,873 $ 35,952 $31,579Male 27,112 37,878 38,000 31,579Female 22,919 29,155 33,392 0
Source: Bureau of the Census 1990 Census PUMS File 95% Confidence IntervalCopy Right 1994 Asian/Pacific Islander Data Consortium, ACCIS San Francisco, CA
• Japanese and Asian Indians U.S. born populations have smaller incomes than their foreign-born counterparts. The mean income in 1989 for foreign-born API Exec/Adm/Mgr of private-for-profit corporations exceed that of their foreign-born counterparts ($40,338 compared to $35,338).
117

TABLE 13NATIONAL FOREIGN BORN ASIAN & PACIFIC ISLANDER AMERICAN POPULATION EXECUTIVES, ADMINISTRATORS, AND MANAGERS OF PRIVATE-FOR-PROFIT COMPANIES. MEAN SALARY INCOMEIN 1989 BY ETHNICITY, EDUCATIONAL ATTAINMENT, AND SEX (in dollars)
Educational AttainmentEthnicity/Sex Total BA/BS BA/BS MA/MS/Prof DoctoralTotal API Population $40,338Chinese 37,111 $24,458 $36,328 $53,775 $70,746
Male 27,199 41,165 57,416 70,101Female 20,670 28,650 42,892 76,995
Filipino 30,798 $23,566 $34,087 $42,551 $81,563Male 24,787 39,381 51,947 81,563Female 22,239 29,243 30,798 0
Japanese 65,099 $42,689 $76,131 $71,954 $78,549Male 51,048 80,057 75,055 87,337Female 24,664 35,759 49,234 13,268
Asian Indian 46,265 $22,565 $40,189 $59,348 $84,177Male 25,386 45,574 63,325 89,112Female 17,011 25,572 31,974 29,371
Korean 31,754 $22,619 $38,160 $43,547 $88,540Male 24,886 43,243 47,573 88,540Female 19,475 25,506 27,445 0
Vietnamese 28,556 $23,330 $35,284 $55,810 $70,000Male 26,584 44,503 63,294 70,000Female 18,763 24,066 34,041 0
Hawaiian 27,456 $24,243 $53,500 $28,000 $ 0Male 25,500 53,500 28,000 0Female 24,077 0 0 0
Other Southeast Asian 26,198 $23,289 $26,283 $37,802 $78,500Male 26,354 26,960 36,677 78,500Female 18,908 24,066 66,000 0
Other API 31,444 $22,119 $38,975 $42,608 $44,650Male 23,518 40,687 45,238 44,650Female 19,583 30,146 23,095 0
Source: Bureau of the Census 1990 Census PUMS File 95% Confidence IntervalCopy Right 1994 Asian/Pacific Islander Data Consortium, ACCIS San Francisco, CA
• Tables 13 and 14 illustrate that Japanese and Asian Indian foreign born Exec/Adm/Mgr of private-for-profit corporations have a larger mean income than their U.S. born counterparts (Table 13). However, compared to the white male Exec/Adm/Mgr’s mean income of $50,052, all the foreign born Exec/Adm/Mgr except for the Japanese make less than white males.
118

TABLE 14NATIONAL U.S. BORN ASIAN & PACIFIC ISLANDER AMERICAN EXECUTIVES, ADMINISTRATORS, ANDMANAGERS OF PRIVATE-FOR-PROFIT COMPANIES. NUMBER OF CASES BY ETHNICITY,EDUCATIONAL ATTAINMENT, AND SEX
Educational AttainmentEthnicity/Sex Total BA/BS BA/BS MA/MS/Prof DoctoralTotal API Population 46,604Chinese 10,602 3,874 4,985 1,544 199
Male 2,218 2,554 907 126Female 1,656 2,431 637 73
Filipino 6,948 4,911 1,671 330 36Male 3,608 845 224 0Female 2,303 826 106 36
Japanese 20,394 10,039 8,328 1,853 174Male 5,474 5,498 1,361 174Female 4,565 2,830 492 0
Asian Indian 811 327 240 205 39Male 173 36 183 30Female 154 204 22 0
Korean 1,248 492 574 158 24Male 138 282 125 0Female 354 292 33 24
Vietnamese 139 35 104 0 0Male 35 0 0 0Female 0 104 0 0
Hawaiian 4,795 4,013 650 132 0Male 1,864 384 94 0Female 2,149 266 38 0
Other Southeast Asian 50 50 0 0 0Male 17 0 0 0Female 33 0 0 0
Other API 1,617 844 491 255 57Male 425 210 125 57Female 419 281 100 0
Source: Bureau of the Census 1990 Census PUMS File 95% Confidence IntervalCopy Right 1994 Asian/Pacific Islander Data Consortium, ACCIS San Francisco, CA
119

GENERAL BACKGROUND
The Hispanic American population in the UnitedStates (23 million in 1992) is an ethnic group dif-ferentiated by national origin and by time and circumstance of entry into the United States. 1990 Census data show that it is geographicallyconcentrated in 14 metropolitan areas of fivestates—California, Texas, New York, Florida, and Illinois. The national Hispanic communitycomprises more than 20 national origin groupsthat vary significantly from one another. To portray Latinos as a homogeneous ethnic group is misleading. For example, the predominantgroups in the Latino community, i.e., MexicanAmericans (13.3 million), Puerto Ricans (2.6 million), and Cuban Americans (1.0 million) aregeographically concentrated in different regionsof the nation. As a consequence, the experienceof Cuban American refugees in south Florida versus Puerto Ricans in New York or MexicanAmericans in south Texas are differentiated by historical factors, education, economic oppor-tunities, sociocultural differences of the localareas, and level of bilingualism as well as by race. Hispanics are the living Rainbow Coalition,Caucasian, African American, Asian, Indian, and
the possible combinations of the above. In thisreport, the term minority male includes whiteHispanic males and the terms Hispanic and Latino are used interchangeably.
The next section shows how dramatically the views of CEOs and the views of Hispanic malesand females differ on glass ceiling issues. CEOsexpress the conviction that the inclusion ofHispanics at all levels is a bottom-line issue.Hispanics perceive a cap on how far they areallowed to go. Research reveals negative stereotypes of both Hispanic men and women—images that can undermine how supervisors judge the leadership potential of Hispanics.
THE PERCEPTIONS
How CEOs Perceive The Glass Ceilingand Hispanic AmericansEven though most of the CEOs interviewed werein states with high concentrations of HispanicAmericans, almost all interpreted “minorities” solely as African Americans. In fact, only two ofthe non-minority CEOs mentioned Hispanicswithout being reminded of the existence ofminority groups other than African Americans.120
Hispanics are the living Rainbow
Coalition, Caucasian, African
American, Asian, Indian, and the
possible combinations of the above.
“THE TWO-WAY MIRROR” HISPANIC AMERICANS

CEOs were very clear that the
changing national demographics
and the need to compete in the global
market required that they have
Hispanics at all levels of their
organizations.
Being both a woman and a Hispanic
in Corporate America meant carrying
a double burden because of resistance
to them first as Hispanics and then
as women.
When reminded that the glass ceiling affectedgroups other than African Americans, CEOs were very clear that the changing national demo-graphics and the need to compete in the globalmarket required that they have Hispanics at alllevels of their organizations. Several believed thatthere is only a small pool of U.S.-born Hispanicswith the credentials that are required to move up the career ladders. They were especially concerned that they could not find many U.S.-born Hispanics who are literate in English andSpanish.
“In order to do business you have to relate to the people who can give you business. . . . A business that has to sell in a pluralistic environment has a lot to gain if it can cover the waterfront.”
“We are in advertising. We influence, we sell.We can’t sell if we can’t influence and we can’t influence if we don’t understand our consumers. We need all points of view withinour shop.”
“I am desperate to find Hispanics who areSpanish literate. It is so important that I am sending Anglos to school to learn to speakSpanish.”
“We need people who can relate in LatinAmerica. I find that I have to hire foreign
nationals. Isn’t anybody teaching our Hispanickids Spanish?”
How Hispanic Women Perceive the Glass Ceiling The information in this section is drawn fromrecords of 1993 and 1994 Aspen Institute Seminarson Hispanic Americans and the Business Community.
The Hispanic women executives who participatedagreed that being both a woman and a Hispanicin Corporate America meant carrying a doubleburden because of resistance to them first asHispanics and then as women. They found it particularly difficult to build mentoring relation-ships with non-Hispanics who could guide theircareer advancement and they perceived that theirnon-Hispanic white supervisors focused more onoutward signs of difference than on competence.Two of their comments illustrate these points of view:
“The vice-president sought me out and told methat he was going to take charge of my career. l was delighted. Six months later he transferredacross the country, did not take me along, andnever looked back. I was left high and dry.”
“I have all the credentials and I have beenassigned the job of writing copy in Englishwhich they run with no corrections. However, instaff reviews they always mention that I speak 121

Most of these Hispanic
executive men believe that their
advancement requires total
assimilation and acculturation to the
Anglo culture and style.
with an accent. When I ask them if they havedifficulty understanding me, they say, ‘No, butyou know how it is upstairs. Accents make themnervous. Why don’t you work harder to get ridof it?’ You should hear this [deleted] when hetries to speak Spanish to our customers.”
Other Hispanic women explained that they feltadrift in a sea of insensitivity where white peersand superiors didn’t know how to identify withthem or treat them.
“They keep telling me that I am not consideredPuerto Rican because I am so like them—‘notlike the others.’ That offends me. Then when itcomes time for promotion and I’m in line, I’mtold that I didn’t get it because there isn’t roomnow for another Latin woman. So what am I?”
“There are minority jobs and that’s not right.But then, when something opens up in thatarea they put in a Black. That is what they consider to be a minority. So I’m not a minorityand I am not white. Where do Mexicanasbelong?”
“I’ve watched and I have seen that they do notalways hire or promote the best of us. SometimesI think they just put us in to fill the quotas.They have decided just how far they intend tolet us go on the day they hire us.”
How Hispanic Men Perceive the Glass Ceiling
“Glass is nice; you can see through it. But the glass ceiling, it’s like a two-way mirror.”
Hispanic participants in the minority executivemale focus groups assembled by the Glass CeilingCommission characterized the glass ceiling as“opaque.” Hispanics believe that the glass ceilingis keeping them from moving beyond a certainlevel and they feel that they are always beingwatched and judged.
The “Minority” LabelLike African Americans, American Indians, andAsian and Pacific Islander Americans, Hispanicmen considered the term “minority” manipulativeand part of a deliberate attempt to slow themdown or relegate them to a lower position. Theyconsider themselves as having accomplished“heroic” efforts to advance in the corporate world,particularly in light of the unfair hiring andadvancement practices to which they feel theyhave been subjected. Most of these Hispanic exec-utive men believe that their advancement requirestotal assimilation and acculturation to the Angloculture and style. Some feel that they are not play-ing on a level field even when they do accept allthe Anglo norms. Two comments sum up howstrongly the participants felt that the minoritylabel restricts their options.122

“. . .instead of watching us shine the
bottom of your glass ceiling as if it
were your $200 shoes, open the
opportunity up and let these people of
color play in your sandbox.”
“I consider it like they always felt you’re aminority. Your education goes just so far.”
“. . . and we can go to the country club, butwe’re still the caddie.”
The Ceiling ItselfWhen asked if there is a glass ceiling, Hispanicmen stated:
“There’s a glass ceiling. And whether you wantto accept it or not, there is a glass ceiling, guys.”
“We are not allowed to pass it but to keep bumping into it.”
“. . .there is a level to which the majority willallow minorities to proceed up the ladder. Onceyou hit that level, you are not going to go any further.”
Glass Ceiling Impact on Jobs and CareersThese are some of the comments Hispanic menmade about the impact of the glass ceiling ontheir careers and on their employers—
“. . . though management refuses to acknowledge that such an issue exists, the lower strata of the workforce is well aware ofhow difficult the advancement in the workforcecan be.”
“. . . a person should be hired or promoted byhis/her ability to do said work. Yet, people arepromoted more by their skin than their ability.”
What are the Stereotypes About Hispanic Americans?In a 1994 survey of middle-level managers conducted by The Hispanic Policy DevelopmentProject middle-level white corporate supervisorsadmitted off the record that they are not comfortable with what they perceive as Hispanicdifference or what they expect will be different even whennothing is immediately evident. Hispanics interviewedin the same study who had “made it” into the decisionmaking ranks attribute the dearth ofLatino peers to the widespread stereotyping andbias that shuts Latinos out. They say it requiresthem to pass ever more stringent tests to whichtheir white peers are not subjected. It shunts themto the side “even when they accept the mainstreamnorms and play by white male corporate rules.”
A compilation of the Hispanic stereotypes report-ed in the research papers contracted by the GlassCeiling Commission (Mauricio Gastón Institute,and Hispanic Policy Development Project) revealsthat Hispanics in general are lumped togetherand widely perceived as being poor/uneducated/and recently arrived in the United States. During a1994 focus group held at the Aspen Institute that included Hispanics and high-level Anglo corporate managers, the Anglo managers said 123

124
that they often heard that many Hispanic maleswere chauvinist/ domineering/ arrogant/ prone to violence/ unwilling to learn English/ not patriotictoward the U.S./ and heavy drinkers and drug userswho don’t want to work. Hispanic PolicyDevelopment Project research reveals that anexception is often made for Cubans who are perceived positively as brave exiles from communism.Otherwise Cubans are frequently perceived negatively as an overly aggressive group that has“taken over Miami.”
The same Commission sources cited above showthat Hispanic women, Latinas, are frequently seenas strong and stoic/ self-sacrificing/ tied to family and
community/ under the domination of husbands andfathers/ passive/ overly emotional and educationallydeficient.
Although the stereotypes applied to Hispanic menand women differ, they all have a negative impacton Hispanics as potential candidates for corporateleadership.

THE REALITY CHECK:Perceptions and Stereotypes -Versus the Facts
The Basic Facts• The Hispanic population grew 53 percent between 1980 and 1990 according to U.S. Census
figures. The increase to 22.4 million is attributable almost equally to the birth rate and to immigration.
• In 1990 Hispanics represented 7.9 percent of the labor force—9.9 million workers according to the Bureau of Labor Statistics.
• The work ethic of Hispanics is very strong. Adult Hispanic men have the highest rate of labor force participation in the nation. Census data show that the labor force participation rates of Hispanic men and women in 1990 was 78.2 percent and 52 percent respectively compared to non-Hispanic men (74 percent) and non-Hispanic women (57 percent). In addition, U.S. Department of Education statistics show that male Hispanic high school students work more hours while attending school than any other group of male students.
• Most Hispanics are not recent arrivals. Census data reveal that two-thirds of the Hispanics were born in the United States. The group with the highest percentage of those born in the U.S. is of Mexican heritage.
• Hispanics do want to learn English. Calvin Veltman’s 1988 study on language shift shows that Hispanic immigrants are learning English at the same rate as other immigrants of the same socioeconomic level.
• All Hispanics are not poor. The 1990 Census reported that 48.2 percent of Hispanic households made over $25,000 per year.
Hispanics as Managers1990 Census data reveal that the percentage of Hispanics who are managers and administrators is farbelow the percentage of non-Hispanic whites who are managers and administrators.
• Non-Hispanic white Americans 43.0 %• Mexican Americans 6.0 %• Puerto Ricans 8.0 %• Cuban Americans 7.5 %• All Other Hispanic Americans 7.5 %
In 1993, Hispanics represented a $175 billion consumer market according to the Bureau of LaborStatistics, Consumer Expenditure Survey.
125
The Participation of Hispanic Americans in Corporate America Preparedness:
—Are Hispanic Americans Prepared for Management?
Education has become an increasingly importantfactor for advancement in the private sector.Graduate degrees have evolved from helpful assets to important prerequisites to advancementand promotion. Secondary school dropout ratesare high and directly limit the size of the pool ofpotential Hispanic American managers as doesthe number of immigrants who arrive do with lit-tle education. Nonetheless, the number of Latinosattending and completing college is steadilyincreasing as is the percentage of college gradu-ates who go on to earn post graduate degrees.
• U.S. Census data show that in 1980, 7.7 percent of Hispanics 25 years of age and older had completed four or more years of college. By 1990 that figure had increased to 10 percent. In 1990 the percentage of non-Hispanics who had completed four or more years of college had risen to 21 percent. The proportion of Hispanics with four years of college continues to lag behind the general population.
• In 1990 according to U.S. Census data, only 370,000 Hispanic men and women 18 years of age or older had earned the advanced degrees that are now considered a prereq-
uisite for climbing the corporate ladder. • A January 1994 Hispanic Business magazine
survey of Hispanic senior executives in Fortune 1000 companies revealed that 60 percent of the respondents held advanced degrees—23 percent had MBAs, 12 percent had law degrees, 18 percent had master’s degrees (other than MBAs), and 7 percent had earned Ph.D.s.
Placement and Opportunity:—Where are Hispanic Americans in Corporate America?—What Opportunities are Available to Them?
Although the number of Hispanics earning thedegrees that business looks for has steadilyincreased, it does not represent a large pool.Hispanics continue to be relatively invisible in corporate decisionmaking positions, in partbecause Hispanic managers and administratorsare more frequently employed in government and the nonprofit sector than in the for-profit sector.
The paucity of Hispanics in corporate decision-making jobs may also stem from the fact thatwhen they do enter the private sector they areclustered in staff jobs that lack career mobility and lack access to development programs with tailored leadership training and mentoring.
In 1990 only 370,000 Hispanic men
and women 18 years of age or older
had earned the advanced degrees that
are now considered a prerequisite for
climbing the corporate ladder.
126

• Commission research by the Mauricio Gastón Institute, Hispanic Policy Development Project, and with focus groups indicates that Hispanic men and women in the private sector are clustered in staff jobs in community relations, human resources, public affairs, corporate giving, and philanthropy. These positions provide minimal access to the influential sponsors who can place managers on the track to high responsibility and high-salaried positions.
• A 1994 Hispanic Policy Development Project study indicated that one of the barriers that blocked the advancement of Hispanics is lack of mentoring. A number of white non-Hispanic middle-managers who were interviewed by the Hispanic Policy Development Project for a report that has yet to be released, stated in confidence that they are reluctant to mentor when they perceive that they will have to overcome cultural barriers. The comments of Hispanic employees who were interviewed reflect this reality. They reported that they sense that the white managers don’t want to mentor them.
Tables 15 and 16 (following) show the size of theHispanic adult labor force by major national ori-gin group and how Hispanic managers at all man-agement levels are distributed across the
for-profit industrial sectors. The numbers inparentheses in Table 16 represent the percentageof managers who are Hispanic. For example:
• Mexican Americans comprise only 4.9 percent of the retail trade managers nationwide. Hispanic representation in other industries surveyed falls below that of the retail industry.
• Puerto Ricans nationwide account for .7 percent of the managers in the manufacturing industry.
• Cubans nationwide account for .11 percent of the managers in the transportation industry although they represent .2 percent of the adult working-age population.
The 1994 Hispanic Business survey of the Fortune1000 companies identified 169 Hispanic seniorexecutives (vice-president or above) employed in95 major corporations. Another 174 companiesreported that they have no Hispanic senior executives and the remainder did not reply. The profile of the 169 Hispanic senior executivesshows:
• Forty-four percent of the senior executives worked in the Consumer, Finance and Food and Beverage sectors. An additional forty percent were in high tech, publishing and media, telephone and utilities, and the service sectors
• The 23 women senior executives represented every industry except energy, food and beverage, and industrial
127

Just as the advancement of women
into senior positions in business has
led to the appointment of more women
to corporate boards of directors, so the
advancement of Hispanics into senior
level positions has resulted in an
increase in the number of Hispanics
appointed to boards of directors.
• Eighty-six percent of the Hispanic senior executives were male
• Over 40 percent had been in their companies 16 years or more
Though the number of Hispanic senior managerscontinues to be small, it has increased over the last15 years. The majority of the senior managersreported in Hispanic Business hold line positions,frequently in the international divisions of theircompanies where their bilingual/bicultural skillsare considered assets. (It is interesting to note thatthere is a history of strong opposition to Spanishbilingualism in the nation as evidenced by EnglishOnly movements. The High School and BeyondLongitudinal Study of the U.S. Department ofEducation reveals that only 4 percent of Hispanichigh school students take three years of Spanish—the minimum for literacy even among nativespeakers—thereby failing to develop a valuable potential business asset.)
Just as the advancement of women into seniorpositions in business has led to the appointmentof more women to corporate boards of directors,so the advancement of Hispanics into senior levelpositions has resulted in an increase in the number of Hispanics appointed to boards ofdirectors. In 1995, fifty-one Hispanics served onthe boards of seventy-four of the Fortune 1000corporations—41 men and ten women. Hispanic
Business reports that this is a net increase of eightindividuals from the previous year.
Compensation:—How are Hispanic Americans Being Compensated?
Income is the fundamental indicator of socioeconomic status in the United States. A broad-brush look at U.S. Census data on thepercentage of families in Hispanic national origingroups with annual earnings above $30,000 compared to non-Hispanics paints the followingpicture:
• Mexican and Mexican Americans 31%• Puerto Ricans 23%• Cubans 40%• All Other Hispanic Groups 40%• All Non-Hispanics 53%
The income differentials between non-Hispanicsand Hispanics indicate that Mexican Americansand Puerto Ricans lag much farther behind non-Hispanics than do Cubans and Other Hispanics.The following tables, prepared by the TomásRivera Center, show substantial differences in theincome of all managers by gender, by industry,and by national-origin group. Because data is notdisaggregated by level of management, there is noway to know if the remarkable differentials resultfrom varying level of management or disparatecompensation for comparable responsibility.128

(Tables below show group distribution of Hispanics by region and by national origin based on data fromthe 1990 Census. Hispanics in these industries are clustered in manufacturing and retail with the exception of Cubans in Florida and Puerto Rican women in New York. These groups are heavily represented in the finance and professional sectors. The wholesale, transportation, and business industries do not have significant numbers of Hispanic managers.)
TABLE 15HISPANIC ADULT EMPLOYED POPULATION, BY SUBGROUP IN U.S., 1990
(% of Subgroup)
HispanicSubgroup All Persons U.S.-Born Foreign-Born
Mexican American 13,393,208 8,933,371 (66.7) 4,459,837 (33.4)
Puerto Rican 2,651,815 2,618,963 (98.8) 32,852 (1.2)
Cuban 1,053,197 298,481 (28.3) 754,716 (71.7)
Other Hispanic 4,801,869 2,207,624 (46.0) 2,594,245 (54.0)
Source: 1990 Bureau of the Census, PUMS File; 95% Confidence Interval
Compiled by the Tomás Rivera Center Research staff
129

TABLE 16DISTRIBUTION AND REPRESENTATION OF PRIVATE SECTOR EXECUTIVE, ADMINISTRATIVE, AND MANAGERIAL OCCUPATIONS IN THE U.S. BY INDUSTRY, HISPANIC SUBGROUP, AND GENDER
(PERCENTAGES ARE FOR INDUSTRY)
Industry/Gender Mexican American Puerto Rican Cuban Other Hispanic White TotalManufacturing
Male 112 ( .9) 21 (.2) 9 (.1) 50 (.4) 12,413 (98.5) 12,605Female 55 (1.7) 17 (.5) 5 (.2) 25 (.8) 3,170 (96.9) 3,272
TransportationMale 50 (1.3) 7 (.2) 4 (.8) 15 (.4) 3,724 (98.0) 3,799Female 24 (1.7) 5 (.4) 4 (.3) 12 (.9) 1,374 (96.8) 1,419
WholesaleMale 24 (1.0) 1 (.0) 6 (.3) 11 (.5) 2,366 (98.3) 2,408Female 17 (1.9) 4 (.4) 2 (.2) 5 (.6) 884 (96.9) 912
RetailMale 120 (2.1) 11 (.2) 3 (.1) 33 (.6) 5,548 (97.1) 5,715Female 113 (2.8) 8 (.2) 3 (.1) 18 (.5) 3,865 (96.59) 4,007
BusinessMale 53 (1.6) 8 (.3) 3 (.1) 20 (.6) 3,172 (97.4) 3,256Female 21 (1.4) 3 (.2) 5 (.3) 11 (.7) 1,459 (97.3) 1,499
FinanceMale 65 (1.4) 16 (.2) 6 (.1) 22 (.6) 4,531 (97.7) 4,640Female 95 (2.2) 15 (.4) 3 (.1) 19 (.4) 4,126 (96.9) 4,258
ProfessionalMale 47 (1.0) 10 (.2) 5 (.1) 27 (.6) 4,548 (98.1) 4,637Female 112 (1.3) 19 (.3) 6 (.1) 29 (.5) 5,951 (97.1) 6,127
TotalMale 471 (1.3) 74 (.2) 36 (.1) 178 (.5) 36,403 (98.0) 37,162Female 447 (2.1) 71 (.3) 30 (.1) 119 (.6) 20,829 (96.9) 21,496
Source: 1990 Bureau of the Census, Public Use Microdata (5%) Sample; 95% Confidence IntervalCompiled by Tomás Rivera Center Research Staff
• Each row illustrates the distribution of male and female managers in a particular industry. For instance, a sampling of five percent of U.S. households identified 112 Mexican American men and 55 Mexican American women occupying managerial occupations in the manufacturing industry nationwide. The same sample identified 12,413 white non-Hispanic men and 3,170 non-Hispanic women occupying managerial occupations in manufacturing industry in the U.S. The percentages in parenthesis reflect the representation for those groups included in the Table.
130

IN SUM
Public hearings, glass ceiling research, and privateresearch indicate that the major barriers to theadvancement of Hispanic Americans in the privatesector are these:
• The small size of the pool of Hispanic American men and women who have gained the credentials that are now considered prerequisites for senior management.
• Business recruitment practices that overlook or do not identify Hispanic Americans who have the necessary credentials.
• Entry level discrimination which steers Hispanics into staff as opposed to line positions and holds them there.
• A tendency to consider potential Hispanic recruits in terms of the Spanish-speaking markets. (This tendency discriminates against the 5 million Hispanic Americans 18 years of age and over who do not speak Spanish at all or do not speak it well.)
• Insensitivity to cultural differences.• Stereotyping and discomfort with cultural
differences that cause white middle-level and upper-level managers to be reluctant to mentor and promote Hispanic men and women.
• The lack of a large pool of Hispanic mentors for new Hispanic recruits.
• Isolation from the informal communication networks.
• A lack of assignments that provide visibility and interaction with senior managers.
131

TABLE 17aCOMPARISON OF THE MEAN WAGE INCOME OF MEXICAN AMERICAN AND WHITE MANAGERS BY STATE, PRIVATE-FOR-PROFIT INDUSTRY, GENDER, AND HISPANIC SUBGROUP
(MEAN WAGE in dollars)
California California Texas Texas Illinois IllinoisIndustry/Gender Mexican White Mexican White Mexican White
American American AmericanManufacturing
Male $41,456 $58,666 $30,821 $56,616 $49,998 $64,223Female 26,296 31,662 23,449 29,883 29,849 33,500
TransportationMale 33,353 50,677 30,948 51,716 34,295 51,486Female 32,791 32,933 24,926 31,968 37,671 32,471
WholesaleMale 41,967 58,283 32,871 57,216 33,657 60,450Female 25,686 29,125 18,037 28,340 ——- 30,425
RetailMale 24,213 36,439 19,740 37,700 32,346 39,743Female 15,527 18,461 13,150 20,188 17,802 20,184
BusinessMale 27,998 45,468 21,809 44,327 28,750 50,946Female 24,725 29,037 18,783 26,772 24,743 32,221
FinanceMale 36,894 59,240 32,061 55,769 40,200 67,531Female 23,332 29,467 19,940 23,860 28,218 30,712
ProfessionalMale 32,180 51,024 32,769 50,841 28,605 52,795Female 22,357 26,773 19,029 24,294 27,976 28,028
Source: 1990 Bureau of the Census, Public Use Microdata (5%) Sample; 95% Confidence IntervalCompiled by Tomás Rivera Center Research Staff
The number of cases used to determine mean wages is in some instances as few as one. Sample sizes from a 5 percent file are expectedly small. Data is provided for all cases regardless of sample size.
• Tables 17a, 17b, and 17c illustrate the significant wage differentials that exist by state, industry, and gender. In California, Mexican American men earn approximately $17,210 less than white non-Hispanic males. Mexican American women earn $32,370 less, and white non-Hispanic women earn $27,400 less than white men in the same industry. The wage income of white males is consistently higher than Hispanic men and women regardless of state, Hispanic subgroup, and industry.
132

TABLE 17bCOMPARISON OF THE MEAN WAGE INCOME OF PUERTO RICAN AND WHITE MANAGERS BY STATE, PRIVATE-FOR-PROFIT INDUSTRY, AND GENDER
(MEAN WAGE in dollars)
New York New York Illinois IllinoisIndustry/Gender Puerto Rican White Puerto Rican White
ManufacturingMale $45,853 $62,403 $25,300 $64,223Female 31,448 37,160 21,333 33,500
TransportationMale 35,096 55,671 33,000 51,486Female 31,857 36,081 36,500 32,471
WholesaleMale 37,654 67,696 80,000* 60,450Female 16,000 36,998 ——- 30,425
RetailMale 27,837 40,820 24,667 39,743Female 18,403 22,942 24,721 20,184
BusinessMale 70,257* 54,503 29,000 50,946Female 29,330 37,628 23,000 32,221
FinanceMale 40,368 70,000 13,800 67,531Female 29,268 37,704 10,000 30,712
ProfessionalMale 35,375 52,340 29,000 52,795Female 24,826 30,931 19,443 28,028
Source: 1990 Bureau of the Census, Public Use Microdata (5%) Sample; 95% Confidence IntervalCompiled by Tomás Rivera Center Research Staff
*The number of cases used to determine mean wages is in some instances as few as one. Sample sizes from a 5 percent file are expectedly small. Data is provided for all cases regardless of sample size.
133

TABLE 17cCOMPARISON OF THE MEAN WAGE INCOME OF CUBAN, OTHER HISPANIC, AND WHITE MANAGERS BY STATE, PRIVATE-FOR-PROFIT INDUSTRY, AND GENDER
(MEAN WAGE in dollars)
California California Florida FloridaIndustry/Gender Other White Cuban White
HispanicManufacturing
Male $54,301 $58,666 $42,047 $53,659Female 27,773 31,662 21,345 27,317
TransportationMale 34,176 50,677 43,761 48,063Female 32,513 32,933 27,193 29,833
WholesaleMale 50,920 58,283 45,496 53,186Female 40,980 29,125 22,808 28,160
RetailMale 24,749 36,439 32,187 36,950Female 22,125 18,461 17,405 20,064
BusinessMale 45,418 45,468 32,380 40,164Female 21,049 29,037 16,980 25,645
FinanceMale 62,528* 59,240 29,644 50,489Female 28,497 29,467 30,500* 25,672
ProfessionalMale 41,111 51,024 54,045* 47,585Female 26,250 26,773 45,201* 24,858
Source: 1990 Bureau of the Census, Public Use Microdata (5%) Sample; 95% Confidence IntervalCompiled by Tomás Rivera Center Research Staff
*The number of cases used to determine mean wages is in some instances as few as one. Sample sizes from a 5 percent file are expectedly small. Data is provided for all cases regardless of sample size.
134

TABLE 18aCOMPARISON OF THE MEAN WAGE INCOME OF MEXICAN AMERICAN AND WHITE EXECUTIVE, ADMINISTRATIVE, AND MANAGERIAL POPULATIONS, IN SELECTED PRIVATE-FOR-PROFIT INDUSTRIES BY GENDER AND STATE1
California California Illinois Illinois Texas TexasMexican White Mexican White Mexican White
Industry/Gender American American AmericanManufacturing
Male 23.8 34.1 22.9 35.1 16.7 32.0Female 12.5 15.2 13.9 16.9 8.0 12.8
TransportationMale 10.6 10.2 15.7 9.2 11.0 12.2Female 5.4 6.6 9.2 7.1 7.1 7.7
WholesaleMale 5.1 6.5 10.0 7.3 6.0 7.5Female 3.9 4.2 4.3 3.6 5.2
RetailMale 25.5 15.2 28.6 13.7 34.3 14.0Female 25.4 18.6 23.1 18.9 30.7 17.9
BusinessMale 11.3 8.7 5.7 8.5 12.6 10.3Female 4.3 7.0 7.7 6.9 5.8 7.4
FinanceMale 13.8 12.7 7.1 12.2 7.8 12.9Female 21.3 19.8 15.4 18.3 16.7 21.7
ProfessionalMale 9.9 12.5 10.0 11.7 11.6 11.1Female 27.2 28.6 30.8 27.6 28.3 27.3
Source: 1990 Bureau of the Census, Public Use Microdata (5%) Sample; 95% Confidence IntervalCompiled by Tomás Rivera Center Research Staff
*The number of cases used to determine mean-wages is in some instances as few as one. Sample sizes from a 5 percent filee are expectedly small. Data is provided for all cases regardless of sample size.
• Tables 18a, 18b, and 18c illustrate comparisons on a state-by-state basis by industry, gender, and ethnicity of the within group distribution for managerial occupations. Each column illustrates the within group distribution for a particular industry, etc. Thus, 23.8 percent of Mexican American men in California who hold managerial occupations work in the manufacturing industry; as opposed to 34.1 percent of white non-Hispanic males. Also in California, 27.2 percent of Mexican American women who hold managerial occupations work in the professional industries; as opposed to 28.6 percent of white non-Hispanic women.
1Comparisons made in states with large populations of Hispanic subgroups. Percentage are of total male and female Hispanic subgroupmanagerial population.
135

TABLE 18bCOMPARISON OF PERCENTAGE OF PUERTO RICAN AND WHITE EXECUTIVE,ADMINISTRATIVE, AND MANAGERIAL POPULATIONS, IN SELECTED PRIVATE-FOR-PROFIT INDUSTRIES BY GENDER AND STATE1
New York New York Illinois IllinoisIndustry/Gender Puerto Rican White Puerto Rican White
ManufacturingMale 15.6 30.9 35.3 35.1Female 15.0 16.8 7.1 16.9
TransportationMale 10.2 9.3 11.7 9.2Female 9.7 5.8 35.3 7.1
WholesaleMale 5.5 6.8 5.9 7.3Female 1.8 4.6 7.1 4.3
RetailMale 15.6 14.4 17.6 13.7Female 10.5 13.8 14.3 18.9
BusinessMale 4.7 8.4 5.9 8.5Female 8.8 8.9 7.1 6.9
FinanceMale 30.5 16.7 5.9 12.2Female 23.77 20.4 21.4 18.3
ProfessionalMale 18.0 13.6 17.7 11.7Female 30.7 29.8 42.9 27.6
Source: 1990 Bureau of the Census, Public Use Microdata (5%) Sample; 95% Confidence IntervalCompiled by Tomás Rivera Center Research Staff
1Comparisons made in states with large populations of Hispanic subgroups. Percentages are of total male and female Hispanic subgroupmanagerial population.
136

TABLE 18cCOMPARISON OF PERCENTAGE OF CUBAN, OTHER HISPANIC, AND WHITE EXECUTIVE, ADMINISTRATIVE, AND MANAGERIAL POPULATIONS, IN SELECTED PRIVATE-FOR-PROFIT INDUSTRIES BY GENDER AND STATE1
California California Florida FloridaIndustry/Gender Other White Cuban White
HispanicManufacturing
Male 27.9 34.1 14.5 24.3Female 21.0 15.2 15.4 10.7
TransportationMale 8.4 10.2 11.8 12.3Female 10.1 6.6 13.5 7.0
WholesaleMale 6.2 6.5 18.4 7.2Female 4.2 4.2 9.6 4.2
RetailMale 19.0 15.2 17.1 19.2Female 15.1 18.6 11.5 19.1
BusinessMale 11.2 8.7 7.9 10.3Female 9.2 7.0 15.4 7.0
FinanceMale 12.3 12.7 15.8 15.2Female 16.0 19.8 23.1 23.2
ProfessionalMale 15.1 12.5 14.5 11.6Female 24.4 28.6 11.5 28.8
Source: 1990 Bureau of the Census, Public Use Microdata (5%) Sample; 95% Confidence IntervalCompiled by Tomás Rivera Center Research Staff
1Comparisons made in states with large populations of Hispanic subgroups. Percentages are of total male and female Hispanic subgroupmanagerial population.
137

TABLE 19aCOMPARISON OF MEXICAN AMERICAN AND WHITE EXECUTIVE, ADMINISTRATIVE, AND MANAGERIAL POPULATIONS, IN SELECTED PRIVATE-FOR-PROFIT INDUSTRIES BYGENDER AND STATE
(% OF STATE TOTAL)
California California Mexican White Texas TexasIndustry/Gender Mexican White American Mexican White
American AmericanManufacturing
Male .9 94.9 .4 95.9 3.3 92.1Female 1.6 91.6 1.0 92.7 5.2 88.2
TransportationMale 1.3 93.0 1.1 91.5 5.5 89.7Female 1.5 88.1 1.5 87.5 7.5 84.8
WholesaleMale 1.0 93.6 .9 96.5 5.0 91.0Female 1.8 91.2 94.7 5.8 88.7
RetailMale 1.9 88.2 1.4 91.4 12.7 76.7Female 2.6 88.8 1.4 90.7 12.3 75.9
BusinessMale 1.6 92.8 .5 94.4 7.2 87.0Female 1.2 92.1 1.3 90.6 6.6 87.7
FinanceMale 1.3 92.7 .4 95.8 3.8 92.0Female 2.1 90.5 1.0 91.2 6.4 87.4
ProfessionalMale 9.4 91.4 .6 92.4 6.2 87.2Female 1.8 89.1 1.3 86.9 8.1 82.6
Source: 1990 Bureau of the Census, Public Use Microdata (5%) Sample; 95% Confidence IntervalCompiled by Tomás Rivera Center Research Staff
• Tables 19a, 19b, and 19c illustrate the within state representation of Hispanic subgroups and white non-Hispanics. Thus, in California, Mexican American males hold .9 percent of all the managerial, while white non-Hispanic males hold 94.9 percent. Combined, the two groups hold 95.8 percent of the managerial occupations in the state industry.
138

139
TABLE 19bCOMPARISON OF PUERTO RICAN AND WHITE EXECUTIVE, ADMINISTRATIVE, AND MANAGERIALPOPULATIONS, IN SELECTED PRIVATE-FOR-PROFIT INDUSTRIES BY GENDER AND STATE
(% OF STATE TOTAL)
New York New York Illinois IllinoisIndustry/Gender Puerto Rican White Puerto Rican White
ManufacturingMale .4 94.7 .2 95.9Female 1.1 89.0 .1 92.7
TransportationMale .9 90.7 .2 91.5Female 1.9 81.0 87.5
WholesaleMale .7 95.7 .1 96.5Female .5 91.4 .4 94.7
RetailMale .9 90.6 .2 91.4Female 1.0 90.7 .2 90.7
BusinessMale .5 90.7 .1 94.4Female 1.3 90.3 .3 90.6
FinanceMale 1.4 85.6 .1 95.8Female 1.4 86.2 .3 91.2
ProfessionalMale 1.1 90.0 .2 92.4Female 1.3 86.9 .4 86.9
Source: 1990 Bureau of the Census, Public Use Microdata (5%) Sample; 95% Confidence IntervalCompiled by Tomás Rivera Center Research Staff
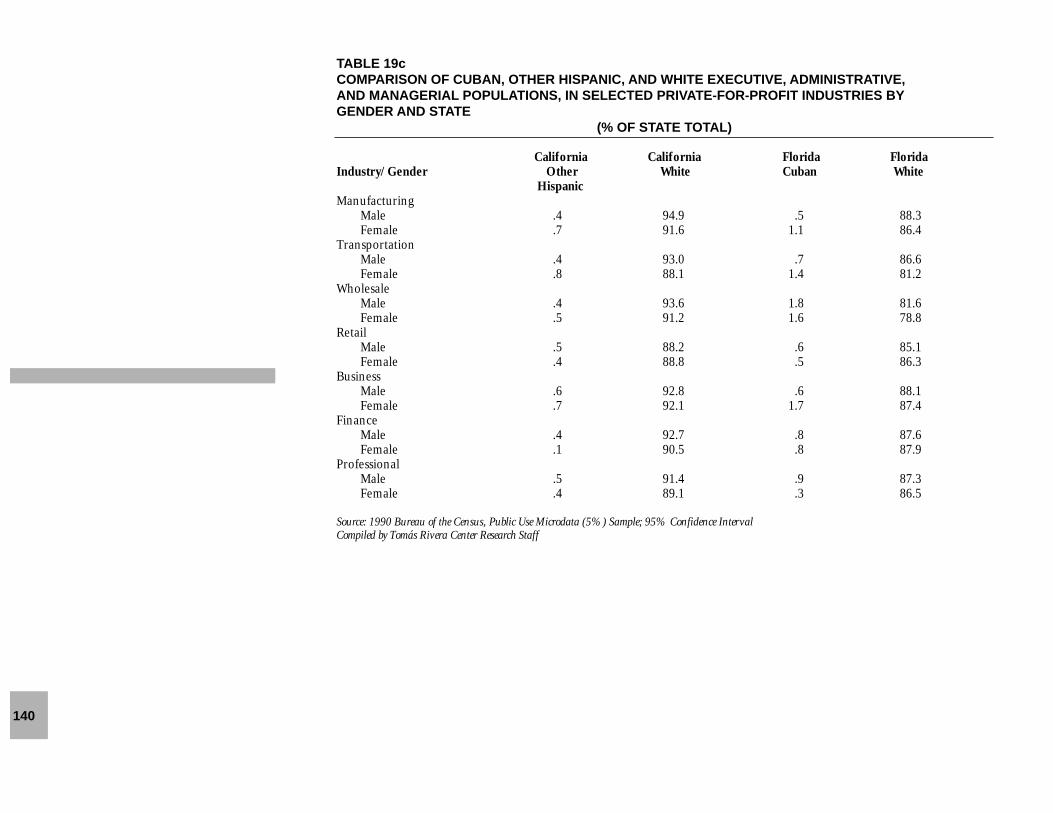
TABLE 19cCOMPARISON OF CUBAN, OTHER HISPANIC, AND WHITE EXECUTIVE, ADMINISTRATIVE, AND MANAGERIAL POPULATIONS, IN SELECTED PRIVATE-FOR-PROFIT INDUSTRIES BYGENDER AND STATE
(% OF STATE TOTAL)
California California Florida FloridaIndustry/Gender Other White Cuban White
HispanicManufacturing
Male .4 94.9 .5 88.3Female .7 91.6 1.1 86.4
TransportationMale .4 93.0 .7 86.6Female .8 88.1 1.4 81.2
WholesaleMale .4 93.6 1.8 81.6Female .5 91.2 1.6 78.8
RetailMale .5 88.2 .6 85.1Female .4 88.8 .5 86.3
BusinessMale .6 92.8 .6 88.1Female .7 92.1 1.7 87.4
FinanceMale .4 92.7 .8 87.6Female .1 90.5 .8 87.9
ProfessionalMale .5 91.4 .9 87.3Female .4 89.1 .3 86.5
Source: 1990 Bureau of the Census, Public Use Microdata (5%) Sample; 95% Confidence IntervalCompiled by Tomás Rivera Center Research Staff
140

TABLE 20HISPANIC* AND WHITE NON-HISPANIC MEAN WAGE INCOME BY AGE AND EDUCATION, IN SELECTEDPRIVATE-FOR-PROFIT INDUSTRIES IN THE U.S.
(in dollars)
Ethnicity/Age/Education Manufacturing Transportation Utilities Wholesale
Hispanic/25-34Some College $30,679 $28,550 ** $34,075College 36,788 33,770 ** **Post College 60,394 ** ** **
White Non-Hispanic/25-34Some College $32,933 $32,680 $28,665 $31,399College 42,171 41,464 42,400 42,575Post College 53,036 52,388 57,124 52,811
Hispanic/35-44Some College $32,258 $38,442 ** $34,080College 54,171 51,743 ** **Post College 79,722 ** ** **
White Non-Hispanic/35-44Some College $42,684 $43,776 $43,884 $42,116College 59,587 55,067 55,261 61,511Post College 70,449 65,430 65,198 72,095
Hispanic/45-54Some College $51,688 $44,714 ** $35,800College 63,438 ** ** **Post College 48,800 ** ** **
White Non-Hispanic/45-54Some College $52,710 $47,058 $43,745 $56,694College 72,730 67,218 72,087 84,301Post College 87,981 84,477 85,869 **
*Includes Native-born Mexican, Puerto Rican, Cuban, and Other Hispanic Subgroups.**Cells with less than 5 cases are not included in the table. (Note: Small sample sizes increase the effects of standard error. The mean wages of Hispanics in this sample, in many cases, represent the reported wages for as few as ten cases due to the size of the sample and therelatively low number of Hispanics in managerial occupations.)Post College means graduate degree or professional degree completed.
Source: 1990 Bureau of the Census, Public Use Microdata (5%) Sample; 95% Confidence IntervalCompiled by Tomás Rivera Center Research Staff
141

CON’T—TABLE 20HISPANIC* AND WHITE NON-HISPANIC MEAN WAGE INCOME BY AGE AND EDUCATION, IN SELECTEDPRIVATE-FOR-PROFIT INDUSTRIES IN THE U.S.
(in dollars)
Ethnicity/Age/Education Retail Business Finance Insurance ProfessionalHispanic/25-34
Some College $20,490 $23,002 $25,478 ** $20,784College 30,069 38,448 26,417 ** 26,029Post College ** ** ** ** 38,080
White Non-Hispanic/25-34Some College $23,805 $27,747 $28,458 $29,449 $23,424College 30,612 37,029 38,391 36,004 31,533Post College 37,280 38,785 62,301 ** 36,974
Hispanic/35-44Some College $37,928 $30,289 $35,773 ** $22,747College 38,750 46,289 54,231 ** 34,848Post College ** ** 83,205 ** 38,552
White Non-Hispanic/35-44Some College $32,204 $37,623 $37,199 $39,016 $28,879College 45,979 54,121 60,318 61,259 42,314Post College 65,549 67,729 84,879 74,629 51,530
Hispanic/45-54Some College $32,181 $33,262 $55,414 ** $29,949College ** ** ** ** 39,800Post College ** ** ** ** 41,725
White Non-Hispanic/45-54Some College $35,562 $42,917 $40,570 $50,293 $32,123College 59,649 65,426 70,984 73,640 47,910Post College ** ** ** ** **
*Includes Native-born Mexican, Puerto Rican, Cuban, and Other Hispanic Subgroups.**Cells with less than 5 cases are not included in the table. (Note: Small sample sizes increase the effects of standard error. The mean wagesof Hispanics in this sample, in many cases, represent the reported wages for as few as ten cases due to the size of the sample and the relative-ly low number of Hispanics in managerial occupations.Post College means graduate degree or professional degree completed.
Source: 1990 Bureau of the Census, Public Use Microdata (5%) Sample; 95% Confidence IntervalCompiled by Tomás Rivera Center Research Staff
142
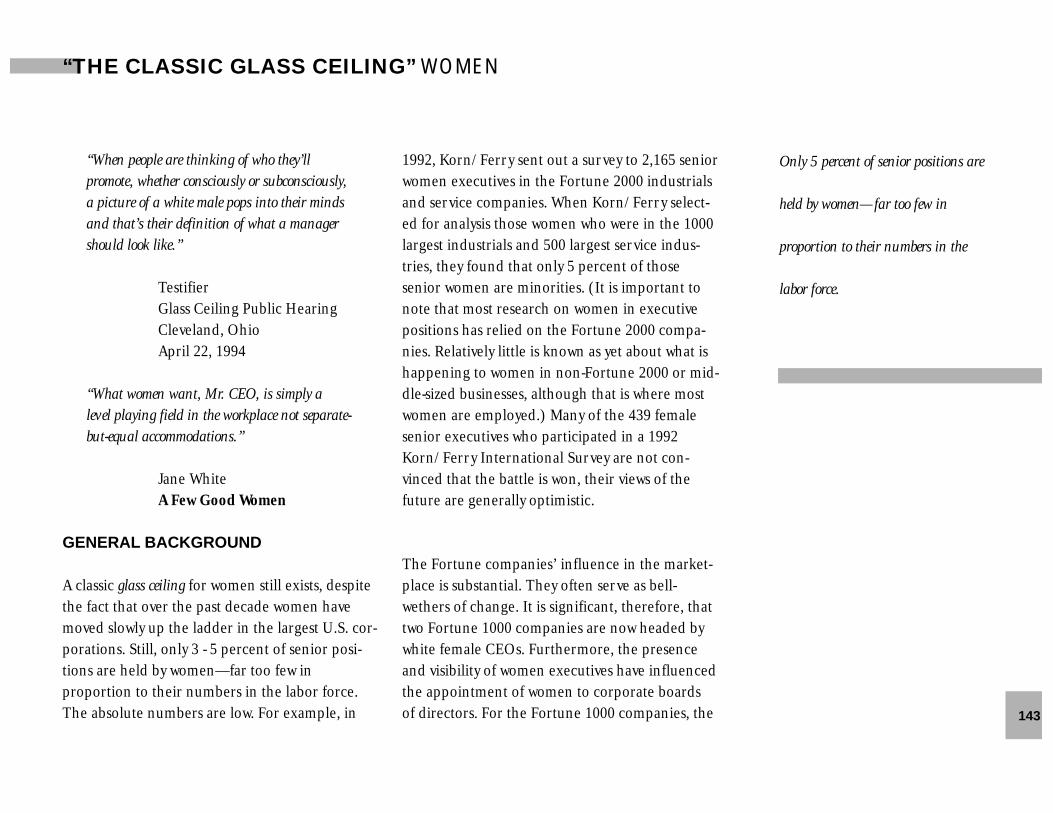
143
“When people are thinking of who they’ll promote, whether consciously or subconsciously,a picture of a white male pops into their mindsand that’s their definition of what a managershould look like.”
TestifierGlass Ceiling Public HearingCleveland, OhioApril 22, 1994
“What women want, Mr. CEO, is simply a level playing field in the workplace not separate-but-equal accommodations.”
Jane WhiteA Few Good Women
GENERAL BACKGROUND
A classic glass ceiling for women still exists, despitethe fact that over the past decade women havemoved slowly up the ladder in the largest U.S. cor-porations. Still, only 3 - 5 percent of senior posi-tions are held by women—far too few in proportion to their numbers in the labor force.The absolute numbers are low. For example, in
1992, Korn/Ferry sent out a survey to 2,165 seniorwomen executives in the Fortune 2000 industrialsand service companies. When Korn/Ferry select-ed for analysis those women who were in the 1000largest industrials and 500 largest service indus-tries, they found that only 5 percent of thosesenior women are minorities. (It is important tonote that most research on women in executivepositions has relied on the Fortune 2000 compa-nies. Relatively little is known as yet about what ishappening to women in non-Fortune 2000 or mid-dle-sized businesses, although that is where mostwomen are employed.) Many of the 439 femalesenior executives who participated in a 1992Korn/Ferry International Survey are not con-vinced that the battle is won, their views of thefuture are generally optimistic.
The Fortune companies’ influence in the market-place is substantial. They often serve as bell-wethers of change. It is significant, therefore, thattwo Fortune 1000 companies are now headed bywhite female CEOs. Furthermore, the presenceand visibility of women executives have influenced the appointment of women to corporate boards of directors. For the Fortune 1000 companies, the
Only 5 percent of senior positions are
held by women—far too few in
proportion to their numbers in the
labor force.
“THE CLASSIC GLASS CEILING” WOMEN
number of directorships (board seats) held bywomen increased 13 percent from 1993 to 1994(731 to 814). The number of women serving onboards increased by 14 percent from 1993 to 1994(500 to 570). According to a 1994 Catalyst surveywomen occupied only 6.9 percent of the seats oncorporate boards of directors-—up from 6.2 per-cent in 1993. Half of the Fortune 500 IndustrialService companies have at least one female boardmember. Approximately half of the 70 newwomen on boards have never before served on aFortune 500/Service 500 board. Sixty- four compa-nies that had no women on their boards in 1993now have at least one female director. Each of theten most profitable Fortune 500 companies has atleast one female director and five have two.
A 1992 Heidrick & Struggles report, Minorities andWomen on Corporate Boards, based on a survey of806 public Fortune companies, showed that whitewomen held 5.3 percent of board seats, AfricanAmerican women, 0.3 percent, Hispanic Americanwomen, 0.1 percent, and Asian and PacificIslander American women, 0.01 percent. (Whitemen held 88.9 percent of the board seats, AfricanAmerican men, 1.8 percent, Hispanic Americanmen, 0.7 percent, and Asian and Pacific IslanderAmerican men, 0.2 percent. Non-U.S. citizens held 2.85 percent of all the seats, slightlybelow the percentage of seats held by all U.S. citizens who were racial or ethnic minorities.)
Contrary to indications from current data, themajority of the CEO participants in theCommission’s survey believe that women nolonger confront serious glass ceiling problems.The CEOs were encouraged by the fact that thesuccessful performance of women in top-levelpositions was overcoming the stereotypes thathave historically limited women’s upward mobility.The CEOs did admit that the attitudes and biasesof middle-level managers continue to create barri-ers to the advancement of women. Catalystresearch also shows that acceptance of traditionalstereotypes of women has influenced middle man-agers to move women to staff rather than to theline jobs that relate directly to a company’s prof-itability and lead to the positions above the glassceiling.
On the other hand, a 1990 Financial WomenInternational survey of male CEOs and femalevice presidents indicated a distinct disparitybetween the men’s and women’s perceptions of the existence of a glass ceiling. Seventy-three percent of the male CEOs said they don’t thinkthere is a glass ceiling; seventy one percent of thefemale vice presidents think there is. PollyDiGiovacchino, president of the group that conducted the survey, pointed out, “There is definitely a gap between reality and perception.”
The CEOs who were interviewed did not differen-tiate between minority and white women except to144

state that they believed that compensation paritybetween white non-Hispanic women and otherwomen of color had been achieved. Data however,show that very few Hispanic women and women ofcolor are employed in private sector managementand very few have advanced into senior positions.
Research indicates that minority women clearlyperceive that they carry a double burden andalmost all of them believe that it is harder forthem to break through the glass ceiling than fortheir non-Hispanic white female peers. (However,African American women as a proportion of allfemale senior executives surveyed by Korn/FerryInternational in 1992 may be doing better—2.3 percent—than were African American malesas a proportion of all male senior executives surveyed by Korn/Ferry in 1989—0.6 percent. In absolute numbers, the Korn/Ferry samples ofsenior-level executives included four AfricanAmerican men and ten African American women.These surveys lend support to the contention thatminority women are promoted over minority mento use their double count toward meeting diversitytargets.)
Most minority women interviewed felt that theyare perceived first as minorities and then, andonly later, as women. Most identify themselves inthat order as well. For this reason the views andperceptions of minority women have been outlined in the environmental scans of specific
groups in the context of each group’s experience.They will not be repeated here. This environmen-tal scan of women includes comparative informa-tion on the status, preparation, opportunity, andplacement of all groups of women.
THE PERCEPTIONS
How CEOs Perceive Glass Ceiling and Women:The majority of the CEOs interviewed in the GlassCeiling Commission survey think of the glass ceil-ing as something that used to affect women—white and non-white—but that is no longer a realproblem for them. Without exception theyexpressed strong support for the concept ofwomen’s advancement to corporate senior man-agement.
Although most CEOs thought that compensationparity between white non-Hispanic women andminority women had been reached, they agreedthat parity between women and white non-Hispanic men had not been achieved, either interms of equal access to senior decisionmakingjobs or in compensation. However, the majority of CEOs interviewed demonstrated that their companies had some women above the glass ceiling or ready to move through it. The majority of these companies had other women managerssteadily climbing the promotion ladder.
145

All attributed the relative success of women versusminority males to two factors:
• women have been in corporate management longer (CEOs estimate that it takes 20 to 25 years for any aspiring manager white or non-white, to move through the glass ceiling), and
• the category of women, which includes all white women and women of color, represents more than half the total population—simply put, there are far more women than there are minority men.
Although some CEOs admitted that it is not always easy to persuade managers down the line to change their attitudes and practices that havelimited the mobility of women and minorities, the CEOs interviewed are generally sanguineabout the glass ceiling. They believe either that it no longer applies to women or that it is about to disappear for women. They recognize that thenumber of women at the top is still small, but theybelieve that change is inevitable.
Remarks made by CEOs on the topic of womenand the glass ceiling include:
“Gender is not a problem in finding highlyqualified employees.”
“The issue has to be forced but if the minorities
and women are hired on merit and can compete,there is grudging acceptance. The first time we hired a woman she went through a zillioninterviews and there was deep resistance. Nowwe hire men and women at a 60/40 ratio, andwe’d be comfortable with 50/50. The men haveseen that the women are high performers. Nowthere are women who outrank men and whosupervise men with no problem.”
“I question the pernicious, sexist, and racistassumptions of the phrases ‘qualified women’and ‘qualified minorities.’ We don’t find it necessary to talk about qualified males.”
How White Women Perceive Glass Ceiling IssuesThe perceptions quoted in this section are drawnfrom the testimony of women who spoke at thefive public hearings sponsored by the GlassCeiling Commission, from a 1992 Catalyst study,Women in Engineering: An Untapped Resource, andfrom Jane White’s book, A Few Good Women:Breaking the Barriers to Top Management.
“As an upper-level manager and an executivefor [a major hotel chain] I kind of feel likeI’m on the other side sometimes. I will saythough that, contrary to some of my male counterparts who wonder what is the glass ceiling, they don’t understand the terms. They don’t see it, so they’re not sure that it’s
“Women and minorities are as smart
as white males and there is no reason
why diversity should not be equated
and supported by quality and merit.”
146

“When I told my boss I was interested
in becoming a manager, he said he
didn’t envision a woman manager in
his lifetime.”
even there.”
“It was amazing to me that in that short timeperiod, an employer would take up valuableminutes asking about family instead of qualifications for the job. I myself was askedhow many words I typed per minute. . . I guessI was fool enough to think that graduatingmagna cum laude from undergraduate and completing my juris doctor degree would alle-viate the emphasis on my typing abilities.”
“It’s not whether you’re effective in gettingresults, it’s a question of whether you fit someview of what a wife or mistress or daughter or somebody ought to look like.”
“People build their expectations on the basis ofexperience, and they come to these environmentswhere there are nine men and one woman, andthey immediately think that I am the one whobrings papers or takes coats.”
“My boss is somewhat uncomfortable with mebecause I am a woman at a high level. He hastold me so.”
“My experiences are the things that you’veheard, but some of the things that I did when Iwas working with the company, I believe made adifference. I’d win a lot of awards when I’d wincontests and they’d give me money clips and tie
tacks. And I’d say, ‘What am I supposed to dowith these things? I don’t need a money clip. I don’t need a tie tack.’ And so, I made a verystrong point of asking for gender-nonspecificgifts when we won something like that.”
“So, I think one of the things that needs to be done on a widespread basis is the blueeye/brown eye experiment that we’ve seen thathas worked with racial discrimination—whereblue-eyed people are given a collar and put inthe rooms and made to feel very uncomfortableand to experience all the things that they’venever experienced. White men, on the whole, all need to go through that experience. Theydon’t understand what we go through becausethey have never been compelled to put themselvesin the position of being the only anything.”
“When people are thinking of who they’ll promote, whether consciously or subconsciously,a picture of a white male pops into their mindsand that’s their definition of what a managershould look like.”
The following information on senior women executives was drawn from the 1982 and 1992Korn/Ferry International Surveys. It appliesalmost exclusively to the perceptions and experi-ences of white non-Hispanic women because 95 percent of the senior female executives in theFortune 1000 industrial and Fortune 500 service 147

industries who participated in the survey were non-Hispanic white women.
• Almost 93 percent of the 439 senior women executives surveyed by Korn/Ferry International in 1992 felt that a glass ceiling for women still exists.
• On the other hand, 96 percent of these 439 executives believe that women are continuing to make progress in business. The majority of those surveyed in 1982 expect that women will constitute 20 percent of their company’s senior management by the year 2000.
• Forty-five percent of all the senior executive women surveyed said that they aspired to a higher level office and 14 percent of all surveyed aspired to be CEOs.
• Two-thirds of the women in the Korn/Ferry sample do not think that male backlash has increased now that more women are in competitive positions with men. On the other hand, a quarter of the women in the survey feel that “being a woman/sexism” was the biggest obstacle they have had to overcome and 59 percent of the survey participants have personally experienced sexual harassment on the job.
What are the Stereotypes about Women? The stereotypes and preconceptions described in the following paragraphs are those applied towomen regardless of race or ethnicity. The
Environmental Scans of Asian and Pacific IslanderAmericans, African Americans, HispanicAmericans, and American Indians presented additional stereotypes that affect women of colorand Hispanic women. These women labor under adouble burden of race or ethnicity and gender.
Commission research shows that stereotypes thathave been applied across the board to women ofall races and ethnicities include: not wanting towork/ not being as committed as men to their careers/not being tough enough /being unwilling or unable towork long or unusual hours/ being unwilling or unableto relocate/ unwilling or unable to make decisions/ tooemotional/ not sufficiently aggressive/ too agressive / toopassive/ and lacking quantitative skills.
Not all of the stereotypes are, on the surface, negative. Women are also perceived by male managers as good with people/ warm andnurturing/creative/ hard-working/ loyal/ and goodteam players.
It should be noted that women’s “leadership style”has been the subject of research. Sally Helgesen’sstudy of female managers concluded that womenoperate most effectively by being in the middle of things—listening, communicating, and empowering others to act. Helgesen coined thephrase “web of inclusion” to describe what shesees as an alternative to traditional command-and-control. Helgesen’s conclusions are reinforced by
Almost 93 percent of the 439 senior
women executives surveyed by
Korn/Ferry International in 1992
felt that a glass ceiling for women still
exists.
148

149
the work of Anne Jardim, Dean of the SimmonsGraduate School of Management, who uses the term “centrarchies” to describe a circle-likeorganization that she believes women tend tofavor. University of California professor Judy B.Rosener describes the leadership style of success-ful women as “interactive,” a model that empha-sizes positive interactions with others. Based onher 1990 study of International Women’s Forummembers, published in the Harvard BusinessReview, Rosener concluded that a “second wave” ofexecutive women are “succeeding because of—not inspite of—certain characteristics generally considered tobe ‘feminine’ and inappropriate in leaders.” At the
same time, it must also be noted, as Dawn-MarieDriscoll and Carol R. Goldberg point out in their1993 book, Members of the Club: The Coming of Agefor Executive Women,
“Management theories that favor less authorityat the top and a more participatory style havebeen around for a long time. . . male-orientedcultures as diverse as Japanese companies orLevi-Strauss seem to have perfected the art ofparticipatory management.”

A REALITY CHECK:Perceptions and Stereotypes -Versus the Facts
The Basic FactsWomen in the Labor Force
• In 1994, there were 58.4 million women in the labor force. They represented 45.6 percent of the total labor force or 57.9 percent of all women. (Bureau of Labor Statistics)
• The Bureau of the Census reported the 1990 racial/ethnic breakdown of women in the workforce as follows:
Total—All Women—1990 100%* 56,553,624White 77.2% 43,645,395African American 12.0% 6,765,395Hispanic American 7.2% 4,055,665Asian and Pacific Islander 3.0% 1,692,093American
American Indian 0.7% 395,076
(*Data do not always add up to 100.0 percent due to rounding errors.)150

A REALITY CHECK:Perceptions and Stereotypes -Versus the Facts
Women as Managers• In 1990 the Bureau of Labor Statistics reported the number of female managers—defined by the
federal government as executives, administrators, and managers—was 6 million. The number of male managers was 9 million.
• Private surveys conducted by Korn/Ferry and Catalyst, show that women represent from 3 percent to 5 percent of all senior managers—vice president and above—in the private sector. In 1991, then Secretary of Labor Lynn Martin released a Department of Labor Glass Ceiling report which showed that only 6.6 percent of executive level jobs in the 94 companies surveyed.
• The findings of a 1992 Korn/Ferry Survey of women in senior management positions in the Fortune 1000 industrial and 500 service companies refute many of the popular stereotypes about women that have been cited for why “they are not senior management material.” For example,
— women are not as committed to their careers as men, yet only a third of the women had ever taken a leave of absence. Almost two-thirds of these leaves were for less than six months and 82 percent of these leaves were for maternity or other family reasons. If maternity is controlled for, more men in the Korn/Ferry surveys took leaves of absence than did women.
— Women will not work long hours, yet the respondents in the Korn/Ferry survey worked an average of 56 hours a week in 1992. This is the same number of hours reported by their male counterparts in a similar 1989 Korn/Ferry survey.
— Women cannot or will not relocate, yet only 14.1 percent of the women in the 1992 survey refused relocation. Twenty percent of their male counterparts reported refusing relocation in the 1989 Korn/Ferry survey. It is interesting to note that Korn/Ferry found that women are not asked to relocate as frequently as men. The failure to provide this opportunity may prejudice their chances for advancement.
— Women lack quantitative skills, yet 23 percent of women and 27 percent of men have spent most of their corporate careers in finance. Sixteen percent of men and 26 percent of women are in the commercial banking or diversified financial sectors.
— Women are warmer and more nurturing than men, yet “concern for people” was cited as important by 33 percent of men and only 18 percent of women in the Korn/Ferry suverys.
151

The Participation of Women in Corporate AmericaPreparedness:
—Are Women Prepared to Participate in Corporate America?
Although more men than women continue toearn the degrees and credentials that are nowgenerally considered to be prerequisites for seniormanagement positions in the private sector, thegap is closing.
• In 1990 the National Center for Education Statistics reported that 8,408,000 women (6.5 percent of all women) and 10,597,000 men (8.6 percent of all men) in a total civilian workforce of 107,657,000 individuals 25 years or older held bachelor’s degrees.
• The number of women holding post graduate degrees has steadily increased. In 1990, 5,202,000 women held post graduate degrees. At the same time, 6,086,000 men in the workforce held such degrees.
• The National Center for Educational Statistics reported that in 1991 white non-Hispanic women earned 141,058 master’s degrees; African American women earned 10,429; Hispanic women earned 4,715; Asian and Pacific Islander American women earned 4,861; and American Indian women earned 677.
• Although the advanced degrees earned by all women continue to be heavily concentrated in education, in 1994, the National Center on Educational Statistics reports that 14 percent of the master’s degrees earned by both white and minority women are in the field of business management. Forty-four percent of the master’s degrees earned by white non-Hispanic men are in the field of business management.
• In the Korn/Ferry Survey, 40.1 percent of senior female executives had MBAs and 25.2 percent held law degrees.
Placement and Opportunity :—Where are Women Managers?—What Opportunities Are Available to Them?
Commission research and review of nongovern-ment surveys reveal the following information anddata on where women are in Corporate Americaand how they are faring:
• The representation of women in the private sector differs significantly by group. According to the 1991 Earnings and Employment Surveys of the Bureau of Labor Statistics, U.S. Department of Labor, the following percentages of women managers were in the private sector:
—35 percent of all white non-Hispanic women managers were in the private sector
In the Korn/Ferry Survey, 40.1
percent of senior female executives had
MBAs and 25.2 percent held
law degrees.
152

The lack of family-friendly workplace
practices is often cited as a barrier for
female managers who must juggle
home and professional responsibilities.
153
—3.4 percent of all African American women managers were in the private sector—2.0 percent of all Hispanic American women managers were in the private sector—1.2 percent of all Asian and Pacific Islander American women managers were in the private sector, and —0.2 percent of all American Indian women managers were in the private sector.
• Research reveals that women of all racial/ethnic groups are more likely to be employed in the service industries and in finance, insurance, real estate, and the wholesale/retail trade industries than are men. Nearly 75 percent of employed women work in these industries.
• Some Catalyst research suggests that male managers in these industries are reluctant to risk placing women in line positions because of stereotypes and preconceptions about women these managers hold.
• Given this reluctance, it is not surprising that a Catalyst survey found that women in the private sector are still concentrated in staff positions in “traditionally” female functional areas such as human resources, corporate communications, community and government relations, and the staff side of marketing and finance.
• Minority women experience the same barriers as white non-Hispanic women but the impact on them is greater. Because their numbers are smaller there are fewer male or female role models of the same race or ethnicity, and they are subject to racial and ethnic stereotypes as well as general stereotypes about women.
• Opportunities for advancement by minorities and women to senior positions, and especially for minority women, are limited by job placement that influences pay and advancement. The Commission’s research papers suggest that women are often steered into jobs that limit possibilities for their career growth. Examples include gender- and race-based stereotyping of jobs, pay inequities, and “mommy-track” policies.
• The lack of family-friendly workplace practices is often cited as a barrier for female managers who must juggle home and professional responsibilities. Commission research shows that when companies do offer such programs, only a few career managers—male or female—take advantage of them, largely because they perceive that it may prejudice a climb up the corporate ladder. But glass ceiling research also reveals that those women who have availed themselves of the benefits of family-friendly programs have not sacrificed their opportunity for advancement.

Between 1982 and 1992, the
proportion of women holding the title
of Executive Vice President rose from
4 percent to 9 percent. In that same
period, the proportion of those at the
Senior Vice President level rose from
13 percent to 23 percent.
154
• Despite the obstacles women have faced in getting on the track to senior management, they have persisted, persevered, and delivered high performance. As a consequence, an increasing number who have been in Corporate America for a dozen or more years are playing senior leadership roles and 60 percent of the female executives surveyed in the 1992 Korn/Ferry report that they expect to be members of the top senior management team by the year 2000. (This is an increase over the proportion of women in the 1982 Korn/Ferry Survey who expected to break through to the top.)
• The experience of the Korn/Ferry survey participants reveals that the following additional encouraging changes have occurred over the decade:
—Between 1982 and 1992, the proportion of women holding the title of Executive Vice President rose from 4 percent to 9 percent.—In that same period, the proportion of women at the senior vice president level rose from 13 percent to 23 percent.
• Commission research shows that women appear to have the best opportunity for advancement into management and decisionmaking positions in three types of industries:
—Those which are fast-growing, for example, business services.—Those where change (i.e., deregula-tion or restructuring) has occurred, for example, in telecommunications.—Those with a female-intensive work-force, for example, insurance and banking.
Compensation—How are Women Compensated?
Women’s advances in title and responsibility are also being reflected in rising levels of compensation. For example:
• Korn/Ferry surveys in 1982 and 1992 show that in those 10 years average annual base salary plus bonus for senior women executives rose from $92,000 to $187,000.
• The same surveys show that 30 percent of senior women executives earned over $200,000 in 1992 versus only 2.7 percent in 1982.
The progress made by women senior executivesdoes not mean that their earnings are comparableto male executives. The predominantly male sample of the 1989 Korn/Ferry survey showed an average annual base salary plus bonus of $289,000.(Part of the $102,000 difference in average compensation between the men surveyed in 1989and the women surveyed in 1992 may be due to the shorter average tenures of the women.

155
A significant number of women may just be enter-ing their higher earning years.)
IN SUM
White women are advancing but progress is slow.Minority women are even more severely underrep-resented in senior management in the private sector than their white female peers. Nonetheless,growing numbers of women—minority and non-minority—are earning the credentials requiredfor senior management positions.
Public hearings, glass ceiling research, and privatestudies all indicate that the major barriers to theachievement of senior management positions bywomen in the private sector are these:
• Clustering of women in “traditionally female positions” that are dead-end
• Resistance of many middle-level and
upper-level managers to place women in the line positions that feed into the senior management positions above the glass ceiling
• Lack of mentoring and lack of access to assignments and job rotation that provide visibility
• Exclusion from informal communications networks
• Prevalence of bias, insensitivity, and incidents of sexual harassment
• Lower compensation levels which act to disqualify high potential women as executive search firm candidates when corporations are looking outside for senior managers


GLASS CEILING REALITIES: AN INDUSTRY COMPARATIVE

Prepared by the Asian and PacificIslander Center for Census Informationand Services for the Glass CeilingCommission March 3, 1995
The glass ceiling continues to be a real issue forminorities and women who work as executives,administrators, and managers of private-for-profitcompanies. The comparative analysis that followssynthesizes two key factors that relate to the glassceiling reality: (1) industry representation of non-Hispanic whites, minorities, and women as execu-tives, administrators and managers, and (2) in-come or “return on investment.”
It is important to understand that available datado not disaggregate executives, administrators, ormanagers by level of responsibility. Therefore, thisanalysis includes all individuals who carry the titleof executives, administrators, or manager.
In terms of workforce representation amongstexecutives, administrators, and managers of pri-vate-for-profit companies the data show:
• The male population dominated its female counterpart in all industries
• The African American, Asian and Pacific Islander American and Hispanic American Populations tended to be proportionately underrepresented in all industries; the white population tended to be proportion-ately overrepresented in all industries.
• The white male population was proportion-ately overrepresented in most industries; all other men and women were generally proportionately underrepresented.
In terms of mean income of executives, adminis-trators, and managers of private-for-profit compa-nies:
• The male population with a bachelor’s or master’s degree had considerably higher mean incomes than their female counter-parts.
• The African American, Asian and Pacific Islander American, and Hispanic American populations generally earned lower mean incomes than their white counterparts.
• The white male population generally earned the highest mean incomes; all other men and women generally had lower mean incomes.
159
GLASS CEILING REALITIES: AN INDUSTRY COMPARATIVEEXECUTIVES, ADMINISTRATORS, AND MANAGERS OF PRIVATE-FOR-PROFIT COMPANIES
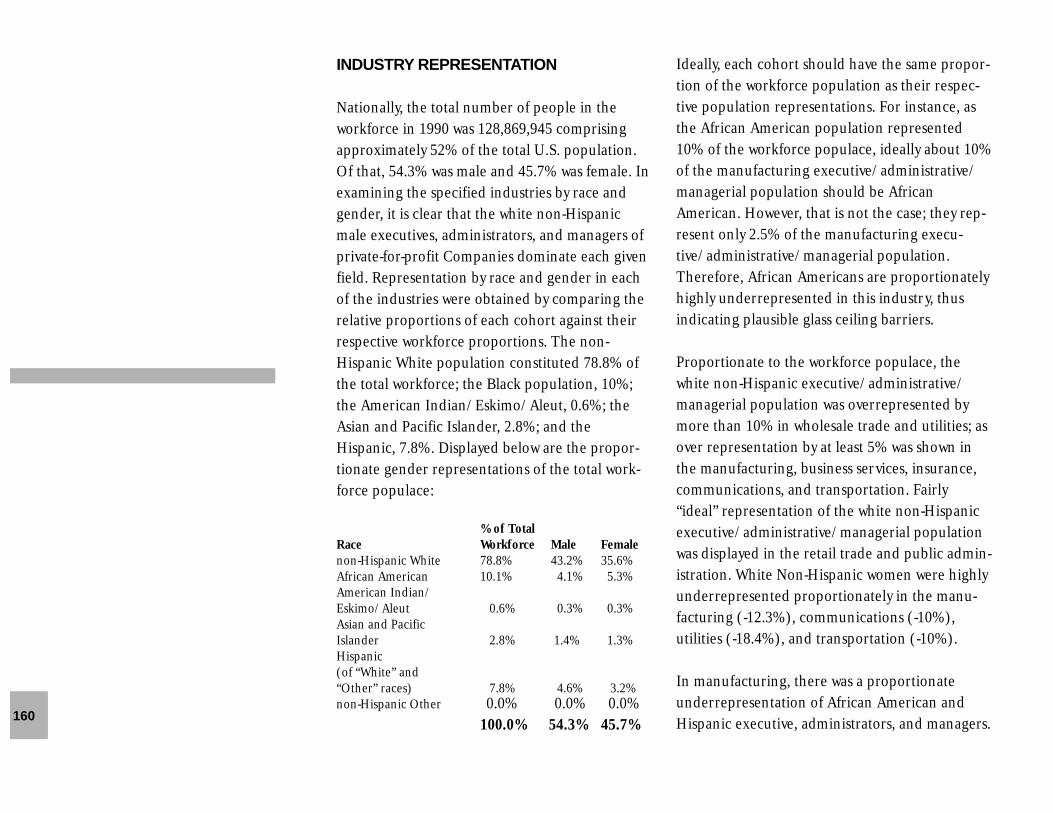
INDUSTRY REPRESENTATION
Nationally, the total number of people in theworkforce in 1990 was 128,869,945 comprisingapproximately 52% of the total U.S. population.Of that, 54.3% was male and 45.7% was female. Inexamining the specified industries by race andgender, it is clear that the white non-Hispanicmale executives, administrators, and managers ofprivate-for-profit Companies dominate each givenfield. Representation by race and gender in eachof the industries were obtained by comparing therelative proportions of each cohort against theirrespective workforce proportions. The non-Hispanic White population constituted 78.8% ofthe total workforce; the Black population, 10%;the American Indian/Eskimo/Aleut, 0.6%; theAsian and Pacific Islander, 2.8%; and theHispanic, 7.8%. Displayed below are the propor-tionate gender representations of the total work-force populace:
% of TotalRace Workforce Male Femalenon-Hispanic White 78.8% 43.2% 35.6%African American 10.1% 4.1% 5.3%American Indian/Eskimo/Aleut 0.6% 0.3% 0.3%Asian and Pacific Islander 2.8% 1.4% 1.3%Hispanic (of “White” and “Other” races) 7.8% 4.6% 3.2%non-Hispanic Other 0.0% 0.0% 0.0%
100.0% 54.3% 45.7%
Ideally, each cohort should have the same propor-tion of the workforce population as their respec-tive population representations. For instance, asthe African American population represented10% of the workforce populace, ideally about 10%of the manufacturing executive/administrative/managerial population should be AfricanAmerican. However, that is not the case; they rep-resent only 2.5% of the manufacturing execu-tive/administrative/managerial population.Therefore, African Americans are proportionatelyhighly underrepresented in this industry, thusindicating plausible glass ceiling barriers.
Proportionate to the workforce populace, thewhite non-Hispanic executive/administrative/managerial population was overrepresented bymore than 10% in wholesale trade and utilities; asover representation by at least 5% was shown inthe manufacturing, business services, insurance,communications, and transportation. Fairly“ideal” representation of the white non-Hispanicexecutive/administrative/managerial populationwas displayed in the retail trade and public admin-istration. White Non-Hispanic women were highlyunderrepresented proportionately in the manu-facturing (-12.3%), communications (-10%), utilities (-18.4%), and transportation (-10%).
In manufacturing, there was a proportionateunderrepresentation of African American andHispanic executive, administrators, and managers.160

161
Women of all races were severely underrepresent-ed in the manufacturing field; representing only27.1% of the manufacturing workforce, comparedto 45.7% of the total workforce.
In retail trade, there was a proportionate overrep-resentation of the Asian and Pacific Islander pop-ulation (+2.4%) and of the white non-Hispanicfemale population (+3.5%). Retail trade was theone industry analyzed where the white non-Hispanic male executives, administrators, andmanagers were underrepresented. Overall,women had an “ideal” proportional representa-tion in retail; though African American andHispanic women were underrepresented.
In wholesale trade, African American andHispanic executives, administrators, and man-agers were proportionately underrepresented by8.7% and 3.0% respectively. Overall women wereproportionately underrepresented.
In business services, the African American execu-tive/administrative/managerial population wasproportionately underrepresented by 6.1%, whilethe Asian and Pacific Islander population showedfair representation and the Hispanic populationwas slightly overrepresented. Women generallywere underrepresented by 8.0%, although Asianand Pacific Islander and Hispanic women showedrepresentation relatively at par with their respec-tive workforce proportions.
In public administration, the Asian and PacificIslander populations were proportionately under-represented. Overall, women were underrepre-sented (-4.1%) even though Asian and PacificIslander women executives, administrators, andmanagers were at par, and Hispanic women wereoverrepresented.
In finance, the African American population, aswell as the Hispanic male population were propor-tionately underrepresented. Asian and PacificIslander executives, administrators, and managerswere overrepresented in finance by 1.6%. Womenexecutives, administrators, and managers general-ly showed proportionate over representation.
In insurance, the minority racial groups were allunderrepresented proportionate to their respec-tive workforce compositions. African Americanwomen executives, administrators, and managerswere proportionately underrepresented by 2.7%,while overall, women were overrepresented by2.9%.
In communications, the white non-Hispanic maleand Hispanic executives, administrators, and man-agers were overrepresented proportionately; thewhite non-Hispanic female and the AfricanAmerican, and Asian and Pacific Islander popula-tions were underrepresented by 10%, 6.7%, and1.5% respectively/ Women generally were propor-tionately underrepresented.

162
In utilities, the minority racial groups were allunderrepresented proportionately; AfricanAmerican by 7.8%, Asian and Pacific Islander by2.0%, and Hispanic by 4.0%. White Non-Hispanicwomen were severely underrepresented with a17.2% representation in utilities as compared pro-portionately to 35.6% of the non-Hispanic femaleworkforce. Overall, women were underrepresent-ed by 26.2%.
In transportation, the Hispanic executive/ admin-istrative/managerial population was proportion-ately overrepresented. Men of all races were over-represented (+14.3%); women of all races wereunderrepresented (-15.4%).
RETURN ON INVESTMENT—INCOME
Using the white non-Hispanic population as thebase, the return on investment for communitiesother than the white non-Hispanic population wasgenerally low. The mean income of the white non-Hispanic executive/administrative/ managerialmale population with a Bachelor’s degree was $47, 181. The mean income of their female coun-terparts was $31,338; a mean income of $15,843less than the men. The white non-Hispanic popu-lace was used as the base to examine the genderand racial/ethnic differences in earned meanincome amongst the executives, administrators,and managers. The following table shows themean income of those executives, administrators,
National Mean Income Disparities- Race/ Ethnicity by Gender of Executives, Administrators,and Managers of Private-for-Profit Companies with Bachelor’s or Master’s Degrees: 1990Census
Bachelor’s Degree Master’s DegreeRace/Ethnicity Male Female Male FemaleNH White $47,181 $31,338 $57,371 $38,391African American ($15,180) ($754) ($10,137) ($4,385)Chinese ($5,924) ($2,032) $1,481 $7,292Filipino ($7,992) ($3,045) ($7,204) ($7,160)Japanese $22,406 ($373) $13,071 $1,533Asian Indian ($1,872) ($6,096) $5,997 ($6,970)Korean ($4,400) ($5,559) ($5,801) ($10,576)Vietnamese ($2,678) ($6,267) $5,923 ($4,350)Other Southeast Asian ($20,221) ($6,679) ($20,694) **Hawaiian ($11,252) ($8,066) ($14,079) **Other A/PI ($6,853) ($1,688) ($12,734) ($11,695)
**results very unreliable due to extremely small sample size

163
and managers who earned a bachelor’s or mas-ter’s degree for specified populations, with thewhite non-Hispanic mean incomes, male andfemale, as the comparatives.
As illustrated, the only group with a bachelor’sdegree that fared better than the white non-Hispanic male population was the Japanese malepopulation that earned on average $22,406 morethan its white non-Hispanic counterpart. Similarly,the Japanese male population with a master’sdegree had the highest mean income. (The meanincome of the Japanese male population appearsinflated because it includes those executives,administrators, and managers who worked in theUnited States on assignment from Japan-basedparent-firms, and thus were compensated on parwith the salaries according to the cost-of-living in
Japan.) African American men with a bachelor’searned on average $15,180 less than the whitenon-Hispanic male population, the second lowestmale mean income of those with a bachelor’sdegree. In addition to this large discrepancy, thegreatest discrepancy amongst those with a bache-lor’s in comparison to the white non-Hispanicmales were Other Southeast Asian (who earnedon average $20,221 less). Hawaiian men had thethird lowest mean income (-$11,252) amongst themale population with a bachelor’s degree.
Amongst the women with a bachelor’s degree, theJapanese American and African American womenwere relatively within reach of possibly being atpar with the white non-Hispanic executive/administrative/managerial women. However, allwomen had considerably lower mean incomes
National Mean Income Disparities- non-Hispanic White and Hispanic by SelectIndustry and Age of Executives, Administrators, and Managers of Private-for-ProfitCompanies with College Education: 1990 Census
Manufacturing Mean IncomeNH White Hispanic
25-34 years $42,171 ($5,383)35-44 years $59,587 ($5,416)45-54 years $72,730 ($9,292)
Professional Services Mean IncomeNH White Hispanic
25-34 years $31,533 ($5,504)35-44 years $42,314 ($7,466)45-54 years $47,910 ($8,110)

compared to their male counterparts, in particu-lar to the white non-Hispanic male. The Hawaiianwomen with a bachelor’s degree had the lowestmean income of $23,272($8,066 less than whitenon-Hispanic women and $39,115 less than whitenon-Hispanic men of the same level of educa-tion.)
On the master’s level of education, the disparitiesbetween the different cohorts illustrated morevariation than that on the bachelor’s level.Amongst the male population with a master’sdegree, Other Southeast Asian men (by over$20,000), as well as the Hawaiian, Other Asian andPacific Islander, and African American male popu-lations (each by over $10,000) had lower meanincomes than the white non-Hispanic male popu-lation. A few Asian and Pacific Islander ethnicgroups had higher mean incomes than their whitenon-Hispanic Counterpart. The Chinese andJapanese American women had higher meanincomes than their white non-Hispanic counter-parts, yet still earned significantly less than thewhite non-Hispanic men by at least $11,688.Furthermore, the women with a master’s degreeearned lower mean incomes than their malecounterparts who achieved just a bachelor’sdegree.
In examining the disparities amongst the meanincome between the white non-Hispanic andHispanic executives, administrators, and man-
agers of private-for-profit companies, two selectedindustries (manufacturing and professional ser-vices) with age factored in are below. Similar towhat had been previously reflected, the white non-Hispanic population of each age group had high-er mean incomes.
Those executives, administrators, and managerswithin each age group in the manufacturingindustry tended to earn higher mean incomesthan those in professional services. For bothindustries, age impacted the mean incomes forboth the white non-Hispanic and Hispanic popu-lations; the older the population, the higher themean income. In addition, the largest disparityamong each cohort was between those 25 to 24years of age and 35 to 44 years; varying between adifference of $17, 416 of the white non-Hispanicto $8,819 of the Hispanic.
While the data was presented in different ways,the results were the same. The data showed theexistence of considerable gender and racial differ-ences between executives, administrators, andmanagers of the various cohorts.
164

APPENDICIES
GLOSSARY OF TERMSCOMPOSITION OF THE U.S. CIVILIAN LABOR FORCE BY SEX, RACE, AND HISPANIC ORIGIN
CORPORATE PRACTICES TABLEMETHODOLOGY FOR MEASURING GLASS CEILING REALITIES
STANDARD INDUSTRIAL CLASSIFICATIONSTANDARD OCCUPATIONAL CLASSIFICATIONS
SURVEY OF CEOs METHODOLOGY AND QUESTIONS ASKEDFOCUS GROUP METHODOLOGY
EMPLOYED PERSONS WITHIN INDUSTRY BY RACE AND HISPANIC ORIGINEMPLOYED PERSONS WITHIN IDUSTRY BY GENDER AND OCCUPATIONAL LEVEL
PUBLIC HEARINGS: ROSTER OF ORAL TESTIMONYINDEX OF TABLES


167
African AmericanThe term “African American” includes persons who indicate their race as “Black” or “Negro” or reportthemselves as African American, Afro-American, Black Puerto Rican, Jamaican, Nigerian, West Indian, orHaitian. U.S. Bureau of the Census definition.
Alaska Native Village Statistical Area (ANVSA) The term “Alaska Native Village Statistical Area” includes tribes, bands, clans, groups, villages, communi-ties, or associations in Alaska that do not have legally designated boundaries, but the Census Bureau hasestablished Alaska Native village statistical areas (ANVSA) for statistical purposes.
American IndianThe term “American Indian” includes persons who classify themselves as American Indian, Eskimo, orAleut. U.S. Bureau of the Census definition.
Asian and Pacific Islander AmericanThe term “Asian and Pacific Islander American” includes persons who identify themselves as Chinese,Filipino, Japanese, Asian Indian, Korean, Vietnamese, Cambodian, Hmong, Laotian, Thai, or otherAsian and Hawaiian, Samoan, Guamanian or other Pacific Islander. U.S. Bureau of the Census defini-tion.
Corporate AmericaA generic term referring primarily to major U.S. corporations, including, but not limited to, the Fortune1000 Industrial and the Fortune 500 Service companies. As used here it also includes companies thathave more than 500 employees and that have been in business for 10 or more years.
Decisionmaking PositionsUsed to refer to senior vice presidents, executive vice presidents, presidents, chief executive officers,chief financial officers, or their equivalents.
GLOSSARY OF TERMS

Environmental ScanA strategic planning tool corporations used to monitor key forces—demographic, economic, technologi-cal, political/legal, and social/cultural—and significant actors—customers, competitors, supplies, andlabor—that affect the ability of corporations to earn profits in the marketplace. It identifies strengths,weaknesses, opportunities, and threats.
Federal ReservationThe term “Federal Reservation” includes Federal American Indian reservations that are areas withboundaries established by treaty, statute, and/or executive or court order, and recognized by the FederalGovernment as territory in which American Indian tribes have jurisdiction.
Federal Trust Land AreasThe term “Federal Trust Land Areas” (FTLA) includes property associated with a particular AmericanIndian reservation or tribe, held in trust by the Federal Government.
HispanicThe term “Hispanic” includes those persons who identify their origin as Mexican, Puerto Rican, Cuban,Central, or South American, or some other Spanish-related origin. U.S. Bureau of the Census definition.
Labor Force Participation RateThe percentage of persons 16 years of age and older who were either employed during the week of theDepartment of Labor survey or, if unemployed, had looked for work during the prior four weeks andwere available to work. It measures the degree of active involvement or interest in the work world.
LatinoThe Bureau of the Census collects data using a Hispanic category. However, people have strong feelingsabout the terms Latino and Hispanic. Research has revealed that Latino is the term of preference inCalifornia—the state with the largest number of Latino/Hispanics—while Texans and Easterners preferHispanic. In this report the terms Latino and Hispanic are used interchangeably to refer to the samegroup of individuals, both male and female.
168

Mean IncomeMean income is the amount which is obtained by dividing the total income of a particular cohort/uni-verse by the total population in that cohort/universe. Mean income is the average income.
Median Annual Family IncomeThe dollar figure that divides all familes into two equal-sized groups, one group having incomes abovethe median value and the other having incomes below the median value.
Members of Sovereign NationsTerm is derived from the legal relationships between American Indian tribes and the FederalGovernment.
Minority/MinoritiesTerms used in this report to refer to African Americans, American Indians, Asian & Pacific IslanderAmericans, and Hispanic Americans (both white and non-white). Although all of these groups find theterms objectionable, it is used here to conform to the language of the legislation.
95% (Ninety-Five Percent) Confidence IntervalThe term “95% Confidence Interval” is used in this report to state that the findings are accurate within95 percent of certainty. Thus 95 percent or more of the time these findings are accurate.
State ReservationsThe term “State Reservations” includes American Indian reservations with boundaries established withina state by which it has been legally recognized.
Strategic PlanThe managerial process of developing and maintaining a viable fit between the organization’s objectivesand resources and its changing market opportunities. The aim of strategic planning is to shape andreshape the company’s directions and ways of functioning so that they combine to produce satisfactoryprofits and growth.
169

170
Tribal Jurisdiction Statistical AreaThe term “Tribal Jurisdiction Statistical Area” (TJSA) includes areas delineated by federally recognizedtribes in Oklahoma without a reservation for which the Census Bureau tabulates data.
Unemployment RateThe percentage of those 16 years of age or older who were not employed during the survey week but hadlooked for a job during the prior four weeks and were available to work. It measures the unemploymentrate among those actively participating in the workforce. Bureau of Labor Statistics definition.
White AmericanThe U.S. Bureau of the Census definition includes persons who indicated their race as “white” or report-ed themselves as Canadian, German, Italian, Lebanese, Near Easterner, Arab, or Polish.

COMPOSITION OF THE U.S. CIVILIAN LABOR FORCE BY SEX, RACE, AND HISPANIC ORIGIN
Annual Averages, Selected Years, 1970-2005*
2000 20051970 1980 1990 (Projection) (Projection)
Total 82,774 100% 106,940 100% 124,787 100% 142,596 100% 152,154 100%Men 51,228 61.8% 61,453 57.5% 56,554 54.7% 76,041 53.3% 80,356 52.8%Women 31,543 38.2% 45,487 42.5% 56,554 45.3% 66,555 46.7% 71,798 47.2%
White 73,556 88.9% 93,600 87.5% 107,177 85.9% 119,604 83.9% 126,485 83.1%Men 46,035 55.6% 54,473 50.9% 59,298 47.5% 64,523 45.2% 67,645 44.4%Women 27,521 33,3% 39,127 36.6% 47,879 38.4% 55,080 38.6% 58,840 38.7%
Black and Other** 9,218 11.2% 10,863 10.0% 13,493 10.8% 16,046 11.3% 17,395 11.4%Men 5,194 6.2% 5,612 5.1% 6,708 5.4% 7,815 5.5% 8,355 5.5%Women 4,024 4.8% 5,253 4.9% 6,785 5.4% 8,231 5.8% 9,040 5.9%
Asian and Other*** — — — 6,947 4.9% 8,274 5.4%Men — — — 3,703 2.6% 4,356 2.9%Women — — — 3,244 2.3% 3,918 2.6%
American Indian — — — — —Men — — — — —Women — — — — —
Hispanic**** — 6,146 5.7% 9,576 7.7% 14,271 10.0% 16,581 10.9%Men — 3,818 3.6% 5,755 4.6% 8,434 5.9% 9,626 6.3%Women — 2,328 2.2% 3,821 3.1% 5,837 4.1% 6,963 4.6%
Percents do not always add to 100
Civilian Labor Force (Bureau of Labor Statistics)—The civilian labor force comprises all civilians classified as employed or unemployed 16 years of age or older.
*Figures for the Years 2000 and 2005 are Bureau of Labor Statistics Civilian Labor Force projections.
**Black and Other figures for 1970 only includes Blacks, Hispanics and the Asian and Other group.
***Asian and Other groups consists of (1) Asian and Pacific Islanders, (2) American Indians, and (3) Alaskan Natives.
****NOTE: Detail for Hispanic-origin groups will not sum to civilian workforce totals because data for Hispanics are included in both white, and black and other population groups.
(—) = Data not available.
Source: Bureau of Labor Statistics Current Population Survey—Annual Averages, Selected Years 1970-1990Bureau of Labor Statistics—Office of Employment Projections April 1994 171*Specific Companies may have more than one corporate practice.

172
TABLESINDEX BY COMPANYAAA—American Automobile AssociationAetna Life & Casualty Allstate Insurance CompanyAmerican AirlinesAmerican Express CompanyAmoco CorporationApple ComputerArthur Andersen & Co.AT&TAvon Products, Inc.Barnett BankBaxter Healthcare CorporationCase Western Reserve UniversityChampion International CorporationChubb & Son, Inc.CIGNACon EdisonConnecticut MutualContinental InsuranceCorning Glass Works, Inc.Dow ChemicalDow Jones & CompanyEastman Kodak CompanyE.I. du Pont de Nemours & CompanyExxon Research & Engineering Co.
Fannie MaeFel-Pro, Inc.First Interstate Bank of CaliforniaGannett Co., Inc.General Electric, NY Silicone Manufacturing DivisionGeneral FoodsGoldman Sachs & Co.Hershey FoodsHewlett-Packard Co.Hoffmann-La RocheHoneywell, Inc.Hughes AircraftIBMJC Penney Co., Inc.J.P. MorganJohn Hancock Financial ServicesJohnson & Johnson3MMCA, Inc.Marquette ElectronicsMassachusetts Mutual Life Insurance CompanyMcCormack & DodgeMcDonald’sMorrison & FoersterMotorola, Inc.NationsBankNorth Carolina National Bank
CORPORATE PRACTICES TABLES: EMPLOYMENT PRACTICES THAT HELP BREAK THE GLASS CEILING*

173
New England Telephone - NYNEXNorth Broward Hospital DistrictPDQ Personnel ServicesPacific BellPacific Gas and ElectricPhillip MorrisPitney-Bowes, Inc.Port Authority of NY & NJProcter & GambleProskauer, Rose, Goetz & MendelsohnPublic Service Electric & Gas CompanyRaychem CorporationRensselaer Polytechnic Institute Ryder Systems, Inc.The San Francisco Bar AssociationSC Johnson WaxSidley & AustinSkadden, Arps, Slate, Meagher & FlomSquare D Co.Steelcase, Inc.Stride Rite Corporation
Tandem Computer, Inc.Tenneco, Inc.Texas InstrumentsThe TravelersTom’s of MaineTucson Medical CenterUniversity of North Carolina at GreensboroUS SprintUS WESTWork/Family DirectionsXerox Corporation

COMPANY PROGRAM
AAA-American Management DevelopmentAutomobile Association Program
AT&T Leadership Continuity Program (LCP); Executive Education Program
Barnett Bank Leadership and Career Development
Connecticut Mutual Management Excellence Selection; Components for Leadership Development
DESCRIPTION
The four-level Management Development Program focuses on building the kindof skills AAA managing directors, general managers and mid-level managersneed in order to lead the company in a changing competitive climate. The pro-gram is based on three core themes: (1) building the competencies of the AAA“manager of the future”; (2) Action Learning, an idea borrowed from GeneralElectric that focuses on immediate transfer of skills learned in class to on-the-jobsituations; and (3) member satisfaction, or convincing executives to spend timewith customers so they can make decisions that better anticipate customer needs.
Introduced to help further the advancement of minorities and women advance-ment into higher management, the LCP identifies and accelerates the develop-ment of managers who have the potential to be leaders in an intensely competi-tive environment. The Executive Education Program provides internal andexternal education experiences for AT&T executives and those middle managersidentified as having high potential. Executive Education Program candidates,most of whom are in the LCP, are selected on the basis of their on-the-job learn-ing experiences, career histories, career plans, and the business strategies of theorganization. Executive Education Programs are offered internally and at 40 uni-versities worldwide. Programs last from one week to two-and-a-half months.
Women are chief executives of four Barnett units and make up 44 percent of thehighest paid employees. Women make up 21 percent of Barnett’s senior andexecutive vice presidents.
1. The Management Excellence process involves “selecting individuals who willmake successful managers in our environment.” The process was developedthrough the McBurr model of competencies: a group of average and outstand-ing managers was selected and studied in order to identify the traits that led tosuccess in management and traits that the company wanted to emphasize inmanagement selection and development.174
SUMMARY TABLES: LEADERSHIP AND CAREER DEVELOPMENT
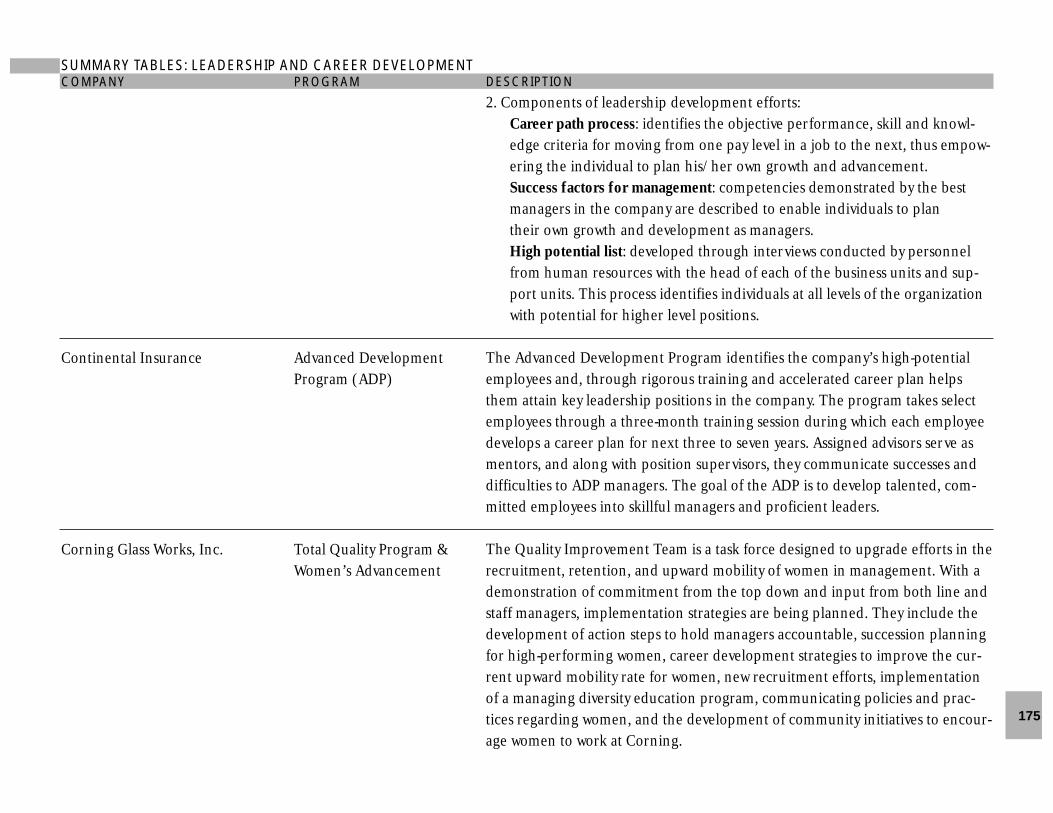
175
DESCRIPTION
2. Components of leadership development efforts:Career path process: identifies the objective performance, skill and knowl-edge criteria for moving from one pay level in a job to the next, thus empow-ering the individual to plan his/her own growth and advancement.Success factors for management: competencies demonstrated by the best managers in the company are described to enable individuals to plan their own growth and development as managers.High potential list: developed through interviews conducted by personnel from human resources with the head of each of the business units and sup-port units. This process identifies individuals at all levels of the organization with potential for higher level positions.
The Advanced Development Program identifies the company’s high-potentialemployees and, through rigorous training and accelerated career plan helpsthem attain key leadership positions in the company. The program takes selectemployees through a three-month training session during which each employeedevelops a career plan for next three to seven years. Assigned advisors serve asmentors, and along with position supervisors, they communicate successes anddifficulties to ADP managers. The goal of the ADP is to develop talented, com-mitted employees into skillful managers and proficient leaders.
The Quality Improvement Team is a task force designed to upgrade efforts in therecruitment, retention, and upward mobility of women in management. With ademonstration of commitment from the top down and input from both line andstaff managers, implementation strategies are being planned. They include thedevelopment of action steps to hold managers accountable, succession planningfor high-performing women, career development strategies to improve the cur-rent upward mobility rate for women, new recruitment efforts, implementationof a managing diversity education program, communicating policies and prac-tices regarding women, and the development of community initiatives to encour-age women to work at Corning.
COMPANY PROGRAM
Continental Insurance Advanced Development Program (ADP)
Corning Glass Works, Inc. Total Quality Program & Women’s Advancement
SUMMARY TABLES: LEADERSHIP AND CAREER DEVELOPMENT

176
DESCRIPTION
Newly appointed as CEO in the early 1980s, David O. Maxwell challenged the tra-ditional hiring patterns of the financial industry by deliberately recruiting a man-agement team that included minorities and women. To continue increasing thenumber of minorities and women in mid- and senior-level positions, CEOMaxwell works aggressively with top management to identify and promote thecompany’s most promising minorities and women.
Instituted in 1979 by Chairman Allen Neuharth, the program encompassesstrategies for recruiting, hiring, developing, and promoting minorities andwomen. The program features a system to measure performance of managers indeveloping minorities and women. It is aimed at high potential individuals forparticipation in management development programs. College recruitment andinternship programs aimed at minorities and women ensure a diverse pool of tal-ent from which future company leaders will emerge. The program, which hasbeen tracked since 1981, has produced high percentages of minority and femaleemployees and managers.
The conference began as a grassroots effort by company women to showcase theachievements of HP’s female engineers and scientists, promote their leadershipdevelopment, and help them to network in a highly decentralized organization.After a successful first Technical Women’s Conference in October 1988, the com-pany sponsored a worldwide conference in May 1991, drawing 800 attendees.
COMPANY PROGRAM
Fannie Mae Recruitment
Gannett Co., Inc. Partners in Progress
Hewlett-Packard Co. Technical Women’s Conference
SUMMARY TABLES: LEADERSHIP AND CAREER DEVELOPMENT

177
DESCRIPTION
JC Penney Co., Inc. has created the Women’s Advisory Team and the MinorityAdvisory Team to develop programs which increase the representation of womenand minorities at the senior management level and to find ways to make the com-pany’s affirmative action plan more effective. Each team is composed of 16-18management associates appointed directly by the company chairman. Focusgroups with employees help develop team agendas. The teams have created a for-mal mentor program, an internal newsletter that focuses on workforce diversity,leadership forums that allow employees to hear from outside experts, and adirect broadcast system that electronically puts together managers to discussdiversity issues. They have developed a nontraditional staffing program whichpermits managers to better balance work and family responsibilities.
The company refined its 15-year-old Management Issues Board to emphasize theprofessional development of employees. The single board was expanded to four15-member boards (3 product line and 1 corporate), and was renamed theProfessional Development Boards. The new system provides professional staffwith opportunities for career growth through their participation in challengingbusiness projects. Participants develop critical skills, enhance their visibility withtop management, and broaden their responsibilities, while assuring Mass. Mutualof a growing reservoir of professional and managerial talent.
For over a decade, this law firm has had in place an array of liberal work andfamily programs that help women in the demanding legal profession achievetheir fullest potential. A flextime policy for partners and associates with caregiv-ing responsibilities, a three-month paid maternity leave (followed by a three-month unpaid leave), a family sick leave and a firm-wide dependent careresource and referral program are viewed as basic levels of support. The firm hasestablished ongoing training programs to teach lawyers, managers, and staff howto work with one another in an environment of diversity and how to manage in a
COMPANY PROGRAM
JC Penney Co., Inc. Management Development Program Leadership Forums
Massachusetts Mutual Professional Development Life Insurance Company Boards
Morrison & Foerster Work and Family Diversity
SUMMARY TABLES: LEADERSHIP AND CAREER DEVELOPMENT

178
DESCRIPTION
workplace made more complex by the firm’s commitment to flexible work arrange-ments for women. Lawyers and firm managers are also trained in preventing sexualharassment and delivering effective feedback.
The program was implemented to increase the number of women in technical posi-tions, create support systems for technical women, alleviate gender bias, and helpwomen acquire the skills and opportunities they need to advance. A cornerstone ofthe initiative is education. In conjunction with a local university, employees with notechnical background can enroll in a two-year certificate program to prepare them-selves for technical careers. To help women who have technical experience moveinto higher levels of management, the company has a “Corporate Leaders” manage-ment succession plan. The program is open to both men and women.
Set up in 1988 to increase the number of minorities and women at senior manage-ment levels, the program allows PG&E to break away from traditional lines of pro-gression that require an employee to remain in a specific job for a set number ofyears before being considered for a leadership position. Each business of the com-pany can recommend employees for 10 slots available in the two-year program.Program outline and training are tailored to the career aspirations of each candi-date. Of the 21 employees who participate in the program through 1993, 16 weresuccessful, including one woman who now manages a power plant.
The Management Succession and Development Committee challenges managers toconsider minorities and women for new openings, and pay and benefits structuresare reviewed regularly to make certain that they are equitable and attractive tominorities and women. An effective job-posting system ensures that knowledge ofavailable opportunities and of the hiring process is clear and that the hiring processis fair to all employees. Ongoing training and development is critical. SC JohnsonWax has also paid full tuition for employees’ undergraduate and graduate studies.
COMPANY PROGRAM
New England Telephone - Women in TechnologyNYNEX
Pacific Gas and Electric Accelerated Development Program
SC Johnson Wax Management Succession and Development Committee
SUMMARY TABLES: LEADERSHIP AND CAREER DEVELOPMENT

179
SUMMARY TABLES: LEADERSHIP AND CAREER DEVELOPMENTDESCRIPTION
Women make up more than 45 percent of the employees and 33 percent of theboard. One of three vice presidents is a woman, as are 50 percent of the man-agers.
This pilot program was developed to address, at the state level, the scarcity ofwomen in administrative positions, especially higher-level positions in highereducation. It was a locally developed program that was funded by a local founda-tion, a local university, the participant enrollment fees, and the state AmericanCouncil on Education/National Identification Project, which aims to identify tal-ented women who are ready to move into senior administrative positions. Theprogram provided the following: (1) high accessibility to women administratorsand faculty in the state; (2) appraisal of career advancement as well as develop-ment of leadership skills; (3) individual career counseling for participants; and(4) training for participants in fiscal matters.
In 1988, US WEST implemented its Women of Color Project to remedyinequities in the career opportunities for non-Caucasian women. The programwas a response to the recommendation of three employee Resource Groups. Theobjective of the program, which has just recently completed its five-year lifespan,was to provide developmental and promotional opportunities for the women onthe basis of their leadership, communication, and decisionmaking skills and theneeds of the business. Of the 36 participants that completed the program, allexperienced developmental opportunities and 83% were offered one or morepromotional opportunities.
COMPANY PROGRAM
Tom’s of Maine Leadership and Career Development
University of North Carolina Career/Leadershipat Greensboro Advancement Program
for Women Administrators
US WEST Women of Color Project

180
SUMMARY TABLES: ROTATION/NONTRADITIONAL EMPLOYMENTCOMPANY PROGRAM
American Airlines Nontraditional employment
Avon Products, Inc. Slating: High potential selection process
Chubb & Son, Inc. Job rotation
DESCRIPTION
See American Airlines: Succession Planning
The slating process was instituted to expand the pool of internal candidates foropen positions and to ensure that minorities and women are better representedin line positions. When a position for manager, director, or vice presidentbecomes available, human resources personnel work with department heads toidentify candidates. To better prepare for staffing changes, a slate of candidates issometimes developed before the position becomes open. Candidates are selectedon the basis of their job-specific skills and credentials.
The high potential selection process for high potential employees identifiesthose who have developed exceptional leadership and management skills, andwho support the company’s valuing diversity efforts. These individuals work withtheir managers and human resources staff to identify the experiences they needto advance. With slating, the pool of high potentials is screened to ensure ade-quate representation of minorities and women.
High potential women in staff and administrative positions are given the oppor-tunity to rotate into line functions. To prepare for a new position, each candidatecurrently in a staff position receives training and, in some cases, gains hands-onexperience by working for several months in a lower-level line job without takinga pay cut.

181
DESCRIPTION
The Management Intern Program is a comprehensive strategy to recruit, devel-op, and promote qualified women. Begun in 1981, the program currentlyrecruits approximately 30 college graduates annually on the basis of technicalcompetence, leadership potential, communication skills, and part-time workexperience. Interns spend one year in four three-month assignments designed toexpose them to a variety of company functions. Visibility is an added programbenefit: interns gain exposure to officers and upper management throughrequired presentations and informal forums. At the outset of the program, eachintern is assigned a mid-level manager who serves as a mentor. 75% of the 89female engineers hired since 1981 are still at Con Ed. Women have the highestrate of retention.
The “Blue Collar Prep” program aims to prepare women educationally, psycho-logically, and physically for nontraditional jobs.
At Du Pont, most executives move through at least two or three functions beforethey reach top positions. For example, an employee with technical experiencemay move from manufacturing to marketing to general management to corpo-rate staff before attaining executive line status. The job rotation process beginswith the identification of high-potential employees. Of Du Pont’s 20,000 exemptemployees with college degrees (15% of whom are women), approximately 2,000are considered capable of advancing into upper management positions. Askedwhy job rotation is particularly important for women, a Du Pont representativesaid, “Women don’t have role models in upper management positions. Job rotation helps them learn firsthand about the skills and knowledge they need fora new position.”
COMPANY PROGRAM
Con Edison Management Intern Program
Blue Collar Prep Program
E.I. du Pont de Nemours Job rotation& Company
SUMMARY TABLES: ROTATION/NONTRADITIONAL EMPLOYMENT

182
DESCRIPTION
ECAP began in 1976 at the company’s Bell Laboratory location in Naperville,Illinois. Originally intended as a mentoring program for all newly hired or promot-ed minorities and women at the professional engineer level in Bell Laboratories(AT&T’s Research and Development division), the program was recently broad-ened to include associate technical positions. Mentors are managers at either thesupervisor, department head, or director level, and must work outside the mentee’sdepartment.
Implemented in 1990, the program aims to improve the preparation of talentedindividuals for senior management positions. The program selects employees at theassistant vice president level and above who are excellent performers and demon-strate potential for advancement. While the 30 employees participating in the pilotprogram in 1990 included women, minorities, and white non-Hispanic men, themajority of those participating were female.
CIGNA developed a guide and let each of its ten operating divisions decide howthey wanted to approach the mentoring process. The guide profiles successful men-tor relationships, including key behaviors of coaches, mentors, and mentees; on-the-job opportunities for coaching and mentoring; methods to improve coachingand skills; and tips for mentees. The model was also developed to provide a bench-mark for best practices and approaches to mentoring and coaching in CIGNA’sdivisions.
To promote cultural diversity and enhance developmental and promotional oppor-tunities for minorities and women, the company developed mentoring quads. Eachquad is made up of four members who are diverse in terms of position, level, race,gender, and functional area. Program developers felt another advantage of thegroup approach would be to offer greater learning opportunities to larger num-bers of people. The approach also assumes that group dynamics will minimize per-sonality conflicts.
COMPANY PROGRAM
AT&T Early Career Advisory Program (ECAP)
Chubb & Son Inc. Senior Management Sponsorship Program
CIGNA Mentoring Guide
Dow Jones & Company Mentoring Quads
SUMMARY TABLES: MENTORING

183
DESCRIPTION
Du Pont’s mentoring program is tied to other initiatives to develop and advancehigh potential minorities and women. While the company allows mentors andmentees to structure their own relationship, every mentor receives two days oftraining in which ground rules are set and guidelines are given.
This program for female and minority high school students was implemented toincrease the pool of minority and women recruits. By providing students withprofessional-level mentors, who serve as role models and career counselors, aswell as offering “real” engineering work experience, Exxon aims to build positive,long-term relationships with students and to foster their interest in becoming permanent employees.
The Individual Mentoring Program is part of an overall initiative, begun in early1992, to create and implement programs for the advancement of minorities andwomen. The overall initiative, The Career Opportunities and DevelopmentProgram, includes all phases of career development and planning, diversity train-ing, multi-cultural networks, a group mentoring program,and an individual men-toring program. The purpose of the Individual Mentoring Program is to providehigh potential selected minorities and women with an opportunity to focus onexamining personal expectations, work habits, communications goals and objec-tives, constructive feedback, and understanding expectations under the guidanceof experienced and skilled professionals. Recognition that the bank couldstrengthen its business by developing employees was the motivation for establishing the initiative. Throughout the next three to five years all of the par-ticipants will be tracked as to their career development.
JC Penney Co., Inc. created its own two-day workshop on managing a diverseworkforce. All profit-sharing managers in the company have attended the pro-gram. The workshop objectives are to create an awareness of cultural differences, to develop an understanding of how these diverse cultures benefit the workplace
COMPANY PROGRAMS
E.I. du Pont de Nemours Imaging Systems& Company
Exxon Research & Engineering Internship and Mentoring Program
First Interstate Bank of California Individual Mentoring Program
JC Penney Co., Inc. MentoringSkills Development Workshops
SUMMARY TABLES: MENTORING

184
DESCRIPTION
environment, and improve communications among an increasingly diverse work-force. Additionally, 120 key senior managers attended a week-long multi-culturalworkshop that uses relationships and team-building to reinforce the value ofdiversity.
Designed to help prevent some of the problems associated with structured men-toring relationships, NYNEX has implemented “mentoring circles.” Becausementors and mentees meet in groups of up to 12 people, the sexual tension andrumors that can accompany one-on-one male/female and interracial mentoringare eliminated. Moreover, the circles maximize the use of mentors’ time, as thenumber of individuals qualified to serve as mentors is usually far fewer than thenumber of employees seeking mentors.
The objectives of the 1989 pilot program were to augment the developmentprocess by helping to increase the number of candidates ready to fill managerialpositions and to improve the retention of valued employees. The program wasalso designed to further the company’s goal of creating an environment that val-ues diversity by helping to increase the representation of minorities and womenmanagement. The current program strives to match mentors and mentees in asmany levels as possible by looking at the development needs of associates, theexperience of mentors, geographic proximity and/or functional commonality.
COMPANY PROGRAMS
New England Telephone - NYNEX Mentoring circles
Pitney-Bowes, Inc. Pairing System
SUMMARY TABLES: MENTORING

185
SUMMARY TABLES: ACCOUNTABILITY PROGRAMSCOMPANY PROGRAMS
Procter & Gamble Corporate Mentoring Program
Baxter Healthcare Corporation Affirmative Action Strategy; Balanced Work Force Initiative
Corning Glass Works, Inc. Quality Improvement Teams
Square D Co. Diversity Goal Setting
DESCRIPTION
The objective of the program is to ensure that there is an experienced managerto act as “a trusted counselor, coach, role model, advisor and voice of experience”to managers with less experience who are expected to advance within the organi-zation. The first priority of the company was to ensure that minorities and womenwho had been identified as having advancement potential have mentors becauseof the higher turnover rates among these managers.
The program holds managers individually accountable for recruiting, retaining andpromoting minorities and women. Managers are provided with guidelines for devel-oping professional skills and, at year end, are required to complete detailed sum-maries of their efforts. Managers then submit the forms to corporate headquarters foran in-depth review of their achievements. Baxter then reinforces support for man-agers’ initiatives by tying 20 percent of their discretionary bonus to their “good faith”efforts and pursuit of corporate goals. Both the number of female vice presidents andthe number of female division presidents have increased substantially since 1988.
To counteract a trend in attrition, the company assigned senior managers to separatequality improvement teams, one for women’s advancement and one for the advance-ment of African Americans. After an intensive six-month effort, involving surveys andfocus groups, the teams made recommendations for improving the workplace. Someof the outcomes include mandatory gender and racial awareness training for man-agers and professionals, the introduction of career planning systems, and improvedcommunication.
Goals for preparing high-potential female employees for management positions (at salaries of $60,000 and above) were developed and presented to senior executivestaff. In 1991, it was decided that a minimum of 20 percent of managers’ bonuseswould be based on their effectiveness in meeting corporate goals to recruit, develop,and promote women.

186
SUMMARY TABLES: SUCCESSION PLANNINGCOMPANY PROGRAMS
Tenneco, Inc. Executive Incentive Compensation Program
American Airlines Supertrack
Career Development Program (CDP)
Women in Operations Management Advisory Council
Hershey Foods Senior Management Review
DESCRIPTION
This program links a significant percentage of each executive’s bonus to the attain-ment of defined divisional goals to promote minorities and women. Three-quartersof this percentage relates to these pre-established goals, which are separate forminorities and women and are set by each company according to its individual work-force and location; the remaining one-quarter is for implementing programs direct-ed at developing and advancing targeted groups.
The company is taking a multifaceted approach to retaining, developing, andpromoting minorities and women. Supertrack requires officers to submitdetailed, cross-functional development plans for all high-potential minorities andwomen in middle management and above.
American’s Career Development Program (CDP), a sophisticated, computerizedjob-posting system, allows employees to signal their interest in positions beforevacancies occur. Company-wide posting also helps reduce potential for discrimi-nation or favoritism by providing all employees with instant job information.
To boost women’s representation in nontraditional positions, a task force wasestablished: Women in Operations Management Advisory Council. The goals ofthe group are to identify the barriers for women in nontraditional areas, to edu-cate female employees on the growing opportunities in technical fields and toserve as mentors to female employees.
The advancement of minorities and women is one of the many goals of the suc-cession planning process. During the company’s Senior Management Review,high-growth individuals and potential high-growth individuals are identified aspart of the annual meeting of top-level executives. Managers compile profiles ofthe high-growth individuals. The profiles include performance strengths, weak-nesses, and areas that need development, the next planned or anticipated

187
COMPANY PROGRAMS
Cross Entity Review
McCormack & Dodge Succession Management Resources Review (SMRR)
Motorola, Inc. Succession Planning with Clout
SUMMARY TABLES: SUCCESSION PLANNINGDESCRIPTION
position, and the anticipated position or level in five years. A five-year develop-ment plan charts the path from the employee’s present position to anticipatedposition.
Lateral movement or promotions from one division to another are identified tohelp develop an individual through new experiences. It also serves a businesspurpose by placing key employees where their expertise is needed.
A component of a larger initiative to foster career advancement, SMRR is theprocess by which all senior managers evaluate those managers who report tothem directly and determine their readiness for progression into even moresenior positions. Senior managers must also identify the critical skills, trainingand job experiences that each middle manager must have in order to be promot-ed to more senior positions. A detailed, individualized development plan is pre-pared for these individuals and is reviewed by executives on an annual basis.These plans are reinforced through performance evaluation and other goal-setting processes.
To accelerate women’s advancement, the company implemented this program in1986. The program features an ambitious, corporate-wide “Parity Initiative,”which requires, by year end 1996, that the representation of minorities andwomen at every management level mirrors the representation of these groups inthe general population. The “Parity Initiative” has already produced results: InSeptember 1989 Motorola had two female vice presidents; today it has fourteen.To achieve these goals, the company uses a succession planning process, the“Organization and Management Development Review,” which is unique in that itreaches down to the entry and mid-levels of management and holds managersaccountable for developing and retaining minorities and women.
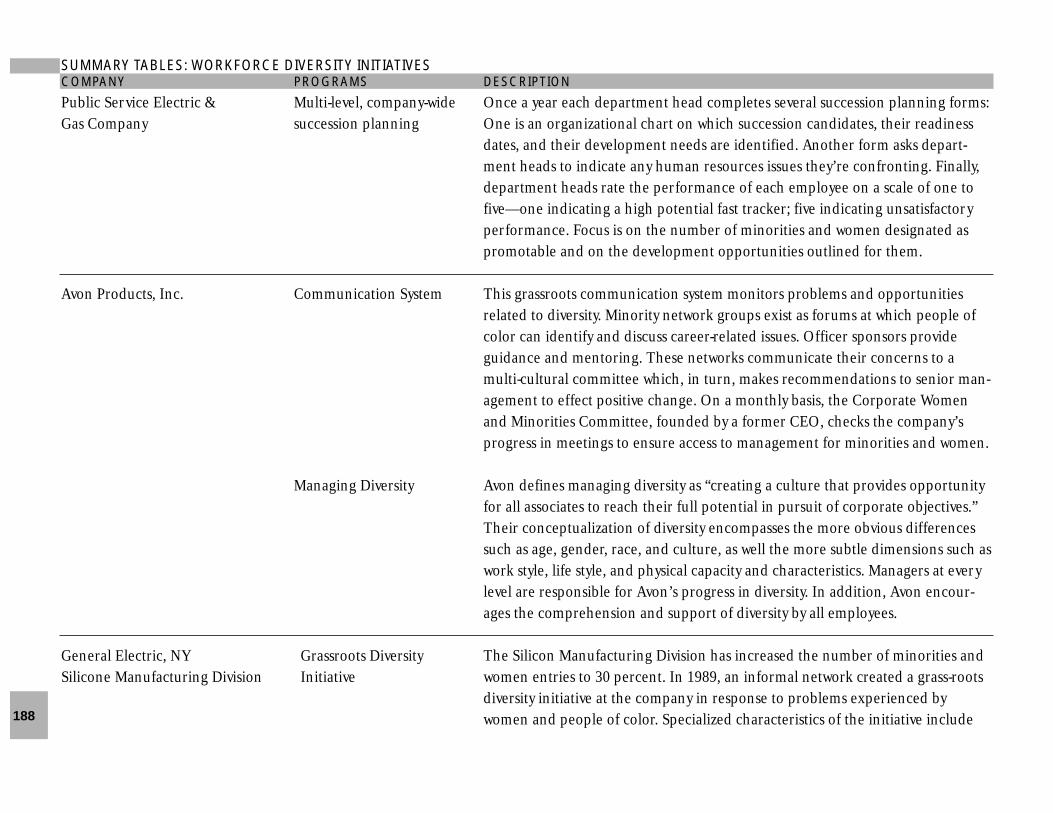
188
COMPANY PROGRAMS
Public Service Electric & Multi-level, company-wide Gas Company succession planning
Avon Products, Inc. Communication System
Managing Diversity
General Electric, NY Grassroots Diversity Silicone Manufacturing Division Initiative
DESCRIPTION
Once a year each department head completes several succession planning forms:One is an organizational chart on which succession candidates, their readinessdates, and their development needs are identified. Another form asks depart-ment heads to indicate any human resources issues they’re confronting. Finally,department heads rate the performance of each employee on a scale of one tofive—one indicating a high potential fast tracker; five indicating unsatisfactoryperformance. Focus is on the number of minorities and women designated aspromotable and on the development opportunities outlined for them.
This grassroots communication system monitors problems and opportunitiesrelated to diversity. Minority network groups exist as forums at which people ofcolor can identify and discuss career-related issues. Officer sponsors provideguidance and mentoring. These networks communicate their concerns to amulti-cultural committee which, in turn, makes recommendations to senior man-agement to effect positive change. On a monthly basis, the Corporate Womenand Minorities Committee, founded by a former CEO, checks the company’sprogress in meetings to ensure access to management for minorities and women.
Avon defines managing diversity as “creating a culture that provides opportunityfor all associates to reach their full potential in pursuit of corporate objectives.”Their conceptualization of diversity encompasses the more obvious differencessuch as age, gender, race, and culture, as well the more subtle dimensions such aswork style, life style, and physical capacity and characteristics. Managers at everylevel are responsible for Avon’s progress in diversity. In addition, Avon encour-ages the comprehension and support of diversity by all employees.
The Silicon Manufacturing Division has increased the number of minorities andwomen entries to 30 percent. In 1989, an informal network created a grass-rootsdiversity initiative at the company in response to problems experienced bywomen and people of color. Specialized characteristics of the initiative include
SUMMARY TABLES: WORKFORCE DIVERSITY INITIATIVES

189
SUMMARY TABLES: WORKFORCE DIVERSITY INITIATIVESCOMPANY PROGRAMS
General Foods Diversity ManagementSteering Committee
McDonald’s Changing Workforce Programs
DESCRIPTION
teamwork and diversity training. A review board examined such issues as familyleave, flexible hours, personal and professional development, and other pro-grams. Since the implementation of the program, there has been an increase inthe number of women in managerial positions including women of color.
Mentoring, an important component of the program, was established to provideminorities and women with role models who would give the participants insightinto the corporate culture and management systems.
General Foods began its diversity effort by forming a Diversity Management SteeringCommittee, chaired by the president and including 10 senior executives, to monitorall company activities relating to affirmative action and diversity management. A full-time human resources position dedicated solely to diversity management was estab-lished, along with a Workforce 2000 Council to address the issues of the upwardmobility of minorities and women, networking, and career/family balance. A hugetraining effort was then launched for the entire salaried employee population. Thegoal of the training is to increase awareness of changing workforce demographics,the diversity efforts of competing companies, and the internal cultural barriers thatinhibit the productivity of minorities and women.
Formalized more than a decade ago, the programs are based on a premise of respectfor all contributors to the business. Comprising six progressive management devel-opment modules, the program has helped ensure that employees of both gendersand all cultures can reach their full professional potential. Through the modules,class participants are encouraged to explore personal attitudes and assumptions thatcan become barriers to their professional growth, or the growth of employees theymanage. Training courses offered include: Managing the Changing Workforce(MCW); Women’s Career Development (WCD); Black Career Development (BCD);Hispanic Career Development (HCD); Managing Cultural Differences (MCD) andManaging Diversity (MD).

190
COMPANY PROGRAMS
PDQ Personnel Services Workforce Diversity Initiatives
Procter & Gamble Corporate Diversity Strategy Task Force
Rensselaer Polytechnic Beyond Diversity EffortInstitute
US WEST Pluralism Performance Menu (PPM)
SUMMARY TABLES: SUCCESSION PLANNINGDESCRIPTION
PDQ has developed ongoing relationships with diverse business groups to generatecontinuous referrals and to promote the advancement of minorities and women. Ithas developed outreach to organizations representing minorities and women suchas the Latin Business Association, Black Business Association, and the UrbanLeague. These organizations assist PDQ with recruitment outside the company.PDQ has developed non-gender and non-racial interview questions which are uni-formly administered to all candidates being considered for management positions.
In 1988, the president commissioned this task force, intentionally including linevice presidents, to redefine the importance of a multicultural work force and toidentify strategies for managing diversity. In terms of diversity training, the com-pany offers awareness training, symposiums on women and minority issues, and“onboarding” programs that help orient new hires with special attention to gen-der and minority concerns. To foster development and retention, all managersreceive regular career assessments in which they and their supervisors identifythe skills they need to advance.
The Institute views itself as a microcosm of the broad society: they have devel-oped initiatives that cut across the entire university community in order to ade-quately prepare students for the work force. The program was established as partof the Institute’s recent strategic planning process. It offers both students andfaculty opportunities to learn and participate in different cultures and lifestylesthrough lectures, concerts, travel, workshops, and task forces.
Pluralism Performance Menu, initiated in October 1990, is a measurementdevice for tracking the performance of the company’s officers on their quantita-tive and qualitative efforts to develop and advance minorities and women. ThePPM lists criteria for measuring officers’ efforts. Every six months, officers submita completed menu to corporate headquarters where the data are analyzed. Eachofficer is provided with feedback and suggestions for improvement. The short-

191
SUMMARY TABLES: WORKFORCE DIVERSITY INITIATIVES PROGRAMS FOR WOMEN OF COLORCOMPANY PROGRAMS
US WEST Women of Color Project
Workshop: White Maleism and the Corporate Culture
Xerox Corporation Asset Management Program
DESCRIPTION
term goal of the PPM was to boost the company’s recruitment, development,and advancement of minorities and women. The PPM is designed to raise thecompany’s commitment to diversity to a new plane so that, in the long run, pro-moting diversity will become second nature to all employees.
See US WEST: Leadership and Career Development
The goal of this workshop is to improve the communication between men andwomen and to help men avoid seeing women in the workplace as a threat, andinstead as “an opportunity for greater economic prosperity and increased per-sonal enrichment.”
This program was started in 1983 to foster mobility of women of color within the company’s Development and Manufacturing Organization. The programcombines formal training and on-the-job experience. It is intended to provideexposure to and understanding of the manufacturing operation through intensive on-the-job experiences under the direction of the plant manager. The plant manager also serves as mentor to the candidate to ensure that the program’s objectives are fulfilled through each developmental phase.

192
SUMMARY TABLES: WORKFORCE DIVERSITY INITIATIVES CORPORATE WOMEN’S GROUPS/NETWORKSCOMPANY PROGRAMS
Avon Products, Inc. Avon Multicultural Committee
Case Western Reserve University Salary Equity Committee
Hoffmann-La Roche Concerned Women of Roche (CWR)
DESCRIPTION
Avon has three strong groups: the Avon Asian Network, the Avon HispanicNetwork, and the Black Professional Association (BPA). These groups originatedin the 1970’s as the Concerned Women of Avon, which then became the Womenand Minorities Committee. In the mid-1980s committee members branched outand began networks to address their specific needs. Management developed anorganized system through which networks and committees feed into each otherto ensure a consistent flow of information and communication. In order to becredible, the group has made sure that its objectives are consistent with the company’s goals. The committee is structured to help Avon implement its business strategy of becoming a multicultural workplace. The group has devel-oped an operational structure with officers and regular meetings that follow theaccepted business protocol at Avon. In addition, the committee tries to be openabout its intentions and to communicate clearly and consistently.
Established in 1992, this committee reviewed the salary distribution of all univer-sity faculty and its findings have been shared with the entire University communi-ty. This kind of open review will be done annually. An external consultant annu-ally reviews the staff salary plan to ensure equity. Every performance appraisalcarries two levels of review within its division and a review by a compensation sec-tion of the Human Resources Office for equity, appropriateness, and consistency.
Founded in 1972, CWR is one of the older corporate women’s groups in thecountry. The 400-member group seeks to encourage women to develop theirabilities to the fullest potential; it actively supports the company’s EqualEmployment Opportunity/AffirmativeAction program and championsHoffmann-La Roche’s policies on behalf of women’s advancement andwork/family balance. The group is recognized as a viable corporate entity withfull support of management. Recognizing the growing need for child care, CWRchampioned the concept of an on-site center. After conducting a feasibility study

193
SUMMARY TABLES: WORKFORCE DIVERSITY INITIATIVES CORPORATE WOMEN’S GROUPS/NETWORKSCOMPANY PROGRAMS
Honeywell, Inc. Women’s Council
DESCRIPTION
and assessing employee child care needs, the Hoffman La-Roche Child CareCenter sponsored a child care center in 1979. It was established in New Jerseyand was one of the first in the country. Also, at the request of management, CWR had input into the company’s maternity leave and sexual harassment policies. CWR also spearheads the company’s mentoring program (which wasrecently expanded to include bilingual mentors), offers career counseling andskills workshops four times a year, and provides a wide range of programs foremployees and their families. Hoffmann-La Roche funds these programs andother CWR activities.
Formed in 1978, the group has approximately 35 members who represent a wide range of job functions, levels, and organizational units. They exemplify thediverse workforce in terms of age, race, and family status. Initially, the group was chartered to contribute to a working environment that would attract andretain quality female employees and encourage personal growth of all employ-ees. Its goals were to identify, study, and make recommendations on issues of concern to Honeywell women and support women who sought career mobility.
After gaining management support, the Council moved beyond its originalemphasis on programming to providing recognized policy input. Without abandoning its original broad agenda, the group now focuses on identifying and studying issues of concern to Honeywell women and barriers to theirupward mobility, and makes recommendations about how both managementand employees can work to remove these barriers. The Council comprisesemployees from both the professional and administrative ranks.

194
COMPANY PROGRAMS
Arthur Andersen & Co. Men and Women as Colleagues
E.I. du Pont de Nemours Personal Safety & Company
Core Groups
SUMMARY TABLES: WORKFORCE DIVERSITY INITIATIVES GENDER/RACIAL AWARENESS TRAININGDESCRIPTION
This gender awareness training program was introduced in May 1990 at theaccounting firm’s Dallas office. It aims to enhance interpersonal communicationbetween male and female employees, legitimize discussion of workplace genderissues, increase understanding of the business benefits of creating a supportiveenvironment for women, and help Andersen attract and retain female employ-ees. Based on the success of the Dallas office pilot, the program has beenendorsed by Andersen’s national human resources office and is now being conducted at multiple locations throughout the country.
The company has chosen to address in a business context the growing socialproblem of personal violence, including rape, wife/spouse battering, and childand elder abuse. Senior management recognizes that employees’ concerns about safety, both on and off the job, can prevent them from fully reaching theirpotential. Du Pont’s program contributes to a supportive work environment andimproved productivity by helping employees address previously ignored areas ofmental stress and by opening the lines of communication between men andwomen.
These specialized workshops were implemented in 1988 to sensitize white, upper-level managers to gender and racial issues. Comprising 12 to 18 employees (fiveof whom are white male managers, and the remaining minorities and women),core groups meet with an outside facilitator for eight hours a month, on compa-ny time if they choose. Senior vice presidents are encouraged to form coregroups within their own departments, and members either self-select or are invit-ed to participate. While the groups have a life of their own, they typically lastabout a year. Occasionally members of the group will continue to meet on an adhoc basis once the group has disbanded.

195
SUMMARY TABLES: WORKFORCE DIVERSITY INITIATIVES GENDER/RACIAL AWARENESS TRAININGDESCRIPTION
Hughes has implemented a series of “Managing a Diverse Workforce” training programs for management/supervisors, as well as career development seminarsfor minorities and women. Hughes also has a variety of management and profes-sional development programs, including the Chairman’s Executive LeadershipProgram, Line Managers Development Course, Contract Managers Course, andthe Management Action Workshop for new supervisors and middle managers. All of these programs are monitored on a regular basis to determine the enroll-ment patterns of minorities and women.
JC Penney Co., Inc. created its own two-day workshop on managing a diverse workforce. All profit-sharing managers in the company have attended the pro-gram. The workshop objectives are to create an awareness of cultural differences,to develop an understanding of how these diverse cultures benefit the workplaceenvironment, and improve communications between an increasingly diverse workforce. Additionally, 120 key senior managers attended a week-long multi-cultural workshop that uses relationship and team-building to reinforce the valueof diversity.
The 3M Women’s Advisory Committee’s mission is “to influence and effect changein 3M to assure that all employees can participate and contribute equally.” Thestatement emphasizes change and focuses attention on promoting women’s careerand leadership development through identification of issues, communication to3M about women’s concerns, and recommendation of specific action plans. Thecommittee provides direct advice to senior management committees regardingpolicies that impact 3M women. The committee has contributed to the implemen-tation of a number of significant programs including: supervisory and manage-ment development programs, internal communications on diversity in the work-force, an improved performance appraisal system, employee initiated part-timeemployment, and internal personnel search required for all job openings.
COMPANY PROGRAMS
Hughes Aircraft Gender/racial Awareness Training
JC Penney Co., Inc. Diversity Awareness WorkshopsSkills Development Workshops
3M The Women’s Advisory Committee

196
SUMMARY TABLES: WORKFORCE DIVERSITY INITIATIVES GENDER/RACIAL AWARENESS TRAININGCOMPANY PROGRAMS
MCA, Inc. Gender/racial Awareness Training
North Broward Hospital District Bridges
Pitney-Bowes, Inc. Minorities Resource Group/ Women’s Resource Group
Port Authority of New York Women’s Equityand New Jersey (WE)
DESCRIPTION
A Diversity Awareness Program, first targeting senior executives and then allmanagement staff, enhances and sustains a work environment that is responsiveto the changing demographics of MCA’s workforce, eliminates any attitudinalbarriers that hinder the hiring and promotion of people of diverse backgrounds,and reaffirms the company’s commitment to considering candidates fromdiverse backgrounds for all jobs. More than 300 management personnel haveattended. A Diversity Forum has been established to address diversity issues thatemerge on a day-to-day basis.
This voluntary management training program helps develop the skills needed to manage a diverse workforce through a 32-hour series of workshops involvingrole playing and interactive conversations. The eight training modules focus onintercultural perceptions, gender stereotypes, subtle racial sterotypes, ethnicidentity, organizational culture, intercultural conflict, and communications barriers. Ninety-four percent of those participating in the program found itexcellent or very good.
The two groups play significant roles in enriching the company’s equal opportu-nity environment. The groups work with both senior management and humanresources personnel to provide input into programs and new initiatives such ascandidate slating, job posting, development of management training programs,the mentor program, recruiting and hiring practices, and enhancing upwardmobility for all employees in the company.
WE was organized by a small group of management women to reduce their senseof isolation and to promote women’s upward mobility. By 1984, women were well represented in junior and mid-management jobs; subsequently, WE beganto recognize the importance of women’s voice in the workplace and to lobby theagency’s leaders about women’s concerns. Issues of primary interest included

197
COMPANY PROGRAMS
Raychem Corporation Women’s Network
Ryder Systems, Inc. Women’s Management Association
DESCRIPTION
flextime, parental leave, child care, and the availability of promotion opportunitiesfor all women. Opening up membership into the women’s organization at all levelswas a logical step because the group’s steering committee believed they would gaingreater clout when voicing concerns to management by representing more womenin the agency. To recruit new members, WE planned programs to involve women atall levels, such as a workshop on juggling work and family obligations, a display onwomen’s historical contributions to the Port Authority, and health seminars. Toensure the relevance and usefulness of the programs to all members, Women’sEquity also sought nonmanagement women’s involvement on the steering commit-tee and on each of its five subcommittees. The group then planned a special work-shop cosponsored by Asian, African American, and Hispanic groups to help recruitwomen for nontraditional jobs such as the construction trades.
The Network was developed in early 1991 to address women’s isolation in the corporation’s heavily male-dominated culture. The Women’s Network issues anewsletter to more than 200 female and male employees. The Network is drafting its formal charter, organizing focus groups with female employees and top manage-ment, and launching a formal study to determine whether there are barriers tocareer development at Raychem. A positive and constructive approach and its practice of communicating with management regularly and openly are attributesthat led to the group’s success.
Founded in 1982, the Women’s Management Association defines itself as a “businessassociation.” Its objectives include helping women to become more effective in theirjobs, apprising senior management of women’s concerns and recommending practi-cal solutions, and improving the knowledge of members of Ryder’s businesses andcustomers. A unique aspect of the group and a key to its success is the involvementof senior management. The group is guided by a Governing Board, comprised of 10senior-level female managers, and an Executive Advisory Committee,
SUMMARY TABLES: WORKFORCE DIVERSITY INITIATIVES GENDER/RACIAL AWARENESS TRAINING
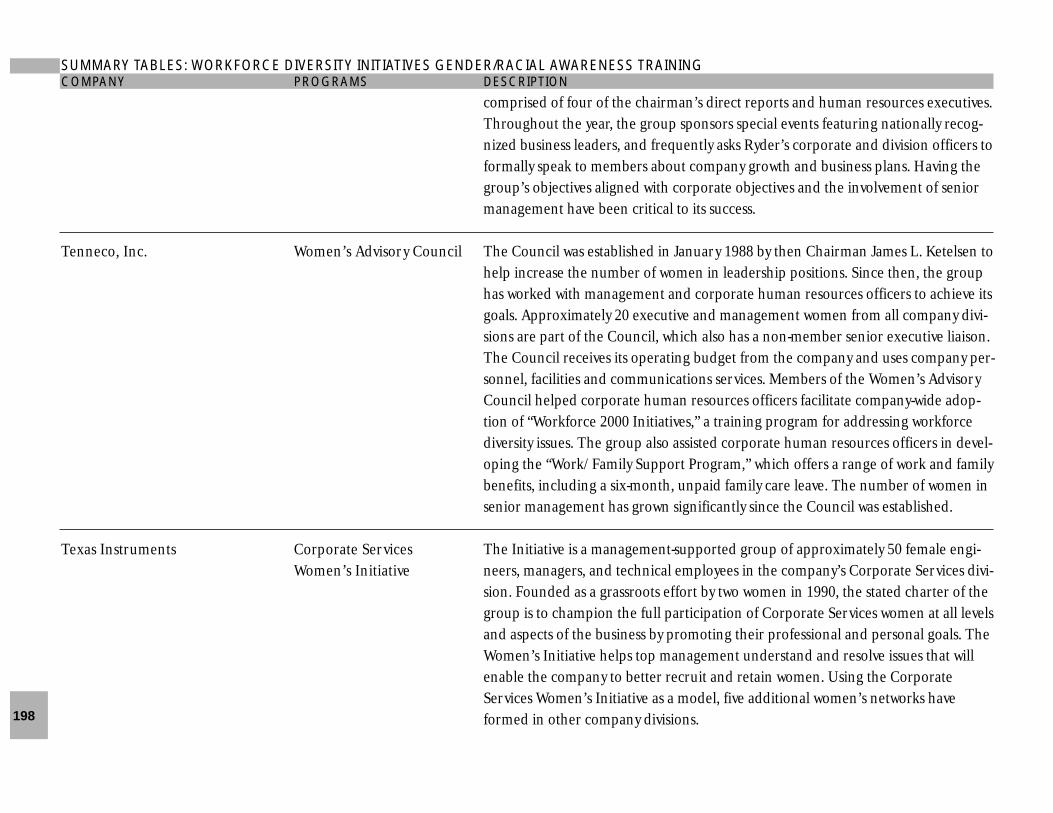
198
COMPANY PROGRAMS
Tenneco, Inc. Women’s Advisory Council
Texas Instruments Corporate Services Women’s Initiative
SUMMARY TABLES: WORKFORCE DIVERSITY INITIATIVES GENDER/RACIAL AWARENESS TRAININGDESCRIPTION
comprised of four of the chairman’s direct reports and human resources executives.Throughout the year, the group sponsors special events featuring nationally recog-nized business leaders, and frequently asks Ryder’s corporate and division officers toformally speak to members about company growth and business plans. Having thegroup’s objectives aligned with corporate objectives and the involvement of seniormanagement have been critical to its success.
The Council was established in January 1988 by then Chairman James L. Ketelsen tohelp increase the number of women in leadership positions. Since then, the grouphas worked with management and corporate human resources officers to achieve itsgoals. Approximately 20 executive and management women from all company divi-sions are part of the Council, which also has a non-member senior executive liaison.The Council receives its operating budget from the company and uses company per-sonnel, facilities and communications services. Members of the Women’s AdvisoryCouncil helped corporate human resources officers facilitate company-wide adop-tion of “Workforce 2000 Initiatives,” a training program for addressing workforcediversity issues. The group also assisted corporate human resources officers in devel-oping the “Work/Family Support Program,” which offers a range of work and familybenefits, including a six-month, unpaid family care leave. The number of women insenior management has grown significantly since the Council was established.
The Initiative is a management-supported group of approximately 50 female engi-neers, managers, and technical employees in the company’s Corporate Services divi-sion. Founded as a grassroots effort by two women in 1990, the stated charter of thegroup is to champion the full participation of Corporate Services women at all levelsand aspects of the business by promoting their professional and personal goals. TheWomen’s Initiative helps top management understand and resolve issues that willenable the company to better recruit and retain women. Using the CorporateServices Women’s Initiative as a model, five additional women’s networks haveformed in other company divisions.

199
DESCRIPTION
The policy was instituted in February 1991 as part of an overall effort to bringmore structure to a relatively liberal environment. When confronted with sexualharassment situations, the company is not reluctant to take action; offenders are terminated when appropriate. The policy has three components: a statementdefining and prohibiting sexual harassment; a section outlining managers’responsibility, and a section describing the process of filing and resolving grievances.
A company-wide sexual harassment policy was implemented in the early 1980 as a step toward ensuring a nondiscriminatory workplace. The employeemanual, “Dealing With Sexual Harassment, a Guide for Employees,” conveys thenature and implications of sexual harassment by illustrating real-life examples of improper behavior, and consequences for harassers. The “New Focus onSexual Harassment” workshop sensitizes supervisors and employees to thenuances of sexual harassment through videotapes, case studies, and role playing.
In 1987, the company developed this four-hour workshop to help create aresponsible and respectful environment free of sexual harassment and discrimi-nation. The workshop uses a videotape of real-life examples of sexual harass-ment, including the more subtle forms, the offensiveness of which men are oftenunaware. After an employee discussion of their perceptions of sexual harass-ment, the facilitators define the legal parameters and implications of sexualharassment. Another video shows the company’s chief executive officer express-ing his disapproval of sexual harassment. The final segment outlines theresources available to employees and the actions they can take.
COMPANY PROGRAMS
Apple Computer Sexual Harassment Policy
AT&T Policy Training manual
E.I. du Pont de A Matter of RespectNemours & Company
SUMMARY TABLES: WORKFORCE DIVERSITY INITIATIVES ELIMINATION OF SEXUAL HARASSMENT

200
DESCRIPTION
A task force was appointed in November 1986 to examine work and family issues. The task force reviewed the programs of 33 work-and-family-supportivecompanies, surveyed 2,000 Kodak employees and consulted with work and family specialists. The result was a comprehensive work and family programwhich includes up to 17 weeks of unpaid, job-protected family leave, child care resource and referral service, and corporate funding for start-up cost forday-care homes in Kodak communities.
A surprisingly high number of men have taken advantage of a generous familyleave policy without stigma and without derailing their careers. Also unusual isthe length of leave the men have taken to care for their infants: an average of12.2 weeks, which is just a week less than the average leave for mothers. Fullhealth coverage continues during leave, and employees are assured of returningto the same or comparable job.
Fel-Pro increased its financial aid for adoption from $2,500 to $5,000 andincreased its tuition refund benefits from $2,500 to $3,000 for undergraduatestudies and from $5,000 to $6,500 for graduate studies. Tuition reimbursementhas been extended to part-time employees, who are mostly female.
The company designed its innovative Family Care Issues to help recruit andretain top talent. The company has instituted a program that includes such benefits as a one-year unpaid leave of absence and an on-site child care center.But the company has gone beyond traditional work and family programs: aSummer Care Fair offers employees and the public information about summercamps and programs in New England and a “Kids-to-go” program works withlocal day care centers to provide activities for the school-aged children ofemployees during school holidays and vacations.
COMPANY PROGRAMS
Eastman Kodak Company Work and Family Program
Parental Leave
Fel-Pro, Inc. Family Friendly Programs
John Hancock Financial Services Family Care Issues
SUMMARY TABLES: FAMILY FRIENDLY PROGRAMS

201
COMPANY PROGRAMS
Johnson & Johnson Balancing Work and Family Program
Marquette Electronics On-Site Daycare, Flexible Work Schedules
NationsBank Shared Parenting
SC Johnson Wax Child care/ parental leave
DESCRIPTION
The program includes the following components: Child Care Resource andReferral; On-site Child Development Centers; Dependent Care Assistance Plans;Family Care Leave; Family Care Absence; Flexible Work Schedules; AdoptionBenefits; SchoolMatch; Elder Care Resource and Referral; Relocation Planning;and Employed Spouse Relocation Services. These initiatives were designed inlarge part to address the changing composition of their work force — theincreasing numbers of women, two-career families, single parents, and the children of elderly parents. The company conducted a survey that showed thatbetween 1990 and 1992, supervisors became significantly more supportive ofemployees when work/family problems arose and supervisors were also seen as more supportive of the use of flexible time and leave policies. There was, however, no impact on absenteeism or tardiness.
Marquette has two on-site centers serving 175 children. Workers can adjust theirschedules daily, if necessary, to meet family needs.
The bank is one of the first, if not the only company to offer fathers paid timeoff to care for their newborn children. The policy is based on the company’sbelief that parenting is a shared responsibility. New fathers receive up to sixweeks of paid paternity leave: for each year of service they accrue one week ofleave.
One of the company’s foremost work and family benefits is its on-site child careprogram, established in 1985. The child-care program provides before- and after-school care, transportation to and from school, a kindergarten programand parent training for employees. The center has been accredited by theNational Association for the Education of Young Children. During the summer,the company offers full-time day care for school-age children of employees.
SUMMARY TABLES: FAMILY FRIENDLY PROGRAMS

202
DESCRIPTION
The parental leave policy allows up to three months of unpaid leave for bothmale and female employees. This is in addition to the paid medical leave for themother. The option to work part-time following parental leave is also available.
The Adoption Reimbursement Program reimburses employees for 100 percentof their covered expenses — up to a maximum of $2,000. The adoption ofstepchildren is covered and adopted children can be any age up to 18. There are no limits on the number of adoptions per employee that can qualify forreimbursement. Covered expenses include legal, court, adoption agency and placement fees, medical expenses, and transportation expenses, and transportation expenses associated with picking up the child.
A child care center in the home office building is available to all JC Penney Co.,Inc. employees. The 10,000-square-foot facility can accommodate 157 childrenfrom 6 weeks to 5 years of age at an average cost of $100 per week.
Tandem has offered a nine-week unpaid parental leave for over 10 years. A full-time disability leave manager helps expectant parents obtain and process thenecessary medical and insurance forms, and an on-staff nurse is available tocheck on the health of pregnant employees. Tandem also recognizes infertilityby covering up to three in-vitro fertilization treatments as well as expenses forsurrogate mothers.
To generate awareness and build broad-based support, Sprint appointed 150employees from a range of company divisions to 11 career and family actionteams. The teams developed the blueprint of the FamilyCare program.Announced in July 1989, FamilyCare provides flexible work schedules, a depen-dent-care resource and referral service, adoption assistance, personal and familycounseling, working-partner relocation assistance, and flexible health-care bene-fits.
COMPANY PROGRAMS
Pacific Gas and Electric Adoption Reimbursement Program
JC Penney Co., Inc. On-Site Child Care
Tandem Computer, Inc. Model Maternity Leave
US Sprint FamilyCare Program
SUMMARY TABLES: FAMILY FRIENDLY PROGRAMS

203
SUMMARY TABLES: FAMILY FRIENDLY PROGRAMSDESCRIPTION
The program allows female or male managers to return to work on a part-timebasis for up to three years following the birth or adoption of a child, while main-taining the benefits of a full-time employee. Andersen clearly communicates thatmanagers who work part-time at some point in their careers will remain eligiblefor partnership; flexible work arrangements will lengthen an employee’s pro-gression toward partnership, not derail it.
Corning’s policy states that “alternative job schedules are privileges—not rights.”An employee must have a good performance rating and the position must lenditself to a nontraditional schedule. Options include part-time, flextime, job sharing, and work at home.
Flexible work arrangements, including those at the managerial level, have beenavailable on an ad hoc basis since the early 1980s. In November 1988 a formalpolicy was introduced in which part-time, job sharing, and flextime are availableto all employees.
In 1987 the bank began offering employees on parental leave the opportunity to rejoin the workforce at their own pace during a six-month leave period.Employees arrange their schedules with their managers, receive full benefits and a prorated salary, and return to the same or comparable position. The bankalso offers Select Time, a part-time program instituted in 1988. Although SelectTime has been used mostly by officers and managers, it is available to any employee who has worked at NCNB at least a year and performs at a level rated“satisfactory” or above.
Pacific Bell has been researching the business costs and payoffs of telecommut-ing since the inception of its pilot telecommuting program in May 1985. Thecompany defines telecommuting as working from a site other than the officeusing telecommunications technology.
COMPANY PROGRAMS
Arthur Andersen & Co. Flexible Work Program
Corning Glass Works, Inc. Alternative Job Schedules
Eastman Kodak Company Professional Flexible Work Arrangements (FWAs)
North Carolina National Bank Alternative Work Schedules
Pacific Bell Telecommuting

204
SUMMARY TABLES: FAMILY FRIENDLY PROGRAMS FLEXIBLE WORK ARRANGEMENTSCOMPANY PROGRAMS
The San Francisco Model Alternative Work Bar Association Schedule Policy
Sidley & Austin Part-time Work Policy
Skadden, Arps, Slate, Part-time policyMeagher & Flom
DESCRIPTION
The policy, drafted by the association’s Committee on Equality, outlines fouroptions that it says firms should make available to lawyers: (1) flextime; (2) part-time; (3) job sharing; and (4) flexiplace. The model policy is compatible withthe American Bar Association, the Oregon State Bar Association and the policyput forth by the Minnesota Women Lawyers. The four models agree that:
• Alternative work schedules should be available to both men and women;• Compensation should be calculated on a pro rata basis, with full or
prorata benefits;• There should be periodic review of alternative work schedule
arrangements;• There should be uninhibited promotion and advancement for part-time
attorneys, but those attorneys have a responsibility to keep regular hours and to be available even when not in the office.
The law firm, located in Chicago, introduced a part-time work policy in 1987. Part-time, normally 60 to 80 percent of a full-time work load, is not restricted to depen-dent-care needs. Most often it is new mothers who take advantage of the policy,which entitles them to take up to an eight-month, full-time parental leave. After thisleave ends, the firm permits the associate to work part-time for up to six months. Ifthe arrangement does not jeopardize the needs of the practice, an employee canrequest to work part-time indefinitely.
In 1981, the law firm adopted a policy allowing attorneys with two years of experi-ence at the firm to work part-time. In 1984, the option was expanded to includenew recruits. The policy has no restrictions in terms of duration. While part-timeattorneys are not on the partnership track, they can pursue partnership once theyreturn to full-time status.

205
SUMMARY TABLES: FAMILY FRIENDLY PROGRAMS FLEXIBLE WORK ARRANGEMENTSCOMPANY PROGRAMS
Steelcase, Inc. Professional Job Sharing
Tucson Medical Center Alternative Scheduling
DESCRIPTION
After offering job-sharing for 6 years to nonexempt salaried employees, the com-pany extended the option to its entire work force in 1988. Management encour-ages employees and their supervisors to customize job sharing arrangements.The most common arrangement features a weekly schedule divided between thepartners. Job sharers receive half of their medical, dental, and life insurancebenefits, but can purchase a full package at the company’s group rate. Vacationand sick days are prorated, and annual merit raises and promotion opportunitiesare preserved.
The 15-member Nursing Recruitment and Retention Committee works withsenior administration and the governing board to identify projects and pro-grams that help prevent or reduce the effects of the nursing shortage. Staffingand scheduling are known to be areas of dissatisfaction for nurses and may causea nurse to leave an institution. Tucson Medical Center has the traditional eight-hour shift, and also ten-hour, twelve-hour, split, and other nontraditional shifts.In many cases, through a process of self-scheduling, the nurses put these shiftstogether to provide 24-hour coverage. This departure from traditional schedul-ing by the management team allows staff nurses to develop their own work calen-dar within some pre-established parameters.

206
SUMMARY TABLES: FAMILY FRIENDLY PROGRAMS PARENTAL LEAVECOMPANY PROGRAMS
Aetna Life & Casualty Family Benefits
Corning Glass Works, Inc. Policy
IBM Policy
Proskauer, Rose, Goetz & Family Benefits for MenMendelsohn
DESCRIPTION
A Family Leave Policy was implemented in June 1988. The policy grants employ-ees, both male and female, up to six months of unpaid leave following the birthor adoption of a child or to deal with a serious illness of a parent, spouse, orchild.
The parental leave policy provides six weeks of disability leave for maternity,including full benefits, followed by an optional 20 weeks of child care leave fornew fathers as well as mothers, including adoptive parents, and an optional part-time return. At the end of parental leave or at any other point an employeeneeds more time for family care responsibilities, he or she may elect to work flexible hours, arrange a jobsharing situation or work at home. The programallows employees temporary part-time work assignments when they need todevote extra time to caring for children or other dependent relatives.
In October 1988, IBM extended its unpaid personal leave of absence from 1 to 3years to help employees balance career and family responsibilities. Employeestaking leaves of one year or less are guaranteed their same or a comparable jobupon return; workers who take longer leaves are assured of a job but not neces-sarily at the same salary or level.
In March 1989, this law firm adopted a policy granting three-month paidparental leaves for male and female associates. The policy dictates that “eligibilityfor partnership consideration shall not be affected in any way by the fact that anassociate has been on child care leave, although the timing of such considera-tion may be affected if the leave or leaves are for extended periods.” To qualifyfor the paternity leave, new fathers must be the primary caregiver in the familyand must have been employed by the firm for at least a year.

207
DESCRIPTION
The program is championed by Allstate Insurance Company, American Express Company, Amoco Corporation, IBM Corporation, Johnson & Johnson,Motorola, Inc., The Travelers, Xerox Corporation, and Work/Family Directions.The collaboration is an effort by 109 companies and 28 public and private organizations to ease the work/family conflicts of their employees. This uniqueeffort aims to increase the supply and enhance the quality of dependent care services for their employees and the communities in which they live and work.The Collaboration has invested more than $25 million in 300 dependent careprograms in 44 communities.
In collaboration with the New York City Department for the Aging, the programwas developed to assist employees with elder-care support. The companies fundthe program, and in turn, they choose Department of Aging services that best fittheir needs and corporate cultures. Among them are on-site seminars foremployees on such topics as legal and financial planning and nursing homeplacement, individual consultation to assess the elder-care needs of employeesand to refer employees to appropriate resources, an elder-care counseling “hot-line,” and technical assistance for human resources professionals in designingand communicating elder-care benefits packages. Representatives from sponsor-ing companies meet on a regular basis to discuss the status, strategies, and goalsof the partnership.
Based on an employee survey indicating child care as a major concern, andstrong support from its Chief Executive Officer, the company opened an on-sitechild care center in 1988. The 4,900-square-foot center, housed in an officebuilding adjacent to corporate headquarters, was imaginatively designed by anarchitect with experience in child care center planning. Each age group has aseparate room, and a complex security system ensures safety and proper visitoridentification. While the center is open to the community, children and
COMPANY PROGRAMS
Allstate Insurance Company, The American BusinessAmerican Express Company, Collaboration for Amoco Corporation, IBM Quality Dependent CareJohnson & Johnson, Motorola, Inc., The Travelers, Xerox Corporation,and Work/Family Directions
American Express Company, Partnership for EldercareJ.P. Morgan, and Philip Morris
Champion International On-site child care center Corporation
SUMMARY TABLES: FAMILY FRIENDLY PROGRAMS DEPENDENT CARE

208
SUMMARY TABLES: FAMILY FRIENDLY PROGRAMS DEPENDENT CARECOMPANY PROGRAMS
IBM Elder Care Referral Service (ECRS)
Stride Rite Corporation On-site intergenerational center
DESCRIPTION
grandchildren of Champion employees are given preference. Currently, the cen-ter provides care for 60 children aged three months to five years, and a waitinglist exists. In keeping with Champion’s commitment to accessible, high-qualitycare, the center is accredited by the National Association for the Education ofYoung Children.
IBM introduced its Elder Care Referral Service in February 1988 to ease the care-giving responsibilities of its U.S. employees, retirees, and their spouses. Througha nationwide network of 200 community-based organizations, ECRS provides per-sonalized telephone consultation, which educates employees on elder care issuesand refers them to services or care providers in the area in which their depen-dent relative resides. IBM offers the referral service on a prepaid contractualbasis, while the employee or older relative selects and pays for the actual careprovided.
Opened in March 1990, the center was the first of its kind to be sponsored by anAmerican company. To assist with the center, Stride Rite has enlisted the help ofWheelock College, a Boston-based school that specializes in child care and familystudies, and Somerville-Cambridge Elder Services, a local nonprofit agency thatprovides assistance to the elderly. At full capacity, the center accommodates 55children (ranging in age from 15 months to 6 years), and 24 adults age 60 andover. To foster the relationship between children and elders, the center sponsorssuch activities as reading and writing stories, playing games, celebrating holidays,cooking and arts and crafts. It is open to employees as well as to members of thecommunity, some of whom receive state-subsidized membership. There is a sliding-scale fee structure based upon family income.

METHODOLOGY FOR MEASURING GLASSCEILING REALITIES FOR THE AFRICANAMERICAN AMERICAN, INDIAN, ASIAN ANDPACIFIC ISLANDER, AND HISPANICAMERICAN POPULATIONS
An analysis of the 1990 Census data was conductedto establish baseline employment characteristicdata on a national level for the specific ethnicgroup and for other variables. By performing a sec-ondary data analysis (i.e., analysis of existing gov-ernment datasets), alternate variables for describ-ing potential glass ceiling conditions encounteredby each ethnic group were identified.
Despite the lack of specificity of senior-level posi-tions under the current Standard OccupationClassification System (SOC) on the 1990 Census,there were other characteristics which were ana-lyzed to improve our knowledge of the occupationpatterns. Using the 1990 Census Public UseMicrodata Sample (PUMS 5% dataset), the follow-ing variables were processed and analyzed:
A. Class of worker/work segment was related toadvancement opportunities and income. Thepotential barriers to professional advancementvaried depending on whether the persons works
for the government, or profit company, or not-for-profit organization. For the purposes of thisreport, the focus of the data extractions was theprivate for profit segment.
B. Industry played a role in the occupation oppor-tunities. There was more mobility in certain indus-tries than others. Also, the salary range differed byindustry. By knowing the employment patternbased on industry, it explained the occupationand income differentials. Industry categories ana-lyzed were: manufacturing, transportation, com-munications, public utilities; wholesale trade,retail trade, finance, insurance, and real estate,business services and repair services, professionaland related services, public administration, andother industries.
C. Nativity affected employment and occupationopportunities. Immigrants’ employment experi-ence differed from the U.S.-Born experience. Forthe Asian and Pacific Islander American commu-nity, given that two-thirds of the Asian and PacificIslander Americans are immigrants and that morethan half of them immigrated to the U.S. duringthe 1980s, this particular segment in the work-force would not have had enough time to “climb 209
METHODOLOGY FOR MEASURING GLASS CEILING REALITIES

210
the corporate ladder.” The fields that were analyzed in regard to nativity for API and theHispanic communities were U.S.-Born and Foreign Born.
D. Income was an important variable for assessingwhether executives/administrators and managersare at par with their peers. The wage/salaryincome ranges that were analyzed for the fourgroups were: zero to $24,999, $25,000 to $49,999,$50,000 to $74,000, $75,000 to $99,999, $100,000to $139,000, and $140,000 or more.
E. Gender was important in examining differ-ences in occupational achievements of men andwomen. Certain occupations and industries aredominated by men or women; thus the distinctionin the analysis was useful.
F. Educational attainment was used in determiningthe return on investment. The education attain-ment categories analyzed were: (a) Less than a bachelor’s degree (b) bachelor’s degree(c) master’s or professional degree, and (d) doctorate degree.
G. Age was a variable used in this analysis forHispanic Americans. Variances in the mean wageincome in the datasets was an indicator of the negative impact of the glass ceiling in the area of compensation. It is hypothesized that whencontrolling for education and other factors,
Hispanic Americans just out of college (betweenthe ages of 25-29) are being compensated at levels equal, or relatively close to their white non-Hispanic male counterparts. In addition, asHispanics climb the occupational “pipeline” theirmean-wage income lags behind that of their whitemale counterparts—an indication of the pressureof the glass ceiling. Thus, Hispanic male employ-ees between the ages of 40-54 have significantlylower incomes than their white non-Hispaniccounterparts.
Two analyses were performed: one nationally and the other by states with the largest group ofthe specific ethnicity. The Hispanic American subgroups that were analyzed were MexicanAmerican, Puerto Rican American, CubanAmerican and Other Hispanics. Asian and PacificIslander American subgroups examined were:Chinese, Filipino, Japanese, Korean, Vietnamese,Asian Indian and Other Southeast Asians.Hawaiian was the only Pacific Islander group disaggregated in this analysis.
The occupation category for analysis was limitedto the executive, administrator, and manager level as this is the level that is most impacted bythe glass ceiling. The 1990 Census codes “006”through “022” were taken as an aggregate groupto comprise this category. (Refer to the StandardOccupational Classification Tables).

211
The cross-tabulations controlled for the executives, administrators, and managers of private-for-profit companies by gender. The following cross-tabulations were performed:
1. Race by Occupation by Gender2. Race by Industry by Gender3. Race by Industry by Class of Work by Occupation by Gender4. Race by Industry by Class of Work by Education by Occupation by Gender5. Race by Industry by Class of Work by Education by Occupation by Gender

212
The Industry Classifications used in this report arebased on the 1990 Census of Population ofHousing. The classifications were developed fromthe 1987 Standard Industrial Classification (SIC)table.
There were seven broad categories used in theanalysis: 1) Business Services; 2) Finance,Insurance and Real Estate; 3) Manufacturing; 4) Retail trade; 5) Wholesale trade; 6) Transportation and Public Utilities; and7) Public Administration.
The industry analysis was performed for theUnited States (National level) and regions withthe highest population percentage of the specificrace/ethnicity group (except African Americans)as defined by the 1990 Bureau of the Census (5%)
PUMs dataset. The agriculture and mining indus-tries were examined in the analysis. However, thedata cells for the senior level executives, adminis-trators, and managers were too small to be statisti-cally significant/reliable; thus, these industrieswere not reported.
The Asian subgroups examined were: Chinese,Filipino, Japanese, Korean, Vietnamese, AsianIndian and other Southeast Asians. The Hispanicsubgroups examined were: Cuban, Puerto Rican,Mexican and other Hispanics.
The occupation category for this analysis was lim-ited to the executive, administrative, and manage-rial level, as this is the level that is most impactedby the glass ceiling effect.
STANDARD INDUSTRY CLASSIFICATIONS (SIC)

The table refers to the industry codes analyzed.
SIC Code Industry Category010-032 Agriculture, Forestry, and Fisheries 040-050 Mining100-392 Manufacturing400-472 Transportation, Communications
and Public Utilities500-571 Wholesale trade580-691 Retail trade700-710 Finance: Banking, savings
institutions including credit unions, credit agencies, security, commodity brokerage, and investment companies.
711 Insurance712 Real Estate, including real estate
insurance offices721 Advertising722-741 Business Services812-840 Health Care: offices and clinics,
hospitals, nursing, and personal care facilities, health services
900-932 Public Administration
213
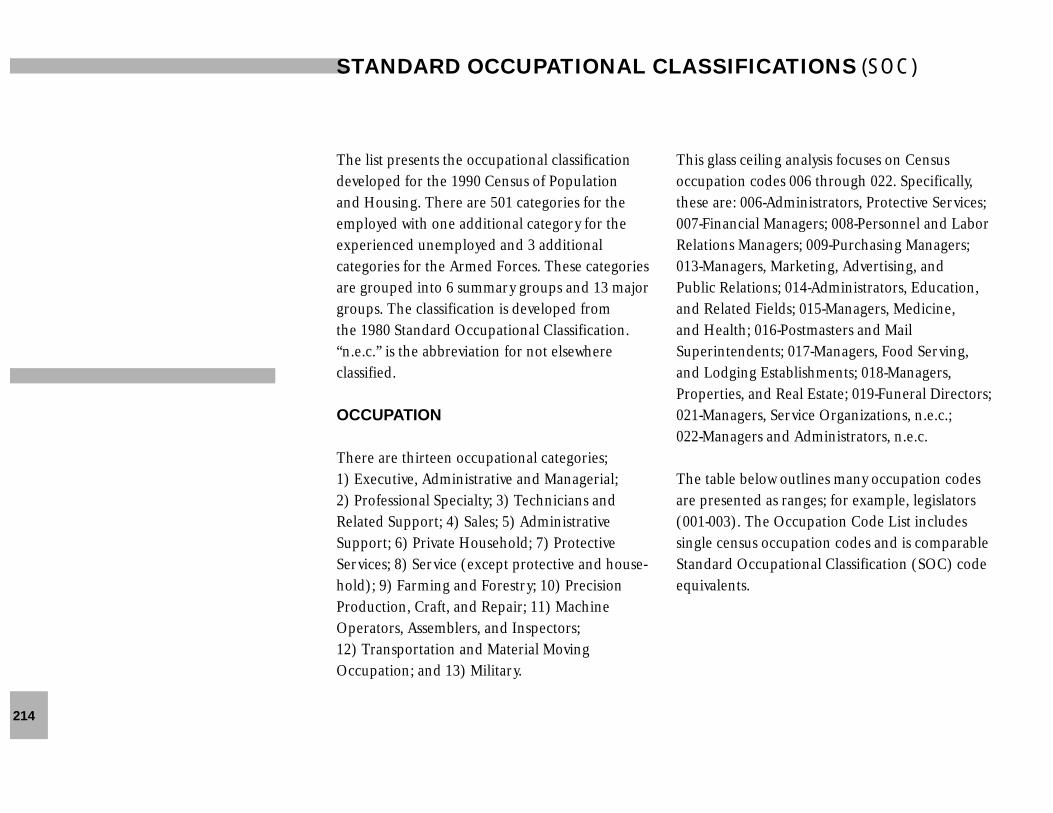
The list presents the occupational classificationdeveloped for the 1990 Census of Population and Housing. There are 501 categories for theemployed with one additional category for theexperienced unemployed and 3 additional categories for the Armed Forces. These categoriesare grouped into 6 summary groups and 13 majorgroups. The classification is developed from the 1980 Standard Occupational Classification.“n.e.c.” is the abbreviation for not elsewhere classified.
OCCUPATION
There are thirteen occupational categories; 1) Executive, Administrative and Managerial; 2) Professional Specialty; 3) Technicians andRelated Support; 4) Sales; 5) AdministrativeSupport; 6) Private Household; 7) ProtectiveServices; 8) Service (except protective and house-hold); 9) Farming and Forestry; 10) PrecisionProduction, Craft, and Repair; 11) MachineOperators, Assemblers, and Inspectors; 12) Transportation and Material MovingOccupation; and 13) Military.
This glass ceiling analysis focuses on Census occupation codes 006 through 022. Specifically,these are: 006-Administrators, Protective Services;007-Financial Managers; 008-Personnel and LaborRelations Managers; 009-Purchasing Managers;013-Managers, Marketing, Advertising, and Public Relations; 014-Administrators, Education,and Related Fields; 015-Managers, Medicine, and Health; 016-Postmasters and MailSuperintendents; 017-Managers, Food Serving,and Lodging Establishments; 018-Managers,Properties, and Real Estate; 019-Funeral Directors;021-Managers, Service Organizations, n.e.c.; 022-Managers and Administrators, n.e.c.
The table below outlines many occupation codesare presented as ranges; for example, legislators(001-003). The Occupation Code List includes single census occupation codes and is comparableStandard Occupational Classification (SOC) codeequivalents.
214
STANDARD OCCUPATIONAL CLASSIFICATIONS (SOC)

215
Occupation Category
MANAGERIAL AND PROFESSIONAL SPECIALTY OCCUPATIONS
Executive, Administrative, and Managerial Occupations
006 Administrators, Protective Services007 Financial Managers008 Personnel and Labor Relations Managers009 Purchasing Managers013 Managers, Marketing, Advertising, and Public Relations014 Administrators, Education, and Related Fields015 Managers, Medicine, and Health016 Postmasters and Mail Superintendents017 Managers, Food Serving, and Lodging Establishments018 Managers, Properties, and Real Estate019 Funeral Directors021 Managers, Service Organizations, n.e.c.022 Managers and Administrators, n.e.c.
n.e.c. = not elsewhere classified

METHODOLOGY
The 25 CEOs interviewed did not represent a sci-entific random sample. Participants were chosenacross industry and geographic lines, with a mixof small and large, public and private businesses.No CEO who was asked to participate refused.Some of the companies they lead do business on aregional basis, most are national, and a few oper-ate in the international marketplace. Eight minor-ity-owned businesses headed by men were includ-ed in the sample. The following selection criteriawere used:
Minimum Number of Employees:500 to 500,000
Minimum Annual Revenue: $5 million to $84 billion
Ownership:Publicly traded and privately owned
Headquarters Location/Service Areas: East Coast, South, Midwest, Southwest, West Coast
Industrial Sectors:Manufacturing, transportation, communications,advertising, print media, television and telecom-munications, public utilities, wholesale and retailtrade and distribution, investment banking, law,information technology, aerospace, and defense.
The interviews were conducted by representativesof the Glass Ceiling Commission’s ResearchConsortium. All interviews were based on the setof questions that follow. The interviews were con-ducted as structured, hour-long conversations,and not as strict question-and-answer interroga-tions. Whenever possible, the interviewers askedfor examples and anecdotes to illustrate thepoints the CEOs were making. To encourage thehighest levels of candor, the CEOs were grantedanonymity. The conversations were not recordedbut the interviewers did take detailed notes. Onoccasion, the interviewers read back statements tothe interviewees to ensure that the CEO was beingquoted accurately.
The 25 interviews were compiled in a paper enti-tled In Their Own Words: CEO Views of Diversity atthe Top. This paper, available from the GlassCeiling Commission, provides an extensive review216
SURVEY OF CEOs

of the opinions, experiences, and judgmentsexpressed by CEOs about the problems and challenges inherent in achieving gender, racial, and ethnic diversity at the top.
QUESTIONS POSTED IN NONRANDOMSAMPLE INTERVIEWS WITH CEOS
Diversity, along with Team Management andQuality Management, has received a great deal ofattention by management experts over the pastfive years. In fact, a whole industry has grownaround diversity training. Yet there continues tobe a debate between (1) those who assert thatdiversity—in terms of minorities and women—on boards and in the top ranks of management iscrucial to the future of healthy business, and (2)those who feel equally as strongly that the bestinterest of business and the bottom line is servedby homogeneous top management—like-mindedindividuals pursuing mutual goals. Most of theacademicians and advocates who argue these matters pro or con are not on the firing line. You are and we are interested in your experienceand point of view.
In your opinion, what are the downsides and up-sides of diversity at the top?
Has your Board put any pressure on you one wayor the other? Have you put pressure on yourBoard?
Have you experienced pressure from other quar-ters? If so, where has it come from and how haveyou been able to respond?
(IF THEY SEE MORE DOWNSIDES THAN UPSIDES:
THE FOLLOWING APPLY)
What has been your experience in hiring and promoting minorities and women?
Has your reluctance to include more minoritiesand women in the pipeline caused any problems?If so, with whom and how have you dealt withthose problems?
(IF THEY SEE MORE UPSIDES THAN DOWNSIDES:
THE FOLLOWING APPLY)
What motivated you to support the inclusion ofminorities and women in top policy-making anddecisionmaking levels?
What management challenges did you face whenyou moved to increase the representation ofminorities and women in the top management of your organization?
How did you motivate your in-place managers tochange the way they think about staffing?
What formal programs were put in place regard-ing recruitment, development, succession, and so 217

forth? Have there been informal activities thatpromoted diversity?
What were the major obstacles you met in promot-ing the inclusion of minorities and women? Whatwere the outstanding successes? Have the formalor the informal actitivities proven most successfulin increasing diversity at the top?
What have you learned? What indication do youhave that diversifying top management has beengood for business?
218
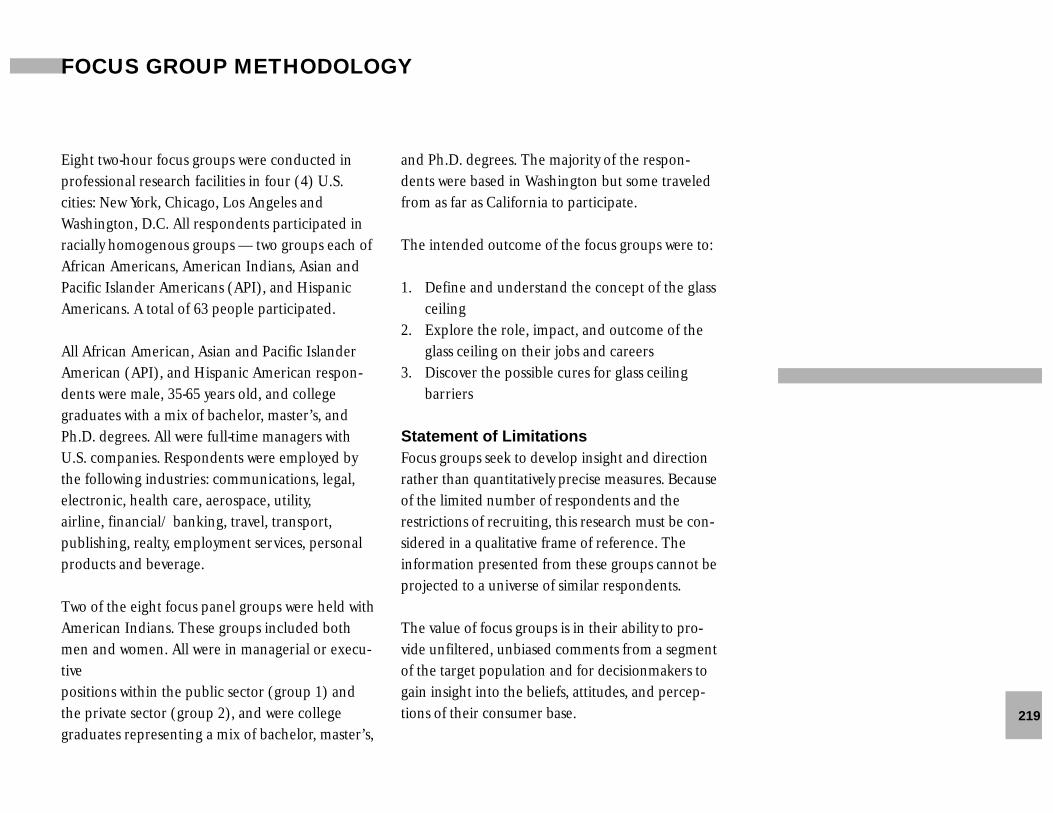
219
Eight two-hour focus groups were conducted inprofessional research facilities in four (4) U.S.cities: New York, Chicago, Los Angeles andWashington, D.C. All respondents participated inracially homogenous groups — two groups each ofAfrican Americans, American Indians, Asian andPacific Islander Americans (API), and HispanicAmericans. A total of 63 people participated.
All African American, Asian and Pacific IslanderAmerican (API), and Hispanic American respon-dents were male, 35-65 years old, and college graduates with a mix of bachelor, master’s, andPh.D. degrees. All were full-time managers withU.S. companies. Respondents were employed by the following industries: communications, legal,electronic, health care, aerospace, utility, airline, financial/ banking, travel, transport, publishing, realty, employment services, personalproducts and beverage.
Two of the eight focus panel groups were held withAmerican Indians. These groups included bothmen and women. All were in managerial or execu-tive positions within the public sector (group 1) andthe private sector (group 2), and were college graduates representing a mix of bachelor, master’s,
and Ph.D. degrees. The majority of the respon-dents were based in Washington but some traveledfrom as far as California to participate.
The intended outcome of the focus groups were to:
1. Define and understand the concept of the glass ceiling
2. Explore the role, impact, and outcome of the glass ceiling on their jobs and careers
3. Discover the possible cures for glass ceiling barriers
Statement of LimitationsFocus groups seek to develop insight and directionrather than quantitatively precise measures. Becauseof the limited number of respondents and therestrictions of recruiting, this research must be con-sidered in a qualitative frame of reference. Theinformation presented from these groups cannot beprojected to a universe of similar respondents.
The value of focus groups is in their ability to pro-vide unfiltered, unbiased comments from a segmentof the target population and for decisionmakers togain insight into the beliefs, attitudes, and percep-tions of their consumer base.
FOCUS GROUP METHODOLOGY

EMPLOYED PERSONS WITHIN INDUSTRY BY RACE AND HISPANIC ORIGIN
FinanceBusiness Insurance Public Retail Wholesale
Industry Services Communications and Real Estate Manufacturing Administration Trade Transportation Utilities Trade
White 31,122,541 1,327,802 6,861,092 16,890,055 4,368,430 16,364,128 4,081,444 1,259,288 4,394,632Percent of Industry 79% 80% 83% 79% 76% 80% 77% 82% 83%
African AmericanPercent of Industry 4,271,203 200,754 670,697 1,961,469 847,814 1,611,127 699,951 1,57,594 328,670
11% 12% 8% 9% 15% 8% 13% 10% 6%
Hispanic AmericanPercent of Industry 2,609,580 91,562 459,141 1,793,630 340,940 1,627,779 380.003 87,444 414,909
6.6% 5.5% 5.5% 8.3% 5.9% 7.9% 7.1% 5.6% 7.8%
Asian & Pacific IslanderPercent of Industry 1,192,364 36,354 253,873 632,058 136,003 692,411 141,280 25,628 145,5402
3.0% 2.2% 3.1% 3.0% 2.4% 3.4% 2.6% 1.7% 2.7%
American Indian Percent of Industry 235,768 8,157 28,700 117,389 58,472 118,938 31,628 11,229 23,251
0.6% 0.49% 0.35% 0.55% 1.02% 0.58% 0.59% 0.73% 0.44%
Total Employed by Industry 39,431,456 1,664,629 8,273,504 21,394,602 5,751,660 20,414,384 5,334,307 1,541,184 5,307,003
Source: 1990 Bureau of the Census, Social and Economic Characteristics
220

EMPLOYED PERSONS WITHIN INDUSTRY BY GENDER AND OCCUPATIONAL LEVEL
Finance TransportationBusiness Insurance Public Retail Public Utilities Wholesale
Industry Services and Real Estate Manufacturing Administration Trade Communications Trade
Males 14,830,000 3,323,000 14,315,000 3,218,000 9,444,000 5,819,000 3,329,000Percent of Industry 37.9% 41.4% 67.6% 57.4% 48.1% 71.5% 71.6%
Female 24,254,000 4,697,000 6,868,000 2,390,000 10,174,000 2,317,000 1,322,000Percent of Industry 62.1% 58.6% 32.4% 42.6% 51.9% 28.5% 28.4%
Total Employed asExecutive/Administrator/Mgr. 4,757,000 2,089,000 2,544,000 1,201,000 1,550,000 920,000 528,000**% of total positions at Exec/Admin 12.17% 26.04% 12.01% 21.42% 7.90% 11.30% 11.35%
Males 2,415,000 1,046,000 1,874,000 702,000 834,000 627,000 341,000***% Male at occupation level 50.77% 50.07% 73.66% 58.45% 53.81% 68.10% 7.33%
Females 2,342,000 1,043,00 671,000 499,000 716,000 294,000 187,000***% Females at occupation level 49.23% 49.93% 26.38% 41.55% 46.19% 31.90% 35.42%
Total Employed by Industry 39,084,000 8,021,000 21,184,000 5,608,000 19,618,000 8,136,000 4,651,000
*Data totals do not reflect the total Civilian Labor force. Data is based on respondents to the Bureau of Labor Statistics Current Population Surveys.**Data in these rows are calculated by the total number of executives, administrators and managers divided into the total employed in the industry.***Data in this row is calculated by the total number of executives, administrators and managers (by gender) divided into the total number of executives, administrators and managers employed inthe industry.
Source: Bureau of Labor Statistics, 1990 Household Data Annual Averages*
221

GLASS CEILING HEARING ORAL TESTIMONYKANSAS CITY, KS DECEMBER 8, 1992
Testifier OrganizationSamuel L. Adams, Jr. School of JournalismProfessor University of Kansas at Lawrence
Gloria J. Abercrombie Mid-County Development of Kansas City, Inc.Director
Lynn E. Bertuglia Women in Engineering Task ForceChairperson National Society of Professional Engineers
Wendy Bishop Corporate CommunicationsCoordinator INTERTEC Publishing Company
Diane Bliss Texas InstrumentsSales Consultant
Vicki McDonald Bowers McB Construction Specialists, Inc.President & Construction Workforce Consultants, Inc.
Sharon Sanders Brooks Human Relations DepartmentCivil Rights Investigator Kansas City, Missouri
Towanda Hall Combs INROADSManaging Director Kansas City, Missouri
Linda G. Cooper LGC and AssociatesFounder and President
Carolyn B. Elman American Business Executive Director Women’s Association
Mary Fogarty Board of Public UtilitiesPower Plant Operator
Testifier OrganizationCynthia Frewen-Wuellner National Association of WomenBoard Member Business Owners
Stacy A. GalaryAttorney
Dr. Jacob U. Gordon Institute for Black Leadership,Executive Director Development and Research
University of Kansas at Lawrence
Ron Griffin Washburn UniversityProfessor of Law
Ascension Hermandez League of United Latin American National Vice President, Midwest Citizens
Bobbi L. Herring Central ExchangeExecutive Director
Gromer Jeffers, Jr. Kansas City Association of BlackPresident for Print JournalistsKansas City Chapter, Kansas
Dr. Sue P. McDaniel Missouri Women’s Council on Executive Director Economic Development
Dr. John Maestas Institutional AdvancementVice President College of West Virginia
Ruth L. Margolin Women’s CenterExecutive Director University of Missouri
Annalisa Miranda The School District ofMaterial Control Manager of Kansas City, Missouri222
PUBLIC HEARINGS: ROSTER OF ORAL TESTIMONY

223
Testifier OrganizationAlbert L. Myers Lincoln UniversityDirector Career Advisement, Planning, and
Placement
Monica Nightingale-Hawkins AA ProductionsVice President Marketing/Productions
Dr. Tzy C. Peng McDonnell-Douglas CorporationRetired Senior Scientist
M. C. Richardson United Minority Media AssociationChairman
Kim E. Rose Hyatt Regency Hotel,Director of Human Resources Kansas City, Missouri
Levita Ross Job Referral/Intern ProgramCoordinator United Minority Media Association
Laura Ruffin Urban League Greater Kansas CityVice President Kansas City, Misssouri
Louis Smith Kansas City Division ofPresident Allied Signal Aerospace Company
Bridget Sperl Human Resources ServicesVice President IDS Financial Service, Inc.
Dr. Michele Stern Black & Veath
Mickey D. Vulgamott
Turner White Communications and MarketingVice President Kansas City Power & Light
GLASS CEILING HEARING ORAL TESTIMONY DALLAS, TXDECEMBER 10, 1993
Testifier OrganizationRichard J. Bela Hispanic Association on Corporate President Responsibility
Marjory Lou BettesAttorney
Robert Blonk AT & T Power SystemsManager Human Resources
Billie Bryant CESCOOwner & President
Paula Clements National Association of Women in Executive Director Construction
Sandy Cooke American Women in Radio & President TelevisionDallas Chapter
Gale Duff-Bloom JC Penney Company, Inc.Executive Vice President
Gordon England Lockheed, Fort WorthPresident
Abel M. Gonzales, Representative LULAC (League of United Latin and Member American Citizens) & Hispanic MBAs
of San Antonio, Texas
Susan Gore Mentor Group
Charles Grantham National Basketball Players AssociationExecutive Director Coalition for Equality in Sports
Raul Reyna National Hispanic Employees President Association

Testifier OrganizationGeorgia R. Scaife GTE Telephone OperationsDirector EEO/Affirmative Action
Nancy H. Steorts Women’s Working Committee on theChairman Glass Ceiling
Robert A. Vanourek Recognition InternationalPresident and CEO
Lena Watts National Organization of WomenAccountant & Member
GLASS CEILING HEARING ORAL TESTIMONYLOS ANGELES, CA FEBRUARY 11, 1994
Testifier OrganizationDr. Roy D. Adler Pepperdine UniversityProfessor & Researcher
Betsy Berkhemer-Credaire Diversity Search Partners, Inc.President/CEO Executive Recruitment
Henry Der Chinese Affirmative Action Executive Director
Robert Gnaizda The Greenlining CoalitionGeneral Counsel
Marguerite R. Griffin American Institute of CertifiedCPA and Member Public Accountants
Phyllis N. Harris Occidental PetroleumManager & Attorney Employment Compliance/EEO
Dr. Karen Hill-Scott Los Angeles Women’s Foundation Chair Person Economic Justice Initiative
Dr. Rita Mae Kelly Arizona State UniversityProfessor & Chair School of Justice
Testifier OrganizationSteward Kwoh Asian Pacific American Legal CenterRepresentative
Dr. Jonathan S. Leonard University of California at BerkeleyProfessor Haas School of Business
Felix Loya L. A. Hispanic Professional Counsel Roundtable
Shirley C. McCarty The Aerospace CorporationGeneral Manager Human Resources Division
John F. Moore Federal Reserve Bank of Senior Vice President San Francisco
Ann M. Morrison New Leaders InstitutePresident
Caroline Nahas Korn/Ferry InternationalManaging Partner
Julia Paik Asian Pacific AmericanSupervising Attorney Legal Defense Center
Paula Petrotta City Commission on the Status of Executive Director Women
Esther Renteria National Hispanic Media CoalitionRepresentative
Barbara N. Rodstein California American Women’s EconomicBoard Member Development Corporation
Dr. Judy Rosener University of California at IrvineProfessor and Author
Charles Smith Pacific BellVice Pres. & General Manager Los Angeles Region
Susan Steinhauser L.A. Women’s Appointment Co-Founder & Past Pres. Collaboration
224

225
Testifier OrganizationHenry Vasquez Hispanic Professional Roundtable
Barbara Coull Williams Pacific Gas & Electric Co.Vice President Human Resources
Arlene Falk Withers Transamerica Occidental Life InsurancePresident Company, Living Benefits Division
Janet Wood Human ResourcesVice President MCA/Universal, Inc.
Ron Zepeda Hughes Aircraft Co.President Hispanic Employee Association
OPEN MIKE
Alice La Brie
Shirley McCarty Aerospace Corporation
Marie Reichelt Human Resources and Affirmative ActionConsultant
Vivian Shimayama, Designer Breakthrough UnlimitedRepresentative CA American Women’s Economical
Development Corporation
GLASS CEILING HEARING ORAL TESTIMONYCLEVELAND, OH APRIL 22, 1994
Testifier OrganizationBraxton Baines National Football LeagueRegional Director Players Association
David R. Barclay, Vice President Work Force DiversityHughes Aircraft Co.
Alexandria J. Boone Women’s Policy and Chair Research Commission
Testifier OrganizationKevin T. Duffy Kensington InternationalSearch Consultant
Henry H. Edwards, Jr. Human ResourcesExecutive Vice President Finast Supermarkets
Barbara Fittipaldi General Leadership GroupPartner
Mareyjoyce Green Women’s Comprehensive ProgramsDirector Cleveland State University
Dr. Faith Helmick The University of AkronVice President Administrative Support Services
Edward G. Kramer Kramer and Tobocman Co., L.P.A.Senior Partner & President
Karla M. Lortz Governor’s Council on People Executive Secretary with Disabilities
Michael Mobley The Minority Economic Opportunity CenterDirector
Frances Nankoong Organization of Chinese AmericansPresident of Greater Cleveland
Dennis Raymond The Austin CompanyDirector of Personnel
Dr. Elizabeth R. Redstone Women’s Equity Action League President (WEAL) of Ohio
Dr. Sandra W. Russ Case Western Reserve UniversityAssociate Provost
Martha Sloan The Institute of Electrical and Electronics, 1993 President Inc.
Jean Curtis Ohio Bureau of Employment ServiceDeputy Administration

GLASS CEILING ORAL TESTIMONY - NEW YORK, NYSEPTEMBER 26, 1994
Testifier OrganizationGina S. Anderson New York Women’s Bar AssociationVice President
Zita Arocha National Association of Hispanic Executive Director Journalists
Barbara Arnwine Lawyers Committee for Civil Rights Executive Director Under Law
Ann Bartel Columbia UniversityProfessor School of Business
Linda Bialecki Association of Executive President Search Consultants, Inc.
Gary Brouse Interfaith Center on CorporateDirector Responsibility
M. Christine Carty Obstacles to Advancement SubcommitteeChair of the New York Women’s Agenda
Connie Chung CBS Evening NewsCo-Anchor Eye To Eye With Connie Chung
J. T. Childs International Business MachinesDirector Workforce Diversity
Anna Duran Columbia UniversityProfessor School of Business
Dorothy Gilliam National Association of Black President Journalists
Nancy R. Hamlin Hamlin & Associates, Inc.President
Shirley Harrison Philip Morris Companies Inc.Director
Testifier OrganizationDr. Charles Kamasaki National Council of La RazaVice President
Edward W. Jones, Jr. Harvard Business School President Black Alumni Association
Jeffrey A. Norris Equal Employment Advisory CouncilPresident
Sharon H. Orlopp Kinney Shoe StoresVice President
Karen Page, Chair Harvard Business SchoolAlumnae Advisory Board Network of Women Alumnae
Merble Reagon Women’s Center for EducationExecutive Director
Jenny Rivera The Puerto Rican Legal DefenseFormer Associate Counsel and Education Fund
James C. Stearns United Cerebral Palsy Association, IncPresident
Ann Taylor U. S. Trust Company of Boston
Laurence A. Tisch, CEO CBS, Incorporation
Sheila Wellington Catalyst, New YorkPresident
Dr. Bette Woody University of Massachussetts at BostonProfessor
William Monroe Trotter Institute
Elissa Opstbaum Habbart Women Rainmakers Interest Group
Abraham Nad Corporate Directorship Newsletter
Charles Ralston NAACP Legal Defense FundSenior Attorney
226

Tables/Number
1. Executive, Administrative, and Managerial Occupations By Race,Educational Attainment, and Sex.
2. Percent of Educational Level of Racial Groups Compared to Percentof Racial Groups in Executive, Administrative, and ManagerialOccupations.
3. Executive, Administrative, and Managerial Occupations For MajorIndustry Categories, By Race and Sex.
4. Executive, Administrative, and Managerial Occupations By Race,Educational Attainment, Income, and Gender (Private Sector Only).
5. Executive, Administrative, and Managerial Occupations By Race,Selected Industry, Mean Income, and Sex.
6. American Indian Labor Force Trends: 1970-1990.
7. National Asian and Pacific Islander American Executives,Administrators, and Managers of Private-For-Profit Companies ByEthnicity, Educational Attainment, and Sex.
8. Asian and Pacific Islander American Executives, Administrators,Managers of Private-For-Profit Companies: Top Four Industries.
9. National Asian and Pacific Islander American Population Executives,Administrators, and Managers of Private-For-Profit Companie,: Numberof Cases By Ethnicity, Educational Attainment and Sex.
10. National Foreign Born Asian and Pacific Islander AmericanPopulation Executives, Administrators, and Managers of Private-For-Profit Companies, Number of Cases By Ethnicity, EducationalAttainment and Sex.
11. National Asian and Pacific Islander American Population Executives,Administrators, and Managers of Private-For-Profit Companies, MeanSalary Income in 1989 By Ethnicity, Educational Attainment and Sex.
12. National U.S. Born Asian and Pacific Islander American PopulationExecutives, Administrators, and Managers of Private-For-ProfitCompanies, Mean Salary Income in 1989 By Ethnicity, EducationalAttainment and Sex.
13. National Foreign Born Asian and Pacific Islander AmericanPopulation Executives, Administrators, and Managers of Private-for-Profit Companies, Mean Salary Income in 1989 By Ethnicity,Educational Attainment, and Sex.
14. National U.S. Born Asian and Pacific Islander American PopulationExecutives Administrators, and Managers of Private-for-ProfitCompanies, Number of Cases By Ethnicity, Educational Attainment, andSex. 227
INDEX OF TABLES

15. Hispanic Adult Employed Population, By Subgroup in U.S.
16. Distribution and Representation of Private Sector Executive,Administrative, and Managerial Occupations in the U.S. By Industry,Hispanic Subgroup, and Gender.
17a. Comparison of the Mean Wage Income of Mexican American andWhite Managers, By State, Private-For-Profit Industry, Gender andHispanic Subgroup.
17b. Comparison of the Mean Wage Income of Puerto Rican and WhiteManagers, By State, Private-For-Profit Industry, and Gender.
17c. Comparison of the Mean Wage Income of Cuban, Other Hispanic,and White Managers By State, Private-For-Profit Industry, and Gender.
18a. Comparison of the Mean Wage Income of Mexican American andand White Executive, Administrative, and Managerial Populations inSelected Private-for-Profit Industries By Gender and State.
18b. Comparison of Percentage of Puerto Rican and White Executive,Administrative, and Managerial Populations in Selected Private-for-Profit Industries By Gender and State.
18c. Comparison of Percentage of Cuban, Other Hispanic, and WhiteExecutive, Administrative, and Managerial Populations, in SelectedPrivate-for-Profit Industries By Gender and State.
19a. Comparison of Mexican American and White Executive,Administrative, and Managerial Populations, in Selected Private-For-Profit Industries By Gender and State. (% of State Total).
19b. Comparison of Puerto Rican and White Executive, Administrative,and Managerial Populations, in Selected Private-For-Profit Industries ByGender and State. (% of State Total).
19c. Comparison of Cuban, Other Hispanic, and White Executive,Administrative, and Managerial Populations, in Selected Private-For-Profit Industries By Gender and State. (% of State Total).
20. Hispanic and White Non-Hispanic Mean Wage Income By Age andEducation, in Selected Private-for-Profit Industries in the U.S.
228

ANNOTATED BIBLIOGRAPHY

The following papers, part of the Advancement Study, provide currentassessments of various aspects of the glass ceiling. Each paper includespolicy and research recommendations and an annotated bibliography.
1. Barriers to Work Place Advancement Experienced by African-Americans. Ella L.J. Edmondson Bell, Sloan School of Management,Massachusetts Institute of Technology and Stella M. Nkomo, BelkCollege of Business Administration, University of North Carolina atCharlotte.
A statistical overview of the status of African American managers and anexamination of the barriers they face as described in social scienceresearch literature. The authors’ own empirical data, collected from anational sample of African American and White women managers in pri-vate sector corporations, provide a special focus on the unique barriersfaced by African American women managers. The authors find thatAfrican American men and women still lag behind White women andmen in holding management positions. Over the past 10 years, the pro-portion of African American men and women holding managementpositions has only ranged between 5 and 7 percent. At the individuallevel, the foremost barrier to their advancement are subtle racism andprejudice. Removing these barriers will require multilevel action on thepart of the government and employers. (129 pages)
2. The Glass Ceiling and Persons with Disabilities. David Braddock andLynn Bachelder. Illinois University Affiliated Program in DevelopmentalDisabilities, University of Illinois at Chicago.
This study analyzes the available literature regarding career advance-ment of persons with disabilities. It provides a rare focus on advance-ment and professional and managerial employment of this population.Representation of persons with disabilities in high level positions in theprivate sector is very limited. They are significantly underrepresented inlower management, or “pipeline” positions as well. The primary barriersfor the lack of career advancement stem from inappropriate myths andstereotypes, environmental barriers, and limited access to assistive tech-nology. Research on career advancement for persons with disabilities isextremely rare. (94 pages)
3. The Glass Ceiling in Different Sectors of the Economy: DifferencesBetween Government, Nonprofit, and For-Profit Organizations. Lynn C.Burbridge, Wellesley College Center for Research on Women.
Using U.S. Census population tapes, this paper presents an historicalperspective (1950-1990) of occupational status and earnings of profes-sional, technical, and managerial employees by race/ethnicity and sex.The research is unique in that it examines glass ceiling issues in thecontext of a 3-sector model of the U.S. economy rather than in the tradi-tional public/private context. In the past 40 years, both government andthe not-for-profit sectors drew large numbers of minority and femaleworkers. The percentage of female and male minority professional,technical, and managerial workers in the government and the not-for-profit sector was higher throughout this 40 year period than in the for-profit sector, with the exception of Asian males. (93 pages)
230
ANNOTATED BIBLIOGRAPHY

231
4. Successful Initiatives for Breaking the Glass Ceiling to UpwardMobility for Minorities and Women. Catalyst, New York, NY.
Factors necessary for successfully addressing glass ceiling issues aredeveloped through specific case studies. Initiatives conducted by over 70companies in the areas of leadership and career development, succes-sion planning, job rotation, mentoring, accountability, work force diver-sity, and family friendly programs are summarized. Research shows thatgender and racial bias at senior levels of corporate management centersaround informal culture, selection and recruitment practices, taskassignment, performance evaluation and salary decisions. Most corpora-tions do not have the mechanisms in place to monitor appraisal andtotal compensation systems that determine salary, bonuses, incentivesand perquisites for employees. While legislative and regulatory effortshave been relatively effective in gaining access to employment forminorities and women, they have not been as successful in advancingminorities and women to senior and executive leadership positions incompanies. More research is needed to broaden the business case fordiversity and to identify the variety of costs to organizations of notaddressing the glass ceiling for minorities and women. (118 pages)
5. Managing Diversity and Glass Ceiling Initiatives as National EconomicImperatives. Taylor Cox, Jr. and Carol Smolinski. The University ofMichigan.
This paper examines the connection between organizational economicperformance and effective management of diversity. A review of perti-
nent literature and the authors own research provides conceptual argu-ments and research data regarding implications for the bottom line.Extensive notes. The researchers find that managing diversity canimprove the cost structures of organizations and increase the quality ofhuman resources. Diversity in workgroups can be leveraged to increasemarketing effectiveness, creativity, innovation, and problem solving. Diversity requires managerial attention because differences amongemployees make supervision and work coordination more complex andchallenging. For these reasons, the researchers conclude that organiza-tions which excel at leveraging diversity will experience better financialperformace in the long run than organizations which are not effectivein managing diversity. (85 pages)
6. The Impact of the Glass Ceiling on the Professions. Amy Golen.This working paper discusses the impact of glass ceiling barriers on vari-ous professions, including legal, the sciences, and financial.
7. The Impact of Corporate Restructuring and Downsizing on theManagerial Careers of Minorities and Women: Lessons Learned fromNine Companies. Nancy Hamlin, Sumru Erkut, and Jacqueline P. Fields.Hamlin & Associates Inc., Marblehead, Massachusetts.
The paper presents the findings of a survey examining the restructuringand downsizing processes of nine large American companies, and theireffects on the advancement opportunities for minority and women man-agers. In more than half of the companies surveyed, white women andminorities actually increased their representation in both absolute num-

bers and in proportion to white males between 1990-1994. Theresearcher concludes that it is not necessarily the case that whenever acompany downsizes, proportionately more minority and female man-agers will lose their jobs. Companies simply do not have very manyminority or female managers they can let go that would make a sizableimpact on the magnitude of their managerial force. (48 pages)
8. Barriers to Workplace Advancement Experienced by Women in Low-Paying Occupations. Sharon L. Harlan and Catherine Waite Berheide.Center for Women in Government, State University at Albany.
This paper explores whether a glass ceiling exists for women in low-wageoccupations. The authors use the results of a wide range of empiricalresearch to identify and analyze barriers in the structure of work organi-zations, in their culture, and those external to work organizations. Educational systems that use gender, race, and class to ration access tofirst-rate education restrict future job opportunities for many women,minorities, new immigrants, and people from working class back-grounds. Nearly 70 percent of the full-time female labor force work inlow-paying occupational categories.. The growth of the contingent workforce is creating more part-time and temporary jobs in which womenand African Americans are over-represented. The low-paying jobs withthe largest number of female incumbents are not connected to anypipeline in the organization. Enforcement of rigid work schedules andlack of family sensitive employee benefits constrain women’s promotion-al opportunities. (52 pages)
9. Barriers to Workplace Advancement Experienced by NativeAmericans. Keith James, Willie Wolf, Chris Lovato, and Steve Byers.Colorado State University.
An examination of historical, cultural, social, situational, and individual
factors that have influenced patterns of Native American economic andoccupational success. Presents employment patterns across tribes andwithin them by gender, excluding Native Alaskans and Aliuts. Theauthors also differentiate between rural and urban Native Americans.Figures from the U.S. Census show that while American Indians madegains in achievement of higher level organizational positions in the1960s and 1970s, progress was halted and even reversed in the 1980s and1990s. In the 1980 census, 9.6 percent of American Indian males heldprofessional or technical positions; by 1990, this figure had fallen to 6.7percent. Barriers to American Indian economic and occupational suc-cess include lack of educational attainment and lack of capital fortribal enterprises. (52 pages)
10. Use of Enforcement Techniques in Eliminating the Glass Ceiling.Jonathan S. Leonard. Walter A. Haas School of Business, University ofCalifornia, Berkeley.
A review and analysis of available research and data examines how feder-al policies and practices have affected the advancement of minoritiesand women in the labor market, and suggests how they could bestrengthened and improved. Historical record, the researchers say, sug-gests that to be effective, affirmative action policy requires governmen-tal monitoring and sanctions. (93 pages)
11. Barriers to the Employment and Work Place Advancement of LatinosMauricio Gastón Institute for Latino Community Development andPublic Policy, University of Massachusetts at Boston.
Current research regarding the employment status of Latino/Latinaworkers and the barriers to their mobility and advancement are exam-ined. The paper focuses on labor market factors as well as workplaceorganization in examining issues ranging from recruitment to language232

233
to industrial restructuring. Despite gains in absolute numbers, theresearchers find that for Latinos in managerial and specialty professions,they remain underrepresented. Hispanics are earning higher degrees inthe fields necessary for advancement yet there are small numbers ofHispanic managers and professionals. Hispanics have the lowest full-time and full-year employment rate of any ethnic group and are dispro-portionately represented among displaced workers. (92 pages)
12. An Examination of the Impact of Family-Friendly Policies on theGlass Ceiling. Debra B. Schwartz. Families and Work Institute, NewYork.
A secondary analysis of data from The National Study of the ChangingWorkforce, a review of relevant research and business literature, and infor-mation from discussions with organizations and corporations. Itexplores access to family-friendly policies, the outcomes of the policies,and the impact of the use of leaves and flexible work arrangements oncareer advancement. Little research on the impact of family-friendlypolicies has been conducted. There is some evidence that the actualimpact of using leaves and flexible work arrangements may be less detri-mental to careers than is feared, the researchers report. Supervisor atti-tudes and company culture influence employee use of work-family poli-cies. (51 pages)
13. The Impact of the Glass Ceiling and Structural Change onMinorities and Women. Lois B. Shaw, Dell P. Champlin, Heidi I.Hartmann, and Robert M. Spalter-Roth. Institute for Women’s PolicyResearch, Washington, DC.
The recent changes in the U.S. economy and how these effect theprospects for women and minorities to enter and advance beyond entry-level positions in management is the focus of this literature review and
analysis. The authors explore corporate restructuring and industrialrestructuring and identify possible outcomes which may occur. In spiteof the problems that restructuring entails, the researchers report thatminorities and women made gains at the managerial level during the1980s. Women’s share of the positions increased substantially, but theincrease was much smaller for minority men. African Americans andHispanics of both sexes continue to be seriously underrepresented inmanagement. (41 pages)
14. Impact of Recruitment, Promotion, Selection, and CompensationPolicies and Practices on the Glass Ceiling. Roosevelt Thomas and JeffPorterfield. American Institute for Managing Diversity, Inc. MorehouseCollege.
Original data from cultural audits of private, governmental, and non-profit organizations performed by the American Institute for ManagingDiversity augment a review and analysis of literature regarding person-nel policies and practices and their impact on the advancement ofminorities and women into mid-and upper-management positions. Theresearchers conclude that certain business/corporate policies and pro-cedures inherently operate to produce and/or maintain the effects of aglass ceiling . These effects stem from formal organizational systems(such as policies and practices of recruitment and selection, perfor-mance appraisal, promotion/succession planning, compensation, andturnover) to informal systems (such as mentoring and cultural norms inan organization.) (94 pages)
15. Race, Ethnic, and Gender Earnings Inequality: The Sources andConsequences of Employment Segregation. Donald Thomaskovic-Devy.Department of Sociology, North Carolina State University.
How gender and race/ethnic segregation in the workplace are linked to

employment and advancement barriers is explored. From a review ofrelevant literature as well as his own research, the author examinesissues including pay, job search patterns, hiring and promotion prac-tices, and job stereotyping. Race/ethnic and gender employment segre-gation is widespread in the U.S. economy, according to the researcher.Both racial and gender occupational segregation and earnings inequali-ties have been reduced since the civil rights legislation of the 1960s, butreductions in inequalities are uneven, reversible, and incomplete. Thereis substantial discrimination in hiring by employers and their agents.This discrimination is both in choosing white or male candidates overminority or female candidates and steering all candidates to jobs thatare believed to be appropriate not only to their education and experi-ence, but to their race, ethnicity or gender. (72 pages)
16. Preparedness, Career Advancement, and the Glass Ceiling, Ellen D.Wernick, Glass Ceiling Commission, U.S. Department of Labor.
This review of relevant literature and government statistics analyzes thepreparation of minorities and women for managerial positions and theirresulting availability as executives. Focus is on educational preparationand developmental opportunities and requirements. Educationalattainment is no guarantee to breaking glass ceiling barriers, accordingto the researcher. While more and more qualified minorities andwomen are attaining the necessary educational credentials, they contin-ue to be overlooked or ignored for managerial promotions anddevelopmental opportunities. Few companies have formal succession orexecutive development plans. Most rely on informal practices and pro-cedures that reinforce racial, ethnic, and gender stereotypes and biases.(33 pages)
17. Barriers to Work Place Advancement Experienced by AsianAmericans. Deborah Woo. Institute for the Study of Social Change,
University of California at Berkeley.This unique research review provides a comprehensive analysis of thestatus of Asian Pacific American managers and professionals. The paperexamines employment in industry, government, and academia, with alarge section on educational issues. Includes an historical overview ofAsians in the U.S. labor market since the mid 1800s. While many AsianAmericans are highly educated and occupationally successful, glass ceil-ing barriers exist for them, according to the researcher. And the successof Asian Americans as entrepreneurs may mask the reality that self-employment is taken up as a result of blocked mobility in mainstreamareas of employment, especially at the executive levels. The researcherfinds that Asian American educational attainment is not matched bycomparable access to professional jobs which permit upward mobility inthe long run. Glass ceiling barriers exist for Asian Americans precisely inthose work contexts where we might reasonably expect their profession-al concentration to lead to greater managerial representation, i.e. sci-ence, engineering, and other technical professions. (160 pages)
18. Barriers to Work Place Advancement Experienced by White WomenWorkers. Bette Woody and Carol Weiss. The Trotter Institute, Universityof Massachusetts, Boston.
A literature review and data analysis of the status of white women man-agers and the barriers to their advancement. Includes original surveyresults on corporate programs and policies and senior women man-agers’ perceptions from authors’ related research. (106 pages). Separateannotated bibliography. Despite progress, the researcher reports thatthe proportion of women at the top of business hierarchies remainsnearly unchanged after three decades. Compensation patterns reflectthe concentration of women in entry level positions. Gains in entry levelmanagement by white women has failed to result in promotions to posi-tions of authority and power at the top of corporate America. Despite234

235
identical educational attainment, ambition and commitment to careers,and starting with similar status and starting salaries, research has shownthat women and men experienced very different progressions over timewith men progressing faster and ending in higher status positions withsubstantially higher compensation. (52 pages)
19. Report on Six Focus Groups With Asian, Black, and HispanicExecutives in Three Cities On Issues Related to The Glass Ceiling inCorporate America. Lucius S. Henderson, III. RIVA Market Research,Inc.
Focus groups show that while different groups experience glass ceilingbarriers in different ways, some similarities exist. All saw the term“minority” as pejorative. All saw self-motivation and community supportas crucial. All expressed some of skepticism about the effectiveness ofgovernment actions, but urged that laws and policies already on thebooks be strictly and fairly enforced. All expressed that entrepreneurialactivities were their “private” solution to the glass ceiling.
20. In Their Own Words: CEO Views of Diversity at the Top.Georgianna McGuire and Siobhan Nicolau. Hispanic PolicyDevelopment Project.
Interviews with 25 CEOs from broad range of companies revealed thatthe message of diversity at the top was good for business was broadlyaccepted. Most CEOs continue to see the glass ceiling only in terms ofwomen, that women were faring better than minority males, that meritand ability were the overriding factor in selecting people for top leveljobs, and that overt discrimination and bias are unacceptable.


REFERENCES

American Council on Education, Minorities inHigher Education: 1993 - 12th Annual Status Report.
Asian & Pacific Islander Center for CensusInformation and Services. 1994. ReferenceDocumentation: Datasets of U.S. Bureau of theCensus Public Use Microdata Sample Files.Prepared for the Glass Ceiling Commission. Onfile.
Bell, Ella L.J. Edmondson and Nkomo, Stella M.1994. Barriers to Work Place Advancement Experiencedby African Americans. Paper prepared for the GlassCeiling Commission. On file.
——— 1992. The Glass Ceiling vs. The Concrete Wall:Career Perceptions of White and African-AmericanWomen Managers. Unpublished working paper.
Billingsley, Andrew. 1992. Climbing Jacob’s Ladder:The Enduring Legacy of African American Families.New York: Touchstone.
Borjes, George and Tienda, Marta (eds.) 1985.Hispanics in the U.S. Economy. New York: AcademicPress.
Braddock, David and Bachelder, Lynn. 1994. TheGlass Ceiling and Persons with Disabilities. Paper pre-pared for the Glass Ceiling Commission. On file.
Brischetto, Robert. “Women Professionals Takethe Growth Lead.” Hispanic Business (May 1994).
Burbridge, Lynne. 1994. The Glass Ceiling inDifferent Sectors of the Economy: Differences BetweenGovernment, Non-Profit and For-Profit Organizations.Paper prepared for the Glass Ceiling Commission.On file.
Bureau of the Census. 1990. 1990 Census—Statistical Abstracts of the United States. Washington,D.C.
Bureau of the Census. 1990. Census of Population:General Population Characteristics, 1990.Washington, DC.
Bureau of the Census. 1992. Census of Population:Social and Economic Characteristics, 1990.Washington, DC.
Bureau of the Census. 1990. Current PopulationSurvey, 1990, Household and Family Characteristics.Washington, DC.
238
REFERENCES

Bureau of the Census. 1992. Current PopulationSurvey, 1992. Washington, DC.
Bureau of the Census.1992. Social and EconomicCharacteristics: American Indians and AlaskanNatives. Washington, DC.
Bureau of Labor Statistics. 1991. Employment andEarnings , vol. 38, no. 1 (January 1991).Washington, D.C.
Bureau of Labor Statistics. 1993. Pipelines ofProgress: A Status Report on the Glass Ceiling. August1992. Washington, D.C.
“The Corporate Elite: The Chief Executives of the1000 Most Valuable Publicly Held U.S.Companies,” Business Week (October 19, 1990).
Catalyst. 1990. Women in Corporate Management:Results of a Catalyst Survey. New York.
------------. 1992 Shattering The Glass Ceiling.Washington, DC.
———. 1992. Women on Corporate Boards: TheChallenge of Change. New York.
———. 1993. Successful Initiatives for Breaking theGlass Ceiling to Upward Mobility for Minorities andWomen. Paper prepared for the Glass CeilingCommission. On file.
Cox, Taylor and Smolinski, Carol. 1994. ManagingDiversity and Glass Ceiling Initiatives as NationalEconomic Imperatives. Paper prepared for the GlassCeiling Commission. On file.
Driscoll, Dawn-Marie and Goldberg, Carol R.1993. Members of the Club: The Coming of Age forExecutive Women. New York: The Free Press.
Families and Work Institute. 1993. An Evaluationof Johnson & Johnson’s Work-Family Initiative. NewYork: Families and Work Institute.
Galinsky, E.; Bond, J.T.; and Friedman, D.E. 1993.The Changing Workforce: Highlights from the NationalStudy. New York: Families and Work Institute.
Goldberg, Carol R. “Ways Men and Women Lead.”Harvard Business Review (January/February 1991).
Golen, Amy. 1994. The Impact of the Glass Ceiling onthe Professions. Draft working paper prepared for 239

the Glass Ceiling Commission. On file.
Hamlin, Nancy; Erkut, Sumru, and Fields,Jacqueline P. 1994. The Impact of CorporateRestructuring and Downsizing on the ManagerialCareers of Minorities and Women: Lessons Learned.Paper prepared for the Glass Ceiling Commission.On file.
Harlan, Sharon L. and Bertheide, CatherineWaite. 1994. Barriers to Workplace AdvancementExperienced by Women in Low-Paying Occupations.Paper prepared for the Glass Ceiling Commission.On file.
Heidrick & Struggles. 1992. Minorities and Womenon Corporate Boards. Chicago.
———. 1986. The Corporate Woman Officer.Chicago.
———. 1992. Women and Minorities on CorporateBoards: The Changing Board. New York.
Helgesen, Sally. 1990. The Female Advantage::Women’s Ways of Leadership. New York:Doubleday/Currency.
Henderson, Lucius S. III et al. 1994. Report on SixFocus Groups with Asian, Black and HispanicExecutives in Three Cities on Issues Related to The GlassCeiling in Corporate America. Paper prepared for the
Glass Ceiling Commission. On file.
Hispanic Association of Corporate Responsibility.1993. 1993 HACR Corporate Study: Hispanics inCorporate America. Washington, DC.
Hispanic Policy Development Project. 1994. A LaCumbre: A Latino Perspective on the Corporate GlassCeiling. Paper prepared for the Glass CeilingCommission. On file.
———1994. Off the Record. Unpublished workingpaper.
Ibarra, Herminia. “Personal Networks of Womenand Minorities in Management: A ConceptualFramework.” Academy of Management Review, vol.18, no. 1 (1993).
James, Keith et al. 1994. Barriers to WorkplaceAdvancement Experienced by Native Americans. Paperprepared for the Glass Ceiling Commission. Onfile.
Jardim, Anne and Hennig, Margaret. “The LastBarrier: Breaking into the Boys’ Club at the Top.”Working Woman (November 1990).
Kellogg Graduate School of Management.Northwestern University. 1994. Recommendations tothe Glass Ceiling Commission.
240

Korn/Ferry International and UCLA AndersonGraduate School of Management. 1993. Decade ofthe Executive Woman 1993. New York: Korn/FerryInternational.
Kotler, Philip. 1991. Marketing Management:Analysis, Planning, Implementation, and Control.Englewood Cliffs, N.J.: Prentice-Hall, Inc.
Lee Consultants. 1994. Analysis of U.S. Bureau of theCensus Public Use Microdata Sample Files. Preparedfor the Glass Ceiling Commission. On file.
Leonard, Jonathan. 1994. Use of Enforcement inEliminating Glass Ceiling Barriers. Paper preparedfor the Glass Ceiling Commission. On file.
McGuire, Georgianna and Nicolau, Siobhan.1994. In Their Own Words: CEO Views of Diversity atthe Top. Paper prepared for the Glass CeilingCommission. On file.
McKay, Emily Gantz. 1991. Diversity in theWorkplace: Barriers and Opportunities from anHispanic Perspective. A Summary Analysis and aChartbook of Statistics. Washington, D.C.:National Council of La Raza.
Mauricio Gastón Institute for Latino CommunityDevelopment and Public Policy, University ofMassachusetts. 1994. Barriers to the Employment andWork-Place Advancement of Latinos. Paper prepared
for the Glass Ceiling Commission. On file.
Namkoong, Frances and Namkoong, David. 1992.Shattering the Glass Ceiling. Entering the “Pipeline ofProgress.” Washington, D.C.: Organization ofChinese Americans, Inc.
Nicolau, Siobhan 1994. “Off the Record”—anunpublished work-in-progress commissioned bythe Twentieth Century Fund.
Nicolau, Siobhan; Oppenheimer, J.D.; andPacheco, J. 1994. Handsome Dividends: A Handbookto Demystify the US Hispanic Market. Washington,D.C.: Hispanic Policy Development Project.
Nicolau, Siobhan and Valdivieso, Rafael. 1984.Make Something Happen. Washington, D.C.:National Commission on Secondary Schooling forHispanics.
———. 1990. A More Perfect Union. Washington, D.C.Hispanic Policy Development Project and theAspen Institute.
Rosener, Judy B. “Ways Women Lead.” HarvardBusiness Review (November/December 1990).
Schwartz, Debra B. 1994. An Examination of theImpact of Family-Friendly Policies on the Glass Ceiling.Paper prepared for the Glass Ceiling Commission.On file. 241
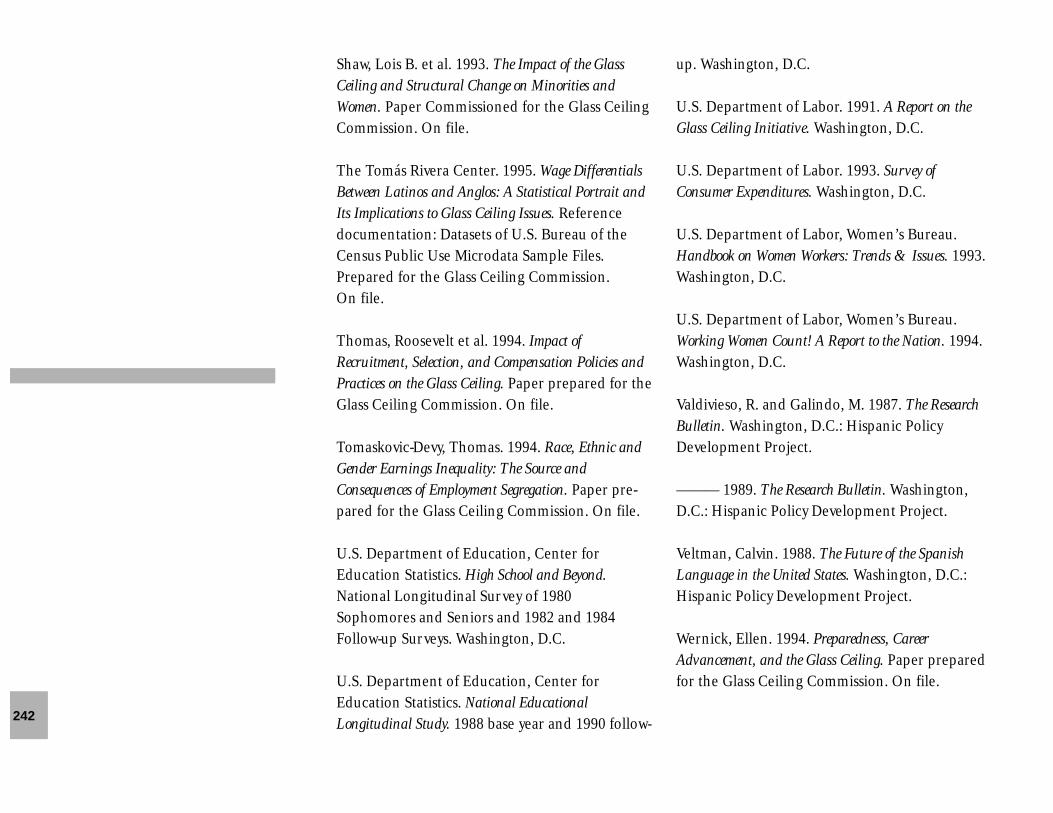
Shaw, Lois B. et al. 1993. The Impact of the GlassCeiling and Structural Change on Minorities andWomen. Paper Commissioned for the Glass CeilingCommission. On file.
The Tomás Rivera Center. 1995. Wage DifferentialsBetween Latinos and Anglos: A Statistical Portrait andIts Implications to Glass Ceiling Issues. Referencedocumentation: Datasets of U.S. Bureau of theCensus Public Use Microdata Sample Files.Prepared for the Glass Ceiling Commission. On file.
Thomas, Roosevelt et al. 1994. Impact ofRecruitment, Selection, and Compensation Policies andPractices on the Glass Ceiling. Paper prepared for theGlass Ceiling Commission. On file.
Tomaskovic-Devy, Thomas. 1994. Race, Ethnic andGender Earnings Inequality: The Source andConsequences of Employment Segregation. Paper pre-pared for the Glass Ceiling Commission. On file.
U.S. Department of Education, Center forEducation Statistics. High School and Beyond.National Longitudinal Survey of 1980Sophomores and Seniors and 1982 and 1984Follow-up Surveys. Washington, D.C.
U.S. Department of Education, Center forEducation Statistics. National EducationalLongitudinal Study. 1988 base year and 1990 follow-
up. Washington, D.C.
U.S. Department of Labor. 1991. A Report on theGlass Ceiling Initiative. Washington, D.C.
U.S. Department of Labor. 1993. Survey ofConsumer Expenditures. Washington, D.C.
U.S. Department of Labor, Women’s Bureau.Handbook on Women Workers: Trends & Issues. 1993.Washington, D.C.
U.S. Department of Labor, Women’s Bureau.Working Women Count! A Report to the Nation. 1994.Washington, D.C.
Valdivieso, R. and Galindo, M. 1987. The ResearchBulletin. Washington, D.C.: Hispanic PolicyDevelopment Project.
——— 1989. The Research Bulletin. Washington,D.C.: Hispanic Policy Development Project.
Veltman, Calvin. 1988. The Future of the SpanishLanguage in the United States. Washington, D.C.:Hispanic Policy Development Project.
Wernick, Ellen. 1994. Preparedness, CareerAdvancement, and the Glass Ceiling. Paper preparedfor the Glass Ceiling Commission. On file.
242

White, Deborah Gray. l985. Aren’t I a Woman?Female Slaves in the Plantation South. New York: W. W. Norton.
White, Jane. 1992. A Few Good Women: Breaking theBarriers to Top Management. Englewood Cliffs:Prentice Hall.
Williams, Linda Faye. 1994. The Impact of the GlassCeiling on African American Men and Women.Reference documentation: Datasets of U.S.Bureau of the Census Public Use MicrodataSample Files. Prepared for the Glass CeilingCommission. On file.
Woo, Deborah. 1994. The Glass Ceiling and AsianAmericans. Paper prepared for the Glass CeilingCommission. On file.
Woody, Bette and Weiss, Carol. 1994. Barriers toWork Place Advancement Experienced by White WomenWorkers. Paper prepared for the Glass CeilingCommission. On file.
Zate, Maria. “The Corporate Elite.” HispanicBusiness (January 1995).
243


Material contained in this publication is in the public domain and may be reproduced, fully or partially,without permission of the Federal Government. Source credit is requested but not required. Permissionis required only to reproduce any copyrighted material contained herein.
This material will be made available to sensory impaired individuals upon request.Voice Phone: 202 218-6652TDD* Phone: 1-800-326-2577
* Telecommunication Device for the Deaf
Copies of the report are available from the following sources:
Printed copies from the U.S. Government Printing Office and its regional bookstores. Telephone: (202) 783-3238.
Microfiche copies are available from the National Technical Information Service, 5285 Port Royal Road,Springfield, VA 22161. Telephone: (703) 487-4690.
Thanks to a partnership with Cornell University, electronic copies are available from the Internet via theWorld Wide Web server and GOPHER. Access code for WWW is http://www.ilr.cornell.edu. Access codefor GOPHER is 128.253.61.155
To request research papers from the Glass Ceiling Commission, please send to:Glass Ceiling CommissionU.S. Department of Labor200 Constitution Ave., NW - Room C-2313Washington, D.C. 20008
You can also fax your request to: (202) 219-7368.
According to regulations which govern the Freedom of Information Act (29 CFR 70.40), the first onehundred pages of requested documents are free; however, we are required to charge 15¢ per page foranything over the first one hundred pages.
FPO GPOBar Code

GOO
D FOR BUSINESS:
MAKING FULL USE OF THENATION’S HUMAN CAPITAL