Embed Size (px)
Citation preview

Fact Book|2017 ‐ 2018

Fact Book | 2017 ‐ 2018This Page Intentionally Left Blank
Houston Community College ‐‐ 2017‐2018 | Fact Book i

About HCC
Since its opening in 1971, millions of students have improved their lives through education and training obtained from Houston Community College. An open‐admission public institution, HCC awards associate degrees and certificates in academic studies and career and technology programs. HCC is committed to meeting the needs of its diverse communities, providing academic courses for transfer to four‐year institutions, terminal degrees and certificates in more than 70 fields of work; as well as, continuing education and corporate training, lifelong learning and enrichment programs, and adult education.
The Houston Community College District was created under the governance of the Houston Independent School District (HISD) as the result of a public referendum on May 18, 1971. In August of that year, more than 5,700 students enrolled in workforce education courses held at the Houston Technical Institute (housed in what was then HISD’s San Jacinto High School). In the following semester, academic transfer classes were added and taught at six HISD locations.
By 1977, with an enrollment of more than 28,000 students, HCC was accredited by the Southern Association of Colleges and Schools Commission on Colleges (SACSCOC). HCC separated from HISD in 1989, establishing its own Board of Trustees and taxing authority. HCC restructured in 1991, creating five regional colleges, as well as the College Without Walls and selected six college presidents. The president of HCC then became the HCC System Chancellor. The Coleman College for Health Sciences was established in 2004. Through the process of Transformation initiated in 2014, instructional programs were organized into Centers of Excellent and Instructional Divisions, providing increased focus for credit programs.
Dr. Cesar Maldonado became the ninth Houston Community College
Chancellor in May of 2014.
HOUSTON COMMUNITY COLLEGE
Houston Community College ‐‐ 2017‐2018 | Fact Book ii
ACCREDITATION AND APPROVALS
SACS Accreditation
Texas Higher Education Coordinating Board Approval
Texas Workforce Commission Approval
The Texas Workforce Commission has approved programs for veteran's education benefits.
Houston Community College is accredited by the Southern Association of Colleges and Schools Commission on Colleges to award associate degrees. Contact the Commission of Colleges at 1866 Southern Lane, Decatur, Georgia 30033‐4097 or call 404‐679‐4500 for questions about the Accreditation of Houston Community College.
The Texas Higher Education Coordinating Board has approved college/university parallel offerings and programs in technical education.
Houston Community College ‐‐ 2017‐2018 | Fact Book iii

TABLE OF CONTENTS
Page
General Information ………………………………………………………………………………………………………… 1
Our Students …………………………………………………………………………………………………………………… 8
Instructional Programs …………………………………………………………………………………………………… 24
Academic Achievement …………………………………………………………………………………………………… 35
Personnel Profile ……………………………………………………………………………………………………………… 64
Financial Information ……………………………………………………………………………………………………… 73
Glossary of Terms …………………………………………………………………………………………………………… 83
The Houston Community College (HCC) 2017‐2018 Fact Book provides statistical information about the college district. Data presented in this publication may differ slightly from statistics found in other reports. Such variances may result from differences methodology including the source of information used, the reporting period covered (semester, academic year, fiscal year), or the student base included (semester credit, continuing education, adult education and literacy). The source of the information in each table and graph is cited, along with the date generated, the reporting period, and the students included. The Glossary of Term provide definitions of key attributes.
The 2017‐2018 Fact Book is available online at
www.hccs.edu/district/about‐us/oir/.
Published January 1, 2018
Houston Community College ‐‐ 2017‐2018 | Fact Book iv

This Page Intentionally Left BlankFact Book | 2017 ‐ 2018
Houston Community College ‐‐ 2017‐2018 | Fact Book v

Page
Strategic Plan Overview | Imagine HCC 2019 ………………………………………………………………………… 2 ‐ 3
Board of Trustees Elected Board of Trustees …………………………………………………………………………………………………… 4Board Member Districts Map ……………………………………………………………………………………………… 5
Service Area College and Campuse Locations Map ………………………………………………………………………………… 6Service Area Demographics ………………………………………………………………………………………………… 7
G
ENER
AL
INFO
RMA
TION

STRATEGIC PLAN OVERVIEW |IMAGINE HCC 2019
Imagine HCC 2019, the institution’s strategic plan for 2016‐2019, was approved by the Houston Community College Board of Trustees in December 2015. The plan is based upon the college’s board‐approved mission and vision, and it represents the collective contributions of individuals and organizations from both our internal and external communities.
Input for the plan was obtained through a variety of means. The Strategic Planning Advisory Council provided coordination and oversight. This group included community members from business, industry, local governments, and other educational institutions, as well as HCC faculty, staff, students, and the Chancellor’s Executive Cabinet. In addition, four work groups, one for each goal area, were established, allowing for more internal input. Members of the HCC Board of Trustees were invited to participate in all aspects of the process and took part in several activities. Further opportunities for college and community participation were also provided through face to face meetings and on‐line surveys.
We appreciate the broad support and participation by so many in our strategic planning, and believe that the resulting work reflects the collective wisdom and vision of all of the contributors. Imagine HCC 2019 serves to focus and direct the college’s efforts.IMAGINE
HCC 2019
Houston Community College ‐‐ 2017‐2018 | Fact Book Page 2

STRATEGIC PLAN OVERVIEW |IMAGINE HCC 2019
Houston Community College is an open‐admission, public institution of higher education offering a high‐quality, affordable education for academic advancement, workforce training, career development, and lifelong learning to prepare individuals in our diverse communities for life and work in a global and technological society.
MISSION
CORE VALUES• Academic standards• Collaboration• Student success
• Passion• Accountability• Student commitment
• Educational workforce• Culture of trust• Innovation
• Consistency
BEHAVIORAL COMPETENCIES
• Acting with Integrity• Thinking Critically• Managing Change – Adapting to Support Change• Communicating Effectively
• Delivering High Quality of Work• Accepting Responsibility• Serving Our Stakeholders• Supporting Organizational Goals• Driving Continuous Improvement
Houston Community College will be a leader in providing high quality, innovative education leading to student success and completion of workforce and academic programs. We will be responsive to
community needs and drive economic development in the communities we serve.
VISION
A. Improve student preparedness, readiness and alignment
B. Improve the student experience
C. Increase student completion
D. Ensure that instructional programs prepare students for success in current and future working environments
A. Focus on one HCC and consistency of quality experience across the campuses, departments, and facilities
B. Foster an environment within the institution as a compelling place to work and learn
C. Employ analytic measures to assess and guide performance excellence
A. Ensure that the strategic plan serves as the basis for funding
B. Improve and streamline business transactions and processes
C. Increase diversity, inclusion and engagement throughout the institution
1. STUDENT SUCCESS 2. ORGANIZATIONALSTEWARDSHIP
3. PERFORMANCE EXCELLENCE
4. INNOVATION
• Acting as a Champion for Change• Thinking Entrepreneurially• Leveraging Opportunities• Setting a Strategic Vision• Attracting & Developing Talent
• Inspiring & Motivating Others• Acting Strategically• Demonstrating Beliefs & Principles• Managing Resources
LEAD
ERSH
IP
CORE
A. Build a culture that champions collaboration, creativity, and innovation
B. Increase innovation in teaching and learning
C. Expand the use of technology throughout the institution
Houston Community College ‐‐ 2017‐2018 | Fact Book Page 3

BOARD OF TRUSTEES
District TermZeph Capo, Secretary District I Expires: 2019David B. Wilson District II Expires: 2019Dr. Adriana Tamez District III Expires: 2021Dr. Carolyn Evans‐Shabazz, Chair District IV Expires: 2023Robert Glaser District V Expires: 2023Dr. John P. Hansen District VI Expires: 2021Neeta Sane District VII Expires: 2019Eva L. Loredo District VIII Expires: 2021Dr. Pretta VanDible Stallworth, Vice Chair District IX Expires: 2023
Trustees
Board of Trustees – 2018
HCC’s Board of Trustees represents the citizens of HCC’s taxing district. There are nine single‐member districts. Trustees are elected for six year terms with elections held on a 2‐year rotating basis. There are no term limits.
The district boundaries are legally determined. The most recent re‐districting occurred in 2012 based on the annexation of Alief and North Forest Independent School Districts.
New officers are elected annually by the members of the Board of Trustees. The three offices include Chair, Vice Chair, and Secretary.
Houston Community College ‐‐ 2017‐2018 | Fact Book Page 4

BOARD OF TRUSTEES
Source: OIR Mapping files, as of December 2017.
Board Member Districts Map ‐ 2018
Zeph Capo
Dr. Pretta VanDible Stallworth
Key:
Major Freeway
Campus/Location
Tax District Boundary
South Campus
Felix FragaCampus
Central Campus
Coleman Health Center
Eastside Campus
Stafford Campus
Alief Campus
Katy Campus
Pinemont Campus
Northeast
Gulfton Center
Automotive Tech. Ctr Northline Campus
West Loop Campus
North Forest Campus
Alief Bissonet Campus
Spring BranchCampus
Acres Homes Campus
Missouri City Campus
Brays Oaks Campus
Dr. Adriana Tamez
Dr. Carolyn Evans‐Shabazz
Neeta Sane
Eva L. Loredo
Dr. John P. Hansen
FORT BENDCOUNTY
HARRIS COUNTY
Dave Wilson
State Hwy 288
Hwy 255
Robert Glaser
Grand Parkw
ay
Houston Community College ‐‐ 2017‐2018 | Fact Book Page 5

COLLEGE AND CAMPUS LOCATIONS
Source: OIR Mapping files, as of December 2017.
Service Area Map - 2018
Key:Tax District
Major Freeway
Campus/Location
Service Area (Out‐of‐District)
South Campus
Felix Fraga Campus
Central Campus
Coleman Health Sci. Center
Eastside Campus
Stafford Campus
Alief Bissonet CampusAlief Hayes Road CampusKaty CampusSpring Branch Campus
Pinemont Campus
Northeast Campus
Gulfton Center
Automotive Tech. Center
West Loop Campus
North Forest CampusNorthline Campus
HCC Colleges and Campuses ‐ 2018Central College
Coleman College
Northeast College
Northwest College
Southwest College
Southeast College
South Campus
Felix FragaCampus
Central Campus
Eastside Campus
Stafford Campus
Alief Campus
Katy Campus
Pinemont Campus
Northeast Campus
Gulfton Center
Northline Campus
West Loop Campus
North Forest Campus
Alief Bissonet Campus
Spring BranchCampus
Coleman Health Center
HARRIS COUNTY
FORT BENDCOUNTY
HWY 255
Grand Parkw
ay
StateHWY 288
Acres Homes Campus
Brays Oaks Campus
Missouri City Campus
Acres Homes Campus
Brays Oaks Campus
Missouri City Campus
Automotive Tech. Center
Houston Community College ‐‐ 2017‐2018 | Fact Book Page 6

SERVICE AREA DEMOGRAPHICS
2016 est.
2,432,543
367,964
1,194,701
75.0%
2016 est.
914,959 African American
12.4% Hispanic
23.6% Asian
2.66 White
34.4% Other or Multiple
Number Percent
$88,786 334,854 21.2%
$55,135 326,479 20.7%
$33,395 298,529 18.9%
618,374 39.2%
Average Household Income
Persons per Household
The demographics reflect the population residing within the boundaries of HCC Service Area, which includes the Houston, Katy, Spring Branch, and Alief Independent School Districts (ISDs); Stafford Municipal District; and the portions of Fort Bend ISD located in Missouri City, the City of Pearland, and the City of Houston.
Sources: Pcensus, data compiled on January 2017.
Median Household Income
Per Capita Income
Educational Attainment Information 2016 est.
(25 yrs and over)
No High School Diploma
High School/GED
High School plus Some College
College Degree
Income Information 2016 est.
26.2%
Households with Children
Total Population
22.6%
41.1%
8.5%
Household Information
Total Households
Households with Income <$15,000/yr
Households with Income <$25,000/yr
Adult Population (% of total)
Gender 2016 est.
Male
Female
Median Age
Population Information
Total Population
Adult Population (18 to 27 years old)
Adult Population (28 to 64 years old)
1.7%
Ethnicity 2016 est.
Total Population
50.0%
50.0%
34.1 yrs 50%Female
50%Male
8%Asian
23%AfricanAmerican
41%Hispanic
39%College Degree
26%White
2%Other orMultiple
21%High School/
GED
19%High School plus Some College
21%No High School
Diploma
Educational Attainment
Ethnicity
Gender
Houston Community College ‐‐ 2017‐2018 | Fact Book Page 7

International Students: Top 20 Host Institutions:
Rank Two‐Year Institutions State Total International Students
1 Houston Community College System TX 5,982
2 Santa Monica College CA 3,532
3 Lone Star College System TX 3,025
4 De Anza College CA 2,792
5 Northern Virginia Community College VA 2,027
6 Miami‐Dade College FL 1,995
7 Montgomery College MD 1,933
8 Green River Community College WA 1,789
9 Valencia College FL 1,764
10 Diablo Valley College CA 1,641
11 Seattle Central Community College WA 1,588
12 Foothill College CA 1,516
13 Edmonds Community College WA 1,491
14 Peralta Community College District CA 1,310
15 Orange Coast College CA 1,286
16 Bellevue College WA 1,263
17 Santa Barbara City College CA 1,242
18 Richland College TX 1,162
19 Collin County Community College District TX 1,146
20 Bunker Hill Collunity College MA 1,003
In 2016/17, HCC was ranked 1st (In Two‐Year Institutions) nationally in
the Associate's Institutions Hosting International Students, according to Open Doors Data.
OUR STUDEN
TS
‐ 4,000 8,000

STUDENT PROFILE
Page
Total Student Enrollment—AY 2013 ‐ AY 2017 Annual ‐ Unduplicated Enrollment Trend ‐ by Career Type …………………………………………………………… 10Annual ‐ Unduplicated Enrollment Trend ‐ by Instructional Divisions …………………………………………… 11Annual ‐ Unduplicated Enrollment Trend ‐ by Centers of Excellence …………………………………………… 11
Unduplicated Enrollment—AY 2013 ‐ AY 2017Annual – Unduplicated Enrollment Trend ‐ All Career Types ………………………………………………………… 12Annual – Unduplicated Enrollment Trend ‐ SCH & CEU ………………………………………………………………… 12
Full‐Time Student Equivalent—AY 2013 ‐ AY 2017 …………………………………………………………………………… 13Full‐Time and Part‐Time Student—AY 2013 ‐ AY 2017 ……………………………………………………………………… 13
Annual Semester Credit Hour Student EnrollmentGender and Ethnicity …………………………………………………………………………………………………………………… 14Gender and Ethnicity Trends ………………………………………………………………………………………………………… 15Age Group …………………………………………………………………………………………………………………………………… 16
Annual Semester Credit Hour Students Residency—AY 2013 ‐ AY 2017 …………………………………………… 17
Annual Semester Credit Hour Enrollment by 18 Highest Zip Codes—AY 2013 ‐ AY 2017 ………………… 18Market Share: 15 ‐ 64 Age by Zip Codes— AY 2017 ………………………………………………………………………… 19
International Student PopulationsAnnual International Students Enrollment by Type—AY 2013 ‐ AY 2017 ……………………………………… 20Annual International Student Populations by Top 40 Countries—AY 2016 ‐ AY 2017 …………………… 21Annual F1 ‐ International Student Demographic by Top 10 Countries—AY 2017 ………………………… 22
Annual Day, Evening, and Weekend Course Enrollment—AY 2013 ‐ AY 2017 …………………………………… 23
Houston Community College ‐‐ 2017‐2018 | Fact Book Page 9

TOTAL STUDENT ENROLLMENT—AY 2013 - AY 2017
AY 2013 AY 2014 AY 2015 AY 2016 AY 2017
Semester Credit Hour (SCH) 88,228 87,460 88,002 85,305 85,447
Funded Continuing Education Unit (CEU) 17,901 16,344 18,170 16,753 16,701
Non Funded Continuing Education (NCR) 1,116 4,708 2,214 2,344 3,147
Adult HS ABE/ESL/GED 9,749 7,992 9,167 11,681 11,286
Total Unduplicated Enrollment 115,600 113,689 115,575 114,288 114,430
Source: HCC OIR DataMart Files, End of Term, AY 2013 ‐ AY 2017.
Annual Total Student Enrollment by Career Type
Total Enrollment Distribution
88,228
87,460
88,002
85,305
85,447
‐ 25,000 50,000 75,000 100,000
AY 2013
AY 2014
AY 2015
AY 2016
AY 2017
Semester Credit Hour (SCH)
17,901
16,344
18,170
16,753
16,701
‐ 10,000 20,000 30,000
AY 2013
AY 2014
AY 2015
AY 2016
AY 2017
Funded Continuing Education Unit (CEU)
1,116
4,708
2,214
2,344
3,147
‐ 2,000 4,000 6,000
AY 2013
AY 2014
AY 2015
AY 2016
AY 2017
Non Funded Continuing Education (NCR)
9,749
7,992
9,167
11,681
11,286
‐ 5,000 10,000 15,000
AY 2013
AY 2014
AY 2015
AY 2016
AY 2017
Adult HS ABE/ESL/GED
Houston Community College ‐‐ 2017‐2018 | Fact Book Page 10

SEMESTER CREDIT STUDENT - ACADEMICS/CENTER OF EXCELLENCE—AY 2013 - AY 2017
AY 2013 AY 2014 AY 2015 AY 2016 AY 2017 Trend
College Readiness 30,531 28,815 26,649 22,701 25,107
English & Communication 31,232 31,973 32,147 31,321 30,477
Liberal Arts, Humanities & Education 26,994 26,289 26,888 25,960 25,778
Earth, Life & Natural Sciences 26,222 26,185 26,932 26,003 25,299
Mathematics 18,527 20,541 23,019 22,812 22,174
Social & Behavioral Sciences 36,103 35,370 36,118 35,430 34,206
AY 2013 AY 2014 AY 2015 AY 2016 AY 2017 Trend
Automotive (b) 410 436
Business 13,849 13,378 14,404 14,319 13,291
Construction 550 639 708 733 908
Consumer Arts & Sciences 1,968 1,970 2,026 1,863 1,675
Digital & Information Technologies 5,853 5,729 6,194 5,872 6,027
Engineering 1,439 1,711 2,303 1,823 1,227
Global Energy 2,121 2,422 2,851 2,412 1,935
Health Sciences 4,033 3,782 3,687 4,311 3,197
Logistics 570 614 613 784 836
Manufacturing 215 275 245 199 147
Material Science 373 500 510 478 523
Media Arts & Technology 1,906 1,716 1,902 1,879 2,025
Public Safety (b) 2,299 2,149 2,008 1,614 1,489
Visual & Performing Arts 12,735 12,853 13,096 12,741 12,536
Total Unduplicated Enrollment 88,228 87,460 88,002 85,305 85,447
Students are counted in each Instructional Divisions/Centers of Excellence in which courses are taken.(a) The transformation started in Fall 2014; therefore, the data were restructured across the Instructional Divisions and Centers of Excellence.(b) The move of Automotive from Public Safety occurred in Fall 2016.
Source: HCC OIR DataMart Files, End of Term, AY 2013 ‐ AY 2017.
Five Year % Change
Annual Total Credit Students Enrolled in Instructional Divisions Courses ‐‐ SCH (a)
Centers of Excellence Five Year % Change
Annual Total Credit Students Enrolled in Centers of Excellence Courses ‐‐ SCH (a)
Instructional Divisions
‐50.0% 0.0% 50.0%
‐50.0% 0.0% 50.0%
‐14.7%
46.7%
3.0%
‐4.0%
‐8.8%
‐31.6%
‐3.2%
40.2%
6.2%
‐35.2%
‐20.7%
‐14.9%
65.1%
19.7%
‐2.4%
‐17.8%
‐4.5%
‐3.5%
‐5.3%
‐1.6%
(b) (b)
Houston Community College ‐‐ 2017‐2018 | Fact Book Page 11

ANNUAL UNDUPLICATED ENROLLMENT—AY 2013 - AY 2017
Source: HCC OIR DataMart Files, End of Term, AY 2013 ‐ AY 2017.
Annual Unduplicated Enrollment Trend ‐‐ SCH & CEU
Annual Unduplicated Enrollment Trend ‐‐ All Career Types
115,600
113,689
115,575
114,288
114,430
‐ 25,000 50,000 75,000 100,000 125,000
AY 2013
AY 2014
AY 2015
AY 2016
AY 2017
88,228
87,460
88,002
85,305
85,447
17,901
16,344
18,170
16,753
16,701
0 25,000 50,000 75,000 100,000 125,000
AY 2013
AY 2014
AY 2015
AY 2016
AY 2017
SCH
CEU
Houston Community College ‐‐ 2017‐2018 | Fact Book Page 12

FULL-TIME STUDENT EQUIVALENT—AY 2013 - AY 2017
Source: Annual Financial Reports ‐ AFR, Certified CBM004 & CBM00C.
Source: HCC OIR DataMart Files, End of Term, AY 2013 ‐ AY 2017.
Annual Full‐Time and Part‐Time Credit Students ‐ Attempted Hours ‐‐ SCH
Method: The number of Full‐Time students is calculated based on fall and spring semesters students attempting 12 or more credit hours; and summer semester students attempting 6 or more credit hours. The number of Part‐Time students is calculated based on fall and spring semesters students attempting less than 12 credit hours; and summer semester students attempting less than 6 credit hours. Then, individual students unduplicated in favor of full‐time any semester during the academic year.
Method: One FTSE (Full‐time Student Equivalent) is equal to 480 annual contact hours [30 semester credit hours (Fall 12SCH + Spring 12SCH + Summer 6SCH) x 16 contact hours per SCH = 480 annual contact hours]. Total annual FTSE is equal to total funded contact hours divided by annual contact hours per student (480). HCC has high number of students who enroll in Continue Education courses. As a result, state funded CEU contact hour are included in this FTSE.
Annual Full‐Time Student Equivalent (FTSE) ‐‐ SCH & CEU
49,824
49,448
50,596
48,826
47,997
‐ 20,000 40,000 60,000 80,000
AY 2013
AY 2014
AY 2015
AY 2016
AY 2017
Full‐time Student Equivalent (FTSE)
51,395
51,977
52,398
51,081
51,590
36,833
35,483
35,604
34,224
33,857
‐ 20,000 40,000 60,000 80,000 100,000
AY 2013
AY 2014
AY 2015
AY 2016
AY 2017 Part‐TimeFull‐Time
Houston Community College ‐‐ 2017‐2018 | Fact Book Page 13

SEMESTER CREDIT STUDENT ENROLLMENT—AY 2017
Gender Ethnicity
Demographic Female Male Female Male Female Male Female Male Female Male Female Male
Gender 6,605 6,499 16,939 9,713 17,027 12,499 6,647 6,036 1,870 1,595 49,088 36,342
(%) 50.4 49.6 63.5 36.4 57.7 42.3 52.4 47.6 53.9 46.0 57.4 42.5
Total (b)
a) Other: American Indian/Alaska Native, Multi‐racial, Nonresident Alien, & Unknown Ethnicity.
b) Includes Unknown/Intersex Gender.
Source: HCC OIR DataMart Files, End of Term, AY 2017.
Annual Semester Credit Hour Student Demographics by Gender and Ethnicity ‐‐ SCH
85,447
White African American Hispanic Asian Other (a) Total
13,106 26,657 29,533 12,684 3,467
85,447Total SCH Enrollment
66%Minority Students
57%Female
43%Male
31%African American
15%White
35%Hispanic
15%Asian 4%
Other (a)
Houston Community College ‐‐ 2017‐2018 | Fact Book Page 14

TOTAL STUDENT ENROLLMENT—AY 2013 - AY 2017
Ethnicity AY 2013 AY 2014 AY 2015 AY 2016 AY 2017
White 15,910 15,053 14,380 13,475 13,106
African American 29,398 29,041 29,608 27,422 26,657
Hispanic 27,580 28,148 28,423 28,648 29,533
Asian 11,845 11,716 11,906 12,129 12,684
Other (a) 3,495 3,502 3,685 3,631 3,467
Total 88,228 87,460 88,002 85,305 85,447
a) Other: American Indian/Alaska Native, Nonresident Alien, & Unknown Ethnicity.Source: HCC OIR DataMart Files, End of Term, AY 2013 ‐ AY 2017.
Annual Semester Credit Student Demographics by Gender
Annual Semester Credit Hour Student Demographics by Ethnicity ‐‐ SCH
‐
20,000
40,000
60,000
AY 2013 AY 2014 AY 2015 AY 2016 AY 2017
Female Male
15,910 15,053 14,380 13,475 13,106
29,398 29,041 29,608
27,422 26,657 27,580 28,148 28,423
28,648 29,533
11,845 11,716 11,906 12,129 12,684
‐
7,000
14,000
21,000
28,000
35,000
AY 2013 AY 2014 AY 2015 AY 2016 AY 2017
African American
White
Asian
Houston Community College ‐‐ 2017‐2018 | Fact Book Page 15

SEMESTER CREDIT STUDENT ENROLLMENT—AY 2013 - AY 2017
Age Group AY 2013 AY 2014 AY 2015 AY 2016 AY 2017
Under 18 2,767 2,869 2,987 3,752 4,734
18 thru 22 34,116 34,453 33,503 32,274 33,094
23 thru 30 28,776 28,339 29,322 28,466 27,593
31 thru 50 19,536 18,838 19,284 18,134 17,469
Over 50 3,028 2,953 2,904 2,671 2,554
Unknown 5 8 2 8 3
Total 88,228 87,460 88,002 85,305 85,447
Average Age 27.0 26.9 27.0 26.7 26.4
Source: HCC OIR DataMart Files, End of Term, AY 2013 ‐ AY 2017.
Annual Semester Credit Hour Student Demographics by Age Group ‐‐ SCH
‐
2,000
4,000
6,000
8,000
10,000
14 24 34 44 54 64 74
2,767 2,869 2,987 3,752 4,734
‐
10,000
20,000
30,000
40,000
Semester Credit Hour Student by Age AY 2017 ‐‐ SCH
34,116 34,453 33,503 32,274 33,094
28,776 28,339 29,322 28,466 27,593
‐
10,000
20,000
30,000
40,000
AY 2013 AY 2014 AY 2015 AY 2016 AY 2017
19,536 18,838 19,284 18,134 17,469
AY 2013 AY 2014 AY 2015 AY 2016 AY 2017
Under 18 18 thru 22
31 thru 5023 thru 30
Houston Community College ‐‐ 2017‐2018 | Fact Book Page 16

SEMESTER CREDIT STUDENTS RESIDENCY—AY 2013 - AY 2017
AY 2013 AY 2014 AY 2015 AY 2016 AY 2017
In‐District 57,755 57,203 56,532 54,157 53,400
Out‐of‐District 21,267 21,369 21,701 20,869 21,665
Out‐of‐State ‐ US Resident 6,228 6,162 6,652 6,830 6,259
Out‐of‐State ‐ Non US Resident 2,909 2,709 3,032 3,440 4,106
Other/Unknown 69 17 85 9 17
Total Credit Students 88,228 87,460 88,002 85,305 85,447
Source: HCC OIR DataMart Files, End of Term, AY 2013 ‐ AY 2017.
Total Enrollment Distribution
Annual Semester Credit Hour Student Demographics by Tuition Residency ‐‐ SCH
AY 2017
57,755 57,203 56,532 54,157 53,400
‐
15,000
30,000
45,000
60,000
75,000
21,267 21,369 21,701 20,869 21,665
‐
8,000
16,000
24,000
32,000
40,000
6,228 6,162 6,652 6,830 6,259
‐
8,000
16,000
24,000
32,000
40,000
AY 2013 AY 2014 AY 2015 AY 2016 AY 2017
2,909 2,709 3,032 3,440 4,106
‐
8,000
16,000
24,000
32,000
40,000
AY 2013 AY 2014 AY 2015 AY 2016 AY 2017
12%Out‐of‐State
Out‐of‐DistrictIn‐District
Out‐of‐State ‐ Non US ResidentOut‐of‐State ‐ US Resident
63%In‐District
25%Out‐of‐District
7%Out‐of‐State ‐US Resident
5%Out‐of‐State ‐
Non US Resident
Houston Community College ‐‐ 2017‐2018 | Fact Book Page 17

SEMESTER CREDIT HOUR ENROLLMENT BY 18 HIGHEST ZIP CODES—AY 2013 - AY 2017
Zip Code AY 2013 AY 2014 AY 2015 AY 2016 AY 2017 Zip Code AY 2013 AY 2014 AY 2015 AY 2016 AY 201777083 3,422 3,443 3,510 3,540 3,558 77081 1,581 1,662 1,669 1,656 1,716 77072 2,699 2,751 2,859 2,828 2,787 77477 1,414 1,486 1,494 1,497 1,567 77082 2,597 2,679 2,756 2,657 2,652 77450 1,985 1,817 1,773 1,651 1,530 77099 2,148 2,237 2,298 2,351 2,310 77063 1,598 1,514 1,547 1,517 1,440 77077 2,270 2,352 2,336 2,313 2,245 77489 1,575 1,548 1,557 1,427 1,402 77459 2,155 2,102 2,127 2,157 2,240 77087 1,426 1,408 1,346 1,327 1,348 77036 2,105 2,035 2,107 2,059 2,097 77479 1,191 1,120 1,080 1,077 1,332 77494 1,670 1,734 1,794 1,823 1,916 77074 1,317 1,279 1,340 1,263 1,246 77042 1,697 1,668 1,774 1,717 1,724 77449 1,375 1,308 1,297 1,218 1,224
Source: HCC OIR DataMart Files, End of Term, AY 2013 ‐ AY 2017; HCCS MapInfo Files with 2011 Board Redistricted Boundaries; Service Area additions per HB 3659; Dec. 2017.
Annual Semester Credit Hour Enrollment by Zip Codes ‐‐ SCH
Key:Tax District Boundary
Service Area Boundary
Major Freeway
Campus/Location
Zip Code Boundary
AY 2017 Student Residences
1,710 to 3,560 (10)820 to 1,709 (26)
0 to 49 (191)50 to 319 (49)320 to 819 (38)
Legend:
Houston Community College ‐‐ 2017‐2018 | Fact Book Page 18

Market Share: 15 - 64 AGE BY ZIP CODES— AY 2017
Annual Market Share ‐ 15 ‐ 64 Age by Zip Codes ‐‐ SCH
Note: Percent of population who are HCC student in credit program.Source: HCCS MapInfo Files with 2011 Board Redistricted Boundaries; Service Area additions per HB 3659; Dec. 2017.
Key:Tax District Boundary
Service Area Boundary
Major Freeway
Campus/Location
Zip Code Boundary
AY 2017 Population 15 ‐ 64 (age)
4.81 to 7.82 (22)
2.97 to 4.80 (30)
0 to 0.17 (229)
0.17 to 1.71 (8)
1.72 to 2.96 (25)
Legend:
Houston Community College ‐‐ 2017‐2018 | Fact Book Page 19

INTERNATIONAL STUDENT POPULATIONS—AY 2013 - AY 2017
AY 2013 AY 2014 AY 2015 AY 2016 AY 2017
F1 ‐ Students 5,122 5,293 6,049 6,742 7,010
Other Student Visas 96 90 89 109 95
Work Authorization 831 929 1,042 1,068 1,143
Refugees and Asylum 136 85 76 80 75
Noriega Bill (HB‐1403) 245 177 151 129 101
Undocumented 1,208 1,153 1,029 997 1,010
Other Visa Types 343 286 280 279 271
Total International Students 7,981 8,013 8,716 9,404 9,705
Source: HCC OIR DataMart Files, End of Term, AY 2013 ‐ AY 2017.
All HCC Students ‐ AY 2017Number of Students
Annual All International Students Enrollment by Type ‐‐ All Career Types
831
929
1,042
1,068
1,143
1,208
1,153
1,029
997
1,010
‐ 1,500 3,000
5,122
5,293
6,049
6,742
7,010
‐ 5,000 10,000
AY 2013
AY 2014
AY 2015
AY 2016
AY 2017
6%F1 ‐ Students
of all HCC students
7,981
8,013
8,716
9,404
9,705
AY 2013
AY 2014
AY 2015
AY 2016
AY 2017
Work
Authorization
F1 ‐Stud
ents
Und
ocum
ented
Total Interna
tiona
l Stud
ents
9%International Students
10%Permanent Resident
81%All Other HCC
Students
Houston Community College ‐‐ 2017‐2018 | Fact Book Page 20

INTERNATIONAL STUDENT POPULATIONS BY TOP 40 COUNTRIES—AY 2016 - AY 2017
1 to 20104)21 to 30 (12)31 to 50 (11)51 to 100 (11)
101 to 200 (7)201 to 300 (3)301 to 500 (3)501 to 1,518 (4)
Country of Citizenship AY 2017 Country of Citizenship AY 2016 AY 2017 Country of Citizenship AY 2016 AY 2017 Country of Citizenship AY 2016 AY 2017
Viet Nam 1,518 Colombia 189 185 Congo, Democratic Republic 57 78 Iran (Islamic Republic of) 36 43
Mexico 1,069 El Salvador 156 173 Qatar 41 68 Philippines 36 40
China 629 Equatorial Guinea 167 155 Taiwan, Province of China 61 66 Russian Federation 36 38
Nigeria 547 Korea, Republic of 152 138 Cameroon 61 63 Bangladesh 36 36
Venezuela 477 Honduras 132 133 Kuwait 62 63 Mali 33 36
India 475 Turkey 94 116 Canada 56 53 Tanzania, Republic of 37 33
Pakistan 322 Kazakhstan 145 112 Guatemala 55 53 Argentina 29 32
Angola 289 Brazil 86 86 Thailand 50 52 Congo 35 32
Saudi Arabia 282 Burkina Faso 77 83 Cote D'Ivoire 42 50 Egypt 22 31
Nepal 211 Gabon 75 79 Jordan 48 45 Ecuador 15 27
a) Visa and Undocumented Students included.
Source: HCC OIR DataMart Files, End of Term, AY 2016 & AY 2017.
Annual Countries with Highest Number of International(a) Students ‐‐ All Career TypesAY 2017
AY 2016
1,417
1,097
632
International Students' Countries__________ AY 2017 __________
463
462
329
143
445
272
283
Countries Represented = 155
Houston Community College ‐‐ 2017‐2018 | Fact Book Page 21

F1 - INTERNATIONAL STUDENT POPULATIONS BY TOP 10 COUNTRIES—AY 2017
All Career F1 ‐ SCH Age Group Course
Country of Citizenship Enrollment Enrollment Female 18 thru 22 Completion Rate
Viet Nam61% 56% 92%
Mexico61% 38% 84%
China60% 33% 86%
Nigeria63% 33% 90%
Venezuela61% 23% 89%
India51% 29% 84%
Pakistan23% 55% 80%
Angola42% 51% 80%
Saudi Arabia14% 33% 76%
Nepal25% 74% 84%
Source: HCC OIR DataMart Files, End of Term, AY 2017.
289
282
211
According to SEVP, HCC has 2nd most F1 international students population than any other Certified Schools in the United States
Semester Credit 'F1' Student ‐‐ SCH
204
260
263
Annual 'F1' International Student Demographic by Top 10 Countries—AY 2017
1,372
501
393
264
1,518
1,069
629
547
477
475
322
181
462
374
Houston Community College ‐‐ 2017‐2018 | Fact Book Page 22

DAY, EVENING, AND WEEKEND COURSE ENROLLMENT—AY 2013 - AY 2017
AY 2013 AY 2014 AY 2015 AY 2016 AY 2017
Day 212,509 205,791 198,885 194,215 198,289
Evening 61,658 61,313 61,552 57,537 56,651
Weekend 14,083 14,086 14,514 14,178 14,948
Other (Includes Distance Education) 84,694 86,621 93,799 91,203 90,584
Total Credit Course 372,944 367,811 368,750 357,133 360,472
Source: HCC OIR DataMart Files, End of Term, AY 2013 ‐ AY 2017.
Total Course Enrollment Distribution
Annual Day, Evening, and Weekend Semester Credit Hour Course Enrollment ‐‐ SCH
AY 2017
212,50
9
205,79
1
198,88
5
194,21
5
198,28
9
‐
60,000
120,000
180,000
240,000
20%Evening & Weekend
61,658
61,313
61,552
57,537
56,651
‐
25,000
50,000
75,000
100,000
14,083 14,086 14,514 14,178 14,948
‐
25,000
50,000
75,000
100,000
AY 2013 AY 2014 AY 2015 AY 2016 AY 2017
84,694
86,621
93,799
91,203
90,584
‐
25,000
50,000
75,000
100,000
AY 2013 AY 2014 AY 2015 AY 2016 AY 2017
55%Day
16%Evening
4%Weekend
25%Other
Other (Includes Distance Education)Weekend
EveningDay
Houston Community College ‐‐ 2017‐2018 | Fact Book Page 23

College ReadinessEnglish & CommunicationLiberal Arts, Humanities & EducationEarth, Life & Natural SciencesMathematicsSocial & Behavioral Sciences
AutomotiveBusinessConstructionConsumer Arts & SciencesDigital & Information TechnologiesEngineeringGlobal Energy Health SciencesLogisticsManufacturingMaterial ScienceMedia Arts & TechnologyPublic Safety Visual & Performing Arts
IN
STRU
CTIONAL
PRO
GRA
MS
Centers of Excellence
Instructional Divisions

INSTRUCTIONAL PROGRAMS
pageSemester Credit Hour Students ‐ Academic/Technical Areas—AY 2013 ‐ AY 2017
Contact Hour Trends ……………………………………………………………………………………………………… 26Top 10 Academic Disciplines by Contact Hours ……………………………………………………………… 27Top 10 Technical Programs by Contact Hours ………………………………………………………………… 27Instructional Divisions by Contact Hours ……………………………………………………………………… 28Centers of Excellence by Contact Hours ………………………………………………………………………… 28
Semester Credit Hour Course Enrollment and Sections—AY 2013 ‐ AY 2017Course Enrollment Trends ……………………………………………………………………………………………… 29Number of Sections Trends …………………………………………………………………………………………… 30
Semester credit Hour Developmental Education—AY 2013 ‐ AY 2017Developmental Education student enrollment by Subject …………………………………………… 31
Dual Credit—AY 2013 ‐ AY 2017 High School Based – Unduplicated Enrollment by Independent School District ……………… 32
Continuing Education Course Enrollment by Clusters—AY 2013 ‐ AY 2017Continuing Education Enrollment Trends ……………………………………………………………………… 33
Library Service—AY 2013 ‐ AY 2017 …………………………………………………………………………………… 34
Houston Community College ‐‐ 2017‐2018 | Fact Book Page 25

SEMESTER CREDIT STUDENT - ACADEMIC/TECHNICAL AREAS—AY 2013 - AY 2017
Contact Hour AY 2013 AY 2014 AY 2015 AY 2016 AY 2017
Academic (a) 17,557,344 16,492,688 16,313,344 15,912,488 15,800,128
Technical/Workforce 6,182,020 5,844,764 6,153,728 5,787,360 5,323,856
Total Contact Hours (b) 23,739,364 22,337,452 22,467,072 21,699,848 21,123,984
a) Includes Developmental Education.
b) Includes all reported contact hours, both funded and non‐funded.
Source: THECB Compliance Reports, CBM004, Fall 2012 through Summer II 2017.
Annual Semester Credit Contact Hour Trends ‐‐ SCH
17,557,344
16,492,688
16,313,344
15,912,488
15,800,128
6,182,020
5,844,764
6,153,728
5,787,360
5,323,856
‐ 5,000,000 10,000,000 15,000,000 20,000,000 25,000,000
AY 2013
AY 2014
AY 2015
AY 2016
AY 2017
Academic (a) Technical/Workforce
Houston Community College ‐‐ 2017‐2018 | Fact Book Page 26

SEMESTER CREDIT STUDENT - ACADEMIC/TECHNICAL AREAS—AY 2013 - AY 2017
Academic Disciplines AY 2013 AY 2014 AY 2015 AY 2016 AY 2017 Trend
Biology 1,944,960 1,914,672 1,921,728 1,810,464 1,735,104
English 1,674,192 1,693,056 1,714,800 1,683,168 1,664,736
Mathematics 1,280,096 1,421,024 1,595,888 1,593,776 1,540,912
History 1,142,464 1,115,936 1,162,880 1,130,640 1,110,336
Government 1,056,960 1,014,480 1,070,640 1,033,216 946,480
Intensive English 835,520 653,520 792,240 907,120 962,480
Chemistry 797,664 825,408 863,184 873,696 833,616
Psychology 831,120 792,528 807,696 803,472 786,528
Developmental Math 1,446,976 1,305,472 876,144 749,144 956,640
Art 583,872 581,472 573,984 544,848 521,280
Workforce/Technical Programs AY 2013 AY 2014 AY 2015 AY 2016 AY 2017 Trend
Accounting 491,696 503,792 556,240 585,600 583,840
Computer Networking & Telecommunications 504,304 499,120 539,360 513,072 552,528
Business Technology 556,608 479,760 515,376 408,432 370,080
Business Management 404,704 455,872 513,936 481,728 362,880
Digital Communication 223,424 218,208 240,944 242,736 261,920
Workforce Student Success 195,696 217,824
Drafting/Design Technology 205,392 224,256 251,472 242,208 209,616
Computer Programming 139,584 164,352 183,216 177,216 209,280
Cosmetology 291,792 266,176 251,200 183,952 178,528
Automotive Mechanics 188,992 200,960 171,888 151,280 158,800
Source: HCC OIR DataMart Files, End of Term, AY 2013 ‐ AY 2017.
Annual Top 10 Academic Disciplines by Contact Hours ‐‐ SCH
Annual Top 10 Technical Programs by Contact Hours ‐‐ SCH
Five Year % Change
Five Year % Change
‐50.0% 0.0% 50.0%
‐50.0% 0.0% 50.0%
49.9%
‐38.8%
2.1%
17.2%
‐33.5%
18.7%
9.6%
‐10.3%
n/a
‐16.0%
‐10.8%
‐2.8%
‐10.5%
15.2%
‐5.4%
‐33.9%
‐10.7%
4.5%
20.4%
‐0.6%
Houston Community College ‐‐ 2017‐2018 | Fact Book Page 27

SEMESTER CREDIT STUDENT - ACADEMICS/CENTER OF EXCELLENCE—AY 2013 - AY 2017
Instructional Divisions AY 2013 AY 2014 AY 2015 AY 2016 AY 2017 Trend
College Readiness 4,035,904 3,546,944 2,971,968 2,789,192 3,091,440
English & Communication 2,117,424 2,172,832 2,175,584 2,113,696 2,073,696
Liberal Arts, Humanities & Education 2,047,232 1,983,472 2,019,456 1,944,224 1,944,192
Earth, Life & Natural Sciences 3,426,468 3,417,644 3,459,952 3,333,952 3,150,704
Mathematics 1,280,096 1,421,024 1,595,888 1,593,776 1,540,912
Social & Behavioral Sciences 2,821,728 2,746,560 2,817,200 2,776,992 2,616,816
Total 15,728,852 15,288,476 15,040,048 14,551,832 14,417,760
Centers of Excellence AY 2013 AY 2014 AY 2015 AY 2016 AY 2017 Trend
Automotive (b) 179,968 186,512
Business 1,695,008 1,700,976 1,878,992 1,808,784 1,652,240
Construction 115,408 126,800 136,448 126,992 174,304
Consumer Arts & Sciences 664,112 639,888 631,792 558,608 525,952
Digital & Information Technologies 708,544 718,720 778,112 750,832 825,504
Engineering 67,360 100,208 142,896 137,552 110,096
Global Energy 482,128 603,792 729,872 615,360 490,640
Health Sciences 1,232,160 1,133,184 1,106,288 1,110,592 906,400
Logistics 37,264 45,280 48,320 75,712 86,784
Manufacturing 48,720 54,880 47,776 50,992 38,064
Material Science 76,752 99,888 107,568 101,472 113,712
Media Arts & Technology 472,032 432,832 477,168 466,528 490,992
Public Safety (b) 603,510 614,512 503,616 373,728 334,480
Visual & Performing Arts 870,672 857,520 859,248 834,768 804,736
Total 7,073,670 7,128,480 7,448,096 7,191,888 6,740,416
(b) The move of Automotive from Public Safety occurred in Fall 2016.Source: HCC OIR Program Review Dashboard, End of Term, AY 2013 ‐ AY 2017.
Annual Instructional Divisions by Contact Hours ‐‐ SCH (a)
Annual Centers of Excellence by Contact Hours ‐‐ SCH (a)
Five Year % Change
Five Year % Change
(a) The transformation started in Fall 2014; therefore, the data were restructured across the Instructional Divisions and Centers of Excellence.
‐100% ‐50% 0% 50% 100%
‐100% ‐50% 0% 50% 100%
48.2%
1.8%
16.5%
‐2.5%
63.4%
132.9%
‐4.7%
‐21.9%
4.0%
‐44.6%
‐26.5%
‐20.8%
51.0%
20.4%
‐2.1%
‐23.4%
‐5.0%
‐8.0%
‐7.3%
‐8.3%
‐7.6%
(b)(b)
Houston Community College ‐‐ 2017‐2018 | Fact Book Page 28

SEMESTER CREDIT HOUR COURSE ENROLLMENT— AY 2013 - AY 2017
a) Embedded dual credit students are counted as regular students. Includes Futures Academy in AY 2013 Thru AY 2016.
Source: HCC OIR DataMart Files, End of Term, AY 2013 ‐ AY 2017.
Annual Course Enrollment (Duplicated) TrendsSemester Credit Hour ‐‐ SCH
372,944
367,811
368,750
357,133
360,472
‐ 110,000 220,000 330,000 440,000
AY 2013
AY 2014
AY 2015
AY 2016
AY 2017
Total
Course Enrollm
ent
274,180
267,455
261,964
251,266
248,780
‐ 110,000 220,000 330,000 440,000
AY 2013
AY 2014
AY 2015
AY 2016
AY 2017Ca
mpu
s‐Ba
sed
Course Enrollm
ent
14,693
14,206
13,609
15,082
21,518
‐ 110,000 220,000
AY 2013
AY 2014
AY 2015
AY 2016
AY 2017
Dua
l Credit
Course Enrollm
ent (
a)
84,071
86,150
93,177
90,785
90,174
‐ 110,000 220,000
AY 2013
AY 2014
AY 2015
AY 2016
AY 2017
Distance Ed
ucation
Course Enrollm
ent
Houston Community College ‐‐ 2017‐2018 | Fact Book Page 29

SEMESTER CREDIT HOUR COURSE SECTIONS—AY 2013 - AY 2017
a) Includes Futures Academy in AY 2013 Thru AY 2017.
Source: HCC OIR DataMart Files, End of Term, AY 2013 ‐ AY 2017.
Semester Credit Hour ‐‐ SCHAnnual Section Trends
17,286
17,304
17,150
16,759
17,025
‐ 5,000 10,000 15,000 20,000
AY 2013
AY 2014
AY 2015
AY 2016
AY 2017
Total Sections
13,376
13,182
12,951
12,526
12,465
‐ 5,000 10,000 15,000 20,000
AY 2013
AY 2014
AY 2015
AY 2016
AY 2017Ca
mpu
s‐Ba
sed Sections
704
744
660
711
1,050
‐ 1,000 2,000 3,000 4,000
AY 2013
AY 2014
AY 2015
AY 2016
AY 2017
Dua
l Credit S
ectio
ns (a
)
3,206
3,378
3,539
3,522
3,510
‐ 1,000 2,000 3,000 4,000
AY 2013
AY 2014
AY 2015
AY 2016
AY 2017
Distance Ed
ucation
Sections
Houston Community College ‐‐ 2017‐2018 | Fact Book Page 30

SEMESTER CREDIT DEVELOPMENTAL EDUCATION—AY 2013 - AY 2017
Developmental Education AY 2013 AY 2014 AY 2015 AY 2016 AY 2017
Intensive English Program (ESOL) 10,046 8,268 10,196 11,497 12,178
Guided Studies 6,741 5,209 ‐ ‐ ‐
Integrated Read & Write (INRW) 85 719 6,288 5,740 6,038
Mathematics 25,130 22,320 15,151 13,410 17,778
Writing (ENGL) 9,130 6,868 101 77 76
Non‐Course Based Offerings ‐‐ NCBO (a) 345 58 68 8 ‐
Total 51,477 43,442 31,804 30,732 36,070
a) Includes PREP & PREM courses.
Source: THECB Compliance Reports, CBM004, AY 2013 to AY 2017.
Annual Developmental Education Student Course Enrollment (Duplicated) by Subject ‐‐ SCH
10,046 8,268 11,497
12,178
6,741 5,209
85 719
6,288 5,740 6,038
25,130 22,320
15,151 13,410
17,778
9,130 6,868
101 77 76 ‐
10,000
20,000
30,000
AY 2013 AY 2014 AY 2015 AY 2016 AY 2017
Writing (ENGL)
Integrated Read & Write (INRW)
Houston Community College ‐‐ 2017‐2018 | Fact Book Page 31

DUAL CREDIT — AY 2013 - AY 2017
Dual Credit Students AY 2013 AY 2014 AY 2015 AY 2016 AY 2017
Alief ISD 411 430 381 350 475
Fort Bend ISD 185 146 147 177 994
Houston ISD 4,692 4,474 4,104 4,354 5,316
Katy ISD 861 669 608 507 781
Spring Branch ISD 348 226 252 403 479
Stafford Municipal District 56 84 78 146 200
Private/Charter 112 189 168 249 303
Others 2,421 2,726 2,827 2,932 3,198
Total Unduplicated 7,788 7,385 6,850 7,557 9,951
a) Dual Credit students defined by 'Location Code' and 'Waiver Code'. Students taking classes at HCC locations (non‐dual) are included.
Source: HCC OIR DataMart Files, End of Term, AY 2013 ‐ AY 2017.
Hou
ston
ISD
Annual Unduplicated Headcount by Independent School District (ISD) ‐‐ SCHHigh School Based Dual Credit Students (a)
Alief ISD
Fort Ben
d ISD
Katy IS
DSp
ring Bran
ch
ISD
185
146
147
177
‐ 300 600 900
AY 2013
AY 2014
AY 2015
AY 2016
AY 2017
411
430
381
350
475
AY 2013
AY 2014
AY 2015
AY 2016
AY 2017
4,692
4,474
4,104
4,354
5,316
‐ 1,000 2,000 3,000 4,000 5,000 6,000
AY 2013
AY 2014
AY 2015
AY 2016
AY 2017
861
669
608
507
781
AY 2013
AY 2014
AY 2015
AY 2016
AY 2017
348
226
252
403
479
‐ 300 600 900
AY 2013
AY 2014
AY 2015
AY 2016
AY 2017994
Houston Community College ‐‐ 2017‐2018 | Fact Book Page 32
CONTINUING EDUCATION COURSE ENROLLMENT BY CLUSTERS—AY 2013 - AY 2017
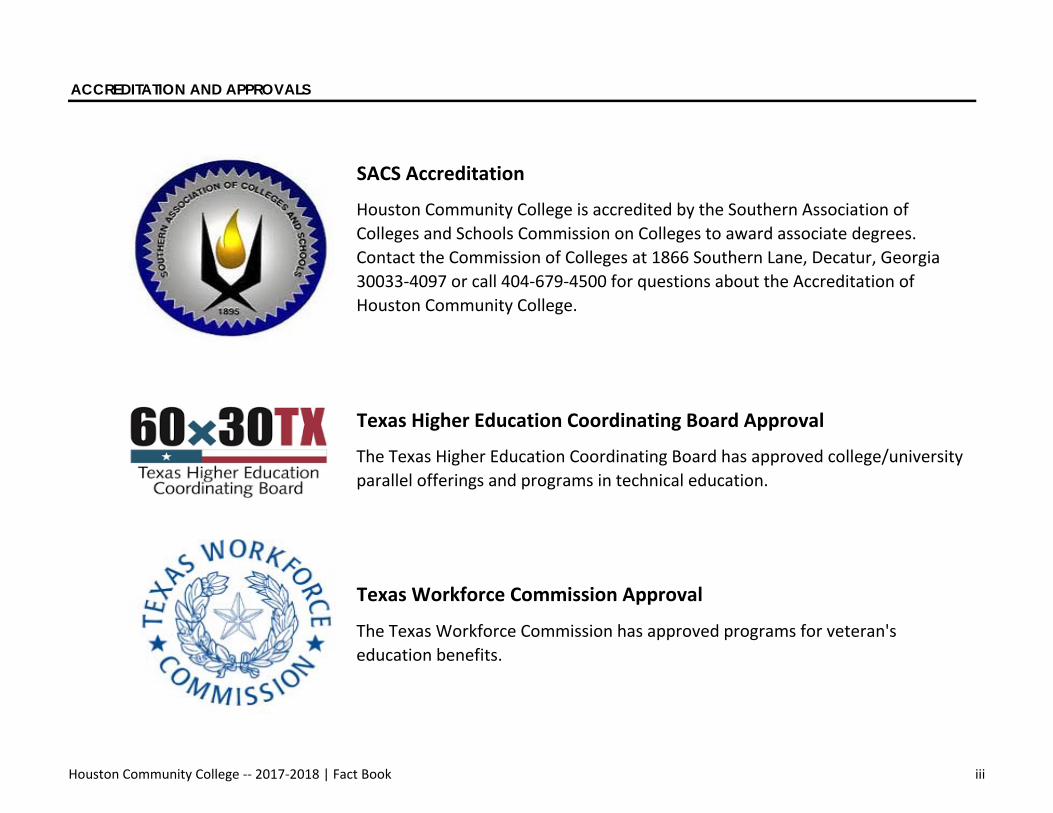
Continuing Education Unit Content Area AY 2013 AY 2014 AY 2015 AY 2016 AY 2017
Apprenticeship 9,788 7,677 8,080 7,030 6,203
Business 1,913 1,668 2,099 1,708 2,241
Constructions 793 733 776 695 794
Corrections Program 10,581 8,790 8,640 7,077 8,959
Global Energy ‐ ‐ 168 35 27
Health Careers 2,412 1,833 2,390 2,297 2,152
Health Professional Institute 1,983 790 692 624 215
Information Technology 883 554 693 506 663
Languages 5,741 8,499 12,424 12,558 11,544
Manufacturing 235 191 258 296 398
Public Safety Institute 2,878 3,841 3,917 3,345 4,775
Transportation 717 852 1,327 1,077 963
Total Course Enrollment (Duplicated) 37,924 35,428 41,464 37,248 38,934
Numbers on this page represent seat count, not unduplicated number of students.Source: HCC OIR DataMart Files, End of Term, AY 2013 ‐ AY 2017.
Public Safety InstituteLanguages
Corrections ProgramApprenticeship
Annual Continuing Education Course Enrollment (Duplicated) Trend ‐‐ CEU
9,788
7,677
8,080
7,030
6,203
AY 2013
AY 2014
AY 2015
AY 2016
AY 2017
10,581
8,790
8,640
7,077
8,959
AY 2013
AY 2014
AY 2015
AY 2016
AY 2017
2,878
3,841
3,917
3,345
4,775
0 4,000 8,000 12,000 16,000
AY 2013
AY 2014
AY 2015
AY 2016
AY 2017
5,741 8,499
12,424
12,558
11,544
0 4,000 8,000 12,000 16,000
AY 2013
AY 2014
AY 2015
AY 2016
AY 2017
23%Corrections
AY 2017Continuing Education Unit
2%Transportation
2%Information Technology
2%
6%
2%Other 16%
Apprenticeship12%
Public Safety
30%Languages
6%Health Careers
Houston Community College ‐‐ 2017‐2018 | Fact Book Page 33

LIBRARY SERVICES—AY 2013 - AY 2017
Media Titles (b)
AY 2013 35,125
AY 2014 33,710
AY 2015 58,112
AY 2016 54,277
AY 2017 55,276
a) Book Volumes and Subscriptions include e‐books and e‐journals.
b) Media Titles includes Digital Video.
Source: As Reported to The National Center for Education Statistics (NCES), AY 2013 ‐ AY 2017.
23,765 534,892
454,008 24,161
1,296,754 17,935 129,404 492,602 23,765
135,792 1,299,610 15,758
1,187,071 19,559 137,489
328,271 23,765
1,047,005 18,784 139,884 450,118 49,347
1,595,964 22,602 144,261
Book Volumes (a) Subscriptions (a)
Annual Library Service by Door Count and Materials Circulation
Use of Library Services
Door Count Materials Circulation
Door Count
Orientation AttendeesMaterials
Circulation
Library Collection
1,595,964
1,047,005
1,187,071
1,296,754
1,299,610
‐ 1,000,000 2,000,000
AY 2013
AY 2014
AY 2015
AY 2016
AY 2017
144,261
139,884
137,489
129,404
135,792
‐ 50,000 100,000 150,000 200,000
AY 2013
AY 2014
AY 2015
AY 2016
AY 2017
Houston Community College ‐‐ 2017‐2018 | Fact Book Page 34

Associate Degrees:All Disciplines2015 Rank (a) Two‐Year Institutions State
3 Ivy Tech Community College (b) IN 9,954
5 Houston Community College TX 5,953
7 Northern Virginia Community College VA 5,643
8 Lone Star College System TX 5,569
9 Tarrant County College District TX 5,323
10 Central New Mexico Community College NM 4,974
14 Hillsborough Community College FL 3,732
15 Nassau Community College NY 3,710
16 Portland Community College OR 3,617
17 Suffolk County Community College NY 3,596
19 CUNY ‐ Borough of Manhattan Community College NY 3,435
20 Salt Lake Community College UT 3,382
22 El Paso Community College TX 3,214
23 Central Texas College TX 3,186
24 San Jacinto Community College TX 3,185
25 Pasadena City College CA 3,146
29 Cuyahoga Community College District OH 2,977
30 Tidewater Community College VA 2,894
31 College of Dupage IL 2,882
32 Pima Community College AZ 2,848
a) Includes, Two‐Year Institutions & Four‐Year Institutions
b) Indiana Statewide System: include 32 campuses.
Total Associate Degrees
AC
ADEM
IC ACH
IEVE
MEN
T
According to Community College Week, In 2016, HCC was ranked 2nd nationally in the number of Associate
Degrees produced by Two‐Year Institutions.
‐ 5,000 10,000 15,000

ACADEMIC ACHIEVEMENT
Page
Awards and Completions Awards and Completions Academic Year 2017 ……………………………………………………………………… 37
Associate Degrees —AY 2017By Instructional Divisions ………………………………………………………………………………………………… 38
By Centers of Excellence …………………………………………………………………………………………………… 38
Award and Completion Trends —AY 2013 ‐ AY 2017By All Degrees, Certificates, and Other Awards ………………………………………………………………… 39
By Instructional Divisions ………………………………………………………………………………………………… 40
By Centers of Excellence …………………………………………………………………………………………………… 40
Semester Credit Hour Student Retention—Fall 2012 ‐ Fall 2016 ………………………………………………… 41
Grade Distribution Grade Distribution Trends —AY 2013 ‐ AY 2017 ……………………………………………………………………… 42
Transfer StudentsTop Public Texas Universities for HCC Transfers—Fall 2012 ‐ Fall 2017 …………………………………… 43
Wage and Job Projections by Centers of Excellence …………………………………………………………………… 44
Houston Community College ‐‐ 2017‐2018 | Fact Book Page 36

AWARDS AND COMPLETIONS ACADEMIC YEAR 2017
All Awards
3,261
17
1,492
1,375
6,145
1,300
31
1,331
4,777
752
5,529
Ethnicity Total 13,005
Source: THECB Certified Reports, CBM009, CBM00M Fall 2017.
According to Community College
Week, HCC is #1 nationally in awarding Associate Degrees, in AY
2016.
Degrees, Certificates, & Other Awards
Certificates
Certificates Total
Advanced Technology (ATC)
Associate in Applied Science (AAS)
Associate Degrees Total
Certificate 1, 2, & 3
Associate Degrees
Associate in Arts (AA)
Associate of Arts in Teaching (AAT)
Associate in Science (AS)
Academic Year 2017
Other Awards
Occupational Skills Award (OSA)
Other Awards Total
Number Awarded
Completion of Core Curriculum (Core)
47%Associate Degrees
60%Minority
14%White
6%OSA
10%Certificates
37%Core
11%AS
11%AAS/T
25%AA
10%International
33%Hispanic 13%
Asian
27%African American
3%Other/Multi‐
Racial
Houston Community College ‐‐ 2017‐2018 | Fact Book Page 37

AWARDS AND COMPLETIONS ACADEMIC YEAR 2017
3,261
Associate of Arts in Teaching (AAT) 17
1,492
1,375
Associate Degrees Total 6,145
Source: THECB Certified Reports, CBM009, CBM00M Fall 2017.
Academic Year 2017Associate Degrees by Instructional Divisions / Centers of Excellence
Associate in Science (AS)
Associate in Applied Science (AAS)
Number AwardedAssociate Degrees
Associate in Arts (AA)
3,261 (53%)Associate in Arts
6%Health Sciences
7%Business
5%Global Energy
2%Consumer Arts & Sciences
2%Engineering
<0.1%Unspecified Instructional
2%Digital &
Information Tech
72%Liberal Arts, Humanities & Education
4%Others
0.2%English &
Communication
0.3%Manufacturing
0.1%Construction
0.5%Logistics
0.5%Public Safety
0.2%Automotive
1.3%Media Arts & Technology
0.1%Visual &
Performing Arts
Houston Community College ‐‐ 2017‐2018 | Fact Book Page 38

AWARD AND COMPLETION TRENDS—AY 2013 - AY 2017
Awards
Associate Degrees 4,445 40.4% 4,984 47.0% 6,430 49.7% 6,565 48.9% 6,145 47.3%
Certificates 1,584 14.4% 1,208 11.4% 1,245 9.6% 1,385 10.3% 1,331 10.2%
Completion of Core Curriculum (Core) 3,934 35.8% 3,574 33.7% 4,597 35.5% 4,952 36.9% 4,777 36.7%
Occupational Skills Award (OSA) 1,035 9.4% 834 7.9% 677 5.2% 535 4.0% 752 5.8%
Total
Source: THECB Certified Reports (CBM009, CBM00M), Fall 2013 ‐ 2017.
AY 2017
Award Trends
AY 2016AY 2013 AY 2014 AY 2015
Academic Years 2013‐2017
13,43710,998 10,600 12,949 13,005
4,4454,984
6,430 6,5656,145
1,584 1,208 1,245 1,385 1,331
3,9343,574
4,597 4,952 4,777
1,036 834 677 535 7520
1,500
3,000
4,500
6,000
7,500
AY 2013 AY 2014 AY 2015 AY 2016 AY 2017
Certificates
Houston Community College ‐‐ 2017‐2018 | Fact Book Page 39

AWARD AND COMPLETION TRENDS—AY 2013 - AY 2017
AY 2013 AY 2014 AY 2015 AY 2016 AY 2017 Trend
English & Communication 24 6 10 20 23
Liberal Arts, Humanities & Education 4,860 4,943 6,435 6,380 5,979
Earth, Life & Natural Sciences 2,089 2,166 2,863 3,081 2,837
Mathematics 1 6
Social & Behavioral Sciences 2 1 4
Automotive 100 124 118 43 110
Business 768 618 657 890 957
Construction 62 52 77 77 93
Consumer Arts & Sciences 336 266 281 221 254
Digital & Information Tech 150 125 142 178 208
Engineering 37 84 150 238 209
Global Energy 227 234 408 379 390
Health Sciences 875 808 695 769 673
Logistics 19 31 55 93 83
Manufacturing 25 40 34 34 30
Material Science 92 131 125 107 108
Media Arts & Technology 156 96 85 157 120
Public Safety 310 162 229 194 226
Visual & Performing Arts 6 3 6 8 16
Unspecified 870 721 577 558 689
Total 10,998 10,600 12,949 13,437 13,005
Source: THECB Certified Reports (CBM009, CBM00M), Fall 2013 ‐ 2017.
Centers of Excellence
Instructional Divisions
Award by Instructional Divisions/Centers of Excellence TrendsAcademic Years 2017
Five Year % Change
(a) The transformation started in Fall 2014; therefore, the data were restructured across the Instructional Divisions and Centers of Excellence.
‐100% ‐50% 0% 50% 100%
10%
18%
‐100% ‐50% 0% 50% 100%
72%
20%
337%
‐21%
465%
23%
‐4%
36%
n/a
‐23%
25%
‐24%
50%
‐23%
17%
‐27%
167%
n/a
39%
Houston Community College ‐‐ 2017‐2018 | Fact Book Page 40

SEMESTER CREDIT HOUR STUDENT RETENTION—FALL 2012 - FALL 2016
Note: Fall credit students who returned to HCC the next Spring semester. Includes Dual Credit and Transfer Students.
Note: Fall credit students who returned to HCC the subsequent Fall semester. Includes Dual Credit and Transfer Students.
Source: HCC OIR DataMart Files, End of Term.
New First‐Time Credit Students (SCH) in Fall Returning the Following Fall
Fall to Spring Retention
Fall to Fall Retention
New First‐Time Credit Students (SCH) in Fall Returning the Following Spring
41.2%
43.0%
41.7%
44.1%
41.4%
0.0% 20.0% 40.0% 60.0% 80.0% 100.0%
Fall 12
Fall 13
Fall 14
Fall 15
Fall 16
78.1%
76.7%
79.6%
78.5%
78.6%
0.0% 20.0% 40.0% 60.0% 80.0% 100.0%
Fall 12
Fall 13
Fall 14
Fall 15
Fall 16
Houston Community College ‐‐ 2017‐2018 | Fact Book Page 41

GRADE DISTRIBUTION TRENDS—AY 2013 - AY 2017
Grades A B C Subtotal D F Subtotal W I/IPAudit/Blanks
Subtotal Total
AY 2013 115,112 92,324 58,363 265,799 19,415 46,812 66,227 32,080 6,894 1,944 40,918 372,944
AY 2014 112,343 90,195 56,846 259,384 20,017 49,093 69,110 31,773 6,187 1,357 39,317 367,811
AY 2015 116,162 89,601 55,034 260,797 19,611 50,261 69,872 32,073 5,262 746 38,081 368,750
AY 2016 112,800 89,020 54,551 256,371 18,733 48,265 66,998 28,909 4,199 656 33,764 357,133
AY 2017 119,433 90,882 55,681 265,996 17,838 40,821 58,659 27,722 7,574 521 35,817 360,472
Note: W = Withdrawal, I = Incomplete, IP = In Progress
Source: HCC OIR DataMart Files, End of Term.
Annual Semester Credit Hour Students ‐ Course Success Rate (A, B, and C Grades) ‐‐ SCH
71.3%
70.5%
70.7%
71.8%
73.8%
0.0% 20.0% 40.0% 60.0% 80.0% 100.0%
AY 2013
AY 2014
AY 2015
AY 2016
AY 2017
Houston Community College ‐‐ 2017‐2018 | Fact Book Page 42

TRANSFER STUDENTS—FALL 2012 - FALL 2016
Fall 12 Fall 13 Fall 14 Fall 15 Fall 16
University of Houston 3,786 3,372 3,525 3,641 3,417
University of Houston ‐ Downtown 1,608 1,576 1,659 1,545 1,496
Texas A&M University 959 978 1,037 1,037 1,049
University of Texas at Austin 1,142 1,196 1,135 1,120 919
Texas Southern University 790 692 669 667 619
Texas State University 331 358 362 357 403
Texas Tech University 262 321 366 385 340
Prairie View A&M University 334 320 351 385 322
Sam Houston State University 339 362 357 380 316
University of Houston ‐ Victoria 344 352 354 339 282
University of Texas at San Antonio 313 250 242 270 263
University of Houston at Clear Lake 240 192 212 230 195
Includes Academic, Technical, and Tech‐Prep Students.
Includes all students who attend HCC in an academic year, received awards, or did not return; who were found to be attending a Texas university in the subsequent fall semester.Source: THECB, Automated Student and Adult Learner Follow‐up System, Students Pursuing Additional Education By Institution, Fall 2012 ‐ 2016.
Institutions Attended
Fall 2016 ‐ Top Four Public Texas Universities for HCC Transfers
Number HCC Transfers HCC Total Transfers to Public Texas Universities
11,505
11,087
11,477
11,933
11,220
0 3,500 7,000 10,500 14,000
Fall 12
Fall 13
Fall 14
Fall 15
Fall 16
1,496 9191,0493,417
University of Houston ‐Downtown
University of Texas
at AustinUniversity of Houston
Texas A&M University
Houston Community College ‐‐ 2017‐2018 | Fact Book Page 43

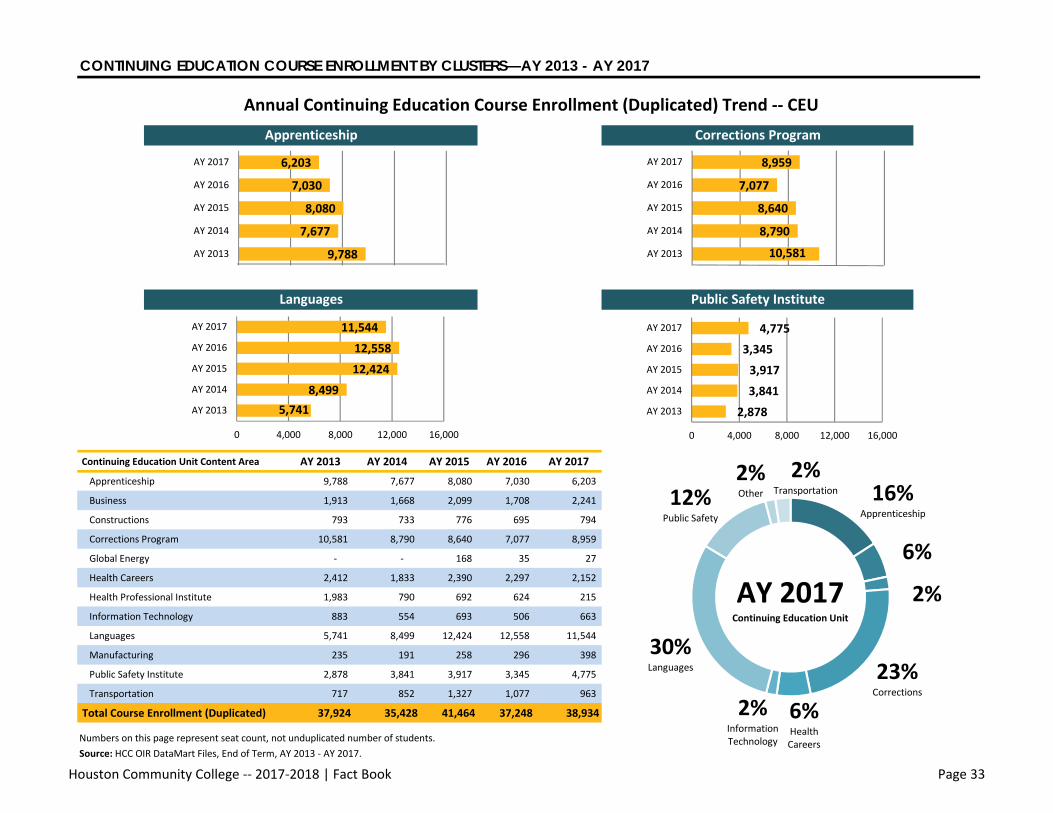
WAGE AND JOB PROJECTIONS BY CENTER OF EXCELLENCE
Average Hourly Earnings
Job Growth Rate (2018–2024)
Annual Job Openings
Automotive Technology, AAS
Technician (Certificate Level 1)
Autobody/Collision Repair Technician (Certificate Level 1)
Light Automotive Maintenance Technician (Occupational Skills Award)
Heavy Vehicle & Truck Repair (Certificate Level 1)
Diesel Preventative Maintenance (Occupational Skills Award)
Freight Broker FastTrack (Non‐Credit) 23.98$ 7.0% 315
Professional Truck Driver FastTrack (Non‐Credit) 20.05$ 8.0% 5,839
Source: Emsi, data compiled on November 16, 2017 by Department of Curriculum and Instructional Assessment.
836
Gulf Coast Wage and Job Growth Expectancy Projectionsby Centers of Excellence
Automotive
1,679
Automotive
Techno
logy
Hea
vy Veh
icles
and Trucks
18.21$ 10.0%
23.40$ 10.0%
19.97$ 12.0% 400
265Annual Graduates
45%% of Students Received
Federal Pell Grant
436Annual Enrollment
9,069Annual Job Openings
In AY 2017
Houston Community College ‐‐ 2017‐2018 | Fact Book Page 44

WAGE AND JOB PROJECTIONS BY CENTER OF EXCELLENCE
Average Hourly Earnings
Job Growth Rate
(2018–2024)
Annual Job Openings
Accounting, AAS
Accounting (Certificate Level 1)
Payroll Specialist (Certificate Level 1) 22.56$ 6.0% 432
Forensic Accounting & Fraud Examination (Enhanced Skills Certificate) 42.58 (a) 10.0% 4,533
Business Management, General Business (AAS)
General Business (Certificate Level 1)
Business Management, Entrepreneurship (Certificate Level 1)
Business Management, Human Resource Management Specialization (AAS)
Human Resource Management Specialization (Certificate Level 1)
Insurance Specialist/Associate (Certificate Level 1) 27.61$ 7.0% 3,304
Human Resource Management FastTrack (Non‐Credit) $ 20.11 (b) 6.0% 295
Project Management Certification FastTrack (Non‐Credit)
General Office Administration Specialization (AAS)
General Office Administration Specialization (Certificate Level 1)
Human Resources/PeopleSoft Specialization (Certificate Level 1)
Bilingual (Certificate Level 2)
Microsoft Office Technology Specialization (AAS)
Microsoft Office Technology Specialization (Certificate Level 1)
Legal Office Assistant Specialization (AAS)
Legal Office Assistant Specialization (Certificate Level 1)
Medical Office Specialist Specialization (AAS) 18.07$ 12.0% 272
Medical Coding/Transcription Specialist Specialization (Certificate Level 1) 21.03$ 5.0% 111
Medical Business Office Professional FastTrack (Non‐Credit) 16.66$ 11.0% 3,329
Medical Coder FastTrack (Non‐Credit) 20.85$ 14.0% 322
(a) The annual wage data given is associated with a Bachelors degree rather than an Associates degree or certificate as listed.
(b) The annual wage data given is associated with an Associates degree rather than a non‐credit program as listed. Source: Emsi, data compiled on November 16, 2017 by Department of Curriculum and Instructional Assessment.
Gulf Coast Wage and Job Growth Expectancy Projectionsby Centers of Excellence
Business
31.12$ 9.0% 3,304Ac
coun
ting 20.88$ 3.0% 3,580
Busine
ss Techn
olog
y
30.19$ 10.0% 585
3,304
Data varies according to industry sector and/or position.
31.12$ 9.0% 3,304
27.93$ 10.0% 1,276
Busine
ss M
anagem
ent
Data is not available for general ownership of a business.
31.12$ 9.0%
Houston Community College ‐‐ 2017‐2018 | Fact Book Page 45

WAGE AND JOB PROJECTIONS BY CENTER OF EXCELLENCE
Average Hourly Earnings
Job Growth Rate (2018–2024)
Annual Job Openings
Banking/Finance (AAS)
Financial Lending (Certificate Level 1)
Financial Operations (Certificate Level 1)
Teller Training (Occupational Skills Award) 13.88$ ‐1.0% 1,270
International Business (AAS)
International Business (Certificate Level 1)
Translation and Interpretation (Certificate Level 2) 24.67$ 16.0% 253
Certified Global Business Specialist (Occupational Skills Award) 23.98$ 7.0% 315
Marketing, General (AAS) 20.14$ 7.0% 3,255
Marketing (Certificate Level 1)
Retailing (Certificate Level 1)
Legal Assistant (AAS)
Legal Assistant, General (Certificate Level 1)
Legal Assistant, Medical Specialization (Certificate Level 1)
Law Office Clerk (Certificate Level 1) 23.78$ 4.0% 371
Paralegal FastTrack (Non‐Credit) $ 30.19 (a) 10.0% 585
(a) The annual wage data given is associated with an Associates degree rather than a non‐credit program as listed. Source: Emsi, data compiled on November 16, 2017 by Department of Curriculum and Instructional Assessment.
Gulf Coast Wage and Job Growth Expectancy Projectionsby Centers of Excellence
Business
Fina
nce/
Bank
ing
17.45$ 2.0% 33
Paralegal
Techno
logy 30.19$ 10.0% 585
Internationa
l Bu
sine
ss 32.57$ 6.0% 637
Marketin
g/Marketin
g Man
agem
ent
12.68$ 9.0% 15,696
Houston Community College ‐‐ 2017‐2018 | Fact Book Page 46

WAGE AND JOB PROJECTIONS BY CENTER OF EXCELLENCE
Average Hourly Earnings
Job Growth Rate (2018–2024)
Annual Job Openings
Comparative Market Analysis (Certificate Level 1) 27.51$ 6.0% 135
Real Estate, General (AAS)
Commercial (Certificate Level 1)
Residential (Certificate Level 1)
Mortgage Lending Specialization (AAS) Mortgage Lending Professional (Certificate Level 1) Property Management (Certificate Level 1) 37.52$ 8.0% 484Multi‐Family Property Management FastTrack (Non‐Credit)
Source: Emsi, data compiled on November 16, 2017 by Department of Curriculum and Instructional Assessment.
Gulf Coast Wage and Job Growth Expectancy Projectionsby Centers of Excellence
Business
Real Estate 26.64$ 3.0%
25.25$ 9.0%
Data is not available for this specific occupation; rather, it is available for a more general management position.
1,064
506
39%% of Students Received
Federal Pell Grant
761Annual Graduates
13,291Annual Enrollment
45,362Annual Job Openings
In AY 2017
Houston Community College ‐‐ 2017‐2018 | Fact Book Page 47

WAGE AND JOB PROJECTIONS BY CENTER OF EXCELLENCE
Average Hourly Earnings
Job Growth Rate (2018–2024)
Annual Job Openings
Construction Engineering Technology, General (AAS)
Construction Technology (Certificate Level 1)
Construction Helper (Certificate Level 1)
Craft Management Specialization (AAS)
Industrial Scaffold Builder FastTrack (Non‐Credit) 15.22$ 12.0% 5,446
Heating, Air Conditioning & Refrigeration (AAS)
Basic (Certificate Level 1)
Advanced (Certificate Level 1)
Air Conditioning FastTrack (Non‐Credit)
Air Conditioning (Bilingual) FastTrack (Non‐Credit)
Stationary Engineer/Boiler Operator FastTrack (Non‐Credit) 20.20$ 5.0% 94
Electrical Helper (Certificate Level 1)
Electrical Power Technology (Certificate Level 1)
Solar Photovoltaic System Installer (Certificate Level 1) 19.41$ 31.0% 16
Industrial Automation Technology (Certificate Level 1) 25.17$ 5.0% 202
Electrician FastTrack (Non‐Credit)
Electrician / Residential Wiring (Bilingual) FastTrack (Non‐Credit)
Source: Emsi, data compiled on November 16, 2017 by Department of Curriculum and Instructional Assessment.
Gulf Coast Wage and Job Growth Expectancy Projectionsby Centers of Excellence
Construction
34.21$ 7.0% 2,741
Electrical Techn
olog
yCo
nstructio
n En
gine
ering
Techno
logy
Hea
ting, Air Co
ndition
ing
and Re
frigeration
17.24$ 14.0% 354
17.24$ 14.0% 354
22.20$ 13.0% 869
332Annual Graduates
39%% of Students Received
Federal Pell Grant
907Annual Enrollment
9,722Annual Job Openings
In AY 2017
Houston Community College ‐‐ 2017‐2018 | Fact Book Page 48

WAGE AND JOB PROJECTIONS BY CENTER OF EXCELLENCE
Average Hourly Earnings
Job Growth Rate (2018–2024)
Annual Job Openings
Cosmetology Operator (AAS)
Cosmetology Operator (Certificate Level 2)
Facial Specialist (Certificate Level 1) 14.98$ 11.0% 208 Styling/Salon Management Entrepreneur (Certificate Level 1)
Cosmetology Instructor (AAS)
Cosmetology Instructor (Certificate Level 1)
Hair Weaving & Brading Entrepreneur (Certificate Level 1)
Culinary Arts (AAS) 19.48$ 12.0% 431
Culinary Arts (Certificate Level 2) 11.26$ 11.0% 8,196
Baking & Pastry Arts (AAS)
Baking & Pastry Arts (Certificate Level 2)
Baker (Certificate Level 1)
Pastry Cook (Certificate Level 1)
Fashion Design (AAS)
Digital Design (Certificate Level 1)
Men's Tailoring and Alterations (Certificate Level 1) 12.26$ 2.0% 129
Patternmaking (Certificate Level 1) 24.50$ 0.0% 2
Theatrical Costume Design (Certificate Level 2) 18.62$ 7.0% 12
(a) The annual wage data given is associated with a Bachelors degree rather than an Associates degree or certificate as listed.Source: Emsi, data compiled on November 16, 2017 by Department of Curriculum and Instructional Assessment.
Fashion Design
Gulf Coast Wage and Job Growth Expectancy Projectionsby Centers of Excellence
Consumer Arts and Sciences
Cosm
etology
Culin
ary Arts
12.70$ 12.0% 2,415
Data is not available for general ownership of a business.
12.70$ 12.0% 2,415
12.50$ 12.0% 553
Data is not available for general ownership of a business.
$ 27.10 (a) 9.0% 23
Houston Community College ‐‐ 2017‐2018 | Fact Book Page 49

WAGE AND JOB PROJECTIONS BY CENTER OF EXCELLENCE
Average Hourly Earnings
Job Growth Rate (2018–2024)
Annual Job Openings
Fashion Merchandising (AAS) 27.62$ 10.0% 346
Fashion Image Merchandising (Certificate Level 1)
Visual Merchandising (Certificate Level 1)
Hospitality Management (AAS)
Hotel Management (Certificate Level 1)
Restaurant Management (Certificate Level 1) 18.76$ 8.0% 572
Interior Design (AAS)
Interior Decorating (Certificate Level 1)
Kitchen & Bath Design Professional (Certificate Level 2)
Interior Design Communication (Occupational Skills Award)
(a) The annual wage data given is associated with a Bachelors degree rather than an Associates degree or certificate as listed.Source: Emsi, data compiled on November 16, 2017 by Department of Curriculum and Instructional Assessment.
321
Gulf Coast Wage and Job Growth Expectancy Projectionsby Centers of Excellence
Consumer Arts and Sciences
Fashion
Merchan
dising
Hospitality
Administration
Interio
r Design
25.34 (a)$ 4% 231
26.07$ 9.0% 84
13.56$ 6%
246Annual Graduates
48%% of Students Received
Federal Pell Grant
1,670Annual Enrollment
13,523Annual Job Openings
In AY 2017
Houston Community College ‐‐ 2017‐2018 | Fact Book Page 50

WAGE AND JOB PROJECTIONS BY CENTER OF EXCELLENCE
Average Hourly Earnings
Job Growth Rate (2018–2024)
Annual Job Openings
Microsoft Server Administration Specialization (AAS)
Microsoft Server Administration (Certificate Level 1)
Microsoft Server Administration (Certificate Level 2)
Cisco Specialization (AAS)
Certified Cisco Network Associate (Certificate Level 1)
Certified Cisco Network Professional (Certificate Level 1)
Cyber Security Specialization (AAS) 30.49$ 15% 283
Cyber Security (Certificate Level 1)
Cyber Security (Certificate Level 2)
Linux Server Administration Specialization (AAS)
Linux System Administration (Certificate Level 1)
Linux Administrator (Certificate Level 2)
Help Desk Specialization (AAS)
Help Desk (Certificate Level 1)
Help Desk (Certificate Level 2)
Information Technology Core (Certificate Level 1)
A+ Certification FastTrack (Non‐Credit)
Cisco Certified Networking Associate (CCNA) FastTrack (Non‐Credit) $ 36.04 (b) 9% 279
Cyber Security FastTrack (Non‐Credit) $ 49.33 (a) 12% 117
Desktop Support and Networking Specialist FastTrack (Non‐Credit) 27.93$ 10% 1,276
Microsoft Certified Solution Associate FastTrack (Non‐Credit) $ 46.31 (a) 7% 628
Network+ Certification FastTrack (Non‐Credit) $ 36.04 (b) 9% 279
(a) The annual wage data given is associated with a Bachelors degree rather than an Associates degree or certificate as listed.
(b) The annual wage data given is associated with an Associates degree rather than a non‐credit program as listed. Source: Emsi, data compiled on November 16, 2017 by Department of Curriculum and Instructional Assessment.
27.93$ 10% 1,276
Gulf Coast Wage and Job Growth Expectancy Projectionsby Centers of Excellence
Digital and Information Technology
$ 36.04 (b) 9% 279
27.93$ 10% 1,276
Compu
ter S
ystems, Networking
and
Telecom
mun
ications
$ 36.04 (b) 9% 279
Houston Community College ‐‐ 2017‐2018 | Fact Book Page 51

WAGE AND JOB PROJECTIONS BY CENTER OF EXCELLENCE
Average Hourly Earnings
Job Growth Rate (2018–2024)
Annual Job Openings
Applications Development, Microsoft C++ Specialization (AAS)
Applications Development, Microsoft C# Specialization (AAS)
Applications Development, Java Specialization (AAS)
Database Administrator (Certificate Level 2)
SharePoint Administrator (Certificate Level 2)
Mobile Application Developer (Certificate Level 2)
Web Application Developer (Certificate Level 2)
System Applications and Products (SAP) FastTrack (Non‐Credit) $ 45.53 (a) 9% 265
Digital Gaming & Simulation for Artists (AAS)
Digital Gaming & Simulation for Artists (Certificate Level 2)
Digital Gaming & Simulation for Programmers (AAS)
Digital Gaming & Simulation for Programmers (Certificate Level 2)
Technician (Certificate Level 1)
Analyst (Certificate Level 2)
Geographic Information Science (Occupatonal Skills Award)
(a) The annual wage data given is associated with a Bachelors degree rather than an Associates degree or certificate as listed.Source: Emsi, data compiled on November 16, 2017 by Department of Curriculum and Instructional Assessment.
Gulf Coast Wage and Job Growth Expectancy Projectionsby Centers of Excellence
Digital and Information
Compu
ter P
rogram
ming 38.58 (a)$ ‐2% 312
40.22 (a)$ 8% 251
51.53 (a)$ 9% 1,019
Geo
grap
hic
Inform
ation Science
22.72$ ‐1% 217
Digita
l Gam
ing
and Simulation
21.31 (a)$ 6% 496
51.53 (a)$ 9% 1,019
163Annual Graduates
26%% of Students Received
Federal Pell Grant
6,027Annual Enrollment
5,143Annual Job Openings
In AY 2017
Houston Community College ‐‐ 2017‐2018 | Fact Book Page 52
WAGE AND JOB PROJECTIONS BY CENTER OF EXCELLENCE
Average Hourly Earnings
Job Growth Rate (2018–2024)
Annual Job Openings
Computer‐Aided Drafting, General (AAS)
Computer‐Aided Drafting, General (Certificate Level 1)
Computer‐Aided Drafting, Architectural Specialization (AAS)
Computer‐Aided Drafting, Architectural Specialization (Certificate Level 1)
Computer‐Aided Drafting, Civil Specialization (AAS)
Computer‐Aided Drafting, Civil Specialization (Certificate Level 1)
Computer‐Aided Drafting, Electrical Specialization (AAS)
Computer‐Aided Drafting, Electrical Specialization (Certificate Level 1)
Computer‐Aided Drafting, Mechanical Specialization (AAS)
Computer‐Aided Drafting, Mechanical Specialization (Certificate Level 1)
Computer‐Aided Draftig, Pipe Specialization (AAS)
Computer‐Aided Drafting, Pipe Specialization (Certificate Level 1)
AutoCAD Draftsman FastTrack (Non‐Credit)
Electronics Engineering Technology, Biomedical Electronics Specialization (AAS)
Electronics Engineering Technology, Computer Engineering Specialization (AAS)
Computer Servicing/Networks (Certificate Level 1)
Basic Electronics (Certificate Level 2)
Source: Emsi, data compiled on November 16, 2017 by Department of Curriculum and Instructional Assessment.
159
31.38$ 3.0% 352
Electron
ics E
ngineerin
g Techno
logy
3%
34.14$ 1%
Gulf Coast Wage and Job Growth Expectancy Projectionsby Centers of Excellence
Global Energy
44
Data not available for a single skill set within an occupation.
Drafting an
d Design En
gine
ering Techno
logy 44
32.35$ 2% 340
38.03$ 7% 92
37.40$ 3%
37.40$
Houston Community College ‐‐ 2017‐2018 | Fact Book Page 53

WAGE AND JOB PROJECTIONS BY CENTER OF EXCELLENCE
Average Hourly Earnings
Job Growth Rate (2018–2024)
Annual Job Openings
Instrumentation & Controls Engineering Technology (AAS)
Instrumentation & Controls Engineering Technology (Certificate Level 2)
Petroleum Engineering Technology (AAS)
Petroleum Engineering Technology (Certificate Level 2)
Roustabout FastTrack (Non‐Credit) 18.91$ 4% 739
Process Technology (AAS)
Process Operator (Certificate Level 2)
Source: Emsi, data compiled on November 16, 2017 by Department of Curriculum and Instructional Assessment.
Gulf Coast Wage and Job Growth Expectancy Projectionsby Centers of Excellence
Global Energy
271
33.05$ 1% 486
31.38$ 3% 352
Instrumen
tatio
n an
d Co
ntrols
Engine
ering Te
chno
logy
Petroleu
m Eng
inee
ring
Techno
logy
Process
Techno
logy
42.01$ 5%
384Annual Graduates
30%% of Students Received
Federal Pell Grant
1,935Annual Enrollment
2,483Annual Job Openings
In AY 2017
Houston Community College ‐‐ 2017‐2018 | Fact Book Page 54

WAGE AND JOB PROJECTIONS BY CENTER OF EXCELLENCE
Average Hourly Earnings
Job Growth Rate (2018–2024)
Annual Job Openings
Allied Health, Dental Assisting Track (AAS)
Dental Assisting (Certificate Level 1)
Dental Hygiene (AAS) 35.43$ 21% 278
Diagnostic Medical Sonography (Advanced Technical Certificate) 41.57$ 17% 148
Histologic Technician (AAS)
Medical Laboratory Technician (AAS)
Nuclear Medicine Technology (AAS) 37.91$ 10% 18
Radiography (AAS)
Computed Tomography (Enhanced Skills Certificate)
Electrocardiography (EKG) Technician FastTrack (Non‐Credit)
Electrocardiography Monitoring/Telemetry Technician FastTrack (Non‐Credit)
Health Information Technology (AAS)
Analysis (Certificate Level 1)
Coding (Certificate Level 2)
Human Service Technology (AAS)
Chemical Dependency Counselor (Certificate Level 1)
Certified Prevention Specialist (Occupational Skills Award) 17.09$ 14% 436
Community Health Worker (Occupational Skills Award) 22.49$ 12% 149
Allied Health, Pharmacy Technician Track (AAS) 16.72$ 11% 767
Pharmacy Technician (Certificate Level 2)
Retail (Occupational Skills Award)
(a) The annual wage data given is associated with a Bachelors degree rather than an Associates degree or certificate as listed.(b) The annual wage data given is associated with an Associates degree rather than a non‐credit program as listed. Source: Emsi, data compiled on November 16, 2017 by Department of Curriculum and Instructional Assessment.
Health
Care Ad
ministration 20.85$ 14% 322
$ 22.71 (a) 17% 149
11.55$ 20% 36
Diagn
ostic
Services
28.50$ 11% 287
$ 25.67 (b) 15% 129
19.85$ 16% 217
Gulf Coast Wage and Job Growth Expectancy Projectionsby Centers of Excellence
Health Sciences
Den
tal
Services 17.52$ 16% 1,076
Houston Community College ‐‐ 2017‐2018 | Fact Book Page 55

WAGE AND JOB PROJECTIONS BY CENTER OF EXCELLENCE
Average Hourly Earnings
Job Growth Rate
(2018–2024)
Annual Job Openings
Nursing (AAS)
LVN/ADN Transition (AAS)
Allied Health, Vocational Nursing Track (AAS)
Vocational Nursing (Certificate Level 1)
Certified Nurse Aide FastTrack (Non‐Credit) 12.96$ 16% 3,181
Allied Health, Medical Assistant Track (AAS)
Medical Assistant (Certificate Level 2)
Medical Scribe (Certificate Level 1) 21.03$ 5% 111
Allied Health, Surgical Technology Track (AAS)
Surgical Technology (Certificate Level 1)
Accelerated Alternative Delivery (Occupational Skills Award)
Sterile Processing Technician (Occupational Skills Award) 16.69$ 17% 121
Patient Care Technician FastTrack (Non‐Credit) 12.96$ 16% 3,181
Phlebotomist FastTrack (Non‐Credit) 16.06$ 20% 268
Occupational Therapy Assistant (AAS) 31.37$ 21% 86
Physical Therapist Assistant (AAS) 32.13$ 23% 194
Respiratory Therapist (AAS) 25.16$ ‐2% 20
Source: Emsi, data compiled on November 16, 2017 by Department of Curriculum and Instructional Assessment.
Nursing
Gulf Coast Wage and Job Growth Expectancy Projectionsby Centers of Excellence
Health Sciences
24.77$ 15% 1,239
37.29$ 15% 4,367
24.25$ 11% 291
Therap
eutic
Se
rvices
Patie
nt Care Se
rvices
14.88$ 16% 2,093
737Annual Graduates
40%% of Students Received
Federal Pell Grant
3,197Annual Enrollment
15,983Annual Job Openings
In AY 2017
Houston Community College ‐‐ 2017‐2018 | Fact Book Page 56

WAGE AND JOB PROJECTIONS BY CENTER OF EXCELLENCE
Average Hourly Earnings
Job Growth Rate (2018–2024)
Annual Job Openings
Logistics & Global Supply Chain Management, General (AAS) 35.86 (a)$ 5% 848
Logistics & Global Supply Chain Management, General (Certificate Level 1)
Logistics & Global Supply Chain Management, Specialist (Certificate Level 1)
Maritime Transportation Logistics Specialization (AAS) 24.75$ 9.0% 383
Maritime Logistics Specialization (Certificate Level 1) 14.52$ 8.0% 6,991
(a) The annual wage data given is associated with a Bachelors degree rather than an Associates degree or certificate as listed.
Source: Emsi, data compiled on November 16, 2017 by Department of Curriculum and Instructional Assessment.
Gulf Coast Wage and Job Growth Expectancy Projectionsby Centers of Excellence
Logistics
Logistics a
nd
Globa
l Sup
ply
Maritime
Logistics
20.94$ 4% 168
83Annual Graduates
31%% of Students Received
Federal Pell Grant
836Annual Enrollment
8,390Annual Job Openings
In AY 2017
Houston Community College ‐‐ 2017‐2018 | Fact Book Page 57
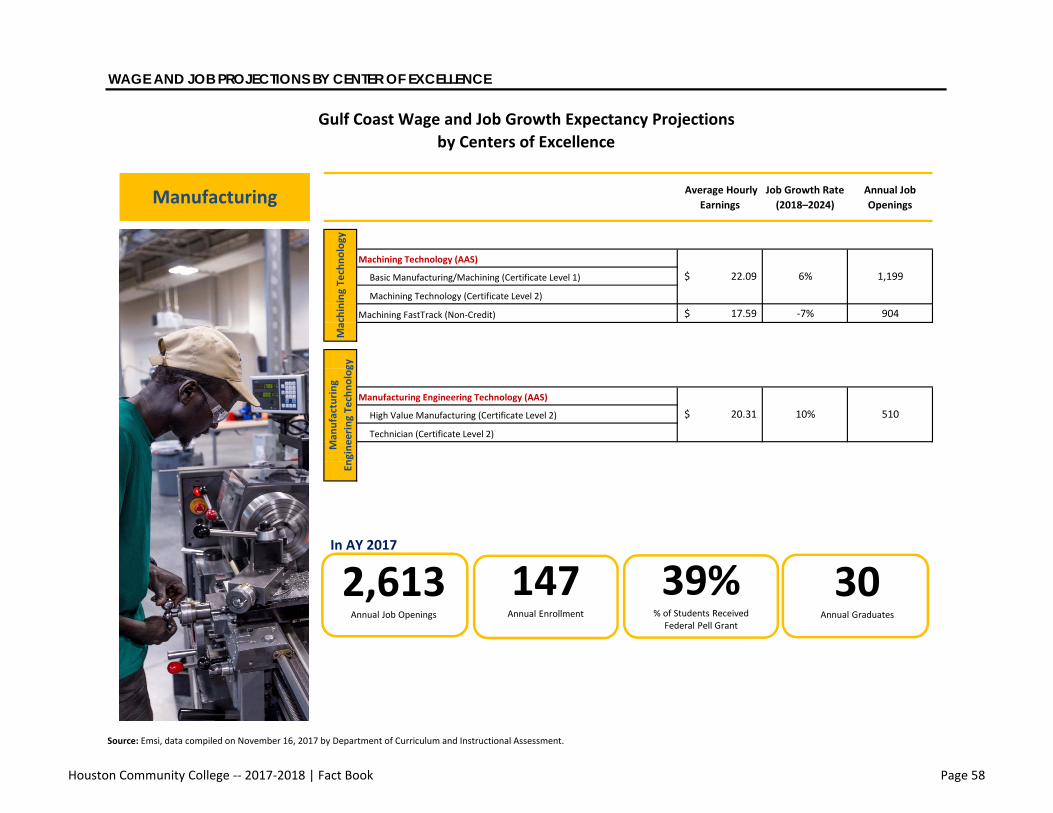
WAGE AND JOB PROJECTIONS BY CENTER OF EXCELLENCE
Average Hourly Earnings
Job Growth Rate (2018–2024)
Annual Job Openings
Machining Technology (AAS)
Basic Manufacturing/Machining (Certificate Level 1)
Machining Technology (Certificate Level 2)
Machining FastTrack (Non‐Credit) 17.59$ ‐7% 904
Manufacturing Engineering Technology (AAS)
High Value Manufacturing (Certificate Level 2)
Technician (Certificate Level 2)
Source: Emsi, data compiled on November 16, 2017 by Department of Curriculum and Instructional Assessment.
Gulf Coast Wage and Job Growth Expectancy Projectionsby Centers of Excellence
Manufacturing
Machining
Techn
olog
yMan
ufacturin
g En
gine
ering Te
chno
logy
20.31$ 10% 510
22.09$ 6% 1,199
30Annual Graduates
39%% of Students Received
Federal Pell Grant
147Annual Enrollment
2,613Annual Job Openings
In AY 2017
Houston Community College ‐‐ 2017‐2018 | Fact Book Page 58

WAGE AND JOB PROJECTIONS BY CENTER OF EXCELLENCE
Average Hourly Earnings
Job Growth Rate (2018–2024)
Annual Job Openings
Corrosion Technology (AAS)
Atmospheric Corrosion (Certificate Level 1)
Cathodic Protection (Certificate Level 1)
Basic Welding Helper (Certificate Level 1)
Advanced Welding (Certificate Level 1)
Welder FastTrack (Non‐Credit)
Source: Emsi, data compiled on November 16, 2017 by Department of Curriculum and Instructional Assessment.
Welding
23.74$ 5% 2,280
Gulf Coast Wage and Job Growth Expectancy Projectionsby Centers of Excellence
Material Science
Corrosion
Techno
logy
17430.67$ 4%
108Annual Graduates
56%% of Students Received
Federal Pell Grant
523Annual Enrollment
2,454Annual Job Openings
In AY 2017
Houston Community College ‐‐ 2017‐2018 | Fact Book Page 59

WAGE AND JOB PROJECTIONS BY CENTER OF EXCELLENCE
Average Hourly Earnings
Job Growth Rate (2018–2024)
Annual Job Openings
Digital Communication, General (AAS)
Digital Communication , General (Certificate Level 1)
Digital Communication, General (Certificate Level 2)
Mobile Application (Certificate Level 1)
Digital Photography Specialization (AAS)
Digital Photography Specialization (Certificate Level 1)
Digital Photography Specialization (Certificate Level 2)
Graphic Design Specialization (AAS)
Graphic Design Specialization (Certificate Level 1)
Graphic Design Specialization (Certificate Level 2)
Digital Media Specialization (AAS)
Multimedia Specialization (Certificate Level 1)
Multimedia Specialization (Certificate Level 2)
Web Publishing Specialization (AAS)
Web Publishing Specialization (Certificate Level 1)
Web Publishing Specialization (Certificate Level 2)
Visual Effects & Motion Graphics Specialization (AAS)
Visual Effects & Motion Graphics Specialization (Certificate Level 1)
Visual Effects & Motion Graphics Specialization (Certificate Level 2)
(a) The annual wage data given is associated with a Bachelors degree rather than an Associates degree or certificate as listed.
Source: Emsi, data compiled on November 16, 2017 by Department of Curriculum and Instructional Assessment.
22.20 (a)$ 5% 47
30.49$ 15% 283
Gulf Coast Wage and Job Growth Expectancy Projectionsby Centers of Excellence
Media Arts and Technology
22.20 (a)$ 5% 47
21.31 (a)$ 6% 496
17.96 (a)$ 4% 230Digita
l Com
mun
ication
21.31 (a)$ 6% 496
Houston Community College ‐‐ 2017‐2018 | Fact Book Page 60

WAGE AND JOB PROJECTIONS BY CENTER OF EXCELLENCE
Average Hourly Earnings
Job Growth Rate (2018–2024)
Annual Job Openings
Audio Recording Technology (AAS)
Audio Recording Technology (Certificate Level 1)
Electronic Music Production (Certificate Level 1)
Electronic Music Production (Enhanced Skills Certificate)
Filmmaking (AAS)
Film/Video Production Specialization (Certificate Level 1)
Screenwriting Specialization (Certificate Level 1)
Filmmaking (Certificate Level 2)
Audio Post‐Production (Enhanced Skills Certificate)
Editing Specialization (Certificate Level 1)
Administration Specialization (AAS)
Administration Specialization (Certificate Level 2)
Songwriting/Production Specialization (AAS)
Songwriting/Production Specialization (Certificate Level 2)
Music Business (Certificate Level 1)
(a) The annual wage data given is associated with a Bachelors degree rather than an Associates degree or certificate as listed.Source: Emsi, data compiled on November 16, 2017 by Department of Curriculum and Instructional Assessment.
Gulf Coast Wage and Job Growth Expectancy Projectionsby Centers of Excellence
Media Arts and Technology
Music Business
23.16 (a)$ 1% 24
Audio Re
cording Te
chno
logy /
Vide
o Prod
uctio
n
24.63$ 1% 22
29.13 (a)$ 3% 31
Film
mak
ing
120Annual Graduates
40%% of Students Received
Federal Pell Grant
2,025Annual Enrollment
1,133Annual Job Openings
In AY 2017
Houston Community College ‐‐ 2017‐2018 | Fact Book Page 61

WAGE AND JOB PROJECTIONS BY CENTER OF EXCELLENCE
Average Hourly Earnings
Job Growth Rate (2018–2024)
Annual Job Openings
Law Enforcement (AAS)
Basic Peace Officer Licensing (Certificate Level 1)
Texas Basic Peace Officer (Non‐Credit)
Emergency Medical Services (AAS)
Paramedic (Certificate Level 2)
Advanced Technician (Certificate Level 1)
Emergency Medical Services, RN to Paramedic (Enhanced Skills Certificate) 32.29 (a)$ 15% 4,367
Firefighter (AAS)
Basic Firefighter (Certificate Level 1)
Fire Officer (Certificate Level 1) 37.54$ 13% 36
Fire Inspector (Occupational Skills Award) 24.45$ 4% 38
Fire Instructor (Occupational Skills Award) 23.04$ 7% 548
Fire & Arson Investigation (AAS)
Fire & Arson Investigator (Occupational Skills Award)
(a) The annual wage data given is associated with a Bachelors degree rather than an Associates degree or certificate as listed.
Source: Emsi, data compiled on November 16, 2017 by Department of Curriculum and Instructional Assessment.
Fire
Protectio
n
32.19$ 8% 27
Gulf Coast Wage and Job Growth Expectancy Projectionsby Centers of Excellence
Public Safety
Crim
inal
Justice
Fire Scien
ce and
Safety
30.58$ 1,390
16.57$ 14% 317
549
7%
Emerge
ncy
Med
ical Services
23.04$ 7%
226Annual Graduates
37%% of Students Received
Federal Pell Grant
1,489Annual Enrollment
7,236Annual Job Openings
In AY 2017
Houston Community College ‐‐ 2017‐2018 | Fact Book Page 62

WAGE AND JOB PROJECTIONS BY CENTER OF EXCELLENCE
Average Hourly Earnings
Job Growth Rate (2018–2024)
Annual Job Openings
Horticulture Technology (AAS) 16.77$ 5% 281
Interpretation Transliteration Technology (AAS) $ 24.67 (a) 16% 253
(a) The annual wage data given is associated with a Bachelors degree rather than an Associates degree or certificate as listed.
Source: Emsi, data compiled on November 16, 2017 by Department of Curriculum and Instructional Assessment.
Gulf Coast Wage and Job Growth Expectancy Projectionsby Instructional Divisions
Other
Hortic
ulture
Interpretin
g /
Sign
Lan
guage
534Annual Job Openings
In AY 2017
Houston Community College ‐‐ 2017‐2018 | Fact Book Page 63

African American Hispanic Asian White Other or Multiple
African American
Hispanic
Asian
White
Other or Multiple
Sources:a) Sources: Pcensus (see Glossary), data compiled on January 2017. b) HCC OIR DataMart Files, End of Term, FY 2017.c) IPEDS Human Resources Survey, Fall 2016.
PE
RSONNEL PRO
FILE
HCC All Student Population
FY 2017 (b)
HCC Service Area Population 2016 (a)
22.6%
41.1%
8.5%
26.2%
1.7%
HCC All Full‐Time (FT) Employees
FY 2017 (c)
15.5%
6.4%
33.4%
0.4%
37.6%
Service Area, All Student Population, and Full‐Time Employee by Ethnicity FY 2017
19.5%
9.1%
27.1%
38.1%
12.9%
Ethnicity
64%Minority Population
65%Minority Students
57%Minority
2%
26% 23%16%
6% <1%27%
8%
41%
13%
38% 9%
33% 38%
20%

PERSONNEL PROFILE
Page
Total Full‐Time Employees—Fall 2012‐Fall 2016Assignment ……………………………………………………………………………………………………………………… 66Gender and Ethnicity ……………………………………………………………………………………………………… 67
Full‐Time Employees—Fall 2016Zip Codes Map ………………………………………………………………………………………………………………… 68
Full‐Time Faculty—Fall 2012‐Fall 2016Gender and Ethnicity ……………………………………………………………………………………………………… 69
Part‐Time Faculty—Fall 2012‐Fall 2016Gender and Ethnicity ……………………………………………………………………………………………………… 70
Full‐Time Administration—Fall 2012‐Fall 2016Gender and Ethnicity ……………………………………………………………………………………………………… 71
Full‐Time Staff—Fall 2012‐Fall 2016Gender and Ethnicity ……………………………………………………………………………………………………… 72
Houston Community College ‐‐ 2017‐2018 | Fact Book Page 65

TOTAL FULL-TIME EMPLOYEES—FALL 2012 - FALL 2016
Full‐Time ‐‐ Employees Fall 12 Fall 13 Fall 14 Fall 15 Fall 16
Faculty 789 759 759 818 830
Administration 162 191 183 185 197
Staff 1,188 1,132 1,202 1,280 1,331
Total 2,139 2,082 2,144 2,283 2,358
Source: IPEDS Human Resources Survey, Fall 2012‐16.
Full‐Time Employees by Assignment Fall Semesters
789 759 759 818 830
162 191 183 185 197
1,188 1,132 1,202 1,280 1,331
‐
400
800
1,200
1,600
Fall 12 Fall 13 Fall 14 Fall 15 Fall 16
Administration
Faculty
35%Faculty
56%Staff
8%Administration
Full‐TimeEmployees
Houston Community College ‐‐ 2017‐2018 | Fact Book Page 66

TOTAL FULL-TIME EMPLOYEES—FALL 2012 - FALL 2016
Full‐Time ‐‐ Employees Fall 12 Fall 13 Fall 14 Fall 15 Fall 16
White 827 788 784 787 787
African American 742 740 788 857 887
Hispanic 395 380 378 433 460
Asian 164 164 183 202 215
Other 11 10 11 4 9
Total 2,139 2,082 2,144 2,283 2,358
Source: IPEDS Human Resources Survey, Fall 2012‐16.
Full‐Time Employees by Ethnicity Fall Semesters
827 788 784
787 787 742 740
788
857 887
395 380 378 433 460
164 164 183 202 215
‐
200
400
600
800
1,000
Fall 12 Fall 13 Fall 14 Fall 15 Fall 16
White
Asian
Houston Community College ‐‐ 2017‐2018 | Fact Book Page 67

FULL-TIME EMPLOYEES BY ZIP CODES MAP—FALL 2016
Full‐Time Employees by Zip Codes ‐ Fall 2016
Note: Number of full‐time employees live in those zip codes. This map did not include 153 (6%) full‐time employees who live 25 or more miles away from Houston downtown (77001).
77532
77090
77050
77396
77346
77530
7701577020 77029
77013
77049
77026
77028
77078
77044
77068
7738877379
77377
77429
77070 77069
77066
7706477065
77095
77433
7708477449
7704177040
77484
77447 77014
77067
77086
77088
77038
77037
77073
77373 77386 7734577339
77338
77039
77093 77016
7749377423
7749477441
7745077082
7707777094
77079
77043
77581
77047
77045
77072
77489
7754577471
77479
77478
77083
77578
77089
7707577048
77584
77054
77035
77477
77053
7745977469
77099
7749877407
77076
77406
77092
77060
77009
7700777024
7705577080
77008
77018
77091
77062
77598
77034
7758777504
77502
77573
77546
7751177583
77051 77033
77021
77023
77011 77547
77012
77017
77503
77506 77536
77571
77059
77586
77058
77087
77004
77074
7703677401
77005
7702577096
77085
7705 77027 77098
7700677019
7706377042
7703177071
7705
6
Houston
77505
77521
77539
77562
77565
77507
77481
77032
7753577336
77355
77485
77002
7708
1 77030
77022
Campus/Location
IAH
Full‐Time Employees, Fall 2016n = 2,244
0 1 5 10 20 50 100
HOU
77061
77003
Houston Community College ‐‐ 2017‐2018 | Fact Book Page 68

FULL-TIME FACULTY—FALL 2012 - FALL 2016
Full‐Time ‐‐ Faculty Fall 12 Fall 13 Fall 14 Fall 15 Fall 16
White 463 436 429 458 454
African American 175 176 178 200 205
Hispanic 75 70 71 75 82
Asian 70 70 78 85 85
Other 6 7 3 ‐ 4
Total 789 759 759 818 830
Source: IPEDS Human Resources Survey, Fall 2012‐16.
Full‐Time ‐‐ Faculty by Ethnicity Fall Semesters
463 436 429
458 454
175 176 178 200 205
75 70 71 75 82
70 70 78 85 85
‐
200
400
600
Fall 12 Fall 13 Fall 14 Fall 15 Fall 16
African American
White
Asian
Hispanic
Houston Community College ‐‐ 2017‐2018 | Fact Book Page 69

PART-TIME FACULTY—FALL 2012 - FALL 2016
Part‐Time ‐‐ Faculty Fall 12 (a) Fall 13 Fall 14 Fall 15 Fall 16
White 808 791 761 777 640
African American 583 605 594 612 552
Hispanic 150 152 141 150 145
Asian 141 154 171 168 196
Other 33 40 20 10 12
Total 1,715 1,742 1,687 1,717 1,545
a) Prior to Fall 2012, tutors were erroneously classified as part‐time faculty.
Source: IPEDS Human Resources Survey, Fall 2012‐16.
Part‐Time ‐‐ Faculty by Ethnicity Fall Semesters
808 791 761 777
640 583 605 594 612
552
150 152 141 150 145
141 154 171 168 196
‐
200
400
600
800
1,000
Fall 12 (a) Fall 13 Fall 14 Fall 15 Fall 16
Hispanic
Houston Community College ‐‐ 2017‐2018 | Fact Book Page 70

FULL-TIME ADMINISTRATION—FALL 2012 - FALL 2016
Full‐Time ‐‐ Administration Fall 12 (a) Fall 13 Fall 14 Fall 15 Fall 16
White 67 80 70 65 69
African American 64 74 76 79 83
Hispanic 28 35 32 35 37
Asian 3 2 4 6 7
Other ‐ ‐ 1 ‐ 1
Total 162 191 183 185 197
a) In Fall 2012, reflects changes in the classification of some professional management personnel to administrative personnel.
Source: IPEDS Human Resources Survey, Fall 2012‐16.
Fall Semesters Full‐Time ‐‐ Administration by Ethnicity
67
80
70 65 69
64
74
76 79 83
28 35 32 35 37
3 2 4 6 7
‐
20
40
60
80
100
Fall 12 (a) Fall 13 Fall 14 Fall 15 Fall 16
Asian
Hispanic
Houston Community College ‐‐ 2017‐2018 | Fact Book Page 71

FULL-TIME SUPPORT STAFF—FALL 2012 - FALL 2016
Full‐Time ‐‐ Staff Fall 12 Fall 13 Fall 14 Fall 15 Fall 16
White 297 272 285 264 264
African American 503 490 534 578 599
Hispanic 292 275 275 323 341
Asian 91 92 100 111 123
Other 5 3 8 4 4
Total 1,188 1,132 1,202 1,280 1,331
Source: IPEDS Human Resources Survey, Fall 2012‐16.
Fall SemestersFull‐Time ‐ Staff by Ethnicity
297 272 285 264 264
503 490 534 578 599
292 275 275 323 341
91 92 100 111 123 ‐
200
400
600
800
Fall 12 Fall 13 Fall 14 Fall 15 Fall 16
White
Asian
Houston Community College ‐‐ 2017‐2018 | Fact Book Page 72

State of the College a great experience for me as Chancellor of HCC Posted on March 9, 2017 by Cesar Maldonado, Ph.D., P.E., Chancellor, Houston Community College
One of my great pleasures is sharing the transformative and innovative achievements at Houston Community College with business, political and educational leaders in the greater Houston area. I had a wonderful opportunity to do just that on the morning of February 27 at our annual State of the College presentation.
One of the themes of my address was that HCC’s innovative culture has a vibrant presence in every corner of our community. Our graduates are having a huge impact in the workforce, in just about every profession you can imagine. How big of an impact? Well, it’s estimated that our alumni equate to 38,000 added jobs to the region.
I have another impressive statistic to share with you. A recent study calculated that HCC generates a total economic impact of $4.1 billion dollars. That’s twice the size of the arts and entertainment industry in the region.
FI
NA
NC
IAL
INFO
RMA
TION

FINANCIAL INFORMATION
Page
Distribution of Revenues ……………………………………………………………………………………………………… 75Distribution of Expenditures ………………………………………………………………………………………………… 75
Audited Revenues, Expenditures, All Funds— FY 2016 ‐ FY 2017Distribution of Revenues ……………………………………………………………………………………………………… 76Distribution of Expenditures ………………………………………………………………………………………………… 76
Tax Rate—2017‐2018 ………………………………………………………………………………………………………………… 77
Tuition and Fees ………………………………………………………………………………………………………………………… 78
Financial Aid Awards Students Receiving Financial aid Awards ……………………………………………………………………………… 79Number of Financial aid Awards …………………………………………………………………………………………… 79Amount Disbursed to Financial Aid Students ………………………………………………………………………… 80Amount Disbursed to Financial Aid Enrolled Students by Centers ………………………………………… 81
Approved Budget Unrestricted Revenues and Expenditures (Operating Fund)— FY 2017 ‐ FY 2018
Houston Community College ‐‐ 2017‐2018 | Fact Book Page 74

APPROVED BUDGET UNRESTRICTED REVENUES AND EXPENDITURES (OPERATING FUND)—FY 2017 - FY 2018
Distribution of Revenues FY 2017 FY 2018 Distribution of Expenditures FY 2017 FY 2018
State Appropriations 70,162,214$ 68,108,943$ Academic Support 23,939,600$ 25,526,184$
Ad Valorem Taxes 146,800,000 159,089,000 Institutional Support 89,591,541 91,412,182
Tuition and Fees 117,882,000 116,257,000 Instructional 111,252,057 113,386,470
Other Local Income 3,120,000 4,800,000 Physical Plant 30,958,367 32,695,573
Total Approved Budget Revenues $337,964,214 $348,254,943 Public Service 1,261,380 1,291,904
Staff Benefits 22,582,675 23,366,553
Student Support 26,837,595 30,721,390
Transfers 31,540,999 29,854,687
Total Approved Budget Expenditures $337,964,214 $348,254,943
Source: HCC FY 2017 & FY 2018 Budget, Unrestricted Funds.
FY 2018 FY 2018
Distribution of Revenues
46%Ad Valorem Taxes
33%Tuition and Fees
20%State
Appropriations
1%Other Local Income
9%Physical Plant
26%Institutional Support
<1%Public Service
7%Staff
Benefits
9%Student Support
9%Transfers
7%Academic Support
33%Instructional
Distribution of Expenditures
Houston Community College ‐‐ 2017‐2018 | Fact Book Page 75

AUDITED REVENUES, EXPENDITURES, ALL FUNDS—FY 2016 - FY 2017
Distribution of Revenues FY 2016 (Restated)
FY 2017 Distribution of Expenditures FY 2016 (Restated)
FY 2017
Tuition and Fees $79,625,900 $78,928,147 Instruction $123,860,246 $131,976,183
Other Operating Revenues 24,126,683 23,103,557 Public Services 10,885,467 11,251,480
Auxiliary Enterprises 10,141,084 12,100,510 Academic Support 32,357,317 33,437,021
Total Operating Revenues $113,893,667 $114,132,214 Student Services 30,877,171 32,769,639
Institutional Support 69,312,047 76,337,702
Ad Valorem Taxes $179,907,211 $193,032,101 Operation & Maintenance of Plant 27,396,317 27,636,411
State Appropriations 83,877,620 84,194,227 Scholarships & Fellowships 58,153,241 55,435,891
Investments Income 2,752,692 3,557,445 Auxiliary Enterprises 11,839,737 11,064,979
Other Non‐Operating Revenue 3,260,812 7,157,578 Depreciation 22,724,776 24,303,365
Title IV Grants 86,117,577 80,531,464 Total Operating Expenses $387,406,319 $404,212,671
Gifts 2,025,562 1,875,561
Total Nonoperating Revenues $357,941,474 $370,348,376 Interest on Capital Related Debt $19,535,342 $17,991,413
Total Audited Revenues $471,835,141 $484,480,590 Loss on Sale of Fixed Assets 5,517,511 ‐
Other Nonoperating Expenses‐net 8,920,785 10,275,410
a) Other: includes Investments Income, Other Non‐Operating Revenue, & Gifts. Total Nonoperating Expenses $33,973,638 $28,266,823
Source: HCC Annual Financial Report for the Fiscal Year Ended August 31, FY 2016 & FY 2017. Total Audited Expenditures $421,379,957 $432,479,494
Ope
ratin
gNon
operating
Non
‐ op
erating
Ope
ratin
g
Distribution of Revenues
FY 2017
Distribution of Expenditures
FY 2017
40%Ad Valorem Taxes
8%Student Services
8%AcademicSupport
3%Public Services
2%Other
Nonoperating Expenses‐net
6%Depreciation
4%Interest on
Capital Related Debt
3%Auxiliary
Enterprises
6%Operation &
Maintenance of Plant
13%Scholarships & Fellowships
18%Institutional Support
31%Instruction
2%Auxiliary
Enterprises
5%Other Operating
Revenues3%Other(a)
16%Tuition and
Fees
17%Title IV Grants
17%State
Appropriations
Houston Community College ‐‐ 2017‐2018 | Fact Book Page 76

Tax Rate — FY 2014 ‐ FY 2018
Tax Rate FY 2014 FY 2015 FY 2016 FY 2017 FY 2018 Trend
Maintenance & Operations Tax Rate 0.077055 0.077055 0.075631 0.075277 0.076652
Debt Service Tax Rate 0.020118 0.029835 0.026311 0.024986 0.023611
Total Tax Rate 0.097173 0.10689 0.101942 0.100263 0.100263
Source: HCC Approved Budget | FY 2018.
Tax Rate Per $100 Valuation
0.077055 0.077055 0.075631 0.075277 0.076652
0.020118 0.029835 0.026311 0.024986 0.023611
0.00
0.02
0.04
0.06
0.08
0.10
0.12
F Y 2 0 1 4 F Y 2 0 1 5 F Y 2 0 1 6 F Y 2 0 1 7 F Y 2 0 1 8
Houston Community College ‐‐ 2017‐2018 | Fact Book Page 77

TUITION AND FEES—FALL 2013 ‐ FALL 2017
Fall 2013 Fall 2014 Fall 2015 Fall 2016 Fall 20173 208.20$ 208.20$ 208.50$ $ 208.50 208.50$
6 410.40 410.40 411.00 411.00 411.00
9 612.60 612.60 613.50 613.50 613.50
12 814.80 814.80 816.00 816.00 816.00
15 1,014.00 1,014.00 1,015.50 1,015.50 1,015.50
Fall 2013 Fall 2014 Fall 2015 Fall 2016 Fall 20173 423.90$ 424.20$ 424.20$ $ 424.50 424.50$
6 841.80 842.40 842.40 843.00 843.00
9 1,259.70 1,260.60 1,260.60 1,261.50 1,261.50
12 1,677.60 1,678.80 1,678.80 1,680.00 1,680.00
15 2,092.50 2,094.00 2,094.00 2,095.50 2,095.50
Fall 2013 Fall 2014 Fall 2015 Fall 2016 Fall 20173 473.40$ 473.70$ 473.70$ $ 474.00 474.00$
6 940.80 941.40 941.40 942.00 942.00
9 1,408.20 1,409.10 1,409.10 1,410.00 1,410.00
12 1,875.60 1,876.80 1,876.80 1,878.00 1,878.00
15 2,340.00 2,341.50 2,341.50 2,343.00 2,343.00
Note:
a) Laboratory fees are not included.Source: Student Financial Services, Fall 2013 ‐ Fall 2017.
Schedule of Tuition and Fees ‐‐ SCH (a)
Non
‐Texas Residen
ts(O
ut‐of‐State)
Per Semester HourAcademic/Workforce Courses
Texas R
esiden
ts(In
‐District)
Texas R
esiden
ts(O
ut‐of‐District)
Per Semester HourAcademic/Workforce Courses
Per Semester HourAcademic/Workforce Courses
Houston Community College ‐‐ 2017‐2018 | Fact Book Page 78

FINANCIAL AID AWARDS—AY 2013 - AY 2017
AY 2013 AY 2014 AY 2015 AY 2016 AY 201730,552 29,786 30,348 28,124 25,845
2,030 1,795 1,316 1,912 2,526
18,750 17,895 17,407 15,703 15,527
2,788 2,908 6,137 4,546 4,107
15 10 12 7 17
452 2,317 4,399 1,243 1,274
2,820 2,852 2,004 3,612 2,705
Unduplicated Total 36,464 35,770 36,091 34,465 31,934
AY 2013 AY 2014 AY 2015 AY 2016 AY 201730,567 29,786 30,348 28,126 25,845
2,031 1,795 2,350 3,377 3,389
33,024 31,633 30,955 27,264 26,966
3,084 3,291 9,169 6,815 6,686
17 12 14 7 17
452 2,317 4,399 1,295 1,406
2,870 2,908 2,070 4,625 3,500
Duplicated Total 72,045 71,742 79,305 71,509 67,809
a) Total number of students is unduplicated; students may receive more than one award.
Source: HCC Financial Aid DataMart.
Annual Number of Total Financial Aid Awards
Annual Number of Enrolled Students Receiving Financial Aid Awards
Texas Loans
Federal/Texas Work Study
Scholarships
Federal/Texas Work Study
Federal Grants
Federal Loans
Texas Grants
Texas Loans
Federal Pell GrantNumber of Students (a)
Scholarships
Texas Grants
Number of AwardsFederal Pell Grant
Federal Grants
Federal Loans
72,045
71,742
79,305
71,509
67,809
‐ 25,000 50,000 75,000 100,000
AY 2013
AY 2014
AY 2015
AY 2016
AY 2017
Total A
wards
30,552
29,786
30,348
28,124
25,845
‐ 10,000 20,000 30,000 40,000
AY 2013
AY 2014
AY 2015
AY 2016
AY 2017
Fede
ral P
ell G
rant
18,750
17,895
17,407
15,703
15,527
‐ 10,000 20,000 30,000 40,000
AY 2013
AY 2014
AY 2015
AY 2016
AY 2017
Fede
ral Loa
ns
Houston Community College ‐‐ 2017‐2018 | Fact Book Page 79

FINANCIAL AID AWARDS—AY 2013 - AY 2017
AY 2013 AY 2014 AY 2015 AY 2016 AY 201793,144,848$ 92,715,529$ $ 94,128,769 $ 84,707,302 $ 79,147,561
1,798,900 1,600,879 871,609 1,240,389 1,253,460
108,421,188 110,127,249 87,466,203 77,814,823 81,369,517
4,734,393 5,718,904 8,640,155 6,689,484 6,595,396
54,534 17,578 18,087 17,993 59,415
3,838,735 3,799,569 1,843,860 3,574,969 3,374,879
Total 211,992,598$ 213,979,708$ 192,968,683$ 174,044,960$ 171,800,228$
Source: HCC Financial Aid DataMart.
Annual Amount Disbursed to Financial Aid Enrolled Students
Federal Pell Grant
Federal Grants
Scholarships
Amount Disbursed
Federal Loans
Texas Grants
Texas Loans
Total Amount Disbursed
$93,144,848
$92,715,529
$94,128,769
$84,707,302
$79,147,561
$‐ $40,000,000 $80,000,000 $120,000,000
AY 2013
AY 2014
AY 2015
AY 2016
AY 2017
Fede
ral P
ell G
rant
$212
$214
$193
$174
$172
‐ 90 180 270
AY 2013
AY 2014
AY 2015
AY 2016
AY 2017
Millions
Total D
isbursed
$108,421,188
$110,127,249
$87,466,203
$77,814,823
$81,369,517
$0 $50,000,000 $100,000,000 $150,000,000
AY 2013
AY 2014
AY 2015
AY 2016
AY 2017
Fede
ral Loa
ns
Houston Community College ‐‐ 2017‐2018 | Fact Book Page 80

FINANCIAL AID AWARDS—AY 2016 - AY 2017
Annual Amount Disbursed to Financial Aid Enrolled Students by Major
AY 2 0 1 6 A Y 2 0 1 7
Automotive
$1,662,663 $1,600,297
AY 2 0 1 6 A Y 2 0 1 7 AY 2 0 1 6 A Y 2 0 1 7
College Readiness(Intensive English)
$16,461
$40,752
AY 2 0 1 6 A Y 2 0 1 7
Construction
$1,803,053$2,115,227
AY 2 0 1 6 A Y 2 0 1 7
Consumer Arts & Sciences
$6,975,353 $7,154,780
AY 2 0 1 6 A Y 2 0 1 7
Digital & Information Tech
$2,371,444
$3,591,294
AY 2 0 1 6 A Y 2 0 1 7
Engineering
$2,761,082$3,074,819
AY 2 0 1 6 A Y 2 0 1 7
English & Communication
$758,999
$1,043,658
AY 2 0 1 6 A Y 2 0 1 7
Global Energy
$5,354,363$4,709,848
AY 2 0 1 6 A Y 2 0 1 7
Health Sciences
$8,126,385 $7,540,741
AY 2 0 1 6 A Y 2 0 1 7
Liberal Arts, Humanities& Education
$79,134,775 $80,034,371
AY 2 0 1 6 A Y 2 0 1 7
Life & Natural Sciences
$31,366,321$34,604,190
Business
$22,015,191$25,719,193
Houston Community College ‐‐ 2017‐2018 | Fact Book Page 81

FINANCIAL AID AWARDS—AY 2016 - AY 2017
Annual Amount Disbursed to Financial Aid Enrolled Students by Major
AY 2 0 1 6 A Y 2 0 1 7
Logistics
$1,359,067$1,586,083
AY 2 0 1 6 A Y 2 0 1 7
MANUFACTURINGManufacturing
$599,323$501,411
AY 2 0 1 6 A Y 2 0 1 7
Material Science
$1,931,487 $2,074,061
AY 2 0 1 6 A Y 2 0 1 7
MATHEMATICSMathematics
$87,394 $102,266
AY 2 0 1 6 A Y 2 0 1 7
Media Arts & Technology
$3,395,131$4,122,381
$2,845,623 $2,689,001
A Y 2 0 1 6 A Y 2 0 1 7
PUBLIC SAFETYPublic Safety$32,845,623 $32,689,001
AY 2 0 1 6 A Y 2 0 1 7
Social & Behavioral Sciences
$74,093
$326,886
AY 2 0 1 6 A Y 2 0 1 7
Visual & Performing Arts
$199,897
$586,721
AY 2 0 1 6 A Y 2 0 1 7
Houston Community College$174,044,960 $171,800,228
Houston Community College ‐‐ 2017‐2018 | Fact Book Page 82

GLOSSARY OF TERMS
Awards: It includes Associate Degrees, Certificates, Completion of Core Curriculum (Core), and Occupational Skills Award (OSA).
Occupational Skills Award (OSA): previously know as Marketable Skills Achievement (MSA).
Career Type: Organizational structure of student data based on type of program enrolled.Semester Credit Hour (SCH): A unit of measure representing an hour (50 minutes) of instruction over a 15‐week period in a semester.
Adult HS ABE/ESL/GED:
DataContact Hour: A unit of measure that represents an hour of scheduled instruction given to a student.
Duplicated: It include seat count
Unduplicated Headcount: The sum of students enrolled with each student counted only once during the reporting period, regardless of when the student enrolled.Door count: Consists of the actual counts of people entering the libraries as recorded by HCC security gates. The count is divided by 2 since the gates also count exits.
Completion of Core Curriculum (Core): A student may be reported as a core curriculum completer if the institution certifies that the student has satisfactorily completed all required elements and courses in the institution's approved core curriculum (including any hours transferred from other institutions). Core curriculum completers must have completed courses totaling at least the number of semester credit hours in the institution’s approved core curriculum (range: 42‐48 semester credit hours).
General Educational Development (GED): Provides an opportunity to earn a high school credential. The GED program, sponsored by the American Council on Education, enables individuals to demonstrate that they have acquired a level of learning comparable to that of high school graduates.
Funded Continuing Education Unit (CEU): One continuing education unit (CEU) is 10 contact hours of participation in an organized continuing educational experience under responsible sponsorship, capable direction, and qualified instruction and funded by the State of Texas.
Non‐Funded Continuing Education Unit (NCR): One continuing education unit (NCR) is 10 contact hours of participation in an organized continuing educational experience under responsible sponsorship, capable direction, and qualified instruction and not funded by the State of Texas.
Adult Basic Education (ABE): Courses designed primarily for students 16 years of age and older to improve basic skills in reading, writing, and arithmetic. These courses are not intended to be part of a program leading to a high school credential, nor are they part of any academic, occupational, or vocational program at the postsecondary level.
Adult High School (AHS): A high school program designed for adult education. It is intended for adults who have not completed high school to continue their education.
Houston Community College ‐‐ 2017‐2018 | Fact Book Page 83

GLOSSARY OF TERMS
Finance
Tuition Residency:In‐District: A student paying the tuition charged by HCC to those students residing in taxing district.
Out‐District: A student paying the tuition charged by HCC to those students residing in out‐side the taxing district.
Out‐of‐State ‐ Non US Resident: A student who is residing in United States on a temporary non‐immigrant visa and pays out‐of‐state tuition.
Organizations
Student
Full‐Time Student Equivalent (FTSE): A single value providing a meaningful combination of full‐time and part‐time students.
Full‐Time Student: A student enrolled for 12 or more semester credits hours in a semester.
SEVP, the Student and Exchange Visitor Program is part of U.S. Immigration and Customs Enforcement (ICE) within the U.S. Department of Homeland Security (DHS). SEVP manages the Student and Exchange Visitor Information System (SEVIS), the web‐based system DHS uses to maintain and manage information on nonimmigrants whose primary purpose for coming to the United States is to study.
Emsi: A private company providing labor‐market information based on government data sources, job postings and other related sources. All Occupations in Houston‐The Woodlands‐Sugar Land, TX ‐‐ MSA — The Area is Houston’s MSA, which encompasses nine counties in Texas: Harris, Fort Bend, Montgomery, Brazoria, Galveston, Liberty, Waller, Chambers and Austin.
Dual Credit: A program through which high school students are enrolled in college level courses, taught at their high school that fulfill both high school graduation requirements and earn the student college credits .
Maintenance and Operations (M&O) Tax Rate: The tax rate levied by districts to fund the operations and maintenance of schools, including maintenance tax notes, and contracts to finance movable equipment.
Texas Higher Education Coordinating Board (THECB): The policies and procedures which regulate the operation of public higher education institutions within the state of Texas.
Integrated Postsecondary Education Data System (IPEDS): The Integrated Postsecondary Education Data System (IPEDS), established as the core postsecondary education data collection program for U.S. Department of Education's National Center For Education Statistics (NCES).
Out‐of‐State ‐ US Resident: A student who is not a legal resident of the State of Texas in which he/she attends school and pays out‐of‐state tuition.
Houston Community College ‐‐ 2017‐2018 | Fact Book Page 84

GLOSSARY OF TERMS
Student (Continue)
F1 ‐ Students: An F1 visa is issued to international students who are attending an academic program or English Language Program at HCC.
Other Student Visas: Includes F2, F3, IF, J1A, J1P, J2, and Vocational Student visa.
Work Authorization Visas: Includes EAD, H1, H1B, H1C, H2A, H2B, H3, H4, IO, L1, L1A, L1B, and L2 visa.
Minority Students: African American and Hispanic students.
Part‐Time Student: A student enrolled for 11 or less semester credits hours in a semester.
International Student: International denotes a person who is not a citizen or permanent resident of the United States and who is in the USA on a temporary basis and does not have the right to remain indefinitely.
New Student: A student attending HCC for the first time, in the fall term. This includes students enrolled in academic or occupational programs.
Houston Community College ‐‐ 2017‐2018 | Fact Book Page 85

Chancellor: Dr. Cesar Maldonado
HOUSTON COMMUNITY COLLEGE3100 Main StreetHouston TX, 77002
www.hccs.edu/
Office of Institutional Research
HCC is committed to a workplace and educational environment free of discrimination and harassment based upon race, color, religion, age, sex, gender
expression, gender identity, national origin, disability, veteran status, or sexual orientation.
Raymond Golitko, Research Associate IIGlenda Barrett, Research Technician
HCC Board of Trustees: Zeph Capo, Secretary, District I Dave Wilson, District II Dr. Adriana Tamez, District III Dr. Carolyn Evans‐Shabazz, Chair, District IV Robert Glaser, District V Dr. John P. Hansen, District VI Neeta Sane, District VII Eva L. Loredo, District VIII Dr. Pretta VanDible Stallworth, Vice Chair, District IX
Dr. Martha Oburn, Executive Director of Institutional Research and Innovation
www.hccs.edu/oir
Hazel Milan, Sr. Research AnalystNishantha Gajanayake, Research Analyst II
Ali Tipu, Research Associate I
Published January 1, 2018
Mario Heredia, Director of Research Support Services
Carla Fearnley, Office Manager
Dr. Kurt Ewen, VC Planning Institutional Research