Embed Size (px)
Citation preview

Fact Book2016
NATIONAL STOCK EXCHANGE OF INDIA LIMITED

Fact Book
Copyright © 2016 by National Stock Exchange of India Ltd. (NSE) Exchange Plaza, Bandra Kurla ComplexBandra (East), Mumbai 400 051 INDIA
All rights reserved. No part of this publication may be produced, stored in a retrieval system or transmitted in any form by any means, electronic, mechanical, photocopying, recording or otherwise without the written permission of NSE, except as stated below. Single photocopies of single chapters may be made for private study or research provided that the source is acknowledged and NSE is notified.
NSE does not guarantee the accuracy of the data included in this publication and accepts no responsibility whatsoever for any consequence of their use.

i
C O N T E N T S
1. National Stock Exchange of India ltd
1-1 Trading Value of different market segments .................................................................... 3
1-2 Market Capitalisation of different market segments ........................................................... 3
1-3 Records reached in different market segments (data from inception to March 31, 2016) ............... 3
1-4 Board of Directors of NSEIL ......................................................................................... 4
2. Membership
2-1 Eligibility criteria for membership ................................................................................ 7
2-2 Growth and distribution of members ............................................................................ 11
3. Listing of Securities
3-1 Listing criteria for companies on the CM segment of NSE .................................................... 15
3-2 Listing fees in the CM segment ................................................................................... 16
3-3 Companies listed, Permitted to trade, Available for trading on the CM segment ........................ 16
3-4 Shareholding pattern at the end of March 2016 for the companies listed at NSE ........................ 17
3-5 Pledged shares data as of March 2016 ........................................................................... 18
3-6 Eligibility criteria for securities on Debt segment ............................................................. 18
3-7 Securities available for trading on Debt Segment ............................................................. 20
3-8 Funds mobilisation on the Exchange ............................................................................. 21
3-9 Initial Public Offerings (IPOs) of Equity Shares during 2015-16 .............................................. 21
3-10 Resource mobilisation through public issue of NCDs during 2015-16 ....................................... 22
3-11 Rights Issues during 2015-16 ...................................................................................... 23
3-12 Preferential allotments by NSE listed companies during 2015-16 ........................................... 23
3-13 Amount raised through QIP during 2015-16 ..................................................................... 29
3-14 Companies Delisted during 2015-16 .............................................................................. 30
4. Capital Market Segment
4-1 Business growth of CM segment .................................................................................. 33
4-2 Frequency distribution of companies traded ................................................................... 34
4-3 Trading frequency of companies in Cash Segment during 2015-16 .......................................... 34
4-4 Advances/Declines in Cash Segment of NSE during 2015-16 (No. of Securities) .......................... 35
4-5 City-wise Turnover in the CM segment........................................................................... 35
Contd...
ii
4-6 Internet Trading Value in the CM Segment in comparison with total trading volumes at NSE .......... 36
4-7 Name of Asset Management Companies listed on NSE as of March 2016 ................................... 36
4-8 NSE CM transaction charges ....................................................................................... 37
4-9 The existing rates of Securities Transaction Tax (STT) for CM segment .................................... 38
4-10 Percentage Share of Top 'N' Securities / Member in Turnover ................................................ 38
4-11 '50' Most Active Securities during 2015-16 in Terms of Trading Value ...................................... 39
4-12 Top '50' Companies by Market Capitalisation as on March 31, 2016 ......................................... 40
4-13 NSE's 10 Most Active Trading days during the year 2015-16 .................................................. 42
4-14 Individual Securities Single day Trading Records 2015-16 .................................................... 42
4-15 Composition of Nifty 50 Index as on March 31,2016 ........................................................... 43
4-16 Composition of Nifty Next 50 Index as on March 31,2016 .................................................... 45
4-17 Industry-wise Weightages of NIFTY 50 Securities as on 31st March,2016 .................................. 47
4-18 NIFTY 50 Index ...................................................................................................... 47
4-19 NIFTY Next 50 Index ................................................................................................ 48
4-20 Performance of NSE Indices during the year 2015-16 ......................................................... 49
4-21 Mutual Funds/ ETFs: No of Trades and Trading Value ......................................................... 49
4-22 Settlement Statistics for CM Segment ........................................................................... 50
5. Debt Market Segment
5-1 Business Growth of Debt Segment................................................................................ 53
5-2 Security -wise distribution of Debt Trades ...................................................................... 54
5-3 Participant wise distribution of Debt Turnover ................................................................. 55
5-4 Share of Top 'N' Securities/ Trading Members/Participants in Turnover in Debt Segment ............... 56
5-5 Market Capitalisation of Debt Securities ........................................................................ 57
5-6 FIMMDA NSE MIBID/ MIBOR Rates 2015-16 ....................................................................... 58
5-7 1-day Value-at Risk (99%) for Government of India Securities Traded as on June 30, 2015 ............. 60
5-8 Corporate Bond Trades at NSE (2015-16) ........................................................................ 60
6. Equity Futures & Option Segment
6-1 Business Growth of Futures & Options Market Segment ...................................................... 65
6-2 Benchmark Indices Contracts & Trading Volume in F&O Segment of NSE (2015-16) ...................... 67
6-3 Internet Trading in the F&O Segment of the Exchange ....................................................... 67
Contd...
Contd...

iii
6-4 Records achieved in the F&O Segment :2015-16 ............................................................... 67
6-5 Participant Wise Trading Value in the F&O Segment (2015-16) .............................................. 68
6-6 Number of members in different turnover brackets in Futures and Option Segment .................... 68
6-7 Number of members in different turnover brackets in Futures and Options Segment. .................. 69
6-8 Segment wise contribution of Top 'N' Members to turnover on Futures and Options Segment .......... 70
6-9 Top 20 Future contracts according to number of contracts in 2015-16 .................................... 70
6-10 Top 20 Option contracts according to number of contracts traded in 2015-16 ........................... 71
6-11 Number of trades in the Futures & Options Segment ......................................................... 72
6-12 Settlement Statistics in F&O Segment ........................................................................... 72
7. Currency Derivatives Segments
7-1 Business Growth of Currency Derivatives Segment at NSE ................................................... 75
7-2 Records achieved in the Currency Futures & Options ......................................................... 75
7-3 Top 5 Currency Futures & Options Contracts on the basis of turnover for the FY 2015-16 .............. 76
7-4 Settlement Statistics of Currency Derivatives Segments at NSE ............................................. 76
7-5 Business Growth of Interest Rates Futures ...................................................................... 77
7-6 Records Achieved in the Interest Rates Futures ................................................................ 77
7-7 Top 5 IRD Contracts on the basis of Turnover for the FY 2015-16 ........................................... 78
7-8 Settlement Statistics in Interest Rate Futures Segments at NSE ............................................ 78
8. Investor Services, Arbitration
8-1 Receipt and Disposal of Investor’s Grievance ................................................................... 81
8-2 Status Report of Arbitration Matters ............................................................................. 81
Contd...

iv
National Stock Exchange of India 1

2

3
1National Stock Exchange of India
Table 1-1: Trading Value of different market segments
(` Crores)
Segment/Year 2011-12 2012-13 2013-14 2014-15 2015-16
Capital Market 2,810,893 2,708,279 2,808,488 4,329,655 4,236,983
Equity Futures & Options 31,349,732 31,533,004 38,211,408 55,606,453 64,825,834
Wholesale Debt Market 633,179 792,214 851,434 772,369 569,495
Currency F&O * 4,674,990 5,274,465 4,012,513 3,023,908 4,501,886
Interest Rate Futures ** 3,959 0.22 30,173 421,558 526,425
Total 39,472,753 40,307,962 45,914,017 64,153,943 74,660,622
Note: *Trading in Currency Futures commenced on August 28, 2008
** Trading in Interest Rate Futures were Relaunch on January 21,2010
Table 1-2: Market Capitalisation of different market segments
(` Crores)
Segment/Year Mar-11 Mar-12 Mar-13 Mar-14 Mar-15 Mar-16
CM 6,702,616 6,096,518 6,239,035 7,277,720 9,930,122 9,310,471
WDM 3,594,877 4,272,736 4,928,332 5,128,733 5,739,273 5,965,056
Total 10,297,493 10,369,254 11,167,366 12,406,453 15,669,395 15,275,528
Table 1-3: Records reached in different market segments (data from inception to March 31, 2016)
Parameter Date Magnitude
Capital Market Segment
Record Number of trades 25-Aug-2015 12,189,508
Traded Quantity (in lakhs) 26-May-2014 21,060
Turnover (` Crores) 29-May-2015 43,621
Market Capitalisation (` Crores) 13-Apr-2015 10,420,430
Contd...

4
Parameter Date Magnitude
Futures & Options Segment
No. of trades 24-Aug-2015 7,738,349
Number of contracts traded 30-Apr-2015 27,205,109
Turnover (` Crores) 31-Mar-2016 648,506
Currency Derivatives Segment
No. of trades 20-Jun-2013 390,049
Number of contracts traded 20-Jun-2013 11,534,563
Turnover (` Crores) 20-Jun-2013 69,324
Wholesale Debt Market Segment
No. of trades 25-Aug-2003 2,074
Turnover(` Crores) 25-Aug-2003 13,912
Table 1-4: Board of Directors of NSEIL
S.No. Name & Company Designation
1 Mr. Ashok Chawla Formal Union Finance Secretary Government of India
Chairman [Public Interest Director]
2 Mr. Ravi NarainFormer Managing Director & CEONational Stock Exchange of India Limited
Vice Chairman [Shareholder Director]
3 Ms. Chitra RamkrishnaNational Stock Exchange of India Limited
Managing Director & CEO
4 Mr. Abhay HavaldarManaging Director - General Atlantic LLC
Shareholder Director
5 Mr. Prakash ParthasarathyChief Investment OfficerAzim Premji Investment Private Limited
Shareholder Director
6 Ms. Dharmishta RavalAdvocate & Former Executive DirectorSEBI
Public Interest Director
7 Mr. Justice B.N. Srikrishna (Retd.) Former Judge, Supreme Court of India
Public Interest Director
Contd...

Membership 2

6

7
2
Cont
d...
MembershipTa
ble
2-1:
Eli
gibi
lity
cri
teri
a fo
r m
embe
rshi
p
CORP
ORA
TES
/ LL
P(A
mou
nt in
` la
kh)
Part
icul
ars/
Seg
men
tsCM
CM
and
F&
OD
EBT
CM a
nd D
ebt
CM,
Deb
t an
d F&
OM
inim
um P
aid-
up c
apit
al30
3030
3030
Net
Wor
th
100
100
(Mem
bers
hip
in C
M
segm
ent
and
Trad
ing/
Trad
ing
and
self
cl
eari
ng m
embe
rshi
p in
F&
O s
egm
ent)
300
(Mem
bers
hip
in C
M
segm
ent
and
Trad
ing
and
Clea
ring
mem
bers
hip
in
F&O
seg
men
t)
50 (
Mem
bers
hip
as
Trad
ing
Mem
ber)
100
(Mem
bers
hip
as T
radi
ng a
nd s
elf
clea
ring
mem
bers
hip)
300
(Mem
bers
hip
as
Trad
ing
and
clea
ring
m
embe
rshi
p)
100
(Mem
bers
hip
in C
M
segm
ent
and
Trad
ing/
Trad
ing
and
self
cl
eari
ng m
embe
rshi
p in
Deb
t se
gmen
t)
300
(Mem
bers
hip
in C
M
segm
ent
and
Trad
ing
and
Clea
ring
mem
bers
hip
in D
ebt
segm
ent)
100
(Mem
bers
hip
in D
ebt
segm
ent,
CM
seg
men
t an
d Tr
adin
g/Tr
adin
g an
d Se
lf C
lear
ing
mem
bers
hip
in F
&O
seg
men
t)
300(
Mem
bers
hip
in D
ebt
segm
ent,
CM
seg
men
t an
d Tr
adin
g an
d Cl
eari
ng m
embe
rshi
p in
F&
O
segm
ent)
Inte
rest
Fr
ee
Secu
rity
De
posi
t (I
FSD)
wit
h N
SEIL
8511
0BM
C*85
(BM
C re
quir
emen
t to
be
met
)11
0(B
MC
requ
irem
ent
to b
e m
et)
Inte
rest
Fr
ee
Secu
rity
De
posi
t (I
FSD)
wit
h N
SCCL
1515
*10
1515
*
Colla
tera
l Se
curi
ty D
epos
it
(CSD
) w
ith
NSC
CL25
25**
NIL
2525
**
Annu
al S
ubsc
ript
ion
11
NIL
11
Adva
nce
Min
imum
Tr
ansa
ctio
n Ch
arge
s fo
r Fu
ture
s Se
gmen
t
NIL
1N
ILN
IL1
Educ
atio
nTw
o di
rect
ors
shou
ld b
e H
SC.
Deal
ers
shou
ld
also
ha
ve
pass
ed
SEBI
ap
prov
ed
cert
ifica
tion
te
st
for
Capi
tal
Mar
ket
- Ca
pita
l M
arke
t M
odul
e of
NCF
M.
Two
dire
ctor
s sh
ould
be
HSC
. De
aler
s sh
ould
als
o ha
ve
pass
ed S
EBI a
ppro
ved
cert
ifica
tion
tes
t fo
r Ca
pita
l Mar
ket
&
Deri
vati
ves.
Two
dire
ctor
s sh
ould
be
HSC
. De
aler
s sh
ould
als
o ha
ve p
asse
d FI
MM
DA-
NSE
Deb
t M
arke
t (B
asic
M
odul
e) o
f N
CFM
.
Two
dire
ctor
s sh
ould
be
HSC
. De
aler
s sh
ould
als
o ha
ve p
asse
d FI
MM
DA-N
SE
Debt
M
arke
t (B
asic
Mod
ule)
of
NCF
M &
SEB
I ap
prov
ed c
erti
ficat
ion
test
for
Ca
pita
l Mar
ket
- Ca
pita
l Mar
ket
Mod
ule
of N
CFM
.
Two
dire
ctor
s sh
ould
be
HSC
. De
aler
s sh
ould
als
o ha
ve p
asse
d FI
MM
DA-N
SE
Debt
M
arke
t (B
asic
M
odul
e) o
f NCF
M a
nd S
EBI a
ppro
ved
cert
ifica
tion
tes
t fo
r Ca
pita
l Mar
ket
& D
eriv
ativ
es.
Expe
rien
ce--
----
----
----
-Tw
o ye
ar's
expe
rien
ce in
sec
urit
ies
mar
ket-
----
----
----
----
----
--O
ther
elig
ibili
ty c
rite
ria
The
appl
ican
t m
ust
be e
ngag
ed s
olel
y in
the
bus
ines
s of
sec
urit
ies
and
mus
t no
t be
eng
aged
in
any
fund
-bas
ed a
ctiv
ity.
The
Dir
ecto
rs/
Shar
ehol
ders
of
the
appl
ican
t co
mpa
ny s
houl
d no
t be
def
ault
ers
on a
ny s
tock
exc
hang
e an
d sh
ould
not
be
deba
rred
by
SEBI
for
bei
ng
asso
ciat
ed w
ith
capi
tal m
arke
t as
inte
rmed
iari
es.
Not
e: N
et w
orth
req
uire
men
t fo
r Pr
ofes
sion
al C
lear
ing
mem
bers
in
F&O
seg
men
t is
` 3
00 l
akhs
. Fu
rthe
r a
Prof
essi
onal
Cle
arin
g m
embe
r ne
eds
to b
ring
Inte
rest
Fre
e Se
curi
ty D
epos
it
(IFS
D)
of `
25
lakh
s w
ith
NSC
CL a
nd C
olla
tera
l Se
curi
ty D
epos
it (
CSD
) of
`
25 l
akhs
w
ith
NSC
CL a
s de
posi
ts.
*A
ddit
iona
l In
tere
st F
ree
Secu
rity
Dep
osit
(IF
SD)
of `
25
lakh
s w
ith
NSC
CL is
req
uire
d fo
r Tr
adin
g an
d Cl
eari
ng M
embe
r (T
M-C
M)
and
for
Trad
ing
and
Self
cle
arin
g M
embe
r (T
M/S
CM).
**
Add
itio
nal
Coll
ater
al S
ecur
ity
Dep
osit
(CS
D)
of
` 25
lak
hs w
ith
NSC
CL i
s re
quir
ed f
or T
radi
ng a
nd C
lear
ing
Mem
ber
(TM
-CM
) an
d fo
r Tr
adin
g an
d Se
lf c
lear
ing
Mem
ber
(TM
/SC
M).
In
add
itio
n, a
mem
ber
clea
ring
for
oth
ers
is r
equi
red
to b
ring
in
IFSD
of
` 2
lakh
and
CSD
of
` 8
lakh
per
tra
ding
mem
ber
he u
nder
take
s to
cle
ar i
n th
e F&
O s
egm
ent.

8
Cont
d...
IND
IVID
UA
LS/P
ART
NER
SHIP
FIR
MS
(Am
ount
in `
lakh
)
Part
icul
ars
CM
CM a
nd F
&O
D
ebt
CM a
nd D
ebt
CM,
Deb
t an
d F&
ON
et W
orth
75
75 (
Mem
bers
hip
in C
M
segm
ent
and
Trad
ing
mem
bers
hip
in F
&O
se
gmen
t)
100
(Mem
bers
hip
in C
M
segm
ent
and
Trad
ing
and
Self
cle
arin
g m
embe
rshi
p in
F&
O
segm
ent)
300
(Mem
bers
hip
in C
M s
egm
ent
and
Tr
adin
g an
d Cl
eari
ng
mem
bers
hip
in F
&O
se
gmen
t)
50 (
Mem
bers
hip
as T
radi
ng
Mem
ber)
100
(Mem
bers
hip
as
Trad
ing
and
self
cle
arin
g m
embe
rshi
p)
300
(Mem
bers
hip
as T
radi
ng
and
clea
ring
mem
bers
hip)
75 (
Mem
bers
hip
in C
M
segm
ent
and
Trad
ing
mem
bers
hip
in D
ebt
segm
ent)
100
(Mem
bers
hip
in C
M
segm
ent
and
Trad
ing
and
Self
cl
eari
ng m
embe
rshi
p in
Deb
t se
gmen
t)
300
(Mem
bers
hip
in C
M
segm
ent
and
Tra
ding
and
Cl
eari
ng m
embe
rshi
p in
Deb
t se
gmen
t)
100
(Mem
bers
hip
in D
ebt
segm
ent,
CM
seg
men
t an
d Tr
adin
g/Tr
adin
g an
d Se
lf
Clea
ring
mem
bers
hip
in F
&O
se
gmen
t)
300
(Mem
bers
hip
in D
ebt
segm
ent,
CM s
egm
ent
and
Trad
ing
and
clea
ring
m
embe
rshi
p in
F&
O s
egm
ent)
Inte
rest
Fre
e Se
curi
ty
Dep
osit
(IF
SD)
wit
h N
SEIL
26.5
51.5
BMC*
26.5
(BM
C re
quir
emen
t to
be
met
)51
.5(B
MC
requ
irem
ent
to b
e m
et)
Inte
rest
Fre
e Se
curi
ty
Dep
osit
(IF
SD)
wit
h N
SCCL
66
*10
66*
Colla
tera
l Sec
urit
y D
epos
it (
CSD
) w
ith
NSC
CL
17.5
17.5
**
NIL
17.5
17.5
**
Annu
al S
ubsc
ript
ion
0.5
0.5
NIL
0.5
0.5
Adva
nce
Min
imum
Tr
ansa
ctio
n Ch
arge
s fo
r Fu
ture
s Se
gmen
t
NIL
1N
ILN
IL1
Educ
atio
nPr
opri
etor
/ T
wo
Part
ners
sh
ould
be
HSC
. D
eale
rs s
houl
d al
so h
ave
pass
ed S
EBI a
ppro
ved
cert
ifica
tion
tes
t fo
r Ca
pita
l Mar
ket
- C
apit
al
Mar
ket
Mod
ule
of N
CFM
.
Prop
riet
or /
Tw
o Pa
rtne
rs s
houl
d be
HSC
.D
eale
rs s
houl
d al
so
have
pas
sed
SEBI
ap
prov
ed c
erti
ficat
ion
test
for
Cap
ital
Mar
ket
&
Der
ivat
ives
.
Prop
riet
or /
Tw
o Pa
rtne
rs
shou
ld b
e H
SC.
Dea
lers
sho
uld
also
hav
e pa
ssed
FIM
MD
A-N
SE D
ebt
Mar
ket
(Bas
ic M
odul
e) o
f N
CFM
.
Prop
riet
or /
Tw
o Pa
rtne
rs
shou
ld b
e H
SC.
Dea
lers
sho
uld
also
hav
e pa
ssed
FI
MM
DA-
NSE
Deb
t M
arke
t (B
asic
Mod
ule)
of
NCF
M &
SEB
I ap
prov
ed c
erti
ficat
ion
test
fo
r Ca
pita
l Mar
ket-
Cap
ital
M
arke
t M
odul
e of
NCF
M.
Prop
riet
or /
Tw
o Pa
rtne
rs
shou
ld b
e H
SC.
Dea
lers
sho
uld
also
hav
e pa
ssed
FI
MM
DA-
NSE
Deb
t M
arke
t (B
asic
Mod
ule)
of
NCF
M &
SEB
I ap
prov
ed c
erti
ficat
ion
test
for
Ca
pita
l Mar
ket
& D
eriv
ativ
es.

9
Cont
d...
Cont
d... Pa
rtic
ular
sCM
CM
and
F&
O
Deb
tCM
and
Deb
tCM
, D
ebt
and
F&O
Expe
rien
ce--
----
----
----
-Tw
o ye
ar's
expe
rien
ce in
sec
urit
ies
mar
ket-
----
----
----
----
----
--O
ther
elig
ibili
ty c
rite
ria
The
appl
ican
t sh
ould
not
be
enga
ged
in a
ny f
und
base
d ac
tivi
ty.
The
Prop
riet
or/P
artn
ers
shou
ld n
ot b
e de
faul
ters
on
any
stoc
k ex
chan
ge a
nd
shou
ld n
ot b
e de
barr
ed b
y SE
BI f
or b
eing
ass
ocia
ted
wit
h ca
pita
l m
arke
t as
int
erm
edia
ries
Fu
rthe
r, P
artn
ersh
ip fi
rms
shou
ld n
ot b
e en
gage
d in
an
y bu
sine
ss o
ther
tha
n Se
curi
ties
.N
ote:
*Add
itio
nal
Inte
rest
Fre
e Se
curi
ty D
epos
it (
IFSD
) of
` 2
5 la
khs
wit
h N
SCCL
is
requ
ired
for
Tra
ding
and
Cle
arin
g M
embe
r (T
M-C
M)
and
for
Trad
ing
and
Self
cle
arin
g M
embe
r (T
M/S
CM).
**
Add
itio
nal
Coll
ater
al S
ecur
ity
Dep
osit
(CS
D)
of `
25 l
akhs
wit
h N
SCCL
is
requ
ired
for
Tra
ding
and
Cle
arin
g M
embe
r (T
M-C
M)
and
for
Trad
ing
and
Self
cle
arin
g M
embe
r (T
M/S
CM).
In
add
itio
n, a
mem
ber
clea
ring
for
oth
ers
is r
equi
red
to b
ring
in
IFSD
of
` 2
lakh
and
CSD
of
Rs.
8 la
kh p
er t
radi
ng m
embe
r he
und
erta
kes
to c
lear
in
the
F&O
seg
men
t.
CURR
ENCY
DER
IVAT
IVES
- Co
rpor
ates
, LL
Ps,
Indi
vidu
als
and
Firm
s
(Am
ount
in `
lakh
)
Part
icul
ars
NSE
Mem
bers
New
App
lican
ts
Trad
ing
Mem
bers
hip
Trad
ing
Cum
Sel
f
Clea
ring
Mem
bers
hip
Trad
ing
Cum
Cle
arin
g
Mem
bers
hip
Trad
ing
Mem
bers
hip
Trad
ing
cum
Self
Cle
arin
g
Mem
bers
hip
Prof
essi
onal
Cle
arin
g
Mem
bers
hip
Net
wor
th10
050
010
0010
050
010
00
Cash
to
NSE
IL2
22
22
-
Non
-cas
h to
NSE
IL8
88
1318
-
Cash
to
NSC
CL -
2525
-25
25
Non
cas
h to
NSC
CL -
2525
-25
25
Adva
nce
Min
imum
Tran
sact
ion
Char
ges
0.5
0.5
0.5
0.5
0.5
0.5

10
Part
icul
ars
NSE
Mem
bers
New
App
lican
ts
Trad
ing
Mem
bers
hip
Trad
ing
Cum
Sel
f
Clea
ring
Mem
bers
hip
Trad
ing
Cum
Cle
arin
g
Mem
bers
hip
Trad
ing
Mem
bers
hip
Trad
ing
cum
Self
Cle
arin
g
Mem
bers
hip
Prof
essi
onal
Cle
arin
g
Mem
bers
hip
Educ
atio
nPr
opri
etor
/Tw
o Pa
rtne
rs/T
wo
dire
ctor
s sh
ould
be
HSC
.
Prop
riet
or/T
wo
Part
ners
/Tw
o di
rect
ors
shou
ld b
e H
SC.
Prop
riet
or/T
wo
Part
ners
/Tw
o di
rect
ors
shou
ld b
e H
SC.
Prop
riet
or/T
wo
Part
ners
/Tw
o di
rect
ors
shou
ld b
e H
SC.
Prop
riet
or/T
wo
Part
ners
/Tw
o di
rect
ors
shou
ld b
e H
SC.
Prop
riet
or/T
wo
Part
ners
/Tw
o di
rect
ors
shou
ld b
e H
SC.
Dea
lers
sho
uld
also
ha
ve p
asse
d SE
BI
appr
oved
Nat
iona
l In
stit
ute
of S
ecur
itie
s M
arke
ts (
NIS
M)
Seri
es I
– Cu
rren
cy D
eriv
ativ
es
Cert
ifica
tion
Ex
amin
atio
n
Dea
lers
sho
uld
also
ha
ve p
asse
d SE
BI
appr
oved
Nat
iona
l In
stit
ute
of S
ecur
itie
s M
arke
ts (
NIS
M)
Seri
es I
– Cu
rren
cy D
eriv
ativ
es
Cert
ifica
tion
Ex
amin
atio
n
Dea
lers
sho
uld
also
ha
ve p
asse
d SE
BI
appr
oved
Nat
iona
l In
stit
ute
of S
ecur
itie
s M
arke
ts (
NIS
M)
Seri
es I
– Cu
rren
cy D
eriv
ativ
es
Cert
ifica
tion
Ex
amin
atio
n
Dea
lers
sho
uld
also
ha
ve p
asse
d SE
BI
appr
oved
Nat
iona
l In
stit
ute
of S
ecur
itie
s M
arke
ts (
NIS
M)
Seri
es I
– Cu
rren
cy D
eriv
ativ
es
Cert
ifica
tion
Ex
amin
atio
n
Dea
lers
sho
uld
also
ha
ve p
asse
d SE
BI
appr
oved
Nat
iona
l In
stit
ute
of S
ecur
itie
s M
arke
ts (
NIS
M)
Seri
es I
– Cu
rren
cy D
eriv
ativ
es
Cert
ifica
tion
Ex
amin
atio
n
Dea
lers
sho
uld
also
ha
ve p
asse
d SE
BI
appr
oved
Nat
iona
l In
stit
ute
of S
ecur
itie
s M
arke
ts (
NIS
M)
Seri
es I
– Cu
rren
cy D
eriv
ativ
es
Cert
ifica
tion
Ex
amin
atio
n
Expe
rien
ce--
----
----
----
-Tw
o ye
ar's
expe
rien
ce in
sec
urit
ies
mar
ket-
----
----
----
----
----
--
Oth
er e
ligib
ility
cr
iter
iaPr
opri
etor
/Par
tner
s/D
irec
tors
/Sha
reho
ldre
s sh
ould
not
be
defa
ulte
rs o
n an
y st
ock
exch
ange
and
mus
t no
t be
deb
arre
d by
SEB
I for
bei
ng a
ssoc
iate
d w
ith
capi
tal
mar
ket
as in
term
edia
ries
. T
he a
pplic
ant
mus
t be
eng
aged
sol
ely
in t
he b
usin
ess
of s
ecur
itie
s an
d m
ust
not
be e
ngag
ed in
any
fun
d-ba
sed
acti
vity
.*
Not
e: *
In a
ddit
ion
to t
he in
divi
dual
s, c
orpo
rate
s an
d pa
rtne
rshi
p fir
ms,
Ban
ks w
hich
are
aut
hori
zed
by t
he R
eser
ve B
ank
of In
dia
unde
r se
ctio
n 10
of
the
Fore
ign
Exch
ange
Man
agem
ent
Act,
199
9 as
‘A
D C
ateg
ory-
I b
ank’
are
per
mit
ted
to b
ecom
e tr
adin
g an
d cl
eari
ng m
embe
rs o
f th
e cu
rren
cy d
eriv
ativ
es m
arke
t of
the
rec
ogni
zed
stoc
k ex
chan
ges,
on
thei
r ow
n ac
coun
t an
d on
beh
alf
of
thei
r cl
ient
s, s
ubje
ct t
o m
inim
um p
rude
ntia
l re
quir
emen
ts o
f m
inim
um n
et w
orth
of
` 50
0 cr
ores
, m
inim
um C
RAR
of 1
0 pe
r ce
nt,
net
NPA
not
exc
eedi
ng 3
per
cen
t an
d ne
t pr
ofit
shou
ld h
ave
been
mad
e fo
r th
e la
st 3
yea
rs.
Th
e AD
Cat
egor
y-I b
anks
whi
ch f
ulfil
l the
pru
dent
ial
requ
irem
ents
are
req
uire
d to
lay
dow
n de
taile
d gu
idel
ines
wit
h th
e ap
prov
al o
f th
eir
Boar
ds f
or t
radi
ng a
nd c
lear
ing
of c
urre
ncy
deri
vati
ves
cont
ract
s an
d m
anag
emen
t of
ris
ks. A
D C
ateg
ory-
I ban
ks w
hich
do
not
mee
t th
e ab
ove
min
imum
pru
dent
ial r
equi
rem
ents
and
AD
Cat
egor
y- I
bank
s w
hich
are
Urb
an C
o-op
erat
ive
bank
s or
Sta
te
Co-o
pera
tive
ban
ks c
an p
arti
cipa
te in
the
cur
renc
y de
riva
tive
s m
arke
t on
ly a
s cl
ient
s, s
ubje
ct t
o ap
prov
al t
here
fore
fro
m t
he r
espe
ctiv
e re
gula
tory
Dep
artm
ents
of
the
Rese
rve
Bank
.
In
cas
e th
e m
embe
r is
opt
ing
for
mem
bers
hip
of a
ny o
ther
seg
men
t(s)
in c
ombi
nati
on w
ith
the
mem
bers
hip
of C
urre
ncy
Der
ivat
ives
seg
men
t, t
he a
pplic
able
net
wor
th w
ill b
e th
e m
inim
um n
et
wor
th r
equi
red
for
the
othe
r se
gmen
t(s)
or
the
min
imum
net
wor
th r
equi
red
for
Curr
ency
Der
ivat
ives
Seg
men
t, w
hich
ever
is h
ighe
r.
Th
e el
igib
ility
con
diti
on f
or a
pplic
ants
pla
nnin
g to
app
ly f
or n
ew m
embe
rshi
p of
the
Exc
hang
e is
tha
t ei
ther
the
pro
prie
tor/
one
desi
gnat
ed d
irec
tor/
part
ner
or t
he C
ompl
ianc
e O
ffice
r of
the
ap
plic
ant
enti
ty s
houl
d be
suc
cess
fully
cer
tifie
d ei
ther
in S
ecur
itie
s M
arke
t (B
asic
) M
odul
e or
Com
plia
nce
Offi
cers
(Br
oker
s) M
odul
e or
the
rel
evan
t m
odul
e pe
rtai
ning
to
the
segm
ents
whe
rein
m
embe
rshi
p of
the
Exc
hang
e ha
d be
en s
ough
t.
11
Table 2-2: Growth and distribution of members
Month/Year(end of period)
CM Debt CDS CM/F&O/CDS/Debt TOTAL
Apr-15 88 6 54 1,253 1,416
May-15 89 6 55 1,254 1,419
Jun-15 88 6 57 1,252 1,418
Jul-15 87 7 57 1,254 1,419
Aug-15 87 7 57 1,250 1,415
Sep-15 88 7 57 1,247 1,413
Oct-15 88 7 58 1,245 1,412
Nov-15 88 7 59 1,246 1,414
Dec-15 89 7 58 1,247 1,415
Jan-16 88 7 58 1,245 1,412
Feb-16 88 7 57 1,248 1,414
Mar-16 89 7 59 1,247 1,416

12

Listing of Securities 3

14
15
3Listing of Securities
Table 3-1: Listing criteria for companies on the CM segment of NSE
Criteria Initial Public Offerings (IPOs) Companies listed on other exchanges
Paid-up Equity Capital (PUEC)/Market Capitalisation (MC) /Net Worth
PUEC ≥ ` 10 cr. and MC ≥ ` 25 cr. PUEC ≥ ` 10 cr. and MC ≥ ` 50 cr. ORPUEC ≥ ` 25 cr. ORMC ≥ ` 100 cr. ORThe company shall have a net worth of not less than ` 50 crores in each of the preceding three financial year
Company/Promoter's Track Record
Atleast 3 years track record of either(a) the applicant seeking listing OR(b) the promoters / promoting company
incorporated in or outside India OR
(c) Partnership firm and subsequently converted into Company not in existence as a Company for three years) and approaches the Exchange for listing. The Company subsequently formed would be considered for listing only on fulfillment of conditions stipulated by SEBI in this regard.
Atleast three years track record of either(a) the applicant seeking listing;
OR(b) the promoters / promoting company,
incorporated in or outside India.
Dividend Record / Net worth / Distributable Profits
-- Dividend paid in at least 2 out of the last 3 financial years immediately preceding the year in which the application has been made
OR The networth of the applicants atleast ` 50 crores
Listing Listed on any other stock exchange for at least last three years OR listed on the exchange having nationwide trading terminals for at least one year.
Other Requirements
(a) No disciplinary action by other stock exchanges/regulatory authority in past 3 years
(b) Satisfactory redressal mechanism for investor grievances,
(c) distribution of shareholding(d) details of litigation record in past 3 years(e) Track record of Directors of the Company
(a) No disciplinary action by other stock exchanges/regulatory authority in past 3 years
(b) Satisfactory redressal mechanism for investor grievances,
(c) distribution of shareholding and(d) details of llitigation record in past 3 years(e) Track record of Directors of the Company(f) Change in control of a Company/Utilisation
of funds raised from public
Note: 1. (a) In case of IPOs, Paid up Equity Capital means post issue paid up equity capital.
(b) In case of Existing companies listed on other exchanges, the existing paid up equity capital as well as the paid up equity capital after the proposed issue for which listing is sought shall be taken into account.”
2. (a) In case of IPOs, market capitalisation is the product of the issue price and the post-issue number of equity shares.
(b) In case of case of Existing companies listed on other stock exchanges the market capitalisation shall be calculated by using a 12 month moving average of the market capitalisation over a period of six months immediately preceding the date of application. For the purpose of calculating the market capitalisation over a 12 month period, the average of the weekly high and low of the closing prices of the shares as quoted on the National Stock Exchange during the last twelve months and if the shares are not traded on the National Stock Exchange such average price on any of the recognised Stock Exchanges where those shares are frequently traded shall be taken into account while determining market capitalisation after making necessary adjustments for Corporate Action such as Rights / Bonus Issue/Split. “
Contd...
16
3. In case of Existing companies listed on other stock exchanges, the requirement of ` 25 crores market capital shall not be applicable to listing of securities issued by Government Companies, Public Sector Undertakings, Financial Institutions, Nationalised Banks, Statutory Corporations and Banking Companies who are otherwise bound to adhere to all the relevant statutes, guidelines, circulars, clarifications etc. that may be issued by various regulatory authorities from time to time
4. Net worth means paid-up equity capital + reserves excluding revaluation reserve - miscellaneous expenses not written off - negative balance in profit and loss account to the extent not set off.
5. Promoters mean one or more persons with minimum 3 years of experience of each of them in the same line of business and shall be holding at least 20 % of the post issue equity share capital individually or severally.
6. In case a company approaches the Exchange for listing within six months of an IPO, the securities may be considered as eligible for listing if they were otherwise eligible for listing at the time of the IPO. If the company approaches the Exchange for listing after six months of an IPO, the norms for existing listed companies may be applied and market capitalisation be computed based on the period from the IPO to the time of listing.
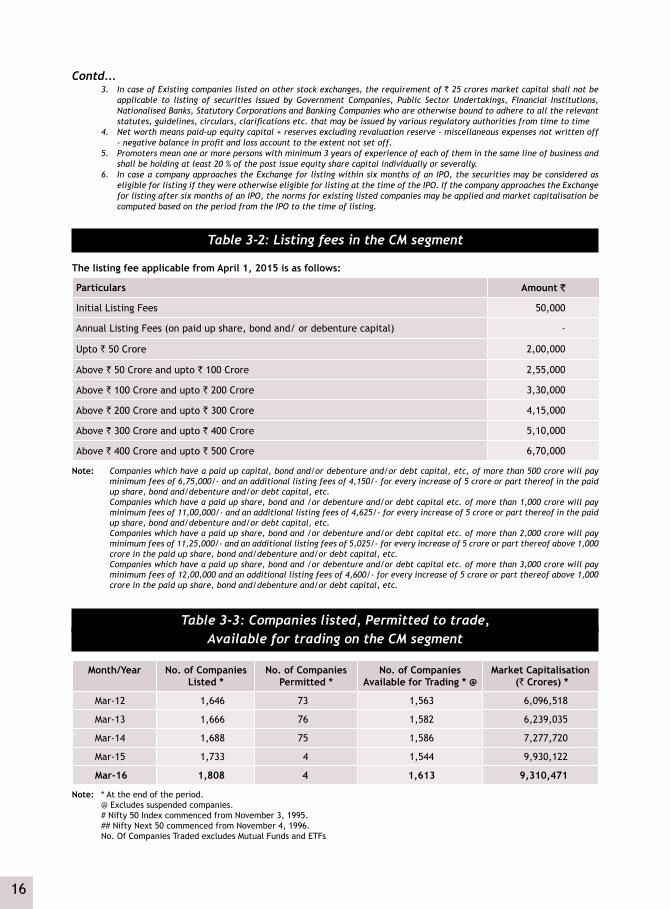
Table 3-2: Listing fees in the CM segment
The listing fee applicable from April 1, 2015 is as follows:
Particulars Amount `
Initial Listing Fees 50,000
Annual Listing Fees (on paid up share, bond and/ or debenture capital) -
Upto ` 50 Crore 2,00,000
Above ` 50 Crore and upto ` 100 Crore 2,55,000
Above ` 100 Crore and upto ` 200 Crore 3,30,000
Above ` 200 Crore and upto ` 300 Crore 4,15,000
Above ` 300 Crore and upto ` 400 Crore 5,10,000
Above ` 400 Crore and upto ` 500 Crore 6,70,000
Note: Companies which have a paid up capital, bond and/or debenture and/or debt capital, etc, of more than 500 crore will pay minimum fees of 6,75,000/- and an additional listing fees of 4,150/- for every increase of 5 crore or part thereof in the paid up share, bond and/debenture and/or debt capital, etc.
Companies which have a paid up share, bond and /or debenture and/or debt capital etc. of more than 1,000 crore will pay minimum fees of 11,00,000/- and an additional listing fees of 4,625/- for every increase of 5 crore or part thereof in the paid up share, bond and/debenture and/or debt capital, etc.
Companies which have a paid up share, bond and /or debenture and/or debt capital etc. of more than 2,000 crore will pay minimum fees of 11,25,000/- and an additional listing fees of 5,025/- for every increase of 5 crore or part thereof above 1,000 crore in the paid up share, bond and/debenture and/or debt capital, etc.
Companies which have a paid up share, bond and /or debenture and/or debt capital etc. of more than 3,000 crore will pay minimum fees of 12,00,000 and an additional listing fees of 4,600/- for every increase of 5 crore or part thereof above 1,000 crore in the paid up share, bond and/debenture and/or debt capital, etc.
Table 3-3: Companies listed, Permitted to trade, Available for trading on the CM segment
Month/Year No. of Companies Listed *
No. of Companies Permitted *
No. of Companies Available for Trading * @
Market Capitalisation (` Crores) *
Mar-12 1,646 73 1,563 6,096,518
Mar-13 1,666 76 1,582 6,239,035
Mar-14 1,688 75 1,586 7,277,720
Mar-15 1,733 4 1,544 9,930,122
Mar-16 1,808 4 1,613 9,310,471
Note: * At the end of the period. @ Excludes suspended companies. # Nifty 50 Index commenced from November 3, 1995. ## Nifty Next 50 commenced from November 4, 1996. No. Of Companies Traded excludes Mutual Funds and ETFs
Contd...
17
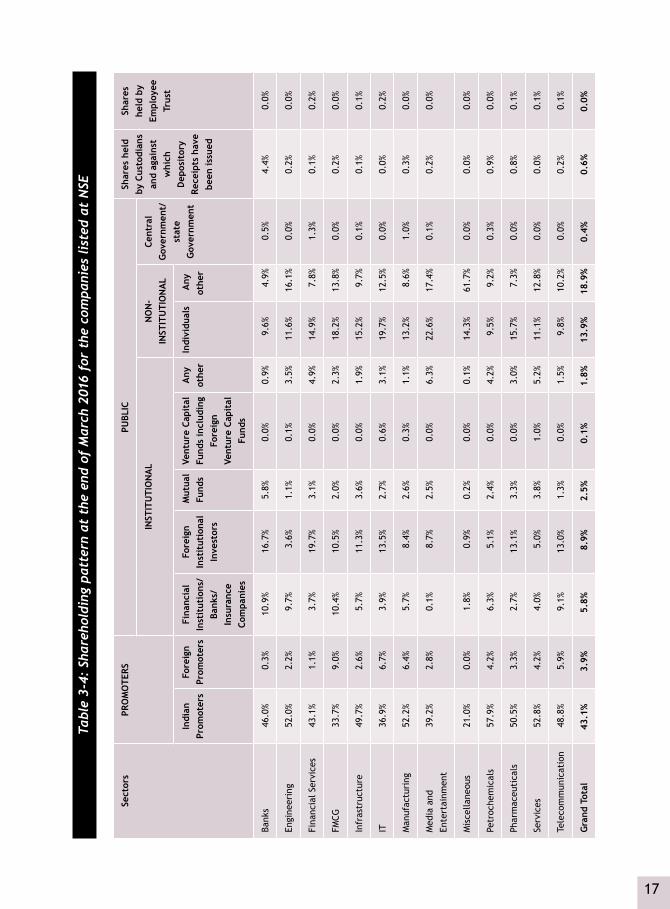
Tabl
e 3-
4: S
hare
hold
ing
patt
ern
at t
he e
nd o
f M
arch
201
6 fo
r th
e co
mpa
nies
list
ed a
t N
SE
Sect
ors
PRO
MO
TERS
PUBL
ICSh
ares
hel
d by
Cus
todi
ans
and
agai
nst
whi
ch
Dep
osit
ory
Rece
ipts
hav
e be
en is
sued
Shar
es
held
by
Empl
oyee
Tr
ust
INST
ITU
TIO
NA
LN
ON
-IN
STIT
UTI
ON
AL
Cent
ral
Gov
ernm
ent/
stat
e G
over
nmen
tIn
dian
Pr
omot
ers
Fore
ign
Prom
oter
sFi
nanc
ial
Inst
itut
ions
/Ba
nks/
Insu
ranc
e Co
mpa
nies
Fore
ign
Inst
itut
iona
l In
vest
ors
Mut
ual
Fund
sVe
ntur
e Ca
pita
l Fu
nds
incl
udin
g Fo
reig
n Ve
ntur
e Ca
pita
l Fu
nds
Any
ot
her
Indi
vidu
als
Any
ot
her
Bank
s46
.0%
0.3%
10.9
%16
.7%
5.8%
0.0%
0.9%
9.6%
4.9%
0.5%
4.4%
0.0%
Engi
neer
ing
52.0
%2.
2%9.
7%3.
6%1.
1%0.
1%3.
5%11
.6%
16.1
%0.
0%0.
2%0.
0%
Fina
ncia
l Ser
vice
s43
.1%
1.1%
3.7%
19.7
%3.
1%0.
0%4.
9%14
.9%
7.8%
1.3%
0.1%
0.2%
FMCG
33.7
%9.
0%10
.4%
10.5
%2.
0%0.
0%2.
3%18
.2%
13.8
%0.
0%0.
2%0.
0%
Infr
astr
uctu
re49
.7%
2.6%
5.7%
11.3
%3.
6%0.
0%1.
9%15
.2%
9.7%
0.1%
0.1%
0.1%
IT36
.9%
6.7%
3.9%
13.5
%2.
7%0.
6%3.
1%19
.7%
12.5
%0.
0%0.
0%0.
2%
Man
ufac
turi
ng52
.2%
6.4%
5.7%
8.4%
2.6%
0.3%
1.1%
13.2
%8.
6%1.
0%0.
3%0.
0%
Med
ia a
nd
Ente
rtai
nmen
t39
.2%
2.8%
0.1%
8.7%
2.5%
0.0%
6.3%
22.6
%17
.4%
0.1%
0.2%
0.0%
Mis
cella
neou
s21
.0%
0.0%
1.8%
0.9%
0.2%
0.0%
0.1%
14.3
%61
.7%
0.0%
0.0%
0.0%
Petr
oche
mic
als
57.9
%4.
2%6.
3%5.
1%2.
4%0.
0%4.
2%9.
5%9.
2%0.
3%0.
9%0.
0%
Phar
mac
euti
cals
50.5
%3.
3%2.
7%13
.1%
3.3%
0.0%
3.0%
15.7
%7.
3%0.
0%0.
8%0.
1%
Serv
ices
52.8
%4.
2%4.
0%5.
0%3.
8%1.
0%5.
2%11
.1%
12.8
%0.
0%0.
0%0.
1%
Tele
com
mun
icat
ion
48.8
%5.
9%9.
1%13
.0%
1.3%
0.0%
1.5%
9.8%
10.2
%0.
0%0.
2%0.
1%
Gra
nd T
otal
43.1
%3.
9%5.
8%8.
9%2.
5%0.
1%1.
8%13
.9%
18.9
%0.
4%0.
6%0.
0%

18
Contd...
Table 3-5: Pledged shares data as of March 2016
Sector Classification Indian Promoters Foreign Promoters Total Promoters Holding
Percentage of promoters'
ownership pledged
Banks 46.0% 0.3% 9.8% 0.0%
Engineering 52.0% 2.2% 5.0% 17.3%
Financial Services 43.1% 1.1% 3.8% 2.3%
FMCG 33.7% 9.0% 6.8% 5.0%
Infrastructure 49.7% 2.6% 8.5% 21.5%
Information Technology 36.9% 6.7% 3.4% 1.1%
Manufacturing 52.2% 6.4% 37.9% 10.4%
Media and Entertainment 39.2% 2.8% 3.2% 7.9%
Miscellaneous 21.0% 0.0% 7.8% 0.4%
Petrochemicals 57.9% 4.2% 3.5% 1.4%
Pharmaceuticals 50.5% 3.3% 2.9% 2.9%
Services 52.8% 4.2% 2.8% 13.5%
Telecommunication 48.8% 5.9% 4.6% 8.4%
Total 43.1% 3.9% 47.0% 7.2%
Table 3-6: Eligibility criteria for securities on Debt segment
The security proposed for listing on the Debt segment of NSE should comply with the requirements as indicated hereunder:
Issuer Eligibility Criteria for listing
Public Issue /Private Placement
Non-Structured Product/Non-Market Linked Debentures
Structured Product/Market Linked Debentures
Corporates (Public limited companies and Private limited companies)
• Paid-up capital of ` 10 crores;or
Market capitalisation of ` 25 crores (In case of unlisted companies Networth more than ` 25 crores)
• Credit rating
• Networth of ` 100 crores• Credit Rating prefix of ‘PP-MLD’ denoting
Principal protected market linked debentures followed by the standardized rating symbols
Public Sector Undertaking, Statutory Corporation established/ constituted under Special Act of Parliament /State Legislature, Local bodies/authorities,
• Credit rating• Qualifies for listing under the
respective Acts, Rules or Regulations under which the securities are issued.
• Networth of ` 100 crores• Credit Rating prefix of ‘PP-MLD’ denoting
Principal protected market linked debentures followed by the standardized rating symbols
• Qualifies for listing under the respective Acts, Rules or Regulations under which the securities are issued.

19
Issuer Eligibility Criteria for listing
Public Issue /Private Placement
Non-Structured Product/Non-Market Linked Debentures
Structured Product/Market Linked Debentures
Mutual Funds: Units of any
SEBI registered Mutual Fund/
scheme : Investment objective
to invest predominantly in
debt or Scheme is traded in
secondary market as debt
instrument
Qualifies for listing under the
respective Acts, Rules or Regulations
under which the securities are issued.
• Networth of ` 100 crores
• Credit Rating prefix of ‘PP-MLD’ denoting
Principal protected market linked
debentures followed by the standardized
rating symbols
• Qualifies for listing under the respective
Acts, Rules or Regulations under which
the securities are issued.
Infrastructure companies : Tax
exemption and recognition as
infrastructure company under
related statutes/regulations
• Credit rating
• Qualifies for listing under the
respective Acts, Rules or Regulations
under which the securities are
issued.
• Networth of ` 100 crores
• Credit Rating prefix of ‘PP-MLD’ denoting
Principal protected market linked
debentures followed by the standardized
rating symbols
• Qualifies for listing under the respective
Acts, Rules or Regulations under which
the securities are issued.
Financial Institutions u/s.
4A of Companies Act,
1956 including Industrial
Development Corporations
• Qualifies for listing under the
respective Acts, Rules or Regulations
under which the securities are
issued.
• Credit rating
• Networth of ` 100 crores
• Credit Rating prefix of ‘PP-MLD’ denoting
Principal protected market linked
debentures followed by the standardized
rating symbols
• Qualifies for listing under the respective
Acts, Rules or Regulations under which
the securities are issued.
Banks Scheduled banks
• Networth of `50 crores or above
• Qualifies for listing under the
respective Acts, Rules or Regulations
under which the securities are issued
Scheduled banks
• Networth of ` 100 crores
• Credit Rating prefix of ‘PP-MLD’ denoting
Principal protected market linked
debentures followed by the standardized
rating symbols
• Qualifies for listing under the respective
Acts, Rules or Regulations under which
the securities are issued.
Note: An Issuer shall ensure compliance with SEBI circulars/guidelines and any other law, guidelines/directions of Central Government, other Statutory or local authority issued on regulating the listing of debt instruments from time to time
Contd...

20
Tabl
e 3-
7: S
ecur
itie
s av
aila
ble
for
trad
ing
on D
ebt
Segm
ent
(as
on M
arch
31)
Secu
riti
es20
1220
1320
1420
1520
16
Num
ber
Am
ount
Am
ount
Num
ber
Am
ount
Am
ount
Num
ber
Am
ount
Am
ount
Num
ber
Am
ount
Am
ount
Num
ber
Am
ount
Am
ount
(` C
rore
s)(U
S $
mn)
(` C
rore
s)(U
S $
mn)
(` C
rore
s)(U
S $
mn)
(` C
rore
s)(U
S $
mn)
(` C
rore
s)(U
S $
mn)
Gov
ernm
ent
Secu
riti
es
1,54
83,
303,
037
645,
673
1,61
83,
682,
242
677,
016
1,75
33,
882,
320
649,
674
1,89
24,
124,
905
659,
027
2,04
44,
241,
335
639,
401
T-B
ills
5226
6,68
452
,131
5230
1,05
155
,351
5233
8,67
556
,674
5236
3,70
458
,108
4934
8,71
452
,570
PSU
Bon
ds97
124
6,64
548
,214
1,05
230
4,84
656
,049
1,00
636
1,74
260
,534
1,09
244
2,06
570
,628
1,10
948
9,07
773
,731
Inst
itut
iona
l
Bond
s
443
146,
589
28,6
5553
917
3,10
531
,827
497
156,
928
26,2
6147
315
8,11
725
,262
214
104,
605
15,7
70
Bank
Bon
ds50
918
9,28
937
,002
495
209,
413
38,5
0346
721
3,00
635
,645
466
241,
694
38,6
1556
329
8,08
644
,938
Corp
orat
e
Bond
s
1,60
520
1,45
939
,381
1,94
825
9,73
447
,755
2,04
328
6,96
948
,022
2,53
835
8,19
857
,229
3,07
543
2,87
565
,258
Oth
ers
203,
517.
868
820
3,51
7.8
647
193,
008.
8350
433
4,05
564
835
4,49
367
7
Tota
l5,
148
4,35
7,22
185
1,74
35,
724
4,93
3,91
090
7,14
75,
837
5,24
2,64
987
7,31
36,
546
5,69
2,73
890
9,51
77,
089
5,91
9,18
589
2,34
5

21
Table 3-8: Funds mobilisation on the Exchange
Particulars 2013-14 2014-15 2015-16
No. of Issues
Amount Amount No. of Issues
Amount Amount No. of Issues
Amount Amount
` Crores US $ bn ` Crores US $ bn ` Crores US $ bn
Equity Public Issues
IPOs 5 1,230 0.21 8 1,462 0.23 32 15,432 2.33
FPOs 1 6,959 1.16 0 - 0 -
IDR issue - - -- -
Rights Issues 10 2,968 0.50 15 7,329 1.17 8 10,497 1.58
QIP* 17 13,663 2.29 40 28,014 4.48 18 13,976 2.11
Preferential Allotment 189 53,523 8.96 197 19,456 3.11 208 48,756 7.35
Non-Convertible Debentures
Public Issue 22 24,371 4.08 22 6,546 1.05 33 21,392 3.22
Total 244 102,713 17.19 282 62,807 10.03 299 110,053 16.59
Note: *Amount includes amount raised by Housing Development Finance Corporation Limited from Conversion of warrants issued on QIP basis
Table 3-9: Initial Public Offerings (IPOs) of Equity Shares during 2015-16
Sr. No. Company Name Issue Size (` Crores)
Issue Price(`)
Date of Listing
1 Adlabs Entertainment Limited* 365.87 180.00 6-Apr-2015
2 Inox Wind Limited* 1,020.52 325.00 9-Apr-2015
3 VRL Logistics Limited* 467.88 205.00 30-Apr-2015
4 MEP Infrastructure Developers Limited 324.00 63.00 6-May-2015
5 UFO Moviez India Limited 600.00 625.00 14-May-2015
6 PNC Infratech Limited 488.44 378.00 26-May-2015
7 Manpasand Beverages Limited 400.00 320.00 9-Jul-2015
8 Syngene International Limited 550.00 250.00 11-Aug-2015
9 Emkay Taps and Cutting Tools Limited 15.55 330.00 13-Aug-2015
10 Power Mech Projects Limited 273.22 640.00 26-Aug-2015
11 Navkar Corporation Limited 600.00 155.00 9-Sep-2015
12 Pennar Engineered Building Systems Limited 156.19 178.00 10-Sep-2015
13 Shree Pushkar Chemicals & Fertilisers Limited 70.00 65.00 10-Sep-2015
14 Sadbhav Infrastructure Project Limited 491.66 103.00 16-Sep-2015
Contd...

22
Sr. No. Company Name Issue Size (` Crores)
Issue Price(`)
Date of Listing
15 Prabhat Dairy Limited 356.19 115.00 21-Sep-2015
16 Shaival Reality Limited 5.28 100.00 1-Oct-2015
17 Ahimsa Industries Limited 3.80 25.00 15-Oct-2015
18 Coffee Day Enterprises Limited 1,150.00 328.00 2-Nov-2015
19 InterGlobe Aviation Limited 3,017.10 765.00 10-Nov-2015
20 S H Kelkar and Company Limited 508.17 180.00 16-Nov-2015
21 Perfect Infraengineers Limited 5.77 23.00 20-Nov-2015
22 Alkem Laboratories Limited 1,346.62 1,050.00 23-Dec-2015
23 Dr. Lal Path Labs Ltd. 631.91 550.00 23-Dec-2015
24 Fourth Dimension Solutions Limited 8.68 30.00 22-Jan-2016
25 Narayana Hrudayalaya Ltd. 613.08 250.00 6-Jan-2016
26 Precision Camshafts Limited 410.19 186.00 8-Feb-2016
27 Teamlease Services Limited 423.68 850.00 12-Feb-2016
28 Quick Heal Technologies Limited 451.25 321.00 18-Feb-2016
29 Hi-Tech Pipes Limited 13.65 50.00 25-Feb-2016
30 Healthcare Global Enterprises Limited 649.64 218.00 30-Mar-2016
31 HEC Infra Projects Limited 5.39 100.00 30-Mar-2016
32 Wealth First Portfolio Managers Limited 8.40 50.00 30-Mar-2016
Total 15,432.13
Table 3-10: Resource mobilisation through public issue of NCDs during 2015-16
S. No.
Name of the Company Date Amount Mobilised (` Crores)
Amount Mobilised (Us $ mn)
1 Srei Equipment Finance Limited 14-May-15 409.7 61.8
2 NTPC Limited 8-Oct-15 700 105.5
3 Indian Railway Finance Corporation Limited 28-Dec-15 4,532 683.2
4 National Highways Authority of India 14-Jan-16 10,000 1,507.5
5 Indian Railway Finance Corporation Limited 28-Mar-16 2,450 369.3
6 National Highways Authority of India 11-Mar-16 3,300 497.5
Total 21,391.70 3,224.90
Contd...

23
Table 3-11: Rights Issues during 2015-16
S. No. Company Name Date of Listing Amount Mobilised(` Crores)
Amount Mobilised(US $ mn)
1 State Bank Of Travancore 17-Apr-2015 474.03 71.46
2 GMR Infrastructure Limited 22-Apr-2015 1,401.83 211.33
3 Zee Media Corporation Limited 22-Apr-2015 195.56 29.48
4 Tata Motors Limited 18-May-2015 6,772.07 1,020.92
5 Tata Motors Limited 18-May-2015 718.41 108.30
6 IL&FS Transportation Networks Limited 10-Nov-2015 740.16 111.58
7 Universal Cables Limited 2-Dec-2015 45.18 6.81
8 JMC Projects (India) Limited 18-Feb-2016 150.00 22.61
Total 10,497.25 1,582.51
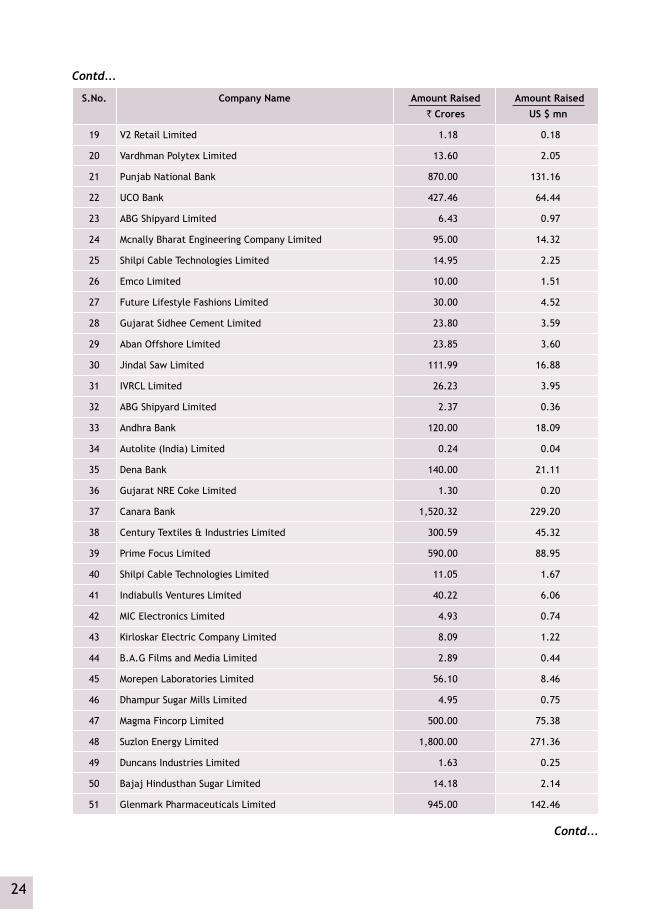
Table 3-12: Preferential allotments by NSE listed companies during 2015-16
S.No. Company Name Amount Raised
` Crores
Amount Raised
US $ mn
1 Bank Of India 642.00 96.78
2 Burnpur Cement Limited 5.00 0.75
3 Banswara Syntex Limited 3.82 0.58
4 Blue Coast Hotels Limited 40.00 6.03
5 State Bank Of India 2,970.00 447.74
6 Canara Bank 570.00 85.93
7 Central Bank of India 1,617.00 243.77
8 IL&FS Engineering and Construction Company Limited 128.71 19.40
9 Syndicate Bank 460.00 69.35
10 Bank Of Baroda 1,260.00 189.95
11 Zicom Electronic Security Systems Limited 41.60 6.27
12 Allahabad Bank 320.00 48.24
13 Indian Bank 280.00 42.21
14 IVRCL Limited 36.16 5.45
15 Genesys International Corporation Limited 6.00 0.90
16 Bajaj Hindusthan Sugar Limited 371.92 56.07
17 kwality limited 75.00 11.31
18 Era Infra Engineering Limited 179.73 27.09
Contd...
24
S.No. Company Name Amount Raised
` Crores
Amount Raised
US $ mn
19 V2 Retail Limited 1.18 0.18
20 Vardhman Polytex Limited 13.60 2.05
21 Punjab National Bank 870.00 131.16
22 UCO Bank 427.46 64.44
23 ABG Shipyard Limited 6.43 0.97
24 Mcnally Bharat Engineering Company Limited 95.00 14.32
25 Shilpi Cable Technologies Limited 14.95 2.25
26 Emco Limited 10.00 1.51
27 Future Lifestyle Fashions Limited 30.00 4.52
28 Gujarat Sidhee Cement Limited 23.80 3.59
29 Aban Offshore Limited 23.85 3.60
30 Jindal Saw Limited 111.99 16.88
31 IVRCL Limited 26.23 3.95
32 ABG Shipyard Limited 2.37 0.36
33 Andhra Bank 120.00 18.09
34 Autolite (India) Limited 0.24 0.04
35 Dena Bank 140.00 21.11
36 Gujarat NRE Coke Limited 1.30 0.20
37 Canara Bank 1,520.32 229.20
38 Century Textiles & Industries Limited 300.59 45.32
39 Prime Focus Limited 590.00 88.95
40 Shilpi Cable Technologies Limited 11.05 1.67
41 Indiabulls Ventures Limited 40.22 6.06
42 MIC Electronics Limited 4.93 0.74
43 Kirloskar Electric Company Limited 8.09 1.22
44 B.A.G Films and Media Limited 2.89 0.44
45 Morepen Laboratories Limited 56.10 8.46
46 Dhampur Sugar Mills Limited 4.95 0.75
47 Magma Fincorp Limited 500.00 75.38
48 Suzlon Energy Limited 1,800.00 271.36
49 Duncans Industries Limited 1.63 0.25
50 Bajaj Hindusthan Sugar Limited 14.18 2.14
51 Glenmark Pharmaceuticals Limited 945.00 142.46
Contd...
Contd...

25
S.No. Company Name Amount Raised
` Crores
Amount Raised
US $ mn
52 Shakti Pumps (India) Limited 6.00 0.90
53 Welspun Corp Limited 2.90 0.44
54 Jindal Saw Limited 117.58 17.73
55 Valecha Engineering Limited 30.15 4.55
56 A2Z INFRA ENGINEERING LIMITED 22.20 3.35
57 Ganesha Ecosphere Limited 6.50 0.98
58 KSK Energy Ventures Limited 108.42 16.34
59 IVRCL Limited 53.89 8.12
60 Raj Rayon Industries Limited 8.00 1.21
61 Ester Industries Limited 20.96 3.16
62 Garden Silk Mills Limited 7.00 1.06
63 Lokesh Machines Limited 5.00 0.75
64 8K Miles Software Services Limited 27.90 4.21
65 IVRCL Limited 5.29 0.80
66 IOL Chemicals and Pharmaceuticals Limited 2.80 0.42
67 Moser-Baer (I) Limited 13.45 2.03
68 Arshiya Limited 6.57 0.99
69 ABG Shipyard Limited 1.77 0.27
70 Farmax India Limited 16.62 2.50
71 Lanco Infratech Limited 13.56 2.04
72 Shasun Pharmaceuticals Limited 78.10 11.77
73 V2 Retail Limited 1.31 0.20
74 RattanIndia Infrastructure Limited 17.86 2.69
75 Banswara Syntex Limited 2.12 0.32
76 IOL Chemicals and Pharmaceuticals Limited 5.04 0.76
77 Excel Industries Limited 6.90 1.04
78 Oberoi Realty Limited 324.50 48.92
79 Shiv-Vani Oil & Gas Exploration Services Limited 8.11 1.22
80 Future Retail Limited 92.72 13.98
81 Mayur Uniquoters Ltd 70.00 10.55
82 Indusind Bank Limited 752.74 113.48
83 Eros International Media Limited 35.00 5.28
84 PVR Limited 350.00 52.76
Contd...
Contd...
26
S.No. Company Name Amount Raised
` Crores
Amount Raised
US $ mn
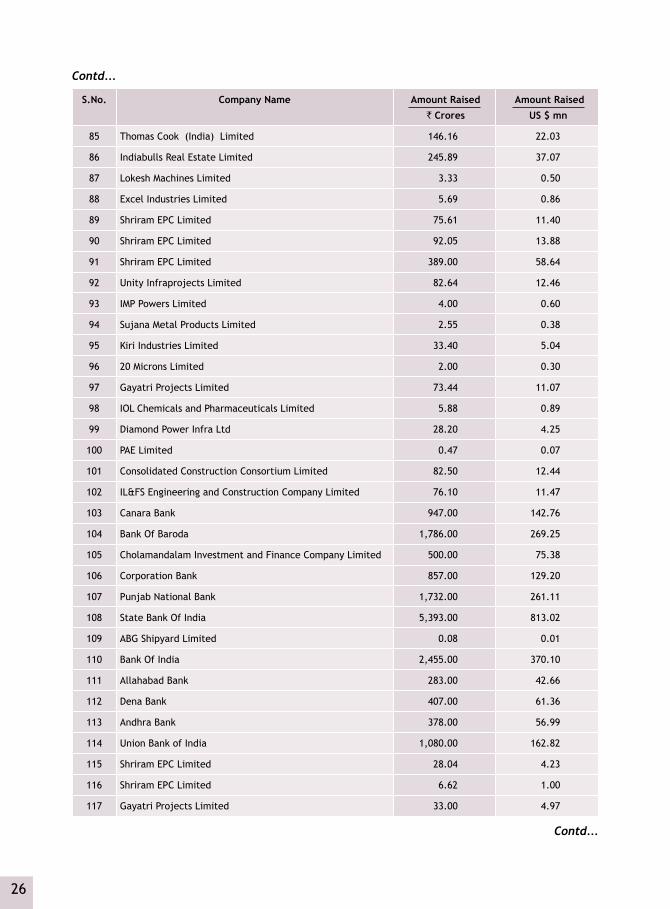
85 Thomas Cook (India) Limited 146.16 22.03
86 Indiabulls Real Estate Limited 245.89 37.07
87 Lokesh Machines Limited 3.33 0.50
88 Excel Industries Limited 5.69 0.86
89 Shriram EPC Limited 75.61 11.40
90 Shriram EPC Limited 92.05 13.88
91 Shriram EPC Limited 389.00 58.64
92 Unity Infraprojects Limited 82.64 12.46
93 IMP Powers Limited 4.00 0.60
94 Sujana Metal Products Limited 2.55 0.38
95 Kiri Industries Limited 33.40 5.04
96 20 Microns Limited 2.00 0.30
97 Gayatri Projects Limited 73.44 11.07
98 IOL Chemicals and Pharmaceuticals Limited 5.88 0.89
99 Diamond Power Infra Ltd 28.20 4.25
100 PAE Limited 0.47 0.07
101 Consolidated Construction Consortium Limited 82.50 12.44
102 IL&FS Engineering and Construction Company Limited 76.10 11.47
103 Canara Bank 947.00 142.76
104 Bank Of Baroda 1,786.00 269.25
105 Cholamandalam Investment and Finance Company Limited 500.00 75.38
106 Corporation Bank 857.00 129.20
107 Punjab National Bank 1,732.00 261.11
108 State Bank Of India 5,393.00 813.02
109 ABG Shipyard Limited 0.08 0.01
110 Bank Of India 2,455.00 370.10
111 Allahabad Bank 283.00 42.66
112 Dena Bank 407.00 61.36
113 Andhra Bank 378.00 56.99
114 Union Bank of India 1,080.00 162.82
115 Shriram EPC Limited 28.04 4.23
116 Shriram EPC Limited 6.62 1.00
117 Gayatri Projects Limited 33.00 4.97
Contd...
Contd...

27
S.No. Company Name Amount Raised
` Crores
Amount Raised
US $ mn
118 Orient Green Power Company Limited 250.03 37.69
119 Shriram EPC Limited 5.63 0.85
120 Jindal Stainless Limited 18.11 2.73
121 Thomas Cook (India) Limited 353.84 53.34
122 Excel Industries Limited 1.21 0.18
123 GMR Infrastructure Limited 568.34 85.68
124 GMR Infrastructure Limited 568.34 85.68
125 Bank of Maharashtra 394.00 59.40
126 Lokesh Machines Limited 3.00 0.45
127 Kesar Enterprises Limited 0.17 0.03
128 IVRCL Limited 7.28 1.10
129 IVRCL Limited 51.64 7.79
130 Unity Infraprojects Limited 23.00 3.47
131 A2Z INFRA ENGINEERING LIMITED 8.10 1.22
132 MIC Electronics Limited 3.42 0.52
133 Indian Overseas Bank 2,009.00 302.87
134 Sunil Hitech Engineers Limited 10.25 1.55
135 20 Microns Limited 1.70 0.26
136 Bajaj Hindusthan Sugar Limited 496.84 74.90
137 IOL Chemicals and Pharmaceuticals Limited 5.67 0.85
138 MIC Electronics Limited 8.13 1.23
139 Pioneer Embroideries Limited 2.98 0.45
140 3i Infotech Limited 33.50 5.05
141 Granules India Limited 34.77 5.24
142 Astral Poly Technik Limited 59.00 8.89
143 Maxwell Industries Limited 11.40 1.72
144 Cubex Tubings Limited 3.62 0.55
145 JK Paper Limited 50.02 7.54
146 L&T Finance Holdings Limited 235.59 35.52
147 A2Z INFRA ENGINEERING LIMITED 9.96 1.50
148 IVRCL Limited 36.70 5.53
149 Uniply Industries Limited 26.68 4.02
150 20 Microns Limited 1.30 0.20
Contd...
Contd...

28
S.No. Company Name Amount Raised
` Crores
Amount Raised
US $ mn
151 Arshiya Limited 14.99 2.26
152 Ganesha Ecosphere Limited 33.92 5.11
153 IOL Chemicals and Pharmaceuticals Limited 4.55 0.69
154 Gammon India Limited 179.60 27.08
155 VAKRANGEE LIMITED 250.00 37.69
156 Dhampur Sugar Mills Limited 4.95 0.75
157 Mangalam Drugs And Organics Limited 7.80 1.18
158 ABG Shipyard Limited 3.43 0.52
159 8K Miles Software Services Limited 5.98 0.90
160 Corporation Bank 143.00 21.56
161 Shriram EPC Limited 23.45 3.54
162 Shriram EPC Limited 25.79 3.89
163 IDBI Bank Limited 2,229.00 336.03
164 Arshiya Limited 20.41 3.08
165 Bank Of India 264.12 39.82
166 Amtek Auto Limited 74.99 11.31
167 Palred Technologies Limited 8.93 1.35
168 Century Textiles & Industries Limited 361.28 54.46
169 MIC Electronics Limited 2.62 0.39
170 JBF Industries Limited 491.23 74.06
171 Gujarat NRE Coke Limited 64.32 9.70
172 Lanco Infratech Limited 167.06 25.19
173 Unity Infraprojects Limited 10.79 1.63
174 Mcnally Bharat Engineering Company Limited 100.00 15.08
175 Energy Development Company Limited 44.00 6.63
176 Gujarat NRE Coke Limited 235.91 35.56
177 IVRCL Limited 5.83 0.88
178 IVRCL Limited 53.26 8.03
179 Impex Ferro Tech Limited 12.67 1.91
180 Autoline Industries Limited 6.23 0.94
181 Gulshan Polyols Limited 2.80 0.42
182 Patel Integrated Logistics Limited 8.05 1.21
183 A2Z Infra Engineering Limited 3.85 0.58
Contd...
Contd...

29
Contd...
S.No. Company Name Amount Raised
` Crores
Amount Raised
US $ mn
184 Bajaj Hindusthan Sugar Limited 156.40 23.58
185 Adani Power Limited 1,114.68 168.04
186 JHS Svendgaard Laboratories Limited 3.61 0.54
187 Cords Cable Industries Limited 6.45 0.97
188 Gulshan Polyols Limited 1.90 0.29
189 Siti Cable Network Limited 300.00 45.23
190 Bhartiya International Limited 12.00 1.81
191 Burnpur Cement Limited 4.30 0.65
192 Gujarat NRE Coke Limited 278.86 42.04
193 Shekhawati Poly-Yarn Limited 16.47 2.48
194 Ankit Metal & Power Limited 38.07 5.74
195 Balaji Telefilms Limited 150.08 22.63
196 Gammon India Limited 62.80 9.47
197 Gammon India Limited 22.25 3.35
198 IVRCL Limited 0.47 0.07
199 Lloyd Electric & Engineering Limited 13.45 2.03
200 A2Z Infra Engineering Limited 4.06 0.61
201 Gulshan Polyols Limited 1.91 0.29
202 IVRCL Limited 159.13 23.99
203 Shriram EPC Limited 11.85 1.79
204 Shriram EPC Limited 32.08 4.84
205 Euro Ceramics Limited 12.60 1.90
206 Rajshree Sugars & Chemicals Limited 3.30 0.50
207 GeeCee Ventures Limited 9.72 1.47
208 Sunil Hitech Engineers Limited 1.11 0.17
Table 3-13: Amount raised through QIP during 2015-16
Sr.No Name of the company Amount Raised
(` Crores)
Amount Raised
(US $ mn)
1 Marksans Pharma Limited 131.24 19.79
2 Hindustan Construction Company Limited 400.00 60.30
3 Ashoka Buildcon Limited 500.00 75.38
Contd...

30
Sr.No Name of the company Amount Raised
(` Crores)
Amount Raised
(US $ mn)
4 Ramco Systems Limited 325.00 49.00
5 Bajaj Finance Limited 1,400.00 211.06
6 Talwalkars Better Value Fitness Limited 107.48 16.20
7 Indusind Bank Limited 4,327.98 652.46
8 The Phoenix Mills Limited 282.59 42.60
9 Titagarh Wagons Limited 150.00 22.61
10 Insecticides (India) Limited 83.76 12.63
11 Indiabulls Housing Finance Limited 3,996.79 602.54
12 Natco Pharma Limited 340.89 51.39
13 J.Kumar Infraprojects Limited 409.28 61.70
14 Astra Microwave Products Limited 65.00 9.80
15 Somany Ceramics Limited 120.00 18.09
16 Strides Arcolab Limited 1,102.66 166.23
17 Deepak Nitrite Limited 83.31 12.56
18 Suprajit Engineering Limited 149.97 22.61
Total 13,975.95 2,106.94
Table 3-14: Companies Delisted during 2015-16
Compulsory / Voluntary Delisting Details
Sr. No
Name of the company Symbol Date of Delisting
Details
1 GSL Nova Petrochemicals Limited GSLNOVA 22-Apr-15 Delisting of Equity Shares of the Company on account of Voluntary delisting pursuant to SEBI (Delisting of Equity Shares) Regulations, 2009.
2 Essar Ports Limited ESSARPORTS 31-Dec-15 Delisting of Equity Shares of the Company on account of Voluntary delisting pursuant to SEBI (Delisting of Equity Shares) Regulations, 2009.
3 Essar Oil Limited ESSAROIL 17-Feb-16 Delisting of Equity Shares of the Company on account of Voluntary delisting pursuant to SEBI (Delisting of Equity Shares) Regulations, 2009.
4 Zenith Computers Limited ZENITHCOMP 18-Mar-16 Delisting of Equity Shares of the Company on account of Voluntary delisting pursuant to SEBI (Delisting of Equity Shares) Regulations, 2009.
5 Gujarat State Financial Corporation
GUJSTATFIN 18-Mar-16 Delisting of Equity Shares of the Company on account of Voluntary delisting pursuant to SEBI (Delisting of Equity Shares) Regulations, 2009.
Contd...
Capital Market Segment 4

32

33
4Capital Market SegmentTa
ble
4-1:
Bus
ines
s gr
owth
of
CM s
egm
ent
Mon
th
&
Year
No.
of
Trad
-in
g D
ays
No.
of
com
-pa
nies
Tr
aded
No.
of
Tr
ades
Trad
ed
Qua
ntit
y T
radi
ng V
alue
Aver
age
Dai
ly
Trad
ing
Valu
eTu
rn-
over
R
atio
Dem
at
Trad
ed
Qua
ntit
y
Dem
at T
radi
ng
Valu
eM
arke
t C
apit
alis
atio
n
( la
kh)
(lak
h)(`
Cro
res)
(US
$ bn
)(`
Cro
res)
(US
$ m
n)(%
)(l
akh)
(` C
rore
s)(U
S $
bn)
(` C
rore
s)(U
S $
bn)
2011
-12
249
1,55
114
,377
1,61
6,97
82,
810,
893
549
11,2
892,
207
46.1
11,
616,
978
2,81
0,89
354
96,
096,
518
1,19
2
2012
-13
250
1,57
713
,605
1,65
9,16
02,
708,
279
498
10,8
331,
992
43.4
11,
659,
160
2,70
8,27
949
86,
239,
035
1,14
7
2013
-14
251
1,58
614
,432
1,53
3,71
62,
808,
488
470
11,1
8918
738
.59
1,53
3,71
62,
808,
488
470
7,27
7,72
01,
218
2014
-15
243
1,60
318
,328
2,36
1,77
94,
329,
655
692
17,8
182,
847
44.0
02,
361,
779
4,32
9,77
969
29,
930,
122
1,58
7
Apr
-15
191,
518
1,50
616
2,66
337
9,34
957
19,9
663,
010
162,
663
379,
349
579,
686,
324
1,46
0
May
-15
201,
519
1,45
315
2,93
636
1,93
555
18,0
972,
728
152,
936
361,
935
5510
,020
,665
1,51
1
Jun-
1522
1,51
71,
525
177,
774
333,
289
5015
,150
2,28
417
7,77
433
3,28
950
9,84
9,07
61,
485
Jul-1
523
1,52
11,
743
196,
777
383,
484
5816
,673
2,51
419
6,77
738
3,48
458
10,1
68,5
611,
533
Aug-
1521
1,52
71,
862
215,
821
419,
932
6319
,997
3,01
521
5,82
141
9,93
263
9,52
9,07
01,
437
Sep-
1520
1,53
51,
497
164,
107
328,
412
5016
,421
2,47
516
4,10
732
8,41
250
9,49
1,60
91,
431
Oct
-15
201,
534
1,46
317
9,06
033
3,80
150
16,6
902,
516
179,
060
333,
801
509,
654,
114
1,45
5
Nov
-15
191,
541
1,31
616
3,70
830
7,15
046
16,1
662,
437
163,
708
307,
150
469,
675,
669
1,45
9
Dec
-15
221,
549
1,48
019
8,46
733
4,95
450
15,2
252,
295
198,
467
334,
954
509,
831,
658
1,48
2
Jan-
1620
1,54
81,
552
209,
339
352,
084
5317
,604
2,65
420
9,33
935
2,08
453
9,20
9,38
61,
388
Feb-
1621
1,55
01,
601
195,
172
345,
646
5216
,459
2,48
119
5,17
234
5,64
652
8,42
2,85
71,
270
Mar
-16
201,
563
1,52
018
5,94
735
6,94
754
17,8
472,
691
185,
947
356,
947
549,
310,
471
1,40
4
2015
-16
247
1,60
718
,518
2,20
1,77
14,
236,
983
639
17,1
542,
586
45.5
12,
201,
771
4,23
6,98
363
99,
310,
471
1,40
4

34
Table 4-2: Frequency distribution of companies traded
Trading Frequency (Range of
Days)
2011-12 2012-13 2013-14 2014-15 2015-16
No. of Companies
Traded
Percentageof Total
No. of Companies
Traded
Percentage of Total
No. of Companies
Traded
Percentage of Total
No. of Companies
Traded
Percentage of Total
No. of Companies
Traded
Percentage of Total
Above 100 1,530 94.0 1,561 95.4 1,469 89.1 1,564 92.5 1,551 91.1
91-100 5 0.3 3 0.2 17 1.0 6 0.4 10 0.6
81-90 8 0.5 6 0.4 15 0.9 8 0.5 12 0.7
71-80 7 0.4 5 0.3 15 0.9 10 0.6 15 0.9
61-70 5 0.3 5 0.3 25 1.5 8 0.5 7 0.4
51-60 6 0.4 9 0.5 15 0.9 5 0.3 6 0.4
41-50 3 0.2 3 0.2 17 1.0 9 0.5
31-40 3 0.2 3 0.2 13 0.8 5 0.9 10 0.6
21-30 8 0.5 6 0.4 14 0.8 7 0.4 8 0.5
11-20 8 0.5 4 0.2 13 0.8 11 0.7 14 0.8
1-10 44 2.7 32 2.0 35 2.1 57 3.4 61 3.6
Total 1,627 100.0 1,637 100.0 1,648 100.0 1,691 100 1,703 100.0
Table 4-3: Trading frequency of companies in Cash Segment during 2015-16
Month/ Year Companies Available for Trading*
No. of companies Traded
Percent of Traded to Available for Trading
Apr-15 1,550 1,518 97.94
May-15 1,555 1,519 97.68
Jun-15 1,553 1,517 97.68
Jul-15 1,559 1,521 97.56
Aug-15 1,574 1,527 97.01
Sep-15 1,581 1,535 97.09
Oct-15 1,582 1,534 96.97
Nov-15 1,587 1,541 97.10
Dec-15 1,599 1,549 96.87
Jan-16 1,603 1,548 96.57
Feb-16 1,606 1,550 96.51
Mar-16 1,613 1,563 96.90
Note: * At the end of the period Includes listed/permitted to trade companies but excludes suspended companies.
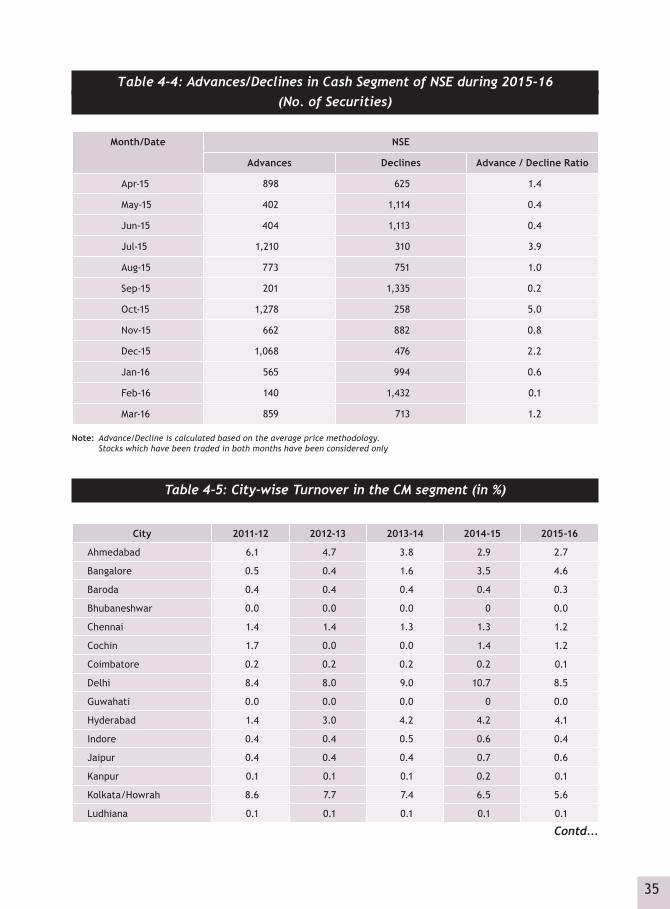
35
Table 4-4: Advances/Declines in Cash Segment of NSE during 2015-16 (No. of Securities)
Month/Date NSE
Advances Declines Advance / Decline Ratio
Apr-15 898 625 1.4
May-15 402 1,114 0.4
Jun-15 404 1,113 0.4
Jul-15 1,210 310 3.9
Aug-15 773 751 1.0
Sep-15 201 1,335 0.2
Oct-15 1,278 258 5.0
Nov-15 662 882 0.8
Dec-15 1,068 476 2.2
Jan-16 565 994 0.6
Feb-16 140 1,432 0.1
Mar-16 859 713 1.2
Note: Advance/Decline is calculated based on the average price methodology. Stocks which have been traded in both months have been considered only
Table 4-5: City-wise Turnover in the CM segment (in %)
City 2011-12 2012-13 2013-14 2014-15 2015-16
Ahmedabad 6.1 4.7 3.8 2.9 2.7
Bangalore 0.5 0.4 1.6 3.5 4.6
Baroda 0.4 0.4 0.4 0.4 0.3
Bhubaneshwar 0.0 0.0 0.0 0 0.0
Chennai 1.4 1.4 1.3 1.3 1.2
Cochin 1.7 0.0 0.0 1.4 1.2
Coimbatore 0.2 0.2 0.2 0.2 0.1
Delhi 8.4 8.0 9.0 10.7 8.5
Guwahati 0.0 0.0 0.0 0 0.0
Hyderabad 1.4 3.0 4.2 4.2 4.1
Indore 0.4 0.4 0.5 0.6 0.4
Jaipur 0.4 0.4 0.4 0.7 0.6
Kanpur 0.1 0.1 0.1 0.2 0.1
Kolkata/Howrah 8.6 7.7 7.4 6.5 5.6
Ludhiana 0.1 0.1 0.1 0.1 0.1
Contd...
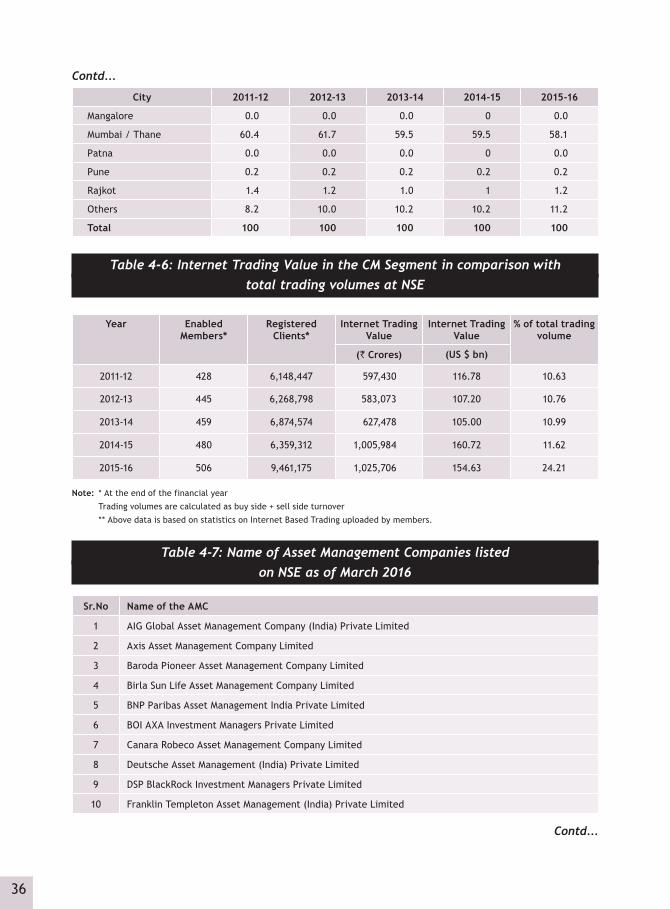
36
City 2011-12 2012-13 2013-14 2014-15 2015-16
Mangalore 0.0 0.0 0.0 0 0.0
Mumbai / Thane 60.4 61.7 59.5 59.5 58.1
Patna 0.0 0.0 0.0 0 0.0
Pune 0.2 0.2 0.2 0.2 0.2
Rajkot 1.4 1.2 1.0 1 1.2
Others 8.2 10.0 10.2 10.2 11.2
Total 100 100 100 100 100
Table 4-6: Internet Trading Value in the CM Segment in comparison with total trading volumes at NSE
Year Enabled Members*
Registered Clients*
Internet Trading Value
Internet Trading Value
% of total trading volume
(` Crores) (US $ bn)
2011-12 428 6,148,447 597,430 116.78 10.63
2012-13 445 6,268,798 583,073 107.20 10.76
2013-14 459 6,874,574 627,478 105.00 10.99
2014-15 480 6,359,312 1,005,984 160.72 11.62
2015-16 506 9,461,175 1,025,706 154.63 24.21
Note: * At the end of the financial year
Trading volumes are calculated as buy side + sell side turnover
** Above data is based on statistics on Internet Based Trading uploaded by members.
Table 4-7: Name of Asset Management Companies listed on NSE as of March 2016
Sr.No Name of the AMC
1 AIG Global Asset Management Company (India) Private Limited
2 Axis Asset Management Company Limited
3 Baroda Pioneer Asset Management Company Limited
4 Birla Sun Life Asset Management Company Limited
5 BNP Paribas Asset Management India Private Limited
6 BOI AXA Investment Managers Private Limited
7 Canara Robeco Asset Management Company Limited
8 Deutsche Asset Management (India) Private Limited
9 DSP BlackRock Investment Managers Private Limited
10 Franklin Templeton Asset Management (India) Private Limited
Contd...
Contd...

37
Sr.No Name of the AMC
11 Goldman Sachs Asset Management (India) Private Limited
12 HDFC Asset Management Company Limited
13 HSBC Asset Management (India) Private Limited
14 ICICI Prudential Asset Management Company Limited
15 IDBI Asset Management Limited
16 IDFC Asset Management Company Limited
17 India Infoline Asset Management Company Limited
18 JM Financial Asset Management Private Limited
19 JPMorgan Asset Management India Private Limited
20 Kotak Mahindra Asset Management Company Limited
21 L&T Investment Management Limited
22 LIC NOMURA Mutual Fund Asset Management Company Limited
23 Motilal Oswal Asset Management Company Limited
24 Principal Pnb Asset Management Company Private Limited
25 Quantum Asset Management Company Private Limited
26 Reliance Capital Asset Management Limited
27 Religare Invesco Asset Management Company Private Limited
28 Sahara Asset Management Company Private Limited
29 SBI Funds Management Private Limited
30 Sundaram Asset Management Company Limited
31 Union KBC Asset Management Company Private Limited
32 UTI Asset Management Company Limited
33 Edelweiss Asset Management Limited
Table 4-8: NSE CM transaction charges
Total Traded Value in a month Revised Transaction Charges
Up to First ` 1250 cores ` 3.25 each side
More than ` 1250 crores up to ` 2500 crores ` 3.20 each side
More than ` 2500 crores up to ` 5000 crores ` 3.15 each side
More than ` 5000 crores up to ` 10000 crores ` 3.10 each side
More than ` 10000 crores up to ` 15000 crores ` 3.05 each side
Exceeding ` 15000 crores ` 3.00 each side
Contd...

38
Table 4-9: The existing rates of Securities Transaction Tax (STT) for CM segment
Sr. No. Taxable securities transaction Rate (%) Payable by
1 Purchase of an equity share in a company [or a unit of a business trust] where –(a) the transaction of such purchase is entered into in a
recognized stock exchange; and(b) the contract for the purchase of such share [or unit] is
settled by the actual delivery or transfer of such share
0.1 Purchaser
2 Sale of an equity share in a Company [or a unit of a business trust] where –(a) the transaction of such sale is entered into in recognized
stock exchange; and(b) the contract for the sale of such share [or unit] is settled by
the actual delivery or transfer of such share [or unit]
0.1 Seller
2A Sale of a unit of an equity oriented fund, where –(a) the transaction of such sale is entered into in recognized
stock exchange; and(b) the contract for the sale of such unit is settled by the actual
delivery or transfer of such unit
0.001 Seller
3 Sale of an equity share in a company or a unit of an equity oriented fund[or a unit of a business trust], where –(a) the transaction of such sale is entered into in a recognized
stock exchange; and(b) the contract for the sale of such share or unit is settled
otherwise than by the actual delivery or transfer of such share or unit
0.025 Seller
4 (a) Sale of an option in securities ** 0.05 Seller
(b) Sale of an option in securities where option is exercised 0.125 Purchaser
(c ) Sale of a futures in securities 0.01 Seller
Note: *** Finance Bill, 2016 has proposed a revision in STT rate with effect from 01-06-2016 on sale of an option in securities where option is not exercised from current 0.017 per cent to 0.05 per cent, revised rate on STT with effect from 01-06-2016.
Table 4-10: Percentage Share of Top ‘N’ Securities / Member in Turnover
No. of Securities/Members
Year 5 10 25 50 100
Securities
2011-12 17.17 27.14 44.28 59.79 75.74
2012-13 16.18 26.22 44.30 60.54 76.82
2013-14 15.29 26.24 46.63 64.85 82.05
2014-15 11.40 18.98 34.13 51.32 70.85
2015-16 11.80 21.00 37.29 53.39 71.71
Members
2011-12 14.80 25.26 46.30 62.16 76.98
2012-13 14.25 24.68 46.66 63.07 77.18
2013-14 13.90 24.92 45.95 63.69 78.75
2014-15 14.93 25.90 47.82 64.88 79.46
2015-16 17.69 29.05 50.50 67.83 81.52

39
Table 4-11: ‘50’ Most Active Securities during 2015-16 in Terms of Trading Value
Rank Name of Security Trading Value % Share in Total Trading Value
Market Capitalisationas on March
31,2016
% Share in Total Market
Capitalisation(` Crores) (US $ bn) (` Crores) (US $ bn)
1 SUN PHARMACEUTICALS IND. 107,128.49 16.15 2.53 197,347 29.75 2.12
2 AXIS BANK LIMITED 106,496.76 16.05 2.51 105,731 15.94 1.14
3 INFOSYS LIMITED 101,411.50 15.29 2.39 279,837 42.19 3.01
4 STATE BANK OF INDIA 92,821.52 13.99 2.19 150,792 22.73 1.62
5 ICICI BANK LTD. 91,975.65 13.87 2.17 137,566 20.74 1.48
6 RELIANCE INDUSTRIES LTD 88,566.15 13.35 2.09 338,607 51.05 3.64
7 HDFC LTD 81,446.61 12.28 1.92 174,562 26.32 1.87
8 TATA MOTORS LIMITED 79,656.55 12.01 1.88 111,619 16.83 1.20
9 LARSEN & TOUBRO LTD. 71,570.71 10.79 1.69 113,311 17.08 1.22
10 TATA CONSULTANCY SERV LT 68,797.23 10.37 1.62 496,607 74.87 5.33
11 YES BANK LIMITED 65,139.21 9.82 1.54 36,327 5.48 0.39
12 MARUTI SUZUKI INDIA LTD. 64,081.24 9.66 1.51 112,262 16.92 1.21
13 LUPIN LIMITED 63,994.41 9.65 1.51 66,645 10.05 0.72
14 ITC LTD 57,947.84 8.74 1.37 263,856 39.78 2.83
15 WOCKHARDT LIMITED 49,412.67 7.45 1.17 10,763 1.62 0.12
16 JET AIRWAYS (INDIA) LTD. 46,375.20 6.99 1.09 6,217 0.94 0.07
17 TATA STEEL LIMITED 42,088.47 6.35 0.99 31,050 4.68 0.33
18 DR. REDDY'S LABORATORIES 41,350.39 6.23 0.98 51,783 7.81 0.56
19 AUROBINDO PHARMA LTD 40,335.00 6.08 0.95 43,563 6.57 0.47
20 HDFC BANK LTD 39,860.60 6.01 0.94 270,582 40.79 2.91
21 BHARTI AIRTEL LIMITED 38,801.52 5.85 0.92 140,229 21.14 1.51
22 HCL TECHNOLOGIES LTD 37,950.78 5.72 0.90 114,776 17.30 1.23
23 EICHER MOTORS LTD 35,703.98 5.38 0.84 52,097 7.85 0.56
24 COAL INDIA LTD 35,173.53 5.30 0.83 184,406 27.80 1.98
25 RELIANCE INFRASTRUCTU LTD 31,774.60 4.79 0.75 14,033 2.12 0.15
26 TATA ELXSI LIMITED 31,579.85 4.76 0.75 5,866 0.88 0.06
27 BANK OF BARODA 31,307.52 4.72 0.74 33,871 5.11 0.36
28 INDIABULLS HSG FIN LTD 30,617.22 4.62 0.72 27,376 4.13 0.29
29 MAHINDRA & MAHINDRA LTD 30,109.80 4.54 0.71 75,196 11.34 0.81
30 VEDANTA LIMITED 29,994.60 4.52 0.71 26,638 4.02 0.29
31 BHARAT PETROLEUM CORP LT 29,825.44 4.50 0.70 65,389 9.86 0.70
32 HERO MOTOCORP LIMITED 29,569.43 4.46 0.70 58,822 8.87 0.63
33 TECH MAHINDRA LIMITED 29,196.65 4.40 0.69 45,943 6.93 0.49
34 HINDUSTAN UNILEVER LTD. 28,446.32 4.29 0.67 188,149 28.36 2.02
Contd...

40
Rank Name of Security Trading Value % Share in Total Trading Value
Market Capitalisationas on March
31,2016
% Share in Total Market
Capitalisation(` Crores) (US $ bn) (` Crores) (US $ bn)
35 DLF LIMITED 28,196.33 4.25 0.67 20,463 3.08 0.22
36 ASHOK LEYLAND LTD 28,149.01 4.24 0.66 30,906 4.66 0.33
37 CIPLA LTD 28,020.39 4.22 0.66 41,129 6.20 0.44
38 HOUSING DEV & INFRA LTD 27,892.60 4.20 0.66 3,065 0.46 0.03
39 INDUSIND BANK LIMITED 27,101.93 4.09 0.64 57,544 8.67 0.62
40 OIL AND NATURAL GAS CORP. 26,111.43 3.94 0.62 183,173 27.61 1.97
41 JUSTDIAL LTD. 26,026.49 3.92 0.61 5,406 0.81 0.06
42 HINDUSTAN PETROLEUM CORP 25,895.77 3.90 0.61 26,675 4.02 0.29
43 ADANI PORT & SEZ LTD 25,654.68 3.87 0.61 51,297 7.73 0.55
44 RELIANCE CAPITAL LTD 25,550.60 3.85 0.60 9,306 1.40 0.10
45 ASIAN PAINTS LIMITED 24,480.83 3.69 0.58 83,297 12.56 0.89
46 KOTAK MAHINDRA BANK LTD 24,202.29 3.65 0.57 124,781 18.81 1.34
47 BHARAT FORGE LTD 24,065.14 3.63 0.57 20,325 3.06 0.22
48 LIC HOUSING FINANCE LTD 23,956.66 3.61 0.57 24,887 3.75 0.27
49 GLENMARK PHARMACEUTICALS 23,354.03 3.52 0.55 22,433 3.38 0.24
50 BHARTI INFRATEL LTD. 22,751.72 3.43 0.54 72,443 10.92 0.78
Total 2,261,917 340.99 53.39 4,808,947 724.97 51.65
Table 4-12: Top ‘50’ Companies by Market Capitalisation as on March 31, 2016
RankName of Security and
IndustryMarket Capitalisation % Share in
Total Market Capitalisation
Trading Volume During 2015-16
% Share in Total Trading Volume(` Crores) (US $ bn) (` Crores) (US $
bn)
1 TATA CONSULTANCY SERV LT 496,607 74.87 5.33 68,797 10.37 1.62
2 RELIANCE INDUSTRIES LTD 338,607 51.05 3.64 88,566 13.35 2.09
3 INFOSYS LIMITED 279,837 42.19 3.01 101,412 15.29 2.39
4 HDFC BANK LTD 270,582 40.79 2.91 39,861 6.01 0.94
5 ITC LTD 263,856 39.78 2.83 57,948 8.74 1.37
6 SUN PHARMACEUTICALS IND. 197,347 29.75 2.12 107,128 16.15 2.53
7 HINDUSTAN UNILEVER LTD. 188,149 28.36 2.02 28,446 4.29 0.67
8 COAL INDIA LTD 184,406 27.80 1.98 35,174 5.30 0.83
9 OIL AND NATURAL GAS CORP. 183,173 27.61 1.97 26,111 3.94 0.62
10 HDFC LTD 174,562 26.32 1.87 81,447 12.28 1.92
11 STATE BANK OF INDIA 150,792 22.73 1.62 92,822 13.99 2.19
12 BHARTI AIRTEL LIMITED 140,229 21.14 1.51 38,802 5.85 0.92
Contd...
Contd...

41
Contd...
RankName of Security and
IndustryMarket Capitalisation % Share in
Total Market Capitalisation
Trading Volume During 2015-16
% Share in Total Trading Volume(` Crores) (US $ bn) (` Crores) (US $
bn)
13 WIPRO LTD 139,402 21.02 1.50 19,998 3.01 0.47
14 ICICI BANK LTD. 137,566 20.74 1.48 91,976 13.87 2.17
15 KOTAK MAHINDRA BANK LTD 124,781 18.81 1.34 24,202 3.65 0.57
16 HCL TECHNOLOGIES LTD 114,776 17.30 1.23 37,951 5.72 0.90
17 LARSEN & TOUBRO LTD. 113,311 17.08 1.22 71,571 10.79 1.69
18 MARUTI SUZUKI INDIA LTD. 112,262 16.92 1.21 64,081 9.66 1.51
19 TATA MOTORS LIMITED 111,619 16.83 1.20 79,657 12.01 1.88
20 NTPC LTD 106,243 16.02 1.14 15,353 2.31 0.36
21 AXIS BANK LIMITED 105,731 15.94 1.14 106,497 16.05 2.51
22 INDIAN OIL CORP LTD 95,564 14.41 1.03 16,559 2.50 0.39
23 ULTRATECH CEMENT LIMITED 88,606 13.36 0.95 21,242 3.20 0.50
24 ASIAN PAINTS LIMITED 83,297 12.56 0.89 24,481 3.69 0.58
25 HINDUSTAN ZINC LIMITED 77,577 11.70 0.83 4,039 0.61 0.10
26 MAHINDRA & MAHINDRA LTD 75,196 11.34 0.81 30,110 4.54 0.71
27 POWER GRID CORP. LTD. 72,771 10.97 0.78 10,031 1.51 0.24
28 BHARTI INFRATEL LTD. 72,443 10.92 0.78 22,752 3.43 0.54
29 BAJAJ AUTO LIMITED 69,620 10.50 0.75 18,826 2.84 0.44
30 LUPIN LIMITED 66,645 10.05 0.72 63,994 9.65 1.51
31 BHARAT PETROLEUM CORP LT 65,389 9.86 0.70 29,825 4.50 0.70
32 BOSCH LIMITED 65,261 9.84 0.70 12,859 1.94 0.30
33 HERO MOTOCORP LIMITED 58,822 8.87 0.63 29,569 4.46 0.70
34 INDUSIND BANK LIMITED 57,544 8.67 0.62 27,102 4.09 0.64
35 NESTLE INDIA LIMITED 55,510 8.37 0.60 9,704 1.46 0.23
36 EICHER MOTORS LTD 52,097 7.85 0.56 35,704 5.38 0.84
37 DR. REDDY'S LABORATORIES 51,783 7.81 0.56 41,350 6.23 0.98
38 ADANI PORT & SEZ LTD 51,297 7.73 0.55 25,655 3.87 0.61
39 GODREJ CONSUMER PRODUCTS 47,021 7.09 0.51 6,597 0.99 0.16
40 TECH MAHINDRA LIMITED 45,943 6.93 0.49 29,197 4.40 0.69
41 GAIL (INDIA) LTD 45,209 6.82 0.49 11,858 1.79 0.28
42 DABUR INDIA LTD 43,961 6.63 0.47 8,666 1.31 0.20
43 AUROBINDO PHARMA LTD 43,563 6.57 0.47 40,335 6.08 0.95
44 SHREE CEMENTS LTD 43,270 6.52 0.46 5,241 0.79 0.12
45 CIPLA LTD 41,129 6.20 0.44 28,020 4.22 0.66
46 IDEA CELLULAR LIMITED 39,677 5.98 0.43 16,942 2.55 0.40
47 SIEMENS LTD 39,163 5.90 0.42 8,926 1.35 0.21
48 NMDC LTD. 38,854 5.86 0.42 5,169 0.78 0.12
Contd...

42
RankName of Security and
IndustryMarket Capitalisation % Share in
Total Market Capitalisation
Trading Volume During 2015-16
% Share in Total Trading Volume(` Crores) (US $ bn) (` Crores) (US $
bn)
49 BAJAJ FINANCE LIMITED 37,302 5.62 0.40 8,346 1.26 0.20
50 ZEE ENTERTAINMENT ENT LTD 37,165 5.60 0.40 21,590 3.25 0.51
Total 5,595,513 844 60.10 1,892,487 285 44.67
Table 4-13: NSE’s 10 Most Active Trading days during the year 2015-16
Sr No. Date Highest Single Day Trading Value
( ` Crores) (US $ bn)
1 29-May-2015 43,621 6.58
2 21-Apr-2015 41,167 6.21
3 30-Nov-2015 29,535 4.45
4 24-Aug-2015 27,890 4.20
5 25-Aug-2015 27,646 4.17
6 31-Mar-2016 27,419 4.13
7 27-Aug-2015 26,117 3.94
8 30-Apr-2015 25,559 3.85
9 29-Feb-2016 24,881 3.75
10 26-Nov-2015 23,315 3.51
Table 4-14: Individual Securities Single day Trading Records 2015-16
Rank Symbol Name of Company Date Traded Value
( ` Crores) (US $ mn)
1 SUNPHARMA SUN PHARMACEUTICALS IND. 21-Apr-2015 24,817.73 3741.39
2 MARUTI MARUTI SUZUKI INDIA LTD. 30-Nov-2015 4,878.99 735.53
3 LUPIN LUPIN LIMITED 29-May-2015 4,367.68 658.45
4 AXISBANK AXIS BANK LIMITED 29-Feb-2016 3,121.04 470.51
5 BHARTIARTL BHARTI AIRTEL LIMITED 29-May-2015 2,864.46 431.83
6 SUNPHARMA SUN PHARMACEUTICALS IND. 21-Jul-2015 2,678.54 403.80
7 LUPIN LUPIN LIMITED 29-Mar-2016 2,580.23 388.98
8 EICHERMOT EICHER MOTORS LTD 29-May-2015 2,416.00 364.22
9 INDIGO INTERGLOBE AVIATION LTD 10-Nov-2015 2,407.46 362.94
10 INFY INFOSYS LIMITED 24-Apr-2015 2,389.82 360.28
Note: Data has been compiled for all markets except Auction Market & Retail Debt Market
Contd...

43
Table 4-15: Composition of Nifty 50 Index as on March 31,2016
Sl. No.
Name of Security Issued Capital
(` crores)
Free Float Market
Capitalisa-tion
(` crores)
Weight-age
(Per-cent)
Beta R2 Daily Volatility (Percent)
Monthly Return
(Percent)
Impact Cost (Per-cent)
1 2 3 4 5 6 7 8 9 10
1 ACC Ltd. 188.2 13,003.10 0.47 0.82 0.36 1.58 15.75 0.03
2 Adani Ports and Special Economic Zone Ltd.
414.2 22,570.89 0.81 1.38 0.38 2.18 25.93 0.05
3 Ambuja Cements Ltd. 310.4 18,044.69 0.65 1.00 0.39 1.70 23.73 0.03
4 Asian Paints Ltd. 95.9 39,149.47 1.41 0.86 0.29 1.49 2.64 0.03
5 Axis Bank Ltd. 476.1 74,011.69 2.67 1.43 0.51 1.82 18.20 0.03
6 Bajaj Auto Ltd. 289.4 33,417.72 1.21 0.91 0.29 1.27 9.30 0.03
7 Bank of Baroda 460.8 13,887.17 0.50 1.58 0.29 2.61 11.45 0.04
8 Bharat Heavy Electricals Ltd. 489.5 10,310.39 0.37 1.28 0.31 2.68 25.32 0.04
9 Bharat Petroleum Corporation Ltd. 723.1 23,539.86 0.85 0.85 0.21 1.79 17.56 0.02
10 Bharti Airtel Ltd. 1,998.7 47,677.79 1.72 0.65 0.17 1.28 11.19 0.03
11 Bosch Ltd. 31.4 18,925.70 0.68 0.99 0.32 1.36 24.19 0.04
12 Cairn India Ltd. 1,874.9 8,653.43 0.31 1.55 0.37 2.30 30.44 0.04
13 Cipla Ltd. 160.7 25,911.11 0.93 0.98 0.36 1.45 (0.43) 0.03
14 Coal India Ltd. 6,316.4 36,881.25 1.33 0.85 0.22 2.00 (6.13) 0.03
15 Dr. Reddy's Laboratories Ltd. 85.3 38,319.30 1.38 0.78 0.16 2.07 (0.03) 0.03
16 GAIL (India) Ltd. 1,268.5 16,727.16 0.60 1.17 0.32 2.23 16.80 0.03
17 Grasim Industries Ltd. 93.3 24,755.91 0.89 0.73 0.42 1.09 15.52 0.04
18 HCL Technologies Ltd. 282.0 45,910.23 1.66 0.82 0.22 1.40 0.10 0.02
19 HDFC Bank Ltd. 505.2 211,054.32 7.61 0.80 0.63 0.82 10.22 0.04
20 Hero MotoCorp Ltd. 39.9 37,057.83 1.34 0.85 0.32 1.92 17.83 0.02
21 Hindalco Industries Ltd. 206.5 11,260.16 0.41 1.64 0.41 3.55 27.93 0.04
22 Hindustan Unilever Ltd. 216.4 62,089.03 2.24 0.58 0.18 1.47 4.71 0.02
23 Housing Development Finance Corporation Ltd.
315.8 174,562.17 6.30 1.15 0.50 1.74 4.27 0.02
24 I T C Ltd. 803.8 184,699.08 6.66 0.83 0.30 2.59 11.03 0.02
25 ICICI Bank Ltd. 1,162.6 137,565.96 4.96 1.49 0.55 2.95 24.52 0.04
26 Idea Cellular Ltd. 3,600.4 12,299.74 0.44 0.65 0.11 1.51 5.66 0.04
27 IndusInd Bank Ltd. 594.7 47,185.87 1.70 1.09 0.51 1.33 16.58 0.03
Contd...
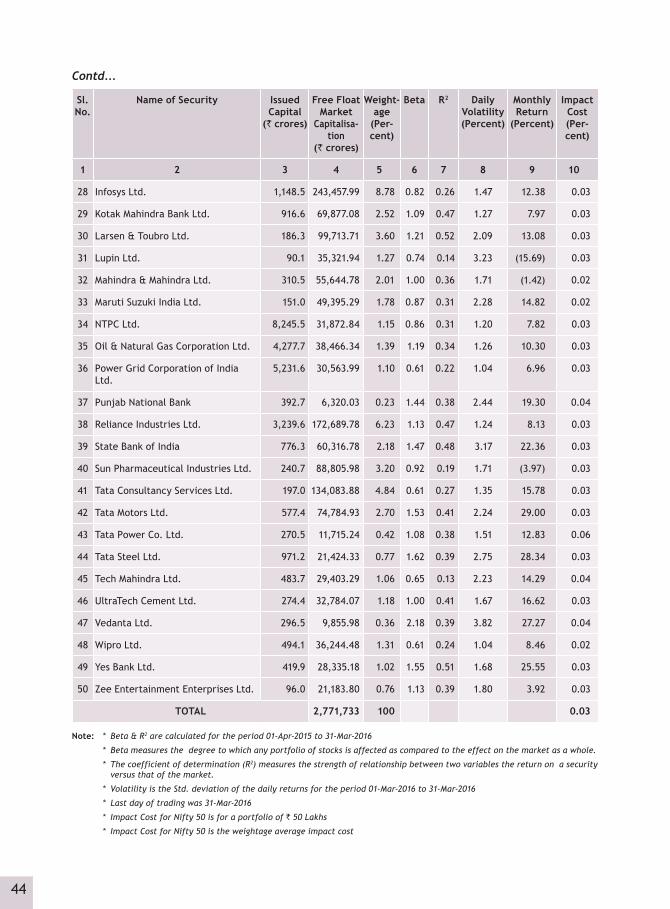
44
Sl. No.
Name of Security Issued Capital
(` crores)
Free Float Market
Capitalisa-tion
(` crores)
Weight-age
(Per-cent)
Beta R2 Daily Volatility (Percent)
Monthly Return
(Percent)
Impact Cost (Per-cent)
1 2 3 4 5 6 7 8 9 10
28 Infosys Ltd. 1,148.5 243,457.99 8.78 0.82 0.26 1.47 12.38 0.03
29 Kotak Mahindra Bank Ltd. 916.6 69,877.08 2.52 1.09 0.47 1.27 7.97 0.03
30 Larsen & Toubro Ltd. 186.3 99,713.71 3.60 1.21 0.52 2.09 13.08 0.03
31 Lupin Ltd. 90.1 35,321.94 1.27 0.74 0.14 3.23 (15.69) 0.03
32 Mahindra & Mahindra Ltd. 310.5 55,644.78 2.01 1.00 0.36 1.71 (1.42) 0.02
33 Maruti Suzuki India Ltd. 151.0 49,395.29 1.78 0.87 0.31 2.28 14.82 0.02
34 NTPC Ltd. 8,245.5 31,872.84 1.15 0.86 0.31 1.20 7.82 0.03
35 Oil & Natural Gas Corporation Ltd. 4,277.7 38,466.34 1.39 1.19 0.34 1.26 10.30 0.03
36 Power Grid Corporation of India Ltd.
5,231.6 30,563.99 1.10 0.61 0.22 1.04 6.96 0.03
37 Punjab National Bank 392.7 6,320.03 0.23 1.44 0.38 2.44 19.30 0.04
38 Reliance Industries Ltd. 3,239.6 172,689.78 6.23 1.13 0.47 1.24 8.13 0.03
39 State Bank of India 776.3 60,316.78 2.18 1.47 0.48 3.17 22.36 0.03
40 Sun Pharmaceutical Industries Ltd. 240.7 88,805.98 3.20 0.92 0.19 1.71 (3.97) 0.03
41 Tata Consultancy Services Ltd. 197.0 134,083.88 4.84 0.61 0.27 1.35 15.78 0.03
42 Tata Motors Ltd. 577.4 74,784.93 2.70 1.53 0.41 2.24 29.00 0.03
43 Tata Power Co. Ltd. 270.5 11,715.24 0.42 1.08 0.38 1.51 12.83 0.06
44 Tata Steel Ltd. 971.2 21,424.33 0.77 1.62 0.39 2.75 28.34 0.03
45 Tech Mahindra Ltd. 483.7 29,403.29 1.06 0.65 0.13 2.23 14.29 0.04
46 UltraTech Cement Ltd. 274.4 32,784.07 1.18 1.00 0.41 1.67 16.62 0.03
47 Vedanta Ltd. 296.5 9,855.98 0.36 2.18 0.39 3.82 27.27 0.04
48 Wipro Ltd. 494.1 36,244.48 1.31 0.61 0.24 1.04 8.46 0.02
49 Yes Bank Ltd. 419.9 28,335.18 1.02 1.55 0.51 1.68 25.55 0.03
50 Zee Entertainment Enterprises Ltd. 96.0 21,183.80 0.76 1.13 0.39 1.80 3.92 0.03
TOTAL 2,771,733 100 0.03
Note: * Beta & R2 are calculated for the period 01-Apr-2015 to 31-Mar-2016
* Beta measures the degree to which any portfolio of stocks is affected as compared to the effect on the market as a whole.
* The coefficient of determination (R2) measures the strength of relationship between two variables the return on a security versus that of the market.
* Volatility is the Std. deviation of the daily returns for the period 01-Mar-2016 to 31-Mar-2016
* Last day of trading was 31-Mar-2016
* Impact Cost for Nifty 50 is for a portfolio of ` 50 Lakhs
* Impact Cost for Nifty 50 is the weightage average impact cost
Contd...
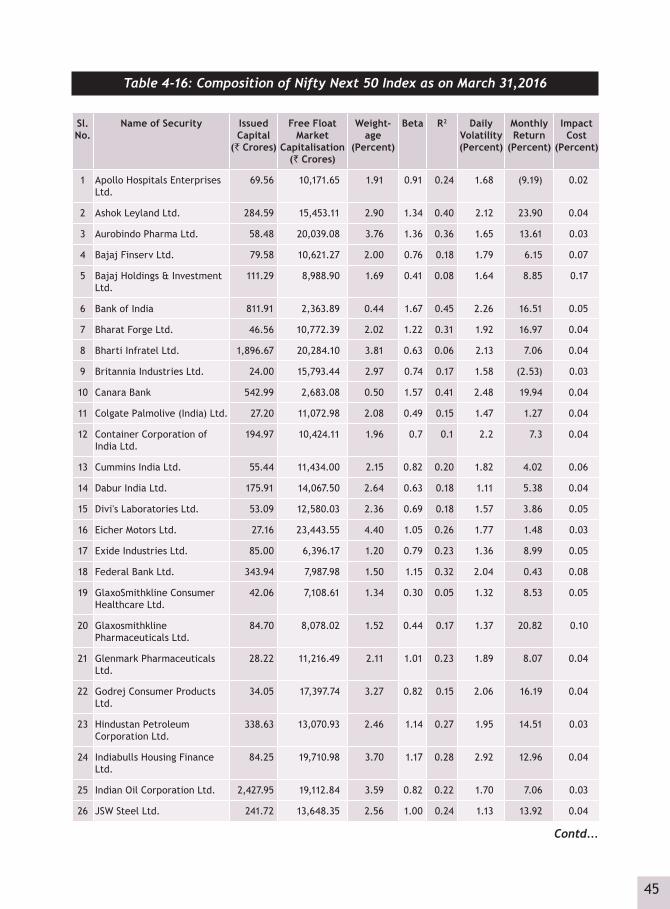
45
Table 4-16: Composition of Nifty Next 50 Index as on March 31,2016
Sl.No.
Name of Security Issued Capital
(` Crores)
Free Float Market
Capitalisation (` Crores)
Weight-age
(Percent)
Beta R2 Daily Volatility (Percent)
Monthly Return
(Percent)
Impact Cost
(Percent)
1 Apollo Hospitals Enterprises Ltd.
69.56 10,171.65 1.91 0.91 0.24 1.68 (9.19) 0.02
2 Ashok Leyland Ltd. 284.59 15,453.11 2.90 1.34 0.40 2.12 23.90 0.04
3 Aurobindo Pharma Ltd. 58.48 20,039.08 3.76 1.36 0.36 1.65 13.61 0.03
4 Bajaj Finserv Ltd. 79.58 10,621.27 2.00 0.76 0.18 1.79 6.15 0.07
5 Bajaj Holdings & Investment Ltd.
111.29 8,988.90 1.69 0.41 0.08 1.64 8.85 0.17
6 Bank of India 811.91 2,363.89 0.44 1.67 0.45 2.26 16.51 0.05
7 Bharat Forge Ltd. 46.56 10,772.39 2.02 1.22 0.31 1.92 16.97 0.04
8 Bharti Infratel Ltd. 1,896.67 20,284.10 3.81 0.63 0.06 2.13 7.06 0.04
9 Britannia Industries Ltd. 24.00 15,793.44 2.97 0.74 0.17 1.58 (2.53) 0.03
10 Canara Bank 542.99 2,683.08 0.50 1.57 0.41 2.48 19.94 0.04
11 Colgate Palmolive (India) Ltd. 27.20 11,072.98 2.08 0.49 0.15 1.47 1.27 0.04
12 Container Corporation of India Ltd.
194.97 10,424.11 1.96 0.7 0.1 2.2 7.3 0.04
13 Cummins India Ltd. 55.44 11,434.00 2.15 0.82 0.20 1.82 4.02 0.06
14 Dabur India Ltd. 175.91 14,067.50 2.64 0.63 0.18 1.11 5.38 0.04
15 Divi's Laboratories Ltd. 53.09 12,580.03 2.36 0.69 0.18 1.57 3.86 0.05
16 Eicher Motors Ltd. 27.16 23,443.55 4.40 1.05 0.26 1.77 1.48 0.03
17 Exide Industries Ltd. 85.00 6,396.17 1.20 0.79 0.23 1.36 8.99 0.05
18 Federal Bank Ltd. 343.94 7,987.98 1.50 1.15 0.32 2.04 0.43 0.08
19 GlaxoSmithkline Consumer Healthcare Ltd.
42.06 7,108.61 1.34 0.30 0.05 1.32 8.53 0.05
20 Glaxosmithkline Pharmaceuticals Ltd.
84.70 8,078.02 1.52 0.44 0.17 1.37 20.82 0.10
21 Glenmark Pharmaceuticals Ltd.
28.22 11,216.49 2.11 1.01 0.23 1.89 8.07 0.04
22 Godrej Consumer Products Ltd.
34.05 17,397.74 3.27 0.82 0.15 2.06 16.19 0.04
23 Hindustan Petroleum Corporation Ltd.
338.63 13,070.93 2.46 1.14 0.27 1.95 14.51 0.03
24 Indiabulls Housing Finance Ltd.
84.25 19,710.98 3.70 1.17 0.28 2.92 12.96 0.04
25 Indian Oil Corporation Ltd. 2,427.95 19,112.84 3.59 0.82 0.22 1.70 7.06 0.03
26 JSW Steel Ltd. 241.72 13,648.35 2.56 1.00 0.24 1.13 13.92 0.04
Contd...
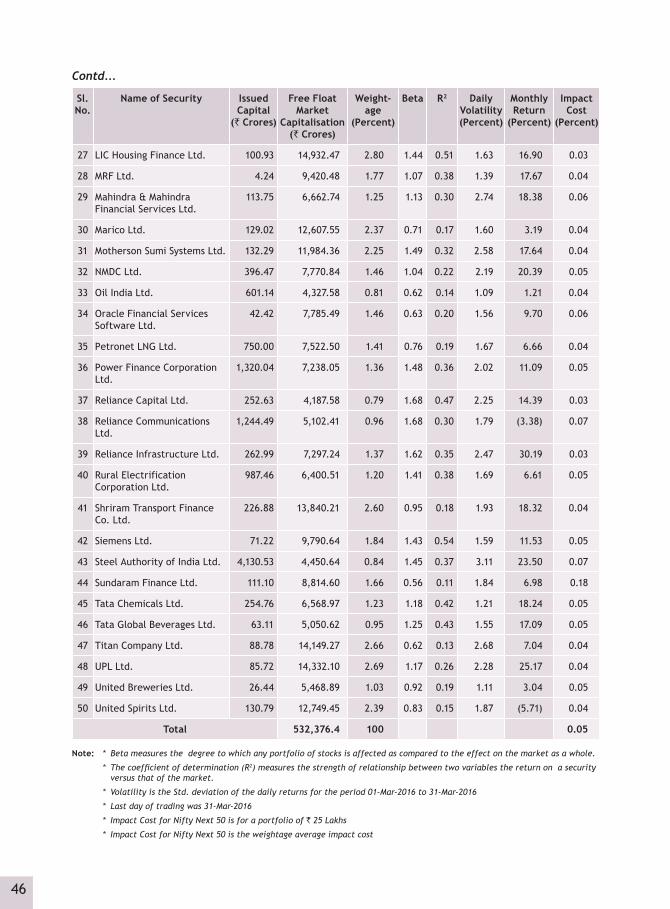
46
Sl.No.
Name of Security Issued Capital
(` Crores)
Free Float Market
Capitalisation (` Crores)
Weight-age
(Percent)
Beta R2 Daily Volatility (Percent)
Monthly Return
(Percent)
Impact Cost
(Percent)
27 LIC Housing Finance Ltd. 100.93 14,932.47 2.80 1.44 0.51 1.63 16.90 0.03
28 MRF Ltd. 4.24 9,420.48 1.77 1.07 0.38 1.39 17.67 0.04
29 Mahindra & Mahindra Financial Services Ltd.
113.75 6,662.74 1.25 1.13 0.30 2.74 18.38 0.06
30 Marico Ltd. 129.02 12,607.55 2.37 0.71 0.17 1.60 3.19 0.04
31 Motherson Sumi Systems Ltd. 132.29 11,984.36 2.25 1.49 0.32 2.58 17.64 0.04
32 NMDC Ltd. 396.47 7,770.84 1.46 1.04 0.22 2.19 20.39 0.05
33 Oil India Ltd. 601.14 4,327.58 0.81 0.62 0.14 1.09 1.21 0.04
34 Oracle Financial Services Software Ltd.
42.42 7,785.49 1.46 0.63 0.20 1.56 9.70 0.06
35 Petronet LNG Ltd. 750.00 7,522.50 1.41 0.76 0.19 1.67 6.66 0.04
36 Power Finance Corporation Ltd.
1,320.04 7,238.05 1.36 1.48 0.36 2.02 11.09 0.05
37 Reliance Capital Ltd. 252.63 4,187.58 0.79 1.68 0.47 2.25 14.39 0.03
38 Reliance Communications Ltd.
1,244.49 5,102.41 0.96 1.68 0.30 1.79 (3.38) 0.07
39 Reliance Infrastructure Ltd. 262.99 7,297.24 1.37 1.62 0.35 2.47 30.19 0.03
40 Rural Electrification Corporation Ltd.
987.46 6,400.51 1.20 1.41 0.38 1.69 6.61 0.05
41 Shriram Transport Finance Co. Ltd.
226.88 13,840.21 2.60 0.95 0.18 1.93 18.32 0.04
42 Siemens Ltd. 71.22 9,790.64 1.84 1.43 0.54 1.59 11.53 0.05
43 Steel Authority of India Ltd. 4,130.53 4,450.64 0.84 1.45 0.37 3.11 23.50 0.07
44 Sundaram Finance Ltd. 111.10 8,814.60 1.66 0.56 0.11 1.84 6.98 0.18
45 Tata Chemicals Ltd. 254.76 6,568.97 1.23 1.18 0.42 1.21 18.24 0.05
46 Tata Global Beverages Ltd. 63.11 5,050.62 0.95 1.25 0.43 1.55 17.09 0.05
47 Titan Company Ltd. 88.78 14,149.27 2.66 0.62 0.13 2.68 7.04 0.04
48 UPL Ltd. 85.72 14,332.10 2.69 1.17 0.26 2.28 25.17 0.04
49 United Breweries Ltd. 26.44 5,468.89 1.03 0.92 0.19 1.11 3.04 0.05
50 United Spirits Ltd. 130.79 12,749.45 2.39 0.83 0.15 1.87 (5.71) 0.04
Total 532,376.4 100 0.05
Note: * Beta measures the degree to which any portfolio of stocks is affected as compared to the effect on the market as a whole.
*Thecoefficientofdetermination(R2) measures the strength of relationship between two variables the return on a security versus that of the market.
* Volatility is the Std. deviation of the daily returns for the period 01-Mar-2016 to 31-Mar-2016
* Last day of trading was 31-Mar-2016
* Impact Cost for Nifty Next 50 is for a portfolio of ` 25 Lakhs
* Impact Cost for Nifty Next 50 is the weightage average impact cost
Contd...
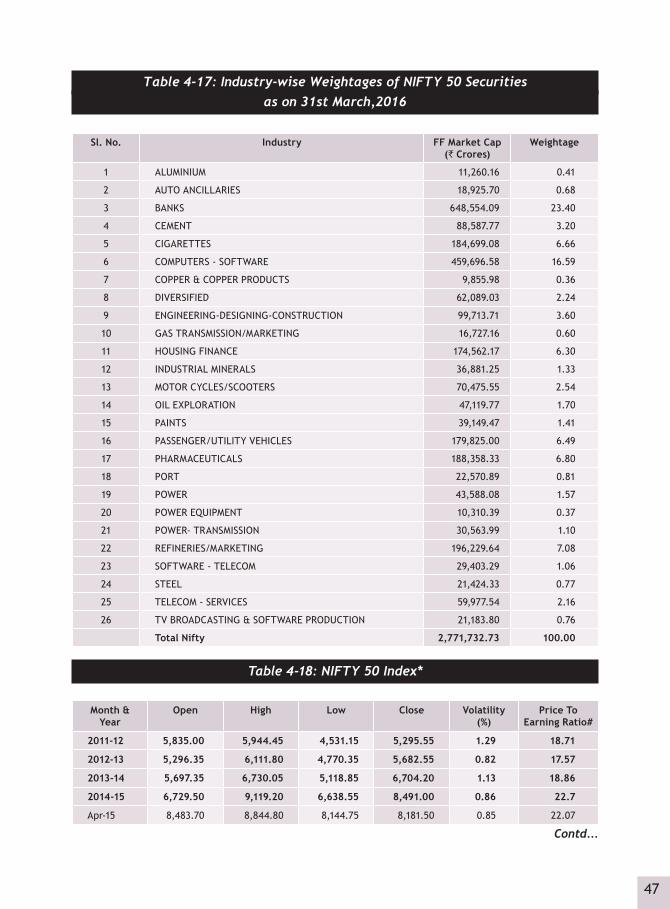
47
Table 4-17: Industry-wise Weightages of NIFTY 50 Securitiesas on 31st March,2016
Sl. No. Industry FF Market Cap (` Crores)
Weightage
1 ALUMINIUM 11,260.16 0.41
2 AUTO ANCILLARIES 18,925.70 0.68
3 BANKS 648,554.09 23.40
4 CEMENT 88,587.77 3.20
5 CIGARETTES 184,699.08 6.66
6 COMPUTERS - SOFTWARE 459,696.58 16.59
7 COPPER & COPPER PRODUCTS 9,855.98 0.36
8 DIVERSIFIED 62,089.03 2.24
9 ENGINEERING-DESIGNING-CONSTRUCTION 99,713.71 3.60
10 GAS TRANSMISSION/MARKETING 16,727.16 0.60
11 HOUSING FINANCE 174,562.17 6.30
12 INDUSTRIAL MINERALS 36,881.25 1.33
13 MOTOR CYCLES/SCOOTERS 70,475.55 2.54
14 OIL EXPLORATION 47,119.77 1.70
15 PAINTS 39,149.47 1.41
16 PASSENGER/UTILITY VEHICLES 179,825.00 6.49
17 PHARMACEUTICALS 188,358.33 6.80
18 PORT 22,570.89 0.81
19 POWER 43,588.08 1.57
20 POWER EQUIPMENT 10,310.39 0.37
21 POWER- TRANSMISSION 30,563.99 1.10
22 REFINERIES/MARKETING 196,229.64 7.08
23 SOFTWARE - TELECOM 29,403.29 1.06
24 STEEL 21,424.33 0.77
25 TELECOM - SERVICES 59,977.54 2.16
26 TV BROADCASTING & SOFTWARE PRODUCTION 21,183.80 0.76
Total Nifty 2,771,732.73 100.00
Table 4-18: NIFTY 50 Index*
Month & Year
Open High Low Close Volatility (%)
Price To Earning Ratio#
2011-12 5,835.00 5,944.45 4,531.15 5,295.55 1.29 18.71
2012-13 5,296.35 6,111.80 4,770.35 5,682.55 0.82 17.57
2013-14 5,697.35 6,730.05 5,118.85 6,704.20 1.13 18.86
2014-15 6,729.50 9,119.20 6,638.55 8,491.00 0.86 22.7
Apr-15 8,483.70 8,844.80 8,144.75 8,181.50 0.85 22.07
Contd...

48
Month & Year
Open High Low Close Volatility (%)
Price To Earning Ratio#
May-15 8,230.05 8,489.55 7,997.15 8,433.65 1.22 23.12
Jun-15 8,417.25 8,467.15 7,940.30 8,368.50 0.94 23.19
Jul-15 8,376.25 8,654.75 8,315.40 8,532.85 0.85 23.53
Aug-15 8,510.65 8,621.55 7,667.25 7,971.30 1.57 22.08
Sep-15 7,907.95 8,055.00 7,539.50 7,948.90 1.25 22.21
Oct-15 7,992.05 8,336.30 7,930.65 8,065.80 0.68 22.06
Nov-15 8,054.55 8,116.10 7,714.15 7,935.25 0.75 21.45
Dec-15 7,958.15 7,979.30 7,551.05 7,946.35 0.77 21.49
Jan-16 7,938.45 7,972.55 7,241.50 7,563.55 1.13 20.22
Feb-16 7,589.50 7,600.45 6,825.80 6,987.05 1.31 18.9
Mar-16 7,038.25 7,777.60 7,035.10 7,738.40 1.06 20.89
2015-16 8,483.70 8,844.80 6,825.80 7,738.40 1.09 20.89
Note : * Nifty 50 commenced from November 3, 1995
# At the end of the period
Volatility is calculated as standard deviation of the Natural Log of returns for the respective month/year
Table 4-19: NIFTY Next 50 Index*
Month & Year Open High Low Close Volatility (%) Price To Earning Ratio#
2011-12 11,319.20 11,758.15 8,224.15 10,450.20 1.26 15.87
2012-13 10,449.80 12,744.00 9,268.50 11,222.80 0.86 16.84
2013-14 11,238.05 13,488.20 9,951.40 13,469.05 1.14 17.28
2014-15 13,529.30 20,275.70 13,328.25 19,441.70 1.14 22.81
Apr-15 19,445.80 20,611.60 18,676.25 19,188.95 1.05 22.17
May-15 19,305.40 20,101.10 18,358.60 19,875.35 1.5 20.85
Jun-15 19,785.55 19,960.20 18,741.80 19,825.45 0.97 21.91
Jul-15 19,900.80 20,944.30 19,886.45 20,813.35 0.8 23.01
Aug-15 20,892.60 21,730.80 18,770.65 20,095.75 2.23 22.09
Sep-15 19,900.35 20,118.20 18,631.85 19,609.75 1.21 21.84
Oct-15 19,765.10 20,279.30 19,629.50 19,733.60 0.62 21.07
Nov-15 19,782.25 19,991.10 19,104.00 19,616.70 0.78 21.74
Dec-15 19,714.25 20,005.00 18,875.60 19,977.05 0.75 22.14
Jan-16 19,995.05 20,263.70 17,673.85 18,399.00 1.43 20.31
Feb-16 18,498.50 18,529.60 16,607.80 17,118.15 1.51 20.08
Mar-16 17,186.45 18,808.15 17,177.85 18,756.60 0.96 22.02
2015-16 19,445.80 21,730.80 16,607.80 18,756.60 1.25 22.02
Note : * Nifty Next 50 commenced from November 3, 1995
# At the end of the period
Volatility is calculated as standard deviation of the Natural Log of returns for the respective month/year
Contd...
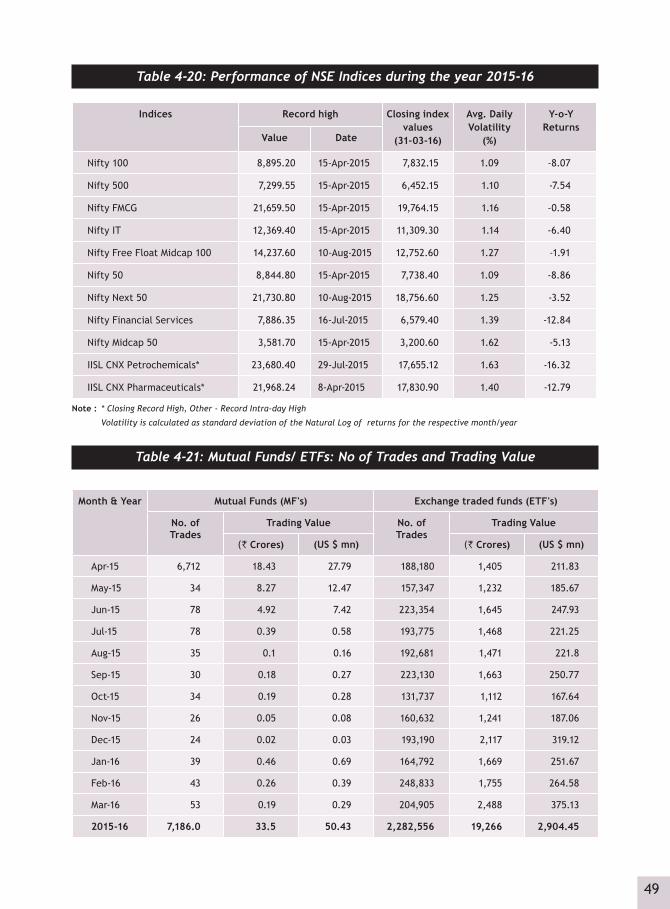
49
Table 4-20: Performance of NSE Indices during the year 2015-16
Indices Record high Closing index values
(31-03-16)
Avg. Daily Volatility
(%)
Y-o-Y Returns
Value Date
Nifty 100 8,895.20 15-Apr-2015 7,832.15 1.09 -8.07
Nifty 500 7,299.55 15-Apr-2015 6,452.15 1.10 -7.54
Nifty FMCG 21,659.50 15-Apr-2015 19,764.15 1.16 -0.58
Nifty IT 12,369.40 15-Apr-2015 11,309.30 1.14 -6.40
Nifty Free Float Midcap 100 14,237.60 10-Aug-2015 12,752.60 1.27 -1.91
Nifty 50 8,844.80 15-Apr-2015 7,738.40 1.09 -8.86
Nifty Next 50 21,730.80 10-Aug-2015 18,756.60 1.25 -3.52
Nifty Financial Services 7,886.35 16-Jul-2015 6,579.40 1.39 -12.84
Nifty Midcap 50 3,581.70 15-Apr-2015 3,200.60 1.62 -5.13
IISL CNX Petrochemicals* 23,680.40 29-Jul-2015 17,655.12 1.63 -16.32
IISL CNX Pharmaceuticals* 21,968.24 8-Apr-2015 17,830.90 1.40 -12.79
Note : * Closing Record High, Other - Record Intra-day High
Volatility is calculated as standard deviation of the Natural Log of returns for the respective month/year
Table 4-21: Mutual Funds/ ETFs: No of Trades and Trading Value
Month & Year Mutual Funds (MF's) Exchange traded funds (ETF's)
No. of Trades
Trading Value No. of Trades
Trading Value
(` Crores) (US $ mn) (` Crores) (US $ mn)
Apr-15 6,712 18.43 27.79 188,180 1,405 211.83
May-15 34 8.27 12.47 157,347 1,232 185.67
Jun-15 78 4.92 7.42 223,354 1,645 247.93
Jul-15 78 0.39 0.58 193,775 1,468 221.25
Aug-15 35 0.1 0.16 192,681 1,471 221.8
Sep-15 30 0.18 0.27 223,130 1,663 250.77
Oct-15 34 0.19 0.28 131,737 1,112 167.64
Nov-15 26 0.05 0.08 160,632 1,241 187.06
Dec-15 24 0.02 0.03 193,190 2,117 319.12
Jan-16 39 0.46 0.69 164,792 1,669 251.67
Feb-16 43 0.26 0.39 248,833 1,755 264.58
Mar-16 53 0.19 0.29 204,905 2,488 375.13
2015-16 7,186.0 33.5 50.43 2,282,556 19,266 2,904.45

50
Tab
le 4
-22:
Set
tlem
ent
Stat
isti
cs f
or C
M S
egm
ent
Mon
th/
Year
No. o
f Tr
ades
(L
akh)
Trad
ed
Qua
ntit
y (L
akh)
Deliv
ered
Q
uant
ity
(Lak
h)
% of
De-
liver
ed
Qua
ntit
y to
Tra
ded
Qua
ntit
y
Turn
over
( `
Cro
res)
Deliv
ered
Va
lue
(` C
rore
s)
% of
De-
liver
ed
Valu
e to
Tot
al
Turn
over
Deliv
ered
Q
uant
ity
in D
emat
M
ode
(Lak
h)
% of
De
mat
De
liver
ed
Qua
ntit
y to
Tot
al
Deliv
ered
Q
uant
ity
Deliv
ered
Va
lue
in
Dem
at
Mod
e (`
Cro
res)
Shor
t De
liver
y (A
ucti
oned
qu
anti
ty)
(Lak
h)
% of
Sh
ort
Deliv
ery
to
Deliv
er-
able
Fund
s Pa
y-in
(` C
rore
s)
Secu
riti
es
Pay-
in(`
Cro
res)
2011
-12
14,3
721,
605,
205
443,
232
27.6
12,
803,
889.
2178
4,40
727
.98
443,
232
100
784,
407
702
0.16
251,
754
785,
268
2012
-13
13,5
741,
644,
259
459,
349
27.9
42,
700,
656.
3179
6,78
429
.50
459,
349
100
796,
784
661
0.14
251,
034
797,
504
2013
-14
14,2
571,
505,
133
423,
417
28.1
32,
771,
237.
6482
2,44
629
.68
423,
330
100
822,
386
600
0.14
271,
841
823,
042
2014
-15
18,3
382,
325,
818
638,
683
27.4
64,
325,
175.
001,
276,
859
29.5
263
8,12
910
01,
274,
071
907
0.14
366,
074
1,27
6,85
9
Apr
-15
1,48
916
0,31
249
,574
30.9
236
7,38
1.99
123,
312
33.5
749
,574
100
123,
312
110
0.22
47,2
9812
3,38
3
May
-15
1,43
014
7,96
945
,268
30.5
933
3,99
8.68
102,
257
30.6
245
,268
100
102,
257
226
0.5
35,1
9010
2,35
9
Jun-
151,
570
181,
627
52,7
1429
.02
367,
299.
3011
5,42
931
.43
52,7
1410
011
5,42
987
0.16
35,5
1011
5,50
1
Jul-1
51,
711
189,
232
55,1
1329
.12
367,
726.
6910
8,81
529
.59
55,1
1310
010
8,81
587
0.16
32,0
6410
8,89
6
Aug-
151,
864
219,
788
63,2
2228
.77
421,
684.
5712
4,75
729
.59
63,2
2210
012
4,75
783
0.13
36,9
3812
4,85
7
Sep-
151,
491
158,
420
43,7
0427
.59
327,
141.
3896
,467
29.4
943
,704
100
96,4
6792
0.21
31,3
1796
,542
Oct
-15
1,47
517
6,93
546
,506
26.2
833
2,08
0.27
94,3
8828
.42
46,5
0610
094
,388
630.
1425
,526
94,4
45
Nov
-15
1,31
315
6,62
944
,157
28.1
930
0,30
8.29
89,3
5229
.75
44,1
5710
089
,352
830.
1924
,536
89,4
24
Dec
-15
1,51
820
2,90
057
,272
28.2
334
6,19
2.71
103,
340
29.8
557
,272
100
103,
340
930.
1626
,681
103,
416
Jan-
161,
521
205,
600
57,8
0628
.12
342,
713.
6895
,137
27.7
657
,806
100
95,1
3777
0.13
29,5
4495
,214
Feb-
161,
591
195,
769
52,9
9627
.07
347,
809.
3095
,759
27.5
352
,996
100
95,7
5988
0.16
29,9
2295
,847
Mar
-16
1,51
118
2,68
049
,895
27.3
134
8,59
0.65
102,
720
29.4
749
,895
100
102,
720
470.
0933
,878
102,
777
2015
-16
18,4
842,
177,
861
618,
225
28.3
94,
202,
927.
511,
251,
732
29.7
861
8,22
510
01,
251,
732
1134
0.18
388,
405
1,25
2,65
8

Debt Market Segment 5

52
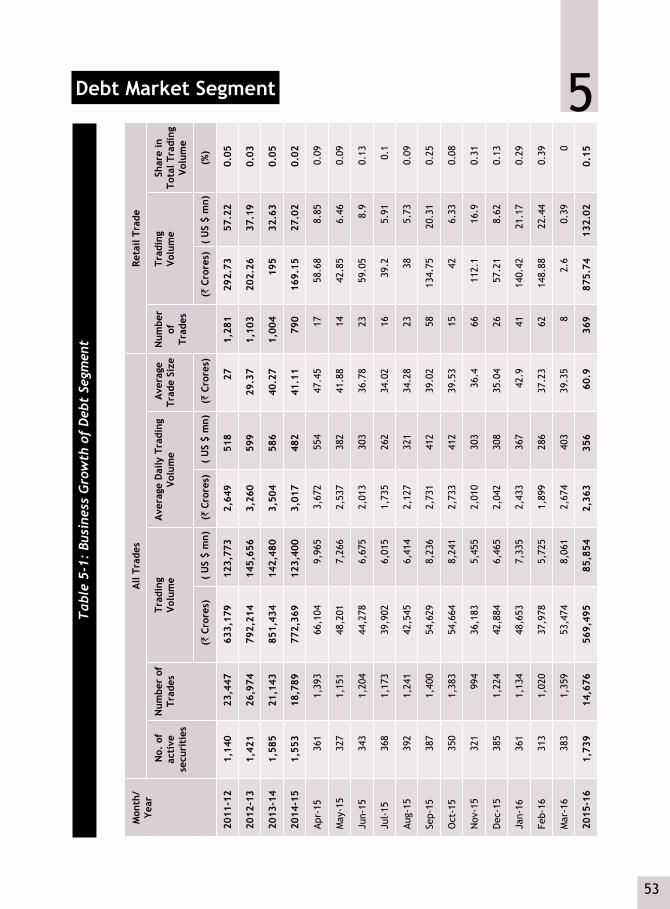
53
5Debt Market SegmentT
able
5-1
: Bu
sine
ss G
row
th o
f D
ebt
Segm
ent
Mon
th/
Year
All
Trad
esRe
tail
Trad
e
No.
of
acti
ve
secu
riti
es
Num
ber
of
Trad
esTr
adin
g Vo
lum
eA
vera
ge D
aily
Tra
ding
Vo
lum
e A
vera
ge
Trad
e Si
zeN
umbe
r of
Tr
ades
Trad
ing
Volu
me
Shar
e in
To
tal T
radi
ng
Volu
me
(`
Cror
es)
( U
S $
mn)
(`
Cror
es)
( U
S $
mn)
(`
Cror
es)
(`
Cror
es)
( U
S $
mn)
(%)
2011
-12
1,14
023
,447
633,
179
123,
773
2,64
951
827
1,28
129
2.73
57.2
20.
05
2012
-13
1,42
126
,974
792,
214
145,
656
3,26
059
929
.37
1,10
320
2.26
37.1
90.
03
2013
-14
1,58
521
,143
851,
434
142,
480
3,50
458
640
.27
1,00
419
532
.63
0.05
2014
-15
1,55
318
,789
772,
369
123,
400
3,01
748
241
.11
790
169.
1527
.02
0.02
Apr-
1536
11,
393
66,1
049,
965
3,67
255
447
.45
1758
.68
8.85
0.09
May
-15
327
1,15
148
,201
7,26
62,
537
382
41.8
814
42.8
56.
460.
09
Jun-
1534
31,
204
44,2
786,
675
2,01
330
336
.78
2359
.05
8.9
0.13
Jul-
1536
81,
173
39,9
026,
015
1,73
526
234
.02
1639
.25.
910.
1
Aug-
1539
21,
241
42,5
456,
414
2,12
732
134
.28
2338
5.73
0.09
Sep-
1538
71,
400
54,6
298,
236
2,73
141
239
.02
5813
4.75
20.3
10.
25
Oct
-15
350
1,38
354
,664
8,24
12,
733
412
39.5
315
426.
330.
08
Nov
-15
321
994
36,1
835,
455
2,01
030
336
.466
112.
116
.90.
31
Dec
-15
385
1,22
442
,884
6,46
52,
042
308
35.0
426
57.2
18.
620.
13
Jan-
1636
11,
134
48,6
537,
335
2,43
336
742
.941
140.
4221
.17
0.29
Feb-
1631
31,
020
37,9
785,
725
1,89
928
637
.23
6214
8.88
22.4
40.
39
Mar
-16
383
1,35
953
,474
8,06
12,
674
403
39.3
58
2.6
0.39
0
2015
-16
1,73
914
,676
569,
495
85,8
542,
363
356
60.9
369
875.
7413
2.02
0.15
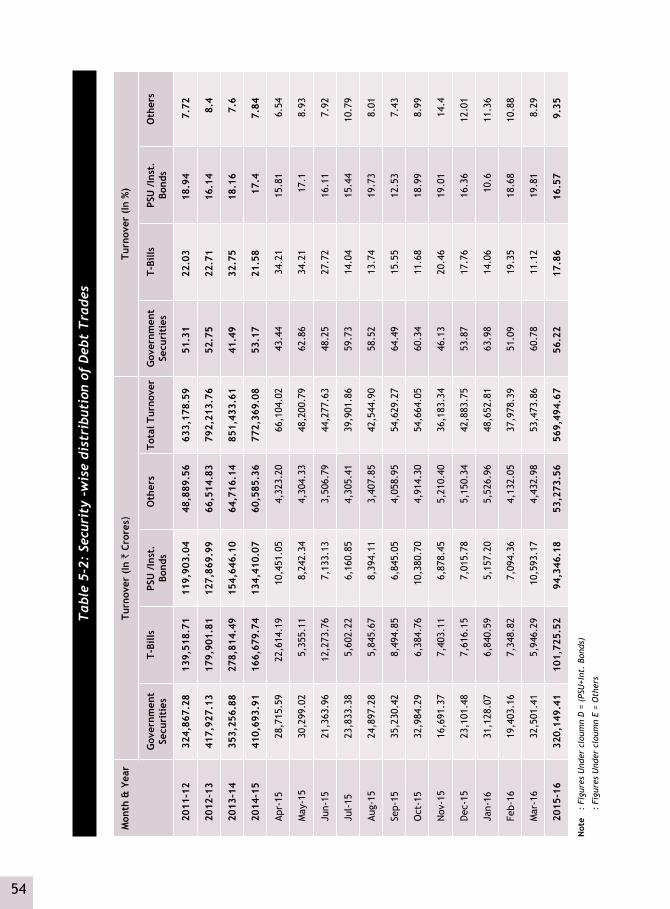
54
Tab
le 5
-2:
Secu
rity
-w
ise
dist
ribu
tion
of
Deb
t T
rade
s
Mon
th &
Yea
rTu
rnov
er (
In `
Cro
res)
Turn
over
(In
%)
Gov
ernm
ent
Secu
riti
esT-
Bills
PSU
/In
st.
Bond
sO
ther
sTo
tal T
urno
ver
Gov
ernm
ent
Secu
riti
esT-
Bills
PSU
/In
st.
Bond
sO
ther
s
2011
-12
324
,867
.28
139
,518
.71
119
,903
.04
48,
889.
56
633
,178
.59
51.3
122
.03
18.9
47.
72
2012
-13
417
,927
.13
179
,901
.81
127
,869
.99
66,
514.
83
792
,213
.76
52.7
522
.71
16.1
48.
4
2013
-14
353
,256
.88
278
,814
.49
154
,646
.10
64,
716.
14
851
,433
.61
41.4
932
.75
18.1
67.
6
2014
-15
410
,693
.91
166
,679
.74
134
,410
.07
60,
585.
36
772
,369
.08
53.1
721
.58
17.4
7.84
Apr-
15 2
8,71
5.59
2
2,61
4.19
1
0,45
1.05
4
,323
.20
66,
104.
02
43.4
434
.21
15.8
16.
54
May
-15
30,
299.
02
5,3
55.1
1 8
,242
.34
4,3
04.3
3 4
8,20
0.79
62
.86
34.2
117
.18.
93
Jun-
15 2
1,36
3.96
1
2,27
3.76
7
,133
.13
3,5
06.7
9 4
4,27
7.63
48
.25
27.7
216
.11
7.92
Jul-
15 2
3,83
3.38
5
,602
.22
6,1
60.8
5 4
,305
.41
39,
901.
86
59.7
314
.04
15.4
410
.79
Aug-
15 2
4,89
7.28
5
,845
.67
8,3
94.1
1 3
,407
.85
42,
544.
90
58.5
213
.74
19.7
38.
01
Sep-
15 3
5,23
0.42
8
,494
.85
6,8
45.0
5 4
,058
.95
54,
629.
27
64.4
915
.55
12.5
37.
43
Oct
-15
32,
984.
29
6,3
84.7
6 1
0,38
0.70
4
,914
.30
54,
664.
05
60.3
411
.68
18.9
98.
99
Nov
-15
16,
691.
37
7,4
03.1
1 6
,878
.45
5,2
10.4
0 3
6,18
3.34
46
.13
20.4
619
.01
14.4
Dec
-15
23,
101.
48
7,6
16.1
5 7
,015
.78
5,1
50.3
4 4
2,88
3.75
53
.87
17.7
616
.36
12.0
1
Jan-
16 3
1,12
8.07
6
,840
.59
5,1
57.2
0 5
,526
.96
48,
652.
81
63.9
814
.06
10.6
11.3
6
Feb-
16 1
9,40
3.16
7
,348
.82
7,0
94.3
6 4
,132
.05
37,
978.
39
51.0
919
.35
18.6
810
.88
Mar
-16
32,
501.
41
5,9
46.2
9 1
0,59
3.17
4
,432
.98
53,
473.
86
60.7
811
.12
19.8
18.
29
2015
-16
320
,149
.41
101
,725
.52
94,
346.
18
53,
273.
56
569
,494
.67
56.2
217
.86
16.5
79.
35
Not
e :
Figu
res
Und
er c
loum
n D
= (
PSU
+Int
. Bo
nds)
:
Figu
res
Und
er c
loum
n E
= O
ther
s
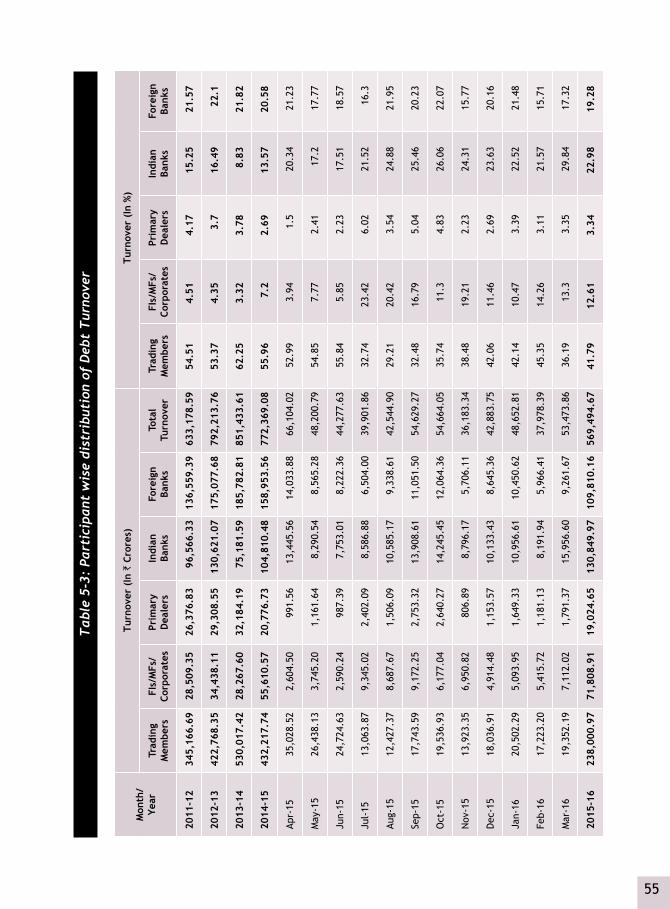
55
Tab
le 5
-3:
Part
icip
ant
wis
e di
stri
buti
on o
f D
ebt
Tur
nove
r
Mon
th/
Year
Turn
over
(In
` C
rore
s) T
urno
ver
(In
%)
Trad
ing
Mem
bers
FIs/
MFs
/Co
rpor
ates
Prim
ary
Dea
lers
Indi
an
Bank
sFo
reig
n Ba
nks
Tota
lTu
rnov
erTr
adin
gM
embe
rsFI
s/M
Fs/
Corp
orat
esPr
imar
yD
eale
rsIn
dian
Bank
sFo
reig
n Ba
nks
2011
-12
345,
166.
6928
,509
.35
26,3
76.8
396
,566
.33
136,
559.
3963
3,17
8.59
54.5
14.
514.
1715
.25
21.5
7
2012
-13
422,
768.
3534
,438
.11
29,3
08.5
513
0,62
1.07
175,
077.
6879
2,21
3.76
53.3
74.
353.
716
.49
22.1
2013
-14
530,
017.
4228
,267
.60
32,1
84.1
975
,181
.59
185,
782.
8185
1,43
3.61
62.2
53.
323.
788.
8321
.82
2014
-15
432,
217.
7455
,610
.57
20,7
76.7
310
4,81
0.48
158,
953.
5677
2,36
9.08
55.9
67.
22.
6913
.57
20.5
8
Apr-
1535
,028
.52
2,60
4.50
991.
5613
,445
.56
14,0
33.8
866
,104
.02
52.9
93.
941.
520
.34
21.2
3
May
-15
26,4
38.1
33,
745.
201,
161.
648,
290.
548,
565.
2848
,200
.79
54.8
57.
772.
4117
.217
.77
Jun-
1524
,724
.63
2,59
0.24
987.
397,
753.
018,
222.
3644
,277
.63
55.8
45.
852.
2317
.51
18.5
7
Jul-
1513
,063
.87
9,34
5.02
2,40
2.09
8,58
6.88
6,50
4.00
39,9
01.8
632
.74
23.4
26.
0221
.52
16.3
Aug-
1512
,427
.37
8,68
7.67
1,50
6.09
10,5
85.1
79,
338.
6142
,544
.90
29.2
120
.42
3.54
24.8
821
.95
Sep-
1517
,743
.59
9,17
2.25
2,75
3.32
13,9
08.6
111
,051
.50
54,6
29.2
732
.48
16.7
95.
0425
.46
20.2
3
Oct
-15
19,5
36.9
36,
177.
042,
640.
2714
,245
.45
12,0
64.3
654
,664
.05
35.7
411
.34.
8326
.06
22.0
7
Nov
-15
13,9
23.3
56,
950.
8280
6.89
8,79
6.17
5,70
6.11
36,1
83.3
438
.48
19.2
12.
2324
.31
15.7
7
Dec
-15
18,0
36.9
14,
914.
481,
153.
5710
,133
.43
8,64
5.36
42,8
83.7
542
.06
11.4
62.
6923
.63
20.1
6
Jan-
1620
,502
.29
5,09
3.95
1,64
9.33
10,9
56.6
110
,450
.62
48,6
52.8
142
.14
10.4
73.
3922
.52
21.4
8
Feb-
1617
,223
.20
5,41
5.72
1,18
1.13
8,19
1.94
5,96
6.41
37,9
78.3
945
.35
14.2
63.
1121
.57
15.7
1
Mar
-16
19,3
52.1
97,
112.
021,
791.
3715
,956
.60
9,26
1.67
53,4
73.8
636
.19
13.3
3.35
29.8
417
.32
2015
-16
238,
000.
9771
,808
.91
19,0
24.6
513
0,84
9.97
109,
810.
1656
9,49
4.67
41.7
912
.61
3.34
22.9
819
.28

56
Table 5-4: Share of Top ‘N’ Securities/ Trading Members/Participants
in Turnover in Debt Segment
Year In Percent
Top 5 Top 10 Top 25 Top 50 Top 100
Securities
2011-12 36.35 44.22 52.63 61.54 72.09
2012-13 34.02 44.36 53.04 62.32 73.29
2013-14 17.83 29.24 41.81 53.82 67.82
2014-15 29.00 37.30 49.94 60.74 71.94
2015-16 23.51 29.94 43.58 56.01 69.04
Trading Members
2011-12 77.50 89.14 99.41 100.00 -
2012-13 81.83 91.18 99.46 100.00
2013-14 82.13 92.14 99.82 100.00 -
2014-15 79.20 91.75 99.98 100.00 -
2015-16 79.13 90.27 99.91 100.00 -
Participants
2011-12 20.60 33.77 44.64 45.50 -
2012-13 21.73 34.52 45.64 46.65 -
2013-14 21.11 29.89 37.22 37.72 -
2014-15 21.28 31.77 43.54 44.02 -
2015-16 23.51 29.94 43.57 56.00 69.03
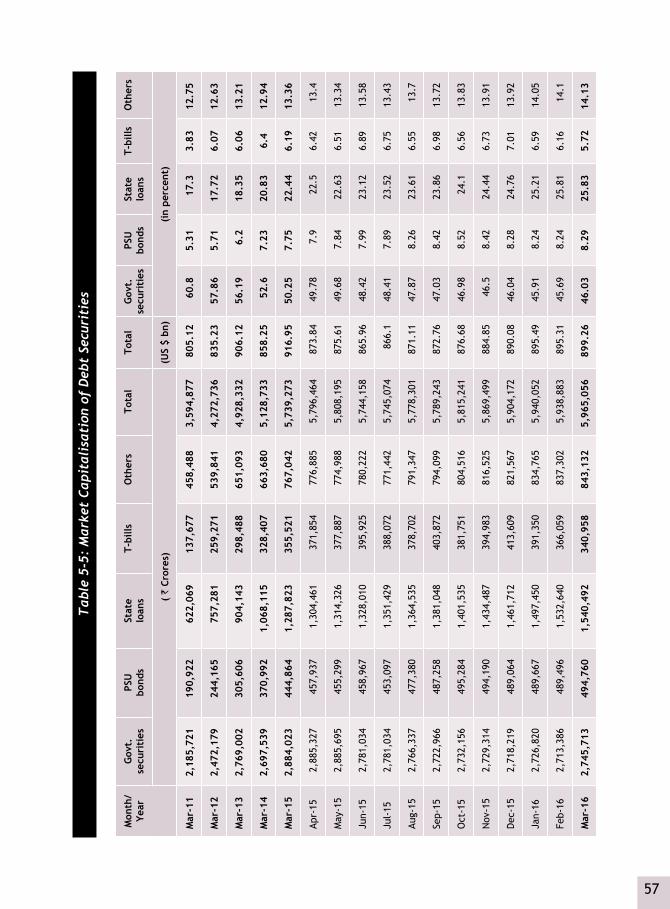
57
Tab
le 5
-5:
Mar
ket
Capi
tali
sati
on o
f D
ebt
Secu
riti
es
Mon
th/
Year
Gov
t.
secu
riti
esPS
U
bond
sSt
ate
loan
sT-
bills
Oth
ers
Tota
lTo
tal
Gov
t.
secu
riti
esPS
U
bond
sSt
ate
loan
sT-
bills
Oth
ers
( `
Cror
es)
(US
$ bn
)(i
n pe
rcen
t)
Mar
-11
2,18
5,72
119
0,92
262
2,06
913
7,67
745
8,48
83,
594,
877
805.
1260
.85.
3117
.33.
8312
.75
Mar
-12
2,47
2,17
924
4,16
575
7,28
125
9,27
153
9,84
14,
272,
736
835.
2357
.86
5.71
17.7
26.
0712
.63
Mar
-13
2,76
9,00
230
5,60
690
4,14
329
8,48
865
1,09
34,
928,
332
906.
1256
.19
6.2
18.3
56.
0613
.21
Mar
-14
2,69
7,53
937
0,99
21,
068,
115
328,
407
663,
680
5,12
8,73
385
8.25
52.6
7.23
20.8
36.
412
.94
Mar
-15
2,88
4,02
344
4,86
41,
287,
823
355,
521
767,
042
5,73
9,27
391
6.95
50.2
57.
7522
.44
6.19
13.3
6
Apr-
152,
885,
327
457,
937
1,30
4,46
137
1,85
477
6,88
55,
796,
464
873.
8449
.78
7.9
22.5
6.42
13.4
May
-15
2,88
5,69
545
5,29
91,
314,
326
377,
887
774,
988
5,80
8,19
587
5.61
49.6
87.
8422
.63
6.51
13.3
4
Jun-
152,
781,
034
458,
967
1,32
8,01
039
5,92
578
0,22
25,
744,
158
865.
9648
.42
7.99
23.1
26.
8913
.58
Jul-
152,
781,
034
453,
097
1,35
1,42
938
8,07
277
1,44
25,
745,
074
866.
148
.41
7.89
23.5
26.
7513
.43
Aug-
152,
766,
337
477,
380
1,36
4,53
537
8,70
279
1,34
75,
778,
301
871.
1147
.87
8.26
23.6
16.
5513
.7
Sep-
152,
722,
966
487,
258
1,38
1,04
840
3,87
279
4,09
95,
789,
243
872.
7647
.03
8.42
23.8
66.
9813
.72
Oct
-15
2,73
2,15
649
5,28
41,
401,
535
381,
751
804,
516
5,81
5,24
187
6.68
46.9
88.
5224
.16.
5613
.83
Nov
-15
2,72
9,31
449
4,19
01,
434,
487
394,
983
816,
525
5,86
9,49
988
4.85
46.5
8.42
24.4
46.
7313
.91
Dec
-15
2,71
8,21
948
9,06
41,
461,
712
413,
609
821,
567
5,90
4,17
289
0.08
46.0
48.
2824
.76
7.01
13.9
2
Jan-
162,
726,
820
489,
667
1,49
7,45
039
1,35
083
4,76
55,
940,
052
895.
4945
.91
8.24
25.2
16.
5914
.05
Feb-
162,
713,
386
489,
496
1,53
2,64
036
6,05
983
7,30
25,
938,
883
895.
3145
.69
8.24
25.8
16.
1614
.1
Mar
-16
2,74
5,71
349
4,76
01,
540,
492
340,
958
843,
132
5,96
5,05
689
9.26
46.0
38.
2925
.83
5.72
14.1
3

58
Table 5-6: FIMMDA NSE MIBID/ MIBOR Rates 2015-16
Month/Date
Overnight at 9:40 a.m
3 Day at 9:40 a.m.*
14 day at 11:30 a.m.
1 month rate 11:30 a.m.
3 month rate at 11:30 a.m.
MIBID MIBOR MIBID MIBOR MIBID MIBOR MIBID MIBOR MIBID MIBOR
Apr-12 8.32 8.37 8.32 8.38 8.89 9.06 9.11 9.33 9.32 9.64
May-12 8.08 8.14 8.16 8.22 8.84 9.11 9.08 9.33 9.42 9.78
Jun-12 8.23 8.28 8.3 8.36 8.95 9.15 9.08 9.3 9.21 9.41
Jul-12 8.01 8.06 7.98 8.03 8.32 8.55 8.61 8.88 8.93 9.24
Aug-12 7.99 8.04 8 8.04 8.25 8.43 8.47 8.66 8.71 8.95
Sep-12 8.02 8.07 8.05 8.1 8.28 8.45 8.46 8.67 8.59 8.81
Oct-12 8.05 8.1 8.06 8.1 8.12 8.28 8.26 8.45 8.44 8.66
Nov-12 8.05 8.09 8.05 8.1 8.06 8.27 8.23 8.46 8.45 8.73
Dec-12 8.19 8.23 8.13 8.18 8.35 8.5 8.52 8.7 8.7 8.92
Jan-13 7.8 7.85 8.05 8.09 8.06 8.2 8.22 8.36 8.64 8.81
Feb-13 7.85 7.9 7.89 7.95 8.16 8.27 8.61 8.74 9.39 9.63
Mar-13 8.78 8.98 13.49 14.44 9.49 9.9 9.3 9.63 9.47 9.78
Apr-13 7.57 7.62 7.55 7.6 8.02 8.18 8.21 8.34 8.53 8.65
May-13 7.26 7.3 7.25 7.29 7.74 7.92 7.94 8.11 8.24 8.42
Jun-13 7.26 7.33 7.28 7.34 7.83 7.99 8.05 8.22 8.36 8.52
Jul-13 10.11 10.17 10 10.11 9.9 10.27 10.22 10.61 10.25 10.75
Aug-13 10.29 10.36 10.3 10.36 10.63 10.77 10.94 11.14 11.18 11.41
Sep-13 9.93 10 9.51 9.56 9.74 9.86 9.83 9.94 9.96 10.08
Oct-13 8.67 8.72 9 9.05 8.86 8.93 8.91 8.98 9.07 9.12
Nov-13 7.63 7.72 7.67 7.75 8.81 8.95 8.87 9.03 9.07 9.21
Dec-13 8.98 9.07 8.75 8.8 8.77 8.91 8.9 9.02 8.98 9.06
Jan-14 8.07 8.12 8.09 8.14 8.59 8.68 8.87 8.93 9.23 9.4
Feb-14 8.03 8.08 8.05 8.1 8.6 8.67 8.72 8.82 9.46 9.68
Mar-14 7.78 8.53 12.25 13.24 9.81 9.99 9.65 9.89 9.58 9.77
Apr-14 8.65 8.7 8.64 8.7 8.61 8.77 8.76 8.98 9.03 9.23
Contd...

59
Month/Date
Overnight at 9:40 a.m
3 Day at 9:40 a.m.*
14 day at 11:30 a.m.
1 month rate 11:30 a.m.
3 month rate at 11:30 a.m.
MIBID MIBOR MIBID MIBOR MIBID MIBOR MIBID MIBOR MIBID MIBOR
May-14 7.86 7.92 8 8.04 8.33 8.44 8.52 8.65 8.89 9.01
Jun-14 8.97 9.02 8.36 8.45 8.33 8.44 8.54 8.66 8.68 8.79
Jul-14 8.07 8.12 8.96 9.02 8.44 8.56 8.57 8.69 8.76 8.87
Aug-14 7.97 8.02 8.02 8.07 8.22 8.36 8.53 8.67 8.77 8.91
Sep-14 8.15 8.19 8 8.05 8.32 8.5 8.57 8.77 8.73 8.9
Oct-14 7.33 7.39 7.9 7.96 8.2 8.42 8.31 8.54 8.56 8.75
Nov-14 7.98 8.02 7.98 8.03 8.12 8.28 8.35 8.48 8.53 8.66
Dec-14 8.94 9.01 8.15 8.2 8.39 8.52 8.46 8.59 8.54 8.65
Jan-15 7.45 7.53 7.86 7.9 8.13 8.23 8.25 8.35 8.48 8.59
Feb-15 7.75 7.79 7.76 7.8 8.11 8.23 8.26 8.38 8.54 8.66
Mar-15 8.28 8.35 13.83 14.93 8.44 8.65 8.59 8.76 8.48 8.64
Apr-15 7.46 7.52 7.69 7.74 7.93 8 8.02 8.09 8.26 8.33
May-15 7.53 7.59 7.64 7.68 7.86 7.97 7.94 8.06 8.14 8.25
Jun-15 7.24 7.28 7.2 7.24 7.74 7.84 7.92 8 8.06 8.14
Jul-15 7.21 7.26 7.19 7.22 7.42 7.55 7.55 7.66 7.75 7.86
Aug-15 7.4 7.52 7.47 7.58 7.66 7.77
Sep-15 7.44 7.56 7.56 7.68 7.68 7.8
Oct-15
Nov-15
Dec-15
Jan-16
Feb-16
Mar-16
Note: * * last 3 day rate for each month
Computation & Dissemination of FIMMDA-NSE MIBID - MIBOR TERM Rates for 14 Days, 1 month and 3 months by NSE has been discontinued w.e.f Septemeber 23, 2015.
Computation & Dissemination of FIMMDA-NSE MIBID - MIBOR for Overnight call rates and 3 Day MIBID - MIBOR by NSE has been discontinued w.e.f July 22, 2015.
Contd...

60
Table 5-7: 1-day Value-at Risk (99%) for Government of India Securities Traded as on June 30, 2015
Sec_type Security Issue_Name Normal Weighted Normal
Historical_Simulation
Weighted Historical_Simulation
EVT Clean Price (off NSE-ZCYC)
Accrued_Interest
GS CG2017 7.99% 0.9310 0.5500 1.1790 0.9580 0.9700 100.2810 3.7953
GS CG2017 8.07% 0.8600 0.5050 1.0710 0.4010 0.9110 100.4120 3.6988
GS CG2022 8.35% 1.2020 0.5130 1.3010 0.3630 1.0170 100.8100 1.0669
GS CG2023 7.16% 1.3250 0.5910 1.4240 0.5450 1.1110 93.8440 0.7956
GS CG2023 7.68% 1.3630 0.6190 1.4640 0.7420 1.1410 96.5750 0.3200
GS CG2024 8.40% 1.4020 0.6430 1.4750 0.7700 1.1760 100.8550 3.5467
GS CG2025 7.72% 1.5390 0.7140 1.6750 0.7830 1.2950 96.2250 0.7506
GS CG2026 8.15% 1.7390 0.7980 1.9020 1.0730 1.5140 98.8500 0.8150
GS CG2026 8.33% 1.6680 0.7680 1.8600 0.6420 1.4470 100.2080 3.9568
GS CG2030 7.88% 2.3660 1.0770 2.8030 0.7480 2.0820 97.3290 1.0726
GS CG2033 8.24% 3.1470 1.5710 4.0000 0.8280 2.7780 99.1360 1.1444
GS CG2036 8.33% 3.6890 2.0070 4.8100 4.0110 3.4370 100.0510 0.5322
GS CG2040 8.30% 4.4900 2.7430 5.8670 3.3880 4.3560 99.9070 4.1039
GS CG2041 8.83% 4.6340 2.9130 6.0950 2.3620 4.5170 105.6000 0.4415
GS CG2045 8.13% 5.2990 3.5710 7.2790 3.1540 5.1540 98.2410 0.1807
TB 364D 61015 0.2990 0.1440 0.3860 0.2250 0.3220 98.0180 0.0000
TB 91D 230715 0.0830 0.0360 0.1090 0.0560 0.0870 99.5340 0.0000
Note: 1-day VaR(99%) measure for GoI Securities that traded on NSE-WDM
Table 5-8: Corporate Bond Trades at NSE (2015-16)
Month/Year No. of Trades Traded Value (` Crores)
2012-13 21,144 242,112
Apr-13 2,422 29,911
May-13 2,299 35,031
Jun-13 1,934 30,309
Jul-13 2,266 36,076
Aug-13 1,541 20,817
Contd...
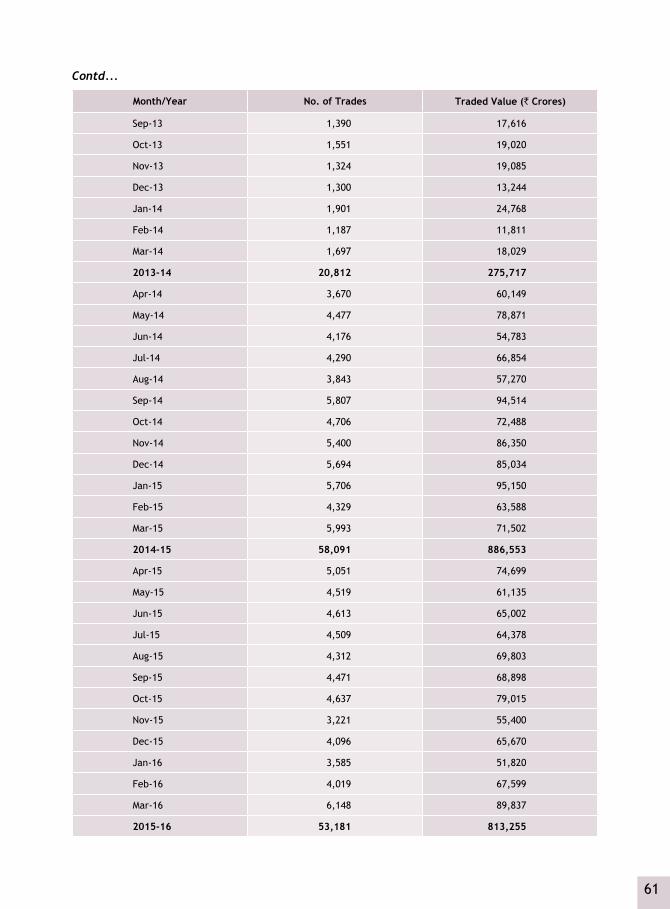
61
Month/Year No. of Trades Traded Value (` Crores)
Sep-13 1,390 17,616
Oct-13 1,551 19,020
Nov-13 1,324 19,085
Dec-13 1,300 13,244
Jan-14 1,901 24,768
Feb-14 1,187 11,811
Mar-14 1,697 18,029
2013-14 20,812 275,717
Apr-14 3,670 60,149
May-14 4,477 78,871
Jun-14 4,176 54,783
Jul-14 4,290 66,854
Aug-14 3,843 57,270
Sep-14 5,807 94,514
Oct-14 4,706 72,488
Nov-14 5,400 86,350
Dec-14 5,694 85,034
Jan-15 5,706 95,150
Feb-15 4,329 63,588
Mar-15 5,993 71,502
2014-15 58,091 886,553
Apr-15 5,051 74,699
May-15 4,519 61,135
Jun-15 4,613 65,002
Jul-15 4,509 64,378
Aug-15 4,312 69,803
Sep-15 4,471 68,898
Oct-15 4,637 79,015
Nov-15 3,221 55,400
Dec-15 4,096 65,670
Jan-16 3,585 51,820
Feb-16 4,019 67,599
Mar-16 6,148 89,837
2015-16 53,181 813,255
Contd...

62
Equity Futures & Options Segment 6

64

65
6Equity Futures & Options SegmentT
able
6-1
: Bu
sine
ss G
row
th o
f Fu
ture
s &
Opt
ions
Mar
ket
Segm
ent
Mont
h/Ye
arIn
dex
Futu
res
Stoc
k Fu
ture
s In
dex
Optio
ns S
tock
Opt
ions
Tota
lAv
erag
e Da
ily
Turn
over
Call
Put
Call
Put
No. o
f Co
ntra
cts
Trad
ed
Turn
over
No.
of
Cont
ract
s Tr
aded
Tur
nove
rNo
. of
Cont
ract
s T
rade
d
Notio
nal
Turn
over
No. o
f Co
ntra
cts
Trad
ed
Notio
nal
Turn
over
No. o
f Co
ntra
cts
Trad
ed
Not
iona
l Tu
rnov
erNo
. of
Cont
ract
s Tr
aded
Notio
nal
Turn
over
No. o
f Co
ntra
cts
Trad
ed
Turn
over
( `
Cror
es)
( `
Cror
es)
( ` C
rore
s)( `
Cro
res)
( ` C
rore
s)(`
Cro
res)
(US
$ bn
)(`
Cro
res)
(US
$ bn
)
Apr-1
46,
561,
718
220,
282.
12
14,6
84,0
79 54
1,30
2.87
24
,308
,260
841,
841.
75
26,9
27,7
91 88
9,74
2.34
3,
834,
234
149,
890.
84
1,89
0,37
8 68
,023
.59
78,2
06,4
60 2,
711,
083.
52
433.
14 15
0,61
5.75
24.
06
May-1
410
,606
,833
383,
586.
50
22,5
71,5
01 80
8,88
2.22
39
,276
,005
1,48
2,88
2.02
32
,215
,520
1,12
1,08
1.60
5,
074,
172
189,
633.
55
2,49
6,11
0 86
,385
.99
112,
240,
141
4,07
2,45
1.88
65
0.65
193,
926.
28 3
0.98
Jun-
148,
961,
673
339,
665.
78
21,4
79,3
52 83
4,72
3.02
39
,386
,497
1,52
3,44
4.52
37
,162
,670
1,37
4,36
7.67
5,
290,
089
213,
744.
70
2,17
6,41
0 82
,241
.21
114,
456,
691
4,36
8,18
6.89
69
7.9
208,
008.
90 3
3.23
Jul-1
49,
554,
373
366,
322.
01
20,6
23,5
44 80
4,57
2.36
45
,455
,235
1,79
1,15
4.59
42
,665
,214
1,60
5,39
5.28
5,
086,
637
205,
523.
05
2,40
7,82
7 91
,008
.08
125,
792,
830
4,86
3,97
5.38
77
7.11
221,
089.
79 3
5.32
Aug-
147,
370,
447
286,
261.
01
15,7
50,5
87 60
9,16
1.70
38
,246
,760
1,52
1,65
9.49
38
,675
,751
1,48
6,72
6.41
4,
221,
191
168,
327.
77
2,18
8,27
5 82
,712
.43
106,
453,
011
4,15
4,84
8.81
66
3.81
218,
676.
25 3
4.94
Sep-
148,
275,
270
332,
662.
35
18,5
98,8
89 73
4,20
3.36
46
,152
,041
1,89
3,48
4.61
46
,023
,582
1,83
1,34
7.44
5,
267,
835
212,
051.
71
2,62
2,80
0 98
,535
.98
126,
940,
417
5,10
2,28
5.46
81
5.18
231,
922.
07 3
7.05
Oct-1
47,
242,
848
278,
778.
96
14,9
06,8
74 55
4,55
5.65
39
,369
,465
1,53
8,06
1.74
39
,389
,871
1,49
1,13
0.38
4,
658,
191
180,
099.
68
2,49
4,34
3 90
,117
.83
108,
061,
592
4,13
2,74
4.24
66
0.28
229,
596.
90 3
6.68
Nov-1
49,
984,
456
261,
335.
02
20,5
21,9
72 62
8,95
4.07
61
,739
,870
1,42
7,99
3.42
68
,133
,114
1,52
0,56
4.00
5,
497,
875
181,
306.
31
2,85
1,16
6 90
,369
.30
168,
728,
453
4,11
0,52
2.11
65
6.73
228,
362.
34 3
6.48
Dec-
1413
,529
,076
354,
146.
92
20,7
09,0
29 63
5,49
1.92
94
,217
,969
2,15
1,34
9.81
89
,667
,817
1,98
5,60
5.36
5,
192,
378
169,
306.
63
2,60
6,42
6 80
,874
.25
225,
922,
695
5,37
6,77
4.90
85
9.04
244,
398.
86 3
9.05
Jan-
1515
,301
,599
408,
681.
47
22,6
62,1
20 71
4,69
8.73
87
,220
,158
2,05
1,16
4.16
94
,256
,509
2,11
3,67
6.15
5,
895,
450
200,
647.
79
3,12
6,14
9 10
1,03
5.75
22
8,46
1,98
5 5,
589,
904.
06
893.
09 26
6,18
5.91
42.
53
Feb-
1515
,942
,356
438,
473.
26
22,9
61,5
13 72
6,57
2.06
89
,989
,220
2,21
7,73
6.39
77
,136
,198
1,77
3,57
0.08
5,
734,
818
190,
391.
89
2,75
6,58
7 85
,408
.80
214,
520,
692
5,43
2,15
2.49
86
7.88
271,
607.
62 4
3.39
Mar-1
515
,983
,669
439,
276.
26
22,1
35,2
81 69
8,64
8.30
96
,055
,190
2,33
0,66
6.00
84
,972
,156
1,95
8,01
8.25
5,
451,
603
182,
458.
02
2,65
8,26
5 82
,456
.90
227,
256,
164
5,69
1,52
3.72
90
9.32
271,
024.
94 4
3.30
Cont
d...

66
Mont
h/Ye
arIn
dex
Futu
res
Stoc
k Fu
ture
s In
dex
Optio
ns S
tock
Opt
ions
Tota
lAv
erag
e Da
ily
Turn
over
Call
Put
Call
Put
No. o
f Co
ntra
cts
Trad
ed
Turn
over
No.
of
Cont
ract
s Tr
aded
Tur
nove
rNo
. of
Cont
ract
s T
rade
d
Notio
nal
Turn
over
No. o
f Co
ntra
cts
Trad
ed
Notio
nal
Turn
over
No. o
f Co
ntra
cts
Trad
ed
Not
iona
l Tu
rnov
erNo
. of
Cont
ract
s Tr
aded
Notio
nal
Turn
over
No. o
f Co
ntra
cts
Trad
ed
Turn
over
( `
Cror
es)
( `
Cror
es)
( ` C
rore
s)( `
Cro
res)
( ` C
rore
s)(`
Cro
res)
(US
$ bn
)(`
Cro
res)
(US
$ bn
)
2014
-15
129,
314,
318
4,10
9,47
1.65
237
,604
,741
8,29
1,76
6.25
70
1,41
6,67
0 20
,771
,438
.52
677,
226,
193
19,1
51,2
24.9
6 61
,204
,473
2,24
3,38
1.97
30
,274
,736
1,03
9,17
0.12
1,8
37,0
41,1
31 55
,606
,453
.47
8,88
4.13
228,
833.
14 3
6.56
Apr-1
514
,679
,503
385,
464.
22
21,7
04,4
44 67
6,40
9.94
10
1,78
0,06
1 2,
353,
554.
22
90,0
01,8
16 2,
000,
401.
58
5,66
6,75
9 18
9,34
0.99
2,
989,
704
94,5
91.6
1 23
6,82
2,28
7 5,
699,
762.
56
859.
27 29
9,98
7.50
45.
22
May-1
514
,755
,189
376,
623.
92
23,8
11,8
52 62
8,53
0.58
89
,487
,844
2,04
5,00
5.25
88
,102
,966
1,90
7,51
7.62
5,
847,
902
162,
058.
86
3,12
3,92
4 80
,988
.73
225,
129,
677
5,20
0,72
4.97
78
4.03
260,
036.
25 3
9.20
Jun-
1515
,854
,676
403,
910.
09
23,6
88,3
66 61
2,25
0.08
96
,828
,143
2,21
1,37
3.99
93
,679
,801
2,03
0,59
9.10
6,
038,
427
160,
448.
54
3,20
5,75
1 79
,938
.83
239,
295,
164
5,49
8,52
0.63
82
8.93
249,
932.
76 3
7.68
Jul-1
514
,789
,002
391,
736.
14
25,8
41,5
03 71
9,88
0.67
93
,622
,788
2,19
6,36
4.79
92
,955
,897
2,07
4,04
0.50
7,
401,
276
215,
682.
60
3,87
7,02
2 10
7,86
8.10
23
8,48
7,48
8 5,
705,
572.
80
860.
14 24
8,06
8.38
37.
40
Aug-
1517
,167
,226
435,
122.
61
27,0
86,9
31 73
4,92
4.08
10
1,76
9,99
4 2,
333,
608.
28
94,8
32,5
42 2,
057,
355.
33
7,74
2,39
4 22
4,71
5.23
4,
095,
032
112,
948.
29
252,
694,
119
5,89
8,67
3.81
88
9.25
280,
889.
23 4
2.35
Sep-
1518
,492
,427
458,
216.
87
22,4
54,4
08 57
0,32
4.80
88
,363
,485
1,99
0,52
0.86
85
,839
,253
1,79
3,28
0.78
5,
494,
359
148,
033.
39
2,93
5,86
9 71
,841
.05
223,
579,
801
5,03
2,21
7.75
75
8.63
251,
610.
89 3
7.93
Oct-1
511
,502
,566
335,
581.
89
20,7
17,8
19 62
7,67
1.38
67
,166
,048
1,64
5,57
8.64
66
,138
,404
1,53
4,87
9.69
6,
445,
041
189,
172.
91
3,54
0,21
8 96
,744
.95
175,
510,
096
4,42
9,62
9.46
66
7.79
221,
481.
47 3
3.39
Nov-1
55,
139,
901
289,
438.
79
11,8
76,9
12 59
7,63
2.51
29
,269
,261
1,74
9,52
3.85
25
,228
,432
1,44
7,83
3.95
3,
315,
699
176,
220.
61
1,74
0,66
3 86
,404
.53
76,5
70,8
68 4,
347,
054.
25
655.
34 22
8,79
2.33
34.
49
Dec-
155,
397,
473
300,
357.
36
12,4
28,8
74 63
0,52
0.71
31
,797
,538
1,88
0,24
6.69
27
,061
,557
1,53
9,48
7.10
3,
547,
704
189,
893.
05
1,82
3,47
2 90
,666
.71
82,0
56,6
18 4,
631,
171.
62
698.
17 21
0,50
7.80
31.
74
Jan-
167,
151,
363
379,
136.
59
14,6
05,1
05 69
8,90
9.21
42
,476
,467
2,40
8,34
9.48
36
,471
,724
1,98
2,82
3.83
4,
629,
447
240,
100.
17
2,49
8,47
3 11
9,70
9.67
10
7,83
2,57
9 5,
829,
028.
96
878.
75 29
1,45
1.45
43.
94
Feb-
168,
444,
206
422,
228.
60
16,0
54,2
24 68
4,61
5.59
52
,734
,262
2,84
9,68
6.65
44
,066
,407
2,27
6,59
3.22
4,
906,
666
221,
932.
13
2,83
7,24
6 11
7,68
8.35
12
9,04
3,01
1 6,
572,
744.
55
990.
87 31
2,98
7.84
47.
18
Mar-1
67,
165,
236
379,
306.
78
13,9
73,5
29 64
6,93
6.45
42
,387
,939
2,39
9,97
7.93
41
,465
,857
2,24
3,32
7.24
4,
287,
288
207,
431.
49
2,30
8,83
8 10
3,75
3.05
11
1,58
8,68
7 5,
980,
732.
93
901.
62 29
9,03
6.65
45.
08
2015
-16
140,
538,
768
4,55
7,12
3.86
234
,243
,967
7,82
8,60
6.00
83
7,68
3,83
0 26
,063
,790
.64
785,
844,
656
22,8
88,1
39.9
4 65
,322
,962
2,32
5,02
9.98
34
,976
,212
1,16
3,14
3.87
2,0
98,6
10,3
95 64
,825
,834
.28
9,77
2.80
262,
452.
77 3
9.57
Cont
d...
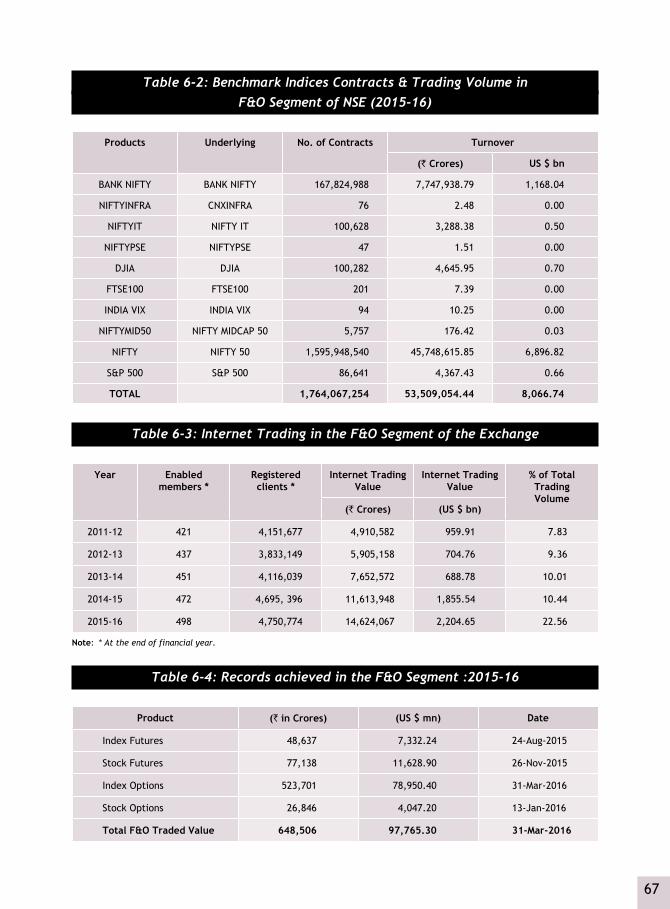
67
Table 6-2: Benchmark Indices Contracts & Trading Volume in F&O Segment of NSE (2015-16)
Products Underlying No. of Contracts Turnover
(` Crores) US $ bn
BANK NIFTY BANK NIFTY 167,824,988 7,747,938.79 1,168.04
NIFTYINFRA CNXINFRA 76 2.48 0.00
NIFTYIT NIFTY IT 100,628 3,288.38 0.50
NIFTYPSE NIFTYPSE 47 1.51 0.00
DJIA DJIA 100,282 4,645.95 0.70
FTSE100 FTSE100 201 7.39 0.00
INDIA VIX INDIA VIX 94 10.25 0.00
NIFTYMID50 NIFTY MIDCAP 50 5,757 176.42 0.03
NIFTY NIFTY 50 1,595,948,540 45,748,615.85 6,896.82
S&P 500 S&P 500 86,641 4,367.43 0.66
TOTAL 1,764,067,254 53,509,054.44 8,066.74
Table 6-3: Internet Trading in the F&O Segment of the Exchange
Year Enabled members *
Registered clients *
Internet Trading Value
Internet Trading Value
% of Total Trading Volume
(` Crores) (US $ bn)
2011-12 421 4,151,677 4,910,582 959.91 7.83
2012-13 437 3,833,149 5,905,158 704.76 9.36
2013-14 451 4,116,039 7,652,572 688.78 10.01
2014-15 472 4,695, 396 11,613,948 1,855.54 10.44
2015-16 498 4,750,774 14,624,067 2,204.65 22.56
Note: * At the end of financial year.
Table 6-4: Records achieved in the F&O Segment :2015-16
Product (` in Crores) (US $ mn) Date
Index Futures 48,637 7,332.24 24-Aug-2015
Stock Futures 77,138 11,628.90 26-Nov-2015
Index Options 523,701 78,950.40 31-Mar-2016
Stock Options 26,846 4,047.20 13-Jan-2016
Total F&O Traded Value 648,506 97,765.30 31-Mar-2016

68
Table 6-5: Participant Wise Trading Value in the F&O Segment (2015-16)
Month/Year
Institutional investors Retail Proprietary
Gross Traded Value
% to GrossTurn-over
Gross Traded Value
% to GrossTurn-over
Gross Traded Value
% to GrossTurn-over` Crores US $ bn ` Crores US $ bn ` Crores US $ bn
2011-12 10,170,705 1,988.15 16.22 25,374,513 4,960.17 40.47 27,154,245 5,308.07 43.31
2012-13 9,908,947 1,821.86 16.63 23,150,983 4,256.53 38.85 26,529,718 4,877.75 44.52
2013-14 12,611,623 2,110.45 16.50 27,350,424 4,576.86 35.79 36,460,769 6,101.40 47.71
2014-15 14,256,375 2,277.71 12.82 40,170,535 6, 417.96 36.12 56,785,997 9,072.58 51.06
Apr-15 1,294,573 195.16 11.36 4,143,915 624.71 36.35 5,961,037 898.65 52.29
May-15 1,117,288 168.44 10.74 3,910,082 589.46 37.59 5,374,080 810.17 51.67
Jun-15 1,171,514 176.61 10.65 4,187,524 631.29 38.08 5,638,003 849.96 51.27
Jul-15 1,201,167 181.08 10.53 4,454,172 671.49 39.03 5,755,807 867.72 50.44
Aug-15 1,379,683 207.99 11.69 4,519,443 681.33 38.31 5,898,222 889.18 50
Sep-15 1,281,252 193.15 12.73 3,755,528 566.16 37.31 5,027,656 757.94 49.95
Oct-15 990,572 149.33 11.18 3,502,848 528.07 39.54 4,365,839 658.17 49.28
Nov-15 1,296,216 195.41 14.91 3,155,056 475.64 36.29 4,242,836 639.63 48.8
Dec-15 1,248,494 188.22 13.48 3,531,280 532.36 38.13 4,482,569 675.77 48.4
Jan-16 1,990,620 300.1 17.08 4,136,976 623.67 35.49 5,530,462 833.74 47.44
Feb-16 2,421,698 365.08 18.42 4,581,898 690.74 34.86 6,141,892 925.92 46.72
Mar-16 1,917,612 289.09 16.03 4,516,795 680.93 37.76 5,527,058 833.23 46.21
2015-16 17,310,690 2,609.67 13.35 48,395,518 7,295.85 37.33 63,945,461 9,640.08 49.32
Table 6-6: Number of members in different turnover brackets in Futures and Option Segment
Upto ` 10 crores
` 10 crores upto ` 50
crores
` 50 crores upto ` 250
crores
` 250 crores upto ` 500
crores
` 500 crores upto ` 1000
crores
` 1000 crores and more
2011-12 15 34 78 75 70 831
2012-13 18 21 87 61 85 811
2013-14 19 29 73 57 87 808
2014-15 13 21 62 37 65 850
Apr-15 58 91 197 107 110 452
May-15 60 84 209 106 124 429
Jun-15 59 89 209 103 106 450
Jul-15 56 86 201 109 107 455
Aug-15 59 99 188 107 109 456
Contd...

69
Upto ` 10 crores
` 10 crores upto ` 50
crores
` 50 crores upto ` 250
crores
` 250 crores upto ` 500
crores
` 500 crores upto ` 1000
crores
` 1000 crores and more
Sep-15 61 102 206 107 114 425
Oct-15 64 96 207 121 124 402
Nov-15 67 96 236 100 122 397
Dec-15 61 94 220 111 122 412
Jan-16 65 77 222 103 119 435
Feb-16 59 80 208 110 122 440
Mar-16 60 87 214 117 102 434
2015-16 11 19 53 50 63 850
Table 6-7: Number of members in different turnover brackets in Futures and Options Segment.
Month Futures Segment Options Segment
Number of Members Number of Members
Upto ` 10
Crores
` 10 Crores upto ` 50
Crores
` 50 Crores upto `250
Crores
` 250 Crores upto ` 500 Crores
`500 Crores upto
`1000 Crores
` 1000 Crores
and more
Upto ` 10
Crores
` 10 Crores upto ` 50
Crores
` 50 Crores upto `250
Crores
` 250 Crores upto ` 500 Crores
`500 Crores upto
`1000 Crores
` 1000 Crores
and more
2011-12 30 52 121 93 117 690 89 70 131 60 92 661
2012-13 35 41 128 99 120 660 88 68 110 79 90 648
2013-14 35 41 138 80 124 655 74 66 116 73 77 667
2014-15 15 36 102 72 104 714 51 50 95 57 92 679
Apr-15 95 139 273 124 109 270 130 117 181 87 99 340
May-15 100 136 275 120 123 255 127 118 194 81 108 322
Jun-15 94 144 275 127 111 258 139 119 179 75 110 339
Jul-15 77 141 283 112 117 275 134 114 179 83 103 345
Aug-15 100 135 268 122 112 276 129 111 176 97 85 349
Sep-15 107 141 281 126 110 245 141 121 179 85 104 323
Oct-15 107 158 269 122 108 247 144 123 190 85 109 299
Nov-15 109 162 274 121 106 237 136 131 194 85 116 284
Dec-15 99 154 268 121 113 255 130 136 196 78 105 308
Jan-16 97 145 276 119 113 266 129 130 177 83 101 331
Feb-16 101 145 277 117 127 246 124 108 189 83 116 334
Mar-16 105 152 271 127 103 252 112 120 192 85 107 328
2015-16 21 33 92 76 114 709 51 52 88 48 94 687
Contd...
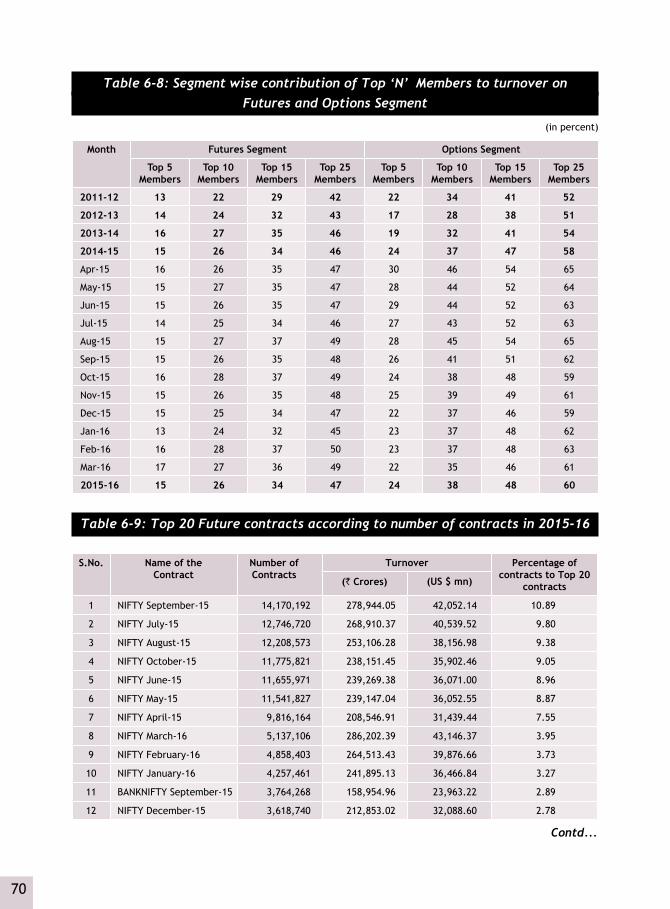
70
Table 6-8: Segment wise contribution of Top ‘N’ Members to turnover on Futures and Options Segment
(in percent) Month Futures Segment Options Segment
Top 5 Members
Top 10 Members
Top 15 Members
Top 25 Members
Top 5 Members
Top 10 Members
Top 15 Members
Top 25 Members
2011-12 13 22 29 42 22 34 41 52
2012-13 14 24 32 43 17 28 38 51
2013-14 16 27 35 46 19 32 41 54
2014-15 15 26 34 46 24 37 47 58
Apr-15 16 26 35 47 30 46 54 65
May-15 15 27 35 47 28 44 52 64
Jun-15 15 26 35 47 29 44 52 63
Jul-15 14 25 34 46 27 43 52 63
Aug-15 15 27 37 49 28 45 54 65
Sep-15 15 26 35 48 26 41 51 62
Oct-15 16 28 37 49 24 38 48 59
Nov-15 15 26 35 48 25 39 49 61
Dec-15 15 25 34 47 22 37 46 59
Jan-16 13 24 32 45 23 37 48 62
Feb-16 16 28 37 50 23 37 48 63
Mar-16 17 27 36 49 22 35 46 61
2015-16 15 26 34 47 24 38 48 60
Table 6-9: Top 20 Future contracts according to number of contracts in 2015-16
S.No. Name of the Contract
Number of Contracts
Turnover Percentage of contracts to Top 20
contracts(` Crores) (US $ mn)
1 NIFTY September-15 14,170,192 278,944.05 42,052.14 10.89
2 NIFTY July-15 12,746,720 268,910.37 40,539.52 9.80
3 NIFTY August-15 12,208,573 253,106.28 38,156.98 9.38
4 NIFTY October-15 11,775,821 238,151.45 35,902.46 9.05
5 NIFTY June-15 11,655,971 239,269.38 36,071.00 8.96
6 NIFTY May-15 11,541,827 239,147.04 36,052.55 8.87
7 NIFTY April-15 9,816,164 208,546.91 31,439.44 7.55
8 NIFTY March-16 5,137,106 286,202.39 43,146.37 3.95
9 NIFTY February-16 4,858,403 264,513.43 39,876.66 3.73
10 NIFTY January-16 4,257,461 241,895.13 36,466.84 3.27
11 BANKNIFTY September-15 3,764,268 158,954.96 23,963.22 2.89
12 NIFTY December-15 3,618,740 212,853.02 32,088.60 2.78
Contd...

71
S.No. Name of the Contract
Number of Contracts
Turnover Percentage of contracts to Top 20
contracts(` Crores) (US $ mn)
13 BANKNIFTY October-15 3,522,909 154,534.24 23,296.77 2.71
14 BANKNIFTY July-15 3,357,399 156,231.55 23,552.65 2.58
15 NIFTY November-15 3,192,383 190,511.75 28,720.55 2.45
16 BANKNIFTY August-15 3,056,668 139,795.60 21,074.85 2.35
17 BANKNIFTY March-16 3,038,480 137,870.36 20,784.61 2.34
18 BANKNIFTY June-15 2,882,244 129,146.12 19,469.39 2.22
19 BANKNIFTY February-16 2,748,956 120,789.69 18,209.62 2.11
20 BANKNIFTY May-15 2,739,779 124,621.81 18,787.33 2.11
TOTAL 130,090,064 4,043,995.55 609,651.55 100.00
Table 6-10: Top 20 Option contracts according to number of contracts traded in 2015-16
S.No. Name of the Contract
Number of Contracts
Turnover (` Crores)
Percentage of contracts to Top
20 contracts
1 NIFTY July-15 183,712,775 3,894,074.13 11.61
2 NIFTY August-15 174,628,310 3,644,398.93 11.04
3 NIFTY April-15 167,497,594 3,570,347.29 10.59
4 NIFTY June-15 166,379,936 3,440,838.45 10.51
5 NIFTY May-15 165,316,671 3,451,905.35 10.45
6 NIFTY September-15 160,169,402 3,189,219.92 10.12
7 NIFTY October-15 147,013,871 3,001,077.74 9.29
8 NIFTY March-16 78,653,610 4,447,756.25 4.97
9 NIFTY February-16 76,751,642 4,204,269.60 4.85
10 NIFTY January-16 64,344,830 3,670,996.62 4.07
11 NIFTY December-15 55,363,224 3,262,315.00 3.50
12 NIFTY November-15 44,934,273 2,690,050.54 2.84
13 BANKNIFTY March-16 14,281,779 665,789.00 0.90
14 BANKNIFTY February-16 13,548,927 596,346.80 0.86
15 BANKNIFTY September-15 12,773,898 550,122.11 0.81
16 BANKNIFTY July-15 12,196,116 570,895.24 0.77
17 BANKNIFTY October-15 11,662,774 516,713.69 0.74
18 BANKNIFTY June-15 11,342,681 514,814.19 0.72
19 BANKNIFTY August-15 11,143,900 512,694.41 0.70
20 BANKNIFTY January-16 10,634,914 506,161.69 0.67
TOTAL 1,582,351,127 46,900,786.94 100.00
Contd...

72
Table 6-11: Number of trades in the Futures & Options Segment
Month/Year Index Futures Stock Futures Index Options Stock Options Total
2011-12 57,713,350 122,687,746 217,338,496 27,365,782 425,105,374
2012-13 38,006,692 116,343,124 186,345,210 47,114,197 387,809,223
2013-14 44,819,943 136,505,248 249,713,197 58,506,897 489,545,285
2014-15 51,500,574 183,210,007 347,263,095 68,254,846 650,228,522
Apr-15 5,451,437 16,140,156 42,066,707 6,187,670 69,845,970
May-15 5,519,605 17,482,204 40,317,325 6,318,709 69,637,843
Jun-15 5,804,774 17,665,372 41,568,973 6,313,511 71,352,630
Jul-15 5,260,579 19,165,611 39,866,962 7,676,929 71,970,081
Aug-15 6,145,132 20,559,094 47,659,071 8,045,674 82,408,971
Sep-15 6,933,610 16,704,261 43,806,234 5,885,135 73,329,240
Oct-15 4,515,945 16,601,420 27,994,652 6,815,598 55,927,615
Nov-15 2,846,122 9,736,617 20,545,595 3,937,449 37,065,783
Dec-15 2,939,652 10,132,879 20,763,886 4,151,799 37,988,216
Jan-16 4,034,017 12,064,256 28,836,543 5,433,380 50,368,196
Feb-16 4,840,860 13,319,152 36,673,278 5,931,654 60,764,944
Mar-16 4,057,606 11,697,777 30,332,192 5,015,373 51,102,948
2015-16 58,349,339 181,268,799 420,431,418 71,712,881 731,762,437
Table 6-12: Settlement Statistics in F&O Segment
Month/Year Index/Stock Futures Index/Stock Options Total
MTM Settlement
Final Settlement
Premium Settlement
Exercise Settlement
(` Crores) (` Crores) (` Crores) (` Crores) (` Crores) (US $ mn)
Apr-15 6,451.43 145.61 1,088.97 161.23 7,847.24 1,183.01
May-15 7,852.88 92.99 1,071.14 98.73 9,115.74 1,374.24
Jun-15 6,935.47 68.08 1,423.83 517.87 8,945.25 1,348.54
Jul-15 7,208.28 146.27 992.72 126.17 8,473.44 1,277.41
Aug-15 10,286.81 348.93 1,394.71 216.30 12,246.75 1,846.26
Sep-15 8,074.80 71.03 1,402.22 132.40 9,680.45 1,459.37
Oct-15 4,199.46 111.36 1,102.77 80.00 5,493.59 828.18
Nov-15 4,472.88 115.13 1,132.69 96.76 5,817.46 877.01
Dec-15 5,845.04 65.13 1,185.22 288.32 7,383.71 1,113.13
Jan-16 9,689.99 64.66 1,719.76 258.22 11,732.63 1,768.75
Feb-16 8,853.91 122.66 1,807.99 401.37 11,185.93 1,686.33
Mar-16 5,712.85 68.88 1,600.28 424.85 7,806.86 1,176.92
2015-16 85,583.80 1,420.73 15,922.30 2,802.22 105,729.05 15,939.16
Currency DerivativesSegment 7

74
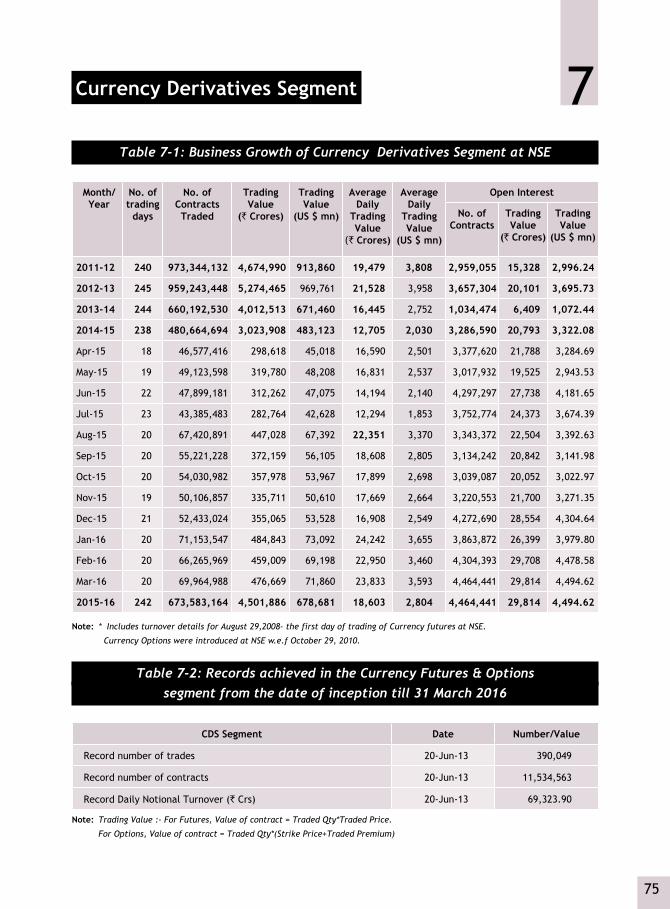
75
7Currency Derivatives Segment
Table 7-1: Business Growth of Currency Derivatives Segment at NSE
Month/ Year
No. of trading
days
No. of ContractsTraded
Trading Value
(` Crores)
Trading Value
(US $ mn)
Average Daily
Trading Value
(` Crores)
Average Daily
Trading Value
(US $ mn)
Open Interest
No. of Contracts
Trading Value
(` Crores)
Trading Value
(US $ mn)
2011-12 240 973,344,132 4,674,990 913,860 19,479 3,808 2,959,055 15,328 2,996.24
2012-13 245 959,243,448 5,274,465 969,761 21,528 3,958 3,657,304 20,101 3,695.73
2013-14 244 660,192,530 4,012,513 671,460 16,445 2,752 1,034,474 6,409 1,072.44
2014-15 238 480,664,694 3,023,908 483,123 12,705 2,030 3,286,590 20,793 3,322.08
Apr-15 18 46,577,416 298,618 45,018 16,590 2,501 3,377,620 21,788 3,284.69
May-15 19 49,123,598 319,780 48,208 16,831 2,537 3,017,932 19,525 2,943.53
Jun-15 22 47,899,181 312,262 47,075 14,194 2,140 4,297,297 27,738 4,181.65
Jul-15 23 43,385,483 282,764 42,628 12,294 1,853 3,752,774 24,373 3,674.39
Aug-15 20 67,420,891 447,028 67,392 22,351 3,370 3,343,372 22,504 3,392.63
Sep-15 20 55,221,228 372,159 56,105 18,608 2,805 3,134,242 20,842 3,141.98
Oct-15 20 54,030,982 357,978 53,967 17,899 2,698 3,039,087 20,052 3,022.97
Nov-15 19 50,106,857 335,711 50,610 17,669 2,664 3,220,553 21,700 3,271.35
Dec-15 21 52,433,024 355,065 53,528 16,908 2,549 4,272,690 28,554 4,304.64
Jan-16 20 71,153,547 484,843 73,092 24,242 3,655 3,863,872 26,399 3,979.80
Feb-16 20 66,265,969 459,009 69,198 22,950 3,460 4,304,393 29,708 4,478.58
Mar-16 20 69,964,988 476,669 71,860 23,833 3,593 4,464,441 29,814 4,494.62
2015-16 242 673,583,164 4,501,886 678,681 18,603 2,804 4,464,441 29,814 4,494.62
Note: * Includes turnover details for August 29,2008- the first day of trading of Currency futures at NSE.
Currency Options were introduced at NSE w.e.f October 29, 2010.
Table 7-2: Records achieved in the Currency Futures & Optionssegment from the date of inception till 31 March 2016
CDS Segment Date Number/Value
Record number of trades 20-Jun-13 390,049
Record number of contracts 20-Jun-13 11,534,563
Record Daily Notional Turnover (` Crs) 20-Jun-13 69,323.90
Note: Trading Value :- For Futures, Value of contract = Traded Qty*Traded Price.
For Options, Value of contract = Traded Qty*(Strike Price+Traded Premium)

76
Table 7-3: Top 5 Currency Futures & Options Contracts on the basis of turnover for the FY 2015-16
Rank Contract Name Total Traded Quantity
Total Traded Value
(` In Crores)
Total Traded Value (%) to Currency
Futures & Options Total Traded Value
Instrument Type
Contract Symbol
Expiry
1 FUTCUR USDINR 27-Aug-15 36,780,880 239,581.02 5.32
2 FUTCUR USDINR 27-Jan-16 34,885,344 234,626.04 5.21
3 FUTCUR USDINR 29-Mar-16 33,572,578 227,328.60 5.05
4 FUTCUR USDINR 28-Sep-15 33,442,132 221,774.63 4.93
5 FUTCUR USDINR 25-Feb-16 32,463,310 221,720.46 4.93
Note: Total Traded Value of Currency Futures & Options for FY 2015-16 is ` 4501885.58 Crs
Table 7-4: Settlement Statistics of Currency Derivatives Segments at NSE
Month/Year MTM Settlement Final Settlement
` Crores US $ mn ` Crores US $ mn
Apr-15 531.66 80.15 33.65 5.07
May-15 537.69 81.06 18.26 2.75
Jun-15 535.36 80.71 16.79 2.53
Jul-15 677.50 102.14 12.21 1.84
Aug-15 927.84 139.88 90.27 13.61
Sep-15 480.29 72.41 29.87 4.50
Oct-15 587.87 88.62 43.96 6.63
Nov-15 488.99 73.72 91.17 13.74
Dec-15 461.68 69.60 46.41 7.00
Jan-16 867.02 130.71 98.33 14.82
Feb-16 502.16 75.70 27.51 4.15
Mar-16 891.27 134.36 69.52 10.48
2015-16 7,489.32 1,129.05 577.96 87.13
Note: 1. Currency Futures trading started at NSE on August 29, 2008
2. Currency Options were introduced at NSE w.e.f October 29, 2010
3. MTM Settlement includes Futures MTM settlement as well as Option Premium settlement values
4. Final Settlement includes Futures Final settlement as well as Options Exercise settlement values
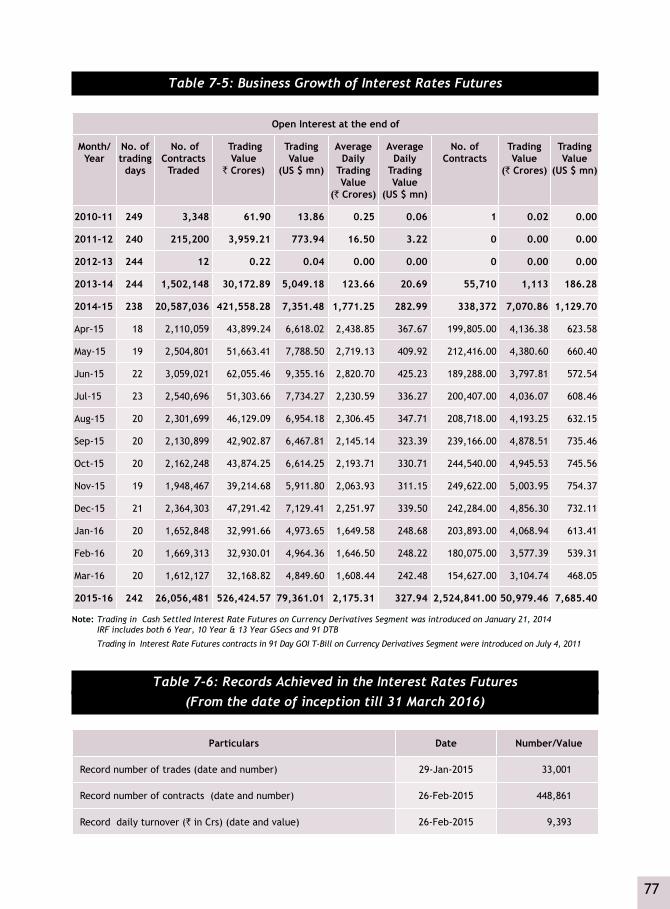
77
Table 7-5: Business Growth of Interest Rates Futures
Open Interest at the end of
Month/ Year
No. of trading
days
No. of Contracts
Traded
Trading Value
` Crores)
Trading Value
(US $ mn)
Average Daily
Trading Value
(` Crores)
Average Daily
Trading Value
(US $ mn)
No. of Contracts
Trading Value
(` Crores)
Trading Value
(US $ mn)
2010-11 249 3,348 61.90 13.86 0.25 0.06 1 0.02 0.00
2011-12 240 215,200 3,959.21 773.94 16.50 3.22 0 0.00 0.00
2012-13 244 12 0.22 0.04 0.00 0.00 0 0.00 0.00
2013-14 244 1,502,148 30,172.89 5,049.18 123.66 20.69 55,710 1,113 186.28
2014-15 238 20,587,036 421,558.28 7,351.48 1,771.25 282.99 338,372 7,070.86 1,129.70
Apr-15 18 2,110,059 43,899.24 6,618.02 2,438.85 367.67 199,805.00 4,136.38 623.58
May-15 19 2,504,801 51,663.41 7,788.50 2,719.13 409.92 212,416.00 4,380.60 660.40
Jun-15 22 3,059,021 62,055.46 9,355.16 2,820.70 425.23 189,288.00 3,797.81 572.54
Jul-15 23 2,540,696 51,303.66 7,734.27 2,230.59 336.27 200,407.00 4,036.07 608.46
Aug-15 20 2,301,699 46,129.09 6,954.18 2,306.45 347.71 208,718.00 4,193.25 632.15
Sep-15 20 2,130,899 42,902.87 6,467.81 2,145.14 323.39 239,166.00 4,878.51 735.46
Oct-15 20 2,162,248 43,874.25 6,614.25 2,193.71 330.71 244,540.00 4,945.53 745.56
Nov-15 19 1,948,467 39,214.68 5,911.80 2,063.93 311.15 249,622.00 5,003.95 754.37
Dec-15 21 2,364,303 47,291.42 7,129.41 2,251.97 339.50 242,284.00 4,856.30 732.11
Jan-16 20 1,652,848 32,991.66 4,973.65 1,649.58 248.68 203,893.00 4,068.94 613.41
Feb-16 20 1,669,313 32,930.01 4,964.36 1,646.50 248.22 180,075.00 3,577.39 539.31
Mar-16 20 1,612,127 32,168.82 4,849.60 1,608.44 242.48 154,627.00 3,104.74 468.05
2015-16 242 26,056,481 526,424.57 79,361.01 2,175.31 327.94 2,524,841.00 50,979.46 7,685.40
Note: Trading in Cash Settled Interest Rate Futures on Currency Derivatives Segment was introduced on January 21, 2014 IRF includes both 6 Year, 10 Year & 13 Year GSecs and 91 DTB
Trading in Interest Rate Futures contracts in 91 Day GOI T-Bill on Currency Derivatives Segment were introduced on July 4, 2011
Table 7-6: Records Achieved in the Interest Rates Futures (From the date of inception till 31 March 2016)
Particulars Date Number/Value
Record number of trades (date and number) 29-Jan-2015 33,001
Record number of contracts (date and number) 26-Feb-2015 448,861
Record daily turnover (` in Crs) (date and value) 26-Feb-2015 9,393

78
Table 7-7: Top 5 IRD Contracts on the basis of Turnover for the FY 2015-16
Rank Contract Name Total Traded Quantity
Total Traded Value
(In ` Crores)
Total Traded Value (%) to Interest rate
products Total Traded Value
Instrument Type
Contract Symbol
Expiry
1 FUTIRC 840GS2024 28-May-15 2,319,519 47,941.66 9.11
2 FUTIRC 840GS2024 25-Jun-15 2,071,162 42,630.84 8.10
3 FUTIRC 772GS2025 31-Dec-15 1,985,614 39,632.06 7.53
4 FUTIRC 772GS2025 29-Oct-15 1,858,168 37,469.54 7.12
5 FUTIRC 840GS2024 30-Apr-15 1,626,119 33,832.12 6.43
Note:- Total Traded Value of Interest Rates Futures for FY 2015-16 is ` 526424.57 Crs
Table 7-8: Settlement Statistics in Interest Rate Futures Segments at NSE
Month/Year MTM Settlement Final Settlement
` Crores US $ mn ` Crores US $ mn
Apr-15 107.94 16.27 3.84 0.58
May-15 86.19 12.99 1.47 0.22
Jun-15 151.17 22.79 1.41 0.21
Jul-15 60.37 9.10 0.33 0.05
Aug-15 92.40 13.93 1.68 0.25
Sep-15 88.00 13.27 0.22 0.03
Oct-15 62.30 9.39 1.70 0.26
Nov-15 100.23 15.11 1.13 0.17
Dec-15 94.88 14.30 - -
Jan-16 75.13 11.33 0.74 0.11
Feb-16 132.66 20.00 5.79 0.87
Mar-16 73.04 11.01 3.78 0.57
2015-16 1,124.30 169.49 22.09 3.33
Note: # Interest Rate Futures trading started on January 21, 2014
IRF includes both 6 Year, 10 Year & 13 Year GSecs and 91 DTB
Open interest is valued at daily settlement prices
91 DTB was introduced on 04th of July 2011
Investor Services,Arbitration 8

80

81
8Investor Services, Arbitration
Table 8-1: Receipt and Disposal of Investor’s Grievance
Year Against Members Against Companies
Pending at the
beginning
Received Disposed Pending at the end
Pending at the
beginning
Received Disposed Pending at the end
2009-10 1,138 5,892 6,226 804 60 881 772 169
2010-11 804 6,610 6,253 1,161 169 1,418 1,157 430
2011-12 1,161 5,401 5,495 1,067 430 1,334 1,651 113
2012-13 1,067 4,721 4,910 878 113 1,644 1,500 257
2013-14 878 4,846 5,178 546 257 1,570 1,640 187
2014-15 546 7,129 7,094 581 187 1,905 1,846 246
2015-16 581 4,762 5,132 211 246 2,629 2,664 211
Table 8-2: Status Report of Arbitration Matters
Year No. of Cases Received
Withdrawn Awards Pending
2009-10 CM 517 52 465 0
2009-10 F&O 502 43 459 0
2010-11 CM 258 13 245 0
2010-11 F&O 276 8 268 0
2011-12 CM 286 8 278 0
2011-12 F&O 278 6 272 0
2012-13 CM 280 4 276 0
2012-13 F&O 330 7 323 0
2013-14 CM 334 11 356 0
2013-14 F&O 395 13 415 0
2013-14 CDS 25 2 23 0
2014-15 CM 265 5 260 0
2014-15 F&O 213 210 3 0
2014-15 CDS 13 13 0 0
2015-16 CM 203 4 151 48
2015-16 F&O 213 7 164 42
2015-16 CDS 11 0 5 6
Total 10,289 608 9,651 96

82