Embed Size (px)
Citation preview

Fiscal Year 2020 Semi–Annual
Budget Performance
Finance/Administration Committee
February 25, 2020

Water and Wastewater Systems Overview
Six-Months
Revenues are higher than budget and expenditures are lower than planned for both enterprises.
Year-end Projection
Projected net revenue and expense savings is estimated to be above budget for both enterprises.
1

Water System Revenue & Expenses
FY20 Through 12/31/2019
2
366.4
221.9
168.9
377.1
193.5
145.6
0
100
200
300
400
Revenues Operating Expenses &Commitments
Capital Cash Flow Expenses
$ M
illio
ns
Jul-Dec Budget Actual

3
Water System Revenues
FY20 Through 12/31/2019
300.6 313.1
0
100
200
300
400
$ M
illions
26.0
17.5
9.1 6.1
4.7 2.4
18.8 17.5
10.4
6.0 7.3 4.1
0
10
20
30
40
$ M
illions
Jul-Dec Budget Actual Revenue

4
Water Operating Expenses & Commitments
FY20 Through 12/31/2019
151.3
70.6
129.9
63.6
0
40
80
120
160
Operations Debt Service
$ M
illio
ns
Jul-Dec Budget Actual Expense

Water Major Capital Cash Flow Expenses
FY20 Through 12/31/2019
5
25.8
19.7
8.8
7.8
5.6
4.8
0 5 10 15 20 25 30
Pipeline Infrastructure Renewals
Reservoir Rehab
New Service Installations
Treatment Plant Upgrades
Pumping Plant Rehab
Maloney PZ Improvements
$ Millions
Total direct capital cash flow spending year-to-date was 86% of 6-month budget
6
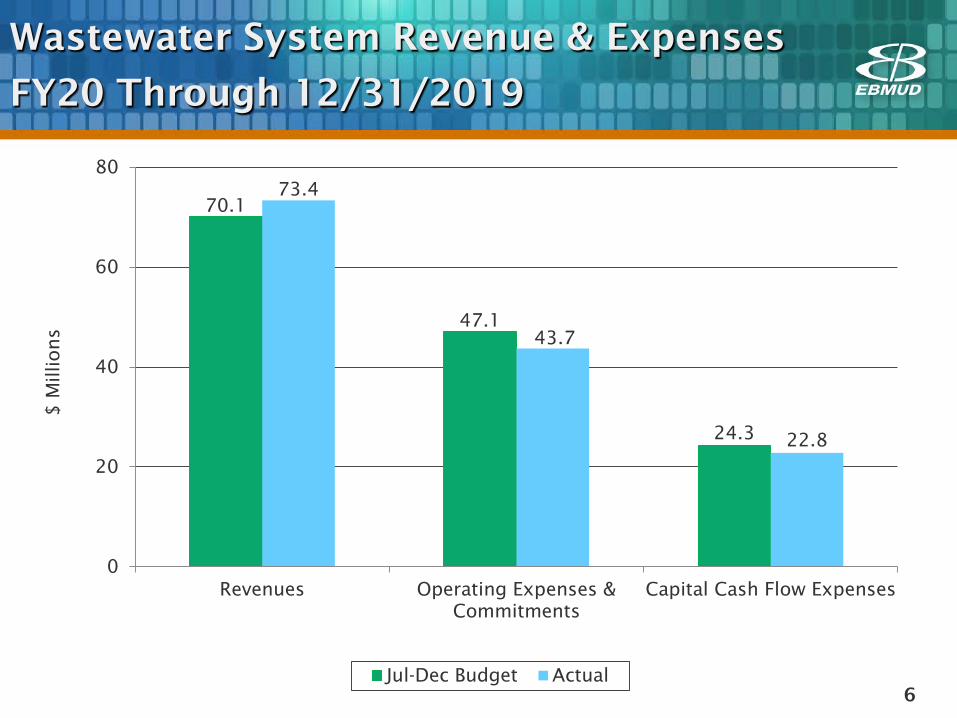
Wastewater System Revenue & Expenses
FY20 Through 12/31/2019
70.1
47.1
24.3
73.4
43.7
22.8
0
20
40
60
80
Revenues Operating Expenses &Commitments
Capital Cash Flow Expenses
$ M
illio
ns
Jul-Dec Budget Actual
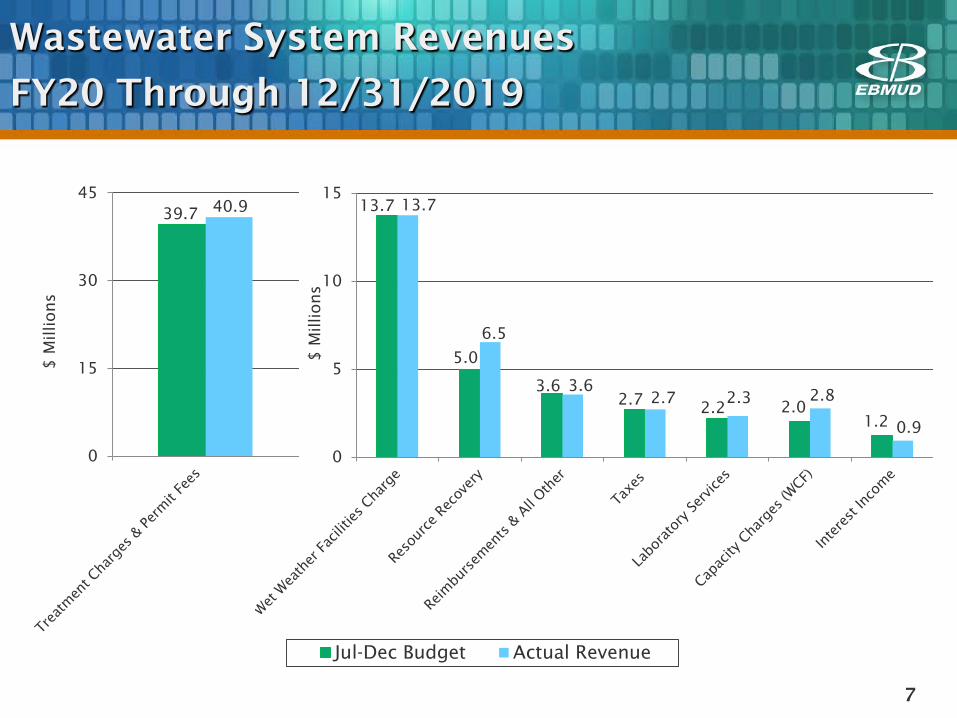
39.7 40.9
0
15
30
45
$ M
illions
7
Wastewater System Revenues
FY20 Through 12/31/2019
13.7
5.0
3.6 2.7 2.2 2.0
1.2
13.7
6.5
3.6 2.7 2.3 2.8
0.9
0
5
10
15
$ M
illions
Jul-Dec Budget Actual Revenue

8
Wastewater Operating Expenses & Commitments
FY20 Through 12/31/2019
37.5
9.7
34.5
9.3
0
10
20
30
40
Operations Debt Service
$ M
illio
ns
Jul-Dec Budget Actual Expense
9
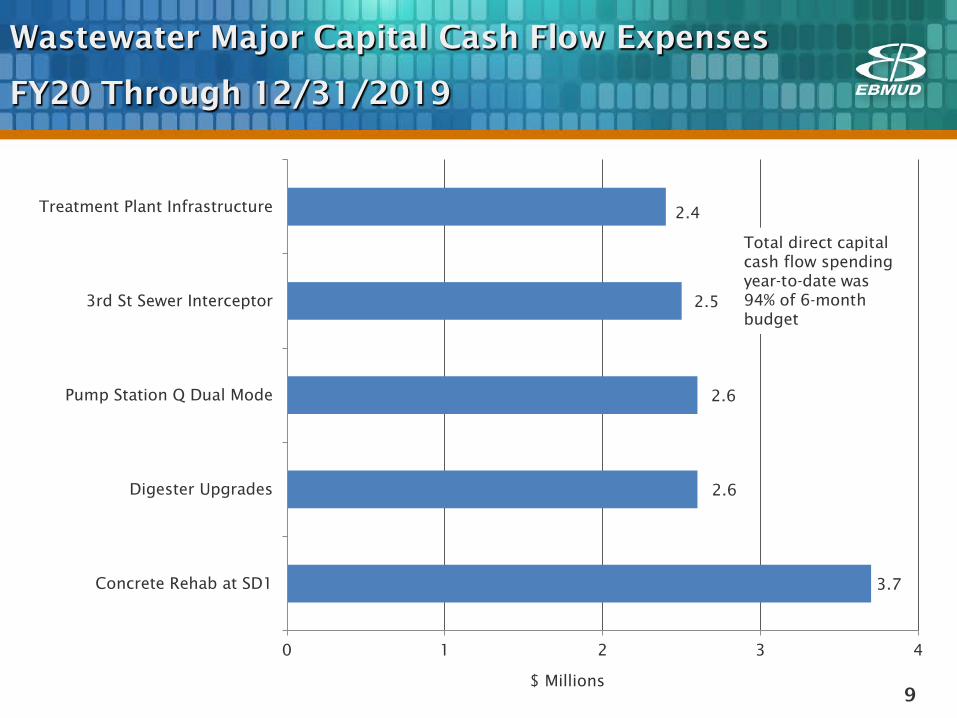
Wastewater Major Capital Cash Flow Expenses
FY20 Through 12/31/2019
3.7
2.6
2.6
2.5
2.4
Concrete Rehab at SD1
Digester Upgrades
Pump Station Q Dual Mode
3rd St Sewer Interceptor
Treatment Plant Infrastructure
0 1 2 3 4
$ Millions
Total direct capital cash flow spending year-to-date was 94% of 6-month budget
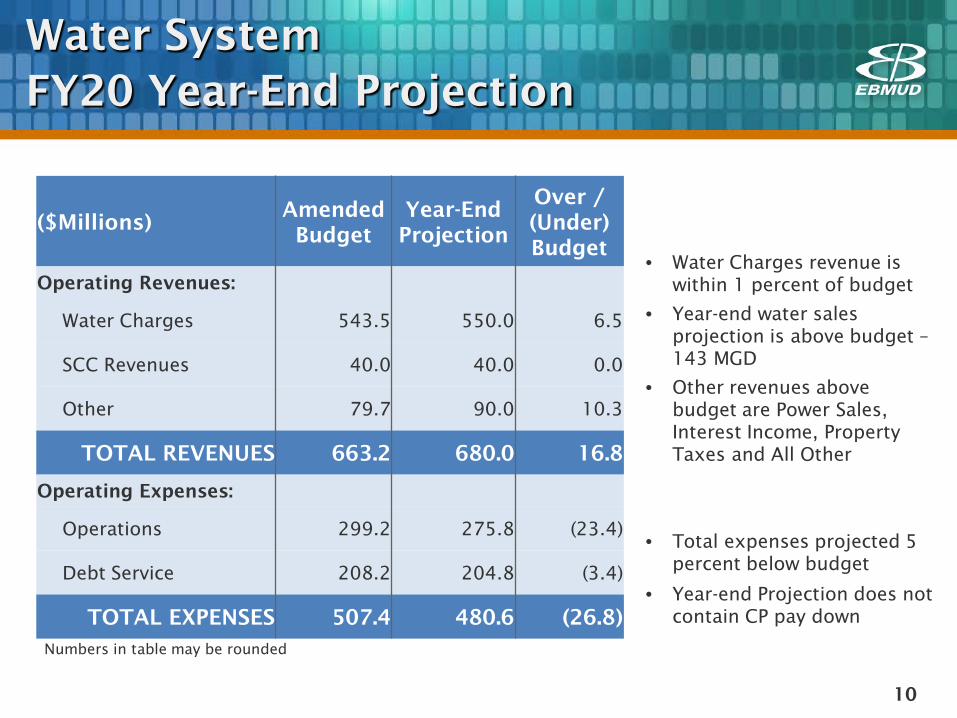
Water System FY20 Year-End Projection
($Millions) Amended Budget
Year-End Projection
Over / (Under) Budget
Operating Revenues:
Water Charges 543.5 550.0 6.5
SCC Revenues 40.0 40.0 0.0
Other 79.7 90.0 10.3
TOTAL REVENUES 663.2 680.0 16.8
Operating Expenses:
Operations 299.2 275.8 (23.4)
Debt Service 208.2 204.8 (3.4)
TOTAL EXPENSES 507.4 480.6 (26.8)
• Water Charges revenue is within 1 percent of budget
• Year-end water sales projection is above budget – 143 MGD
• Other revenues above budget are Power Sales, Interest Income, Property Taxes and All Other
• Total expenses projected 5 percent below budget
• Year-end Projection does not contain CP pay down
10
Numbers in table may be rounded
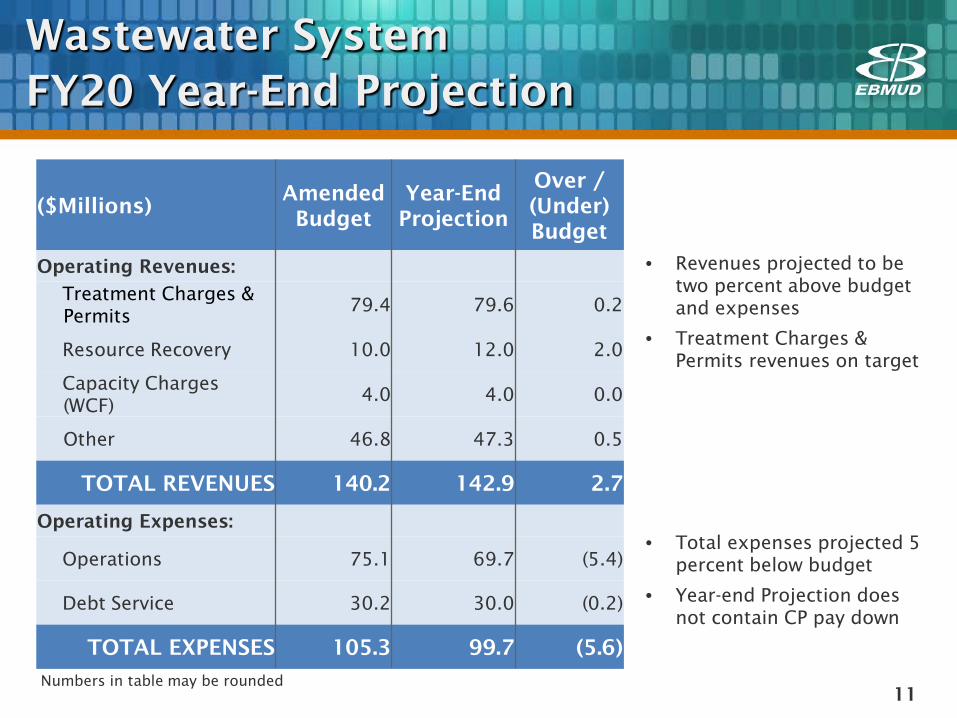
Wastewater System FY20 Year-End Projection
($Millions) Amended Budget
Year-End Projection
Over / (Under) Budget
Operating Revenues:
Treatment Charges & Permits
79.4 79.6 0.2
Resource Recovery 10.0 12.0 2.0
Capacity Charges (WCF)
4.0 4.0 0.0
Other 46.8 47.3 0.5
TOTAL REVENUES 140.2 142.9 2.7
Operating Expenses:
Operations 75.1 69.7 (5.4)
Debt Service 30.2 30.0 (0.2)
TOTAL EXPENSES 105.3 99.7 (5.6)
• Revenues projected to be two percent above budget and expenses
• Treatment Charges & Permits revenues on target
• Total expenses projected 5 percent below budget
• Year-end Projection does not contain CP pay down
11 Numbers in table may be rounded

Questions
12
FY20 Budget Amendment for Commercial Paper Pay Down
Finance/Administration Committee
February 25, 2020

Budget Amendment for Commercial Paper Pay Down
• Funds available in FY19 from higher-than-budgeted revenues and lower-than-budgeted expenses
• Strategy to use a portion of this to pay down commercial paper presented at Finance/ Administration Committee on October 22, 2019
• This item seeks Board approval to amend the FY20 budgets for Water and Wastewater to implement commercial paper pay down
– $24 million for Water System
– $5 million for Wastewater System
1

FY19 Year-end Funds Water System ($M)
2
Strategy Benefits Amount
FUNDS AVAILABLE FY19 YEAR END: $129.0
Used in FY20 & FY21 rate model
Lowered rates $88.4
Pay off Commercial Paper over 15 years in equal annual payments*
Reduces interest cost and provides capacity for future borrowing if needed
$24.0
Retain in fund balance Reduce needed borrowing for capital and creates room for future borrowing
$16.6
*Director of Finance will review and recommend annually
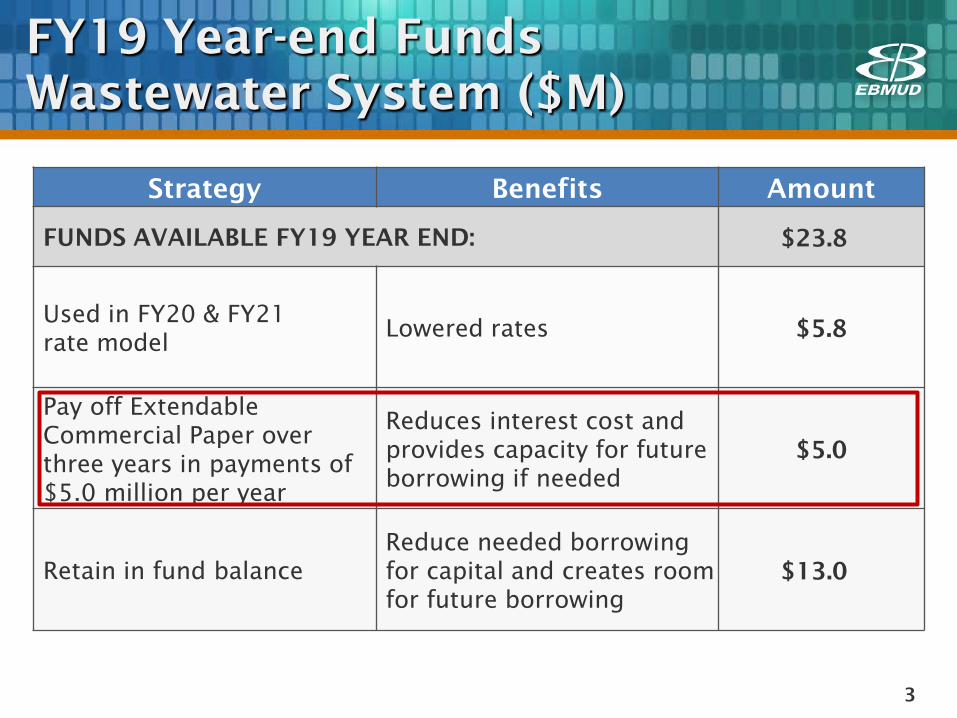
FY19 Year-end Funds Wastewater System ($M)
3
Strategy Benefits Amount
FUNDS AVAILABLE FY19 YEAR END: $23.8
Used in FY20 & FY21 rate model
Lowered rates $5.8
Pay off Extendable Commercial Paper over three years in payments of $5.0 million per year
Reduces interest cost and provides capacity for future borrowing if needed
$5.0
Retain in fund balance Reduce needed borrowing for capital and creates room for future borrowing
$13.0
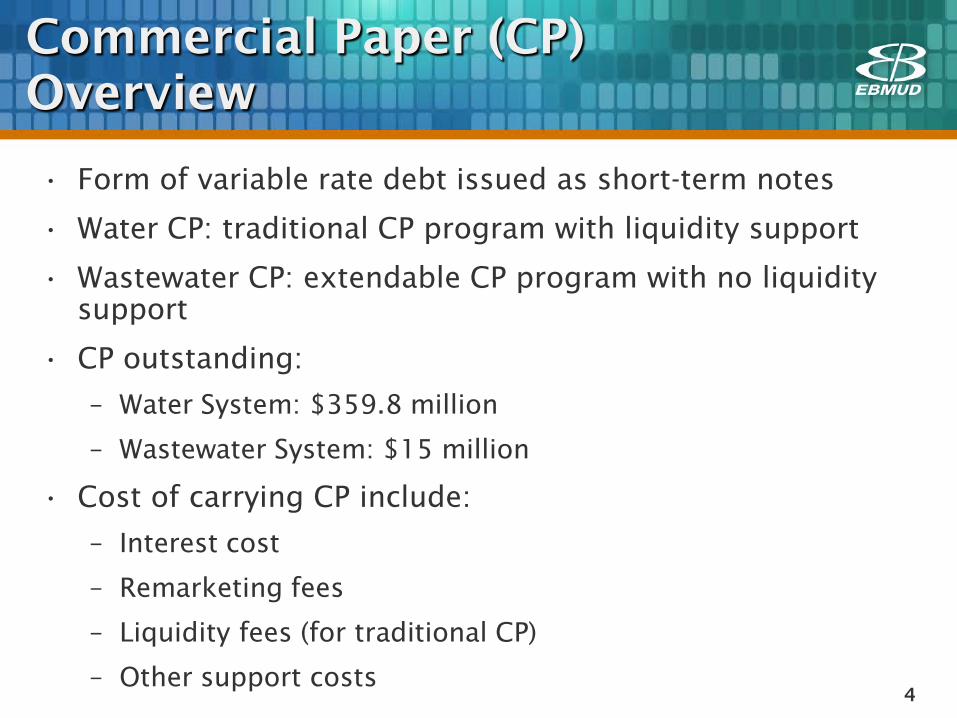
Commercial Paper (CP) Overview
• Form of variable rate debt issued as short-term notes
• Water CP: traditional CP program with liquidity support
• Wastewater CP: extendable CP program with no liquidity support
• CP outstanding:
– Water System: $359.8 million
– Wastewater System: $15 million
• Cost of carrying CP include:
– Interest cost
– Remarketing fees
– Liquidity fees (for traditional CP)
– Other support costs 4
FY20 Budget Amendment
• This budget amendment provides the appropriation in FY20 to implement the CP pay down
• This item will be presented for Board Determination this afternoon
• Future year additional CP pay downs will be based on financial performance and outlook at that time
5
Recommendation to the Board
• Amend the FY20 Water System budget in the amount of $24,000,000 and the Wastewater System budget in the amount of $5,000,000 to pay down a portion of each system’s outstanding commercial paper
6

2020 Strategic Plan Update
Finance/Administration Committee
February 25, 2020

Overview
• First adopted in 2004
• 2020 update will be the 9th edition
• Establishes long-term goals and strategies
• Multiple years to accomplish goals
• Interim reviews conducted every two years
• Advantageous to minimize number of significant changes to focus efforts
• Comprehensive updates every four to six years
• Proposed changes to be presented at May 2020 workshop
1

Update Process
2
• Strategic Plan update process and biennial budget cycle work together
• 2020 Strategic Plan will
guide FY22 & FY23 budget priorities
• Strategic Plan update process will culminate in June

3
2020 Update Focus
• Goals still on target
• Minor updates to some strategies and objectives
• Major focus on key performance indicators — Certain KPI targets were not well suited to their
intentions
— Establish realistic targets to track progress
— Create supplemental Key Performance Indicators publication instead of incorporating into the Strategic Plan

Schedule
4
• Launched process (November 2019)
• Update process underway (November 2019 – March 2020)
• Board Workshops held/planned: √ Infrastructure (November 2019) √ Customer Assistance Program (January 2020) — Long-Term Water Supply (February 2020) — Financial Stability (March 2020) — FY21 Mid-cycle & Strategic Plan (May 2020)
• Adoption (June 2020)

Questions
5